1. Introduction
The demand for transportation fuels has continued to grow due to rapid increases in the number of vehicles on the road worldwide. Because of the overwhelming use of petroleum as the fuel of choice, these vehicles not only reduce petroleum resources, but also release a significant amount of exhaust, which can cause global warming, harm the environment and impact human health.
These concerns have stimulated research on alternative, fuel-efficient vehicle technologies. Electric vehicles (EVs) have long held the promise of being zero-emission vehicles, but their limited travel range has resulted in limited public acceptance. Although hybrid electric vehicles (HEVs) reduce emissions and possess the same travel range as conventional vehicles (CVs), they nevertheless discharge some emissions. Hydrogen fuel cell vehicles (FCVs) are considered as a distant reality due to their high cost and low reliability. Plug-in hybrid electric vehicles (PHEVs), similar to HEVs in configuration, use electricity from the grid to power a portion of their travel.
Each type of fuel-efficient vehicle has achieved higher fuel economy and lower emissions than CVs at the vehicle operation stage [
1,
2,
3,
4]. However, to objectively and holistically evaluate the environmental benefits that are associated with all stages of these vehicles, a life cycle assessment (LCA) is needed to analyze energy consumption and greenhouse gas (GHG) emissions during each vehicle’s entire lifetime. A vehicle’s LCA is comprised of two cycles: a vehicle life cycle that includes vehicle assembly, maintenance, dismantling, and recycling and a fuel life cycle that consists of fuel extraction, processing, distribution, storage, and use. The fuel life cycle is also referred to as the well-to-wheels (WTW) cycle. If the lifetime energy, emission or cost savings of a new vehicle technology during operation does not offset the additional energy and/or emissions consumed in other stages, then the technology does not adequately represent an alternative to CVs or solve our environmental concerns.
Many studies have been conducted to investigate the fuel consumption and emissions of EVs, HEVs, PHEVs, and FCVs from the perspective of a fuel life cycle [
5,
6,
7,
8,
9,
10]. Some researchers have recently added energy use and GHG emissions that are generated during the vehicle life cycle to their studies [
11,
12,
13,
14,
15]. Until now, a comprehensive LCA, specifically for advanced vehicles with commercial availability in today’s market, has not been fully investigated.
Most WTW or LCA analyses use simulated vehicle characteristics (e.g., fuel economy) obtained via simulation software tools and estimated values (e.g., battery capacity or vehicle purchase prices) as inputs to evaluate the environmental and economic benefits [
7,
11,
12,
13,
14,
15,
16]. The use of simulation tools and certain assumptions to model and examine the design by exchanging the powertrain components, such as motor power ratings or battery capacity, makes it possible to quickly obtain vehicle characteristics (e.g., fuel economy and emissions) for the studied vehicles or concept vehicles. The method is effective, particularly when the vehicle information is incomplete or not even available. However, it is often difficult to consider all factors to achieve the optimal results via simulation. Sometimes the component constraints are omitted and practical considerations are not weighted to the full during simulation [
17]. In addition, these studies have addressed some of the aforementioned issues separately. Using different approaches, a few earlier reports have used published data to assess environmental concerns. Van Vliet
et al. conducted techno-economic studies of series HEVs using public domain data to determine efficiencies, costs, and emissions. However, these works focused on WTW and did not take the vehicle cycles into account [
18,
19]. Granovskii
et al. used actual data from various sources to evaluate four types of vehicles. However, their study did not compare the energy benefits of the four types of vehicles, nor did they investigate PHEVs for comparison [
20].
In this article, we conducted an LCA using official published data of the production vehicles from government agencies and/or the vehicle manufacturers to determine the energy consumption, GHG emissions, and ownership costs for various advanced vehicles throughout their lifetimes. Commercial vehicles have been optimized to the greatest extent and designed for a balance of performance, fuel economy, component capacity, emissions, costs, and consumer acceptance. A total of six vehicles, one production vehicle in each powertrain category, were selected for examination to better understand the environmental and economic advantages brought about by a variety of current vehicle technologies. This study allows an objective comparison among the selected vehicles and attempts to discover the vehicle type with the lowest energy use, emissions, and/or costs during its lifetime. As the investigation focuses on vehicles that already exist in the market, these findings should have practical significance with regard to energy application and environmental protection in the near future.
2. Methodology
2.1. LCA of Energy Use and GHG Emissions
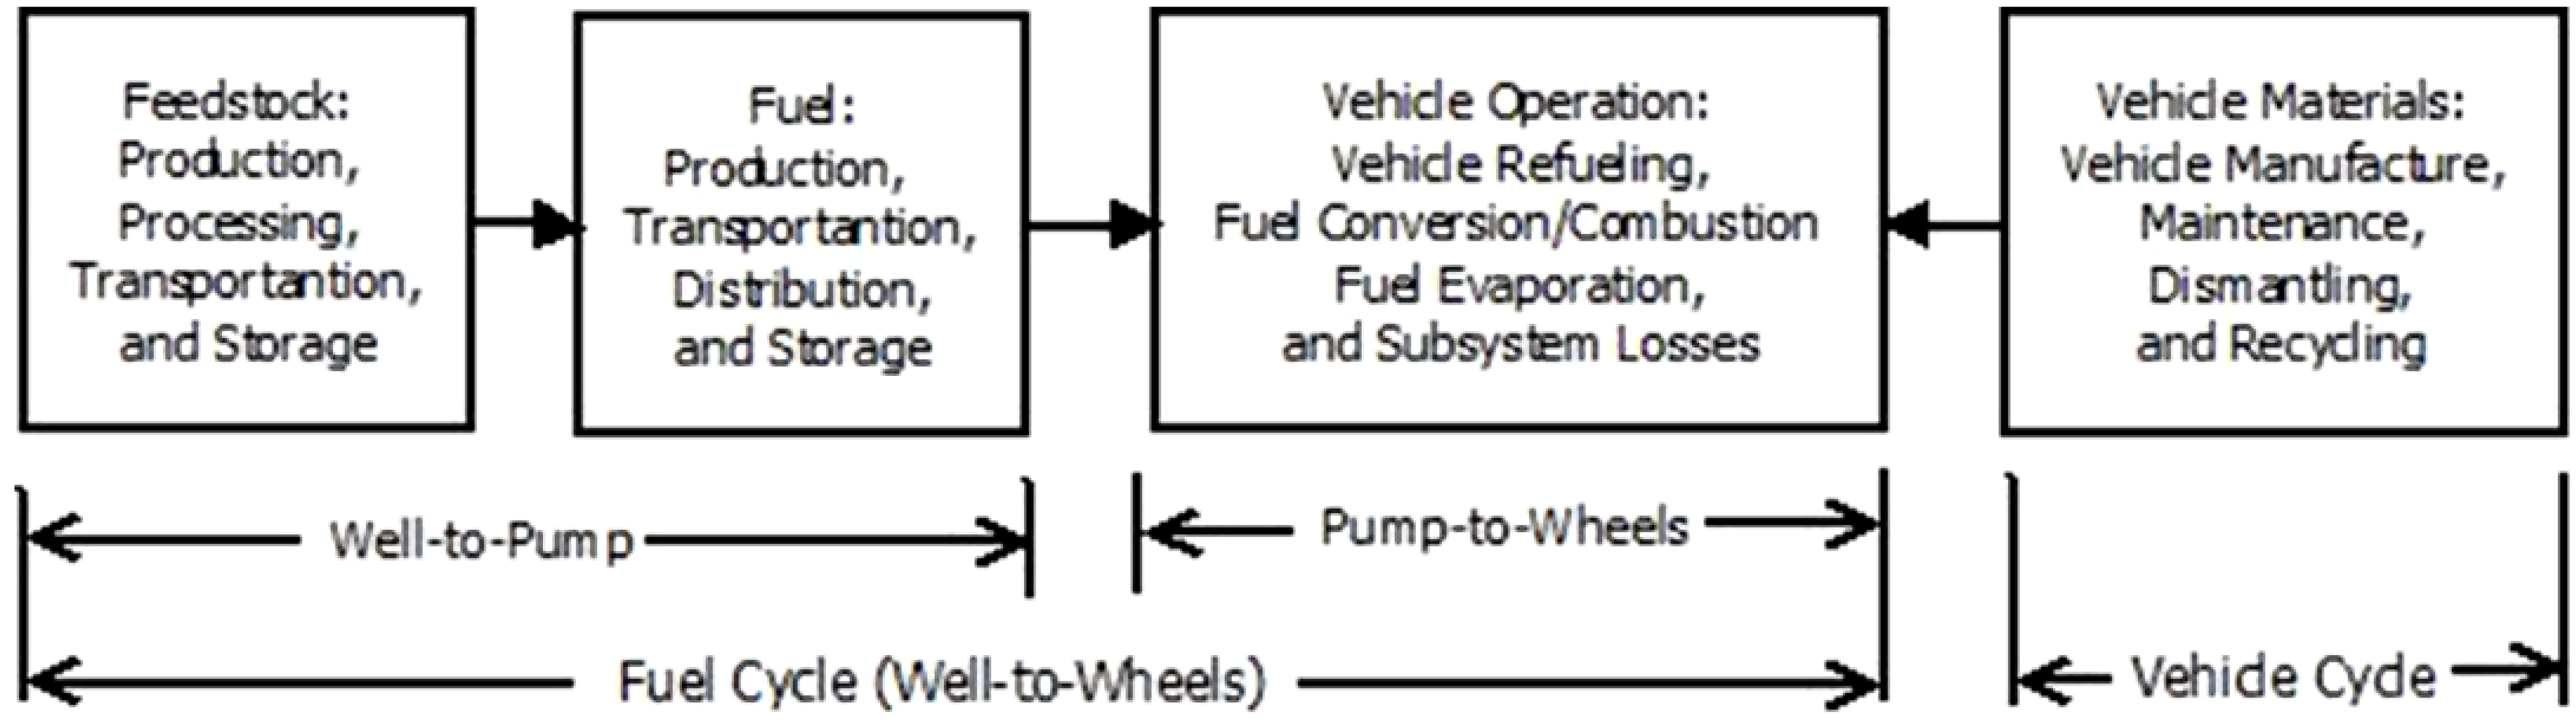
The fuel life cycle consists of two independent stages, including a fuel production stage,
i.e., well-to-pump (WTP), and a fuel utilization stage,
i.e., pump-to-wheels (PTW). The WTP stage includes the recovery or production of the fuel feedstock, the transportation, and storage of the energy source through the conversion of the feedstock to the fuel and the subsequent transportation, storage, and distribution of the fuel to the vehicle tank. The PTW stage refers to the vehicle operation activities throughout its lifetime [
21].
Advanced, fuel-efficient vehicles are being introduced into the market at a fast pace because of their advantages in efficiency and emissions. At the same time, these vehicles employ new components, such as large battery packs, electric motors, power electronics, and fuel cells, in addition to new materials for producing and recycling these components. All of these factors may have significantly different energy and emission impacts that must be considered during the assessment of the new vehicle technology.
Figure 1 shows the vehicle lifetime energy consumption for transportation technologies, including both the fuel cycle and the vehicle cycle.
Figure 1.
Lifetime energy consumption for transportation technologies.
Figure 1.
Lifetime energy consumption for transportation technologies.
To study the energy use and GHG emissions of the full energy cycle of a vehicle, the software GREET from the U.S. Argonne National Laboratory was used. The open-source software consists of multidimensional worksheets that have been developed to address analytical issues associated with fuels and materials.
The recovery and recycling of materials from automotive has increased significantly due to high prices and legislation. The European Union End-of-Life Vehicle Directive aims to increase reuse and recovery of materials to 95% by 2015. For disposal and recycling, the GREET model takes into account the energy use and emissions during recycling of scrap materials back into its original and reusable form.
2.2. Vehicle Powertrain Configurations
The diagrams of a CV and various advanced powertrain configurations that were studied in the current study are shown in
Figure 2.
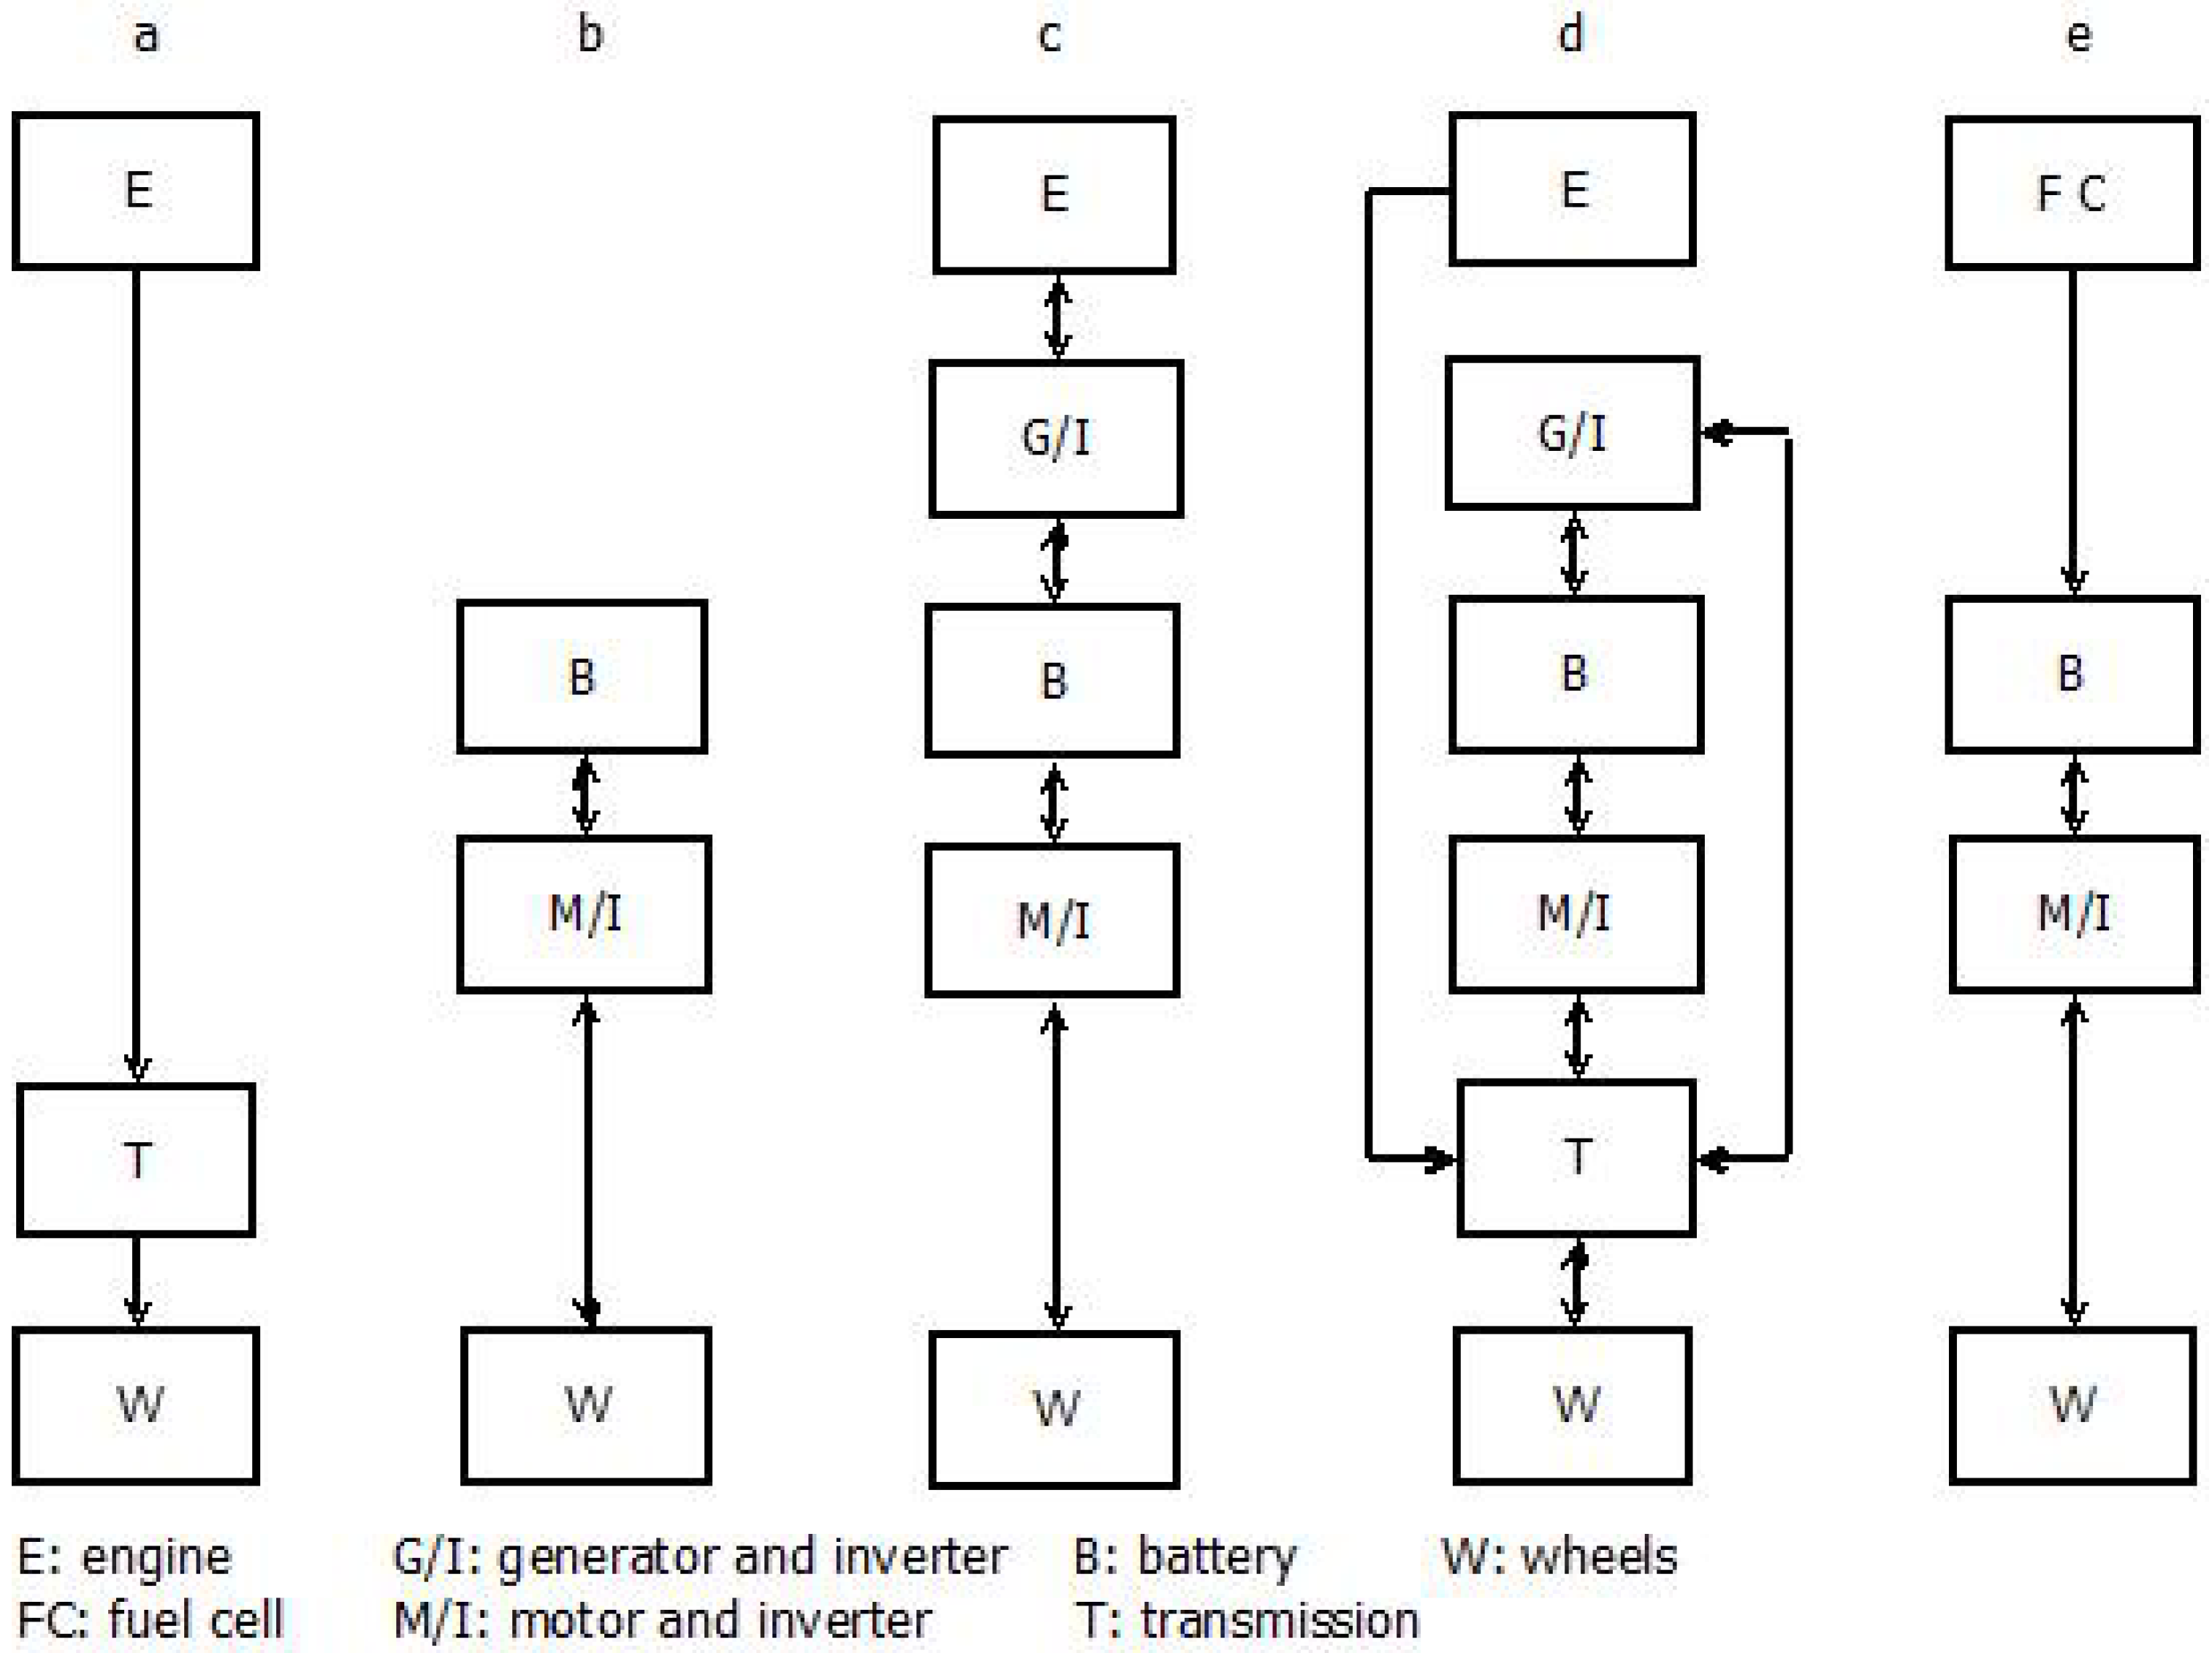
Figure 2.
Diagram of the energy flows in different types of vehicle configurations: (a) CV; (b) battery EV; (c) series HEV; (d) power-split HEV, and (e) FCV.
Figure 2.
Diagram of the energy flows in different types of vehicle configurations: (a) CV; (b) battery EV; (c) series HEV; (d) power-split HEV, and (e) FCV.
The Toyota Corolla [
22], a conventional compact passenger car, was selected as a reference. A CV uses only an internal combustion engine to drive the wheels through a mechanical transmission, as shown in
Figure 2a, and a large engine is needed for acceptable performance, including acceleration and gradeability.
In the interest of making an apples-to-apples comparison between fuel-efficient vehicles and the CV, all of the vehicles must be very similar in terms of dimensions and performances instead of weight. We consider that the weight changes of the advanced vehicles are caused by additional components that are added to the vehicle powertrain systems.
An electric vehicle, represented in
Figure 2b, is propelled by an electric motor (or motors) that is powered by battery packs that are recharged from the grid. It is the most efficient technology with zero tailpipe emissions. The nearly ideal torque-speed characteristic of the electric motor makes multi-gear transmission unnecessary, which further improves the system efficiency [
23]. We selected the Nissan Leaf [
24] as a representative electric vehicle because it is the first and only mass-produced EV throughout the World.
A hybrid electric vehicle is one type of vehicle that combines a conventional engine propulsion system with an electric propulsion system. HEVs can be further classified according to the manner that power is supplied to the powertrain, including series (
Figure 2c), parallel, and power-split hybrids (
Figure 2d).
In a series hybrid, an engine output is first converted into electricity using a generator. Due to mechanical decoupling between the engine and the driven wheels, the engine can be operated in its most optimal region for maximum efficiency. The parallel hybrid allows both the engine and electric motor to deliver power directly to drive the wheels. This eliminates the additional energy conversion step found in a series hybrid, but it also forces the engine to operate in a wider speed band, thus reducing its efficiency. The power-split configuration combines the features of both the series and parallel hybrids [
25]. It requires the use of an additional electric machine and a planetary unit that makes the powertrain relatively more complicated and costly. The Toyota Prius [
26], currently the best-selling HEV in America and worldwide, employs a power-split propulsion system and was selected in this study as a representative HEV.
A PHEV adopts a similar configuration to the conventional HEV, but it differs from the HEV due to its higher battery energy capacity, the utilization of an external power source to recharge the batteries, and the different battery management strategy. The HEV normally maintains its battery state-of-charge (SOC) within a narrow range, which refers to the charging-sustaining (CS) mode. The PHEV can operate in either charge-depleting (CD) mode, similar to EVs, or in CS mode. The distance travelled in CD mode is defined as the all-electric range (AER). PHEVs have two energy sources for propulsion: electricity from the grid and fossil fuel in the tank. The so-called range-extended PHEV is designed to use batteries only in CD mode until the SOC reaches a minimum threshold, and then it operates in CS mode after this occurrence [
12]. The GM Chevrolet Volt [
27] applies this type of design with a new variant layout similar to a series hybrid. The Volt operates as a pure battery electric vehicle until its plug-in battery capacity is depleted, at which point its gasoline engine powers an electric generator to extend the vehicle's range. Therefore, it is also described as an extended-range electric vehicle (EREV). The Toyota Prius Plug-in Hybrid is similar to the regular Prius configuration, but it can be recharged using an electric connection [
28]. It uses a smaller battery pack and has a shorter AER compared to the GM Volt. Even in CD mode, the vehicle turns the engine on whenever needed to assist the motor (e.g., full acceleration) and/or charge the batteries because the propulsion motor is not sized for peak power requests.
The configuration of an FCV, shown in
Figure 2e, is similar to a series HEV with the difference that the primary energy source is a fuel cell rather than an engine-generator. Hydrogen is usually the fuel for fuel cells, which is stored in high-pressure tanks. The steam reforming of natural gas at petroleum-refining facilities is the predominant means of hydrogen production in the chemical process industries. Hydrogen is then distributed to fuel stations for vehicle use. Due to the lack of a hydrogen infrastructure, the high cost and low liability of fuel cells, and safety concerns of hydrogen, FCVs are still thought to be more of a distant reality. The Honda FCV Clarity [
29] is the first dedicated platform hydrogen fuel cell vehicle in the market, although it is currently only available for lease in some areas of the World.
3. Vehicle Specifications and Assumptions
Table 1 shows the specifications of the six different vehicles that were selected for this study, all of which are compact family cars. These vehicles have similar dimensions of approximately 4.5 m long, 1.5 m high, and 1.75 m wide, but the weights are different. The output power of each vehicle is approximately 100 kW. Besides the Volt, the other vehicles have nearly identical performance, as measured by the acceleration time from zero to 60 mph (miles per hour) of approximately 10 s. Based on the specifications, we assume that the selected vehicles are built on a similar platform and that the variances are caused by different powertrain components. Therefore, the energy use and emissions of the vehicles can be objectively compared throughout their lifetimes.
Table 1.
Characteristics of conventional vehicle and advanced vehicles.
Table 1.
Characteristics of conventional vehicle and advanced vehicles.
| | CV | HEV | PHEV | EREV | EV | FCV |
|---|
| Name | Toyota Corolla | Toyota Prius | Toyota Prius Plug-in | GM Volt | Nissan Leaf | Honda Clarity |
| Dimensions, L (m) | 4.57 | 4.46 | 4.48 | 4.50 | 4.46 | 4.83 |
| H × W (m) | 1.45 × 1.76 | 1.49 × 1.75 | 1.49 × 1.75 | 1.44 × 1.79 | 1.55 × 1.77 | 1.47 × 1.85 |
| Weight (kg) | 1256 | 1381 | 1437 | 1716 | 1528 | 1626 |
| Engine power (kW) | 100 | 73 | 73 | 62 | - | 100 a |
| Motor power (kW) | - | 60 | 60 | 111 | 80 | 100 |
| Total power (kW) | 100 | 100 | 100 | 111 | 80 | 100 |
| Battery type b | - | Ni-MH | Li-ion | Li-ion | Li-ion | Li-ion |
| Battery energy (kWh) | - | 1.3 | 4.4 | 16 | 24 | 2 c |
| Battery weight (kg) | - | 50 | 150 | 198 | 300 | 23 c |
| Fuel economy (mpg) | 26/34/29 | 51/48/50 | 112/49/87 d | 93/37/60 | 106/92/99 | 61/61/61 |
| AER (km) | - | - | 24 | 56 | 117 | - |
| 0–60 mph (s) | 10.1 | 10.1 | 10.1 | 9.2 | 9.9 | 10 |
| Price ($) e | 17,600 | 23,500 | 32,000 | 39,200 | 35,200 | - |
The fuel economies were released by the US Environmental Protection Agency (EPA) under standard test procedures. The unit of fuel economy in the US is miles per gallon (mpg), which is equal to 2.352 km/L. To objectively compare the fuel economies of different fuels, the miles per gasoline-equivalent gallon (MPG-e) has recently been used for alternative fuels. EPA’s formula shows that 33.7 kWh of electricity is equivalent to one gallon of gasoline [
30]. For the vehicles that use a single fuel, the 3 numbers in the fuel economy row (e.g., Corolla 28/35/31) denote the city, highway, and combined fuel economies, respectively. The calculation for the combined fuel economy weights the city at 55 percent and the highway at 45 percent. For plug-in hybrids, the first number represents the fuel economy of the vehicle in all-electric mode expressed in MPG-e, and the second is for gasoline-only mode stated in conventional mpg. The third number is the combination of the first two.
Other important aspects concerning the energy use and emissions of each vehicle throughout its lifetime are the total travelled distance and the average period between exchange for several vehicle components and consumables. The vehicles were assumed to have a lifetime of 160,000 miles (256,000 km) [
15,
20], and other data available in the GREET model were used for the calculation of the manufacturing process. Here, it was presumed that all of the vehicle manufacturers use the same processes to build vehicles. In the U.S., the hybrid system, including the high-voltage battery pack, is warranted for 8 years/100,000 miles (160,000 km). Although Li-ion batteries have more charge/discharge cycles, the nickel–metal hydride (NiMH) battery usage in the Prius is controlled in such a way that the battery SOC is forced to a target value throughout the driving cycle to maximize the battery lifetime [
31]. Accordingly, the replacement frequencies of both Li-ion and NiMH batteries in vehicle lifetime were identical during the calculations.
The current U.S. market share for gasoline fuel is approximately half reformulated gasoline (RFG) and half conventional gasoline (CG). Electricity is generated from multiple sources, including renewable energy (e.g., sun, wind or hydraulic energy), natural gas, oil, coal, and nuclear power. The energy use and emissions during electricity generation include those at the power plant and the upstream emissions and energy associated with fuel supply. The input U.S. average electricity generation mix inside GREET was considered appropriately by representing the U.S. present reality of energy source usage, which is dominated by coal (50.7%), followed by natural gas (18.9%), nuclear (18.7%), and others (11.7%) [
32].
4. Results and Discussion
4.1. LCA of Energy Use and GHG Emissions
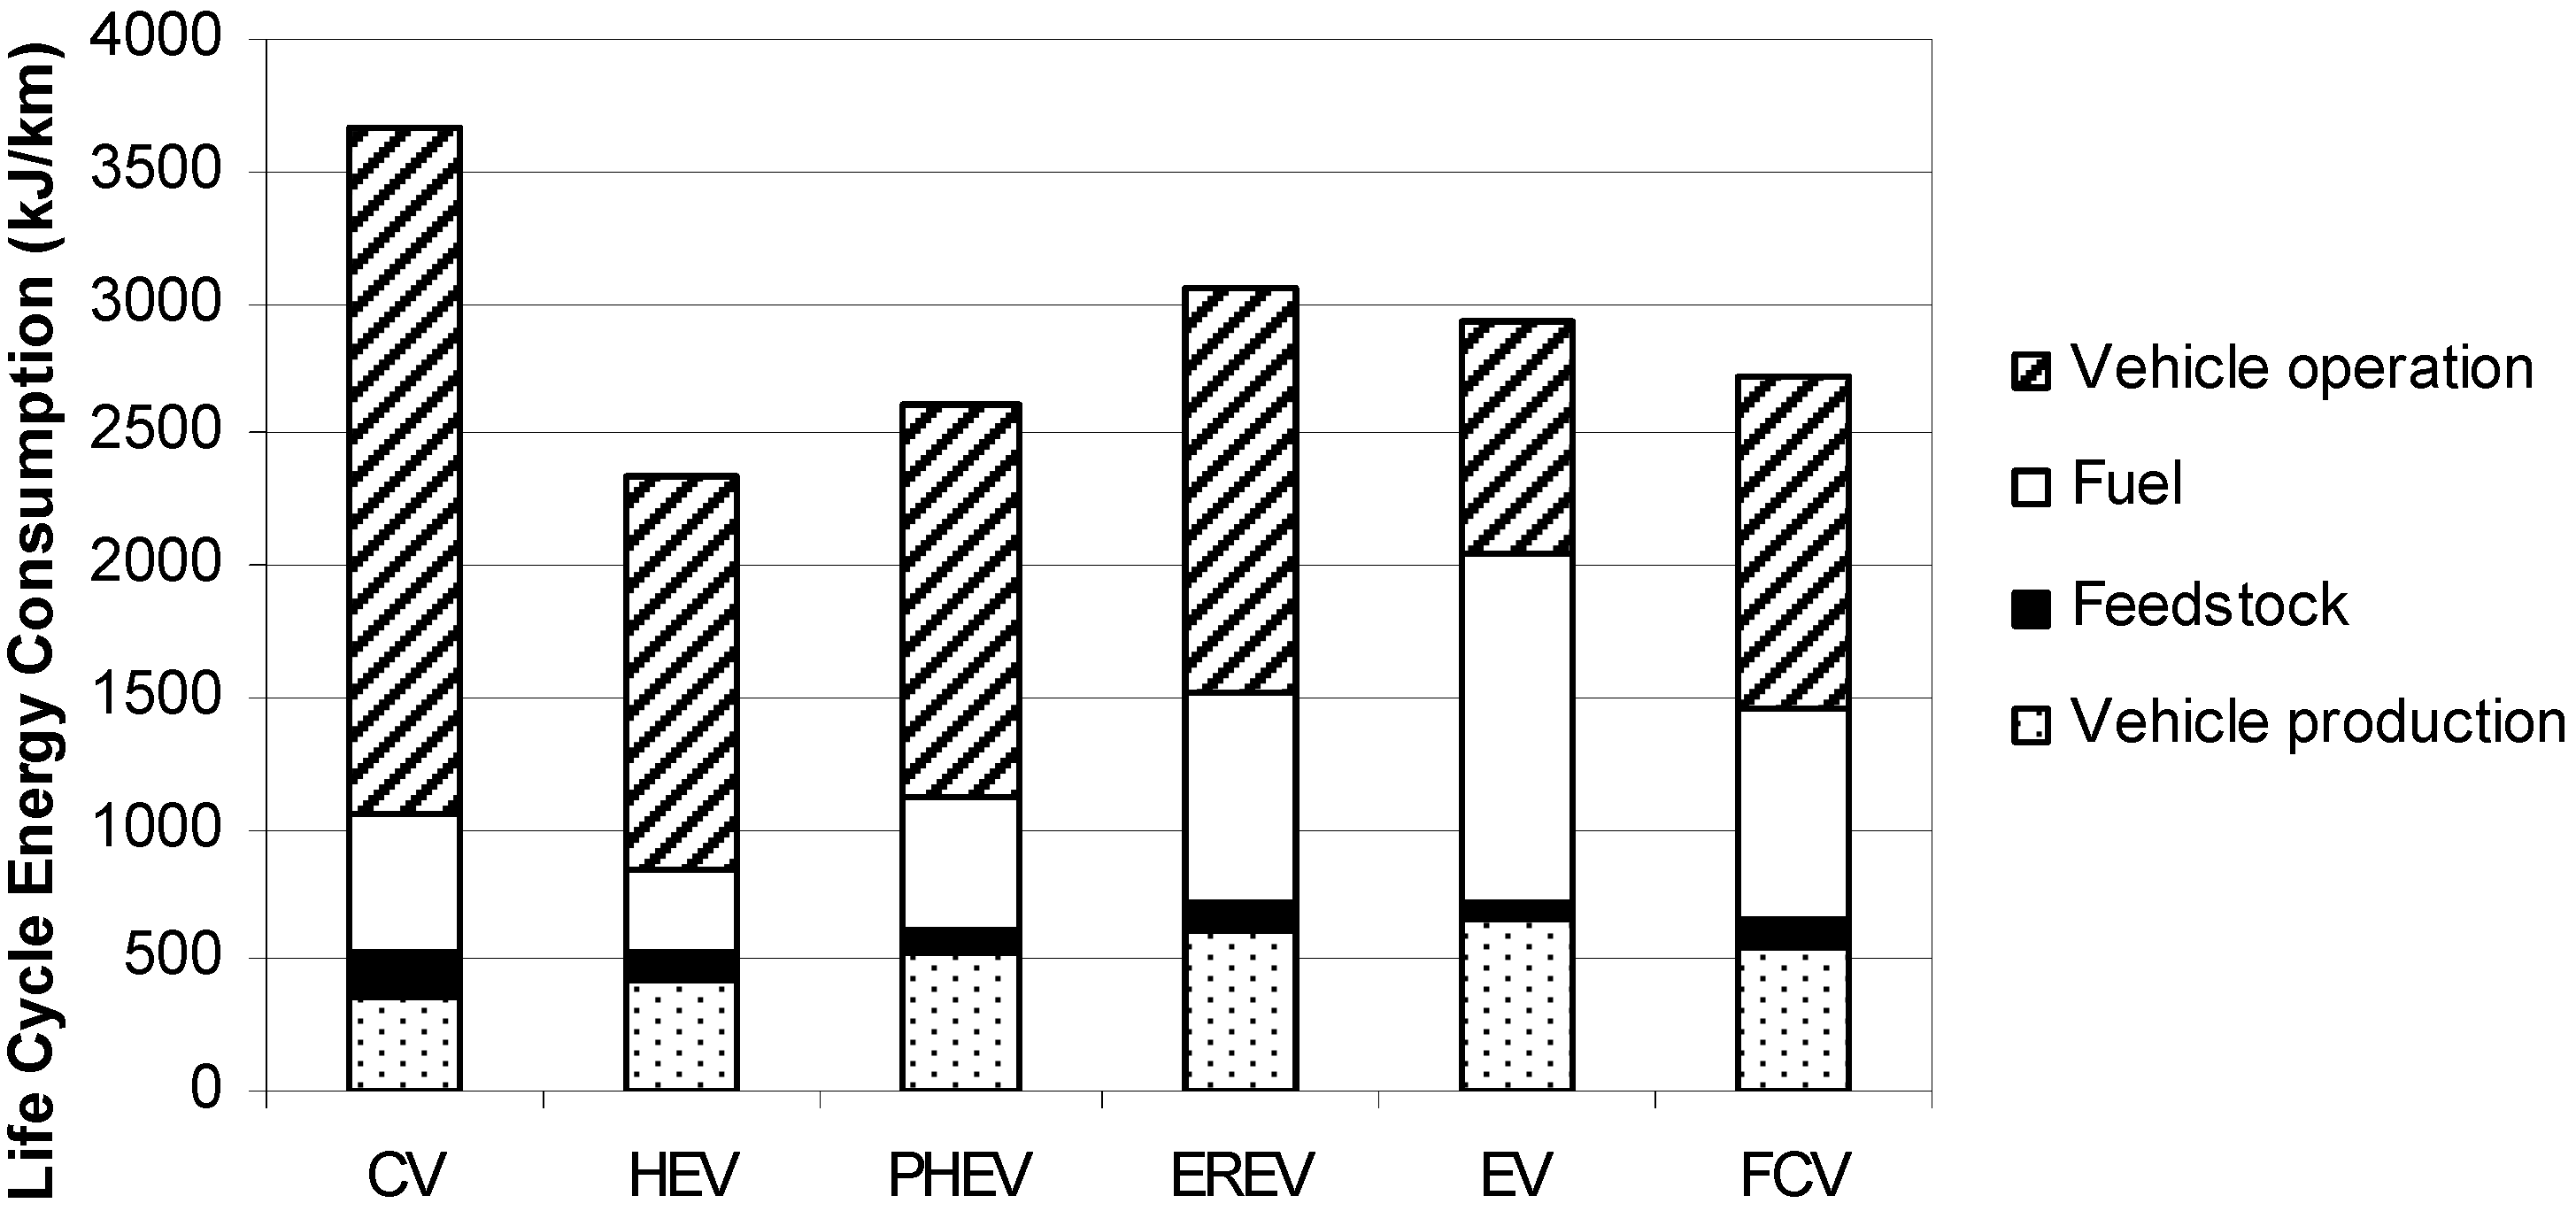
All of the results of the WTP, PTW, and vehicle production stages were combined to obtain the full energy cycle results for the selected technologies. The lifetime energy consumption and GHG emissions of the various vehicles are presented in
Figure 3 and
Figure 4. The fuel production cycle includes fuel and feedstock stages. The differences between these two are shown in
Figure 1.
The LCA shows that the CV has the highest energy use and emissions per km, most of which are produced during the vehicle operation (
i.e., PTW) stage. An engine converts chemical energy to mechanical energy; thus, their maximum efficiencies are relatively low, approximately 32% for gasoline engines and 40% for diesel engines. Practically, engine efficiencies are much lower than their theoretically maximum values because of energy losses associated with transmission, low-power demands, and idling operations [
33]. Due to the simplest configuration and the lightest weight of the CV, the energy use and emissions during the vehicle production stage are the lowest when compared to the advanced vehicles.
Figure 3.
LCA of energy consumption for a conventional vehicle and various advanced vehicles.
Figure 3.
LCA of energy consumption for a conventional vehicle and various advanced vehicles.
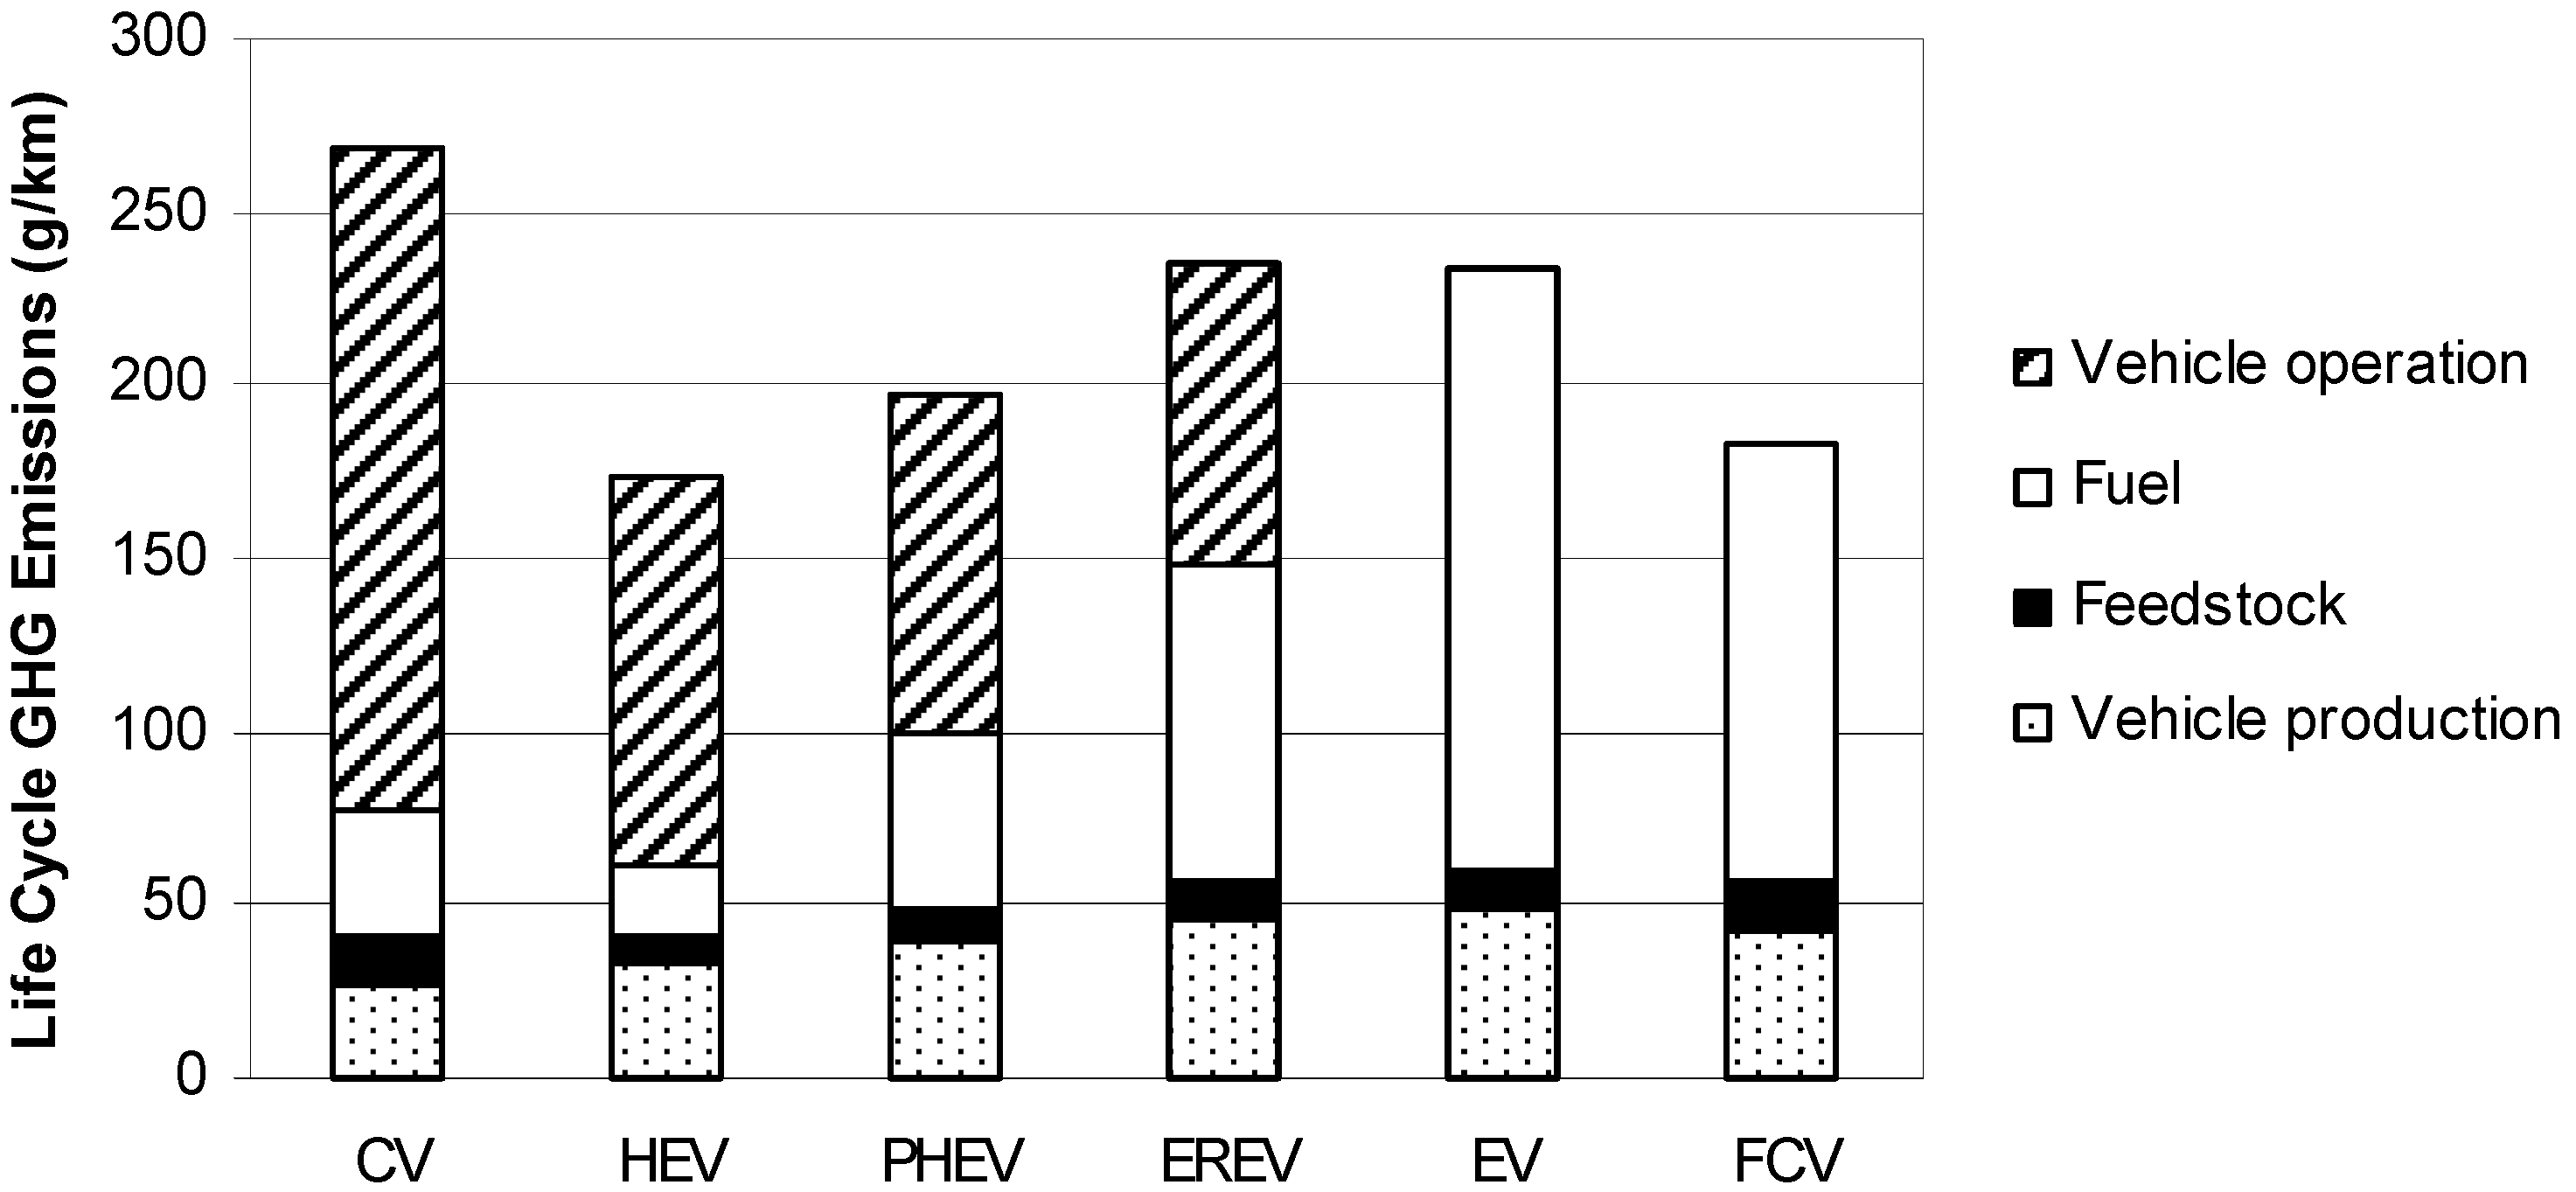
Figure 4.
LCA of GHG emissions for a conventional vehicle and various advanced vehicles.
Figure 4.
LCA of GHG emissions for a conventional vehicle and various advanced vehicles.
The HEV achieves the least GHG emissions and energy consumption in the LCA. The crude-to-gasoline pathway has a high efficiency of 82.6%. The efficiency of crude oil recovery is approximately 98%, while the refining of CG and RFG is 89% efficient [
6]. The HEV also significantly improves the fuel economy at the PTW stage to 50 mpg by eliminating idling losses, downsizing engine displacement, operating the engine at nearly optimal conditions, and recovering energy with regenerative braking [
33].
As for the materials of the vehicles, the production of the fuel-efficient vehicles is a more energy-intensive process because complex electrical systems are involved. The calculations in
Figure 3 and
Figure 4 show that the larger sizes of the batteries and more powerful electronics result in more energy use and emissions during the vehicle production. However, the material contribution to the full life cycle is much smaller than the contribution from the fuel cycle and only accounts for approximately 10–25% of the total energy use and emissions, depending on the types of configurations.
Electric vehicles have been marketed as zero-emission vehicles, which is true for urban air pollution. The claim is not accurate if we include the emissions that are released from the production of the electricity in the power stations and from the manufacture of the vehicles.
Figure 4 shows that the total amount of GHG emissions of the EV is only less than the emissions of the CV, but the emissions created during the WTP stage are much more than those by different fuel pathways. Energy consumption and GHG emissions depend critically on the source of the electricity. The energy use and emissions can be reduced when the electricity is from nuclear and renewable energy. However, the reduction in wheat and corn for renewable energy increase the internationally traded food prices. After the tsunami in Japan, many countries have started to re-evaluate the use of nuclear energy. The complete analysis of the influence of electricity mix has to involve energy policy discussion, which is not addressed in this article. Furthermore, the EV is not very encouraging, even if it is considered from the point of view of energy consumption. Although an EV has high powertrain efficiencies up to 86% with the achievement of the 99 MPG-e, the WTP cycle of electricity has a low-efficiency pathway [
34]. Before charging battery packs from the grid, over 40% of available energy is wasted during generation, and the delivery has an average efficiency of 92% [
32]. Batteries play an important role in the advanced vehicles. A material-based assessment is performed for battery manufacturing. The larger size batteries account for a higher percentage of the total energy use and emissions in vehicle production. Approximately 50%, 34%, 30%, 17%, and 5% of energy and emissions are from battery production during the manufacturing of EVs, EREVs, PHEVs, HEVs and CVS respectively. Fuel cell stacks contain specific composites, and the energy use and emissions for component manufacturing are much higher than other advanced vehicles.
The FCV is also promoted as another zero-emission vehicle. However, the results from this study show that the total energy usage of the FCV is higher than that of both the HEV and PHEV, while the emissions are only higher than those of the HEV. Fuel cells have high energy conversion efficiencies from hydrogen to electricity of up to 83%. In automotive applications, however, a fuel cell needs a peripheral system, which lessens the net efficiency to approximately 52% [
34]. Therefore, the FCV has a higher fuel economy (61 mpg) than that of both the CV (29 mpg) and the HEV (50 mpg). Steam reforming of natural gas in the U.S. is an inefficient method with an energy loss greater than 30%, and a large amount of GHG emissions are produced during the reforming processes. Hydrogen must be compressed to make it transportable [
35]. These factors cause the low efficiency and high emissions of hydrogen during the WTP cycle.
4.2. PHEV Energy Use and Emissions Impacted by Distances between Charges
The PHEVs, with their different architectures, bring about varying fuel economies and emissions during their lifetimes. The EREV has the second highest fuel energy use and emissions among the studied vehicles, while the Prius PHEV significantly improves fuel consumption and GHGs. The ability of the PHEVs to drive from both electricity and gasoline makes their fuel efficiency and emission assessment much more complex, depending on the distance traveled between charges [
16]. For a distance
travelled between charges of a vehicle with an AER of
, the distance traveled in CD mode
, and the distance traveled in CS mode
are calculated as:
The lifetime average energy use
(kJ/km) is calculated by the following equation:
where
(kJ/km) is the energy use with electricity only, and
(kJ/km) is the energy use in hybrid mode. The values of
and
were computed through GREET software based on the vehicle fuel economies in MPG-e and mpg, respectively, that are listed in
Table 1.
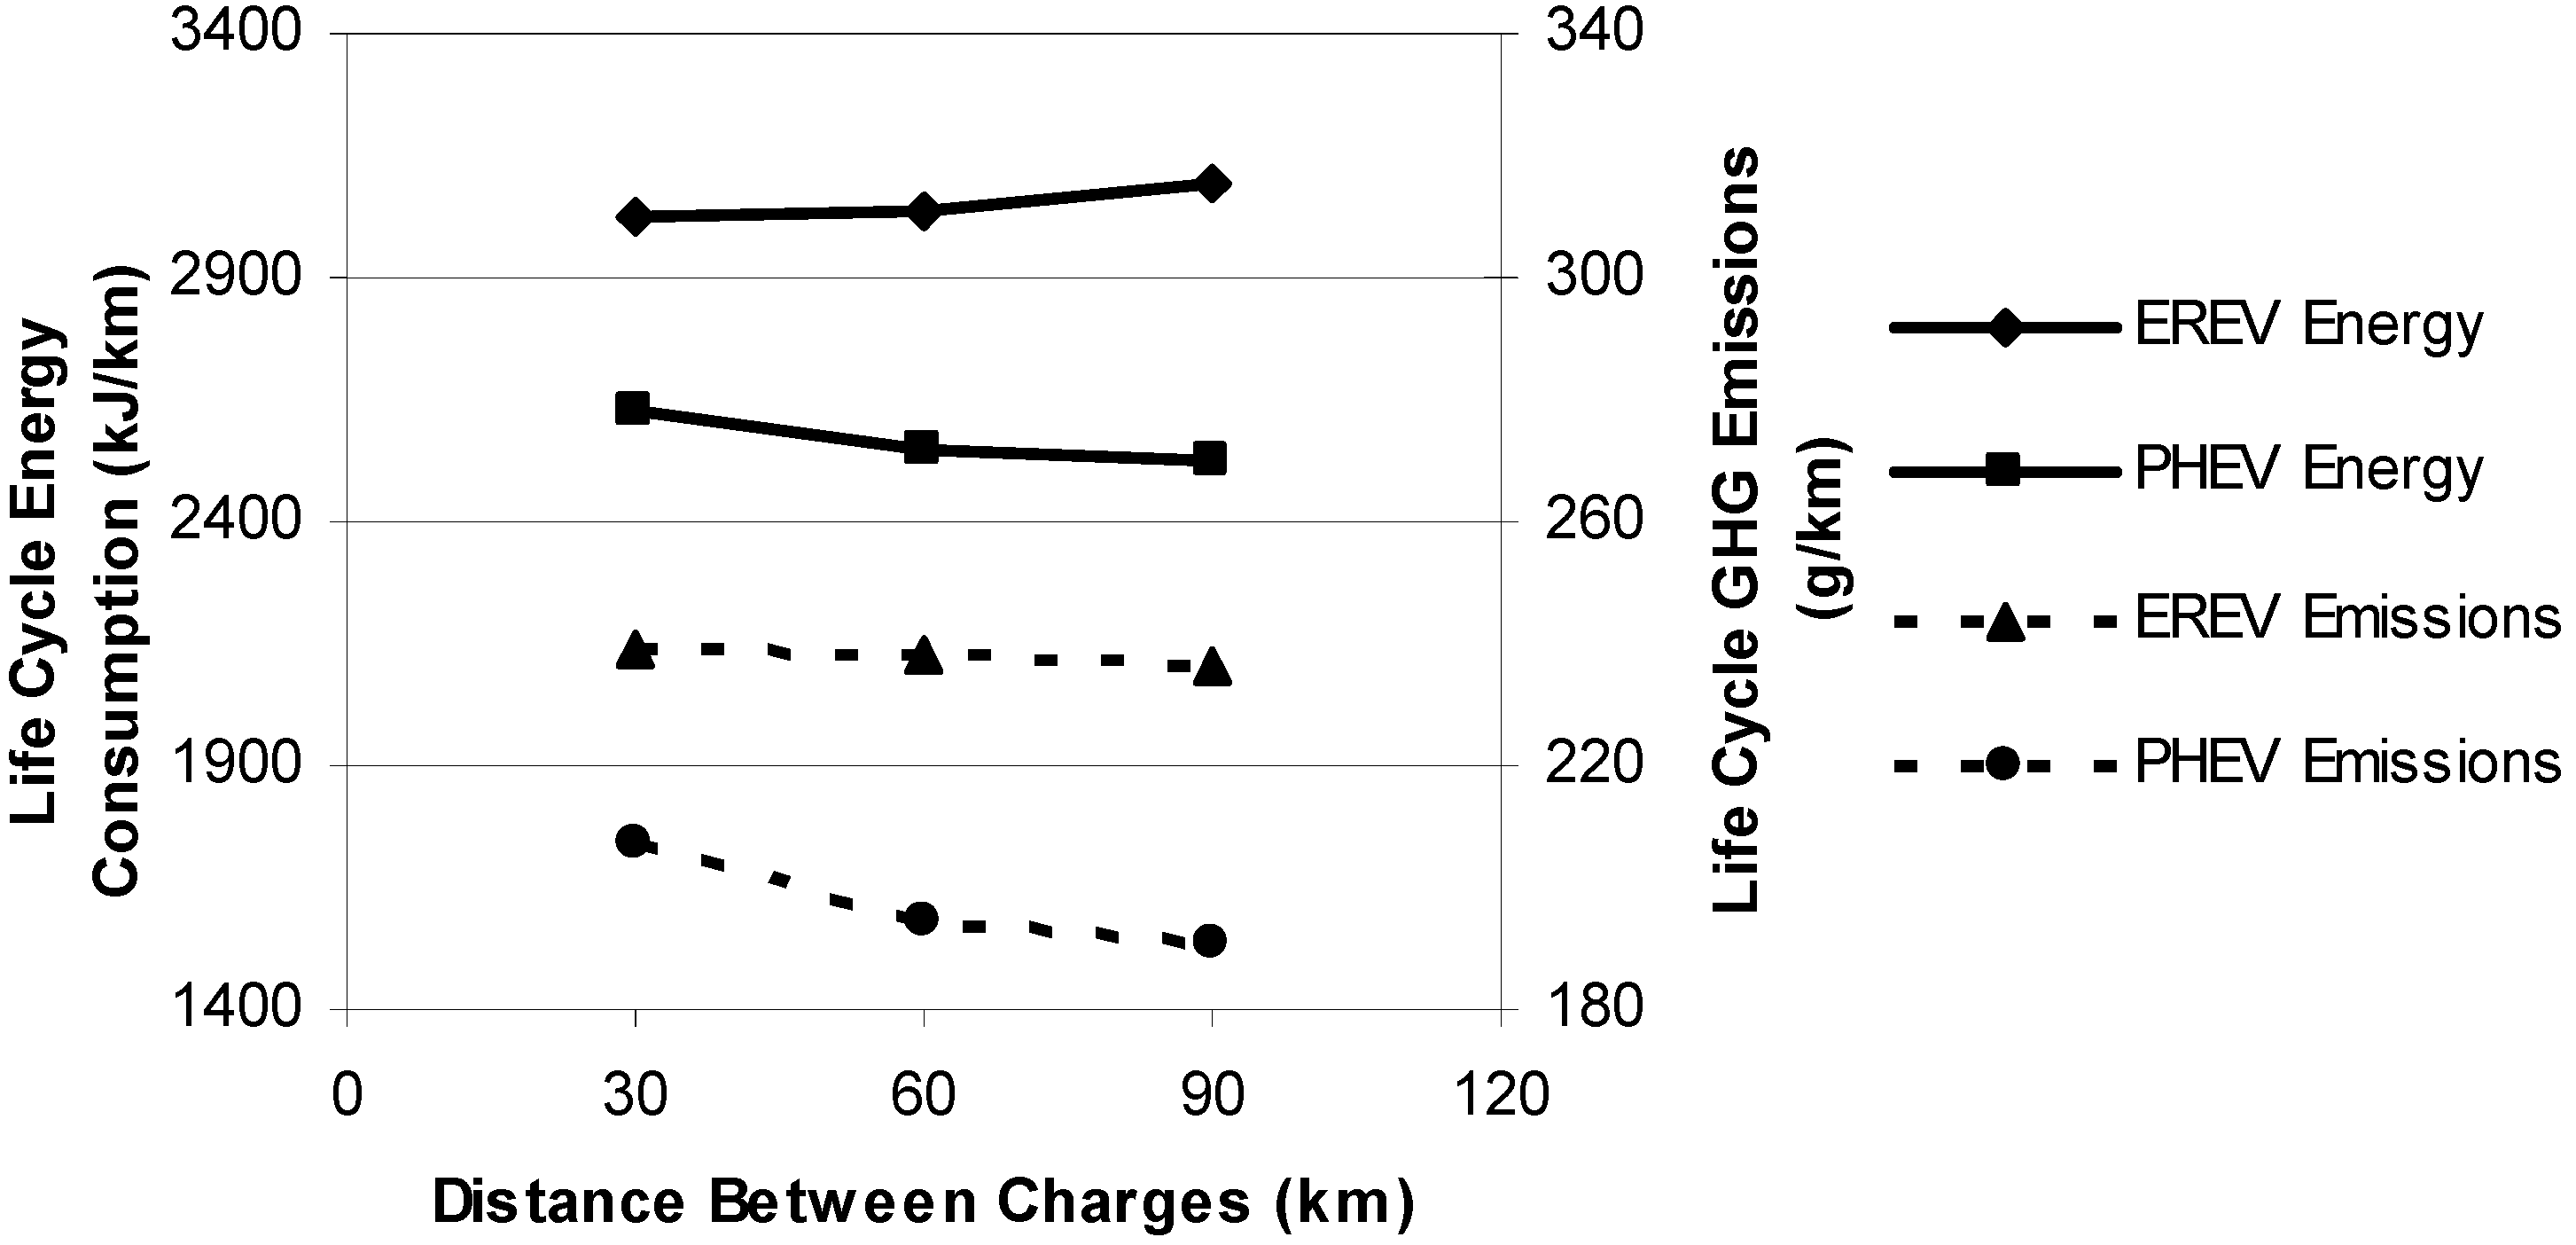
Figure 5 shows the results of the fuel consumptions of the EREV and PHEV, which is a function of the distances of 30, 60, and 90 km between two successive charges. As the motor of the Toyota Prius Plug-in is not sized for peak power, the gasoline engine must assist the motor to meet drivers’ demands, even if the AER has not been completed. Due to the lack of the detail control algorithm of the Prius Plug-in and the longer distances between charges (minimum of 30 km) than the 24 km AER of the Prius, we estimated the lifetime energy consumption of the Prius Plug-in using the same algorithm (Equations (1) and (2)) as the traveled distance was varied between charges.
Figure 5.
Lifetime energy consumptions and emissions of the two PHEVs as a function of the distance driven between charges.
Figure 5.
Lifetime energy consumptions and emissions of the two PHEVs as a function of the distance driven between charges.
PHEVs consume electricity during the AER. Beyond the AER, gasoline fuel is used with a lower PTW efficiency than that while using electricity. However, as analyzed before, the electricity usage does not positively benefit the total energy consumption because of the low-efficiency pathway of electricity. As shown in
Figure 5 for the EREV, the energy consumption increases slightly when the traveled distance between charges increases. This means frequently charging batteries can lower the lifetime energy usage, but the gain is not very obvious. On the contrary, the total energy usage of the PHEV is impaired by more battery charges. Despite the differences in the charging frequencies, the PHEV has consistent and better environmental benefits than those of the EREV due to the smaller size of its battery packs and traction motors. The electric drive system of the EREV, which is designed for longer traveling distance and peak power requests, increases the vehicle weight by approximately 20% and, consequently, reduces the fuel efficiency.
A similar analysis can be applied to the GHG emissions of PHEVs.
Figure 5 shows that the amount of the GHG emissions of the EREV is kept almost constant, regardless of the distance between charges. The emissions of the PHEV increase as more charges are performed because of the considerable amount of emissions produced during the WTP stage.
4.3. LCA of Vehicle Total Ownership Costs
EVs and PHEVs have begun to increase in the market because of their lower refueling costs. To evaluate the net cost implications over the lifetimes of the vehicles, we calculate the total costs by taking into account the vehicle purchase prices and present values of operation costs (variable costs). Due to the lack of maintenance cost data for the advanced vehicles and the extensive hybrid system warranty that is provided by the manufacturers, maintenance/repair costs were not considered in this study. It is estimated that if a HEV is driven 150,000 km, the maintenance cost of the HEV is nearly identical to that of the CV. If its distance is over 300,000 km, the cost is approximately $2,000–$7,000 greater than an equivalent CV [
12]. The costs imposed by a tax on CO
2 were excluded, as there is no nationwide carbon tax leveled in the USA. The operation cost represents the average consumer expense per kilometer related to the recharging costs of using electricity and gasoline fuel. Thus, the total cost
($/km) of a vehicle is calculated as:
where
is the one-time vehicle initial purchase price listed in
Table 1,
is the vehicle lifetime traveled distance 256,000 km,
is the cost of electricity,
is the energy consumption when using electricity, and
is the gasoline price. For a vehicle that does not use electricity from the grid,
equals zero, and
is the same as
. For the EV, which uses electricity only,
is equivalent to
while
is set to zero.
Using the EPA’s MPG-e conversion formula between electricity and gasoline energy,
Table 2 presents the calculated values of energy consumption
of the vehicles using electricity from the grid. We calculated the average lifetime costs for the selected technologies assuming
= $0.13/kWh because the U.S. average electricity price has not changed much over the past several years. The gasoline retail price has drastically fluctuated during the past few years. Thus, $2/gallon ($0.53/liter) and $6/gallon ($1.59/liter) gas price were used to estimate the vehicle variable costs. These two numbers provide boundaries on the marginal prices of gasoline in the U.S. market [
16].
Table 2.
Vehicle energy consumption using electricity.
Table 2.
Vehicle energy consumption using electricity.
| | PHEV | EREV | EV |
|---|
| MPG-e | 112 | 93 | 99 |
| e (kWh/km) | 0.191 | 0.228 | 0.213 |
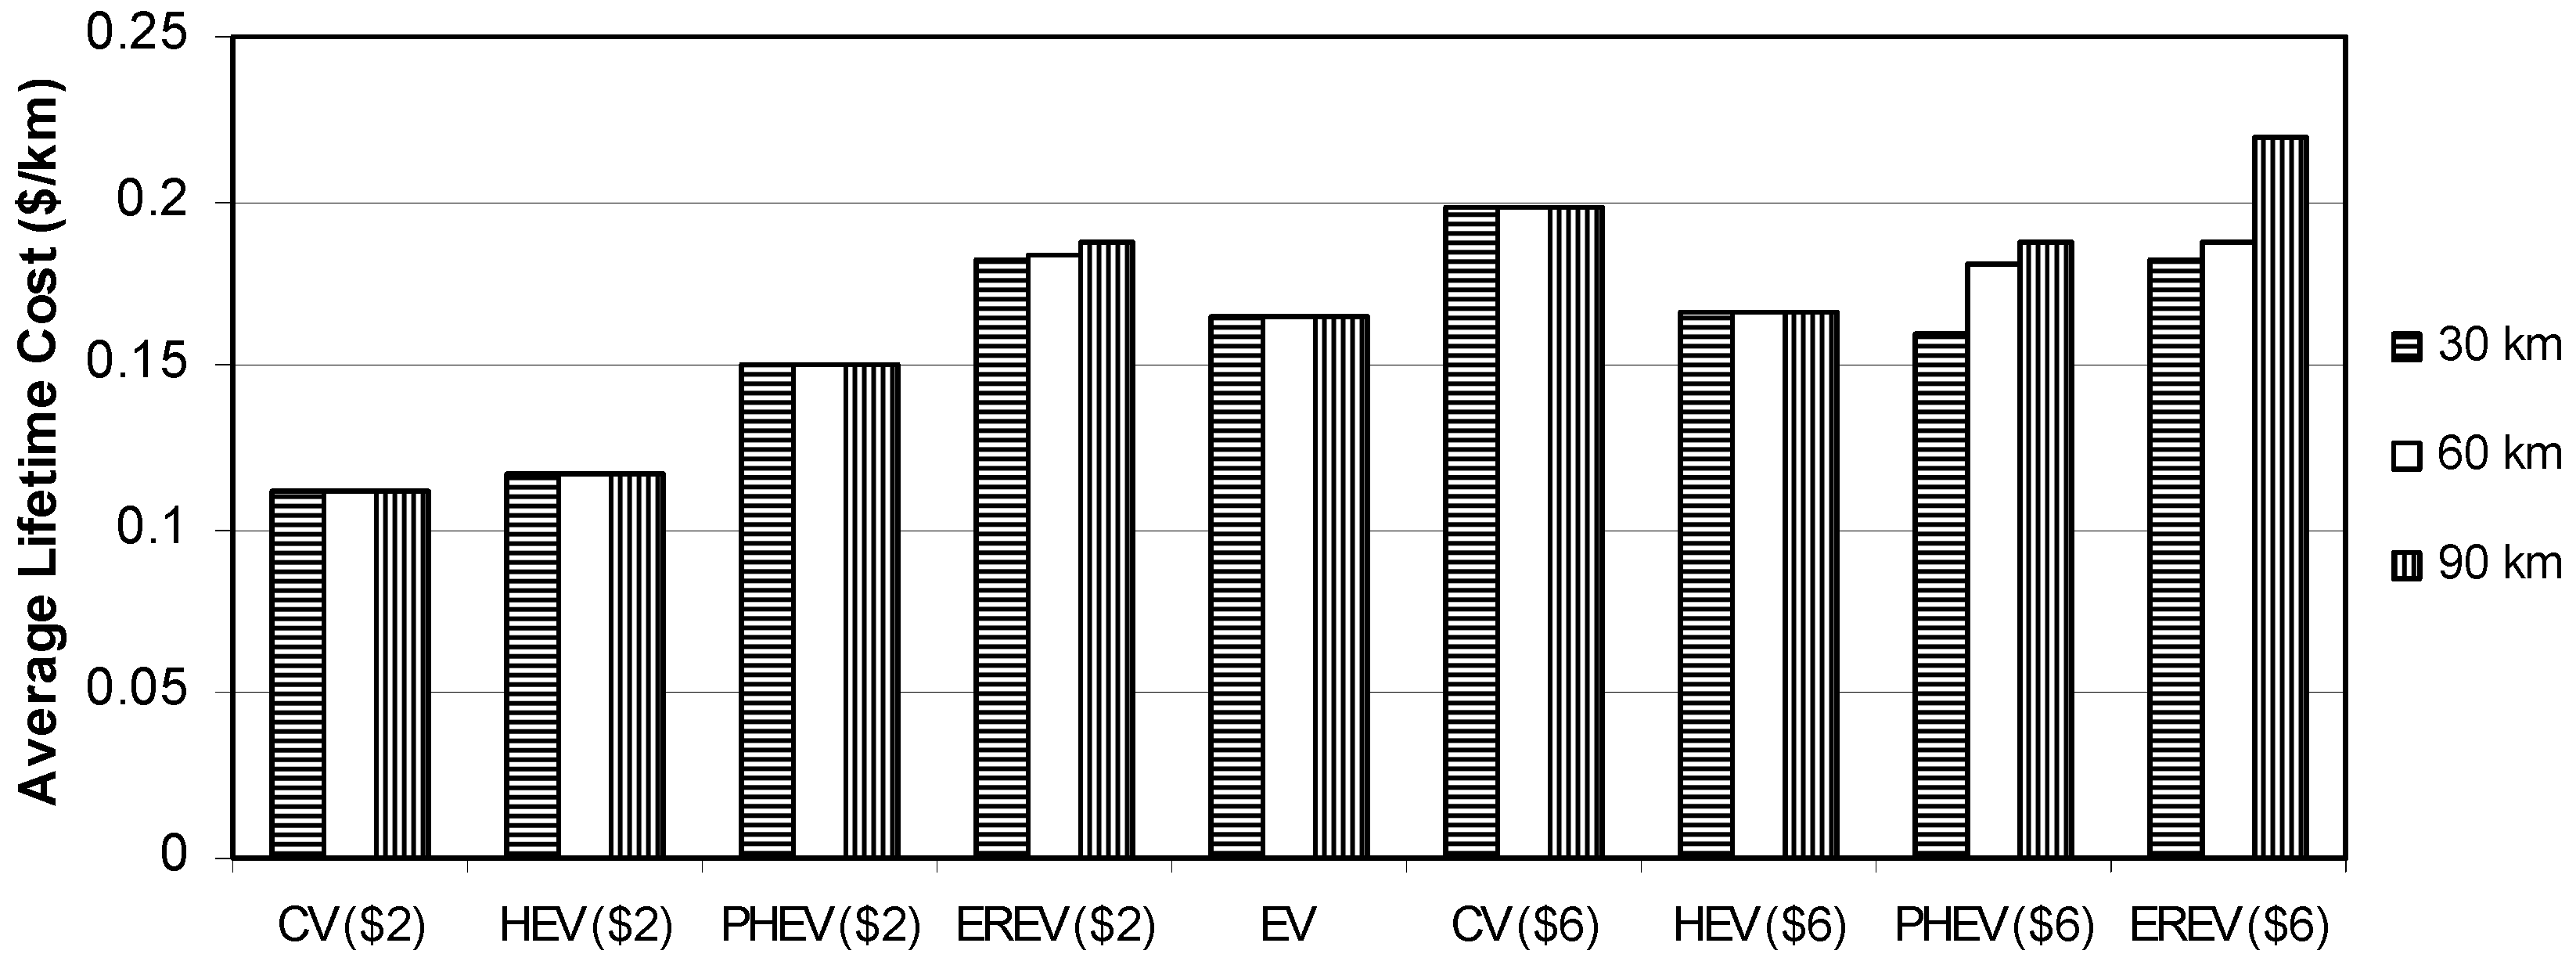
Figure 6 shows the average lifetime cost of the selected vehicles per kilometer as a function of distance between charges for every 30, 60 or 90 km for U.S. consumers. The cost of the FCV was not compared to the others because it is too expensive for regular users and is only available in the state of California for a three-year lease. A study has previously shown that fuel cell vehicles would remain uncompetitive, even if production costs of fuel cells declined by 90% [
18].
A low gasoline price of $2/gallon makes all of the fuel-efficient vehicles less competitive with the CV. In this scenario, the total cost of a vehicle is mainly determined by the vehicle’s retail price, and the higher purchase price results in a higher total cost. The different charging strategies based on the traveled distances do not make EVs, PHEVs, or EREVs more competitive.
A higher price of $6/gallon raises the cost competitiveness of the advanced vehicles and makes the EV the lowest cost option. In this scenario, the CV turns out to be the most expensive vehicle to use. The PHEV, which possesses the same configuration as HEV except for the battery packs, has a lower total cost than that of the HEV if the batteries are charged frequently. The PHEV becomes less competitive than the HEV if it is charged infrequently. The Li-ion battery packs with their higher power density increase the production costs of the PHEV. In addition, the increased weight of the PHEV slightly decreases fuel economy and increase the vehicle operation costs when using gasoline. For this reason, the PHEV must be charged very often and use electricity as much as possible to make it less expensive. Although it is much cheaper to buy a CV, the higher fuel efficiencies of the HEV and the PHEV considerably diminish the vehicle variable costs and thereby offset their initial purchase prices. The highest price and lowest fuel economy during CS mode of 37 mpg make the EREV the least competitive vehicle if it is driven like a regular hybrid electric vehicle without frequent charges. When the EREV is used as a regular electric vehicle, its competitiveness increases, and the lifetime cost can be lower than that of a CV.
From the perspective of consumers, the financial attractiveness of alternative vehicles is influenced by tax incentives which were ignored in this study. In the U.S., EVs and PHEVs that were purchased in or after 2010 may be eligible for a federal income tax credit of up to $7,500, while $3,400 is available for purchased HEVs [
36]. However, the amount of the refund that a consumer can receive varies, depending on family income, expenses, and other tax liabilities. Our calculation shows that a 4-person family with an annual income of $70,000 can only obtain less than half of the maximum credit, and every $1,000 in tax incentives only reduces the total cost by $0.004 per kilometer.
Figure 6.
Average vehicle lifetime costs per kilometer driven as a function of the distance between charges for the selected technologies.
Figure 6.
Average vehicle lifetime costs per kilometer driven as a function of the distance between charges for the selected technologies.
5. Summary and Conclusions
We investigated the energy use, GHG emissions, and costs for five different types of advanced vehicles, including an HEV, a PHEV, an EREV, a battery EV, and a FCV, and compared them to a conventional vehicle. These vehicles are commercially available in the U.S. market, and they have similar dimensions and performances. The LCA covers both the fuel cycle and the vehicle cycle.
The results indicate that all of these fuel-efficient technologies improve the energy use and emissions throughout the lifetimes of the vehicles. Because of the high efficiencies in both cycles, the HEV with the power-split configuration achieves the lowest energy consumption and emissions, with a reduction of energy use by 42% and emissions by 35% when compared to the CV. From the perspective of the vehicle’s lifetime, EVs and FCVs demonstrate more disadvantages than HEVs, although they produce zero emissions during the PTW stage. However, the low-efficiency pathways of electricity and hydrogen production require a large amount of energy for the fuel production and delivery and consequently increase the total energy use and emissions.
PHEVs and EREVs use both electricity from the grid and gasoline as energy sources. A PHEV has a shorter AER than that of an EREV and behaves like an HEV. An EREV uses electricity most of the time for regular commutes and changes to hybrid mode until the battery is low. It is heavier than other vehicles because it employs large batteries to meet the power requirements of an EV and to preserve the complicated hybrid system for battery charging on board. As a result, the powertrain efficiency shrinks, and energy use and emissions during the vehicle manufacturing increase. Further examination shows that changes in the charging frequency actually alter the total energy use and emissions of the PHEVs and EREVs but that the energy use and emissions as a function of charging frequency trend in different directions. Frequent charges of an EREV incur more energy usage and emissions in the whole energy cycle, while the same activity for the PHEV benefits the global environment.
Compared to a CV, the advanced vehicles require more energy for production because of the additional power electronics and battery packs, but the increase is small. The energy use and emissions only account for less than one-fourth of the total energy use and emissions footprint. Moreover, these vehicles have greatly improved fuel efficiencies by 1.7 to 3.8 times in the PTW stage. Accordingly, the energy savings in the fuel cycle for a non-conventional vehicle is higher than the energy used in the vehicle cycle to build it.
The vehicle lifetime costs are mainly dependent on fuel prices. Low gasoline prices of $2 make the fuel-efficient vehicles more expensive to own due to their high purchase prices, however, high prices of $6 increase the cost competitiveness of these vehicles significantly. EVs are suitable for daily short commuters because of the limited traveled distance and relatively stable electricity prices. An HEV is a good option to target the fluctuating gas prices and can be used for regular long distance travel. The operation costs of PHEVs and EREVs can be drastically reduced by frequently charging the batteries, especially when gas prices are high. In the current market, the PHEV is a better choice than the EREV because of the high purchase price of the EREV.
In summary, to lessen the lifetime energy use and GHG emissions of an advanced vehicle, the most critical role is to improve the vehicle powertrain efficiency by decreasing engine fuel consumption when gasoline is the fuel. The electric drive system is very efficient. For a vehicle that uses electricity or hydrogen, the energy and emission reduction is more remarkable by augmenting the efficiencies of the fuel production, delivery, and storage rather than the efficiency of the vehicle itself. The total cost to own a vehicle is mostly determined by the oil market, but it can be reduced by adopting alternative vehicle configurations and by frequently charging batteries if applicable.


