Abstract
PHEVs and BEVs make use of battery cells optimized for high energy rather than for high power. This means that the power abilities of these batteries are limited. In order to enhance their performance, a hybrid Rechargeable Energy Storage System (RESS) architecture can be used combining batteries with electrical-double layer capacitors (EDLCs). Such a hybridized architecture can be accomplished using passive or active systems. In this paper, the characteristics of these topologies have been analyzed and compared based on a newly developed hybridization simulation tool for association of lithium-ion batteries and EDLCs. The analysis shows that the beneficial impact of the EDLCs brings about enhanced battery performances in terms of energy efficiency and voltage drops, rather than extension of vehicle range. These issues have been particularly studied for the passive and active hybrid topologies. The classical passive and active topologies being expensive and less beneficial in term of cost, volume and weight, a new hybrid configuration based on the parallel combination of lithium-ion and EDLCs on cell level has been proposed in this article. This topology allows reducing cost, volume, and weight and system complexity in a significant way. Furthermore, a number of experimental setups have illustrated the power of the novel topology in terms of battery capacity increase and power capabilities during charging and discharging. Finally, a unique cycle life test campaign demonstrated that the lifetime of highly optimized lithium-ion batteries can be extended up to 30%–40%.
1. Introduction
Since the beginning of the automobile era, the internal combustion engine (ICE) has been used for vehicular propulsion. In addition, motor vehicles powered by the ICE are significant contributors to air pollutants and greenhouse gases linked to global climate change [,]. As the global economy begins to strain under the pressure of rising petroleum prices and environmental concerns, a lot of research work has spurred the development of various types of clean energy transportation systems such as Hybrid Electric Vehicles (HEVs), Battery Electric Vehicles (BEVs) and Plug-in Hybrid Electric Vehicles (PHEVs) [,,,,]. However, the requirements for output power during acceleration, efficient use of the regenerative energy and considerable cycle life remain critical aspects for battery technologies to meet [,,,,,,,,,,,,].
In reference [] the general performances of various Rechargeable Energy Storage Systems (RESS) systems have been investigated, analyzed and compared. Plug-in Hybrid Electric Vehicle (PHEV) applications are likely to have their RESS sized for energy requirements rather for power. However, the RESS should have acceptable power capabilities during acceleration and braking events of the vehicle, which seems a barrier for high-energy battery technologies [,,]. In order to overcome this shortcoming, the hybrid structure in the PHEVs can be modified, whereby the main RESS system (high-energy battery) and the ICE can be combined with a high power system such as Electrical Double-Layer Capacitor (EDLC) or also known as supercapacitors or ultracapacitors [,,,,,,].
Existing hybrid topologies of EDLCs and lead-acid batteries have proved their suitability for extending the lifetime of lead-acid batteries, minimize battery losses, achieve efficient energy recuperation and extend the range of the vehicle [,]. EDLCs are very convenient energy storage systems for applications where high power is needed. Furthermore, EDLCs show excellent very fast charge performances, long cycle life (>500,000 cycles) and wide operating temperature range (−40 °C up to 65 °C) [,,,,]. Here it should be noted that the denomination “EDLC” as used in this article only refers to the carbon-carbon based EDLCs.
Figure 1 represents an overview of the various anode and electrode components for high power applications. It is noticeable that the anode and cathode materials for EDLCs are based on activated carbon with a specific capacity of 40 mAh/g. Contrary to the EDLCs, when the ions in the double-layer are transferred to the surface and combine with atoms on the surface, such devices are called pseudo-capacitors [,]. By combining the positive activated carbon with a nanostructured negative metal oxide such as lithium titanate oxide (Li4Ti5O12 or LTO), the energy density can typically be enhanced from 10 Wh/kg up to 14 Wh/kg [,]. This technology has been developed by Telcordia Technology []. Du Pasquier et al. investigated the performances of 500 F pouch cells and they found that values of 11 Wh/kg for energy density and 4000 W/kg for power density could be achieved []. Moreover, the LTO-based anode also can be combined with lithium cobalt oxide or lithium manganese oxide. The energy density can be improved even more. In the literature such a combination is called a hybrid lithium-ion battery, while the coupling of a lithium alloy oxide-based cathode with graphite, which has a high specific capacity, falls under the category of lithium-ion batteries.
Recently new rechargeable energy storage systems called hybrid capacitors or lithium-ion capacitors which have higher energy performances than conventional EDLCs have been in development. In [] Omar et al. investigated a prototype lithium-ion capacitor with an energy density about 14 Wh/kg and power capabilities up to 10 kW/kg. However, as mentioned these technologies are still under development and the long cycleability of these systems is still unknown.
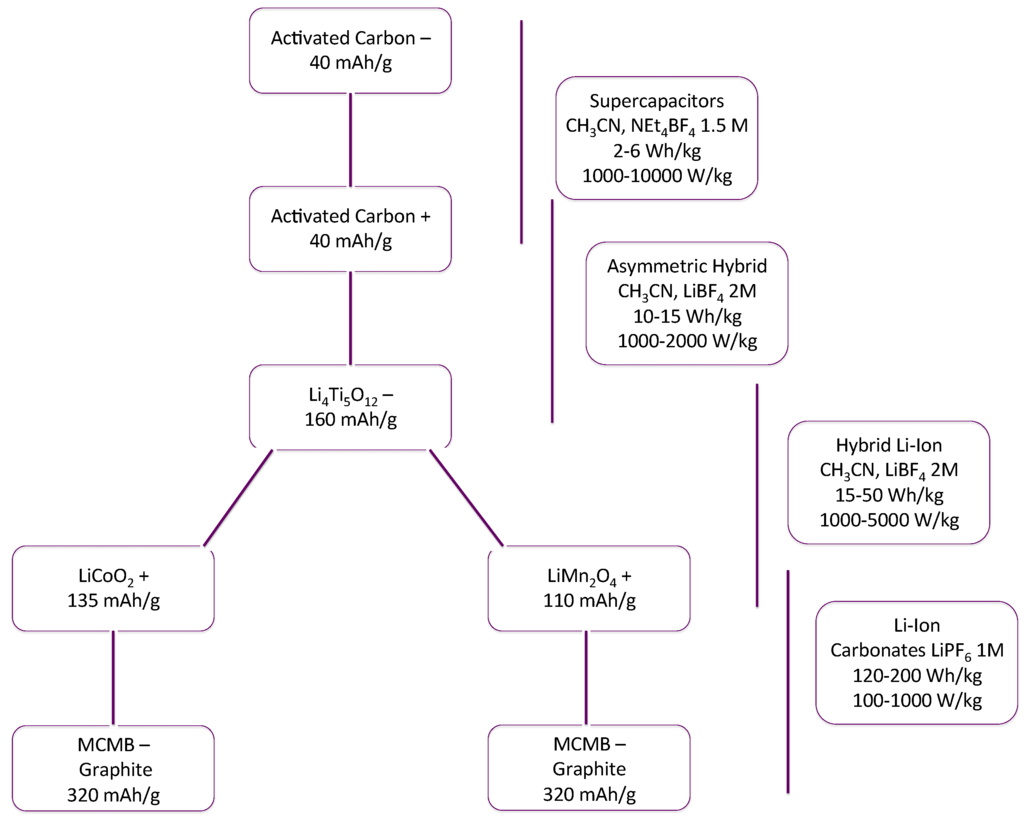
Figure 1.
Overview of the components used in rechargeable energy storage systems [].
In this study, only the activated carbon-carbon based EDLC have been investigated and an extended literature study concerning the characteristics and features of the hybrid systems is presented. This investigation has been carried out based on a novel hybrid simulation model that has been developed in Matlab Simulink. Further, a new hybrid topology is developed which offers good performance compared to the stand-alone battery system. The new topology is more attractive in terms of cost, weight and volume compared to the other existing hybrid topologies such as passive and active. Finally, the long-term capabilities of this topology have been investigated based on a number of unique life-cycle tests.
2. Hybrid Topologies
In the literature, one can find a number of hybridization topologies where EDLCs have been implemented in combination with battery systems. In Figure 2, four possible hybrid structures for BEVs are presented. Each of the presented topologies has its own properties. In this section the merits and drawbacks of these topologies are highlighted.
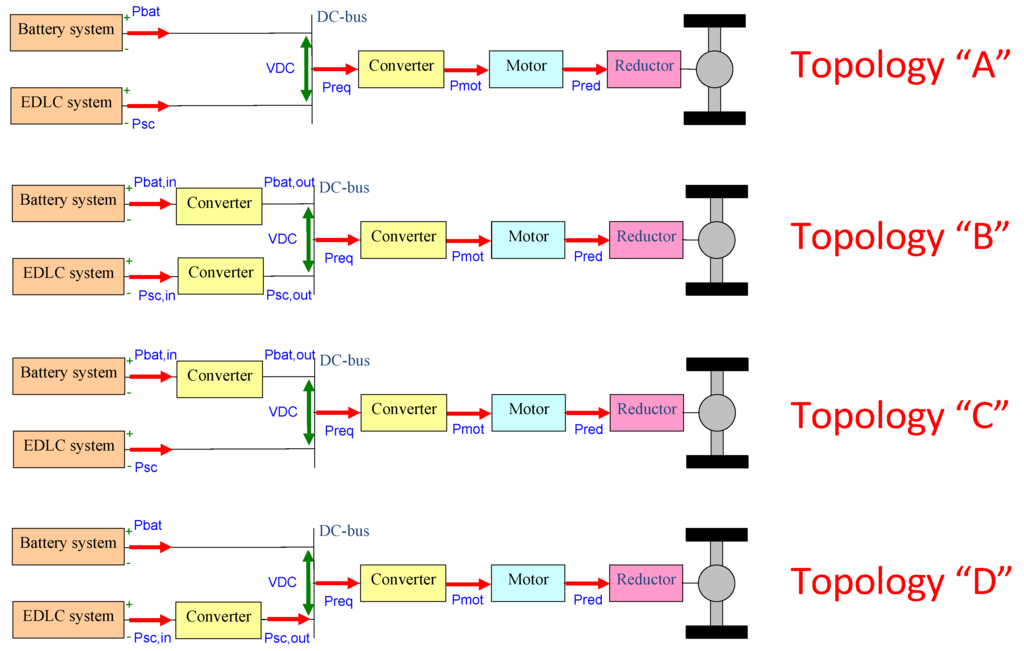
Figure 2.
Hybridization topologies.
2.1. Topology “A”
In the case where the battery and EDLC systems are directly connected to the DC-bus, the energy exchange between the EDLC system and the drive train is dependent on the variation of the DC-bus voltage. In this context, the DC-bus voltage represents the voltage of the driveline.
From the point of view of DC-bus voltage stability and converter working, the DC-bus should be as stable as possible. In terms of DC-bus voltage stability, topology “A”, also called the “passive hybrid” system, does not show a significant system improvement. To the contrary, the system will be much heavier and the losses in the system will increase due to the addition of the additional system.
According to Equation (1), we can conclude that the EDLC system can release 75% of the energy content when the voltage over the system is discharged from a maximum voltage Umax to Umax/2. The EDLC will not be able to cover this voltage envelope with the topology “A”:
where EEDLC: Energy of the EDLC system (J); CEDLC: Capacitance of the EDLC system (F); UEDLC,max: Maximum EDLC system voltage (V); UEDLC,min: Minimum EDLC system voltage (V).
2.2. Topology “B”
In order to increase the performance of the whole system, two dedicated bidirectional DC-DC converters can be used. The converters will allow us to optimize the power flow of the different RESS energy sources. However, the energy efficiency of the system will decrease and the system cost will increase due to the use of two bidirectional DC-DC converters.
2.3. Topology “C”
The third possible topology could be case “C”, whereby the battery system is connected to the DC-bus through a bidirectional DC-DC converter and the EDLC system is connected directly to the DC-bus. This topology does not allow the EDLC system to cover the full voltage envelope.
2.4. Topology “D”
The preferable solution connects the EDLCs through its bidirectional DC-DC converter. The control strategy of the converter will enable it to provide the power peaks during acceleration and to store energy during regenerative braking. According to this topology, the battery power can be controlled indirectly as presented in Equation (2):
where Pb: Battery power (W); PL: Required power (W); PEDLC: EDLC system power (W).
Thus, from the point of view of the cost, performance and system complexity, the cases A and D are the most attractive hybrid topologies. In this paper, these two systems are analyzed and compared.
3. Simulation Tools
Investigating HEV systems is quite a hard task due to the complexity of the various subsystems involved. Simulation models can be of great assistance in examining HEV designs. The simulation will allow us to have a clear view of the efficiency and performances of specific system prior to starting manufacturing. In the last two decennia, a lot of effort has been made regarding the development of software tools for HEVs. In this section, the most prominent simulation software tools are briefly reviewed.
3.1. ADVISOR
The “Advanced Vehicles SimulatOr” (ADVISOR) has been developed by the U.S. Department of Energy (DoE) and the National Renewable Energy Laboratory (NREL) for Transportation and Systems in 1995 and has been widely used [,]. ADVISOR is able to assess the capabilities, emissions and fuel efficiency of both conventional and hybrid systems. The program works under the Matlab Simulink platform. It contains a number of data and submodels such as models for battery, electric motor, ICE, etc. ADVISOR also has the merit that any existing models can be modified and enhanced, when wanted.
3.2. SIMPLEV
In 1993, the Idaho National Engineering and Environmental Laboratory (IREEL) developed a simulation software called “Simple Electric Vehicle Simulation” program (SIMPLEV) only for investigation of BEVs and series HEVs []. In other words parallel hybrid electric vehicles and conventional ICE vehicles cannot be simulated with SIMPLEV. The software calculation method is based on the “effect-cause method” or also known as “backward” or “wheel-to-engine”. When a speed cycle is applied on the wheels, the program will calculate the needed power from the main energy source by including the efficiency of the various sub components of the driveline.
3.3. PSAT
The Powertrain System Analysis Toolkit (PSAT) is a multifunctional software tool developed by Argonne National Laboratory and sponsored by the U.S. Department of Energy [,]. Unlike the previous tools, PSAT is based on the “cause-effect method”. It has been modeled in a Matlab Simulink platform for evaluation of various hybrid systems and conventional ICE vehicles.
3.4. VSP
In 2000, The Vehicle Simulation Programme (VSP) has been developed at the Vrije Universiteit Brussel (see Figure 3) []. During years, it has been used in many research and industrial projects. Based on the extended presented version, the VSP can simulate any kind of HEV topologies and vehicles. The software contains a huge library, whereby the appropriate component can be selected. The sub-models can be modified by using mathematical equations or look-up tables.
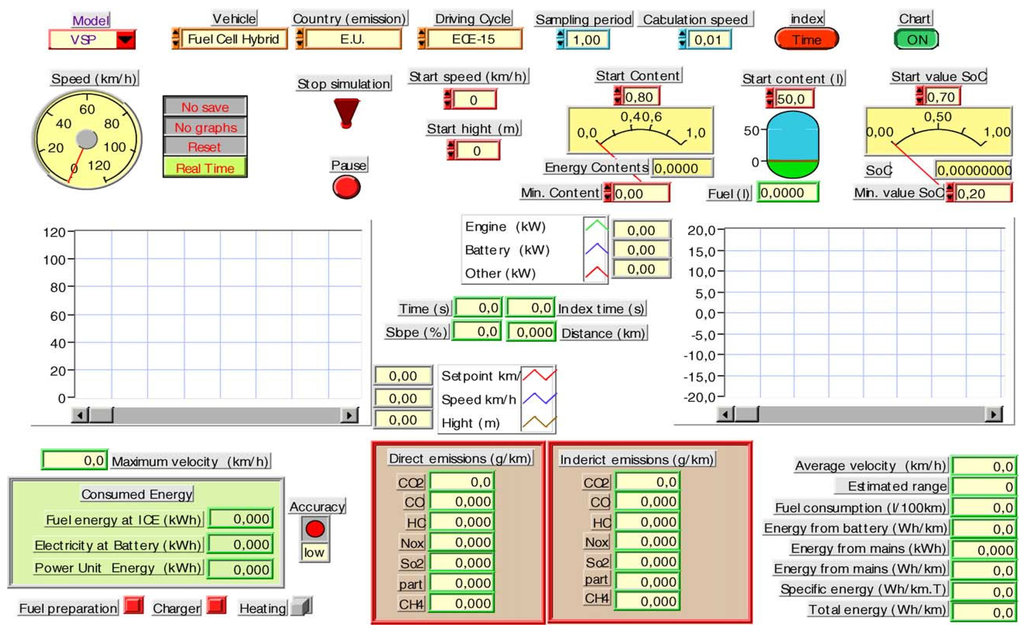
Figure 3.
Vehicle Simulation Programme [].
Furthermore, it has proved its suitability for the evaluation of control algorithms and optimization of performances of sub driveline component at different driving cycles. The software tool also allows estimating the emissions of the HEVs and conventional vehicles with respect to various fuels.
3.5. Modelica
Another available simulation tool is Modelica, which since 2000 has found the way into the industry []. Due to an extensive toolbox, the software is able to simulate and investigate the electrical, fluid, hydraulic, pneumatic and mechanical systems. Unlike the software tools mentioned earlier, Modelica uses only differential algebraic and discrete equations for describing the model and its sub systems.
3.6. Other Software Tools
In the last 10 years, many commercial simulation tools have been developed such as Dymola, MapleSim and CATIA Systems. In 2007, a new combination of software tools has been developed at the University of Waterloo in Canada []. The proposed model combines the ADVISOR and Matlab/Adams HEV model. Based on the ADVISOR simulation tool, only the vehicle performances from the point of view of the energy can be investigated. However, for car manufacturers the simulation of the dynamic capabilities of a vehicle is of high importance. By combination both approach, a multi-functional hybrid vehicle simulation tool was derived. In the literature, one can find more simulation software tools such as EHVSP, ELVIS and HYGEIA [].
3.7. Dedicated Series Hybrid Electric Vehicle
Due to the adaptability concerns of the different abovementioned software tools, a dedicated series hybrid electric vehicle simulation model has been developed in the framework of this study in Matlab Simulink. The authors propose the hybrid electric vehicle topology as a hybrid association between the battery system and the EDLC system. Thus, in this context, there is no internal combustion engine or a fuel cell system available in the driveline. Hereby, we still have a pure electric vehicle, as is the case for the Nissan Leaf.
This simulation model is composed of a battery system and an EDLC system (with and without an associated DC-DC converter). The main user interface of the model is presented in Figure 4. As presented, the model works based on the “backward” calculation method. The aim of the dedicated simulation program is to study the power flow in the drive train of the vehicle and particularly to optimize the power sharing between the several rechargeable energy storage systems (RESS). Moreover, the model allows us to examine the performance of the energy sources in depth. The parameters that can be considered are the power, capacity, temperature, state of charge and energy efficiency. In the present version, the model exists of two energy sources, but it can be extended to multiple sources and to different hybrid architectures such as parallel hybrid and combined hybrid.
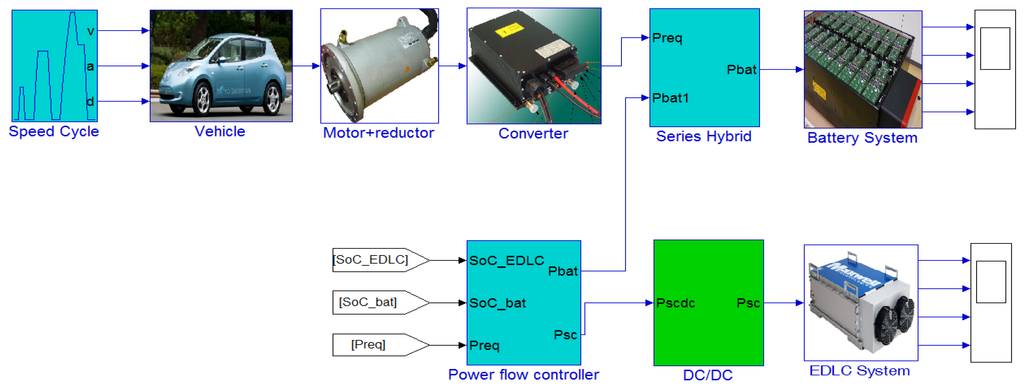
Figure 4.
Main user interface of the developed simulation tool.
3.7.1. Battery Model
In Figure 5 the model represented by FreedomCar [also known as Partnership for a New Generation of Vehicles (PNGV)] is presented []. The model consists of an open circuit voltage (OCV), an ohmic resistance Ro, a polarization resistance (due to the concentration gradient) Rp, a fictive capacitor (1/OCV’) which represents the capacitance that accounts the variation in open circuit voltage with the time integral of the load current Ib and a capacitor C which describes the battery behavior during transient phases. Based on the Kirchoff Voltage law, the voltage of the battery can be calculated when a load is imposed as presented by Equation (3).
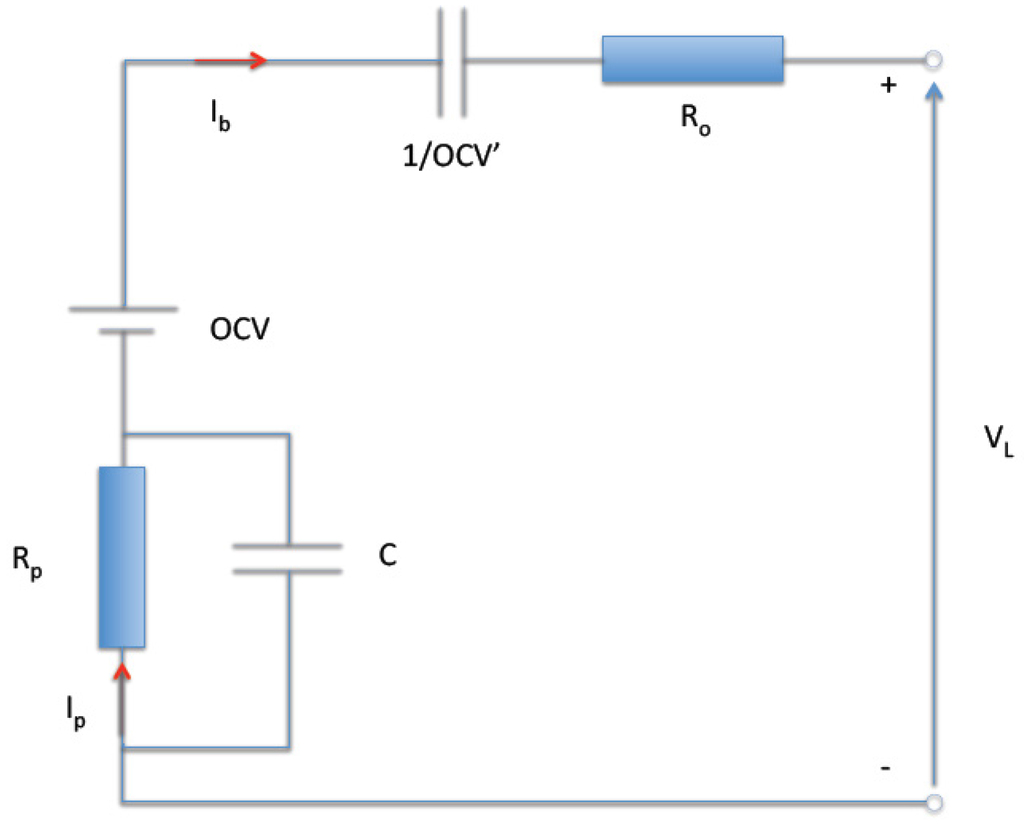
Figure 5.
FreedomCar battery model [].
This equation forms the basis of the FreedomCar battery parameter estimation spreadsheet (see Figure 6) []. The proposed estimation method needs the load current Ib, battery voltage VL and the time vector T. According to these input vectors, the battery model parameters can be estimated. In order to estimate the model parameters, the regular HPPC test (see Figure 7) at every 10% SoC value should be carried out. The HPPC test consists of 10 s discharge and charge pulses at maximum discharge load and 0.75 of the maximum discharge load, respectively. Here it should underlined that the polarization current Ip through the resistance Rp can be obtained based on the differential Equation (4), with an initial condition Ip = 0 at t = 0:
where OCV: Open circuit voltage (V); OCV’: Fictive capacitor (F); Rp: Polarization resistance (Ω); Ro: Ohmic resistance (Ω); C: Polarization capacitor (F); Ip: Polarization resistance (Ω); τ: Time constant (s); Ib: Battery current (A).

Figure 6.
FreedomCar battery parameter estimation spreadsheet [].
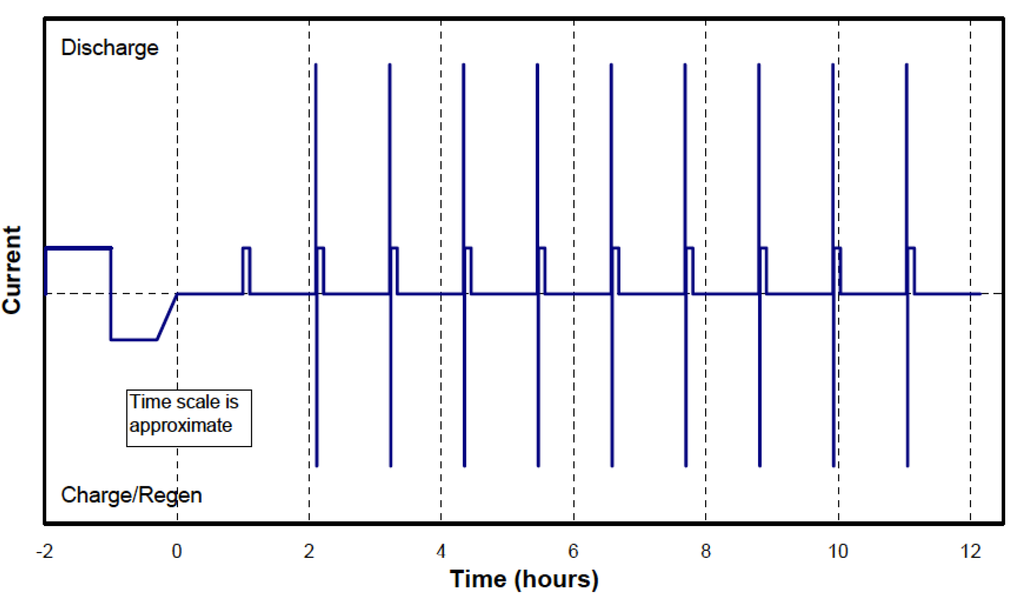
Figure 7.
Hybrid Pulse Power Characterization (HPPC) test [].
3.7.2. EDLC model
As is the case for batteries, prediction of the EDLC behavior can be carried out based on various models. In the literature, a number of electrical models have been proposed. However, each model represents some specific phenomena, which limits its suitability. In [], an EDLC model composed of a capacitor and a resistance has been proposed, similar to the conventional capacitors. Such models are sufficient to represent the ohmic losses in the EDLCs, but do not allow one to predict the EDLC behavior accurately during both transient and steady state conditions.
In [], a promising EDLC model has been developed composed of three RC branches. The first branch represents the EDLC ohmic behavior. The second branch, also called the delayed branch, represents the behavior in terms of minutes. The third branch stands for the long term behavior. Due to the various time constants, the internal charge distribution process can be reflected. However, at low voltages, the error between the simulated and experimental results still seems high (>10%) []. Furthermore, the extraction of the model parameters is much more difficult than the previous one.
In [], an extended version of the first model has been developed. The model exists of an internal resistance REDLC, a constant capacitor Co, a self-discharge resistance Rp,EDLC and finally a capacitor which corresponds to the voltage evolution. This model is the most used in the literature due to its good capabilities and estimation of the model parameters.
However, in the paper, it has not been considered necessary to use the most accurate model, the aim of the study being to investigate the power flow in the drive train and particularly to optimize the power flow between the RESS sources. Therefore, the first EDLC model has been used as presented in Figure 8.
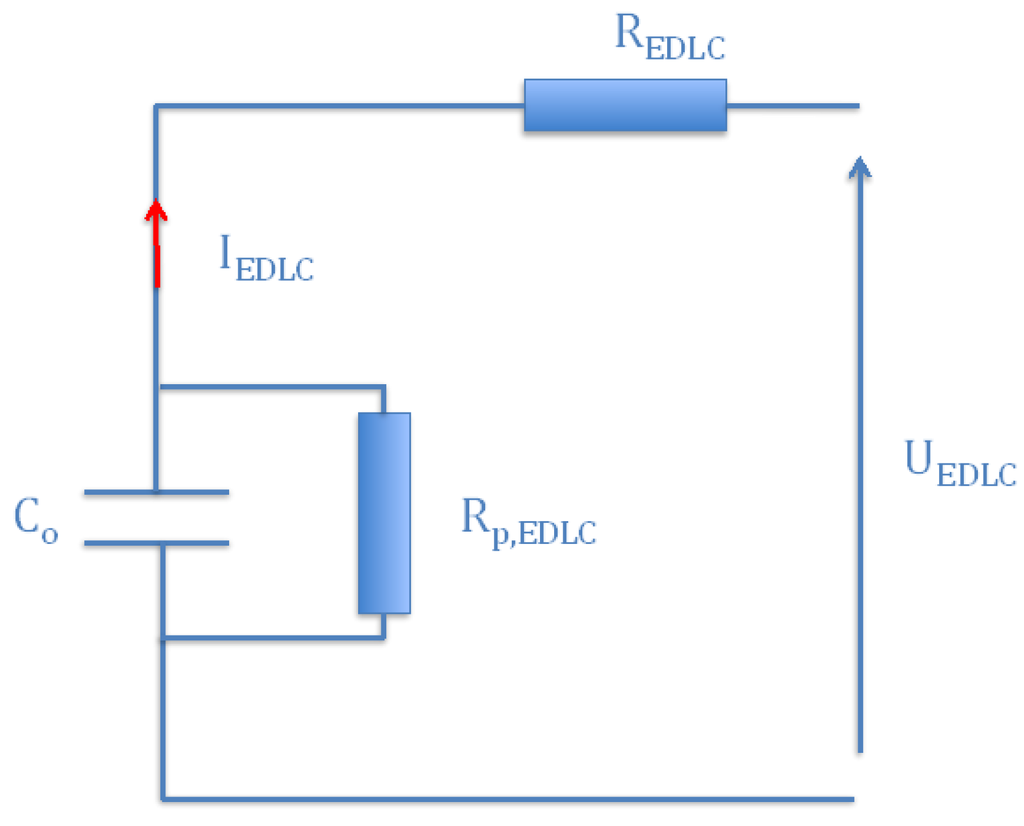
Figure 8.
EDLC model.
3.7.3. Converter, Motor and Reductor Models
In this study, converters, electrical motor and reductor have represented as black boxes with an energy efficiency of 95% for each system, avoiding complicated models []. Regarding the bidirectional DC-DC converter for the EDLC pack, the model assumes the energy efficiency evolution in function of the power, with data derived from the study [] for a 30 kW Interleaved Multi Channel converter. In this article, this type of DC-DC converter has been considered due to its high energy efficiency.
4. Results and Discussion
4.1. Hybrid Rechargeable Energy Storage System Architecture without DC-DC Converter
A typical battery-electric vehicle, the Nissan Leaf, has been considered in the framework of this study; its specifications are listed in Table 1. The Nissan Leaf is fitted out with a nickel manganese cobalt oxide based battery with energy content of 24 kWh and a synchronous motor with a rated power of 80 kW.

Table 1.
Nissan Leaf specifications [].
| Property | Value | Unit |
|---|---|---|
| Vehicle mass (incl. battery) | 1525 | Kg |
| Aerodynamic drag coefficient | 0.29 | - |
| Rolling resistance coefficient | 0.01 | - |
| Front area | 2.27 | m2 |
| Peak power motor (AC) | 80 | kW |
| Battery energy content | 24 | kWh |
Due to the lack of the needed information about the battery cells used, a comparable battery cell has been considered in this study: the pouch battery type LFP from European Batteries (45 Ah and 3.3 V nominal cell voltage).
Since the battery cells in battery-electric vehicles are optimized for energy, their internal resistance is significantly higher than for high power-optimized batteries found in hybrid vehicles such as the Toyota Prius or Nissan Insight.
The considered battery cells have an energy density about 145 Wh/kg and they have a mass of 0.99 kg, as documented in []. The internal resistance of these battery cells is 2.5 mΩ, as presented in Table 2. This value has been derived based on performing the HPPC test as illustrated in Figure 7 at 50% state of charge and at the reference current of 1It. The current It represents the current in amperes, which is defined as the ratio of the measured capacity of the cell in (Ah) and a reference discharge time of 1 h.
Table 2.
Specifications of the battery cells used [].
| Characteristics | Value | Unit |
|---|---|---|
| Cell voltage | 3.3 | V |
| Capacity | 45 | Ah |
| Internal resistance | 2.5 | mΩ |
| Mass | 0.99 | kg |
| Nominal pack voltage | 330 | V |
| Maximum voltage | 365 | V |
| Number cells in series | 100 | - |
In this paper, the battery system has a nominal voltage of 330 V. This means that 100 battery cells are connected in series. Here it should be noted that it is not the objective of this paper to have the same energy content based on the European Batteries cells. The purpose of this study is to investigate the performances of lithium-ion batteries with/without EDLCs in terms of power, energy efficiency, cost, weight and volume. Thus, only the weight of the cells has been taken into account.
4.1.1. Simulation Results
The battery enhancement with pure parallel connection of the EDLCs has been highlighted by many researchers. The possibility of extending the batteries lifespan is often raised as an additional benefit. However, life-cycle tests performed on lead-acid batteries at the Energy Laboratory of Hydro-Québec [] found no appreciably extension in the lifespan of the batteries, possibly because the control strategy was not optimized.
In [], the authors analyzed the use of EDLC in combination with lithium-ion batteries for range extended vehicles. They concluded that EDLCs offer advantages over lithium-ion batteries alone.
Following this research, the authors of [] compared the characteristics of hybrid and stand-alone lithium-ion batteries. They found that a hybrid configuration offers a significant improvement over the stand-alone one in terms of discharge capacity and power capabilities. However, the performed work was only concentrated on low current (4.2 A) batteries, which are useful for portable devices with rather small power demand. The same results also have been confirmed by the references [,,].
In this section, the impact of EDLC on lithium-ion batteries will be investigated based on the passive hybrid architecture as presented in Figure 9, with the battery system directly connected to the EDLC system. In this paper, the EDLC modules BMOD0063 P125 B04/B08 with a rated capacitance of 63 F from Maxwell Boostcap Company have been selected for simulation purposes as presented in Table 3. For simulation objectives, three EDLC modules in series have been used due to the voltage restrictions of the battery system, which has a maximum voltage of 365 V.
Table 3.
The selected Maxwell Boostcap EDLC module BMOD0063 P125 B04/B08 for simulations.
| Characteristics | Value | Unit |
|---|---|---|
| Rated voltage | 125 | V |
| Rated capacitance | 63 | F |
| Internal resistance | 18 | mΩ |
| Mass | 60.5 | kg |
| Volume | 0.108 | m3 |
| Total mass | 181.5 | kg |
| Total volume | 0.32 | m3 |
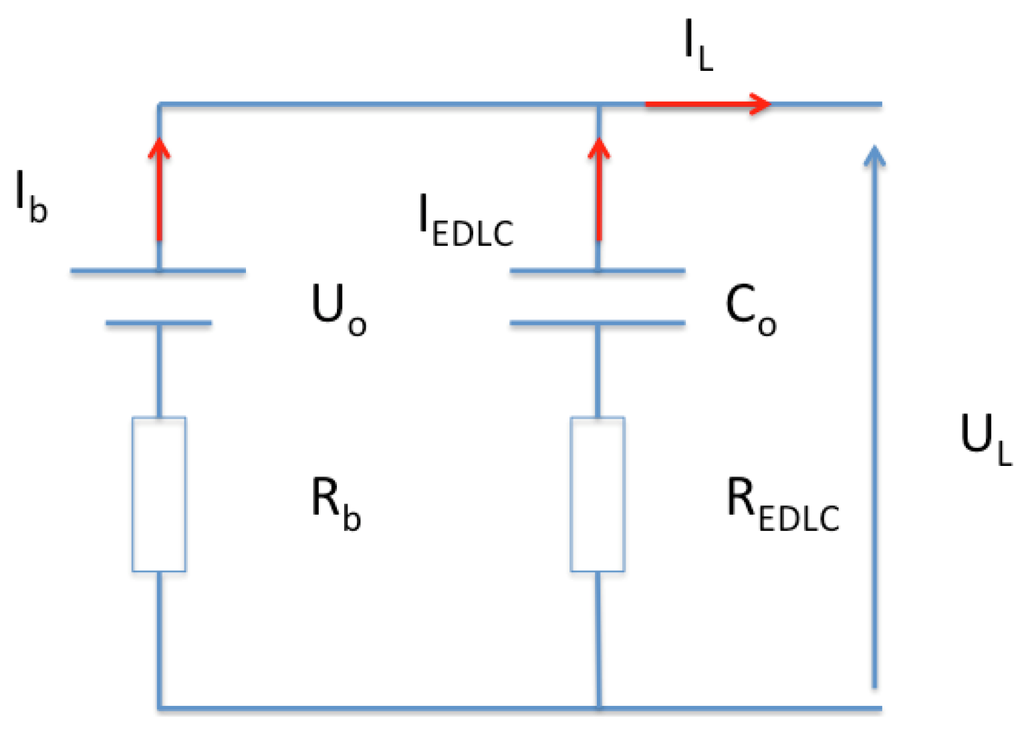
Figure 9.
Passive hybrid topology.
Based on the mathematical analysis of this topology, the EDLC current can be expressed by using Equation (5). Here it should be underlined that the initial EDLC system voltage is equal to the battery system voltage. According to Equation (5), the current distribution will particular be dependent of the internal resistance of both systems and capacitance of the EDLC bank:
where IEDLC: EDLC system current (A); REDLC: Internal resistance of EDLC system (Ω); UEDLC: EDLC system voltage (V); Co: EDLC system capacitance (F); IL: Required current (A); Uo: Initial system voltage (V). In order to assess this hybrid architecture, the Dutch Urban Bus Cycle (DUBC) driving cycle as illustrated in Figure 10 has been employed in the simulation model.
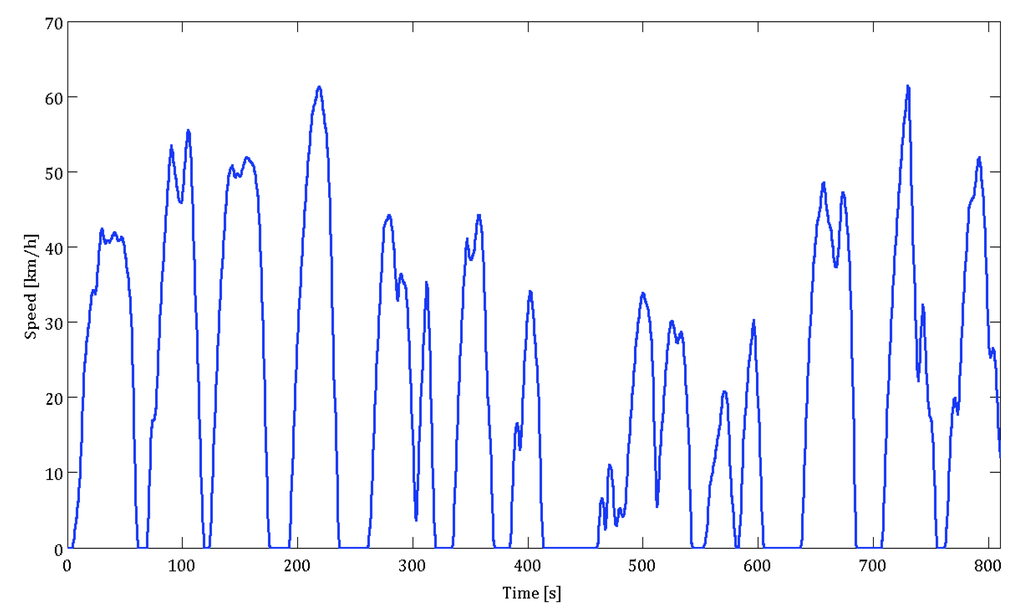
Figure 10.
DUBC speed driving cycle.
In Figure 11, the power evolution of the battery system in the hybrid system, the battery in a stand-alone system and the EDLC system are demonstrated (Figure 12 shows a zoom-out of this same data). As we can observe, the EDLCs are providing the most peak power during short time durations and battery is supplying more or less the average power. Due to this association, the battery stress is reduced. This can be seen in Figure 13 where the battery voltage evolution of both systems is plotted out. The voltage drops based on the hybrid architecture are less pronounced (340–321V) than the battery stand-alone system (363–316V). This means that the power capabilities of the battery in the hybrid system during charging and discharging are enhanced compared with the stand–alone system.
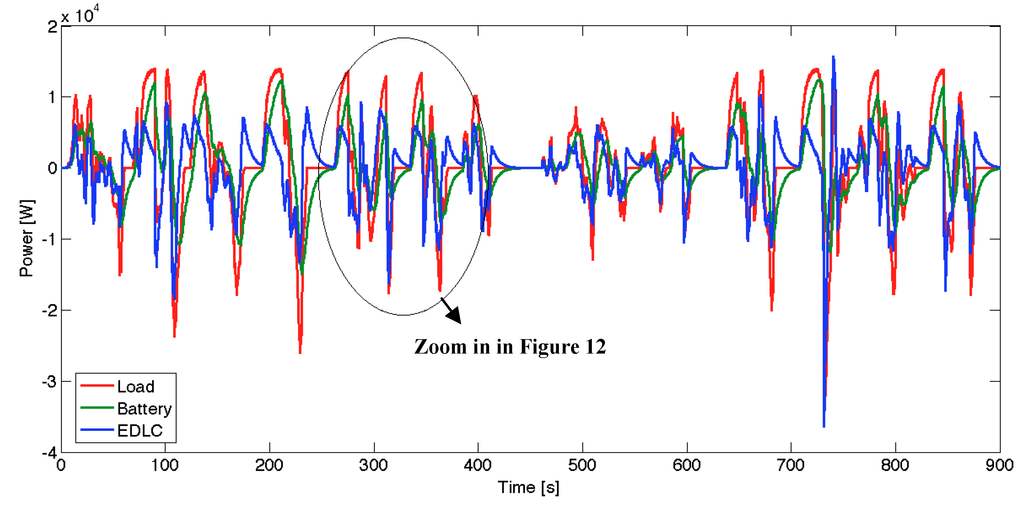
Figure 11.
Power evolution of the passive hybrid topology and the stand-alone battery system.
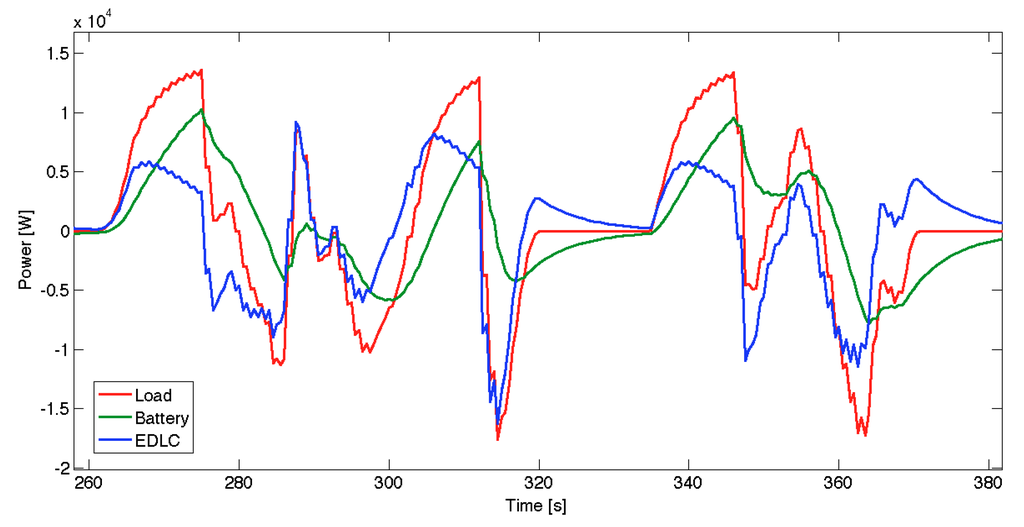
Figure 12.
Zoom in of Figure 11.
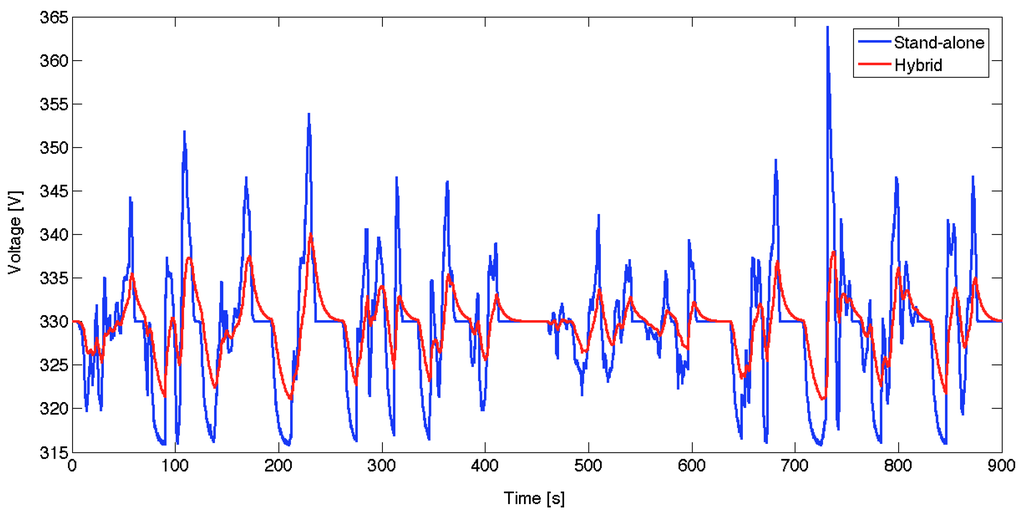
Figure 13.
Comparison of the voltage drop of the battery in both systems.
Moreover, due to the smaller voltage drops and power provided by the battery, the energy efficiency of the battery system in the hybrid system is more beneficial than the stand-alone battery, as we can observe in Figure 14. The energy efficiency of the battery is 91.3% and 84.3% in the hybrid and the stand-alone systems, respectively. The energy efficiency has been determined by using the following Equation (6):
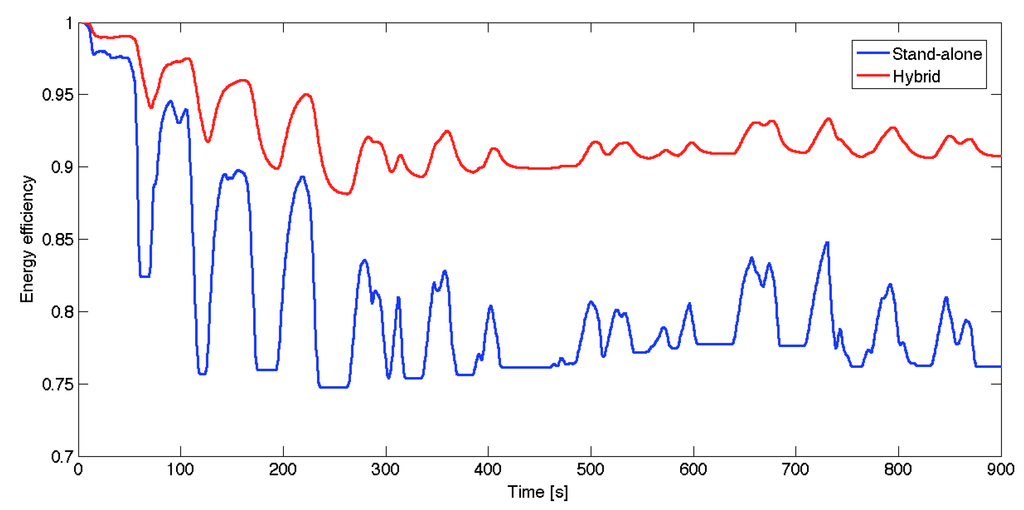
Figure 14.
Comparison of the energy efficiency of the battery in both systems.
Based on the current flow through the battery, the temperature of each topology has been calculated. The temperature evolution has been calculated based on the Equation (7). The specific heat capacity for the used battery type is 950 J/kg·K []:
where Ploss: Heat generation (W); m: Mass of the battery cell (kg); Cp: Specific heat capacity (J/kg·K); Ts: Surface temperature (°C); Ta: Ambient temperature (°C).
According to Equation (7), the temperature increase inside the battery in the stand-alone system is 36.8 °C, compared to 30.4 °C in the passive system.
In BEVs, the driving range can be considered as one of the key limitations of the vehicle. Table 4 compares different speed driving cycles according to the simulation results. As we observe, the EDLCs allow extending the driving range of the vehicle. The extension based on the New European Driving Cycle (NEDC) and the old European Driving Cycle (ECE 15) driving cycles is 5% and 4%, respectively. However, the range for DUBC driving cycle is more pronounced (7%). The latter result is due to the efficient recuperation of the regenerative braking energy. One should note that the DUBC has a more dynamic character than the two European cycles. Moreover, in Table 4, one recognizes the higher battery energy efficiency in the hybrid system compared against the stand-alone architecture. The higher efficiency indicates that the temperature increase inside the battery will be smaller. This will have a positive impact on the battery lifetime.
Table 4.
Comparison of hybrid topology against a stand-alone system at different driving speed cycles.
| Driving speed cycle | Range extension due to hybridization (%) | Energy | Efficiency (%) |
|---|---|---|---|
| - | - | Hybrid | Stand-alone |
| NEDC | 5 | 94.1 | 89.5 |
| DUBC | 7 | 91.3 | 84.3 |
| ECE 15 | 4 | 91.9 | 86.5 |
4.2. Hybrid Rechargeable Energy Storage System Architecture with DC-DC Converter
4.2.1. Model
In the previous Section 4.1, the characteristics of the passive hybrid system have been analysed and discussed. From this study, we have concluded that the passive topology has some drawbacks due to the fact that the EDLC voltage variation is limited since it is pegged to the battery voltage. In order to use the energy content in the EDLC bank as optimally as possible, the voltage should be changed between Umax and Umax/2, whereby 75% of the energy content can be used. Thus, a bidirectional DC-DC converter will be used between EDLC system and DC-bus, leading to an active hybrid topology. Therefore the simulation model in Matlab Simulink as presented in Figure 4 has been used.
4.2.2. Control Strategies
The association of a peak power unit (EDLCs and a bidirectional DC-DC converter) with a battery system requires a dedicated control strategy for sharing the energy between the sources in an optimal way. Many strategies have been proposed and analysed in the research community [,,,]. In [], the author defined an optimization strategy where the main power source (the battery) provides a specified power during a specific time schedule. This strategy has the advantage that the provided power from the battery can increase linearly, and the EDLC system can deal with the demand for the peak power. Following this work, the authors of [] proposed a power strategy to recuperate the energy as much as possible into the EDLC. The strategy uses the required power, state of charge of the EDLC and the speed of the vehicle as the main control parameters. However, such control leads to oversizing of the EDLC bank, because all the recuperated energy should be captured by the EDLCs. In [], a research paper emanating from VUB-MOBI, a new power flow controller has been developed based on the “moving average power control”.
The proposed control strategy allows the main power system only to supply the moving average power, while the EDLCs are designed to absorb and provide the power peaks during acceleration and regenerative braking. Furthermore, this control strategy also allows reducing the battery stress, which leads to an extended cycle life.
In the framework of this study, this control strategy of the “moving average” has been implemented to study the power flow in the drivetrain of the vehicle and especially to optimize the power sharing between the several RESS.
According to the required power on the DC-bus, the moving average power Pmoving is defined as in Equation (8):
The peak power supplied by EDLCs can be defined as in Equation (9):
where Pmoving: Moving average power (W); Preq Required power (W); PEDLC: EDLC system power (W); τ: Time constant of the power provided by the battery system (s).
4.2.3. EDLC Package Sizing
The sizing of the EDLC system can be considered as one of the key issues in the design of the hybrid system. The energy storage system should be sized to have good energy and power performance, with the EDLC system intended to meet peak power requirements at any time. According to [], the sizing of an EDLC system depends on many parameters, such as power requirements, voltage limits and required stored energy. However, in [] it is indicated that the sizing of the EDLC system is also strongly dependent on the control strategy that is used. In this paper, a sizing methodology is proposed that can be used for recovering and releasing energy during very short time periods.
The calculation of the required size of the EDLC system can be obtained by considering the vehicle dynamics:
where Ftot: Propulsion force on the vehicle (N); mveh: Vehicle weight (kg); aveh: Acceleration of the vehicle (m/s2);
Ftot is the total force on the vehicle:
where Ftot: Propulsion force on the vehicle (N); FR: Rolling resistance force (N); FW: Aerodynamic drag force (N); FS: Slope resistance force (N);
With:
where g: Gravity constant (9.8 m/s2); CR: Coefficient of the rolling resistance; cos α: Slope;
where vveh: Velocity of the vehicle (m/s); CX: Aerodynamic drag coefficient of the vehicle; S: Frontal area of the vehicle (m2):
The total recuperated energy in the EDLC system (expressed in J) can be extracted as follows:
To obtain the energy available for the EDLC, this energy should be multiplied by the energy efficiencies of the various driveline components as illustrated in Figure 4.
In order to calculate the required number of EDLC cells, the (application related) maximum EDLC system voltage must be specified. From Equation (1), we know that the minimum EDLC voltage is Umax/2. Therefore, the total EDLC capacitance Ctot,EDLC (expressed in F) of the EDLC bank can be determined:
According to the maximum voltage Umax the number of cells can be extracted from the following Equation (17):
where Umax: Maximum EDLC system voltage (V); Urated,cell: Maximum EDLC cell voltage (V); Nseries: Number of cells in series.
Furthermore, in the case of identical cell capacitance Ccell, the required cell capacity Ccell is defined by the relationship:
where Nparallel: Number of stacks in parallel; Ccell: EDLC cell capacitance (F).
Figure 15 shows if the required current exceeds the specified EDLC cell; the methodology should be repeated using another EDLC cell.
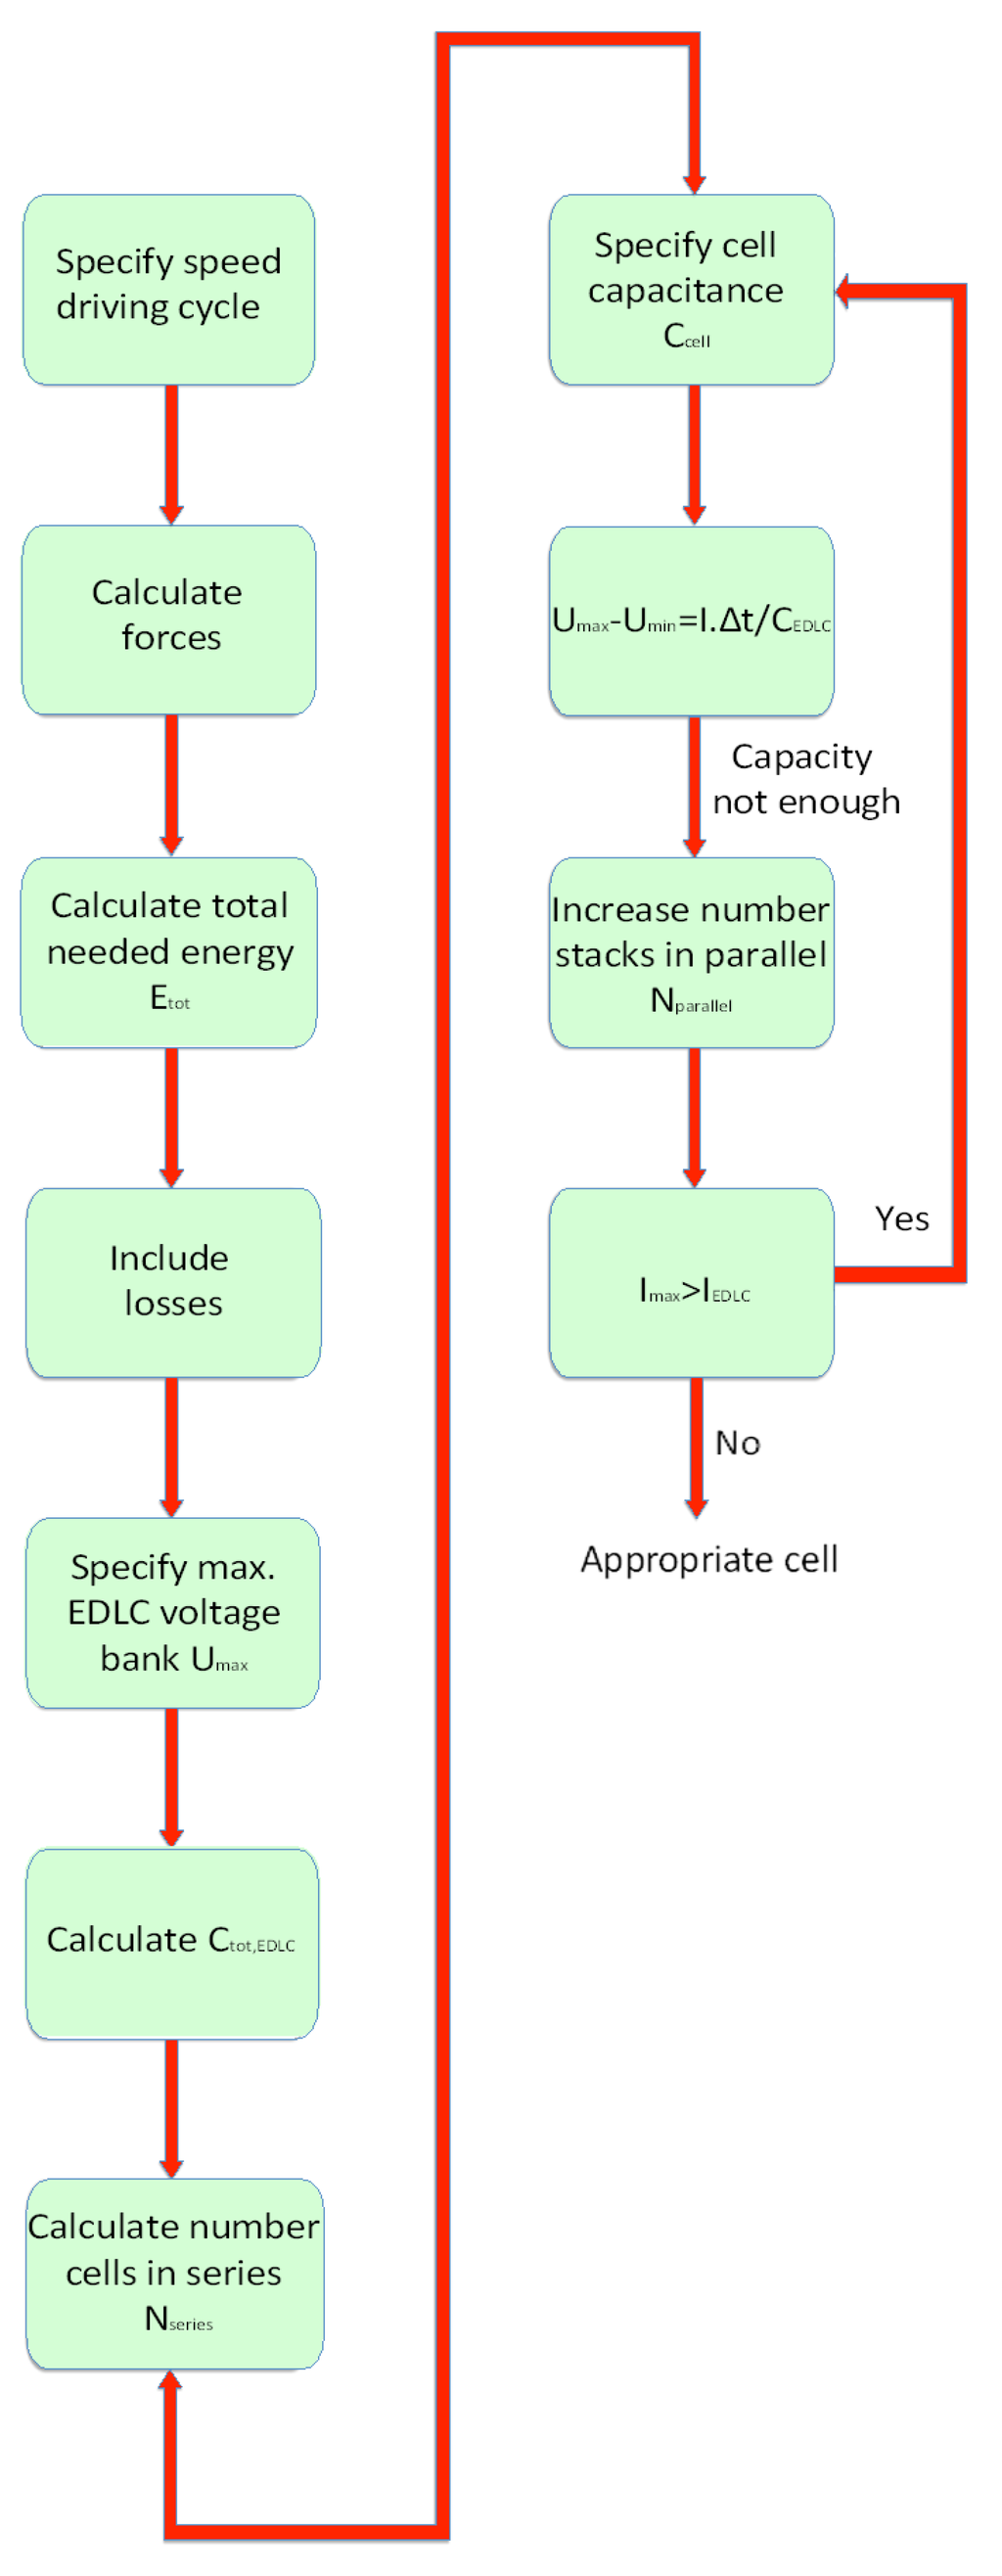
Figure 15.
EDLC system sizing methodology.
4.2.4. Simulation Results
In Figure 16, Figure 17 and Figure 18, the simulation results of the active hybrid system are demonstrated. In Figure 16 it is noticeable that recuperated energy can be stored in the peak power unit, to be used during acceleration events of the vehicle. Hereby, the battery should only serve to supply mean average power.
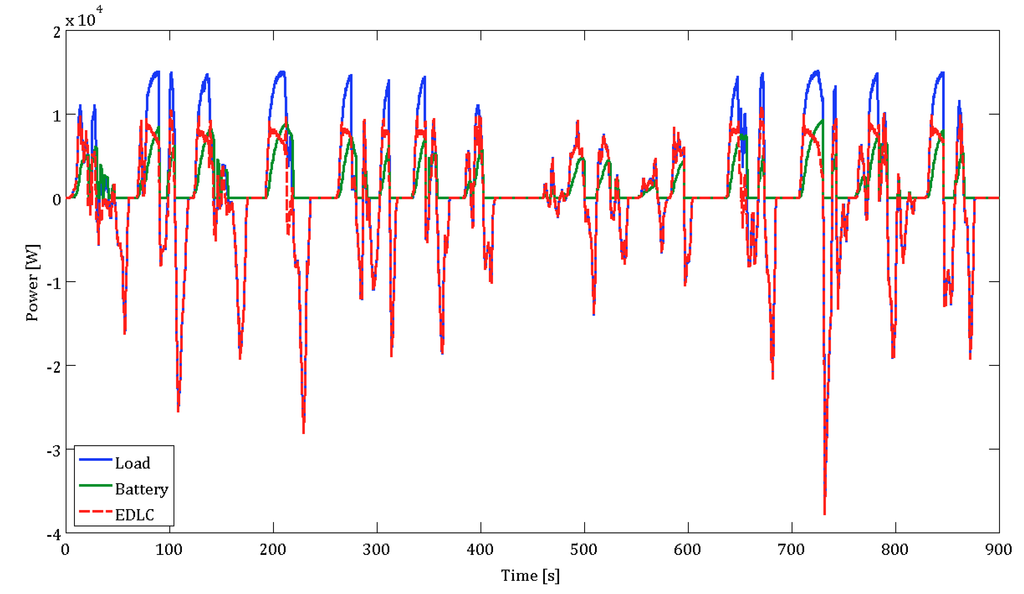
Figure 16.
Power comparison based on the active hybrid topology and battery stand-alone system.
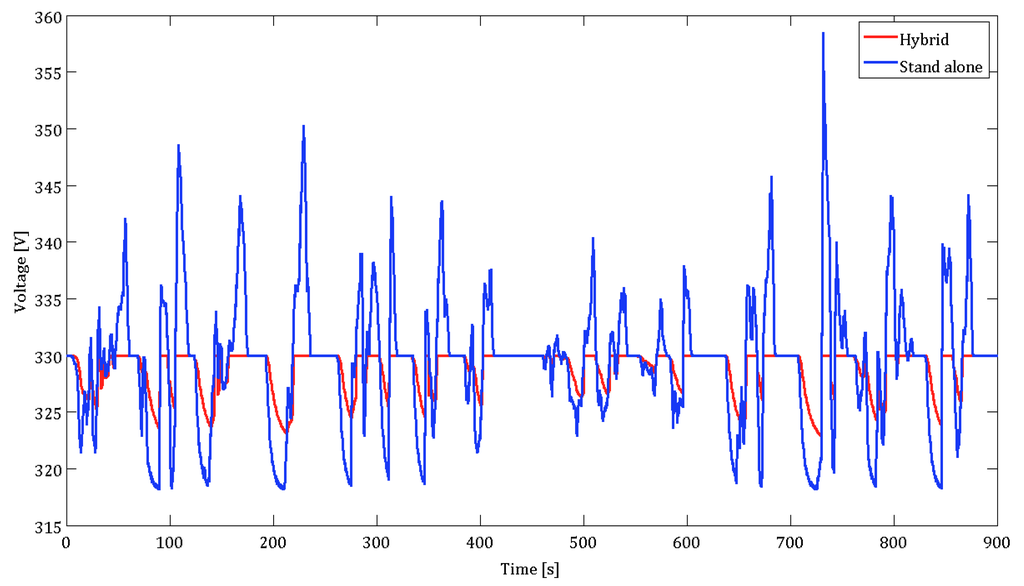
Figure 17.
Voltage comparison based on the active hybrid topology and battery stand-alone system.
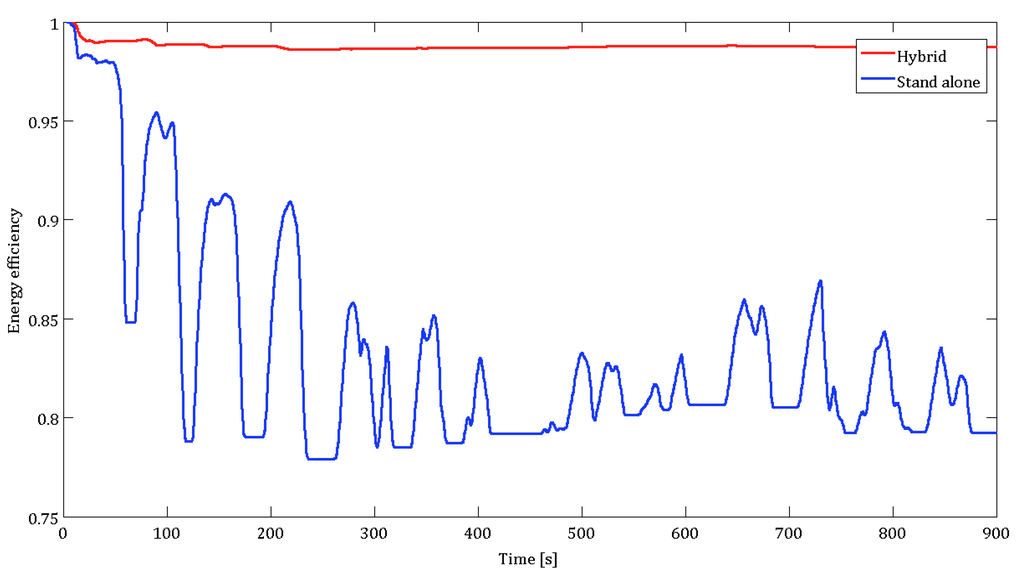
Figure 18.
Comparison of the energy efficiency based on the active hybrid topology and stand-alone battery system.
Therefore, the battery stress can be reduced and the cycle life can be enhanced. From the point of view of the voltage evolution (see Figure 17), the battery voltage drop in the active hybrid system seems very small compared to the stand-alone system. In the hybrid, the battery voltage varies between 300 V–323 V and 358 V–318 V for active hybrid and stand-alone systems, respectively. This characteristic will not only improve the battery performances but also the vehicle drivetrain.
In Figure 18 the impact of the active hybrid system on the battery energy efficiency is illustrated. Here, we observe the beneficial use of a bidirectional DC-DC converter with EDLC system. The energy efficiency is about 98% against 91%, for the passive hybrid and 84.3% for the stand-alone systems. Thus, the temperature increase inside the battery is about 28 °C.
It is generally known that the driveline efficiency improves when the voltage on the DC-bus is less or more stable as it is demonstrated in Figure 19 [,]. At low DC-bus voltage, the current through the DC-bus will increase and the losses in the converter of the electric motor will increase quadratically. Furthermore, operation of the electric motor is improved by stabilizing its operating voltage window. This issue can be achieved by the active hybrid system rather than the passive hybrid and stand-alone systems.
The improvement of the active hybrid system against the passive one in terms of driving range extension seems less beneficial however. According to the simulation results (see Table 5), the extension varies between 7%, 8% and 6% for the NEDC, DUBC and ECE 15 driving cycles, respectively. These results have also been confirmed by the authors of the reference [] who performed simulations for the Th!nk electric vehicle.
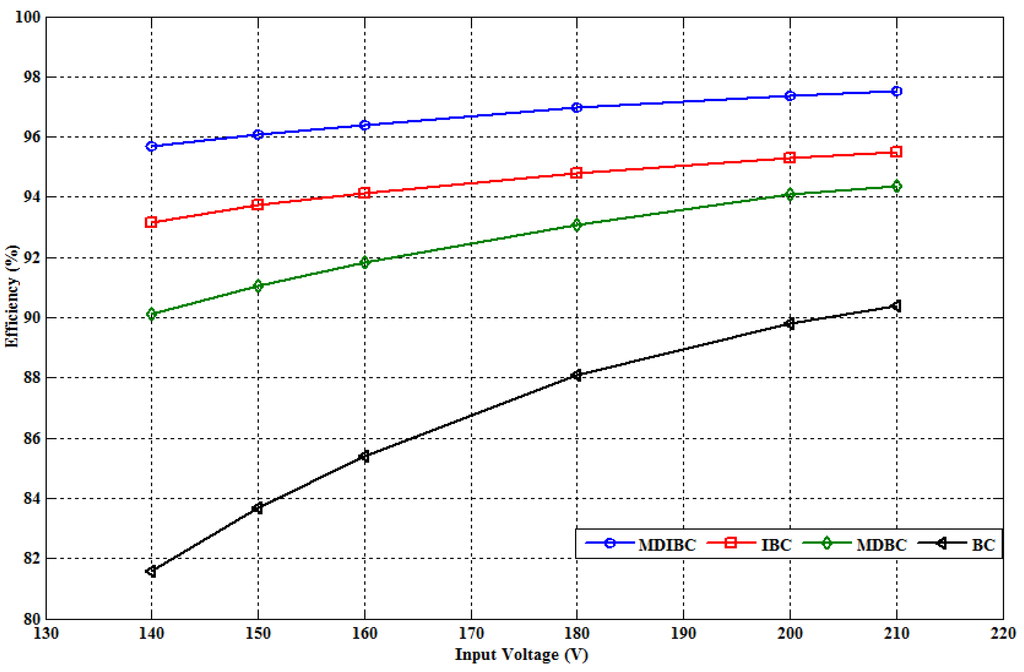
Figure 19.
Energy efficiency evolution as function of the input voltage [,]. (BC: Boost Converter, IBC: Interleaved Boost Converter, MDBC: Multi Device Boost Converter, MDIBC: Multi Device Interleaved Boost Converter.)
Table 5.
Comparison of hybrid topology against stand-alone system at different driving speed cycles.
| Driving cycle | Range extension due to hybridization (%) |
|---|---|
| NEDC | 7 |
| DUBC | 8 |
| ECE 15 | 6 |
4.3. Rechargeable Hybrid Energy Storage Systems Assessment
4.3.1. Cost
In the previous sections, the technical assessment of lithium-ion battery and hybrid architecture has been analysed and compared. However, in order to complete the analysis the cost issue should be taken into consideration. It is generally known that the use of a peak power unit existing of an EDLC system and a bidirectional DC-DC converter is costly. The use of EDLC in electric vehicles can only be viable when the added value in term of cost is advantageous against the stand-alone system. As reported in [], the cost of present lithium-ion batteries varies from 300 up to 1000 €/kWh, depending on the battery chemistry. It should be noted that these prices are based on cell level. In [,], some prognoses indicate that the lithium-ion battery cost decrease will be limited against the EDLC. In the last 10 years, the EDLC price has declined about 90% (see Figure 20) compared to 10% for lithium-ion batteries.
The cost of the bidirectional DC-DC converter (30 kW) for vehicular applications is still high. The price varies between € 2,000–3,000 []. The cost of a complete peak power unit (three modules of 125 V with cells of 1,500 F) thus exceeds € 8,000 (including BMS, packaging, cooling) [].
The battery pack cost price for BEVs with energy content of 24 kWh is about € 10,000–12,000 []. This means that a hybrid system equipped with peak power unit could only be interesting when the extension of the battery lifetime is more than a factor 2. Here, it should be taken into account that the hybrid architecture meets some important challenges such as complexity, safety and volume, which are not included in the analysis.
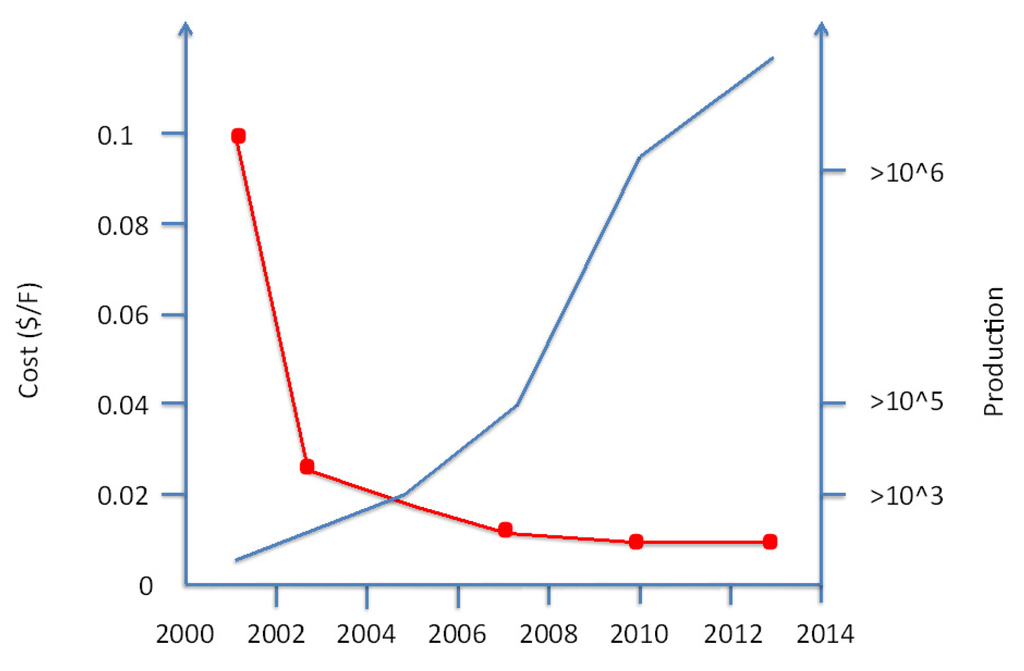
Figure 20.
EDLC price evolution adapted with Maxwell prices.
4.3.2. DC-DC Converter
As we have observed in Section 4.2.4 the power performance of the hybrid energy storage system (HESS) can be enhanced by using a bidirectional DC-DC converter. Due to the bidirectional energy flow through EDLC system, the converter should have a high-energy efficiency. In the literature, a number of bidirectional DC-DC converters have been proposed and investigated [,]. According to [], the most interesting topologies for vehicular applications are the Full-Bridge and Interleaved Multi Channel converters. Particularly, the latter one can achieve 95% energy efficiency at maximum rated power when three channels are in use []. In [], the authors proposed an emerging topology called the “series resonant converter”. However, these topologies are still in a development stage and their relevance in vehicles still should be verified. Moreover, these converters will be higher in price compared to commercial available buck-boost converters.
4.4. Novel Hybrid Topology
In the previous Section 4.1 and Section 4.2, the properties of passive and active hybrid systems have been analyzed and compared. From the point of view of the cost, weight and volume, these two hybrid topologies are still less beneficial for use in BEVs. Particularly the volume aspect seems the main barrier. In order to enhance the performance of the high-energy optimized battery in BEVs, the advantages of passive and active systems can be combined. Compared to active architecture, the combination of battery and EDLC packs requires a well optimized balancing system between the cells within the stack as well as a system for the energy flow from one stack to another by using a bidirectional DC-DC converter, which leads to a very expensive and heavy solution. The passive system seems less expensive than the active topology due to the direct parallel connection. However, the performances of this system are less beneficial compared to the active hybrid one. Moreover, the volume of the system is still an obstacle. In order to reduce the cost, volume and complexity of the system as much as possible, the both hybrid approaches can be combined as presented in Figure 21.
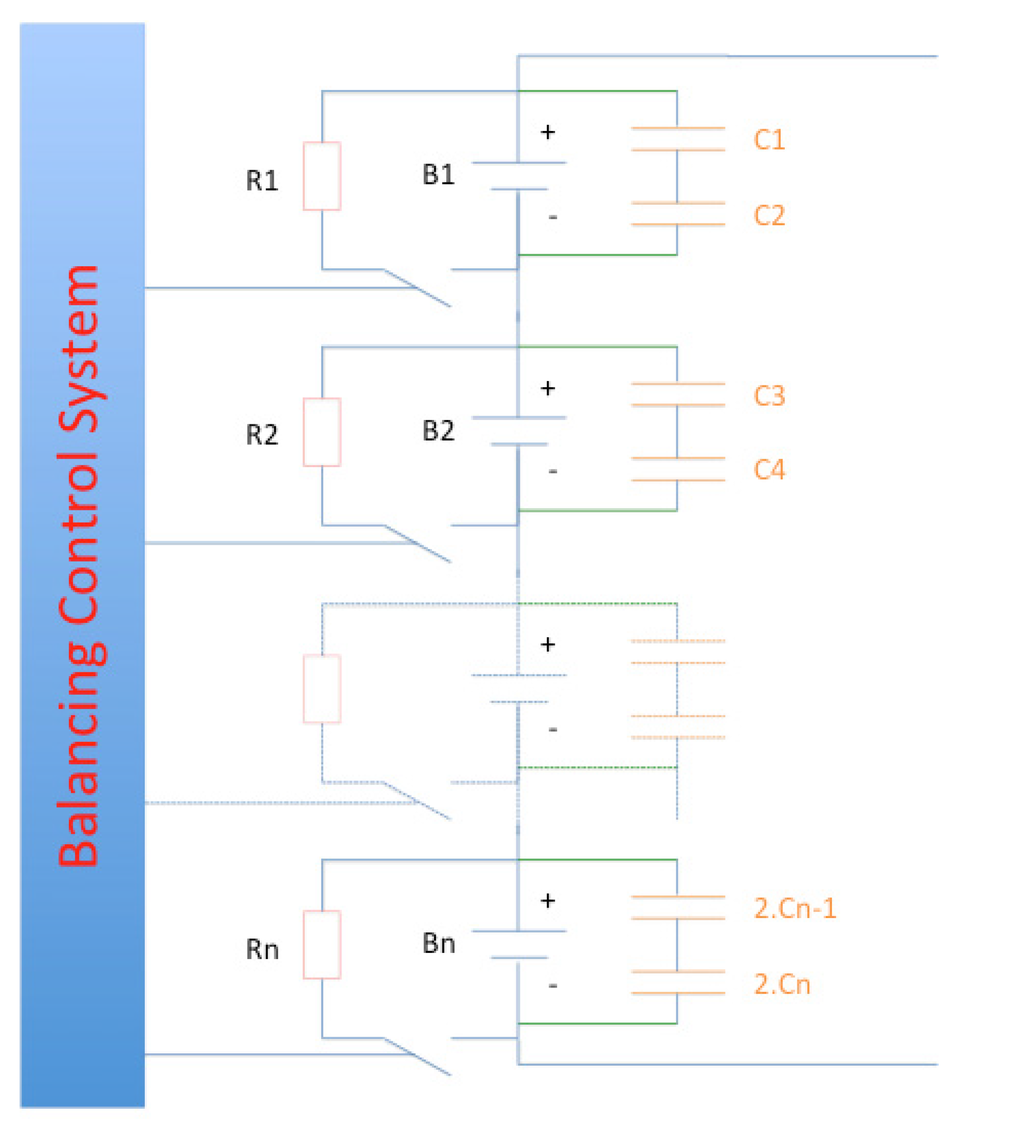
Figure 21.
New hybrid topology.
As we can observe, two EDLC cells connected in series are directly connected in parallel to each battery cell. Due to this parallel connection, there will be continuous auto-balancing between both cells, obviating the need for a balancing system for the EDLC pack. In addition, this new developed topology allows us to integrate the EDLC cells in the same battery housing, which will result in reduced volume and weight, and necessitating the balancing only to be performed at the battery cell level. However it is still necessary to connect two EDLC cells to each lithium-ion battery cell due to the lower EDLC cell voltage (2.7 V) compared to 3.65 V maximum for the considered battery cell as presented in Section 4.1.
4.4.1. Simulation Results
Similarly to the previous topologies, a number of simulation results are presented below for illustrating the performances of this new hybrid topology. As we observe in Figure 22, the battery voltage drops are comparable to the passive hybrid architecture as presented in Figure 13. Thus, from this point of view there is not much improvement, due to the internal resistance value of the selected EDLCs. The EDLC cells used in the passive/active topologies have an internal resistance of about 0.29 mΩ while the resistance of the EDLC cells in the new topology is about 0.8 mΩ [] as can be seen in Table 6. However, the capacitance of the latter one is a factor 4.6 smaller. This will reduce the cost of the system significantly.
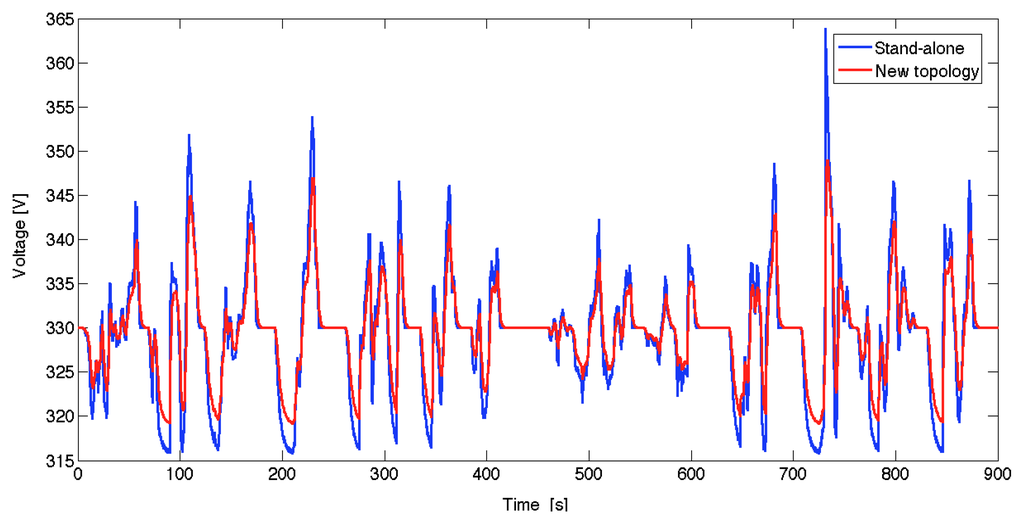
Figure 22.
Voltage comparison based on the novel proposed hybrid topology and the stand-alone battery system.
From the point of view of the energy efficiency, the mean value is about 87% (see Figure 23) compared to 84.3% for the stand-alone system as can be seen in Table 7. This results to the fact that the temperature increase in the battery will be around 33 °C. The range improvement for the new topology is more pronounced than the passive and active hybrid systems.
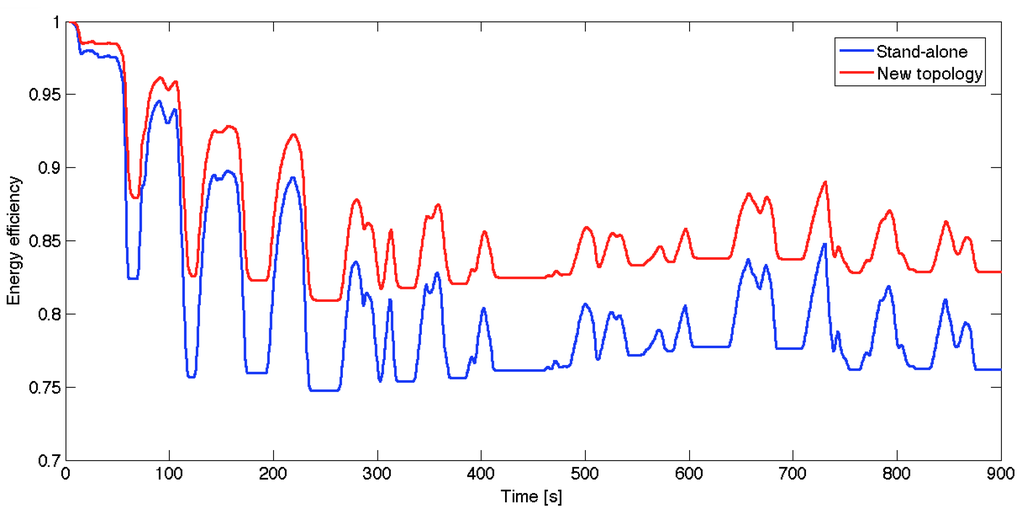
Figure 23.
Energy efficiency comparison based on the novel proposed hybrid topology and stand-alone battery system.
As illustrated in Table 7, the range extension varies between 9% and 12%. These values are slightly bigger than what we observed for the previous topologies. The main reason of the range extension is due to the higher EDLC capacity for each connected battery cell. Then, the weight of the system is significantly lower than the other two hybrid architectures where the mass of the housing, cooling, balancing circuit should be taken into account. Here, it should be noted that in reality the obtained range extension values for the passive and active systems will be smaller due to the energy that the EDLCs consume for balancing and cooling systems needed during the operation of the peak power unit.
Table 6.
Characteristics of the used Maxwell BCAP0650 EDLCs [].
| Characteristics | Value | Unit |
|---|---|---|
| Rated cell voltage | 2.7 | V |
| Rated cell capacitance | 650 | F |
| Internal resistance | 0.8 | mΩ |
| Mass cell | 0.16 | kg |
| Volume | 0.00018 | m3 |
| Number used cells | 200 | - |
| Total mass | 32 | kg |
| Total volume | 0.036 | m3 |
Table 7.
Comparison of hybrid topology against battery stand-alone system at different speed driving speed cycles.
| Driving speed cycle | Range extension due to hybridization (%) | Energy | Efficiency (%) |
|---|---|---|---|
| - | - | Hybrid | Stand-alone |
| NEDC | 10 | 92 | 89.5 |
| DUBC | 12 | 88 | 84.3 |
| ECE 15 | 9.5 | 90 | 86.5 |
4.4.2. Experimental Results
4.4.2.1. Capacity Improvement
In order to confirm the above simulation results, a series of experimental tests have been performed for comparing and studying lithium-ion batteries with EDLCs under realistic load profiles corresponding with the use in a hybrid electric vehicle. In the framework of this study, the same lithium-ion battery cells have been used as presented in Section 4.1.
In Figure 24, the experimental results are presented whereby three identical lithium-ion battery cells have been submitted repeatedly to the same load profile as presented in Figure 25. The blue line represents the battery stand-alone system, whereby the green and red lines stand for the hybrid system with two cells in series with rated capacitance 450 F and 3,000 F (giving a series capacitance of 225 or 1,500 F), respectively (see Table 8). These values were selected to investigate the impact of the EDLC capacitance on the battery behavior.
Table 8.
Used EDLC cells.
| Cell | Rated voltage (V) | Rated capacitance (F) | Internal resistance (mΩ) |
|---|---|---|---|
| NESSCAP | 2.7 | 3000 | 0.29 |
| Maxwell | 2.7 | 450 | 2.4 |
Figure 24 indicates that the discharge capacity of the hybrid architecture is significantly higher than that of the stand-alone system. The capacity increase is 11% and 13% for the 225 F and 1,500 F EDLC packs, respectively. From this analysis, we can conclude that the range of an electric vehicle can be improved by using EDLCs. This evolution has also been observed by the authors of []. The capacity increase is more evident at higher current rates than at low current rates. This study was performed at elevated working temperature (55 °C). In [] it is reported that the capacity increase of a passive hybrid system is 30% compared to a stand-alone battery system.
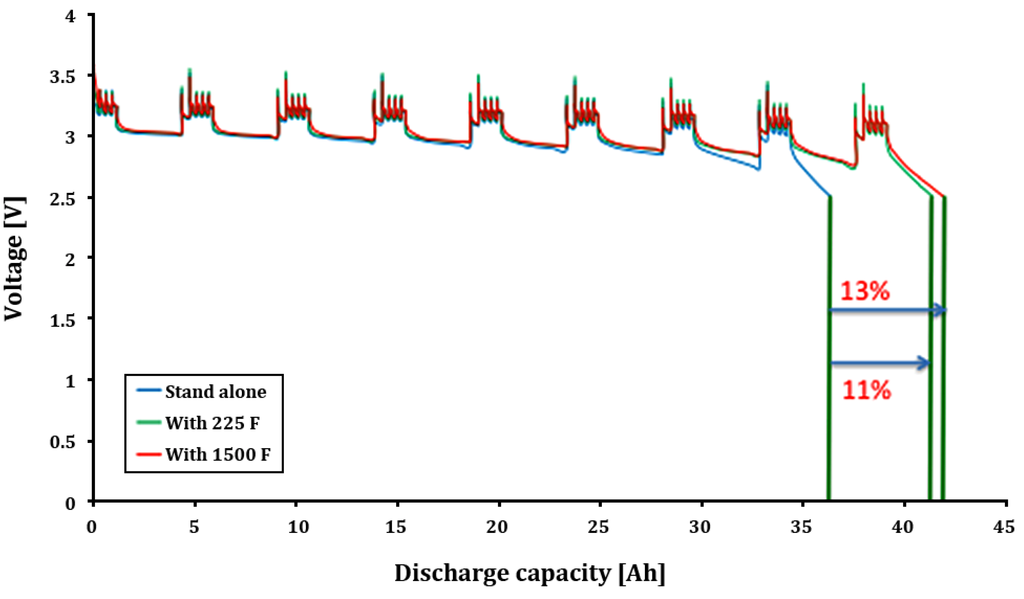
Figure 24.
Voltage versus capacity for different EDLCs at room temperature.
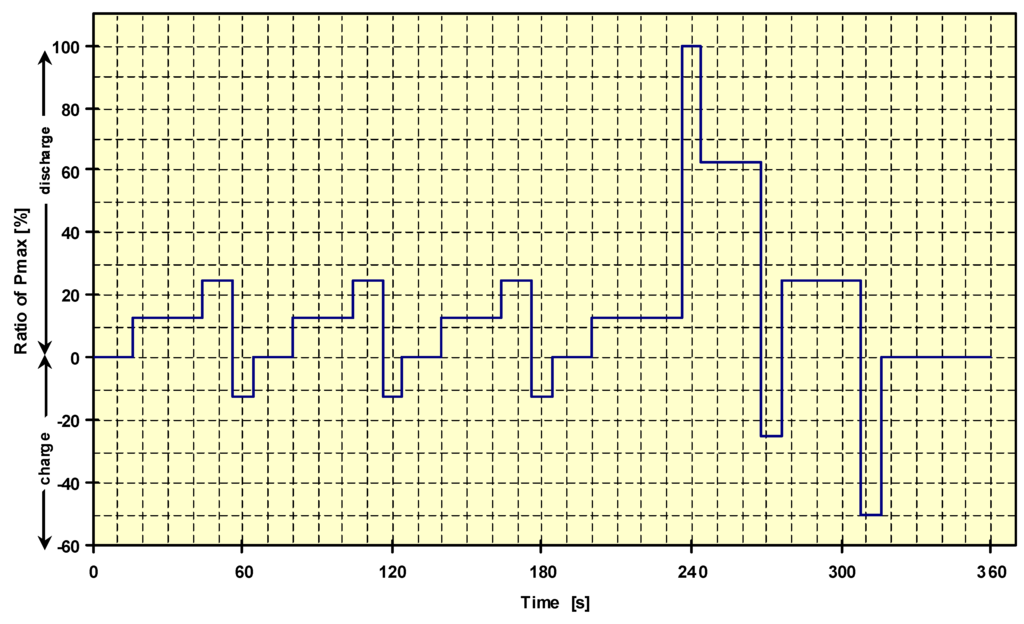
Figure 25.
Used load profile.
The efficiency is 73%, 79% and 83% for the stand-alone, 225 F and 1,500 F EDLC packs, respectively. The lower energy efficiency in the case of the stand-alone is due to the higher internal resistance of the battery cell. The higher resistance results to higher voltage drops and smaller discharge capacity, whereas in the hybrid architecture, the short duration pulses can be supplied by EDLCs. The voltage drop for such systems is smaller as we observe in Figure 24. Due to these characteristics, the battery surface temperature increase is 35 °C for the stand-alone system, 29 °C and 25 °C for the 225 F and 1500 F hybrid systems, respectively.
4.4.2.2. Duty Cycle
In BEVs, the RESS undergoes continuously varying current rates over a wide depth of discharge windows. This increases the battery stress and decreases the lifetime. Furthermore under real driving cycles, the battery is subjected to various duty cycle ratios. During acceleration and regenerative braking, the battery should be able to deliver a high amount of energy in a short time. In order to investigate the impact of the duty cycle ratio on the battery performances, a number of capacity tests have been carried out at 25%, 50%, 75% and 90% duty cycle ratio. The duty cycle ratio (γ) is defined as follows:
where γ: Duty ratio; ton: Pulse duration (s); toff : Rest time (s); The toff is fixed at 2 seconds, while the time ton is changeable. In this study, a current value of 100A has been imposed as presented in Figure 26.
As one can observe in Table 9, the capacity increase due to the passive hybrid system varies between 0.5%–8% and 1%–12% for EDLC pack 225 F and 1,500 F, respectively. Thus, it is noticeable that the EDLC can improve the battery capabilities at lower duty ratio cycles. These results confirm that EDLCs are very powerful to assist the battery during short time pulses.
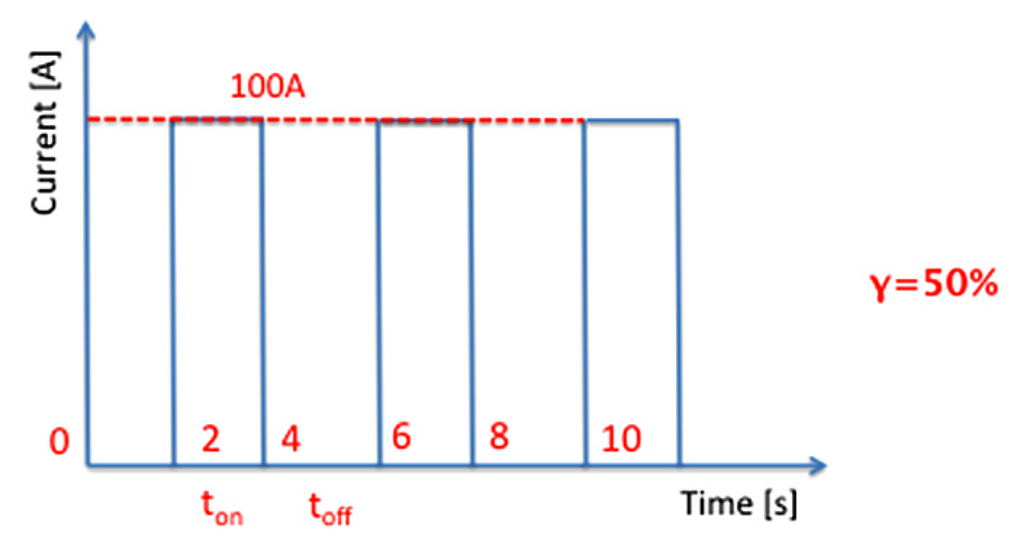
Figure 26.
Representation of duty ratio cycle.
Table 9.
Capacity evolution at different duty cycle ratio at room temperature.
| Duty ratio (%) | Capacity improvement with 225 F bank (%) | Capacity improvement with 1500 F bank (%) |
|---|---|---|
| 25 | 8 | 12 |
| 50 | 6 | 8 |
| 75 | 5 | 7 |
| 90 | 0.5 | 1 |
The main reason for the improvement of the capacity is due to the lower internal resistance of the EDLCs compared to that of the battery. According to the mathematical analysis, during short pulses, the EDLCs is dealing with a major part of the load current IL:
The battery current Ib increases exponentially during discharging as presented in Figure 27. Here it should be noted that the contribution of EDLC current Ic will be much higher when the pulse, in other words, when ton is shorter. Therefore, the battery capacity and capabilities are enhanced as observed above.
In order to complete the analysis, the same test as specified above is repeated at 50 A for γ = 50% duty ratio cycle. This test was used to calculate the well-known Peukert constant k. This constant compares the rate capabilities of RESS. From the analysis, we have observed that the Peukert constant for a 1500 F EDLC package is 1.01 against 1.04 for the battery without EDLCs.
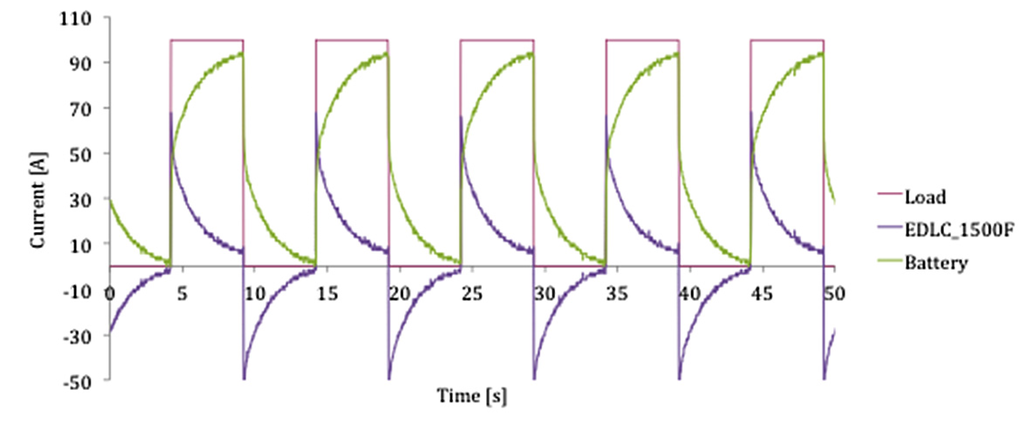
Figure 27.
Current evolution of the EDLCs and the battery currents at room temperature.
4.4.2.3. Power Improvement
The above performed experimental investigation has been extended to a power test whereby both systems have been exposed to the extended HPPC test as described in Section 3.7.1.
As we observe in Figure 28, the hybrid system has higher power capabilities compared to the battery stand-alone system. The power of the hybrid system is about 740 W–680 W compared to 540–223 W for the stand-alone battery in the state of charge window 90%–10%. At 50% SoC, the power improvement is 37%. In Figure 28 it is noticeable that the power capabilities of the hybrid system vary very slightly in function of state of charge. In addition, the same characteristic is feasible during charge.
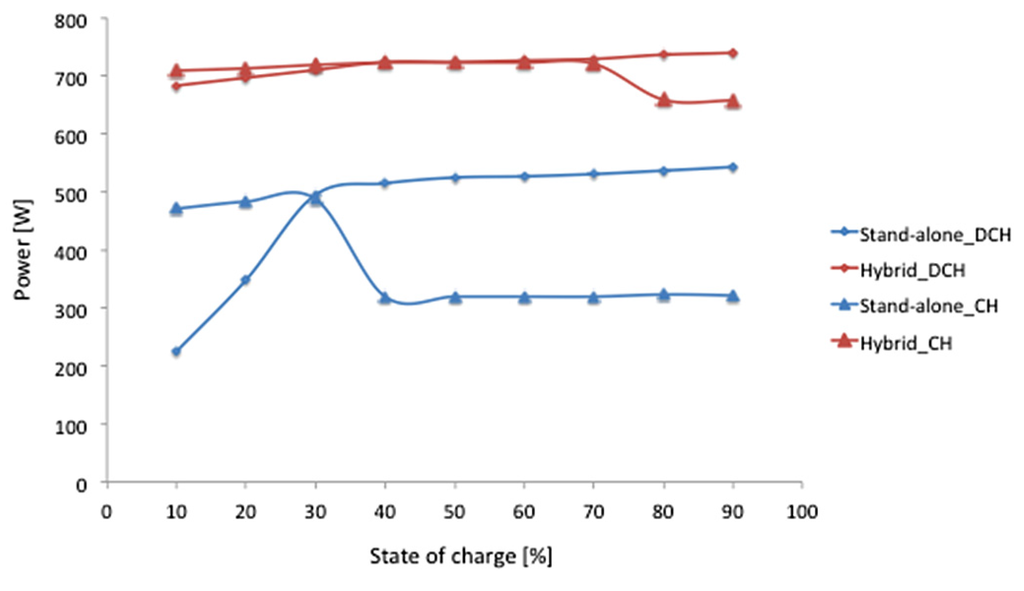
Figure 28.
Power comparison at room temperature based on battery stand-alone system and EDLC systems existing of two cells of 3000 F in series.
4.4.2.4. Cycle Life Analysis
In the academic community a lot of experimental works and analysis have been done on the combination of EDLCs with batteries. However, all these works were often only based on simulations and short experimental validation of the model [,,,]. The authors claimed in their work that the stress of a battery can be reduced and the lifetime of the battery can be enhanced. In [] a series of life-cycle tests have been carried out based on passive and battery stand-alone systems at elevated working temperatures. From the analysis, the authors concluded that the improvement of the battery cycle in the hybrid system is limited compared to the battery in the stand–alone system. These results have also been confirmed by the researchers at the Laboratory of Hydro-Québec []. In order to evaluate this aspect, life cycle testing was performed using pouch LFP based battery cells with a rated capacity of 40 Ah. The batteries have been subjected to the same current profile as illustrated in Figure 25. Three cases are considered:
- Case 1: battery stand-alone;
- Case 2: battery and two EDLC cells (450 F) in series;
- Case 3: battery and two EDLC cells (3,000 F) in series.
The testing was conducted simultaneously using the PEC battery tester. After each 50 cycles the battery capabilities have been checked by a standard cycle (complete charging at 1It current rate and discharging at 1It until 100% depth of discharge DoD). According to the experimental results, the battery cycle life in the case 1 is 650 cycles against 850 and 910 cycles for case 2 and case 3, respectively. This means that the lifetime of the battery in the hybrid architecture has been improved by 30% and 40% compared with the stand-alone system. In Table 10 we can recognize that the cycle life of the battery can be improved when the EDLC capacitance is higher.
Table 10.
Comparison of cycle life at room temperature
| System | Cycle life [cycles] | Cycle life extension [%] |
|---|---|---|
| Stand-alone | 650 | 0 |
| Hybrid (225F EDLC bank) | 850 | 31 |
| Hybrid (1500F EDLC bank) | 910 | 40 |
In [] it is documented that by using the passive battery-EDLC association, the battery current draw is reduced and the EDLC source supplies the majority of the transient current. As a result, the battery stress (defined as the ratio of the battery current in the hybrid system and the battery current in the stand-alone system during a specific constant current load pulse) is reduced by up to 58%. Other laboratory tests showed a substantial improvement over a stand-alone VRLA battery (12 V, 57 Ah) and the lifetime of the battery is increased with 30%. This test was performed using two EDLC stacks consisting of six (600 F) cells in series.
4.4.3. General Comparison
In order to reduce the cost and weight of the system, the EDLC cells should be as small as possible. Therefore the Maxwell BCAP0650 cells with 650 F capacitance will be more than enough []. The Maxwell BCAP0310 cells with a capacitance of 310 F seems unsuitable due to the higher internal resistance (2.2 mΩ) []. Thus, from the cost point of view, the investment cost for the new topology is € 1,300 assuming € 0.01/F. The cost for the passive and active hybrid system will be € 10,500–12,000/€ 12,500–14,000, respectively (see Table 11. Here it should be noted that the price has been calculated based on 3,000 F cells. For 1,500 F cells, the price should be divided by a factor of 2. Thus, from this analysis, we can conclude that the new topology is more beneficial than the previous two hybrid systems (see Table 11).
Table 11.
Comparison of cost, weight and volume of EDLCs based on a maximum system voltage of 365 V [,].
| Characteristics | BMOD0063-P125-B14 | BCAP0650 | BCAP0310 |
|---|---|---|---|
| Volume (m3) | 0.32 | 0.037 | 0.011 |
| Weight (kg) | 181.5 | 32 | 12 |
| Cost (€) | 10,500-12,000 | 1,300 | 620 |
| Cost DC-DC converter (€) | 2,000 | - | - |
Based on the dimensions of the Maxwell 125 V module BMOD0063-P125-B14 and BCAP0650 cells, we can conclude that the new topology can reduce the volume by a factor 8.64, whereas, the weight reduction factor is 5.67. Here, it should be taken into account that the mass and volume of the converter for the active topology has not been included. Furthermore, other aspect such as the reduced complexity makes the new topology more interesting in vehicular applications as illustrated in Table 12.
Table 12.
Comparison of the various hybrid topologies.
| Characteristics | Passive | Active | New |
|---|---|---|---|
| Performances | + | ++ | + |
| Complexity | ++ | + | +++ |
| Cost | ++ | + | +++ |
| Weight | ++ | + | +++ |
| Volume | ++ | + | +++ |
5. Conclusions
In this study, the performance and characteristics of Electrical Double-Layer Capacitors (EDLCs) as a peak power unit in hybrid electric vehicles and battery-electric vehicles have been analyzed and discussed. From the simulation results, we have observed that the use of EDLCs can enhance the battery performance compared to the stand-alone battery system. Particularly, there is an improvement in terms of driving range, energy efficiency and energy recuperation. Furthermore, the cycle life tests have shown the beneficial aspects of the new hybrid topology. The lifetime increase can be in the range of 30%–40% for lithium-ion.
The properties of the active hybrid system have been evaluated and compared to the passive hybrid system. The range extension achieved is limited, but the voltage drop and the battery stress reduction are more pronounced. The only barrier of the active topology compared to the passive topology in hybrid applications is the high cost, volume and weight of the peak power unit.
A new hybrid topology has been proposed in this study, combining the advantages of the active and passive systems. According to the simulation results, the new topology has almost the same performance as the passive topology, while the cost is more advantageous than the passive and active systems by a factor of 4.6.
References
- Maggetto, G.; van Mierlo, J. Electric vehicles, hybrid vehicles and fuel cell electric vehicles: State of art and perspectives. Annal. Chim. Sci. Mater. 2001, 26, 9–26. [Google Scholar] [CrossRef]
- Van Mierlo, J.; Maggetto, G.; Lataire, P. Which energy source for road transport in the future? A comparison of battery, hybrid and fuel cell vehicles. J. Energy Conver. Manag. 2006, 47, 2748–2760. [Google Scholar]
- Van den Bossche, P.; Vergels, F.; van Mierlo, J.; Matheys, J.; van Autenboer, W. SUBAT: An assessment of sustainable battery technology. J. Power Sources 2006, 162, 913–919. [Google Scholar] [CrossRef]
- Omar, N.; van Mulders, F.; van Mierlo, J.; van den Bossche, P. Assessment of behaviour of super capacitor-battery system in heavy hybrid lift truck vehicles. J. Asian Electr. Veh. 2009, 7, 1277–1282. [Google Scholar] [CrossRef]
- Abderrahmane, H.; Emmanuel, B. Assessment of real behavior of VHE energy storage system in heavy vehicles. In Proceedings of 3rd European Ele-Drive Transportation Conference (EET-2008), Geneva, Switzerland, 11–13 March 2008.
- Omar, N.; Verbrugge, B.; van den Bossche, P.; van Mierlo, J. Power and life enhancement of battery-electrical double layer capacitor for hybrid electric and charge-depleting plug-in vehicle applications. Electrochim. Acta 2010, 55, 7524–7531. [Google Scholar] [CrossRef]
- Cheng, J.; van Mierlo, J.; van den Bossche, P.; Lataire, P. Super capacitor based energy storage as peak power unit in the applications of hybrid electric vehicles. In Proceedings of International Conference on Power Electronics, Machines and Drives, Dublin, Ireland, 14–17 March 2006.
- Akli, C.R.; Roboam, X.; Sareni, B.; Jeunesse, A. Energy management and sizing of a hybrid locomotive. In Proceedings of European Conference on Power Electronics and Applications, Aalborg, Denmark, 2–5 September 2007.
- Pay, S.; Baghzouz, Y. Effectiveness of battery-supercapacitor combination in electric vehicles. In Proceedings of IEEE Power Technology Conference, Bologna, Italy, 23–26 June 2003.
- Wang, T.; Yu, H.; Zhu, C. Hybrid energy Sources for hybrid electric vehicle propulsion. In Proceedings of IEEE Vehicle Power and Propulsion Conference, Harbin, China, 3–5 September 2008.
- Van Mierlo, J.; Maggetto, G.; van den Bossche, P. Models of energy sources for EV and HEV: fuel cells, batteries, ultra-capacitors, flywheels and engine-generators. J. Power Sources 2004, 28, 76–89. [Google Scholar] [CrossRef]
- Douglas, H. Sizing ultracapacitors for hybrid electric vehicles. In Proceedings of Annual Conference of IEEE on Industrial Electronics Society, Raleigh, NC, USA, 6–10 November 2005.
- Conway, B.E. Electrochemical Supercapacitors Scientific Fundamentals and Technological Applications; Kluwer Academic: Amsterdam, The Netherlands, 1999. [Google Scholar]
- Du Pasquier, A.; Plitz, I.; Menocal, S.; Amatucci, G. A Comparative Study of Li-ion Battery, Supercapacitors and nonaqueous asymmetric hybrid devices for automotive applications. J. Power Sources 2003, 115, 171–178. [Google Scholar] [CrossRef]
- Amatucci, G.G.; Badway, F.; du Pasquier, A. An asymmetric hybrid nonaqueous energy storage cell. J. Electrochem. Soc. 2011, 148, A930–A939. [Google Scholar] [CrossRef]
- Burke, A. Ultracapacitor technologies and applications in hybrid and electric vehicles. Int. J. Energy Res. 2010, 34, 133–151. [Google Scholar] [CrossRef]
- Burke, A. R&D considerations for the performance and applications of electrochemical capacitors. Electrochim. Acta 2007, 53, 1083–1091. [Google Scholar] [CrossRef]
- Burke, A.; Miller, M. Testing of electrochemical capacitors: Capacitance, resistance, energy density, and power capabilities. Electrochim. Acta 2010, 55, 7438–7548. [Google Scholar]
- Omar, N.; Al Sakka, M.; Daowd, M.; Coosemans, T.; van Mierlo, J.; van den Bossche, P. Assessment of hebavior of Active EDLC-Battery system in heavy hybrid charge depleting vehicles. In Proceedings of 4th European Symposium on Super Capacitors & Applications, Bordeaux, France, 21–22 October 2010.
- Omar, N.; Daowd, M.; Mulder, G.; Timmermans, J.M.; van den Bossche, P.; van Mierlo, P.; Pauwels, S. Assessment of performance of lithium iron phophate oxide, Nickel manganese cobalt oxide and nickel cobalt aluminum oxide based cells for using in plug-in battery electric. In Proceedings of the IEEE Vehicle Power and Propulsion Conference, Chicago, IL, USA, 6–9 September 2011.
- Omar, N.; Daowd, M.; van den Bossche, P.; Hegazy, O.; Smekens, J.; Coosemans, T.; van Mierlo, J. Rechargeable energy storage systems for plug-in hybrid electric vehicles—Assessment of electrical characteristics. Energies 2012, 5, 2952–2988. [Google Scholar] [CrossRef]
- Burke, B.; Miller, M. Performance characteristics of lithium-ion batteries of various chemistries for plug-in hybrid vehicles. In Proceedings of the 24th World Battery, Hybrid and Fuel Cell Electric Vehicle Symposium, Stavanger, Norway, 11–12 May 2009.
- Kötz, R.; Carlen, M. Principles and applications of electrochemical capacitors. Electrochim. Acta 2000, 45, 2483–2498. [Google Scholar]
- Omar, N.; Daowd, M.; Hegazy, O.; Al Sakka, M.; Coosemans, T.; van den Bossche, P.; van Mierlo, J. Assessment of lithium-ion capacitor for using in battery electric vehicle and hybrid electric vehicle applications. Electrochim. Acta 2012, in press. [Google Scholar]
- Tang, Y. On the feasibility of hybrid battery/ultracapacitor energy storage systems for next generation shipboard power systems. In Proceedings of Vehicle Power and Propulsion Conference, Lille, France, 1–3 September 2010.
- Wipke, K.; Cuddy, M.; Bharathan, D.; Burch, S.; Johnson, V.; Markel, A.; Sprik, S. Advisor 2.0: A Second-Generation Advanced Vehicle Simulator for Systems Analysis; Technical Report Contract No. DE-AC369-8-GO10337; National Renewable Energy Laboratory (NREL): Golden, CO, USA, 1999. [Google Scholar]
- Cole, G.H. Simplev: A Simple Electric Vehicle Simulation Program Version 1.0; Technical Report Contract No. DE-AC077-6ID01570; U.S. Department of Energy Field Office: Albuquerque, NM, USA, 1991.
- Argonne National Laboratory. Powertrain Systems Analysis Toolkit—A Flexible, Reusable Model for Simulating Advanced Vehicles; Argonne National Laboratory: Argonne, IL, USA, 2012. Available online: http://web.anl.gov/techtransfer/pdf/PSAT.pdf (accessed on 6 November 2012).
- Argonne National Laboratory. PSAT Training. Part 1—PSAT Overview; Argonne National Laboratory: Argonne, IL, USA, 2012. Available online: http://www.transportation.anl.gov/pdfs/HV/412.pdf (accessed on 6 November 2012).
- Van Mierlo, J. Simulation Software for Comparison and Design of Electric, Hybrid Electric and Internal Combustion Vehicles with Respect to Energy, Emissions and Performances. Ph.D. Dissertation, Vrije Universiteit Brussel, Brussel, Belgium, 2000. [Google Scholar]
- Mobelica. Available online: https://www.modelica.org/education/educationalmaterial/lecturematerial/english/modelicaoverview.pdf (accessed on 6 November 2012).
- Fan, B.S.M. Modeling and Simulation of a Hybrid Electric Vehicle Using Matlab/Simulink and Adams. Master’s Thesis, University of Waterloo, Waterloo, Canada, 2007. [Google Scholar]
- Idaho National Laboratory. Battery Test Manual for Plug-In Hybrid Electric Vehicles; U.S. Department Secretary of Energy: Idaho Falls, ID, USA, 2003.
- Shi, L.; Crow, M.L. Comparison of ultracapacitor electric circuit models. In Proceedings of Power and Energy Society General Meeting—Conversion and Delivery of Electrical Energy in the 21st Century, Pittsburg, PA, USA, 20–24 July 2008.
- Karden, S.B.; Kok, D.; de Doncker, R.W. Modeling the dynamic behavior of supercapacitors using impedance spectroscopy. In Proceedings of IEEE Thirty-Sixth IAS Annual Meeting—Industry Applications Conference, Chicago, IL, USA, 30 September–4 October 2001.
- Zubieta, L.; Boner, R. Characterization of double-layer capacitors for power electronics applications. IEEE Trans. Ind. Appl. 2000, 36, 199–205. [Google Scholar] [CrossRef]
- Barrero, R.; Coosemans, T.; van Mierlo, J. Hybrid buses: Defining the power flow management strategy and energy storage system needs. In Proceedings of the 24th International Battery, Hybrid and Fuel Cell Electric Vehicle Symposium (EVS-24), Stavanger, Norway, 13–16 May 2009.
- Al Sakka, M.; van Mierlo, J.; Gualous, H.; Lataire, P. Comparison of 30 kW DC/DC converter topologies interfaces for fuel cell in hybrid electric vehicle. In Proceedings of European Conference on Power Electronics and Applications, Barcelona, Spain, 8–10 September 2009.
- Nissan Leaf. Available online: http://en.wikipedia.org/wiki/nissan-leaf (accessed on 6 November 2012).
- Angers, P. Supercapacitors—Do they improve battery life? In Proceedings of the 21st International Battery, Hybrid and Fuel Cell Electric Vehicle Symposium (EVS-21), Monaco, France, 4–7 December 2005.
- Verbrugge, M.; Liu, P.; Soukiazian, S.; Ying, R. Electrochemical energy storage systems and range-extended electric vehicles. In Proceedings of the 25th International Battery Seminar Exhibit, Fort Lauderdale, FL, USA, 11–14 March 2008.
- Sikha, G.; Popov, B.N. Performance optimization of a battery–capacitor hybrid system. J. Power Sources 2004, 134, 130–138. [Google Scholar] [CrossRef]
- Dougal, R.A.; Liu, S.; White, R.E. Power and life extension of battery-ultracapacitor hybrids. IEEE Trans. Compon. Packag. Technol. 2002, 24, 120–131. [Google Scholar] [CrossRef]
- Aharon, I.; Kuperman, A. Design of semi-active battery-ultracapacitor hybrids, electrical and electronics engineers in Israel (IEEEI). In Proceedings of IEEE 26th Convention Conference, Eliat, Israel, 17–20 November 2010.
- Kuperman, A.; Aharon, I. Battery-ultracapacitor hybrids for pulsed current loads: A review. J. Power Sources 2011, 15, 1005–1023. [Google Scholar]
- European Batteries. Available online: http://www.europeanbatteries.com/solutions/brochures (accessed on 6 November 2012).
- Carter, R.; Cruden, A. Strategies for control of a battery/supercapacitor system in an electric vehicle. In Proceedings of International Symposium on Power Electronics, Electrical Drives, Ischia, Italy, 11–13 June 2008.
- Hegazy, O.; van Mierlo, J.; Lataire, P. Analysis, modeling and implementation of multidevice interleaved DC/DC converter for fuel cell hybrid vehicles. IEEE Trans. Power Electron. 2012, 27, 4445–4458. [Google Scholar] [CrossRef]
- Hegazy, O.; van Mierlo, J.; Lataire, P. Analysis, control and comparison of DC/DC boost converter topologies for fuel cell hybrid electric vehicle applications. In Proceedings of 14th European Conference on Power Electronics and Applications, Stavanger, Norway, 29 August–2 September 2011.
- Guidi, G.; Undeland, T.; Hori, Y. Effectiveness of supercapacitors as power-assist in pure EV using a sodium nickel chloride battery as main energy storage. In Proceedings of Proceedings of the 24th International Battery, Hybrid and Fuel Cell Electric Vehicle Symposium (EVS-24), Stavanger, Norway, 13–16 May 2009.
- Aanderman, M.; Kalhammer, F.R.; MacArthur, D. Advanced Batteries for Electric Vehicles: An Assessment of Performance, Cost, and Availability; Technical Report; State of California Air Resources Board: Sacramento, CA, USA, 2000. [Google Scholar]
- Cheah, T.; Heywood, J. The cost of vehicle electrification: A literature review. In Proceedings of MIT Energy Initiative Symposium, Boston, MA, USA, April 2010.
- 4ESYS. Available online: http://www.4esys.com (accessed on 6 November 2012).
- Maxwell. Available online: http://www.maxwell.com (accessed on 6 November 2012).
- Barrero, R.; van Mierlo, J.; Lataire, P. Design of bi-directional series resonant converter as peak power unit in hybrid electric vehicles. In Proceedings of International Conference of Industrial Technology, Vina del Mar, Chile, 14–17 March 2010.
- Chandrasekaran, R.; Sikha, G.; Popov, B.N. Capacity fade analysis of a battery/super capacitor hybrid and a battery under pulse loads—Full cell studies. J. Appl. Electrochem. 2005, 35, 1005–1023. [Google Scholar] [CrossRef]
© 2012 by the authors; licensee MDPI, Basel, Switzerland. This article is an open access article distributed under the terms and conditions of the Creative Commons Attribution license (http://creativecommons.org/licenses/by/3.0/).