1. Introduction
Buildings account for
circa 40% of the total energy use in Europe [
1], and for about 36% of the EU’s total CO
2 emissions [
2,
3]. Even though energy saving measures at the building level have been proposed, the net energy use at the city/district levels is still increasing. Buildings are important in achieving the EU’s energy savings target and to combat climate change, while contributing to energy security [
4]. The building industry and the built environment are one of the largest contributors to energy and materials use worldwide. In the northern part of the European Union, 41% of the total final energy use comes from buildings, with 30% being used in residential buildings [
5]. According to the EuroACE report [
6], 57% of the energy used in buildings is for space heating, 25% for hot water, 11% for lighting and electrical appliances, and 7% for cooking.
Buildings are an exceedingly complex industrial product with a lifetime of decades. While there have been certain on-going efforts to control and manage individual aspects of the environmental aspects of buildings (
i.e., energy codes, automation and control schemes, thermal comfort), comprehensive approaches have been lacking [
7,
8], particularly in the design stages of a building’s life span. Unfortunately, it is in the design stage when the greatest opportunities to affect changes whose benefits can last for decades are available.
In Finland, residential and commercial buildings account for 40% of all energy use; in addition commercial and apartment buildings have a notable influence on the peak demand in some periods. Energy and electric intensity in commercial buildings has clearly increased, and residential energy use continues to increase (mainly due to electricity use).
Key features of the Finnish energy policy are improved energy efficiency and increased use of renewable energy sources [
9]. To achieve a sustainable shift in the energy system, a target set by the authorities, both energy savings and increased use of low-pollution energy sources are therefore high priority areas. Building low-energy buildings, characterized by lower thermal energy demand than new buildings with ordinary energy standards, is in accordance with the declared national aim of reducing energy use. However, in the future the use of electricity will be of more importance in respect to CO
2 emissions and primary energy use.
The space heating demand of buildings has decreased by improved insulation, reduced air leakage and by heat recovery from ventilation air. However, these measures result in an increased use of materials. As the energy for building operation decreases, the relative importance of the energy used in the production phase increases and influences optimization aimed at minimizing the life cycle energy use. The life cycle primary energy use of buildings also depends on the energy supply systems.
Presently, the share of renewable energy used in the built environment is very modest; the renewable energy accounted for 10.3% of gross final energy consumption in the EU-27 in the year 2010 [
10]. Both at national and international level, the targets for energy efficiency and share of renewable energy production imply a steep increase of intermittent renewable energy.
The use of a larger share of renewable energy compared to today’s levels with present day technology presents a number of challenges. Renewable energy supplies such as solar or wind energy have a fluctuating character, which is obviously problematic to the demand side: energy needs are usually rather constant or often not in the same temporal cycle as the supply. In addition the peak supply from renewable energies can be much higher than demand and the excess renewable energy cannot be stored. Especially in northern climates, the space needed for local renewable production (area of collectors, etc.) might become disproportionately large. Furthermore, the location of the buildings/districts is not always suitable for utilization of some renewable sources.
The ambition in sustainable development of the built environment is to reduce the harmful impact of the nature of materials and building energy use. Often the building energy use and the minimization of its CO
2 equivalent emissions are considered to be the desired goal. However, as the energy use decreases the importance of CO
2 equivalent emissions originating from building materials and products increases. Thus, what kind of materials and building products are used becomes more important. In addition, the minimization of CO
2 equivalent emissions is perhaps not the only desired target, but we need to consider also the minimization of primary energy use, since it highlights rather well the use of natural resources. The aim of the study is therefore to:
Find out the different available options in the design phase in order to minimize the energy consumption;
Consider how the CO2 equivalent emissions from the embodied energy from building materials and CO2 equivalent emissions from energy use in the building should be treated;
Consider how we should weight the primary energy use and the CO2 equivalent emissions of different design options.
In this study is a real office building was studied. The building already had a rather compact quadratic shape, therefore the geometry is not a variable in this study, which is a limitation of this approach.
2. Methods and Studied Building
2.1. Studied Building
The studied building is an office building located in Helsinki developed by Skanska Commercial Development Finland. The building was under design phase and the aim was to study different alternatives in order to choose the most energy and environmental efficient way to erect the building. The gross floor area of the nine storey building is 26,000 m
2. The geometry of the building is quadratic. The studied properties are shown in
Table 1.
Table 1.
Studied design alternatives. The control systems include ventilation and lightning.
Table 1.
Studied design alternatives. The control systems include ventilation and lightning.
| Feature | Case 1 | Case 2 | Case 3 | Case 4 | Case 5 | Case 6 |
|---|
| Building envelope excl. windows | Building Code 2010 | Building Code 2010 | Building Code 2010 | Building Code 2010 | Building Code 2010 | Passive house |
| Windows (W/m2K) | 1.0 | 1.0 | 1.0 | 1.0 | 0.7 | 0.7 |
| Ventilation heat recovery | 70% | 70% | 80% | 80% | 90% | 90% |
| LED lighting | in garage | in garage | in garage | in garage | in all spaces | in all spaces |
| Systems control level | building | room | room | building | room | room |
In the 2010 Building Code the U-values for external walls is 0.17 W/m2K, base floors 0.16 W/m2K, roofs 0.09 W/m2K and doors 1.0 W/m2K. The ventilation heat recovery requirement in the 2010 Building Code is 45%, which was not used in calculations, since that was not an option in the design phase. In the so called passive house level the U-values for external walls is 0.08 W/m2K, base floors 0.15 W/m2K, roofs 0.08 W/m2K and doors 0.7 W/m2K.
2.3. Building Model
The building model was the architect’s real 3D model but the building spaces were simplified to 43 different zone models each representing typical uses of the space type, such as office rooms, meeting rooms, cafeteria,
etc. In each space the occupants were assumed to be present between 8–16 h and the lightning and equipment were on between 7–17 h. The different profiles for internal loads and lightning are those typically used in Finnish simulations. The main information is shown in
Table 2.
Table 2.
Modelled spaces and their internal loads, air flows, heating and cooling set points as well as room area and height.
Table 2.
Modelled spaces and their internal loads, air flows, heating and cooling set points as well as room area and height.
| Zone Name | Number of Zones | Room Height (m) | Area (m2) | Setpoint (°C) | Air (L/s m2) | Occup.
(No./m2) | Lights
(W/m2) | Equip.
(W/m2) |
|---|
| Heat | Cool | Supply | Return |
|---|
| Open office 1 | 1 | 3.3 | 360.4 | 21 | 25 | 1.5 | 1.5 | 0.06 | 12 | 30 |
| Service | 7 | 5.3 | 64.43 | 21 | 25 | 0.5 | 0.5 | 0 | 8 | 0 |
| Storage | 3 | 5.3 | 16.61 | 18 | 25 | 0 | 0.35 | 0 | 8 | 0 |
| Kabinets | 1 | 5.3 | 12.71 | 21 | 25 | 1.5 | 1.5 | 0.06 | 12 | 30 |
| Meeting BIM | 2 | 5.3 | 36.26 | 21 | 25 | 5 | 5 | 0.1 | 12 | 30 |
| Meeting 1 | 2 | 5.3 | 27.34 | 21 | 25 | 5 | 5 | 0.1 | 12 | 30 |
| Post office | 7 | 5.3 | 43.46 | 21 | 25 | 0.5 | 0.5 | 0 | 8 | 0 |
| Storage | 3 | 5.3 | 15.72 | 18 | 25 | 0 | 0.35 | 0 | 8 | 0 |
| Restaurant | 6 | 5.3 | 211.3 | 21 | 25 | 6 | 6 | 0.06 | 12 | 0 |
| Kitchen | 6 | 5.3 | 100.6 | 21 | 25 | 10 | 10 | 0.06 | 20 | 50 |
| Lifts | 8 | 5.3 | 16.25 | 21 | 25 | 8 | 8 | 0 | 8 | 0 |
| WC | 4 | 5.3 | 34.08 | 21 | 25 | 0 | 1.5 | 0 | 8 | 0 |
| Client service | 1 | 5.3 | 162.3 | 21 | 25 | 1.5 | 1.5 | 0.06 | 12 | 30 |
| Atrium | 5 | 35 | 142.4 | 21 | 25 | 2 | 2 | 0 | 20 | 0 |
| Group meeting | 2 | 3.3 | 20.74 | 21 | 25 | 5 | 5 | 0.1 | 12 | 30 |
| Meeting 2 | 2 | 3.3 | 19.81 | 21 | 25 | 5 | 5 | 0.1 | 12 | 30 |
| Storage | 3 | 3.3 | 16.61 | 18 | 25 | 0 | 0.35 | 0 | 8 | 0 |
| WC | 4 | 3.3 | 31.94 | 21 | 25 | 0 | 1.5 | 0 | 8 | 0 |
| Open office 2 | 1 | 3.3 | 382.6 | 21 | 25 | 1.5 | 1.5 | 0.06 | 12 | 30 |
| Lobby | 1 | 3.3 | 34.2 | 21 | 25 | 1.5 | 1.5 | 0.06 | 12 | 30 |
| Storage | 3 | 3.3 | 12.47 | 18 | 25 | 0 | 0.35 | 0 | 8 | 0 |
| Meeting 3 | 2 | 3.3 | 22.57 | 21 | 25 | 5 | 5 | 0.1 | 12 | 30 |
| WC | 4 | 3.3 | 19.35 | 21 | 25 | 0 | 1.5 | 0 | 8 | 0 |
| Atrium corridor 1 | 5 | 3.3 | 74.8 | 21 | 25 | 1 | 1 | 0 | 8 | 0 |
| Atrium corridor 2 | 5 | 3.3 | 61.79 | 21 | 25 | 1 | 1 | 0 | 8 | 0 |
| kabinett | 1 | 5.4 | 56.8 | 21 | 25 | 1.5 | 1.5 | 0.06 | 12 | 30 |
| Sauna | 9 | 5.4 | 125.9 | 21 | 25 | 1 | 1 | 0 | 12 | 0 |
| HVAC room | 10 | 5.4 | 440.4 | 20 | 25 | 0 | 0.35 | 0 | 8 | 0 |
| Storage | 3 | 5.4 | 16.61 | 18 | 25 | 0 | 0.35 | 0 | 8 | 0 |
| Office | 1 | 5.4 | 104.2 | 21 | 25 | 1.5 | 1.5 | 0.06 | 12 | 30 |
| Meeting 4 | 2 | 5.4 | 22.18 | 21 | 25 | 5 | 5 | 0.1 | 12 | 30 |
| Storage | 3 | 5.4 | 26.23 | 18 | 25 | 0 | 0.35 | 0 | 8 | 0 |
| Library | 1 | 5.4 | 33.37 | 21 | 25 | 1.5 | 1.5 | 0.06 | 12 | 30 |
| WC | 4 | 5.4 | 23.73 | 21 | 25 | 0 | 1.5 | 0 | 8 | 0 |
| Atrium corridor 3 | 5 | 5.4 | 99.7 | 21 | 25 | 1 | 1 | 0 | 8 | 0 |
| Cafeteria | 6 | 5.3 | 198.6 | 21 | 25 | 1.5 | 1.5 | 0.06 | 8 | 0 |
| Corridor | 5 | 5.3 | 56.7 | 21 | 25 | 1 | 1 | 0 | 8 | 0 |
| Service | 12 | 3.9 | 238.9 | 21 | 25 | 0.5 | 0.5 | 0 | 5 | 0 |
| Cellar 1 | 11 | 3.9 | 1527 | 15 | 25 | 1 | 1 | 0 | 5 | 0 |
| Storage 1 | 12 | 3 | 506.2 | 21 | 25 | 0.5 | 0.5 | 0 | 5 | 0 |
| Cellar 2 | 11 | 3 | 1426 | 15 | 25 | 1 | 1 | 0 | 5 | 0 |
| Storage 2 | 12 | 3.1 | 506.2 | 21 | 25 | 0.5 | 0.5 | 0 | 5 | 0 |
| Cellar 3 | 11 | 3.1 | 1426 | 15 | 25 | 1 | 1 | 0 | 5 | 0 |
2.4. Embodied Carbon in Materials
The embodied carbon in materials and material production process was calculated according to ISO 14020 and ISO14040, as well as ISO 14025. In addition the National Method for Building Products and Components were used [
15]. Material specific environmental certificates and declarations were used. The embodied CO
2 includes energy consumption of building materials and products, the use of raw materials and greenhouse gases. The most important greenhouse gases are fossil fuel derived CO
2, CH
4 and N
2O. In the calculations the greenhouse gases are transformed to CO
2 equivalents by using IPCC’s characteristic factors, in which the corresponding factors for CO
2 are 1, CH
4 corresponds 25 and N
2O 298. The sum of these is the CO
2 emissions from embodied energy of building materials and products.
2.5. Energy Sources and Their CO2 Equivalent Emissions and Primary Energy
The studied alternatives for energy sources and their CO
2 equivalent emissions are shown in
Table 3. The average values in district heating and electricity refer to average values in Finland for 2008. In Finland 75% of the district heating is produced in electricity co-generation power plants. The primary energy factors for district heating systems are less than zero, due to the co-generation of heat and power. The factors are calculated by applying the benefit allocation method in co-generation. In the district cooling the production is 40% from free cooling (sea water), 30% from absorption heat pumps and 30% from heat pumps. In green electricity 80% of the power comes from wind and 20% from bio-based fuels.
Table 3.
Primary energy factors and CO2 equivalent emissions used.
Table 3.
Primary energy factors and CO2 equivalent emissions used.
| | Primary Energy Factor | CO2 equivalent * |
|---|
| District heating average | 1.87 | 0.22 |
| District heating bio | 0.4 | 0.12 |
| Electricity average | 1.87 | 0.38 |
| Electricity from district heating average | 1.87 | 0.38 |
| Peak electricity from nuclear power | 2.8 | 0 |
| Peak electricity from coal | 2.0 | 0.928 |
| District cooling | 0.25 | 0.12 |
| Green electricity | 0.2 | 0 |
The service life for building was assumed to be 50 years. The embodied CO2 emissions from building materials and process were estimated according to design drawings.
3. Results
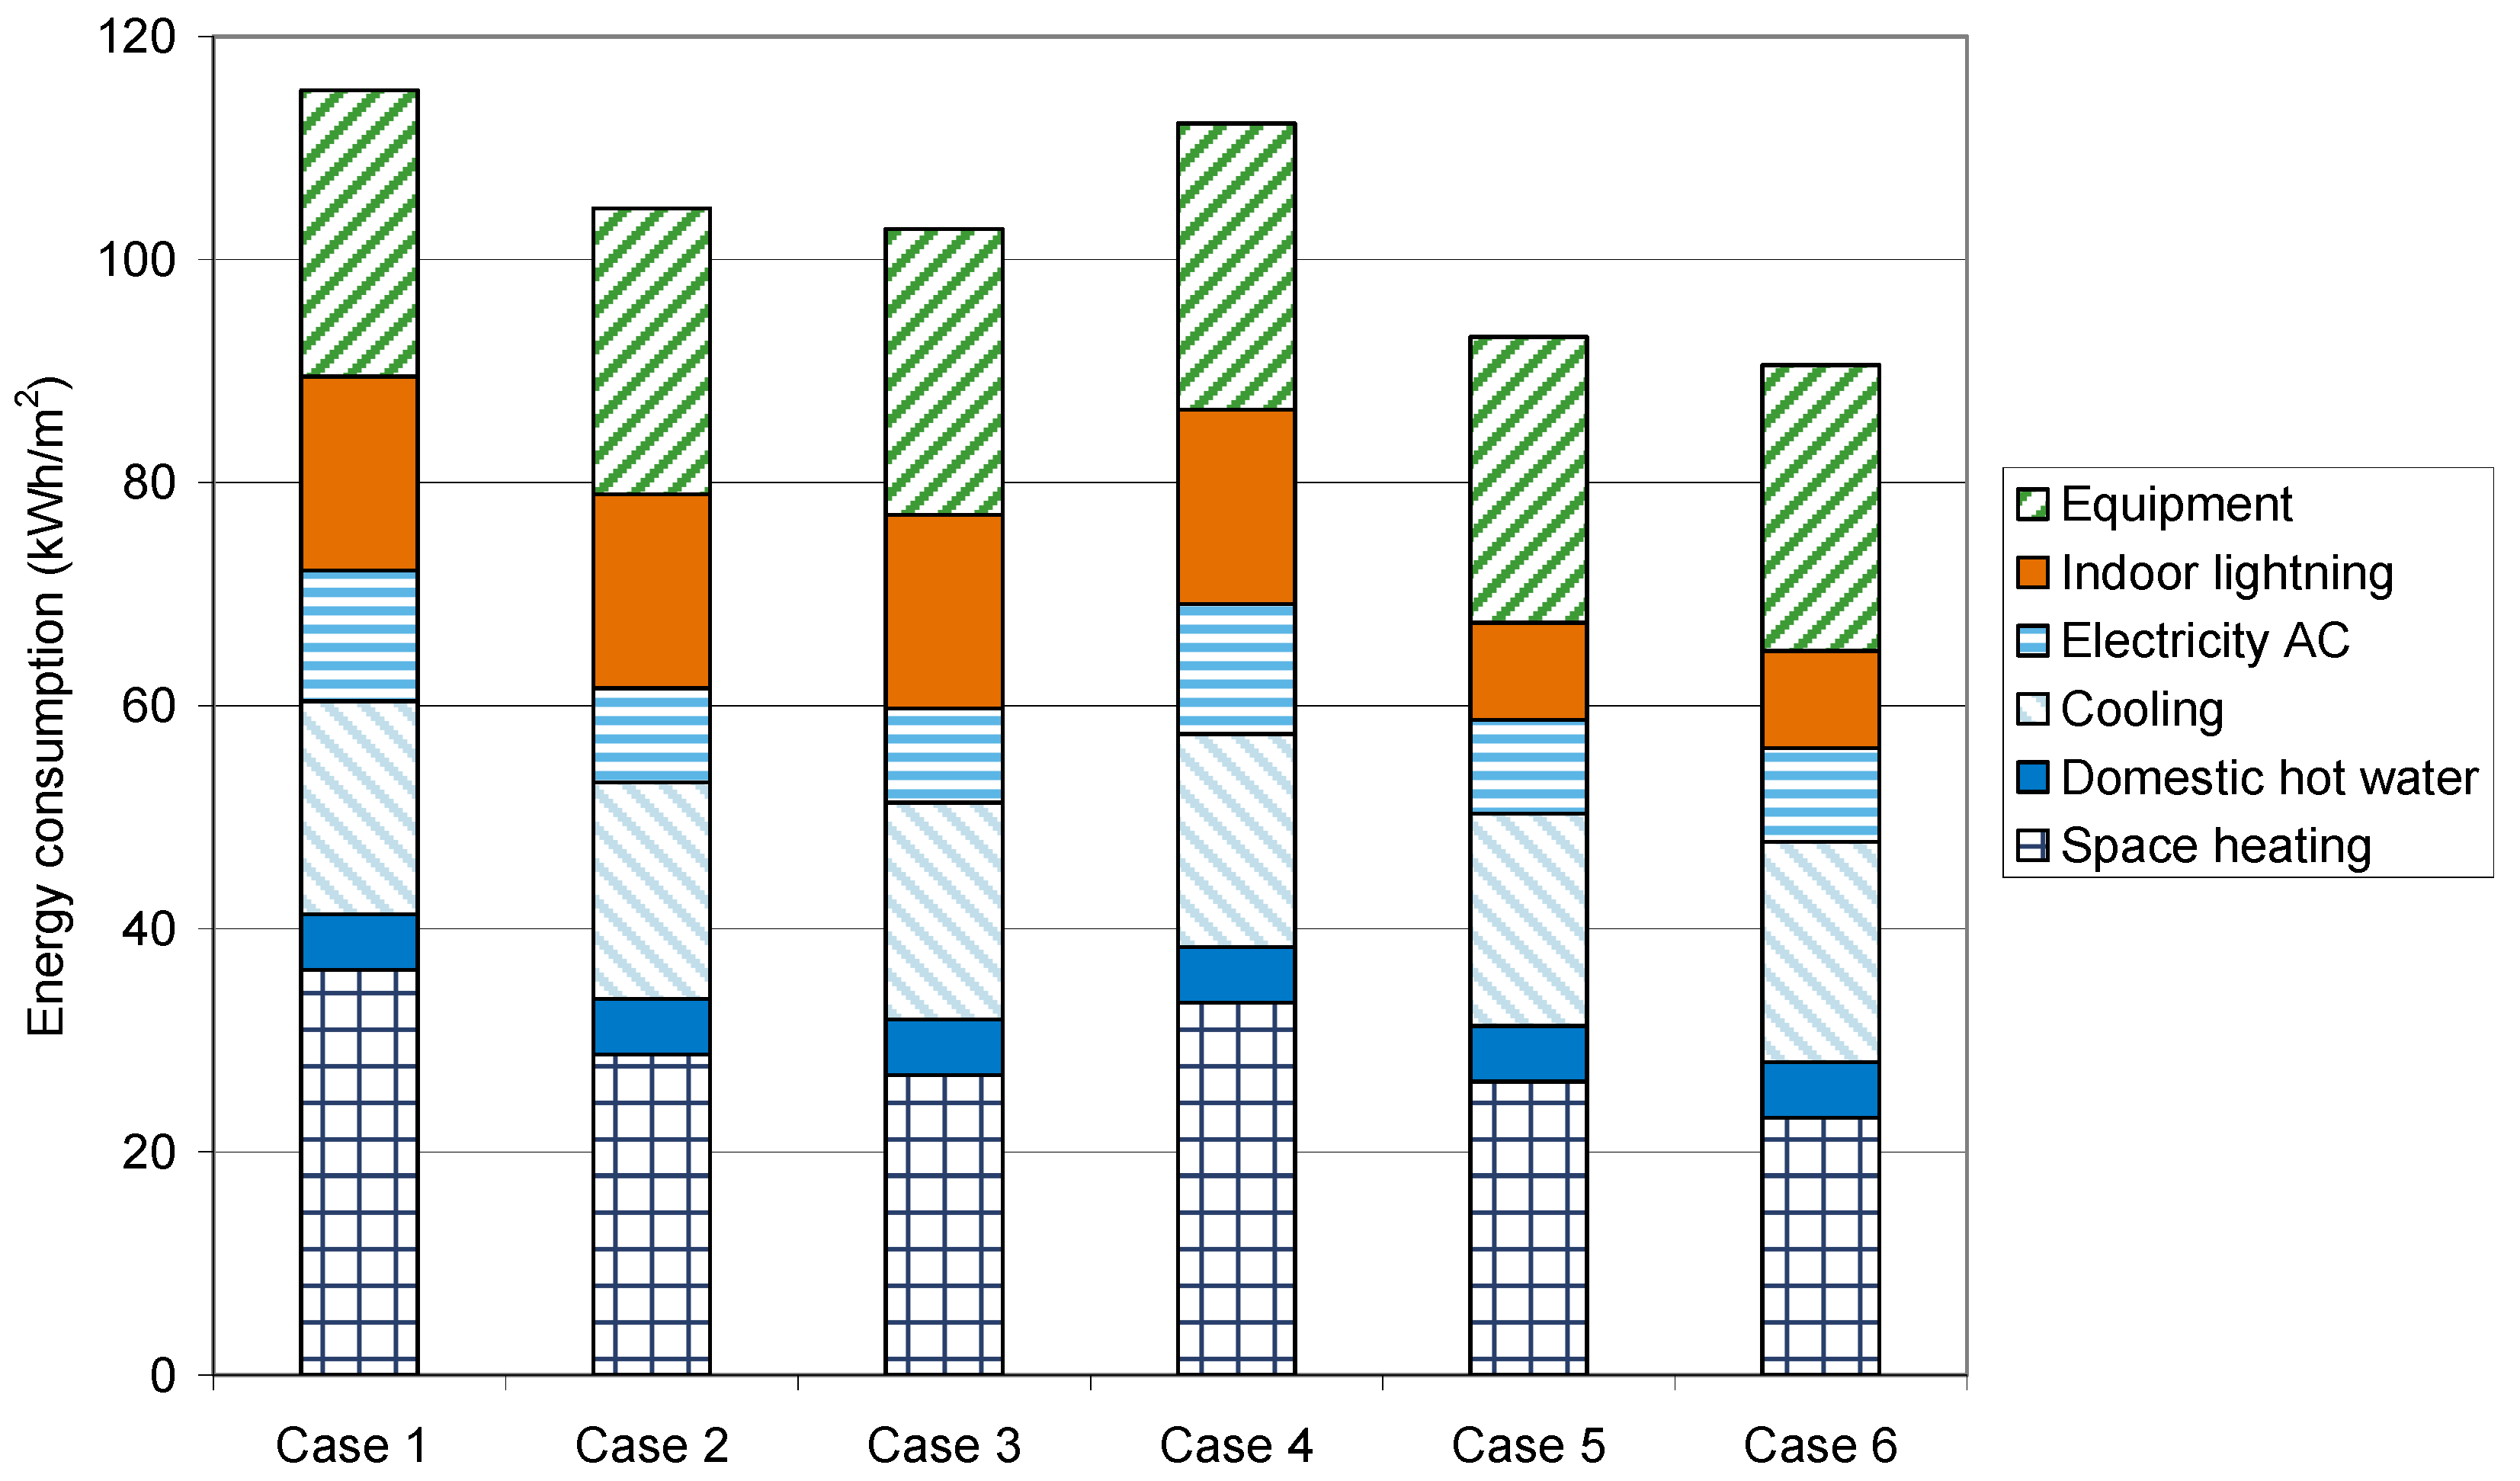
The energy consumption was highest in the case 1 and lowest in the case 6. But the energy consumption in case 4 was also really high, being nearly the same as in the case 1 and showing that the building level control is inefficient with respect to energy saving. In particular the heating energy consumption is the highest when the control is at the building level. The energy consumption was 20% lower in case 6 compared to case 1. The only difference between cases 3 and 4 was the temperature control. In case 3 the control was at the room level, while in the case 4 the control was at the building level. That resulted in a 7% difference in total energy consumption and a 20% difference in space heating, in addition the difference in cooling was also 20% between those two cases (
Figure 1). Since in office buildings the electricity use has higher importance than heating, case 6 does not have that much difference in consumption, even though the insulation values are much better (equal to passive house). The major difference between cases 3 and 5 was the LED lightning, in case 5 all lightning was done by LEDs, which clearly resulted in a lower energy consumption. The use of lower U-values in windows (from 1.0 to 0.7 W/m
2K) did not afford that much energy consumption savings. This was due to the rather high internal loads (typical office equipment and people) thus, the heating demand was already rather low.
Figure 1.
Yearly energy consumption in different cases. Electricity AC represents for electricity for air conditioning systems.
Figure 1.
Yearly energy consumption in different cases. Electricity AC represents for electricity for air conditioning systems.
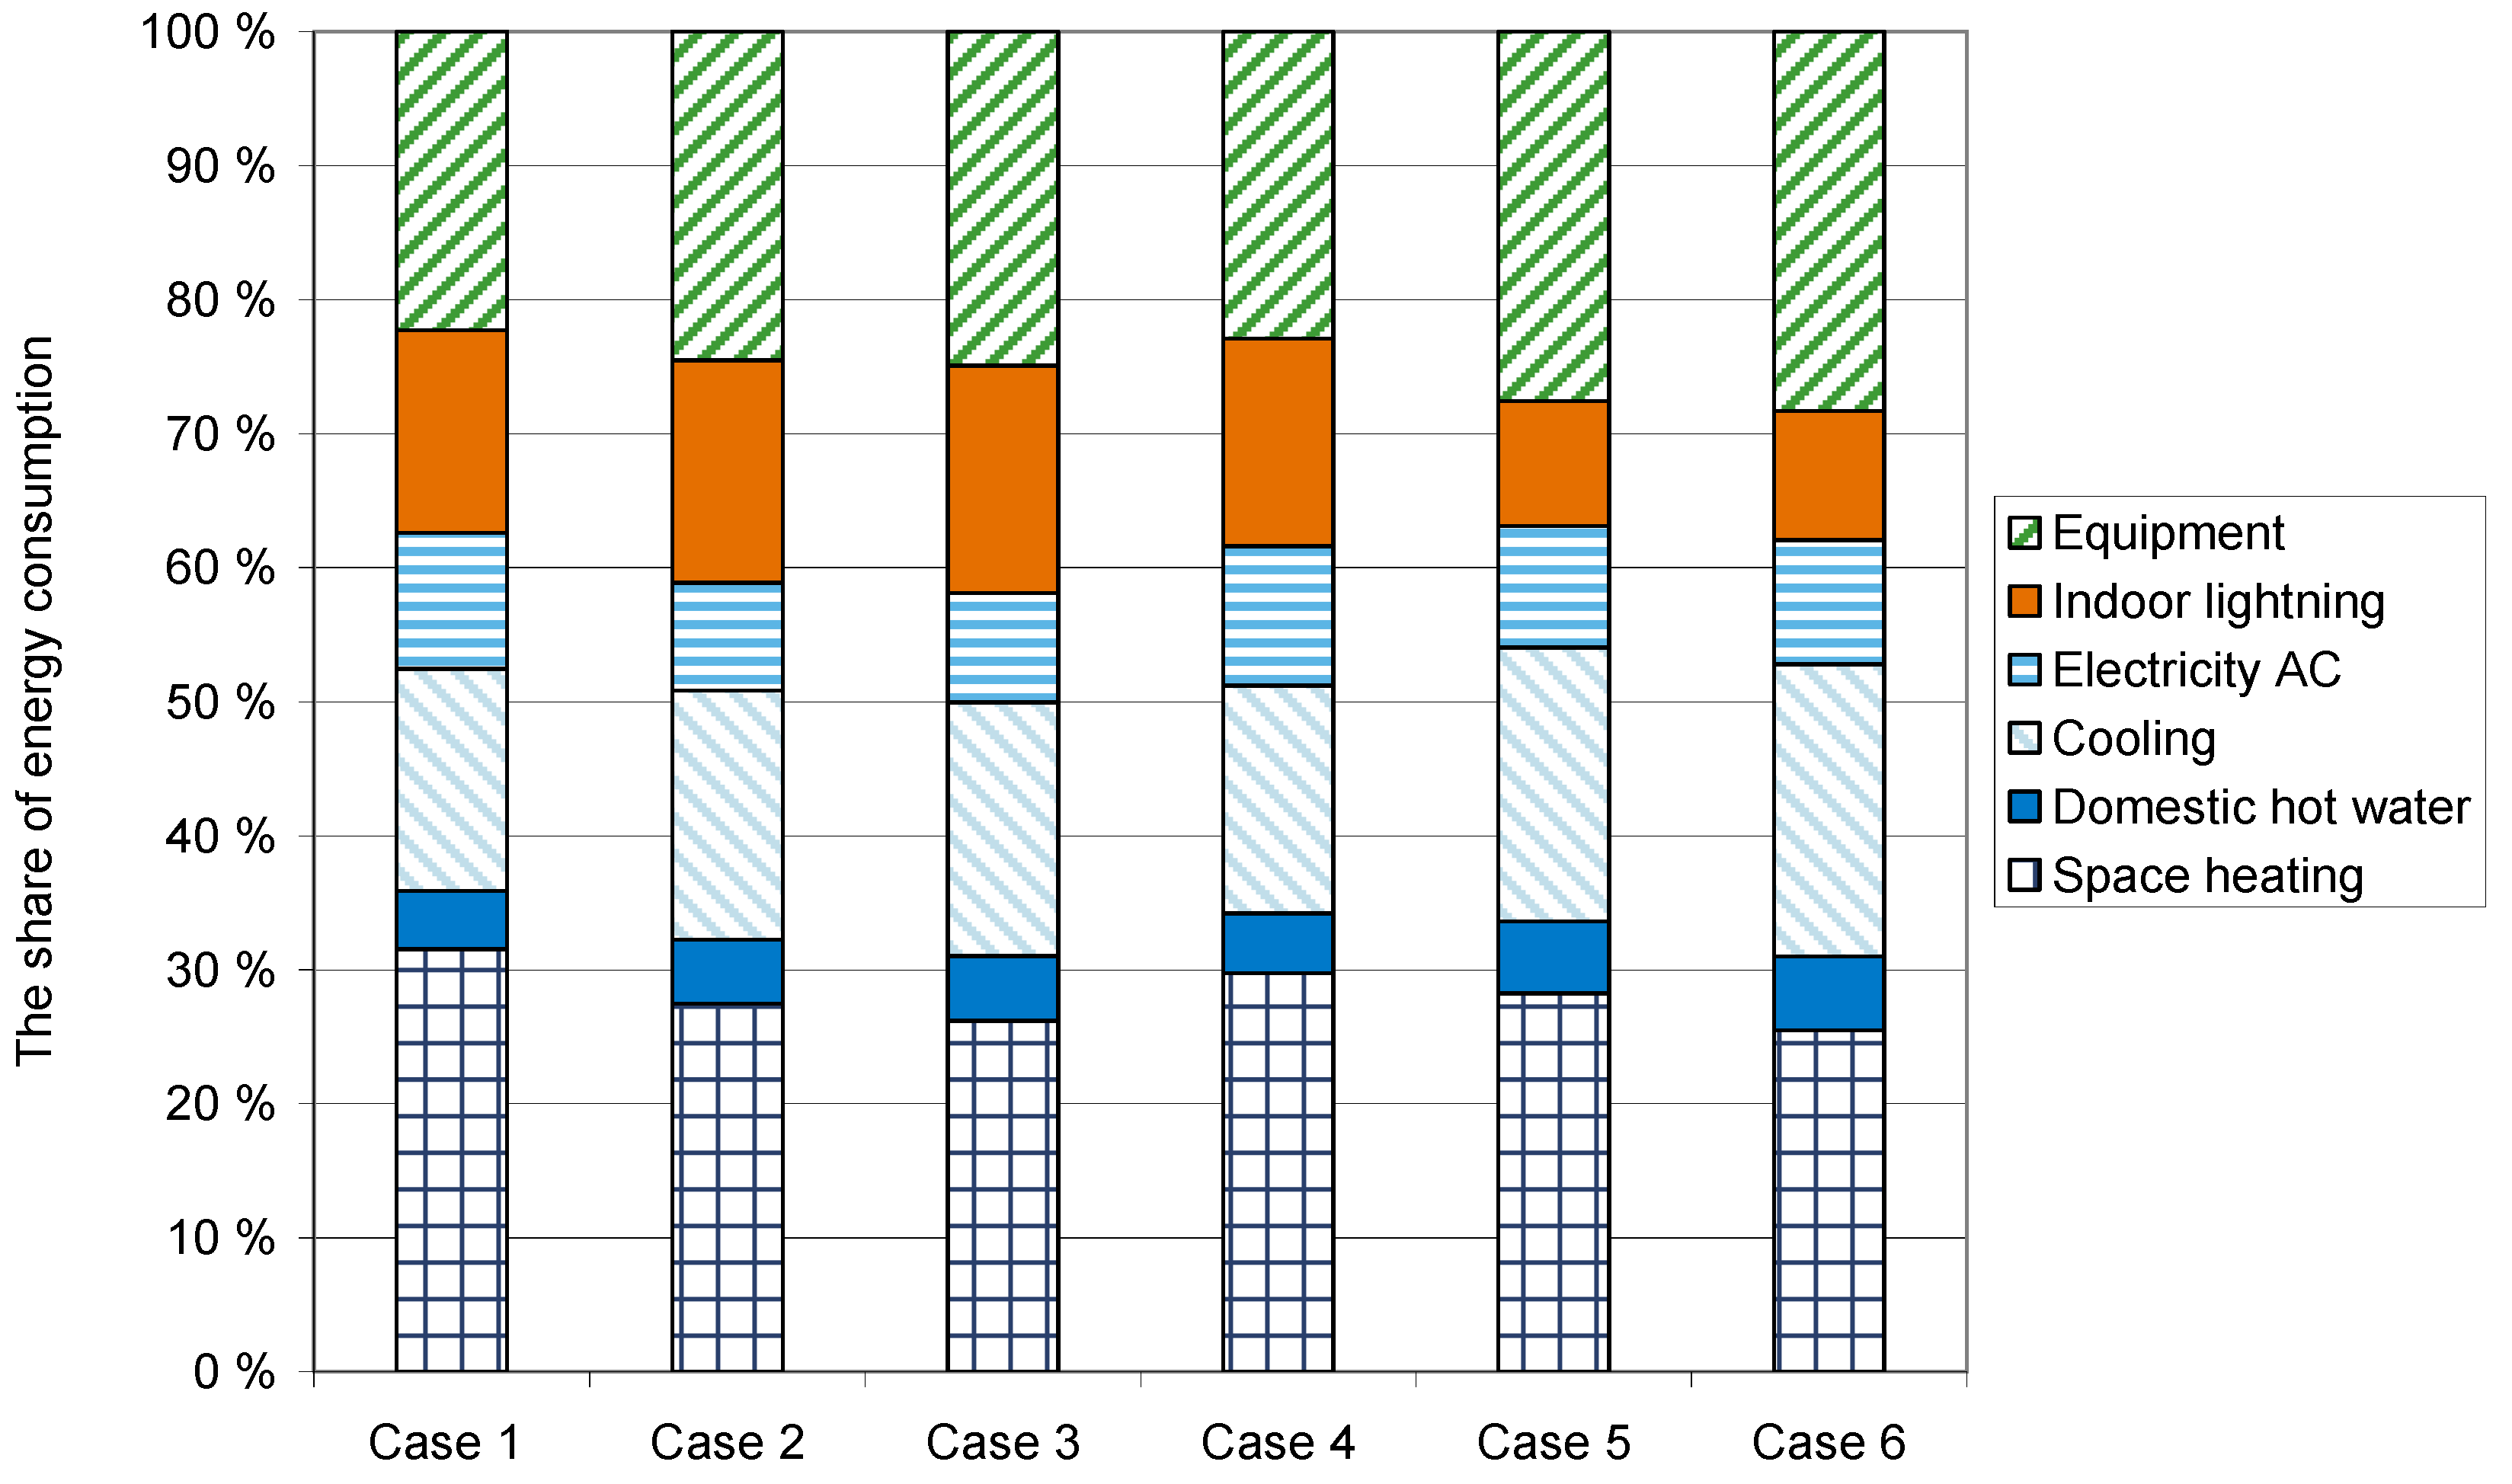
The shares of the total energy consumption are shown in
Figure 2. Due to the rather cold Finnish climate, space heating still represents a rather high share of the whole energy consumption, but it is not dominant as it used to be in older buildings (e.g., office buildings from 1970s). The shares of equipment and cooling are rather big. If all electricity use is added (equipment, indoor lightning, and AC electricity) the share is close to 50% of the total consumption. If the cooling is done with electricity the share is between 65–70%, evidently highlighting the importance of saving electricity. In office buildings the use of domestic hot water is typically very low, as can be seen in
Figure 2.
Figure 2.
The share of different energy use in different cases.
Figure 2.
The share of different energy use in different cases.
3.1. CO2 Equivalent Emissions
The Finnish Building code is very advanced with respect to reducing heat losses from buildings; e.g., the U-values and ventilation heat recovery, as well as air tightness of the building envelope, are required to be rather good. This can be clearly seen from the energy consumptions (
Figure 1). The CO
2 equivalent emissions of heating are also rather low due to the low energy consumption when average Finnish district heating, cooling and electricity are used as energy sources (
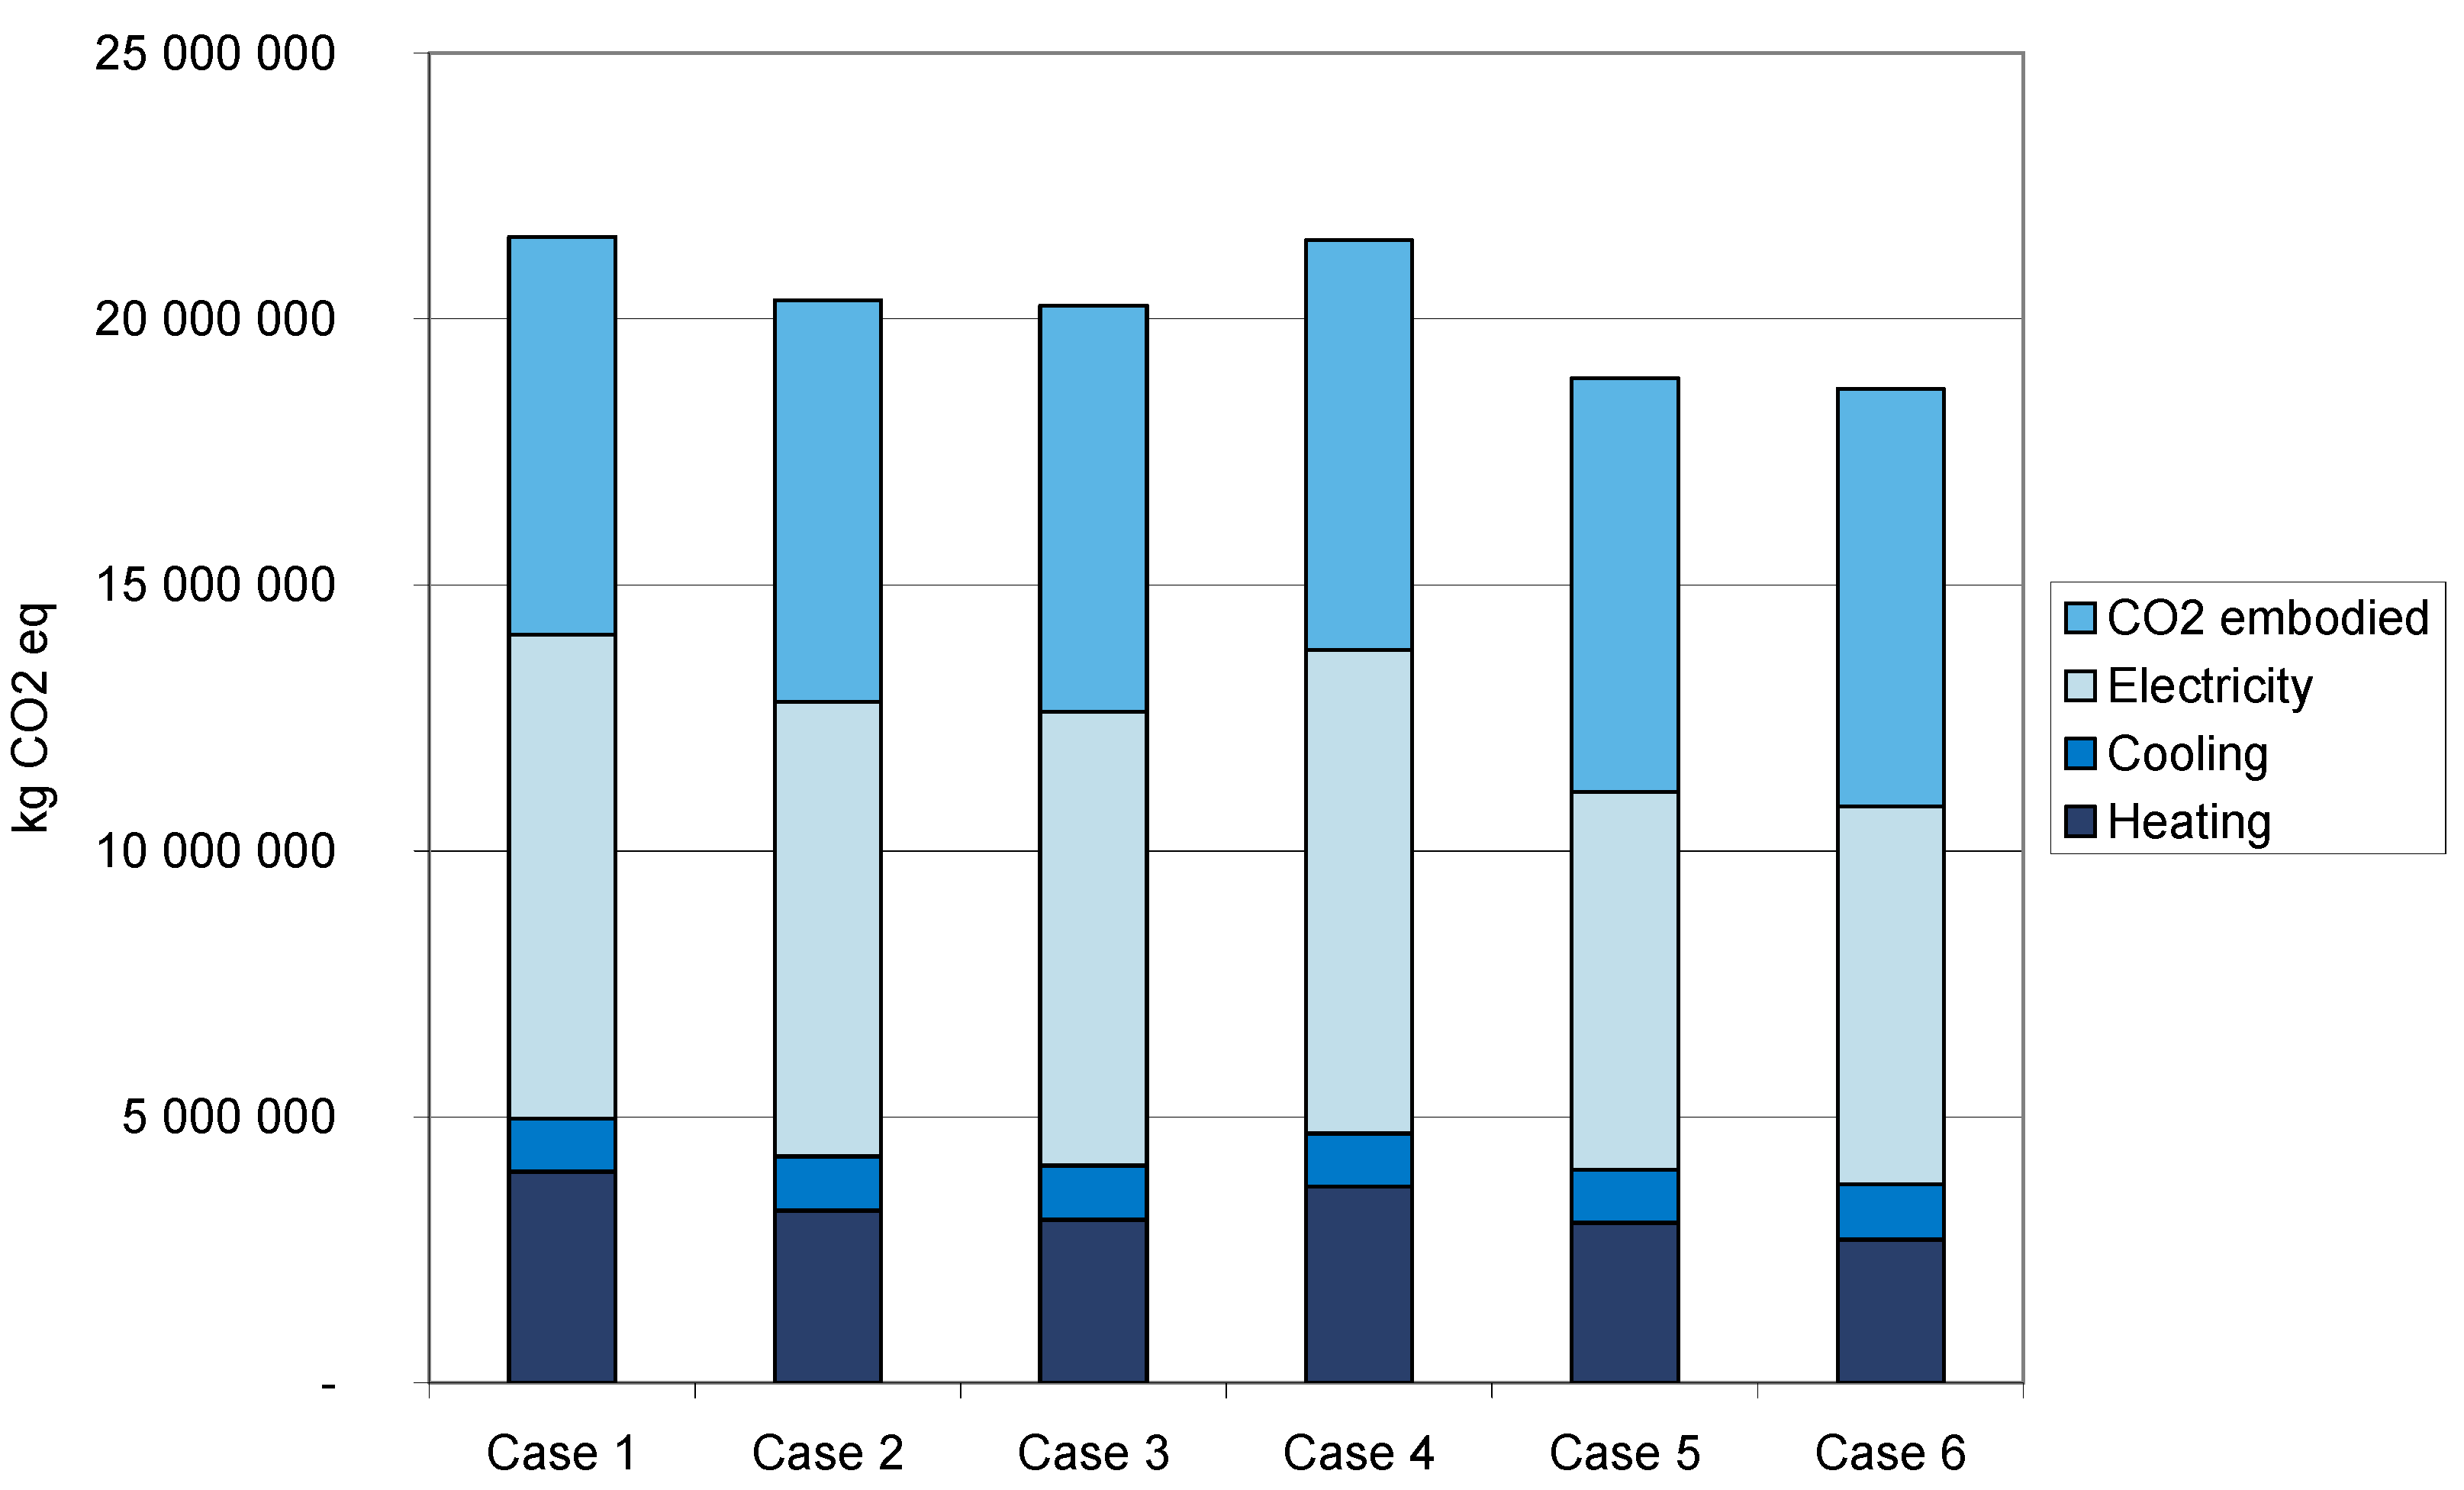
Figure 3). In
Figure 3 heating includes both space heating and domestic hot water.
Figure 3.
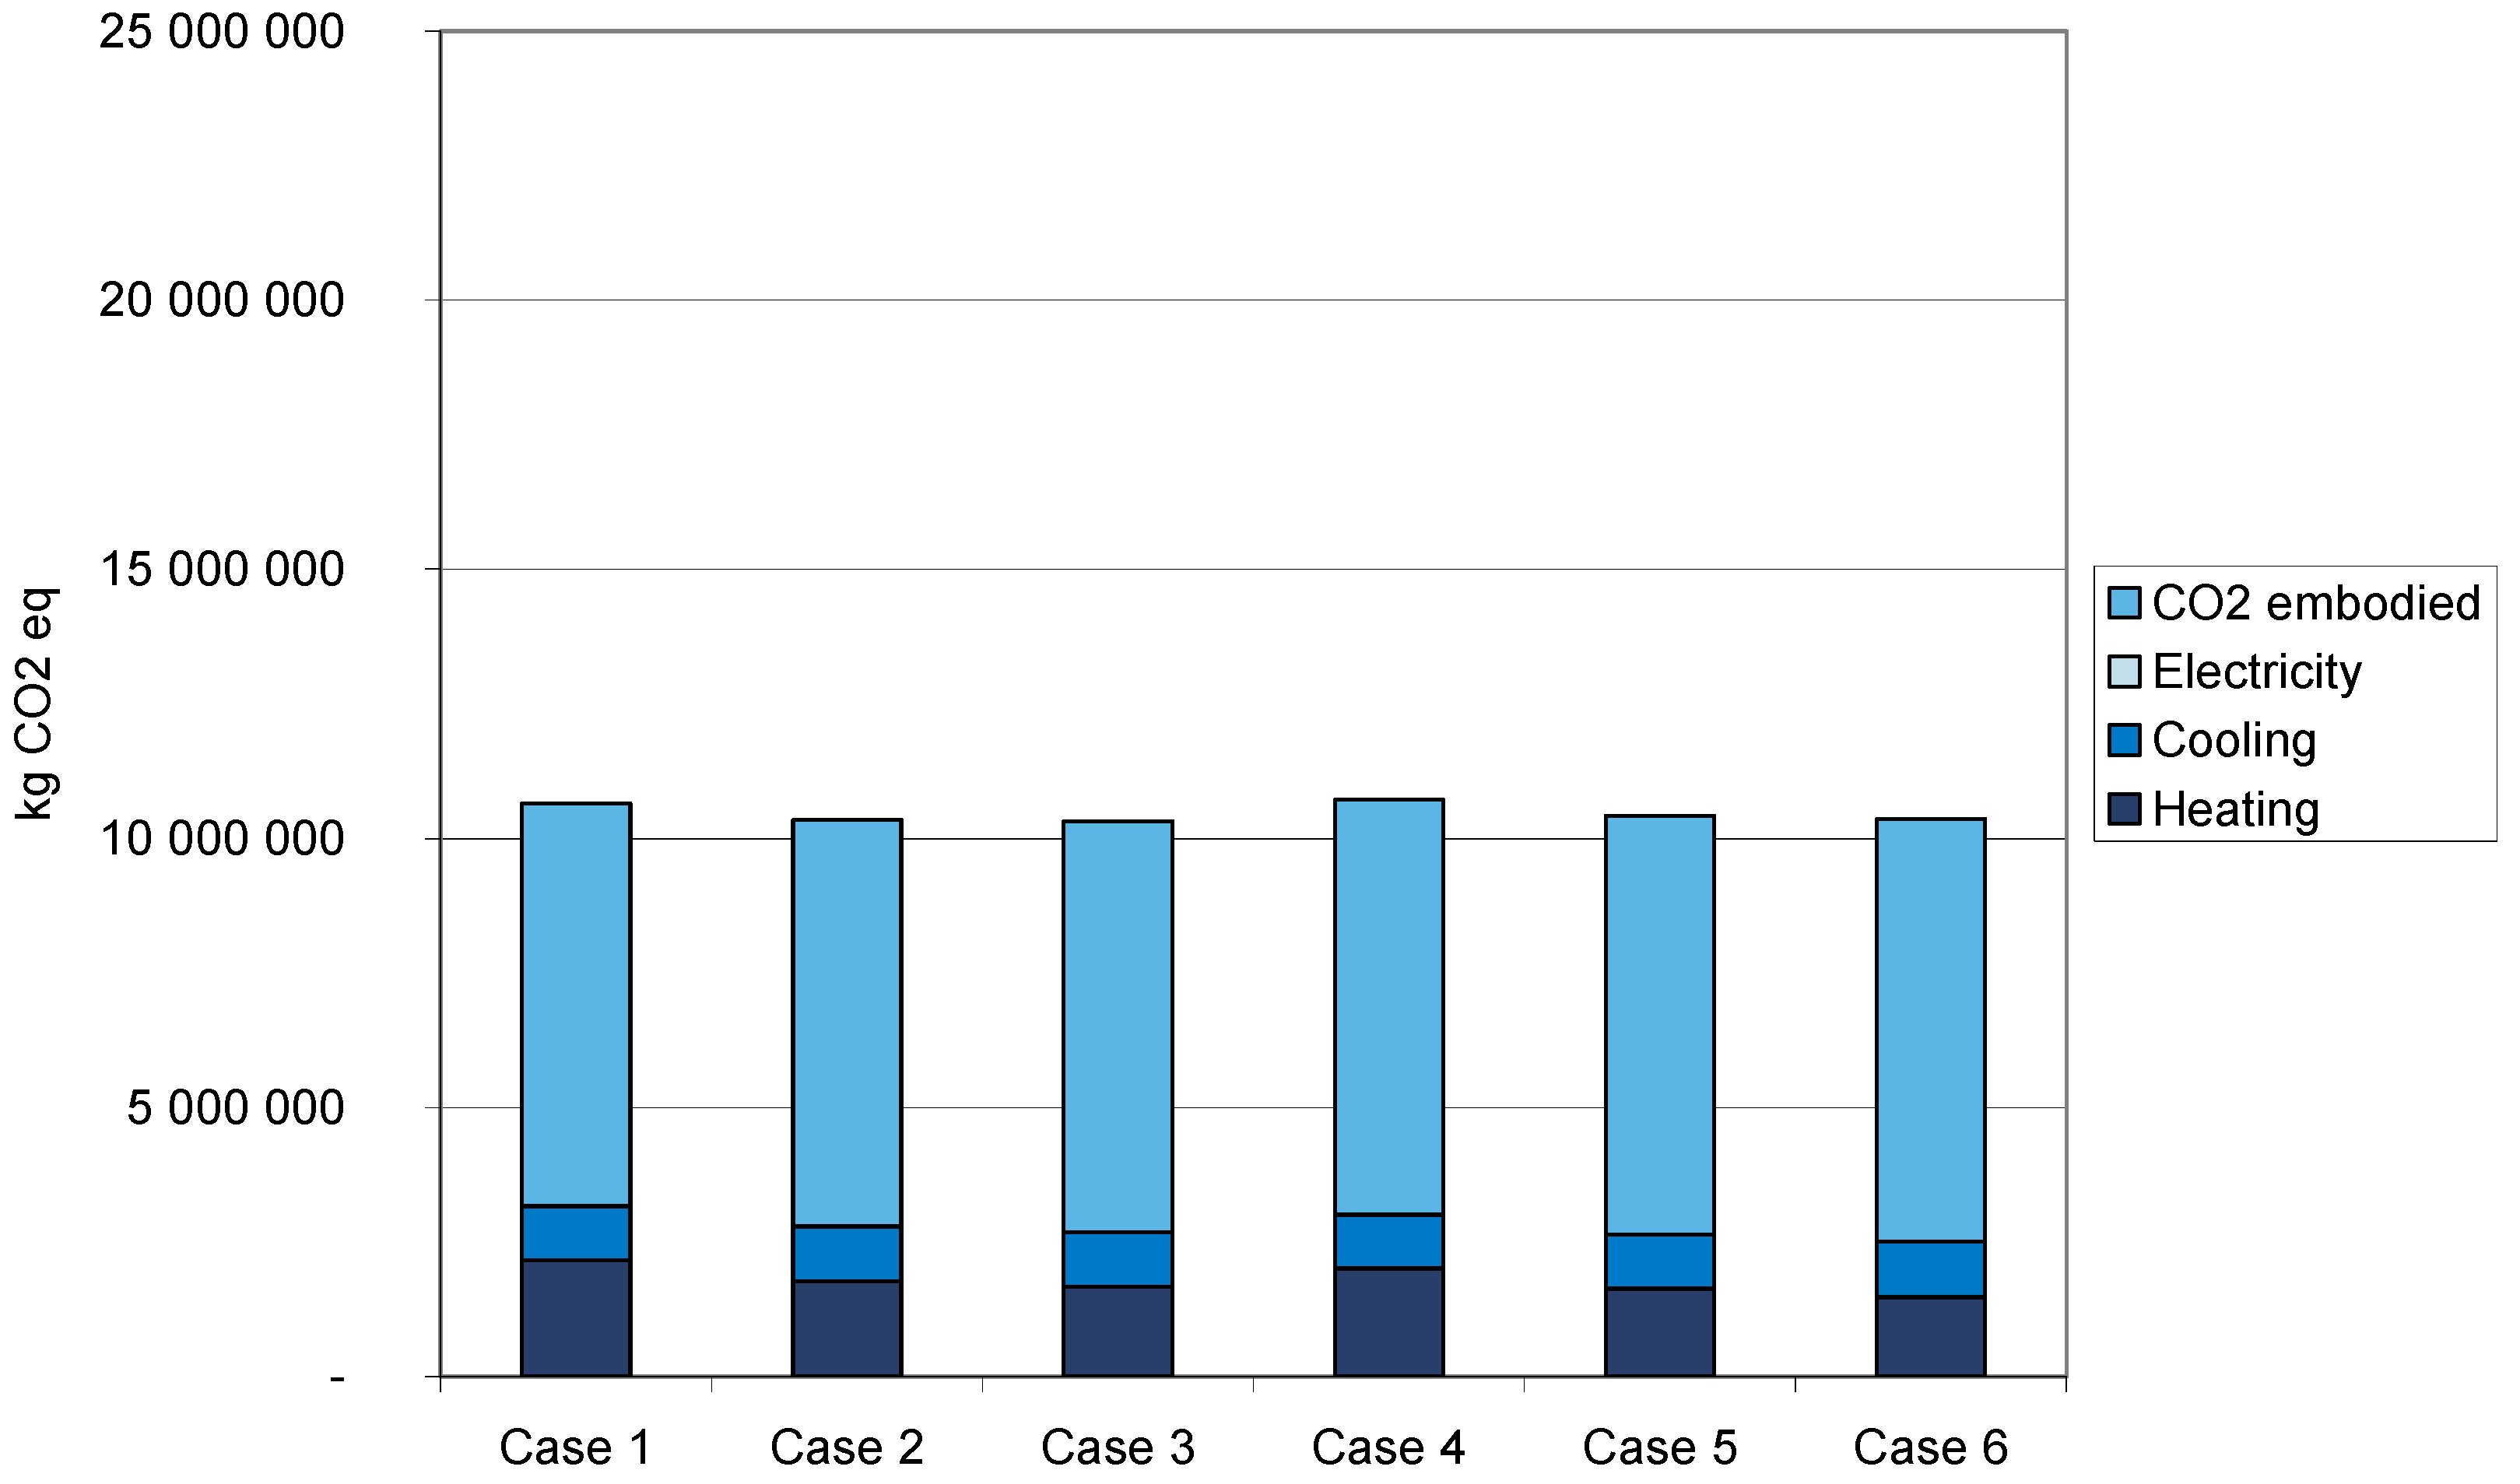
The share of each energy consumption and embodied CO2 in different cases when average district heating, cooling and electricity are used. The heating includes both space heating and domestic hot water heating.
Figure 3.
The share of each energy consumption and embodied CO2 in different cases when average district heating, cooling and electricity are used. The heating includes both space heating and domestic hot water heating.
Due to the low heating energy consumption the embodied CO
2 emissions and electricity are dominant components in the CO
2 emissions. That is actually rather surprising, since case 1 is the typical building code level in new office buildings, and only ventilation heat recovery is clearly better than the average in new buildings. In this study the embodied CO
2 includes energy consumption of building materials and products, and the use of raw materials and greenhouse gases, see
Section 2.4.
Evidently, if all the electricity used is generated from renewable energy sources and for district heating and cooling bio-fuels are used, the embodied CO
2 emissions have the highest share and the over all CO
2 equivalent emissions decrease dramatically (
Figure 4). However, the problem with renewable electricity is that the power plants produce renewable energy on a yearly basis. Thus, sometimes the electricity might originate from fossil fuels for a short period of a time if not enough electricity from renewable sources is available. The electricity produced by fossil fuels is substituted by renewable energy on a yearly basis to get the balance. Usually this means excess energy, e.g., from wind power.
Figure 4.
The share of each energy consumption and embodied CO2 equivalent in different cases when district heating, cooling from bio-fuels is used and electricity is from renewable energy sources.
Figure 4.
The share of each energy consumption and embodied CO2 equivalent in different cases when district heating, cooling from bio-fuels is used and electricity is from renewable energy sources.
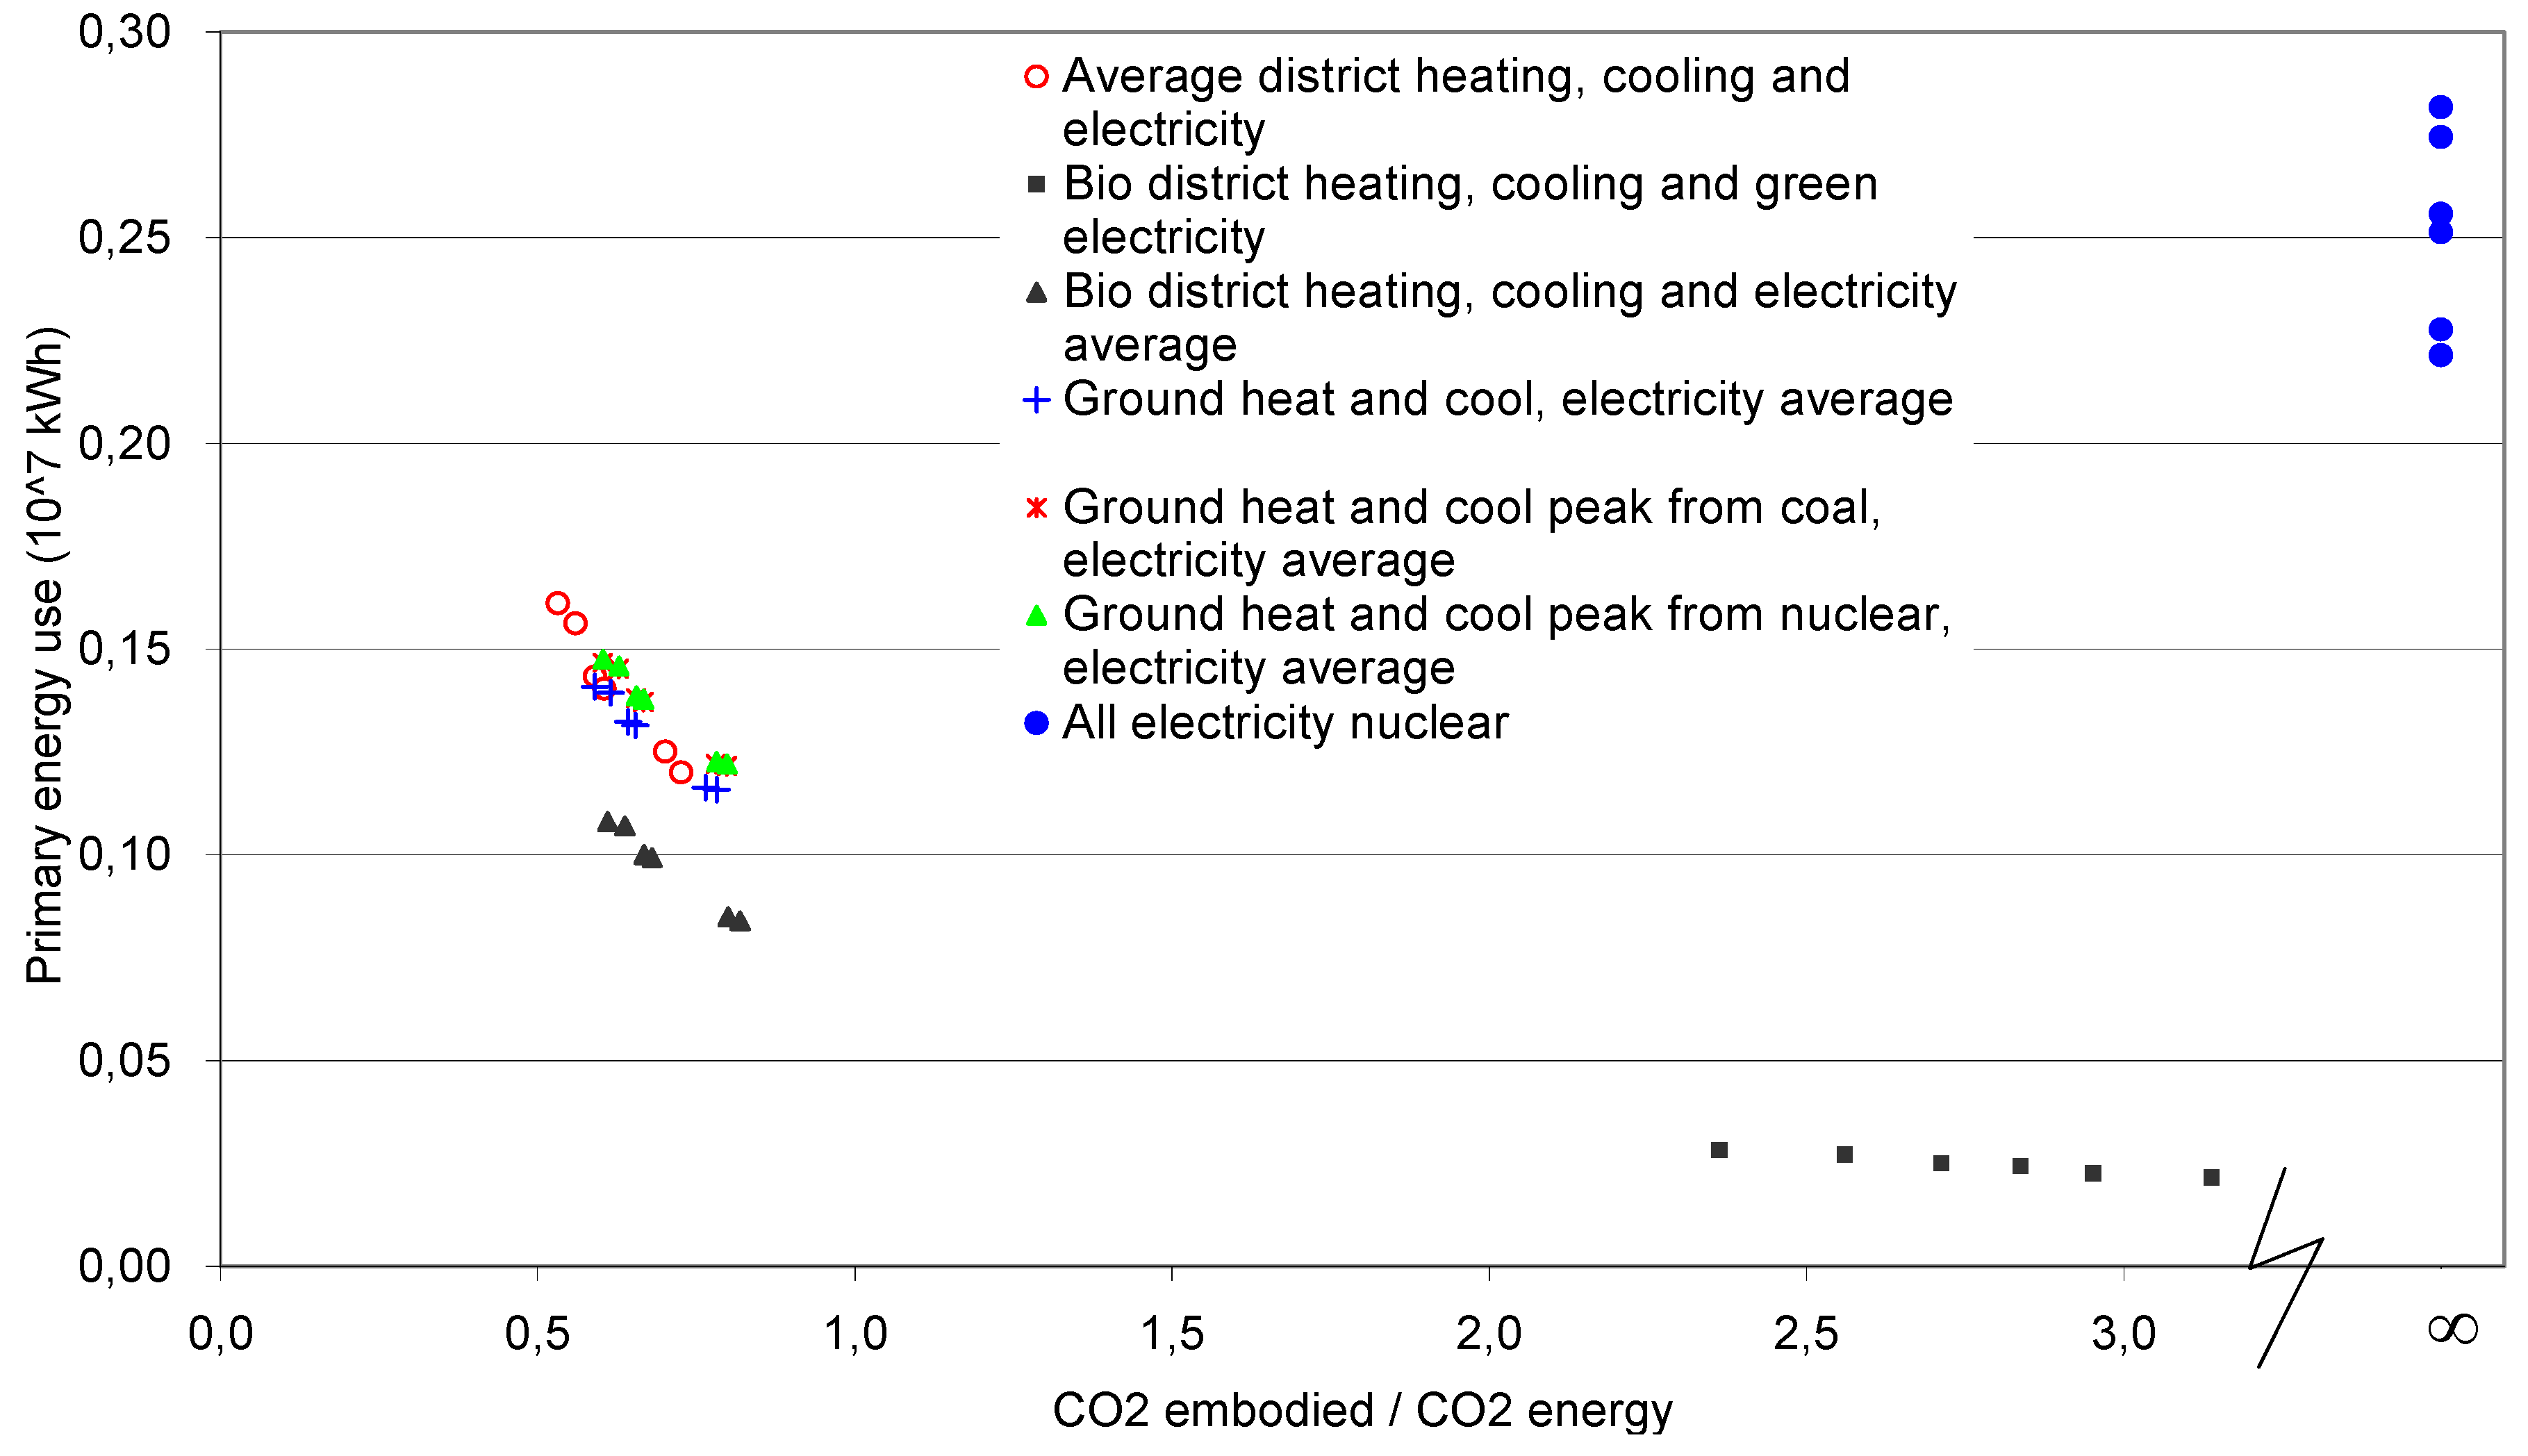
Figure 5 shows the primary energy consumption as a function of the relation between embodied and energy-derived CO
2 equivalent emissions. The CO
2 equivalent embodied corresponds to the CO
2 equivalent emissions from materials during their lifetime and CO
2 energy corresponds the CO
2 emissions from energy use in the building (heating, cooling and electricity). When all different options for heating, cooling and electricity sources were compared it can be clearly seen that the nuclear-based energy alternatives all ended up with rather high primary energy consumption and since the building energy use is carbon neutral, the embodied CO
2 emissions become dominant (
Figure 5).
If low primary energy is the target, then bio-based district heating systems seems to be effective as well as the use of electricity from renewable energy sources. Ground heat or the average local heating performed rather similarly in respect to primary energy use. This is because the ground heating systems use electricity but they can utilize the “free” thermal energy obtained from the ground. It can be seen that the local variations do have an effect on both primary energy use and CO
2 emission (
Figure 3,
Figure 4 and
Figure 5); in some parts the average Finnish values do have a good correlation to local energy production, but in some places the local production is closer to biomass-based production and in other locations closer to peak conditions (see
Table 3). The lowest primary energy use is in alternatives based on bio local heating, cooling and green electricity. The lowest relation between CO
2 embodied and CO
2 energy in addition to low primary energy use was with the cases based on bio local heating, cooling and average electricity. When average electricity or nuclear energy based electricity was used, there was a clear trend in that energy saving gave the highest primary energy use savings.
The lowest primary energy was achieved when bio-based or renewable energies were used in addition to local heating and cooling. Obviously the highest primary energy was when nuclear power was used. When the primary energy use and CO2 equivalent emissions are minimized the CO2 equivalent emissions originated from materials become rather dominant. In this study the CO2 equivalent emissions originated from building materials and products is between 2.4 to 3.1 higher compared to CO2 equivalent emissions originated from building energy use during running time when the building façade was non-wooden and the service life was 50 years.
Figure 5.
Primary energy consumption as a function of the relation between embodied and energy derivated CO2 equivalent emissions. The CO2 embodied corresponds to the CO2 emissions from materials during their life time and CO2 energy corresponds the CO2 emissions from energy use in the building (heating, cooling and electricity). The time period used in calculations is 50 years.
4. Discussion
Finland is committed to the EU’s 2020 targets which correspond to a 20% reduction in CO
2 emissions compared to 1990 levels [
16]. In addition, the Finnish Government has committed to cut down CO
2 emissions by 80% by the year 2050 compared to the levels of 1990 [
17].
The question is where we should target efforts to achieve these goals? At low CO
2 emission levels or low primary energy levels? The advantage of targeting low CO
2 levels, especially in energy consumption, is the fact that the CO
2 emissions are minimized, which is of course one of our major targets. However, considering only low CO
2 emissions in energy consumption still allows us consume rather high amounts of low CO
2 emitting energy [
18]. Many low polluting energy sources, e.g., wood, are natural resources which we shouldn’t waste. In addition the renewal period and the life cycle of the renewable energy source, must be considered as well. Hence low primary energy use should also be one of the priority targets since it reduces the use of natural resources.
Choosing the right energy source is a tricky question and is dependant on the location of the building. When only CO2 emissions are considered, nuclear power has a strong position, but when primary energy considerations are taken into account nuclear power loses its advantage. Renewable energies are obviously strong alternatives. However, especially with wind and solar energy, the supply and demand of energy do not always match. Therefore both daily and seasonal storage are often needed. Bio-fuel based local heating and cooling seem to perform well, both in respect to primary energy use and CO2 equivalent emissions, but there are big differences between average Finnish energy production and single power plants, e.g., the CO2 equivalent emissions might nearly double depending on the energy source and power plant type.
According to this study a building with efficient local heating as a heat source, and a building with ground heat (nuclear power used for complimentary electricity source) performed very similarly in respect to CO2 equivalent emissions. However, conclude from this that which alternative we choose is not important is dangerous. Hypothetically, if the use of local heating were to drop dramatically, the primary energy factor and CO2 equivalent emissions from electricity would rise, leading to an increase of the emissions from the ground heat system.
When all different options were compared the nuclear-based energy alternatives all ended up with rather high primary energy consumption and since the building energy use is carbon neutral, the embodied CO2 emissions become dominant. If low primary energy is the target then bio-based local heating systems seems to be effective as well as the use of electricity from renewable energy sources. Ground heat or the average local heating performed rather similarly in respect to primary energy use. This is because ground heating systems use electricity, but they can utilize the “free” thermal energy from the ground.
To target low CO2 levels, especially in energy consumption, is obviously one of our major objectives, but considering only low CO2 equivalent emissions in energy consumption might lead us to a wrong path; it does not limit our consumption of low CO2 emitting energy. That is naturally not our target since low polluting energy sources such as wood, pellets and nuclear power energy are also natural resources which we should use with care. Setting low primary energy use as a target reduces the use of natural resources.
Problems in the yearly calculations arise due to the fact that we always excluded when energy is needed, which is also very important, sometimes even crucial, to consider. An example of that might be under dimensioned ground heat solutions used in buildings, which cannot be used on very cold days and need typically supportive power in those days. In respect to emissions, this can be problematic if the extra power supplied to markets is produced with a polluting energy source. On the other hand, in the buildings where cooling is needed, ground heat has the advantage that it can be used during cooling periods as well.
This paper was based on a real building with already had a rather compact quadratic form, therefore the building geometry was not a variable in this study even though it is well known, as found in several studies (e.g., [
19,
20]), that the geometry of the building has a high impact on building energy consumption.
5. Conclusions
Current office buildings are becoming more and more energy efficient. Especially, while the importance of heating is decreasing, the share of electricity use is still increasing. When the CO2 equivalent emissions are considered, the CO2 equivalent emissions from embodied energy have an important share, indicating that the building materials have a high importance which is often ignored when only the energy efficiency of running a building is considered.
The reduction of energy use reduces both the primary energy use and CO2 emissions. The reduction of electricity use has a specially high importance for both primary energy use and CO2 equivalent emissions when fossil fuels are used. Often energy originated from fossil fuels is also used as a complimentary source of energy, thus the importance of reducing energy use and especially electricity originated from fossil sources has a high priority.
The lowest CO2 equivalent emissions were achieved when bio-based, renewable energies or nuclear power was used to supply energy for the office building. Evidently then the share of CO2 equivalent emissions from embodied energy from building materials and products became the dominant source for CO2 emissions.
The lowest primary energy was achieved when bio-based local heating or renewable energies were used in addition to local cooling. Obviously the highest primary energy was when nuclear power was used. When the primary energy use and CO2 equivalent emissions are minimized the CO2 equivalent emissions originated from materials become rather dominant. In this study the CO2 equivalent emissions originated from building materials and products is between 2.4 to 3.1 higher compared to CO2 equivalent emissions originated from building energy use during running time when the building façade was non-wooden and the service life was 50 years. This paper did not study the effect of building geometry.


