2. The Proposed STLF Strategy
The structure of the proposed STLF strategy, including a preprocessor and suggested hybrid forecast engine, is shown in
Figure 1. The focus of this paper is on the new hybrid forecast engine module.
Figure 1.
Structure of the proposed STLF strategy including the preprocessor and hybrid forecast engine.
Figure 1.
Structure of the proposed STLF strategy including the preprocessor and hybrid forecast engine.
However, before proceeding to this module, the applied preprocessor should be first introduced to describe the performance of the proposed STLF strategy. The preprocessor receives the input data of the proposed strategy, normalizes the data to bring all inputs to the same range, refines the inputs by the feature selection process and feeds the hybrid forecast engine by its selected inputs. The input data of the STLF strategy, shown by
S(
t) in
Figure 1, is as follows:
where
L(
t−1),…,
L(
t−
NL) are the historical values of load, since electrical load is dependent on its past values. The output of the STLF strategy is the load forecast of the next time interval, denoted by
L(
t) in
Figure 1. The time interval depends on the STLF forecast step; for instance, for an hourly load forecast,
t is measured in terms of hours. Electrical load is also dependent on exogenous variables (such as temperature and humidity), in addition to its past values. These exogenous variables are shown by
EX1 to
EXP in (1). Since, the inputs of (1) have different ranges (such as load and temperature); we linearly normalize all inputs and output to be within the range [0,1] to avoid the masking effect. Linear normalization is a simple and well-known mathematical transformation. Suppose that an input
x (such as load, temperature, humidity,
etc.) is in the range of [
xmin,
xmax]. Linear normalization of
x, to be within the range [0,1], is as follows:
where
xn indicates normalized value of
x in the range of [0,1]. Thus, each input is separately normalized based on its own minimum and maximum values. Also, the normalized variable
xn can easily be returned to the original range [
xmin,
xmax] by means of the inverse transform:
The output of the proposed hybrid forecast engine is in the normalized form, which is returned to the actual range by the inverse transform of (3). For each exogenous variable
i, both its forecast value
EXi(
t) and past values
EXi(
t−1),…,
EXi(
t−
Ni) (such as temperature forecast and past temperatures) are considered as the input data in (1). Choosing these exogenous variables is dependent on the engineering judgment and availability of data. For instance, while residential customers usually have high sensitivity to weather conditions (such as temperature), industrial loads are not so sensitive to weather parameters [
13]. A discussion about this matter can be found in [
2]. In (1),
NL and
N1 to
NP indicate order of back shift for load
L and
P exogenous variables
EX1 to
EXP, respectively. From a data mining viewpoint, these orders should be considered high enough so that no useful information is missed. In [
4], considering short-run trend, daily and weekly periodicity characteristics of hourly load time series, at least
NL =
N1 = … =
NP = 200 has been proposed. However, this results in a too large set of inputs
S(
t) in (1), which cannot be directly applied to a forecast engine. Moreover, this large set may include ineffective inputs, which complicate the construction of input/output mapping function of the STLF (
i.e., the mapping function of
S(
t)→
L(
t)) for the forecast engine and degrade its performance. Thus, the set of inputs
S(
t) should be refined by a feature selection technique such that a minimum subset of the most informative inputs is selected and the other unimportant features are filtered out. For this purpose, the two-stage feature selection technique proposed in our previous work [
16] is used here. This feature selection technique is based on the information theoretic criterion of mutual information and can evaluate both relevancy of each input with the output and redundant information among inputs. The preprocessor by means of the feature selection technique selects a subset of the most relevant and non-redundant inputs among
S(
t). Details of this feature selection technique can be found in [
16]. The selected inputs by the preprocessor are given to the proposed hybrid forecast engine (
Figure 1).
The proposed forecast engine is a multi-layer perceptron (MLP) neural network trained by a new stochastic search technique, i.e., a modified harmony search (MHS) algorithm. In the following, first the original harmony search (HS) algorithm is presented and then the proposed MHS is introduced. Finally, its application for training of the NN based forecast engine is described.
HS is an efficient population based stochastic search method, which was first developed by Geem
et al. [
17]. The idea of HS is based on mimicking the improvisation process of music players that improvise the pitches of their instruments to obtain better harmony [
18]. The harmony in music is analogous to the optimization solution, and the musician's improvisations are similar to local and global search schemes in optimization methods [
19]. Thus, HS has a good potential to be used as an optimization technique. Since its inception, HS has successfully been applied to several practical optimization problems [
18,
19,
20]. However, to the best of our knowledge, no research work has so far formulated application of HS (or any modified version of it) for NN training. Performance of HS, as an optimization method, can be summarized in the form of the following step by step algorithm:
Step 1. Parameter setup. HS has a few user defined parameters or set points, like the other stochastic search techniques (such as genetic algorithm, particle swarm optimization, differential evolution, etc.). HS parameters include harmony memory size (HMS), harmony memory considering rate (HMCR), pitch adjustingt rate (PAR), number of improvisations (NI), and bandwidth (BW). Similar to the other stochastic search techniques, the values of HS parameters should be first set by the user before executing the HS.
Step 2. Initialization of harmony memory. Consider an optimization problem with
ND decision variables
x1,…,
xND. To solve this optimization problem, harmony memory (HM) of HS is a matrix as follows:
Each individual of the HS population is called a harmony vector (HV), which includes the decision variables x1,…,xND. HMS indicates number of harmony vectors of HS population. In (4), the superscript of each HV represents its number from 1 to HMS. In other words, the rows of HM matrix are individuals or harmony vectors of HS. To initialize HM, the decision variables of each of its HVs are randomly initialized within their allowable limits. Then, the value of the objective function, denoted by OF(.), is computed for each HV. Moreover, an improvisation counter IC is set to zero. For training of the MLP neural network (the forecast engine), the decision variables x1,…,xND are the weights of the MLP. Also, the objective function or OF(.) is the error function of the training phase of the MLP neural network that should be minimized. This error function will be introduced later.
Step 3. Improvisation of a new harmony. To produce a new harmony vector
![Energies 04 00488 i003]()
, each of its elements
(1 ≤
i ≤
ND) is generated based on the following cases:
Case 1. Memory consideration without pitch adjustment: If Rand1 < HMCR & Rand2 > PAR, then randomly select among the stored values of ith decision variable in the HM, i.e., {,,…,}.
In the above rule, Rand1 and Rand2 are two randomly generated numbers with uniform distribution in the range of [0,1]. To produce each decision variable (1 ≤ i ≤ ND) of the new harmony vector HVnew, these two random numbers are separately generated. The ith column of HM contains the previously stored values of ith decision variable, which in this case (Rand1 < HMCR & Rand2 > PAR), is selected among them. As described in step 1, HMCR and PAR are two user defined parameters of HS in the interval [0,1]. Thus, the probability of this case is HMCR × (1 − PAR).
Case 2. Memory consideration with pitch adjustment: If
Rand1 < HMCR &
Rand2 < PAR, then randomly select
among {
,
,…,
}. Moreover, pitch adjustment is also executed in this case as follows:
where
Rand3 is a random number uniformly distributed in the range of [−1,1]. Thus, a random number in the range of [−
BW,
BW] is added to the selected
in this case. As mentioned in Step 1,
BW is a user defined parameter of HS. The probability of this case is HMCR × PAR.
Case 3. Randomization: If
Rand1 > HMCR, then randomly generate
within its allowable range. In this case,
is selected from its entire feasible range not limited to those stored in the HM. The probability of this case is (1 − HMCR). After generating all decision variables
(1 ≤
i ≤
ND) based on the above three cases, the new harmony vector
![Energies 04 00488 i005]()
is produced.
Step 4. Update HM. The worst HV of HM owning the highest value of the objective function (the error function of the training phase of the MLP neural network) is found. If the produced HVnew has a lower OF(.) value than the worst HV, HVnew is included in the HM and instead the worst HV is excluded from the HM. Otherwise, the produced HVnew is disregarded and the HM does not change.
Step 5. Stopping condition. Increment the improvisation counter, i.e., IC = IC + 1. If IC < NI (number of improvisations), go back to Step 3; otherwise, terminate the HS algorithm and return the best HV of HM, owning the lowest OF(.) value, as the final solution of the optimization problem.
Here, the
BW parameter is adaptively fine-tuned along the improvisations of HS. In each improvisation,
BW is set to the standard deviation of HS population in the HM, as proposed in [
18]. To convert this HS to the proposed modified HS (MHS), its improvisation and HM updating mechanisms (Steps 3 and 4 of the above algorithm) are improved. For this improvement, two points deserve more attention. Although HS can efficiently use the information content of its harmony vectors, the gradient of HVs is not considered in the improvisation, while the gradient information is usually effective in the search process illustrating further useful search directions in the solution space. Moreover, despite the high diversity of HS search process, it does not focus on the promising areas of the solution space. However, an effective stochastic search technique should also be able to concentrate on promising areas of the solution space and enhance the quality of the potential solution in the promising region. Considering these two points, a new mutation operator is added to the improvisation (Step 3) of HS. Suppose that the output of the mutation operator is shown by
![Energies 04 00488 i006]()
. Each of its elements
(1 ≤
i ≤
ND) is produced as follows:
where
is the
ith element (decision variable) of the best HV, owning the lowest
OF(.) value, of the current HM;
and
indicate the
ith element of two randomly selected harmony vectors
j and
k of the current HM, respectively;
β is a scaling factor controlling the effect of the differential variation. The mutation operation of (6) has been inspired from the mutation operation of differential evolution (DE) algorithm [
21]. However, the random individuals
j and
k of DE mutation operation are selected one time for all elements of the new individual. On the other hand, in the mutation operation of (6), the random harmony vectors
j and
k are separately selected for each element
of the new individual
. In this way, the proposed mutation operation can benefit from higher diversity in its search process and is also more compatible with the improvisation of HS that separately generates each element
of
HVnew. In step 3 of the proposed MHS, the mutation operation of (6) is executed in addition to the improvisation of HS. In other words, both
HVnew and
. are produced by the improvisation and mutation operation, respectively, in the step 3 of the MHS. Then, step 4 of the MHS is sequentially performed for the two newly generated harmony vectors
HVnew and
, respectively, to update the HM. In other words,
HVnew is first compared with the worst HV of the HM as described in the step 4 of the HS algorithm. If it is replaced by
HVnew , the new worst HV of the HM is found. Similarly,
is compared with the newly found worst HV and replaces it provided that
has a lower
OF(.)value than it.
The proposed MHS saves the positive characteristics of the original HS (such as its high exploration capability to search different areas of the solution space), since the new operator of the MHS is performed in addition to the improvisation of HS. At the same time, the MHS can remedy the two problems of HS. The proposed mutation operation of (6), by computation of difference between two randomly chosen harmony vectors from the HM, determines a function gradient in a given area (not in a single point), and so can effectively employ the gradient information in its search process. Moreover, this mutation operation searches around the best harmony vector of the HM (, 1 ≤ i ≤ ND) in each iteration. If a promising area is found along the iterations, it is represented by the best HV of the HM and thus the MHS can search this area and find good solutions within it.
After introducing the proposed MHS, its application for training of the NN based forecast engine is presented. For this purpose, as previously described, the decision variables
x1,…,
xND of (4) are considered as the weights of the MLP neural network. For instance, if the MLP has 20 neurons in the input layer (corresponding to 20 selected inputs by the preprocessor), 10 neurons in the hidden layer and one neuron in the output layer, it will have 20 × 10 + 10 × 1 = 210 weights. These 210 weights are considered as
x1,…,
xND of the MHS (
ND = 210). We should also determine the
OF(.)of the MHS or the error function of the MLP neural network. To train a MLP neural network, the error function can be selected as the training error or validation error. Here, validation error is selected as the error function of the MLP, since it can better evaluate the generalization performance of the NN (generalization is a measure of how well the NN performs on the actual problem once training is complete) [
22,
23].
Finally, the performance of the whole proposed STLF strategy, shown in
Figure 1, can be summarized as the following stepwise procedure:
Step 1. Preprocessor normalizes input data and selects the most informative inputs for the STLF.
Step 2. Using the selected inputs of the preprocessor, the hybrid forecast engine is trained by the proposed MHS. The decision variables x1,…,xND of the final solution of the MHS (the best HV of the last iteration) are considered as the weights of the NN based forecast engine.
Step 3. After training the MLP neural network and determining its weights, it is ready to forecast the future hourly loads. The MLP has one neuron in its output layer for predicting load of the next time interval,
i.e.,
L(
t) (
Figure 1). Multi-period STLF (e.g., prediction of load for the next 24 hours) is reached via recursion,
i.e., by feeding input variables with the forecaster’s outputs. For instance, predicted load for the first hour is used as
L(
t−1) for the load forecast of the second hour provided that
L(
t−1) is among the selected inputs for the forecast engine.
3. Numerical Results
As in any research area, in STLF it is important to allow the reproduction of one’s results. The only way of doing that is using public domain data sets. Two real-life STLF test cases are considered in this paper to evaluate the performance of the proposed forecast strategy. The first STLF test case is related to the Pennsylvania-New Jersey-Maryland (PJM) power system, which is a well-established electricity market in the U.S. The employed data for load and weather parameters (including temperature and humidity) of this test case are publicly available data obtained from websites [
24,
25]. The set of inputs
S(
t), shown in (1), is constructed from the historical values of load and historical and forecast values of the two exogenous variables. Then, the proposed STLF strategy, including the preprocessor and hybrid forecast engine, is executed by the constructed data based on the step by step procedure of the previous section. Its obtained results for day-ahead STLF of the PJM test case are shown in
Table 1 and compared with the results of five other well-known forecast methods including multi-variate ARMA (Auto-Regressive Moving Average) time series, RBF (Radial Basis Function) neural network, MLP neural network trained by BR (Bayesian Regularization) learning algorithm, MLP neural network trained by BFGS (Broyden, Fletcher, Goldfarb, Shanno) learning algorithm, and MLP neural network trained by LM (Levenberg-Marquardt) learning algorithm. The five benchmark methods of
Table 1 have been frequently used in the literature for load forecast of power systems such as [
2,
5,
14,
15,
22]. The reported results in
Table 1 are in terms of well-known error criterion of MAPE (mean absolute percentage error) defined as follows:
where
Lact(
t) and
Lfor(
t) represent actual and forecasted values of load in hour
t, respectively;
NH indicates number of hours in the forecast horizon. Here,
NH = 24 for day ahead STLF. Four test weeks corresponding to the four seasons of 2009 (including the third weeks of February, May, August, and November) are considered for this numerical experiment indicated in the first column of
Table 1. This is to represent the whole year in the numerical experiments. The MAPE value for each test week, shown in
Table 1, is the average of seven MAPE values of its corresponding forecast days. Also, the average result of the four test weeks is shown in the last row of
Table 1. For the sake of a fair comparison, all forecast methods of
Table 1 have the same training period including 50 days prior to each forecast day. Also, all of these methods have the same set of inputs
S(
t) and the same preprocessor (
Figure 1). Thus, each forecast method is fed by the same selected inputs, since the purpose of this numerical experiment is comparison of the efficiency of different forecast engines.
Table 1.
Comparison of the proposed hybrid forecast engine with five other prediction methods for day-ahead STLF of the PJM test case in the four test weeks of year 2009 (the reported results are in terms of MAPE criterion).
Table 1.
Comparison of the proposed hybrid forecast engine with five other prediction methods for day-ahead STLF of the PJM test case in the four test weeks of year 2009 (the reported results are in terms of MAPE criterion).
| TestWeek | Multi-VariateARMA (%) | RBF (%) | MLP + BR (%) | MLP + BFGS (%) | MLP + LM (%) | Proposed (%) |
|---|
| Feb | 4.10 | 2.38 | 2.55 | 2.76 | 2.17 | 1.44 |
| May | 4.45 | 3.06 | 2.63 | 2.85 | 2.44 | 1.91 |
| Aug | 3.09 | 2.01 | 2.61 | 2.59 | 1.86 | 1.10 |
| Nov | 3.01 | 2.24 | 2.28 | 2.63 | 1.75 | 1.13 |
| Average | 3.66 | 2.42 | 2.52 | 2.71 | 2.05 | 1.39 |
We observe from
Table 1 that the proposed hybrid forecast engine outperforms all the other forecast methods shown in
Table 1. The proposed hybrid forecast engine has both the lowest average MAPE, shown in the last row of
Table 1, and the lowest MAPE of each test week. The superiority of the proposed forecast engine compared with the multi-variate ARIMA time series technique, RBF neural network, and MLP neural network trained by BR, BFGS and LM learning algorithms is related to its efficient training mechanism,
i.e., MHS. MHS can effectively search the solution space and optimally determine the values of the weights for the NN based forecast engine leading to its high STLF accuracy. To better illustrate this matter, in
Table 2, the proposed MHS is compared with five other stochastic search techniques, including simulated annealing (SA), genetic algorithm (GA), particle swarm optimization (PSO), differential evolution (DE) and HS for training of the NN based forecast engine. For instance, in the first benchmark method of
Table 2, the proposed MHS is replaced by SA (
i.e., SA trains the NN based forecast engine instead of MHS) and obtained STLF results from the forecast engine are reported. The results of the other benchmark methods of
Table 2 have been obtained similarly. All methods of
Table 2 have the same training period, selected inputs and four test weeks like the methods of
Table 1. The reported results for each stochastic search method in
Table 2 are average results of ten trial runs with random initializations. The user defined parameters of each method are fine-tuned by the search procedure proposed in [
26], which is an efficient cross-validation technique. As seen from
Table 2, the proposed MHS outperforms all other stochastic search methods. Using the proposed MHS as the training mechanism of the NN based forecast engine leads to the lowest MAPE of each test week. Moreover, MHS has considerably lower average MAPE than the other stochastic search methods (indicated in the last row of
Table 2). By combining positive characteristics of HS and new mutation operator, the proposed MHS can benefit from both high exploration capability to avoid being trapped in local minima and high ability to efficiently search promising areas of the solution space.
Table 2.
Comparison of the proposed MHS with five other stochastic search techniques for day-ahead STLF of the PJM test case in the four test weeks of year 2009 (the reported results are in terms of MAPE criterion).
Table 2.
Comparison of the proposed MHS with five other stochastic search techniques for day-ahead STLF of the PJM test case in the four test weeks of year 2009 (the reported results are in terms of MAPE criterion).
| Test Week | SA (%) | GA (%) | PSO (%) | DE (%) | HS (%) | MHS (%) |
|---|
| Feb | 3.98 | 2.68 | 2.39 | 2.11 | 1.87 | 1.44 |
| May | 4.86 | 3.46 | 2.68 | 2.35 | 2.21 | 1.91 |
| Aug | 2.69 | 2.38 | 2.37 | 2.21 | 1.51 | 1.10 |
| Nov | 3.17 | 3.04 | 2.69 | 2.33 | 1.53 | 1.13 |
| Average | 3.68 | 2.89 | 2.53 | 2.25 | 1.78 | 1.39 |
Table 3.
Comparison of the STLF results of the proposed strategy with the STLF results of the PJM ISO for the four test weeks of year 2009 (the reported results are in terms of MAPE criterion).
Table 3.
Comparison of the STLF results of the proposed strategy with the STLF results of the PJM ISO for the four test weeks of year 2009 (the reported results are in terms of MAPE criterion).
| Test Week | PJM ISO (%) | Proposed Strategy (%) |
|---|
| Feb | 4.37 | 1.44 |
| May | 6.49 | 1.91 |
| Aug | 3.12 | 1.10 |
| Nov | 3.50 | 1.13 |
| Average | 4.37 | 1.39 |
In
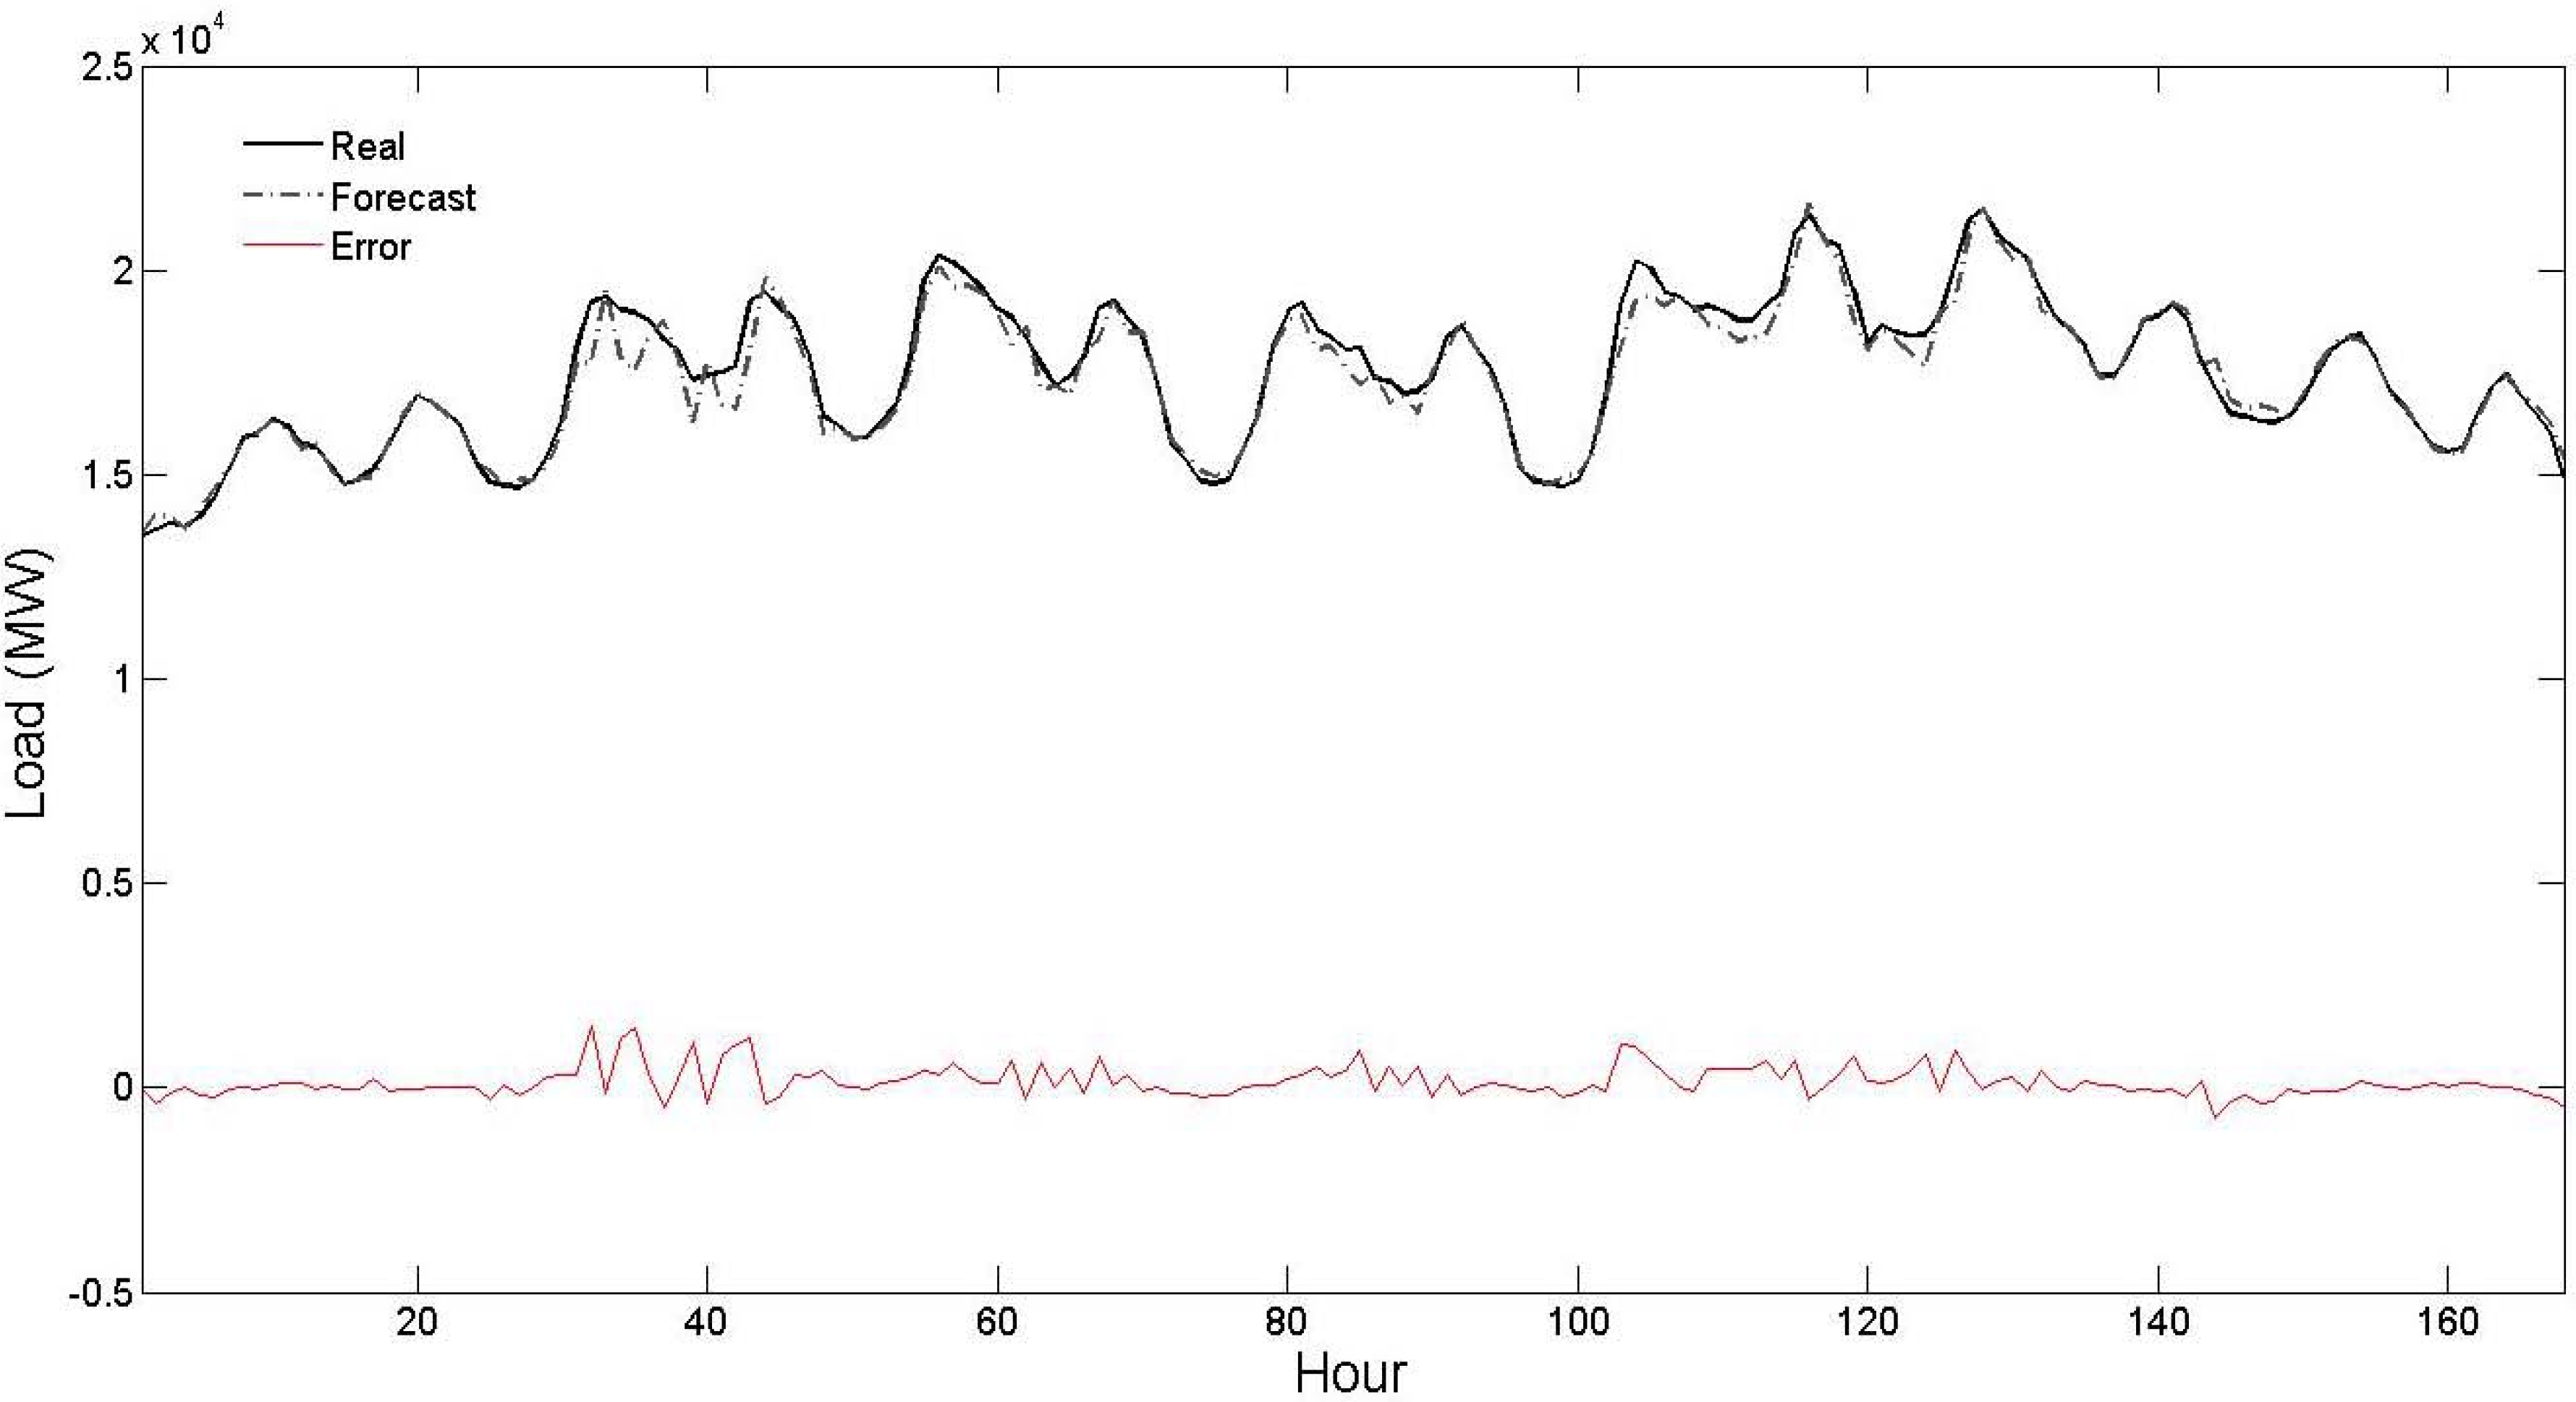
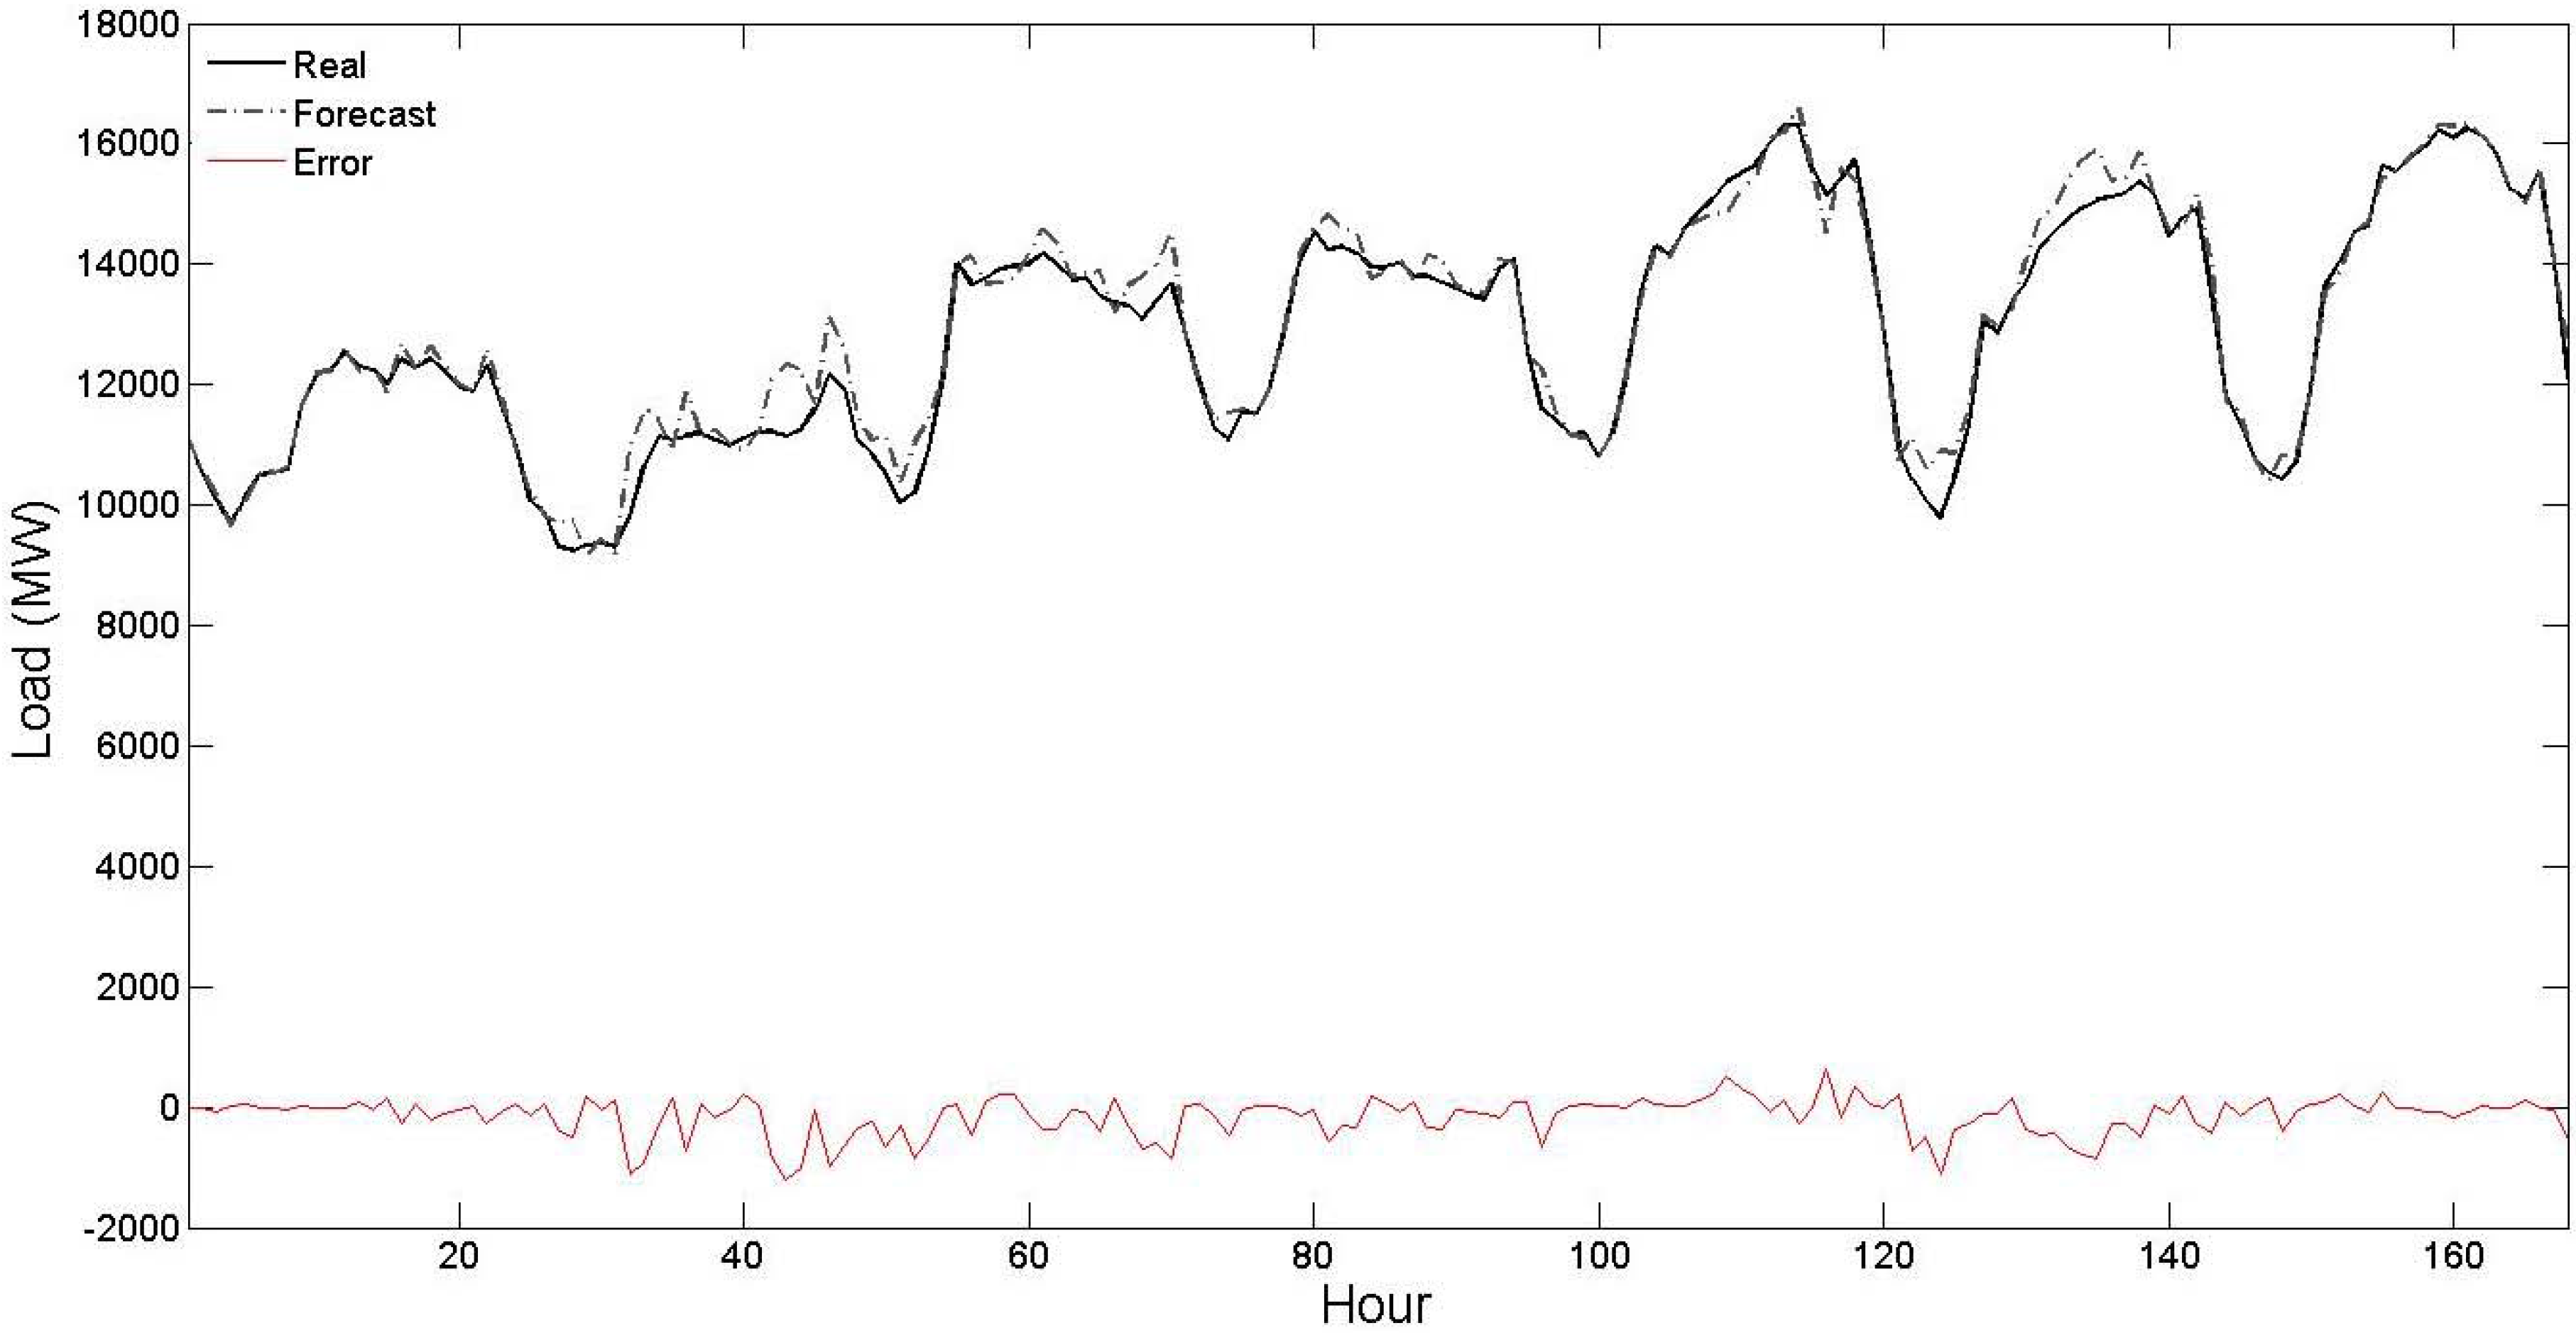
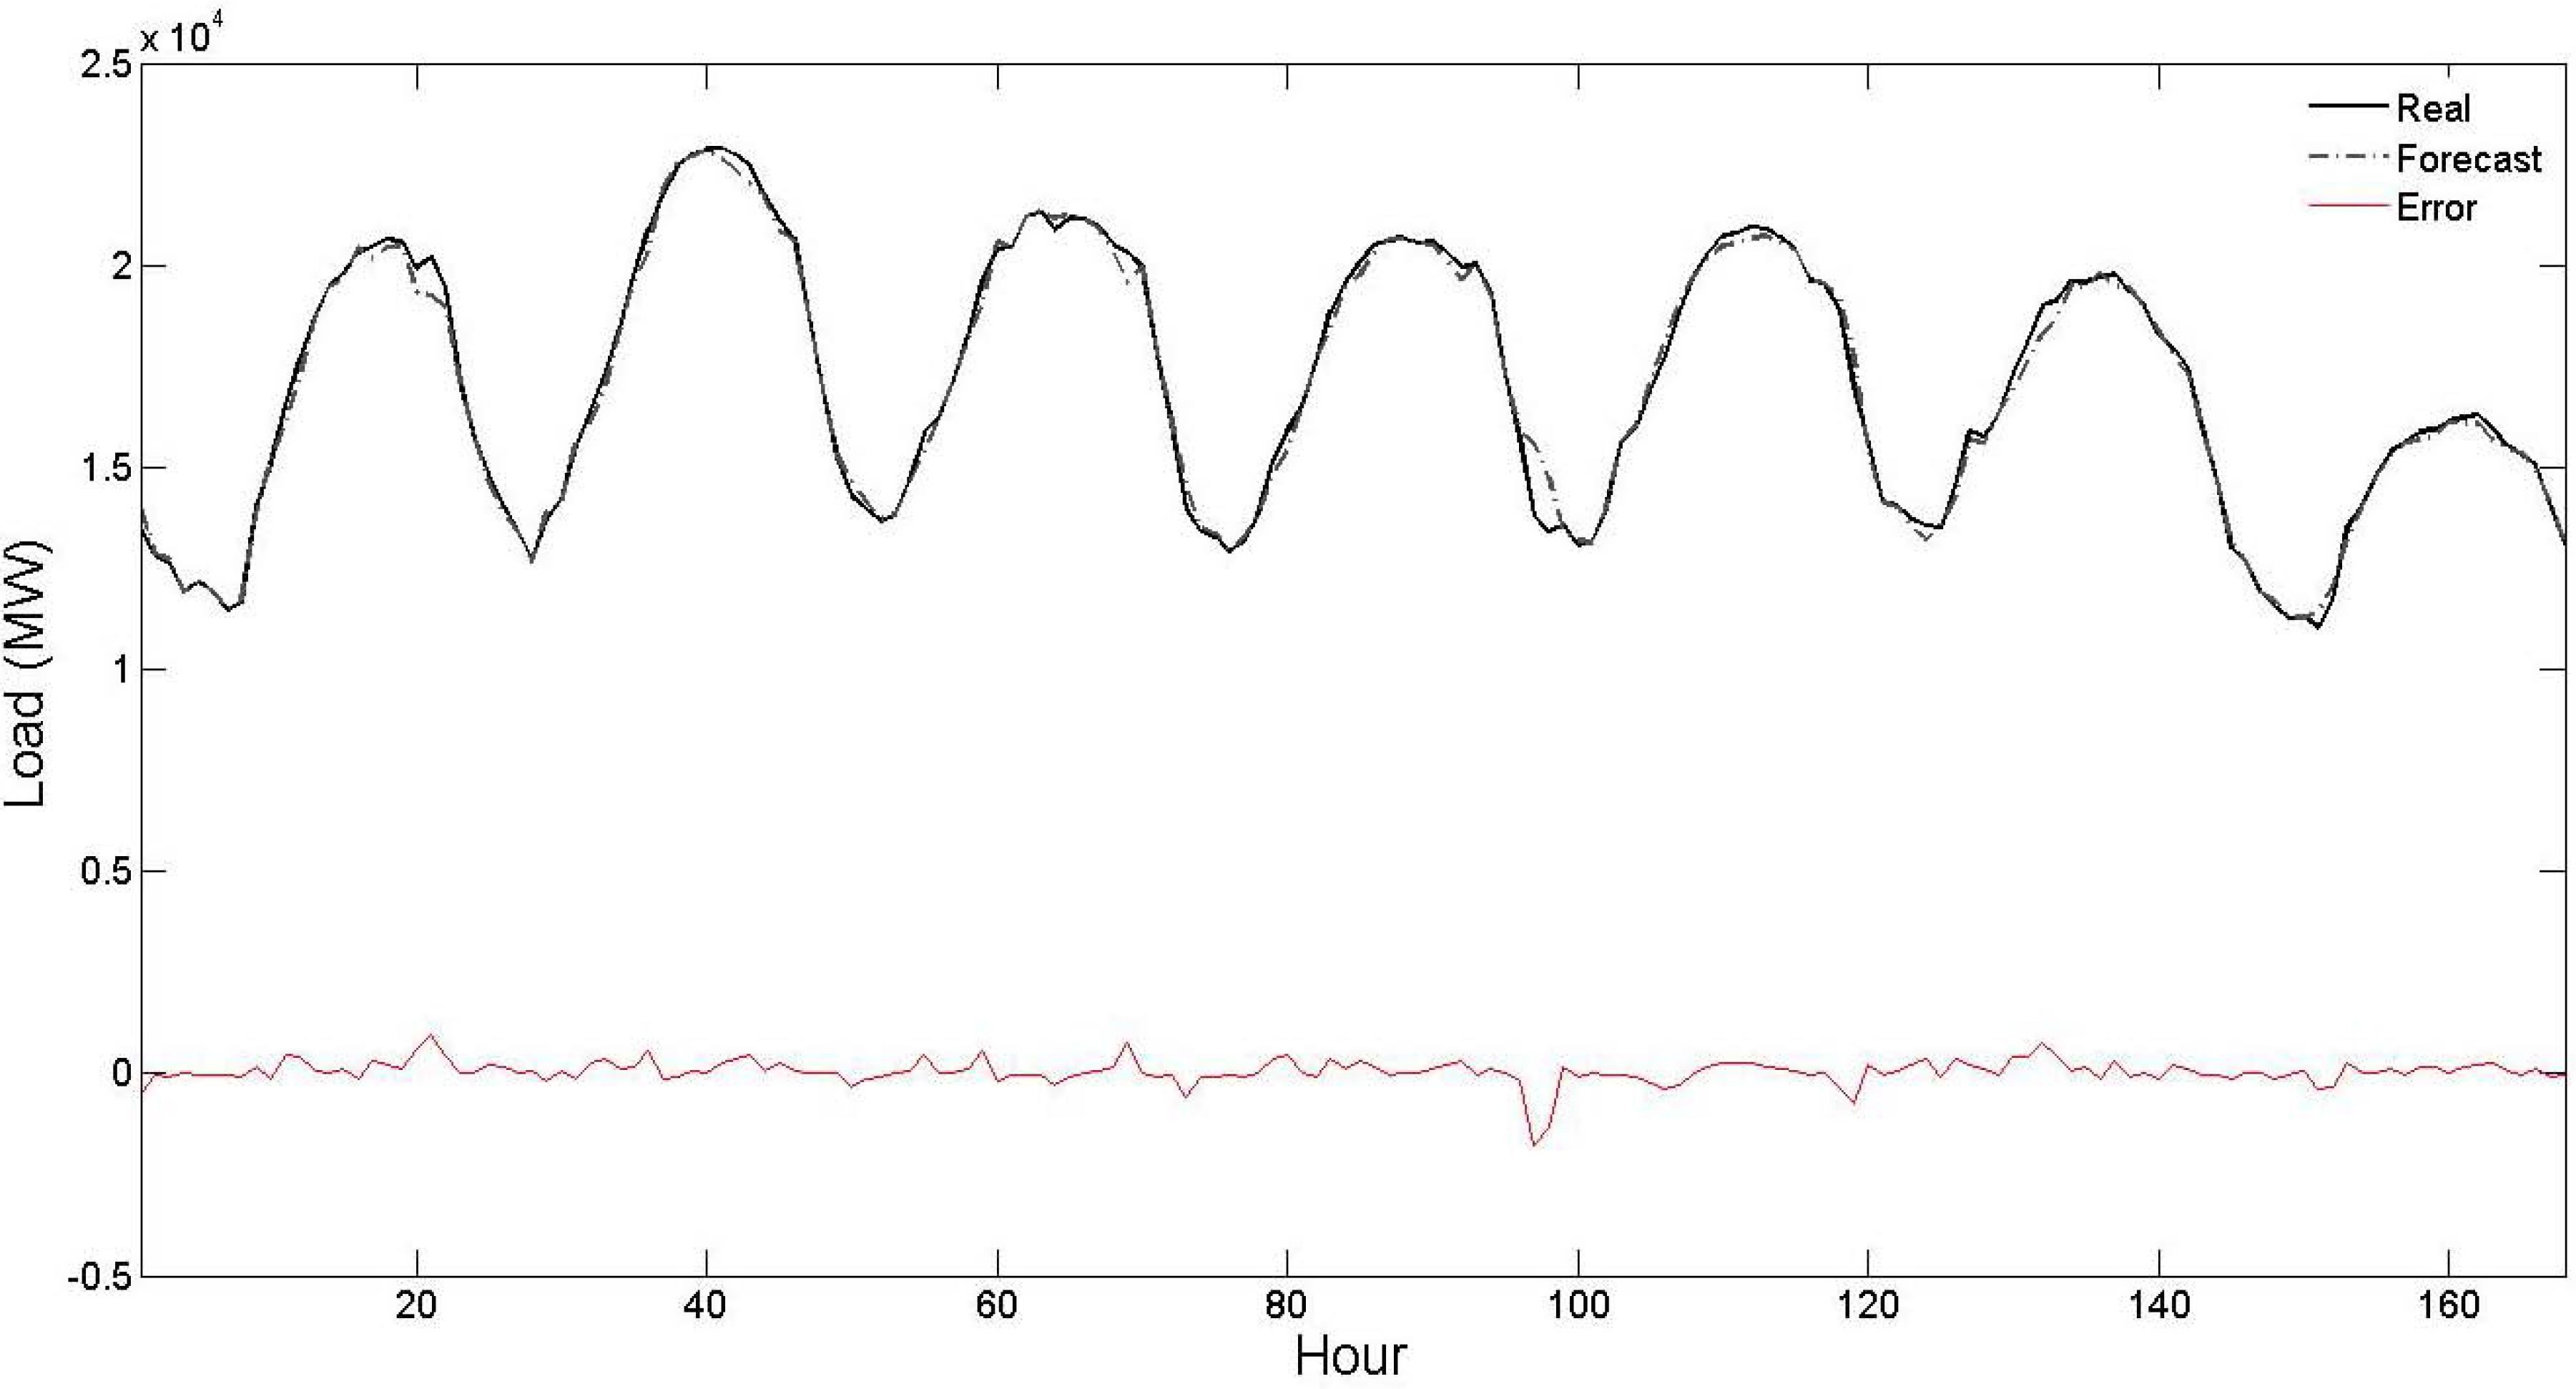
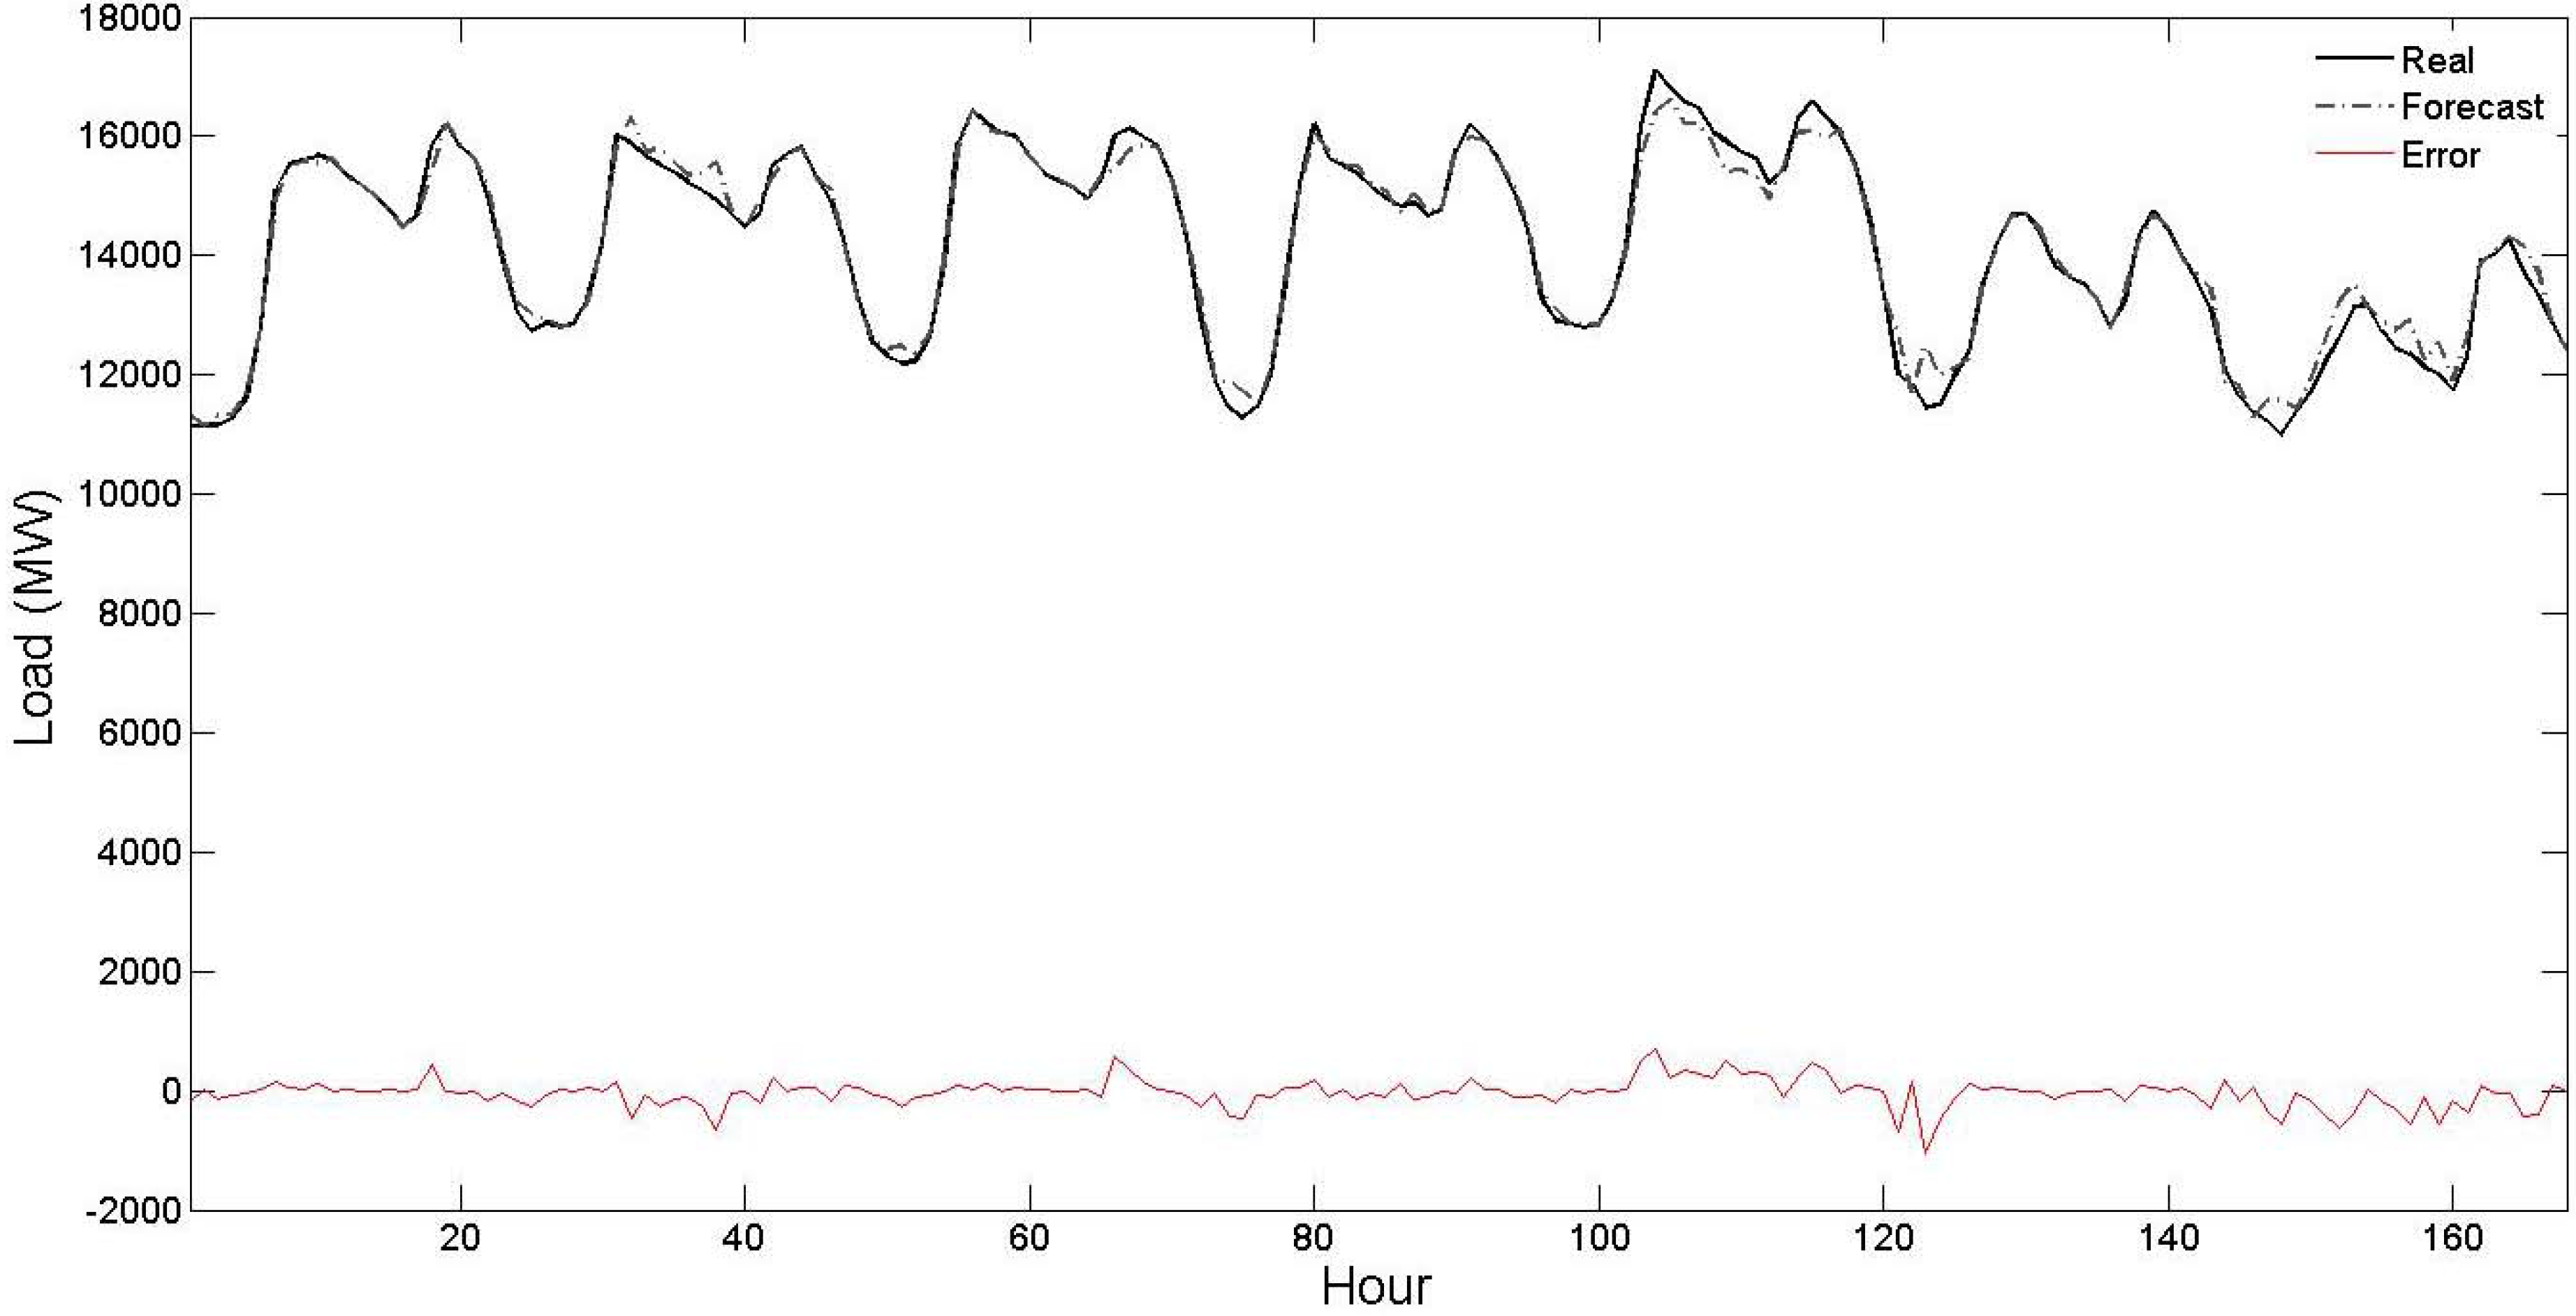
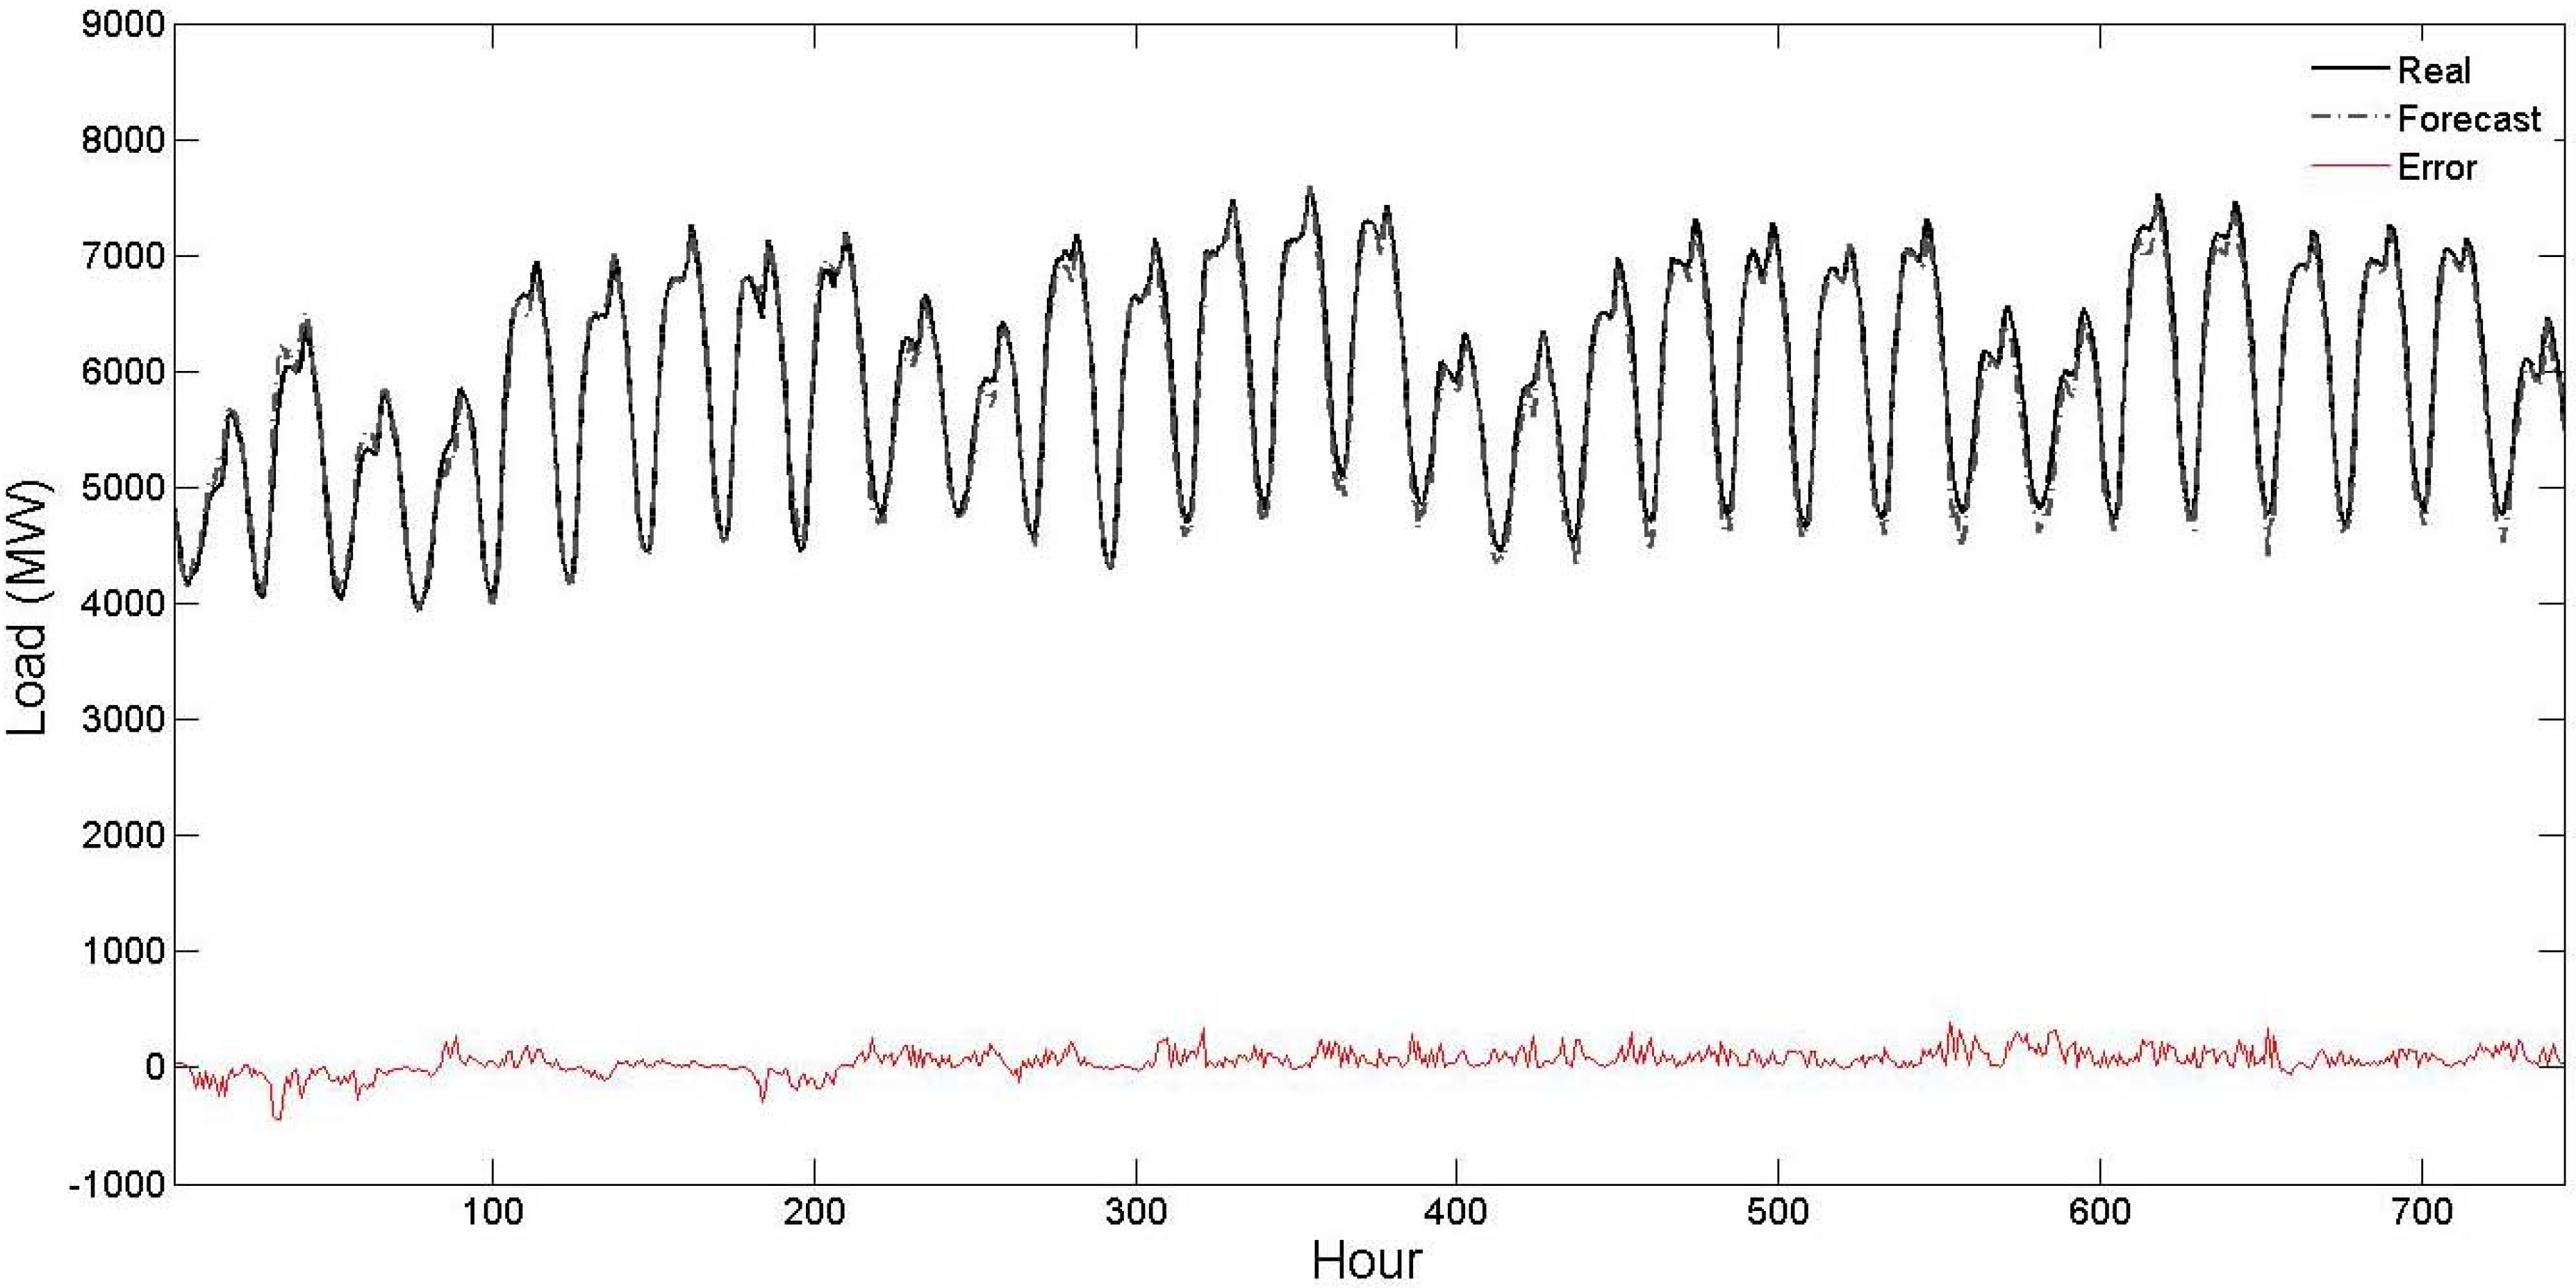
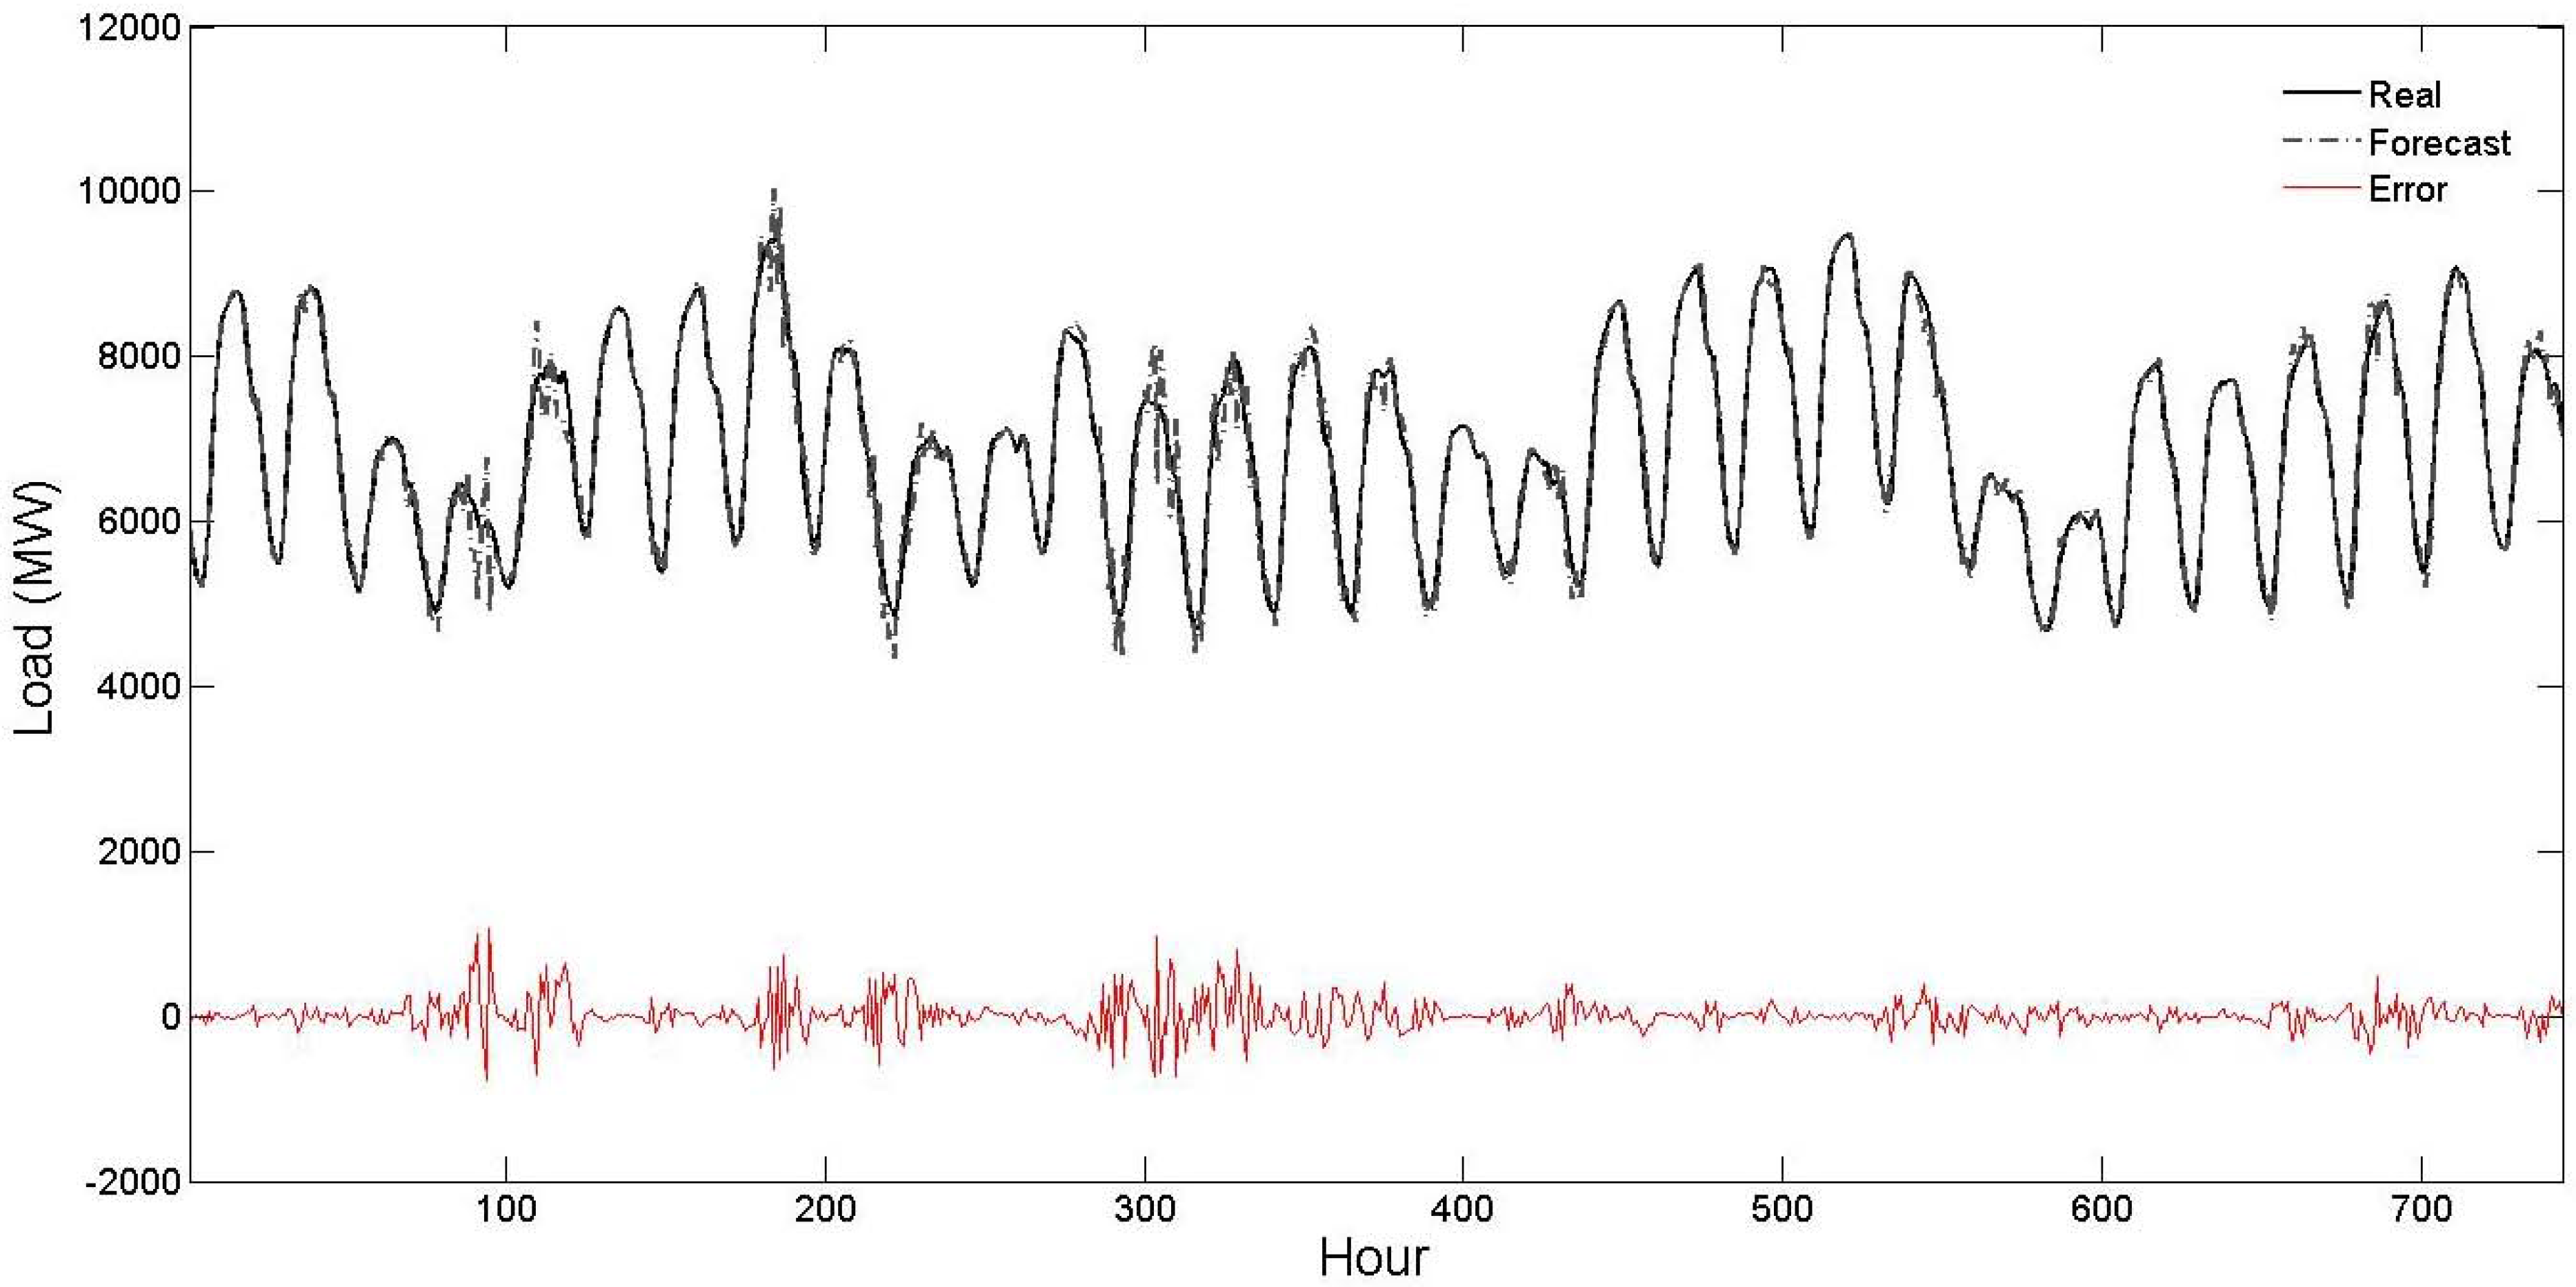
Table 3, the STLF results of the proposed strategy are compared with the STLF results of the PJM independent system operator (ISO). Observe from this table that the STLF errors of the proposed strategy are considerably lower than the STLF errors of the PJM ISO indicating its forecast capability. To also give a graphical view about the STLF accuracy of the proposed strategy, its obtained results for the four test weeks are shown in
Figure 2,
Figure 3,
Figure 4 and
Figure 5. From these figures, it is seen that the forecast curve accurately follows the real curve and only minor deviations are seen in the prediction of the proposed strategy. These figures further illustrate the accuracy and robustness of the proposed STLF strategy.
Figure 2.
Curves of real values, forecast values and forecast errors for the first test week of
Table 1 (the forecast results are related to the proposed strategy).
Figure 2.
Curves of real values, forecast values and forecast errors for the first test week of
Table 1 (the forecast results are related to the proposed strategy).
Figure 3.
Curves of real values, forecast values and forecast errors for the second test week of
Table 1 (the forecast results are related to the proposed strategy).
Figure 3.
Curves of real values, forecast values and forecast errors for the second test week of
Table 1 (the forecast results are related to the proposed strategy).
Figure 4.
Curves of real values, forecast values and forecast errors for the third test week of
Table 1 (the forecast results are related to the proposed strategy).
Figure 4.
Curves of real values, forecast values and forecast errors for the third test week of
Table 1 (the forecast results are related to the proposed strategy).
Figure 5.
Curves of real values, forecast values and forecast errors for the fourth test week of
Table 1 (the forecast results are related to the proposed strategy).
Figure 5.
Curves of real values, forecast values and forecast errors for the fourth test week of
Table 1 (the forecast results are related to the proposed strategy).
To illustrate the performance of the proposed STLF strategy in a long run, its obtained results for one year are shown in
Table 4 and compared with the results of the PJM ISO. The reported MAPE value for each test month in this table is average of its corresponding daily MAPE values. At first, better accuracy of the STLF results of the proposed strategy compared with the STLF results of the PJM ISO can also be seen from
Table 4. For each test month of this table, the proposed strategy has considerably lower MAPE value than the STLF of the PJM ISO. Moreover, the results of the proposed STLF strategy for the 12 test months of year 2009 are close to its results for the four test weeks of year 2009. For instance, average daily MAPE value for the whole year (1.46%) is close to average daily MAPE of the four test weeks (1.39%). Thus, it is seen that the proposed strategy produces good STLF results for one year as well. This numerical experiment further illustrates STLF accuracy and robustness of the proposed strategy in long run.
Table 4.
Comparison of the STLF results of the proposed strategy with the STLF results of the PJM ISO for the 12 months of year 2009 (the reported results are in terms of MAPE criterion).
Table 4.
Comparison of the STLF results of the proposed strategy with the STLF results of the PJM ISO for the 12 months of year 2009 (the reported results are in terms of MAPE criterion).
| Test Month | PJM ISO (%) | Proposed Strategy (%) |
|---|
| Jan | 5.25 | 1.67 |
| Feb | 3.73 | 1.18 |
| March | 4.67 | 1.43 |
| April | 4.27 | 1.32 |
| May | 4.95 | 1.62 |
| June | 5.44 | 1.73 |
| July | 4.92 | 1.53 |
| Aug | 4.29 | 1.35 |
| Sept | 4.72 | 1.54 |
| Oct | 4.36 | 1.33 |
| Nov | 4.28 | 1.32 |
| Dec | 4.71 | 1.53 |
| Whole year | 4.64 | 1.46 |
The hourly electricity load in New York City and weather data observed at Central Park have been considered as the second test case of this paper. The employed data for this test case has been obtained from [
27]. The proposed STLF strategy has the same training period and the same cross-validation technique of the previous numerical experiment. The obtained day-ahead STLF results for the test case are shown in
Table 5. The error criterion of MAE is considered in addition to MAPE in this numerical experiment, which is defined as follows:
where
Lact(
t),
Lfor(
t) and
NH are as defined for (7). The MAE and MAPE results of New York ISO [
27], support vector machine (SVM) [
3], hybrid network (composed of Self-Organized Map (SOM) for data clustering and groups of 24 SVMs for the next day load forecast) [
3], and wavelet transform combined with neuro-evolutionary algorithm [
22] for this test case are also reported in
Table 5 for comparison. The results of the benchmark methods of this table have been quoted from their respective references. The same test period (January 2004 and July 2004) and the same error criteria (MAE and MAPE) of these references are also adopted for the proposed STLF strategy. The reported MAE and MAPE values for each test month in
Table 5 are average of its corresponding daily MAE and MAPE values, respectively. Observe that the proposed strategy has the lowest MAE and the lowest MAPE among all forecast methods of
Table 5 in both the test months. This comparison illustrates the effectiveness of the proposed STLF strategy. Its obtained results for the two test months are also graphically shown in
Figure 6 and
Figure 7, respectively. As seen from these figures, the forecast curve is close to real curve, such that in most of the time these two curves cannot be discriminated, and the error curve has small values. This numerical experiment further validates the efficiency of the proposed hybrid forecast engine.
Although the load patterns of public holidays usually have some differences with respect to normal days, we treated these days like normal days in this research work and good STLF results have been obtained for both the test cases. However, if in a power system, the STLF accuracy of public holidays is not satisfactory, they can be separately treated with specific schemes. More details about this matter can be found in [
3,
6].
Total computation time required for the setup of the proposed STLF strategy including execution of the preprocessor, training process of the hybrid forecast engine by the MHS and fine-tuning of the user defined parameters by the search procedure is about 20 minutes for the test cases of this paper, measured on a simple hardware set of Pentium P4 3.2 GHz with 4 GB RAM. This setup time is completely reasonable within a day-ahead decision making framework. The computer code of the proposed STLF strategy has been written in the MATLAB software package version 7.8.0.347.
Table 5.
Day-ahead STLF results of New York city for the two test months of January 2004 and July 2004.
Table 5.
Day-ahead STLF results of New York city for the two test months of January 2004 and July 2004.
| Type of Forecast | January 2004 | July 2004 |
|---|
| MAE (MW) | MAPE (%) | MAE (MW) | MAPE (%) |
|---|
| New York ISO [27] | 163.05 | 2.86 | 245.47 | 3.55 |
| SVM [3] | 143.21 | 2.38 | 207.74 | 3.03 |
| Hybrid Network [3] | 106.97 | 1.82 | 162.2 | 2.29 |
| Wavelet Transform + Neuro-Evolutionary Algorithm [22] | 87.01 | 1.68 | 123.62 | 2.02 |
| Proposed Strategy | 72.73 | 1.25 | 115.71 | 1.57 |
Figure 6.
Curves of real values, forecast values and forecast errors for the test month of January 2004 of
Table 5 (the forecast results are related to the proposed strategy).
Figure 6.
Curves of real values, forecast values and forecast errors for the test month of January 2004 of
Table 5 (the forecast results are related to the proposed strategy).
Figure 7.
Curves of real values, forecast values and forecast errors for the test month of July 2004 of
Table 5 (the forecast results are related to the proposed strategy).
Figure 7.
Curves of real values, forecast values and forecast errors for the test month of July 2004 of
Table 5 (the forecast results are related to the proposed strategy).


 , each of its elements (1 ≤ i ≤ ND) is generated based on the following cases:
 is produced.
  . Each of its elements (1 ≤ i ≤ ND) is produced as follows:


