Article

Study on the Electroacoustic Pulse Method for Space Charge Recovery Algorithm Considering Temperature Gradient Aging


School of Electrical and Information Engineering, Tianjin University, Tianjin 300072, China
*
Author to whom correspondence should be addressed.
Energies 2026, 19(9), 2222; https://doi.org/10.3390/en19092222
Submission received: 12 March 2026 / Revised: 27 April 2026 / Accepted: 29 April 2026 / Published: 4 May 2026

Abstract

This study addresses the impact of temperature gradient-induced non-uniform aging on the accuracy of space charge measurements in cross-linked polyethylene (XLPE) insulation for high-voltage direct-current cables. Existing pulse-echo acoustic (PEA) recovery algorithms neglect the evolution of material acoustic and dielectric properties during aging. To overcome this limitation, the systematic degradation of sound velocity, attenuation dispersion, and dielectric constant subjected to temperature gradient aging was experimentally investigated. Specimens were aged at temperatures ranging from 40 to 100 °C for durations up to 49 days. Then, quantitative models describing the dependence of acoustic and dielectric properties on aging severity were established. A space charge signal correction algorithm was then developed, incorporating nonlinear adjustments for sound velocity, attenuation, and permittivity according to the through-thickness aging profile. The algorithm’s accuracy was validated by comparing recovered charge waveforms and electric field distributions under 5 kV/mm for samples aged under different temperature gradients. The application of the method under high-voltage DC conditions revealed that aging induces non-monotonic changes in sound velocity, increased attenuation coefficients, and elevated low-frequency dielectric constants. Temperature gradient aging promotes heteropolar charge accumulation. This work provides a theoretical and methodological basis for improving the accuracy of the insulation condition assessment in long-term service HVDC cables.

1. Introduction

High-voltage direct current (HVDC) cables have garnered widespread attention due to their environmental benefits, economic advantages, and high operational efficiency [1]. HVDC transmission can effectively reduce losses during power transmission, improve the utilization rate of existing lines, and is widely used in key areas such as long-distance transmission, submarine cables, and power connections in remote regions [2,3]. Compared to AC cables, the electric field distribution under DC conditions is more complex, influenced not only by the material’s conductivity but also by internal space charge [4,5]. The accumulation of space charge is primarily related to the material properties. Currently, research on the space charge in insulation equipment mainly relies on the pulsed electro-acoustic (PEA) method. Since the PEA method was proposed in 1983, recovery algorithms for characterizing space charge distribution at room temperature have been extensively studied. For instance, T. Takada in Japan used the PEA method to analyze charge and electric fields in dielectric media, such as flat sheet heat-resistant polyester slices [6]. Y. Tanaka et al. investigated acoustic wave attenuation and dispersion factors in lossy flat sheet dielectrics and performed a waveform recovery of voltage measurement signals [7]. B. Vissouvanadin et al. used deconvolution techniques to avoid the influence of flat sheet insulation layer thickness on voltage signals [8]. During the actual operation of power equipment, the insulation often experiences a certain temperature gradient distribution. Long-term operation under such gradients causes uneven aging of the material. The characteristics of acoustic waves propagating through the material will change with alterations in the material’s microstructure. Therefore, voltage signal recovery processing in unevenly aged materials is more complex than in non-aged materials. Currently, research on space charge measurements under temperature gradients exists internationally. For example, D. Fabiani et al. analyzed the injection and distribution of positive and negative charges under temperature gradients [9]. W. Choo et al. primarily used software simulation to model space charge distribution under temperature gradients [10]. Haosen Wang et al. performed waveform recovery by modifying the attenuation coefficient from a first-order to a second-order expression [11]. Xu Jiaxuan et al. corrected the transfer function for space charge under temperature gradients by measuring the acoustic wave velocity, attenuation coefficient, and dispersion coefficient at different temperatures [12]. Wang Xia et al. studied the space charge characteristics in XLPE under the long-term synergistic effect of different temperature gradients and DC electric fields [13]. In the space charge recovery algorithms, either the acoustic properties are assumed constant during operation, or the algorithm is corrected considering the effect of temperature on acoustic properties. No one has considered the impact of changes in the material’s microstructure due to uneven aging on its acoustic characteristics.
To improve the accuracy of space charge detection in actual cables during long-term operations, this paper measures the relevant characteristics of flat sheet cross-linked polyethylene samples aged under different temperatures. This study measured the internal sound velocity, sound wave attenuation, and dielectric constant of crosslinked polyethylene under different aging conditions. Based on this, it explores a recovery algorithm for space charge measurement signals in flat sheet samples subjected to long-term temperature gradient aging and conducts corresponding validation studies.

2. Materials and Methods

2.1. Sample Preparation

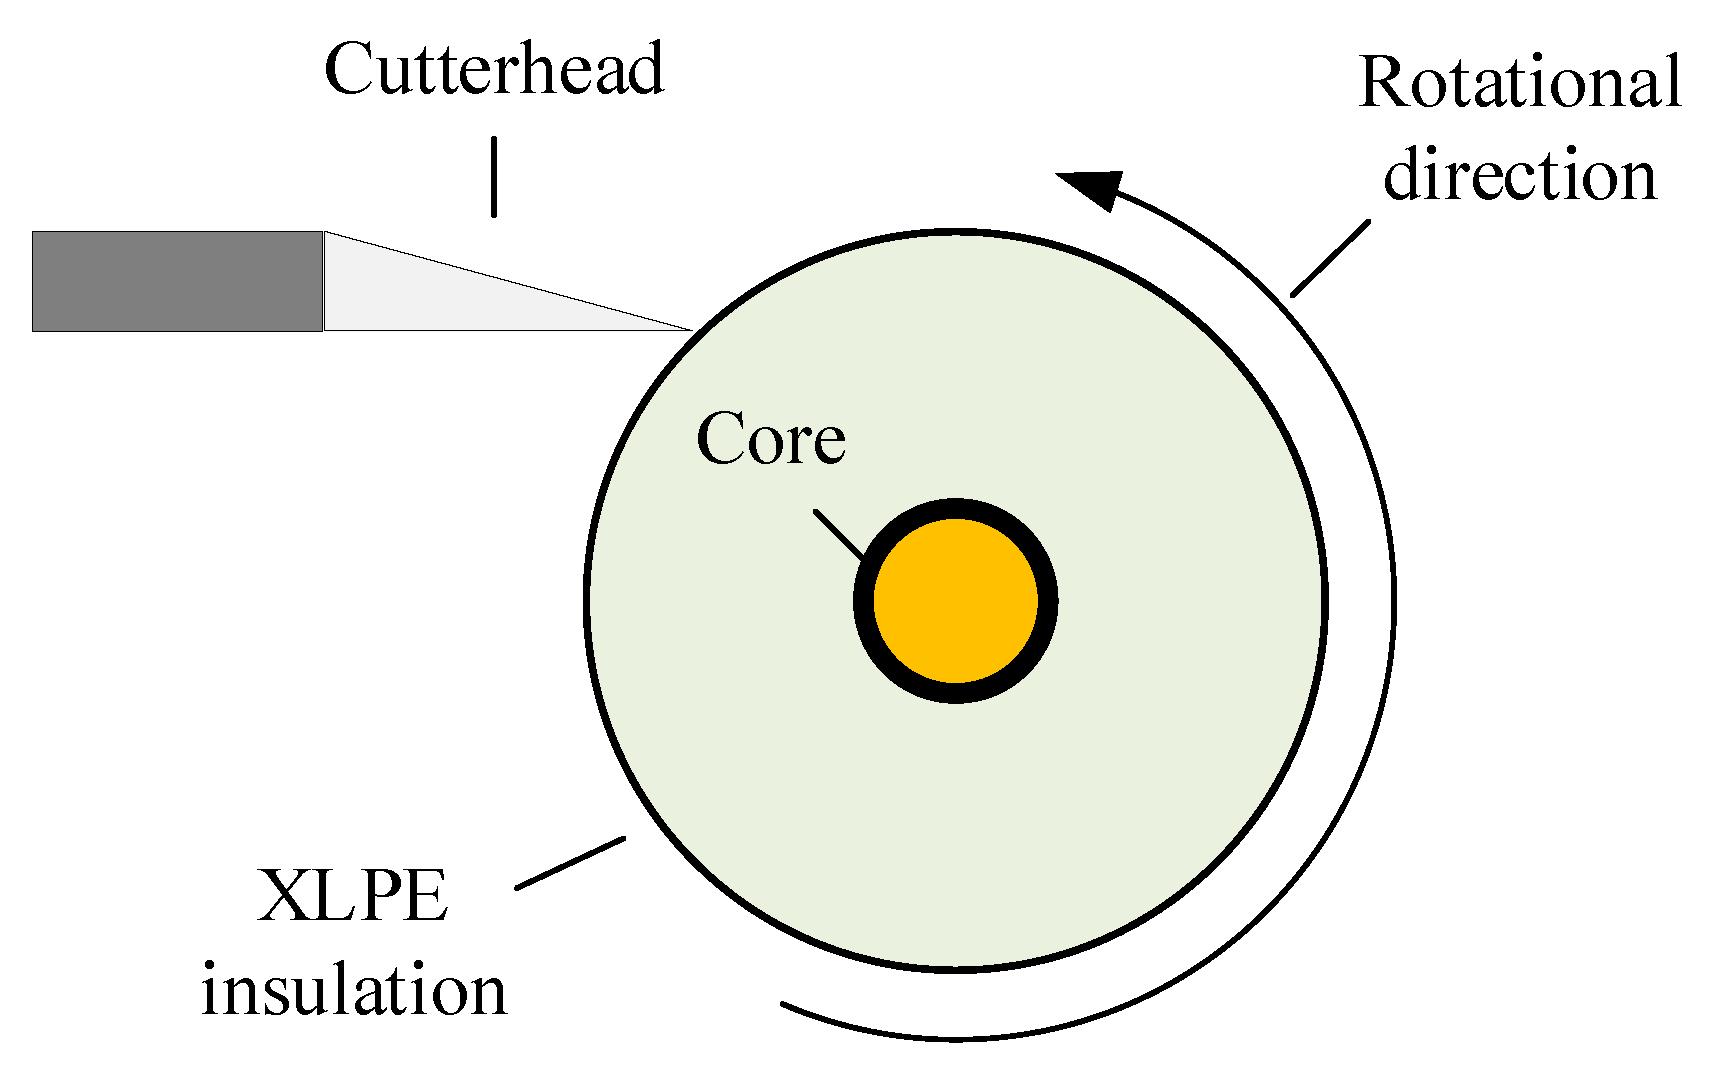
Cross-linked polyethylene thin slice samples were sliced from the insulation of a brand-new 220 kV HVDC submarine cable using a ring-cutting device. The samples have a thickness of 0.5 mm and a width of 50 mm. A schematic diagram of the ring-cutting process is shown in Figure 1.
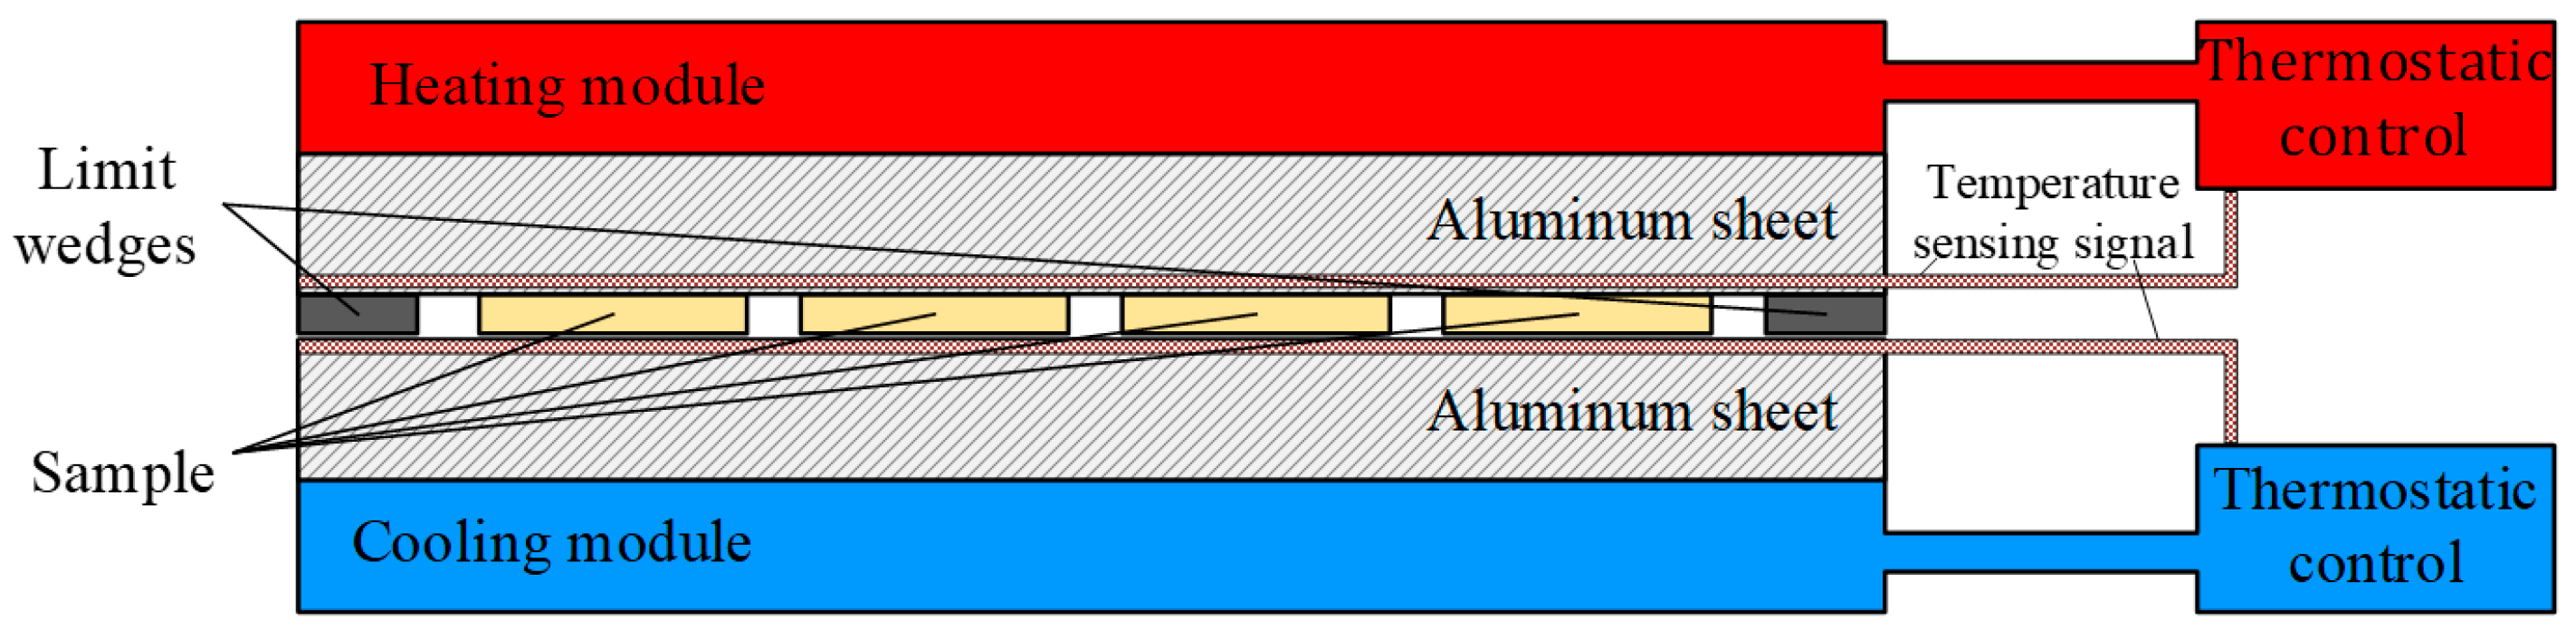
The slice samples were trimmed to a length of 20 cm and divided into 7 groups. Four groups were, respectively, placed in constant temperature aging ovens set to 40 °C, 60 °C, 80 °C, and 100 °C. The other three groups were placed in a temperature gradient aging device, with gradient conditions set to 40–60 °C, 40–80 °C, and 40–100 °C. The temperature gradient aging device is shown in Figure 2. Samples were taken out every 7 days for testing and parameter recording, for a total aging period of 49 days.

2.2. Space Charge Measurement Platform

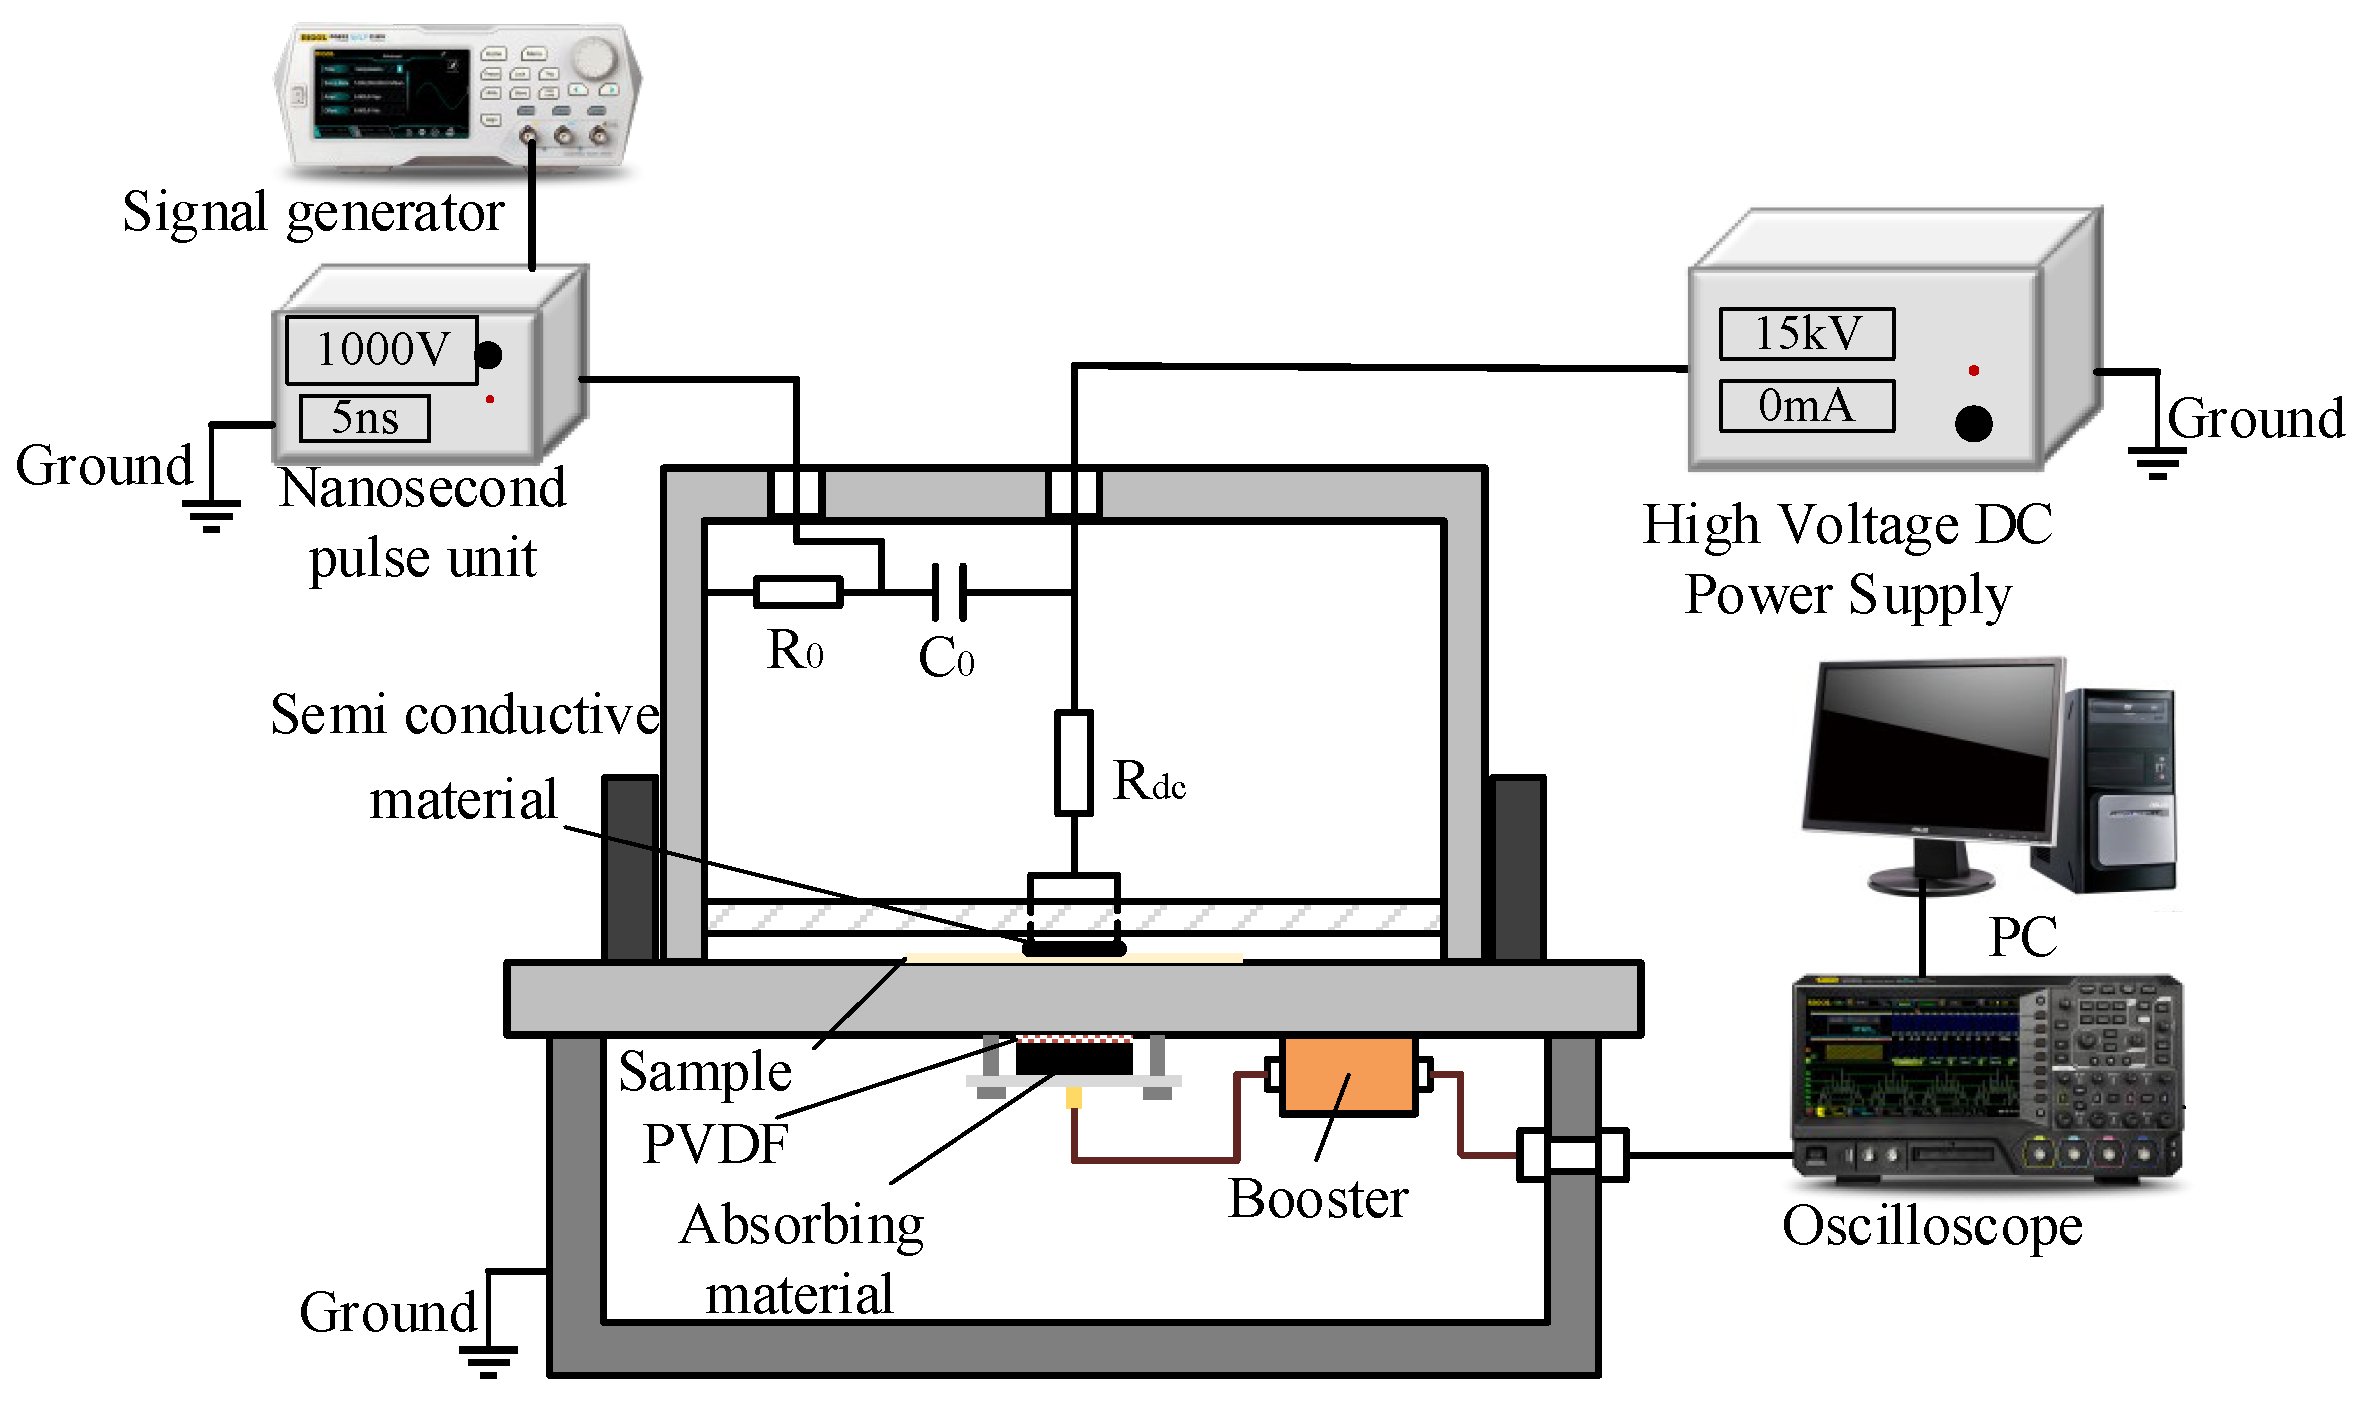
The PEA method is simple to operate, has mature measurement technology, and is suitable for the space charge measurement in solid flat sheet samples [14]. The circuit schematic diagram of the PEA measurement system under DC voltage is shown in Figure 3. The high-voltage DC power supply provides the polarization voltage to the sample. The pulse voltage is superimposed onto the DC voltage through a coupling capacitor. According to traveling wave theory, impedance matching is required at the pulse end to prevent pulse reflection. Assuming space charge exists inside the flat sample, applying an ideal pulse across the sample induces a force on the charge layer within the sample, causing tiny displacement vibrations. This motion generates an acoustic pulse, which propagates through the sample to the polyvinylidene fluoride (PVDF) piezoelectric sensor located at the bottom electrode. The acoustic signal is converted into an electrical signal. As the sensor output voltage signal is very small, it needs amplification by an amplifier for subsequent acquisition and processing [15]. The amplified voltage signal is captured by an oscilloscope, and the data is sent to a computer for storage. A piece of semiconducting material is placed between the sample and the top electrode, and silicone oil is applied between the sample and the bottom electrode. The semiconducting layer serves to match the acoustic impedance between the sample and the top electrode, while the silicone oil fills gaps to reduce reflection loss at the interface [16].

2.3. Broadband Dielectric Spectroscopy Instrument and Method

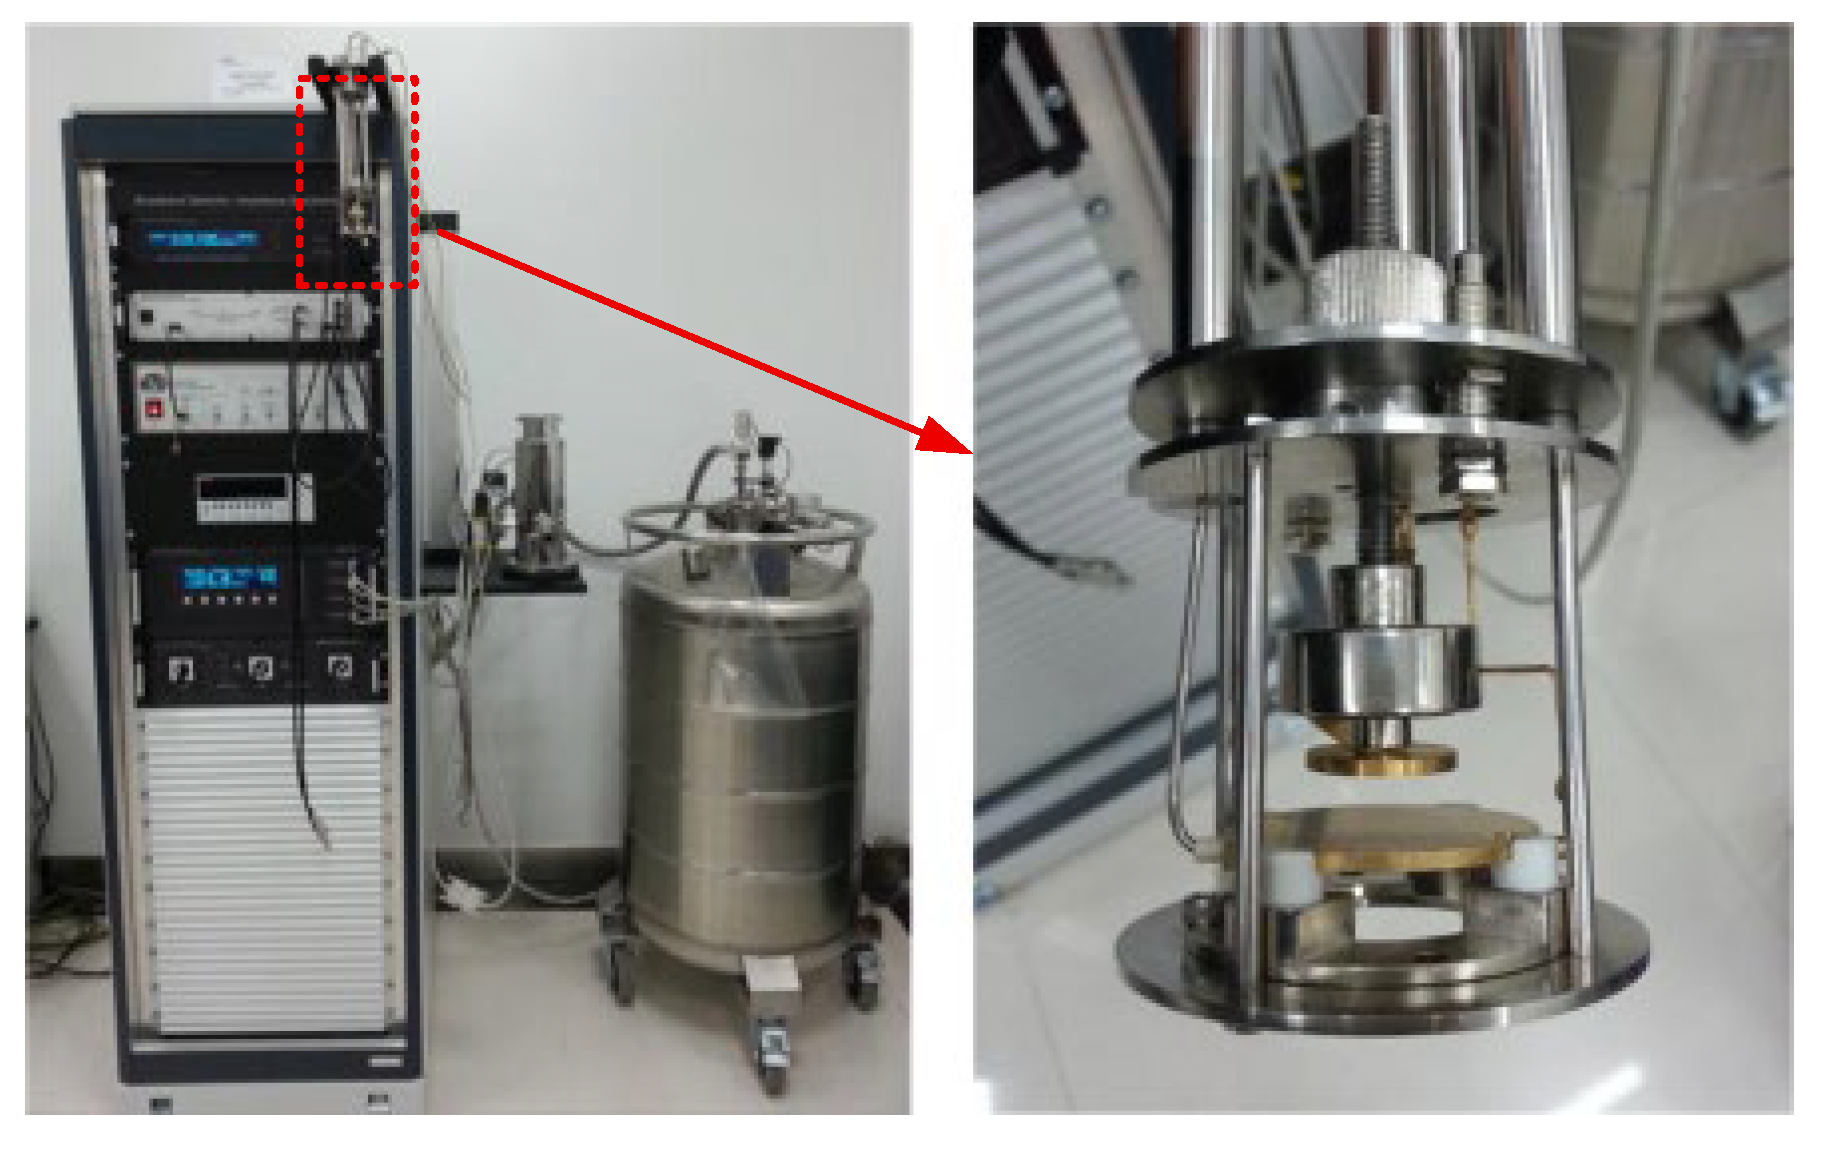
This paper uses the Novocontrol Concept 40 broadband impedance spectrometer to measure the broadband dielectric parameters of various aged XLPE samples, as shown in Figure 4.
Prior to testing, place the different-aged XLPE specimens in a vacuum oven set to 80 °C for 12 h. Next, wipe the surface of the samples clean with 100% ethanol. Using a vacuum ion sputtering system, deposit a layer of silver electrodes with a diameter of approximately 8 mm on both sides of the samples. During testing, set the test temperature to 25 ± 1 °C and maintain the ambient humidity at 45 ± 5% RH, with a measurement frequency range of 0.1 Hz to 10 MHz and a measurement voltage amplitude of 1 Vrms.

3. Fundamental Theory of PEA Data Processing

3.1. Acoustic Wave Propagation in Lossy Media

Assuming the medium is isotropic, the propagation of an acoustic wave function p ( t ,   z ) inside a lossy medium, in relation to acoustic wave propagation time t , angular frequency ω , sound velocity v , and propagation distance z , satisfies the following signal attenuation characteristic equation [17]:
p t , z = P 0 e j ω t z / v = P 0 e j ω t k z
where P 0 is the initial amplitude of the acoustic wave, and k is the wave number.
Considering that the acoustic wave propagation in a medium involves both phase change and amplitude attenuation, let k be a complex number. The attenuation of the acoustic wave amplitude can be calculated using the following formula:
k = β j α
where α is the attenuation coefficient, and β is the dispersion coefficient. Substituting this into the acoustic wave signal attenuation characteristic equation yields the following specific expression of the attenuation characteristic equation:
p t , z = e j ω t e α z j β z
Applying the Fourier transform to the above equation yields the attenuation characteristics of the acoustic wave signal in the frequency domain:
P f , z = P f , 0 e α f z j β f z
where P f , 0 is the frequency-domain form of the acoustic wave at the signal starting point, and P f , z is the frequency-domain form after the acoustic wave signal has propagated a distance z in the medium. α f and β f represent the attenuation coefficient and dispersion coefficient of the acoustic wave signal propagating in the material, respectively, which are related to the signal frequency and the material’s inherent properties. From the above equation, the attenuation transfer function for acoustic wave propagation in a solid medium can be obtained as follows:
G f , z = P f , 0 P f , z = e α f z j β f z
When measuring space charge using the PEA method, the measurement data contains P f , 0 and P f , z . Substituting these into the above equation yields the calculation formulas for the attenuation coefficient α f and dispersion coefficient β f as shown below:
α f = 1 d ln P f , d P f , 0
β f = 1 d ( Φ P ( f , d ) Φ P ( f , 0 ) )
where d represents the sample thickness, P f , 0 and P f , d represent the pulse amplitudes of the acoustic wave signal at the starting point and ending point in the medium, respectively, and Φ P f , 0 and Φ P f , d represent the signal phase angles of the acoustic wave signal at the starting point and ending point in the medium, respectively.

3.2. Mathematical Model for Space Charge Recovery

The recovery of the space charge measurement voltage waveform first requires obtaining the measurement system’s transfer function, the acoustic wave attenuation coefficient, and the dispersion coefficient under a reference voltage. The space charge signal obtained under the test voltage is then deconvolved with the system’s transfer function to eliminate system overshoot. After attenuation and dispersion compensation, the final internal space charge distribution of the sample under the test voltage is obtained. The expression for the transfer function H ( f ) is as follows:
H f = U 0 f τ s v s d ε 0 ε r U d c
where U 0 f is the Fourier transform of the ground electrode charge peak signal, τ s is the oscilloscope sampling time, v s is the sound velocity in the sample, d is the sample thickness, ε 0 is the vacuum permittivity, ε r is the relative permittivity of the sample, and U d c is the DC voltage applied on the sample during the testing process.
Assuming the existence of space charge ρ s t inside the sample, the measured voltage signal is u s t . The frequency-domain expression of the space charge distribution signal after attenuation and dispersion compensation is as follows:
R f = U s f U 0 f G f = ε 0 ε r U d c τ s v s d U s f U 0 f G f
where R ( f ) is the Fourier transform of ρ s t , and U s ( f ) is the Fourier transform of u s t , G ( f ) is the transfer function calculated above.

4. Results and Discussion

4.1. Influence of Aging on Acoustic Waves in the Pulsed Electro-Acoustic Method

4.1.1. Influence of Aging on Acoustic Wave Propagation Velocity

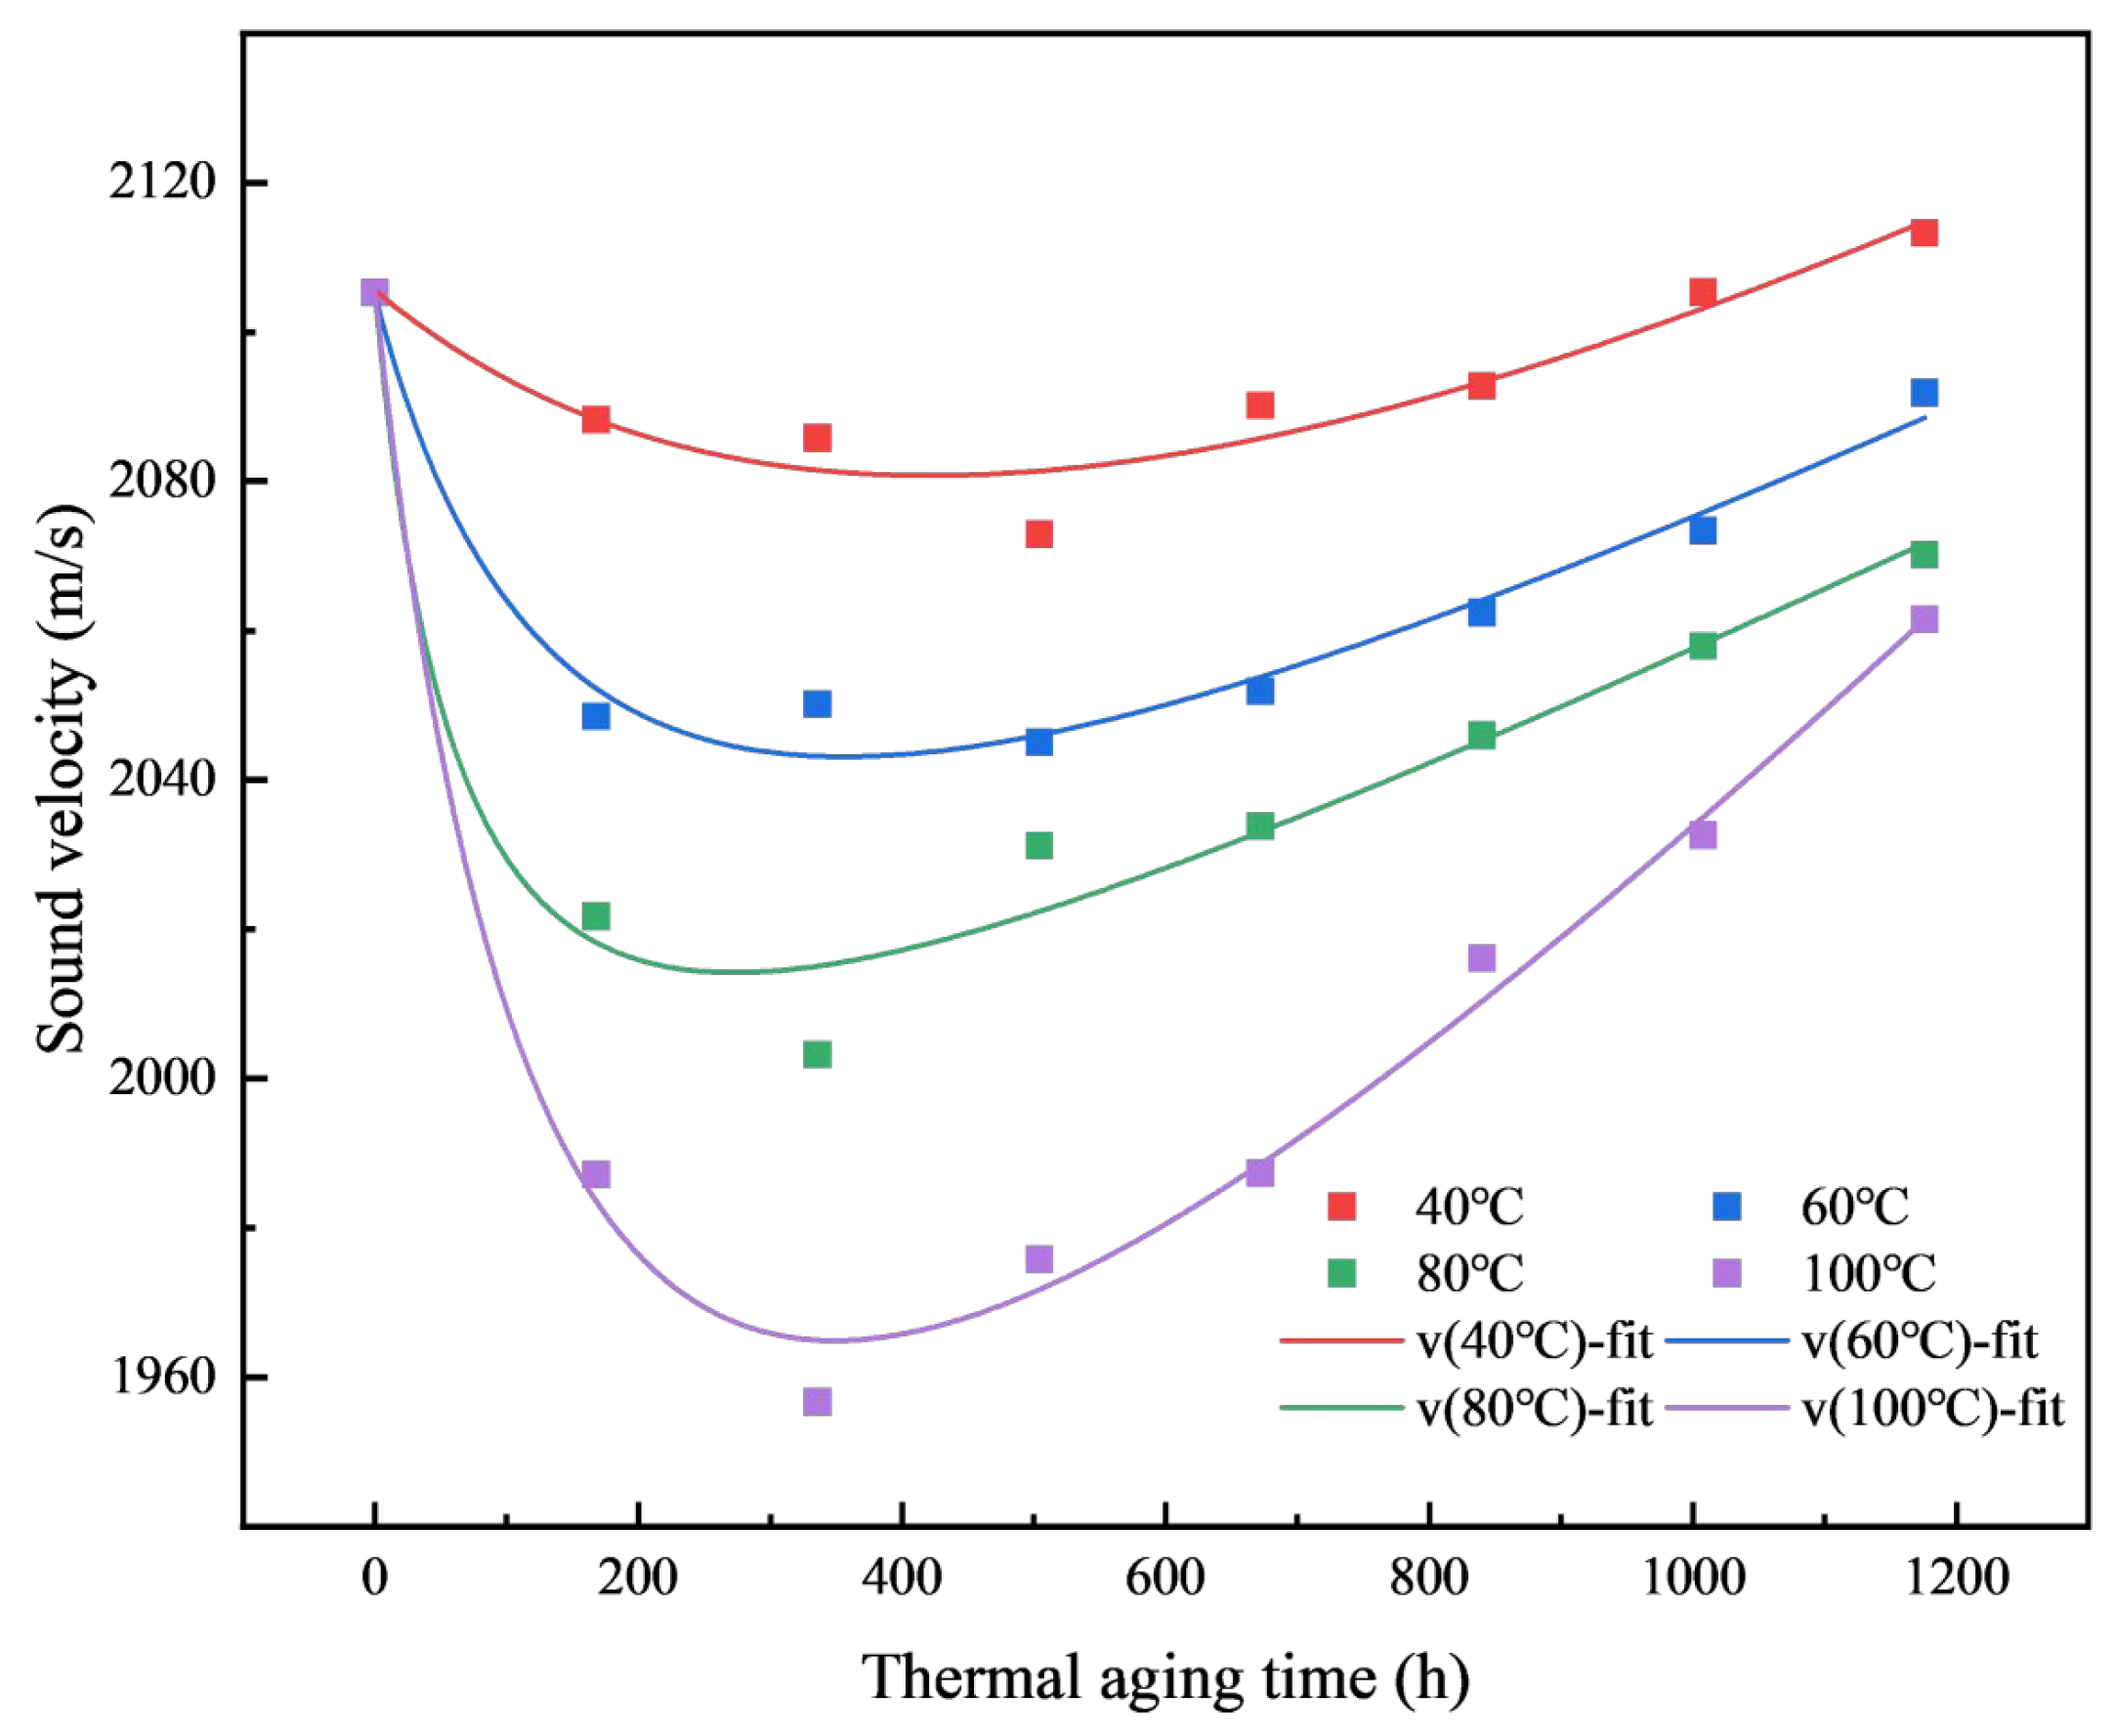
Figure 5 shows the variation curves of sound velocity in cross-linked polyethylene samples aged for different durations at 40 °C, 60 °C, 80 °C, and 100 °C.
It can be seen from the Figure 5 that the sound velocity in the material initially decreases and then increases. Under long-term aging (typically after 20 days) at each temperature, the sound velocity in the material exhibits a roughly linear relationship with aging time. The sound velocity decreases with increasing aging temperature. Fitting the data in the Figure 5 yields an empirical formula for calculating sound velocity:
v t a , T = k t t a + c T + k T · t a + 2140
where k t is the correct factor between temperature and thickness of slices in m/°C, t a is the aging time in seconds, c is a temperature-dependent constant, T is the aging temperature in °C, and k T is the aging time correction parameter in m/s2. In long-term aging, the first term has a negligible effect on the sound velocity and can, therefore, be ignored.
During temperature gradient aging, the temperature is the same across any cross-section within the material. Assuming the temperature at the lower surface of the material is T l , the temperature at the upper surface is T h , and the insulation sample thickness is d . During the temperature-gradient aging process, there is no heat source within the XLPE insulation slices. Furthermore, at the test temperatures (40–100 °C), there is no significant change in the thermal conductivity of the specimens [18]. According to Fourier’s law, the temperature within the specimens follows a linear distribution. Then, the temperature T x at any point inside the sample at a distance x from the lower surface satisfies the following equation:
T x = T l + x d T h T l
For samples subjected to long-term aging, the sound velocity exhibits a linear relationship with the aging temperature for samples with identical aging durations. Therefore, the sound velocity within specimens subjected to temperature gradient aging also follows a linear distribution. Assuming the acoustic wave velocity at the low-temperature aging surface is v 0 and at the high-temperature aging surface is v n , the relationship between the internal acoustic wave velocity and the propagation distance is shown below:
v x = v 0 + x d × v n v 0
Dividing the sample thickness into n equal parts, assuming each part has a thickness d x , where d x is sufficiently small, and the wave velocity is constant within d x . The time t required for the wave to travel from the starting point to distance x can be obtained by integration:
t = 0 x d x v x = d v n v 0 ln v x v 0
From the above equation, the relationship between acoustic wave propagation distance and sampling time can be inversely solved as follows:
x = v 0 d v n v 0 e v n v 0 d t 1

4.1.2. Influence of Aging on Acoustic Wave Attenuation and Dispersion

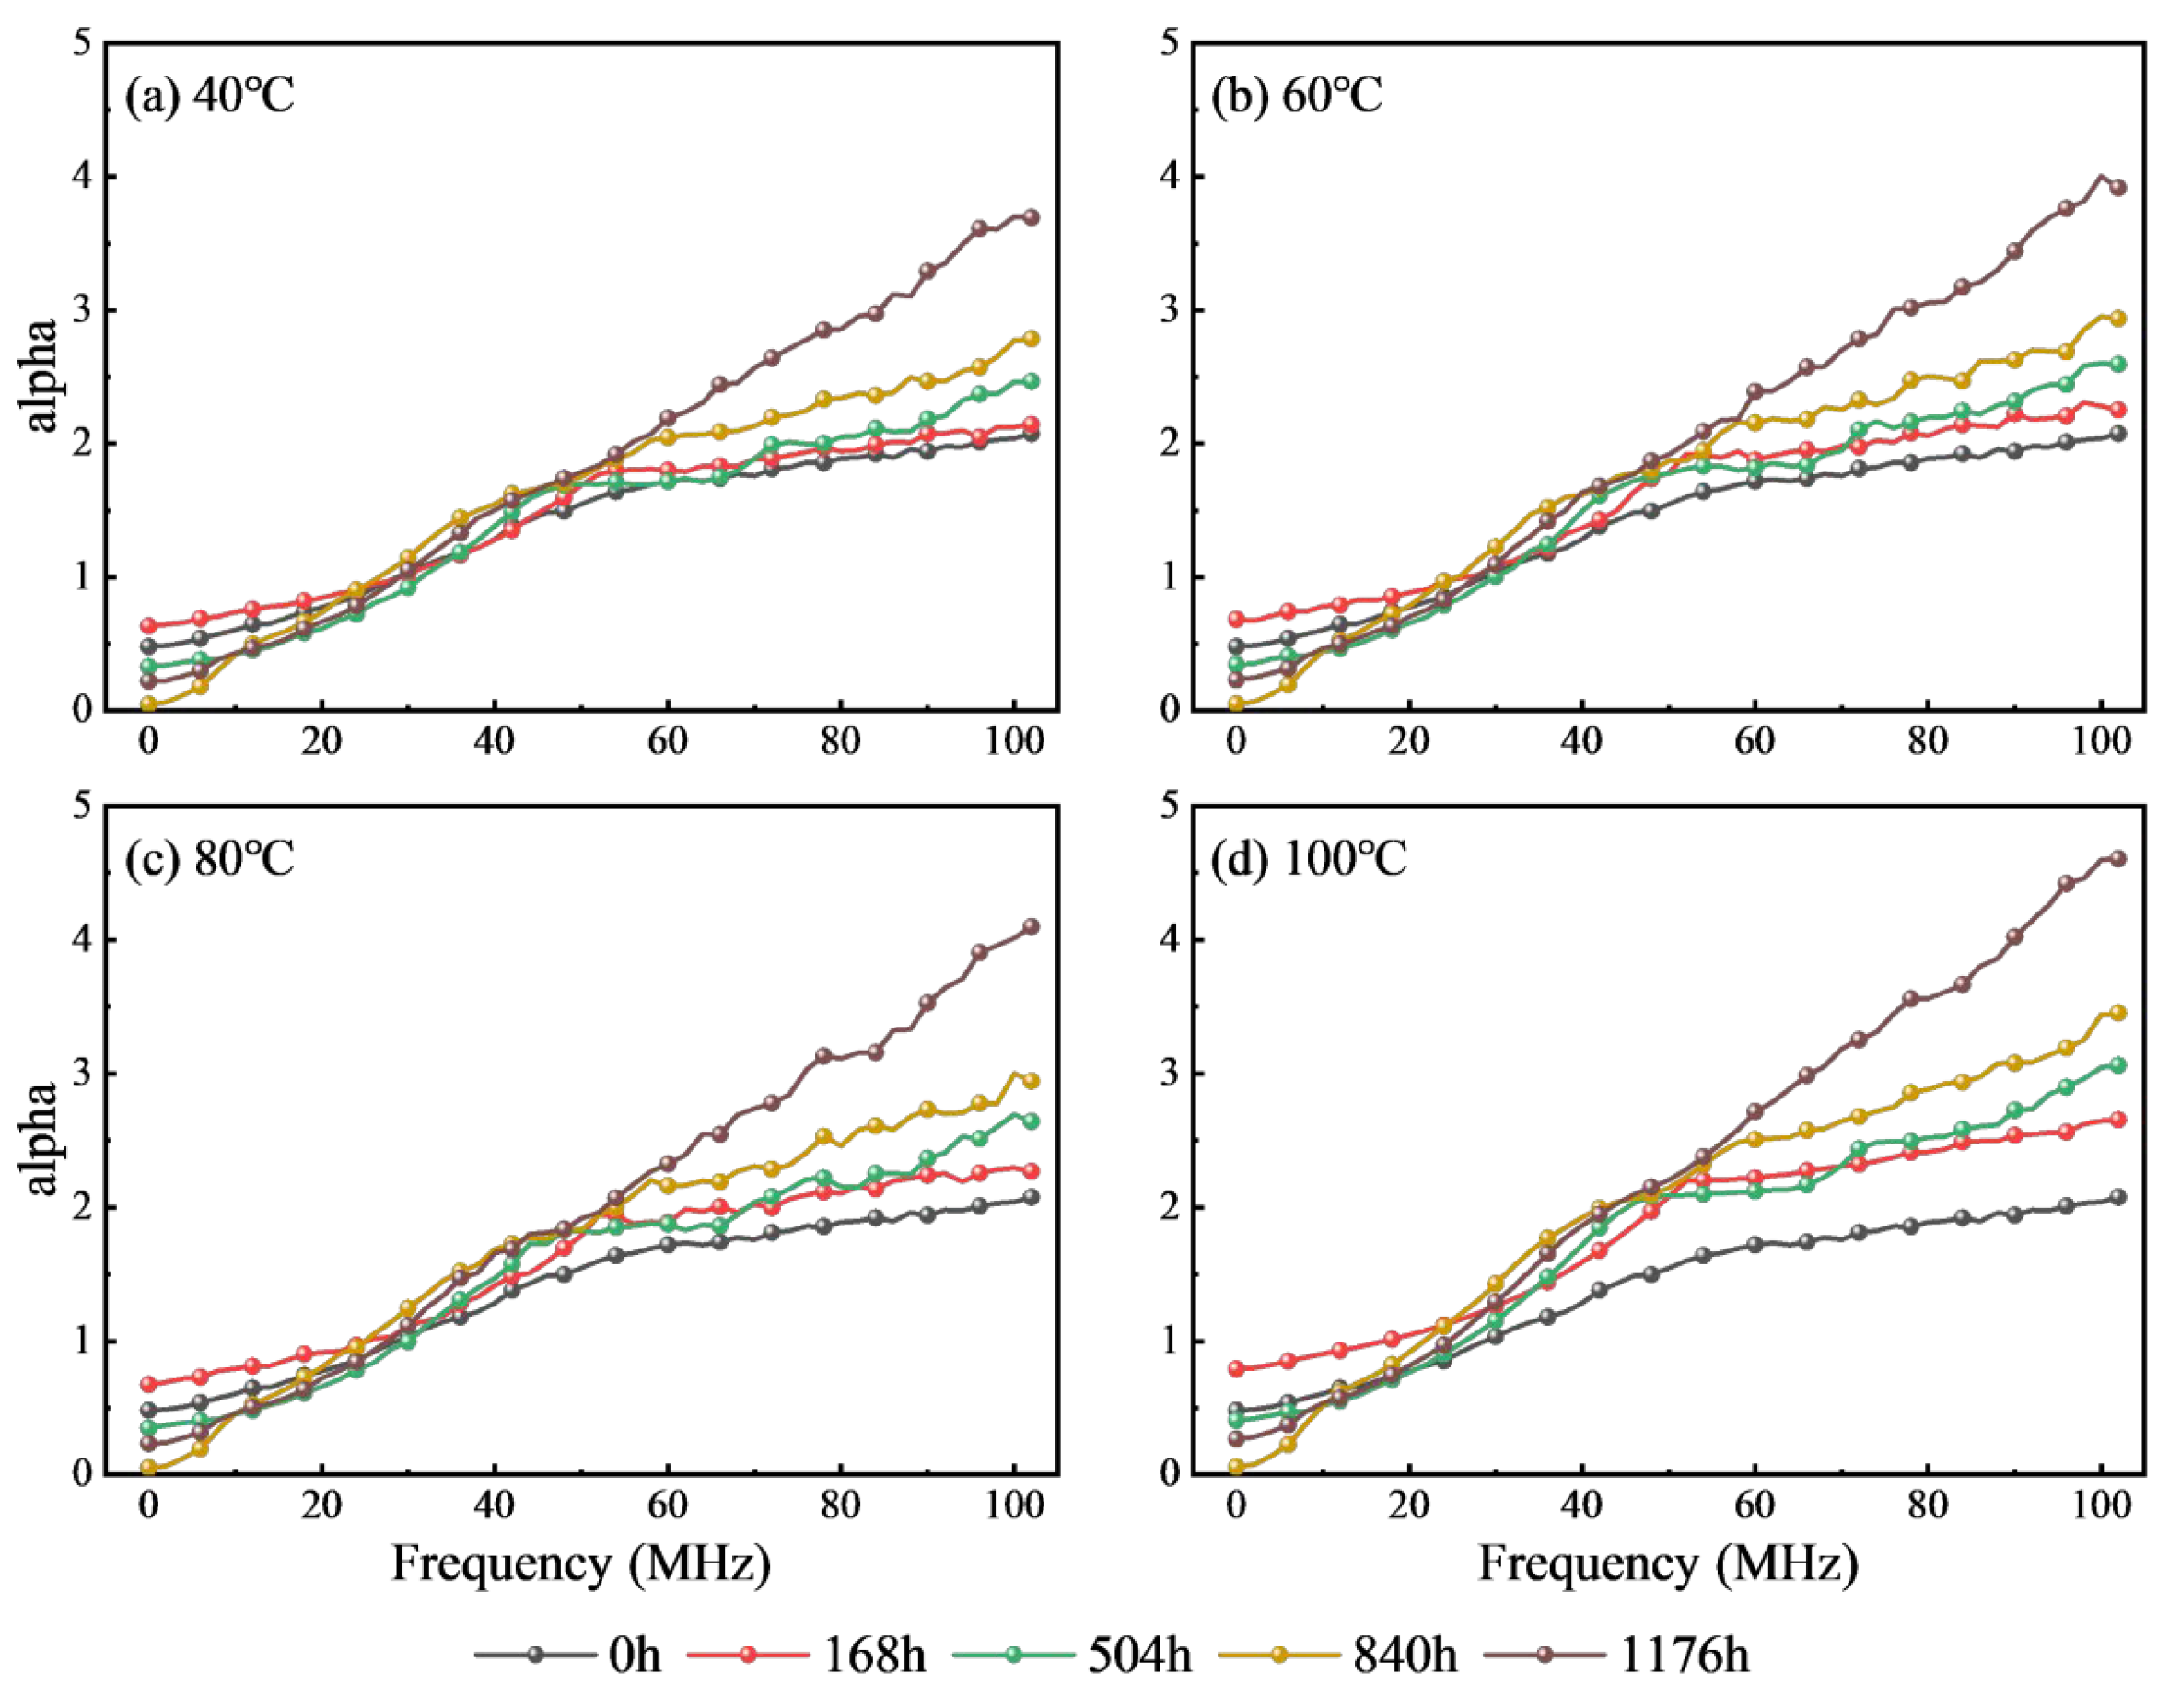
The attenuation and dispersion of acoustic waves in a sample are related not only to the properties of the acoustic wave signal itself, but also to the material’s density, Young’s modulus, and elasticity. As the XLPE material ages, its inherent properties change. The changes affect the attenuation and dispersion characteristics of the acoustic waves. The frequency components of the acoustic waves detected by the laboratory-built PEA system are mainly concentrated in the DC to 100 MHz range. Therefore, we focus on the changes of acoustic wave attenuation and dispersion within the 0–100 MHz range. The attenuation coefficients of acoustic waves are shown in Figure 6.
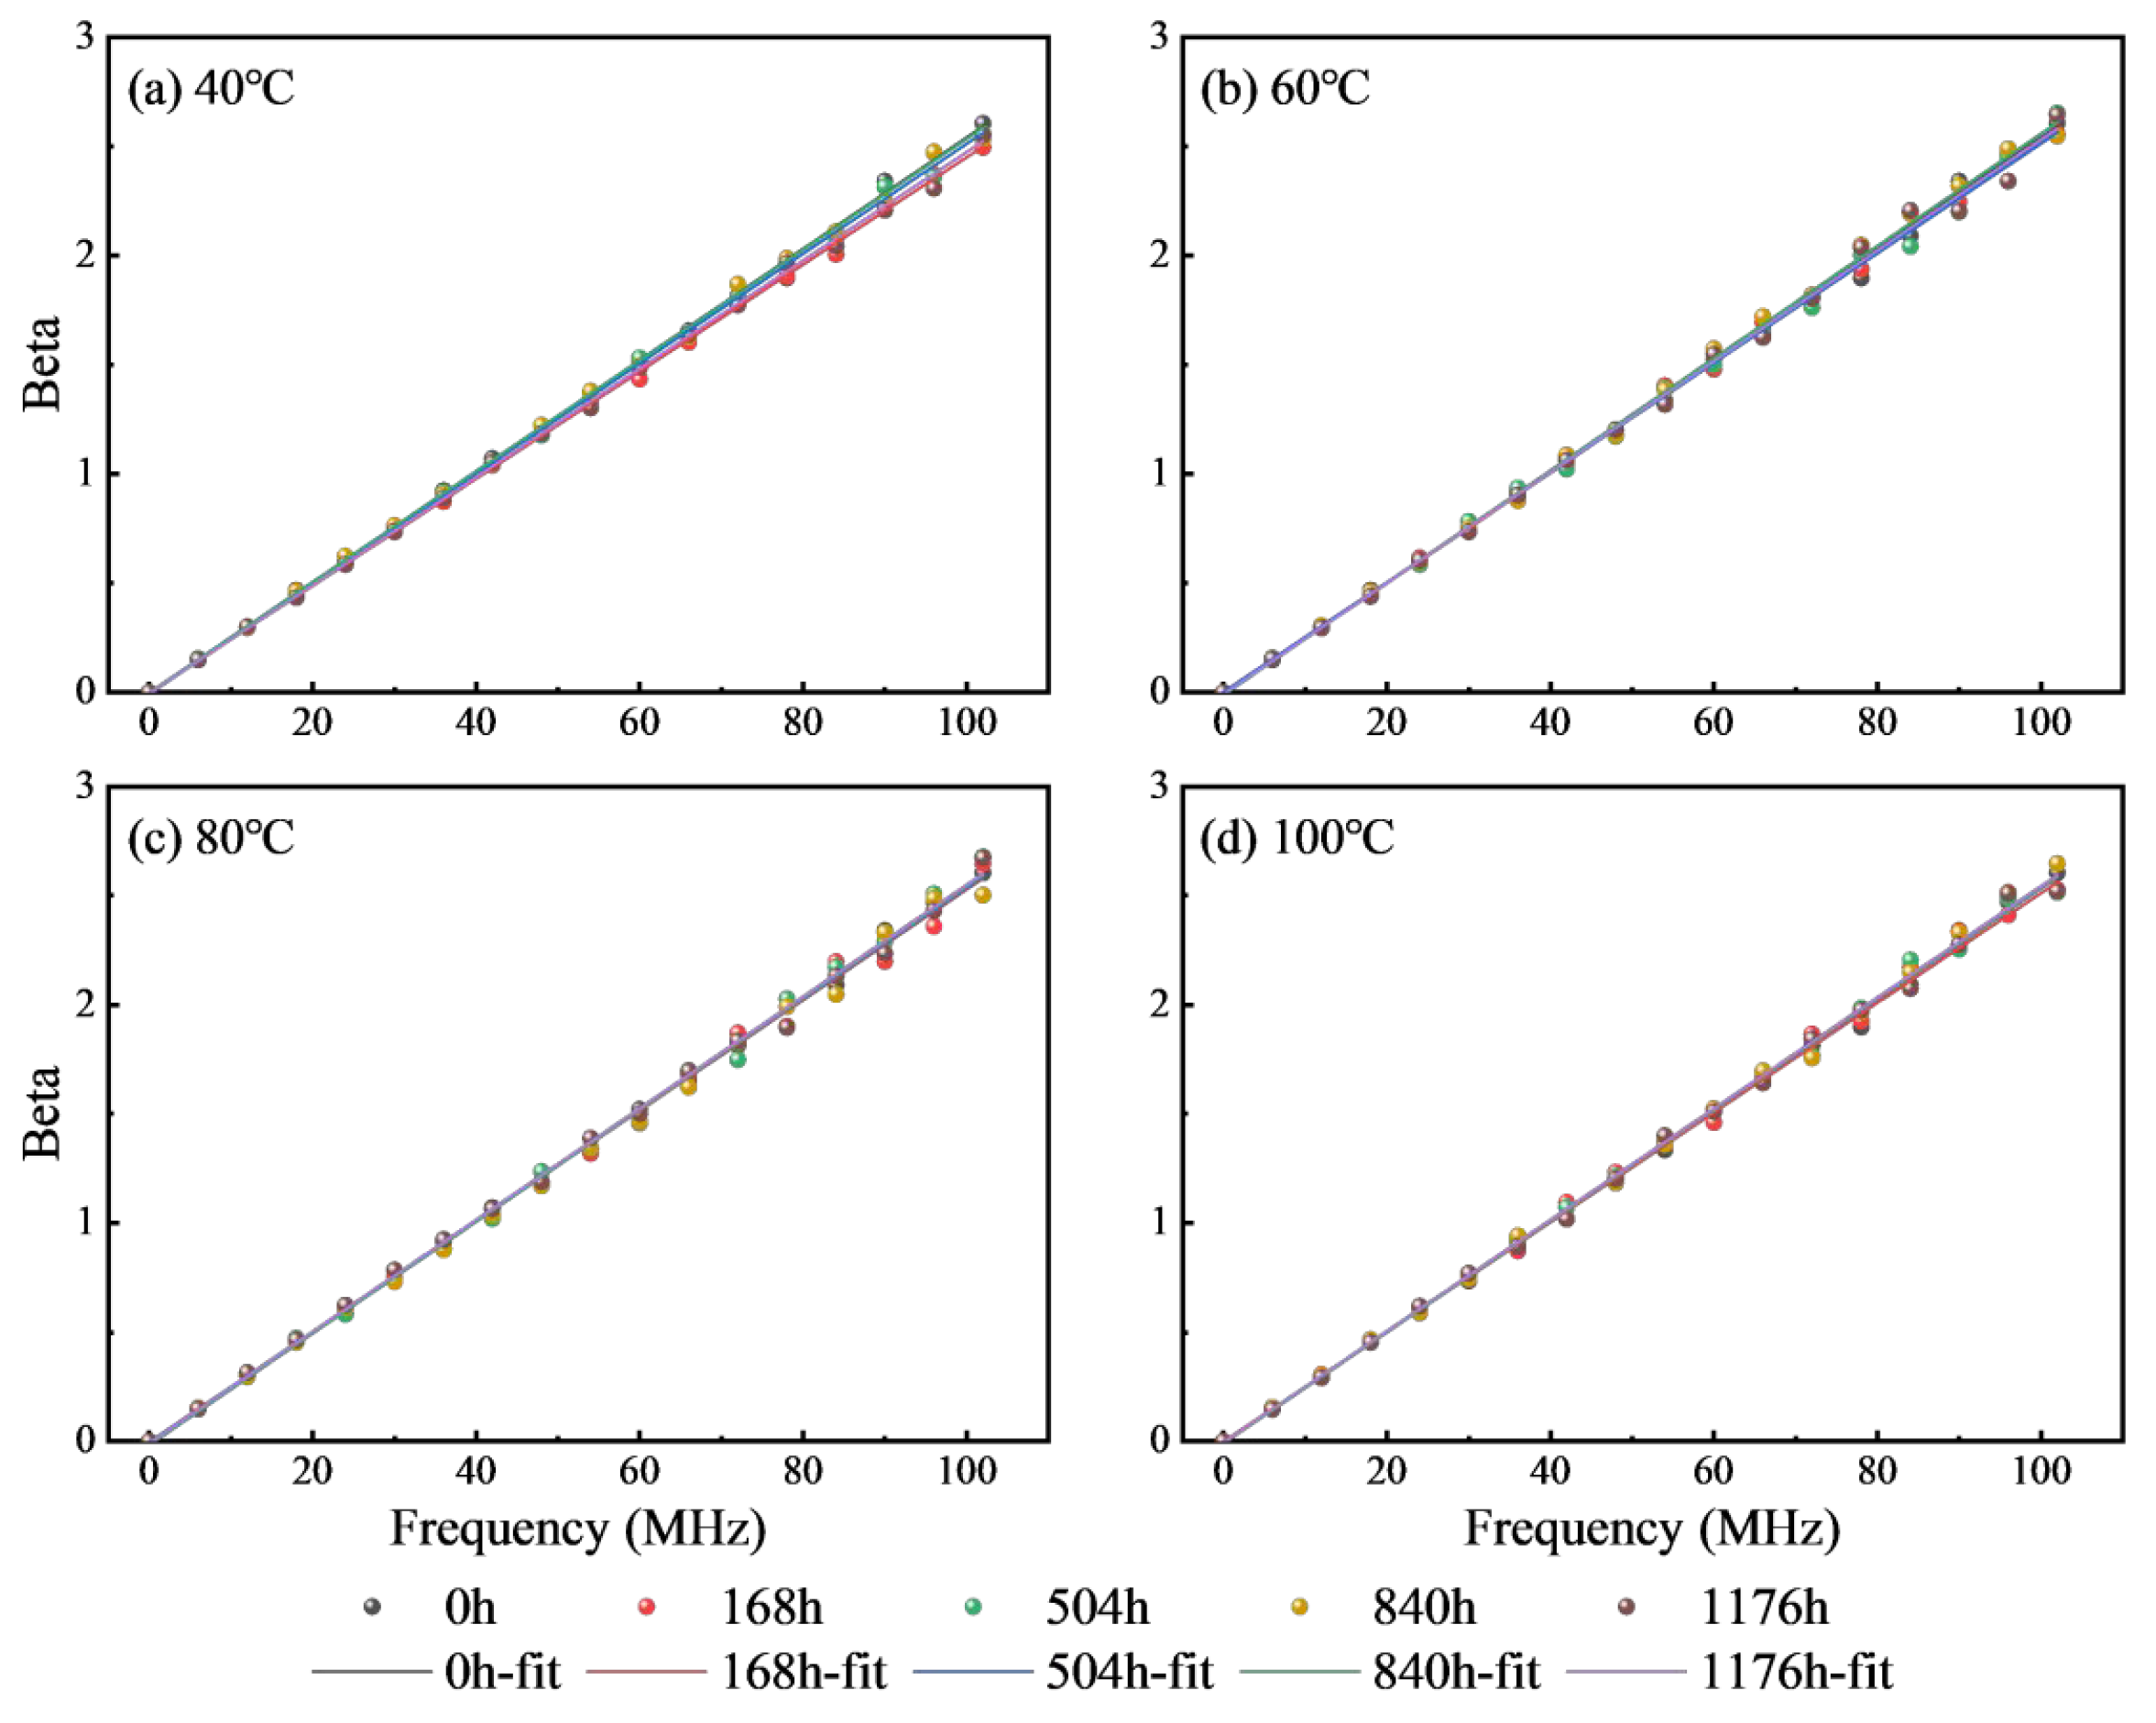
Under different aging conditions, the attenuation coefficient of acoustic wave propagation inside the sample changes significantly, while the dispersion coefficient does not change much. The variation of dispersion for different frequency components of the acoustic wave in the sample under different aging conditions is plotted in Figure 7. It can be seen that within the 0–100 MHz range, the attenuation coefficient of XLPE generally shows a one-dimensional linear relationship with aging time. At different aging temperatures, the curves of the dispersion coefficient versus frequency largely coincide as aging time increases. Fitting the dispersion coefficients of sound waves under different aging conditions yields the fitted results of the dispersion coefficient as a function of frequency, shown in the following equation:
β f = 0.025 · f
where f is the frequency of the sound in MHz.
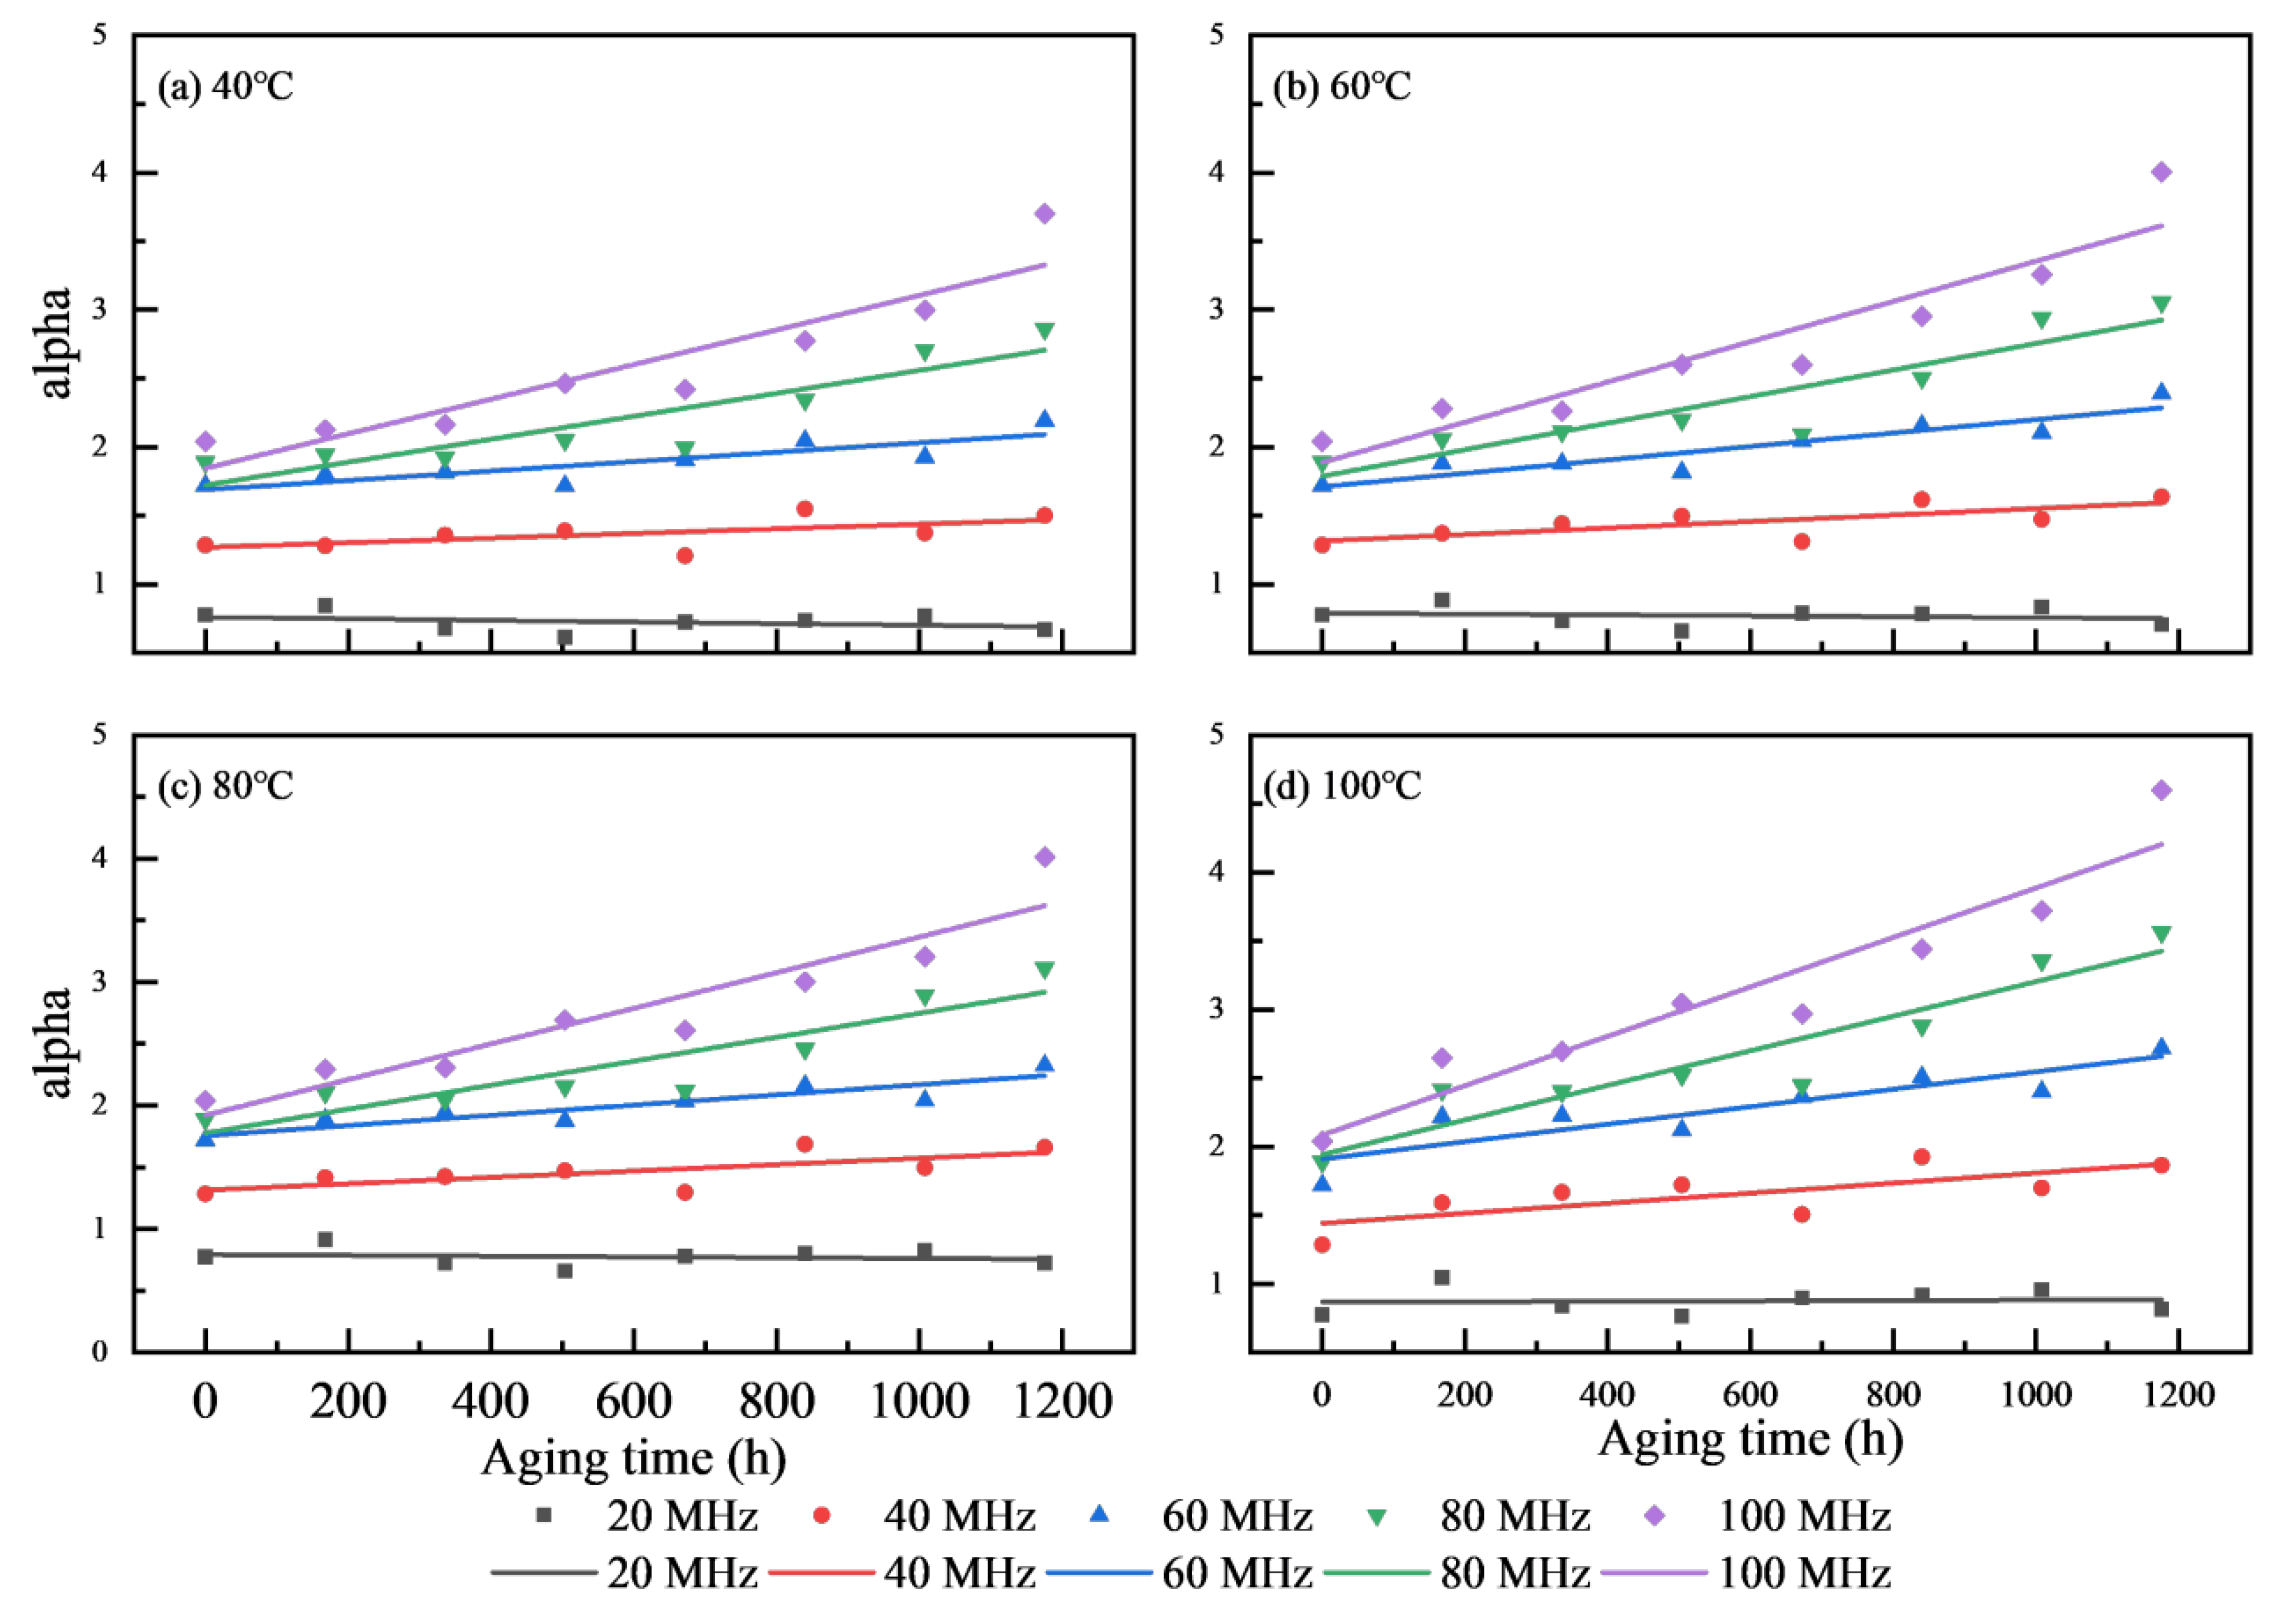
The fitted curve of the sound attenuation coefficient as a function of aging time is shown in Figure 8. Fitting yields the relationship between aging time t and the attenuation coefficient as shown in the equation below:
α f , t a , T = 3 e f 33 1 ln T 100,000 t a + α f , 0 , T 0
where f is the signal frequency in MHz, T is the aging temperature in °C, t a is the aging time in hours, and α f , 0 , T 0 is the attenuation coefficient of the acoustic wave in the unaged sample.
The dispersion coefficient of acoustic waves in the material under different aging degrees is essentially the same. Therefore, the influence of aging degree on the dispersion coefficient can be neglected. The acoustic wave attenuation function for materials with different aging states is then:
G f , z = e 3 e f 33 1 ln T 100,000 t a + α f , 0 z j β f z

4.2. Influence of Aging on Material Dielectric Constant

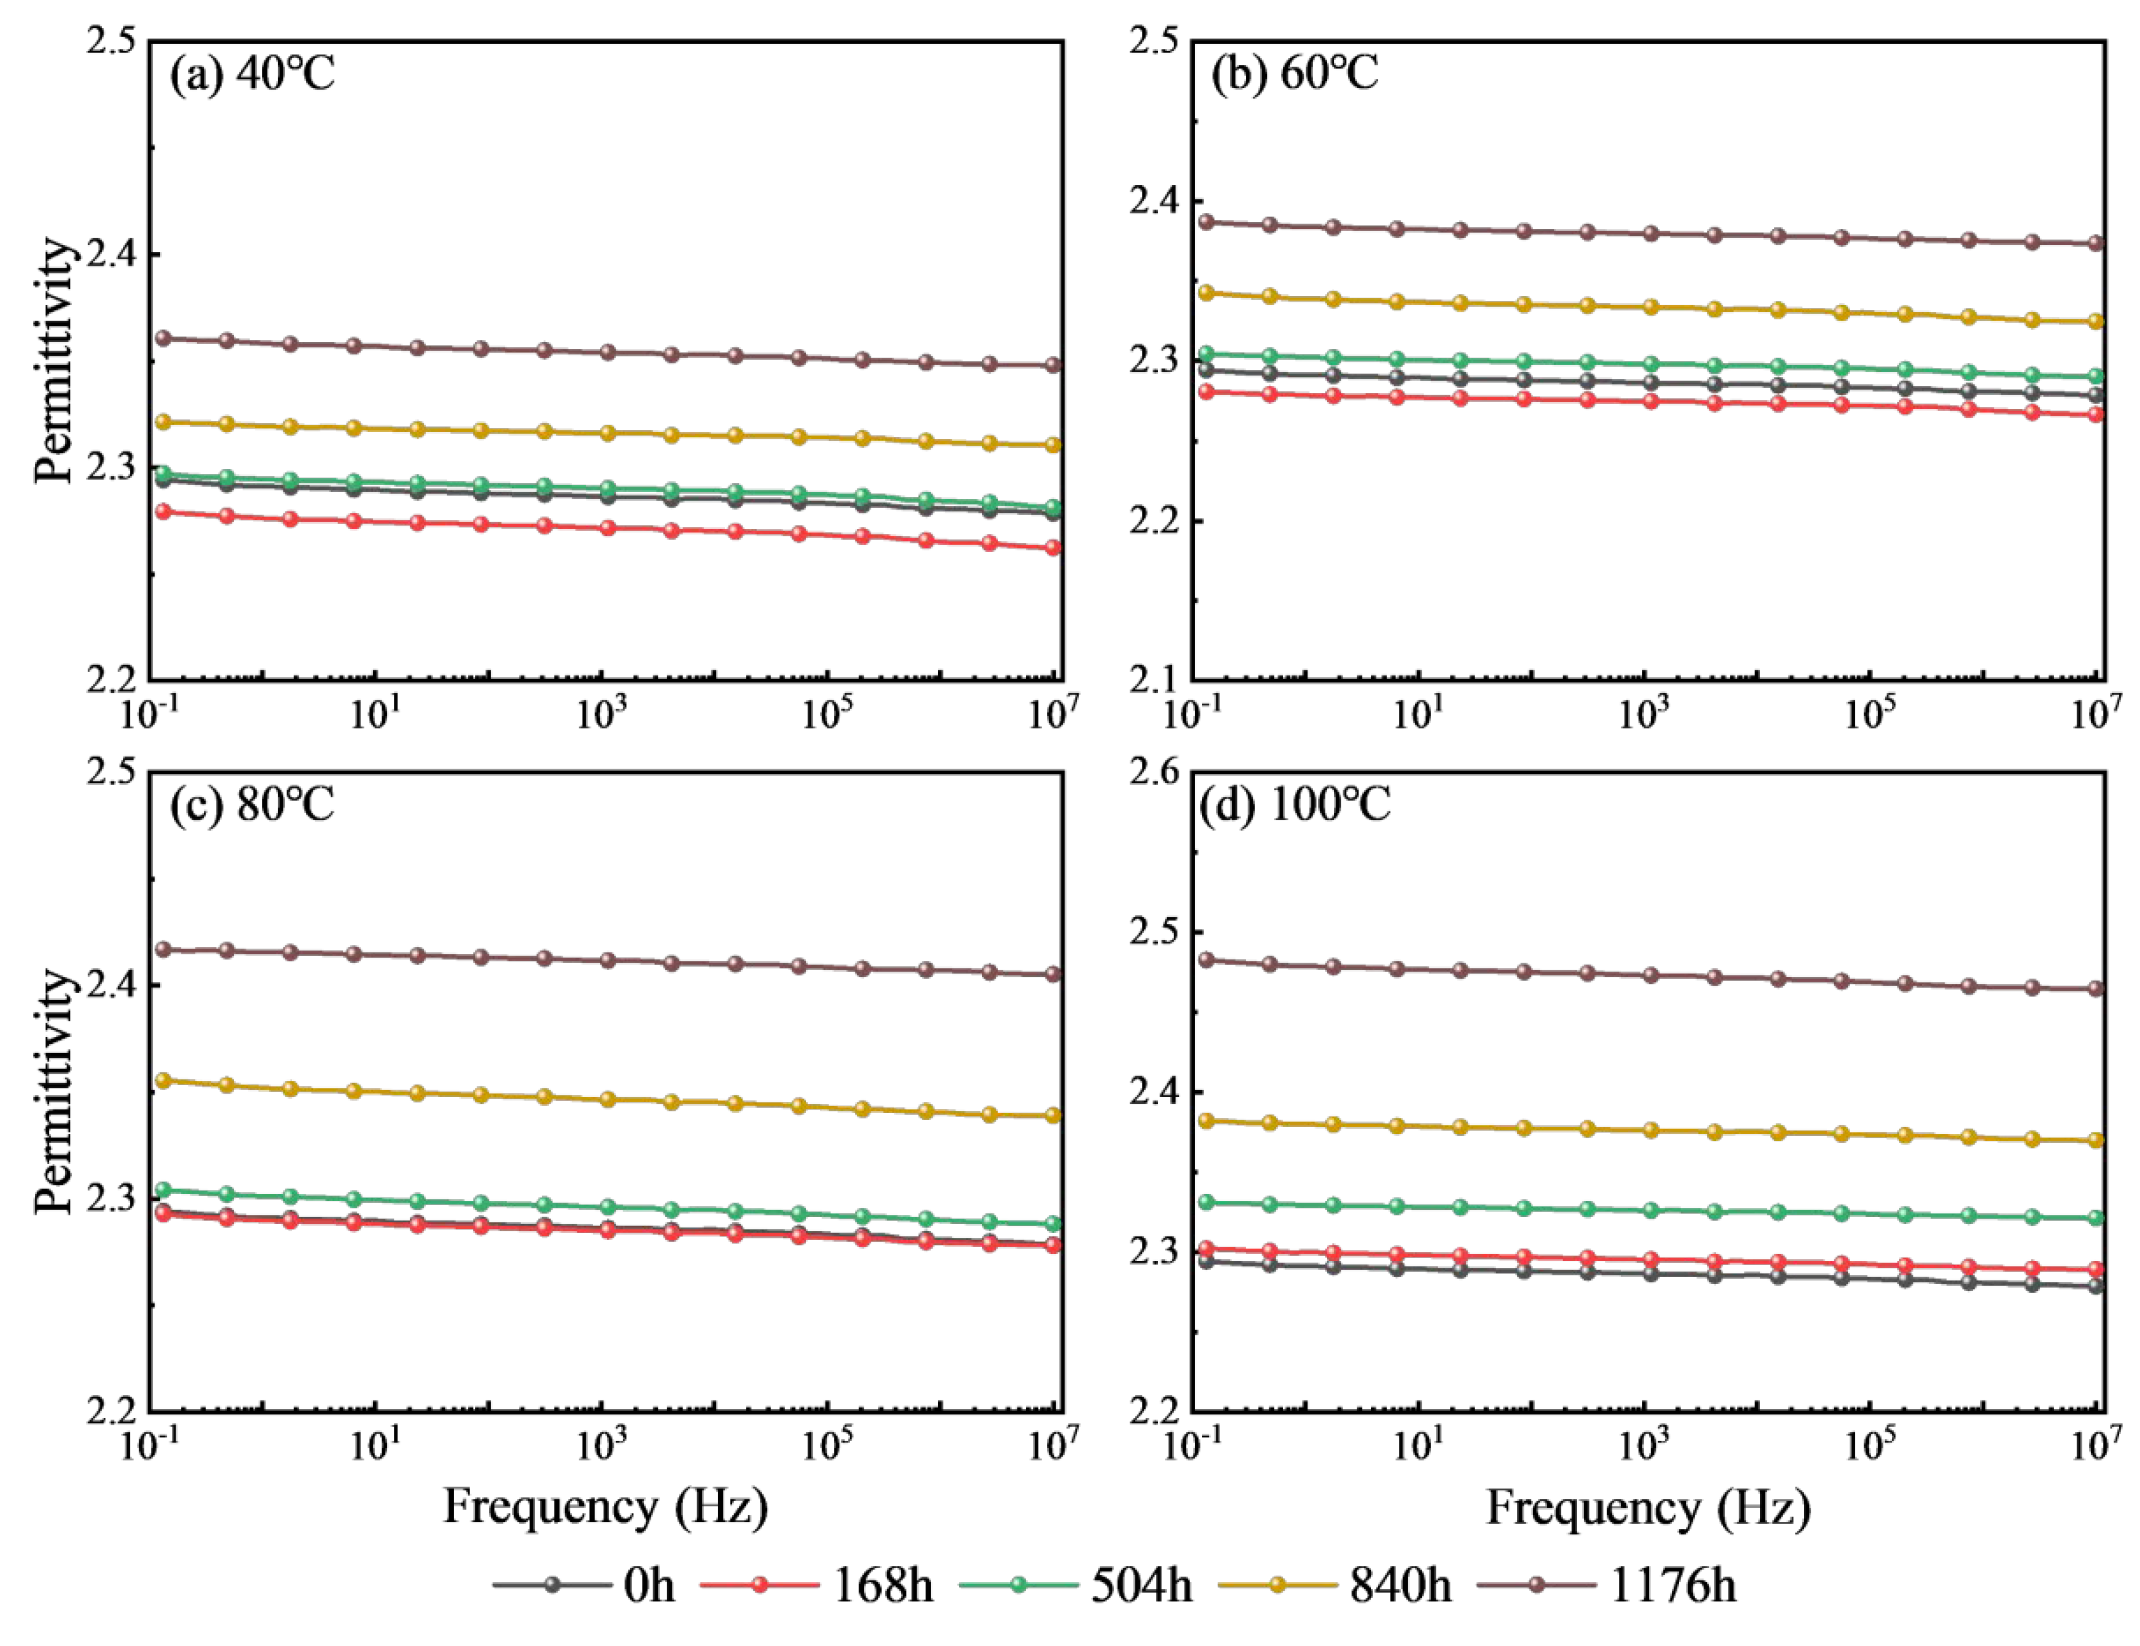
When the dielectric material is under different aging conditions, the dielectric constants vary. Therefore, when measuring space charge distribution in materials under different aging conditions, it is necessary to consider the changes in the dielectric constant. This paper investigates the variation law of the dielectric constant of cross-linked polyethylene under different aging temperatures by measuring the dielectric constant of samples aged at constant temperatures of 40, 60, 80, and 100 °C. The measurement results of the dielectric constant are shown in Figure 9. It can be seen that the dielectric constant shows a decreasing trend with increasing frequency. The dielectric constant initially decreases slightly and then gradually increases with increasing aging time.
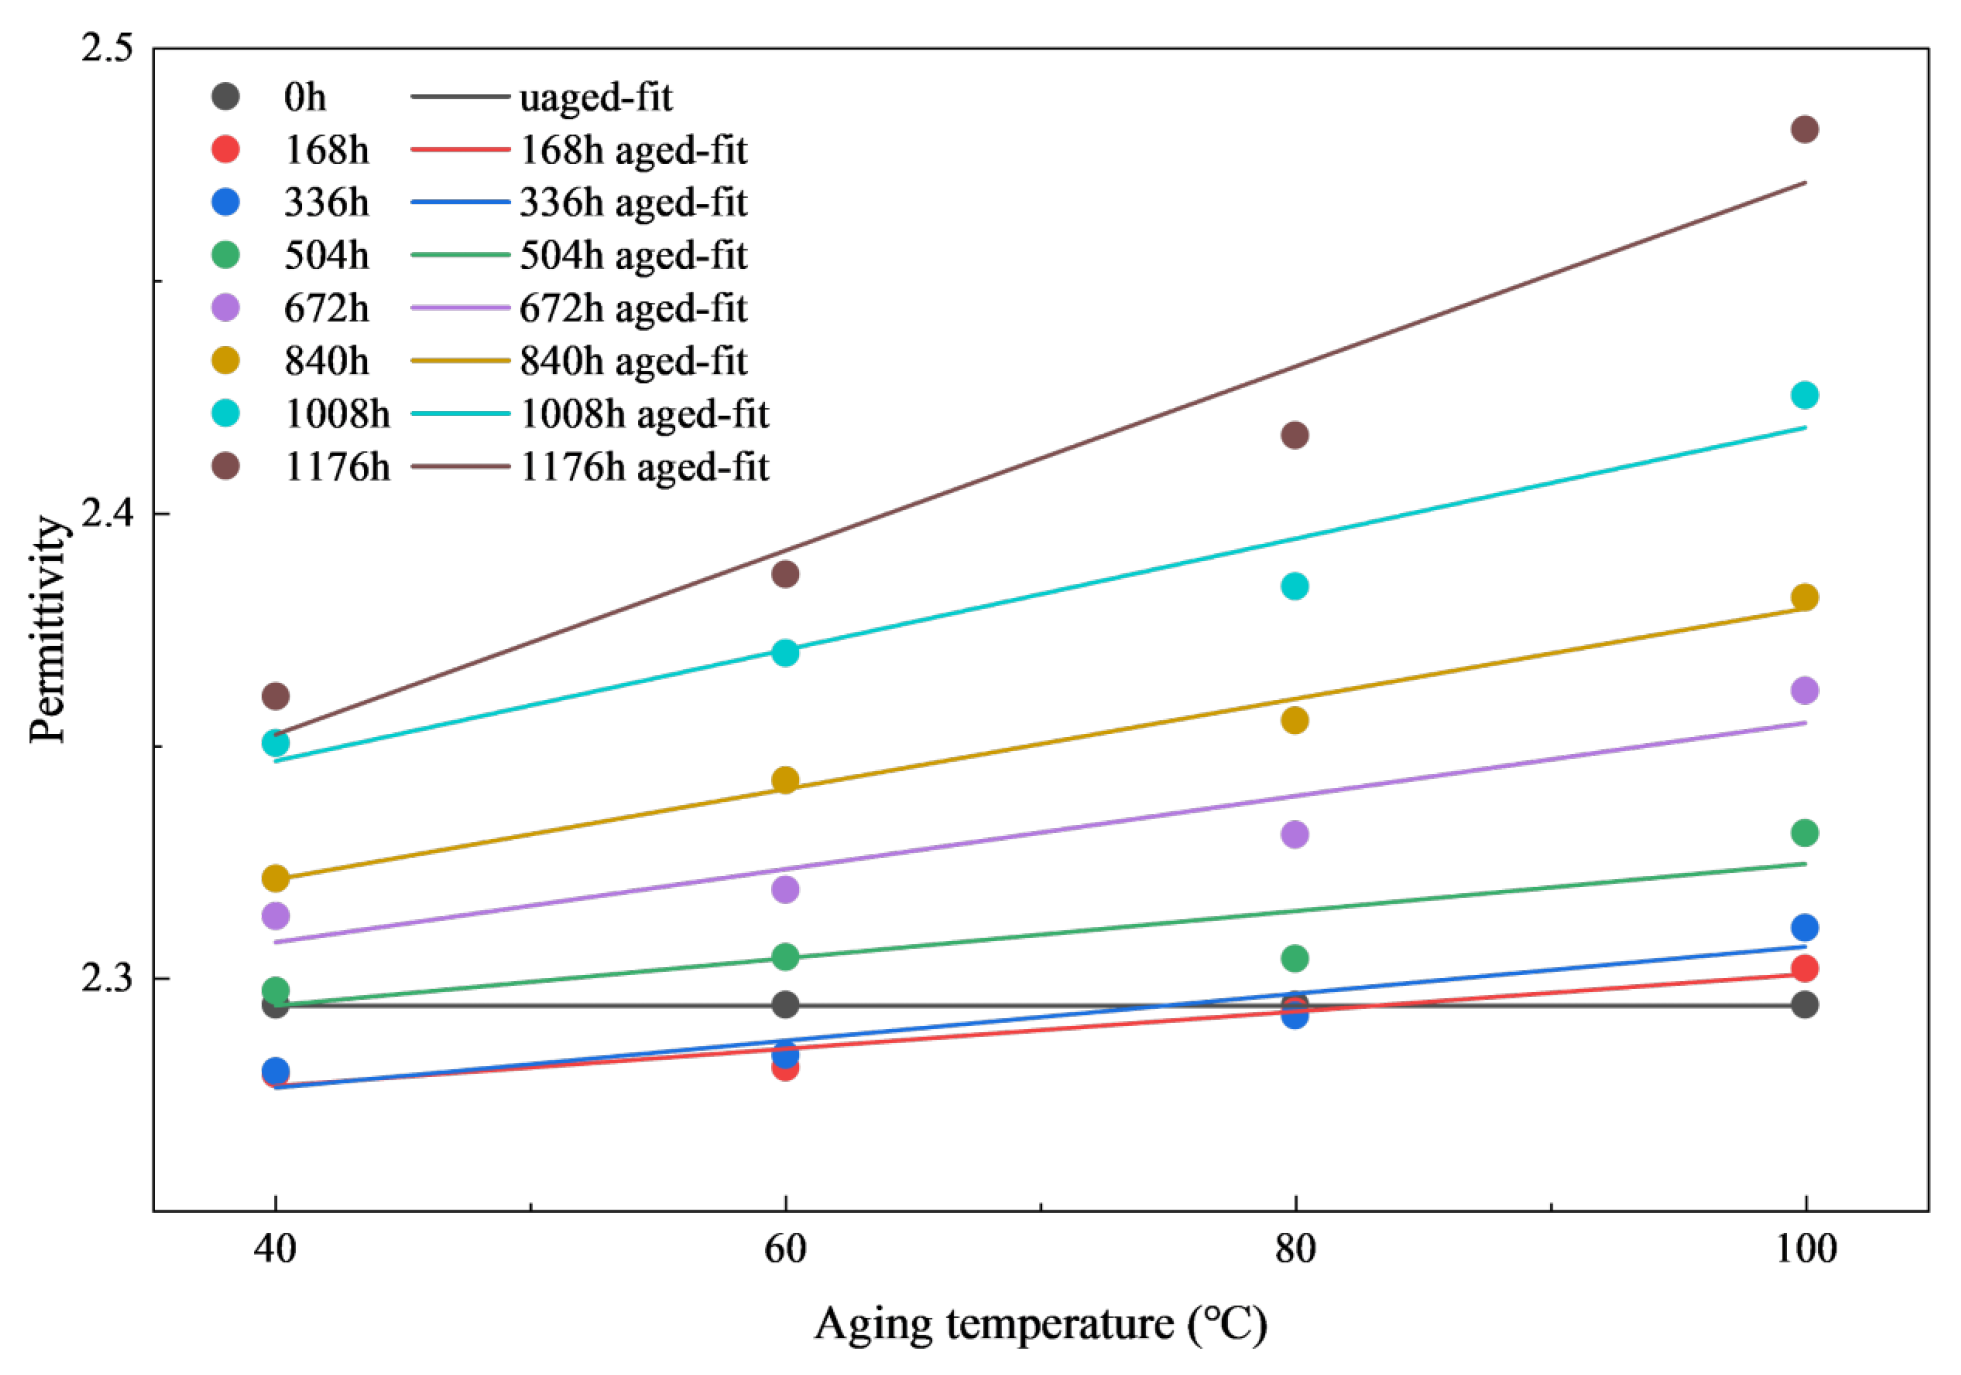
In the signal recovery algorithm for space charge measurements, the electric field within the material must be calculated using the relative permittivity. Since this study measures space charge under a DC electric field, a relative permittivity of 0.1 Hz is adopted as the material’s relative permittivity. The relationship between the relative permittivity of XLPE and aging temperature at different aging stages is shown in Figure 10.
As shown in Figure 10, the dielectric constant of XLPE insulation slices aged at different temperatures exhibits an increasing trend as aging time increases. A linear relationship provides a good fit for the variation of the dielectric constant with aging temperature. Therefore, it can be concluded that, within the same aging stage, the dielectric constant of the sample has an approximately linear relationship with aging temperature.
The distribution of space charge in the recovery algorithm differs when using a uniform dielectric constant compared to using the actual distribution. Based on the previous analysis of temperature distribution in XLPE insulation slices subjected to temperature gradient aging, it can be seen that the temperature within the specimens exhibits a linear distribution along the direction of the temperature gradient. Given the approximate linear relationship between the dielectric constant of the XLPE specimens and the aging temperature, shown in Figure 10, we hypothesize that the dielectric constant within the XLPE also follows a linear distribution along the direction of the temperature gradient under temperature gradient aging conditions. When the dielectric constants on the two sides of the cross-linked polyethylene are ε l and ε h , respectively, the internal dielectric constant distribution can be expressed by Equation (17):
ε x = ε l + x d ε h ε l

4.3. Verification of the Modified Space Charge Recovery Algorithm

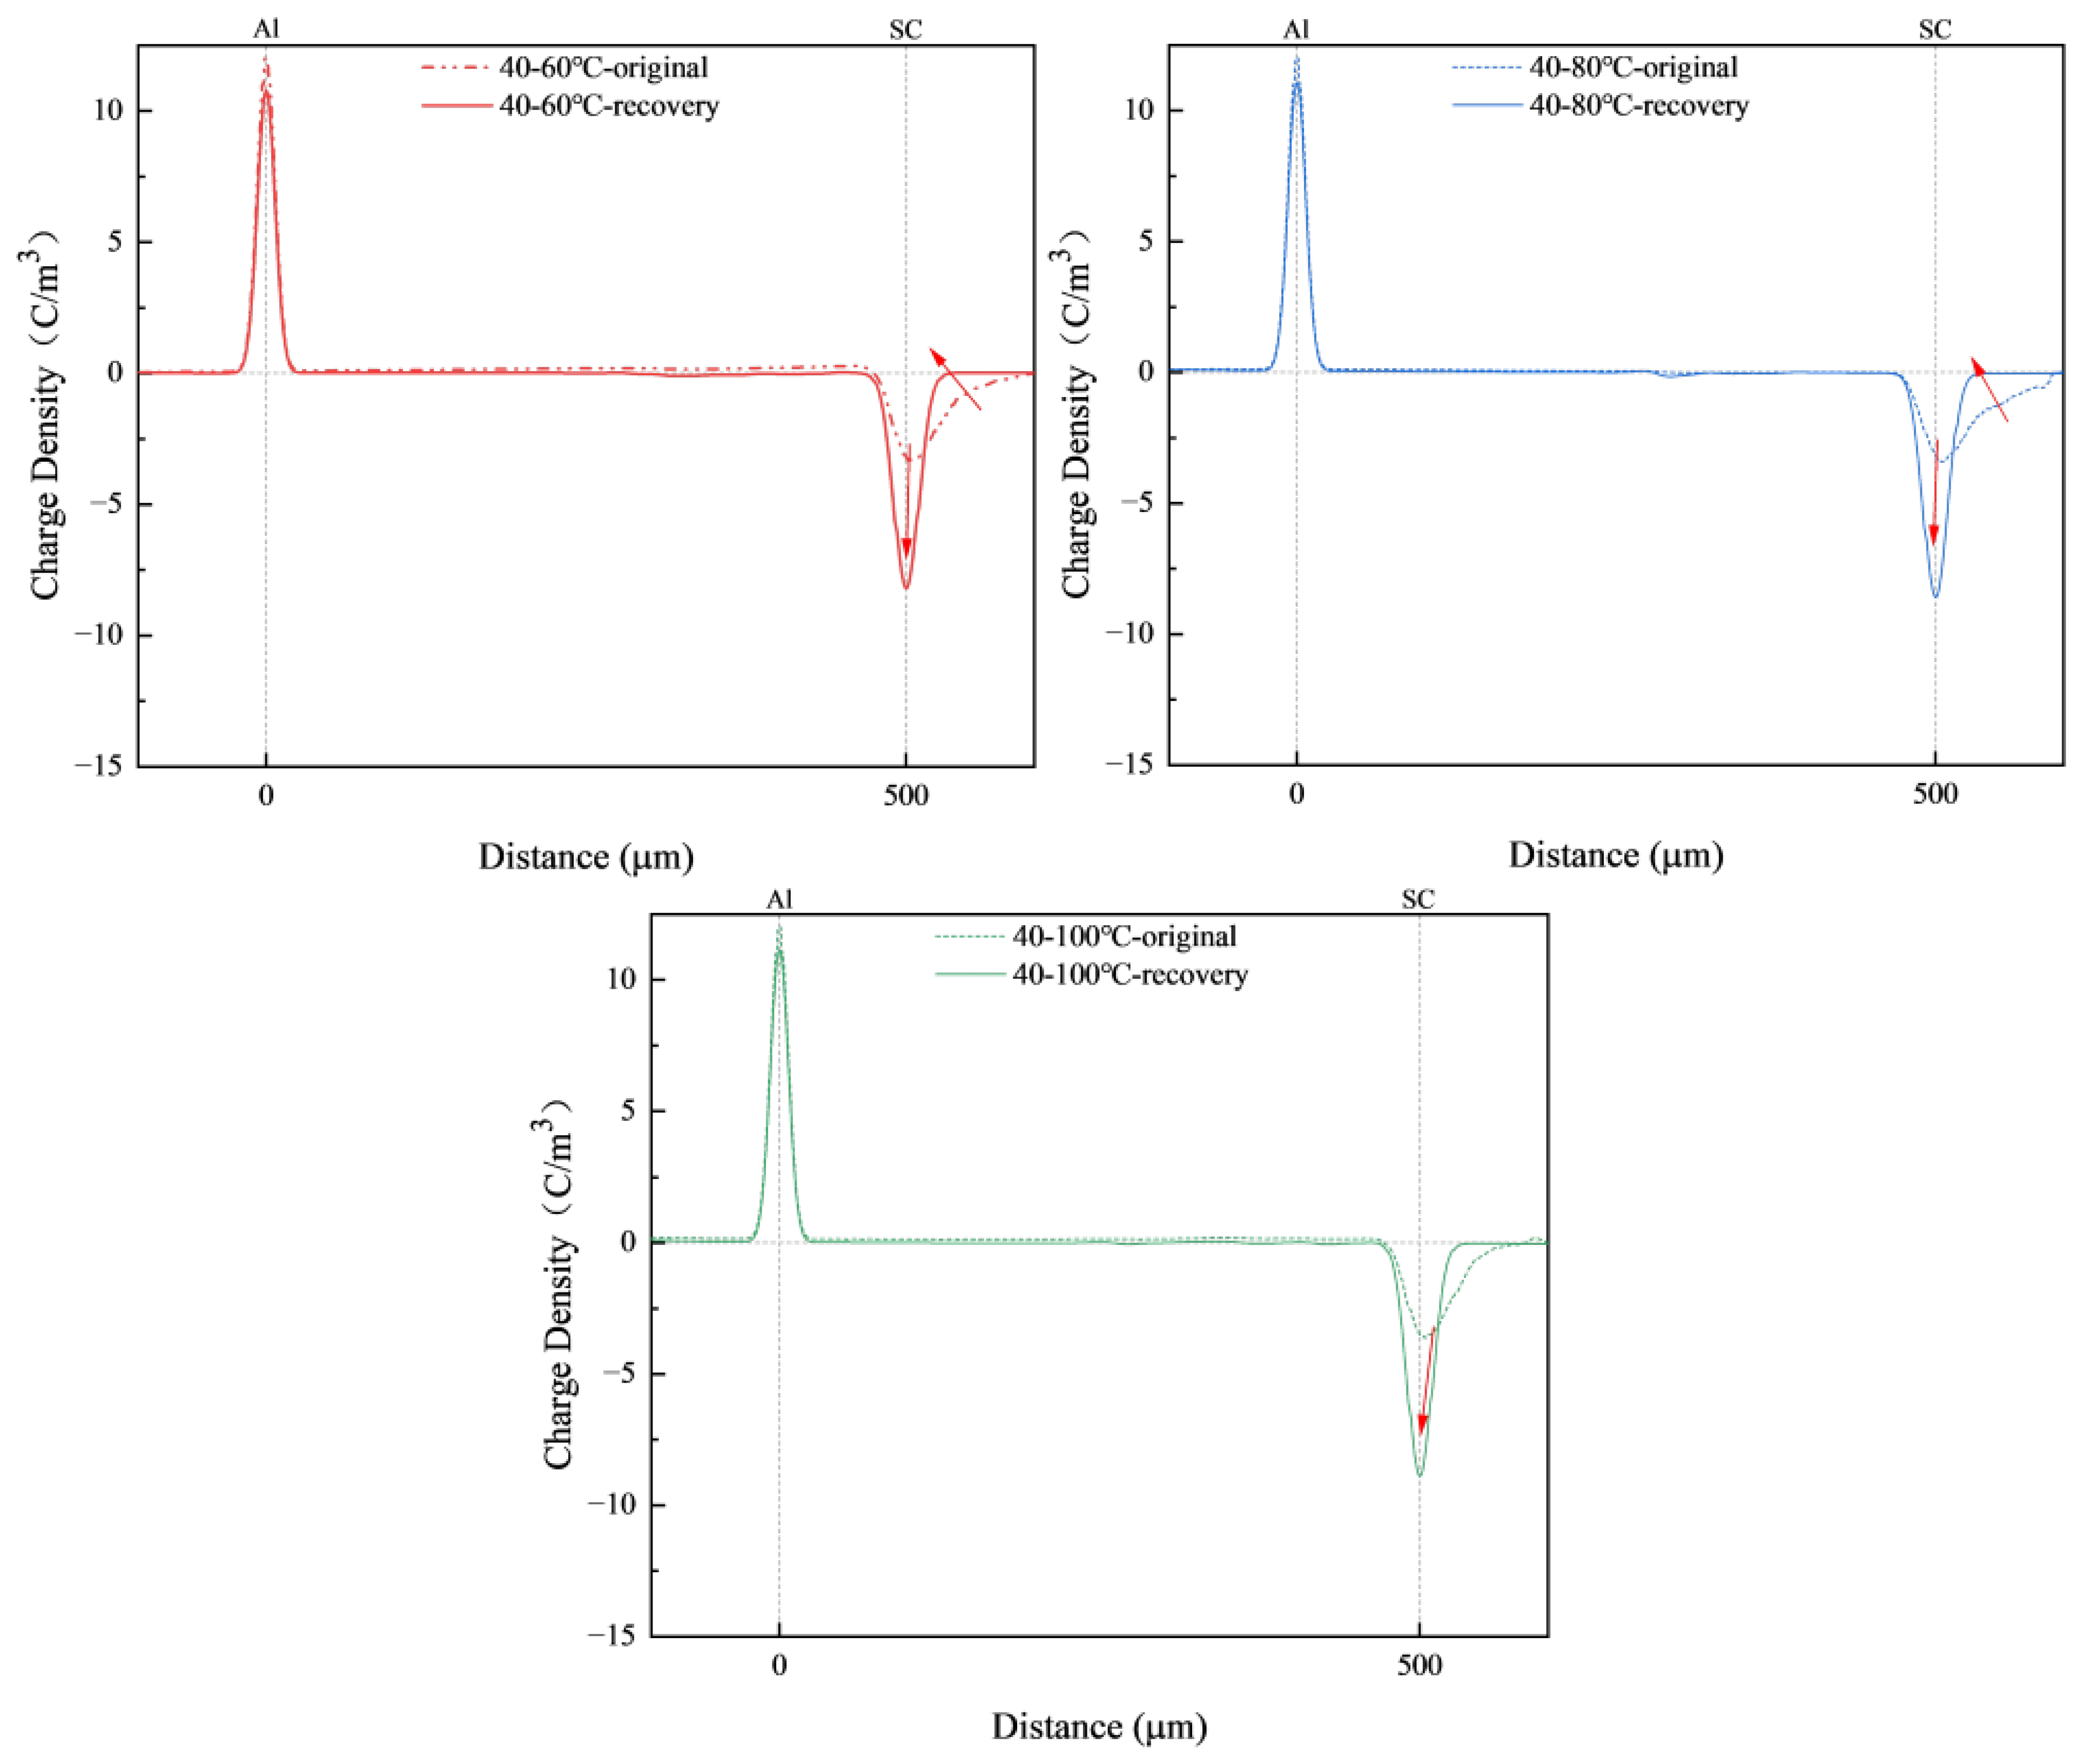
Space charge distribution was measured in the laboratory for samples aged for 49 days under temperature gradients of 40–60 °C, 40–80 °C, and 40–100 °C. The experimental conditions were an applied electric field of 5 kV/mm. The measured voltage signals were recovered, and the recovered waveforms under different aging conditions are shown in Figure 11. The red arrows in the figure indicate the changes before and after the waveform correction. Analysis of the recovery results in Figure 11 reveals that, in the space charge recovery signal obtained by the original space charge recovery algorithm, the signal peaks far from the sensor not only have small amplitudes, but also exhibit severe waveform distortion. In contrast, the two signal peaks in the space charge recovery waveform produced by the improved space charge recovery algorithm—which accounts for non-uniform aging due to temperature gradients—exhibit essentially identical basic waveforms. This is consistent with the theoretical knowledge that, under a DC electric field, the surface charge peaks on both sides of an XLPE insulation slice are equal in magnitude but opposite in polarity. This indicates that the proposed space charge recovery algorithm, which accounts for temperature gradient-induced, non-uniform aging, can more accurately reflect the distribution of space charge in non-uniformly aged XLPE specimens.
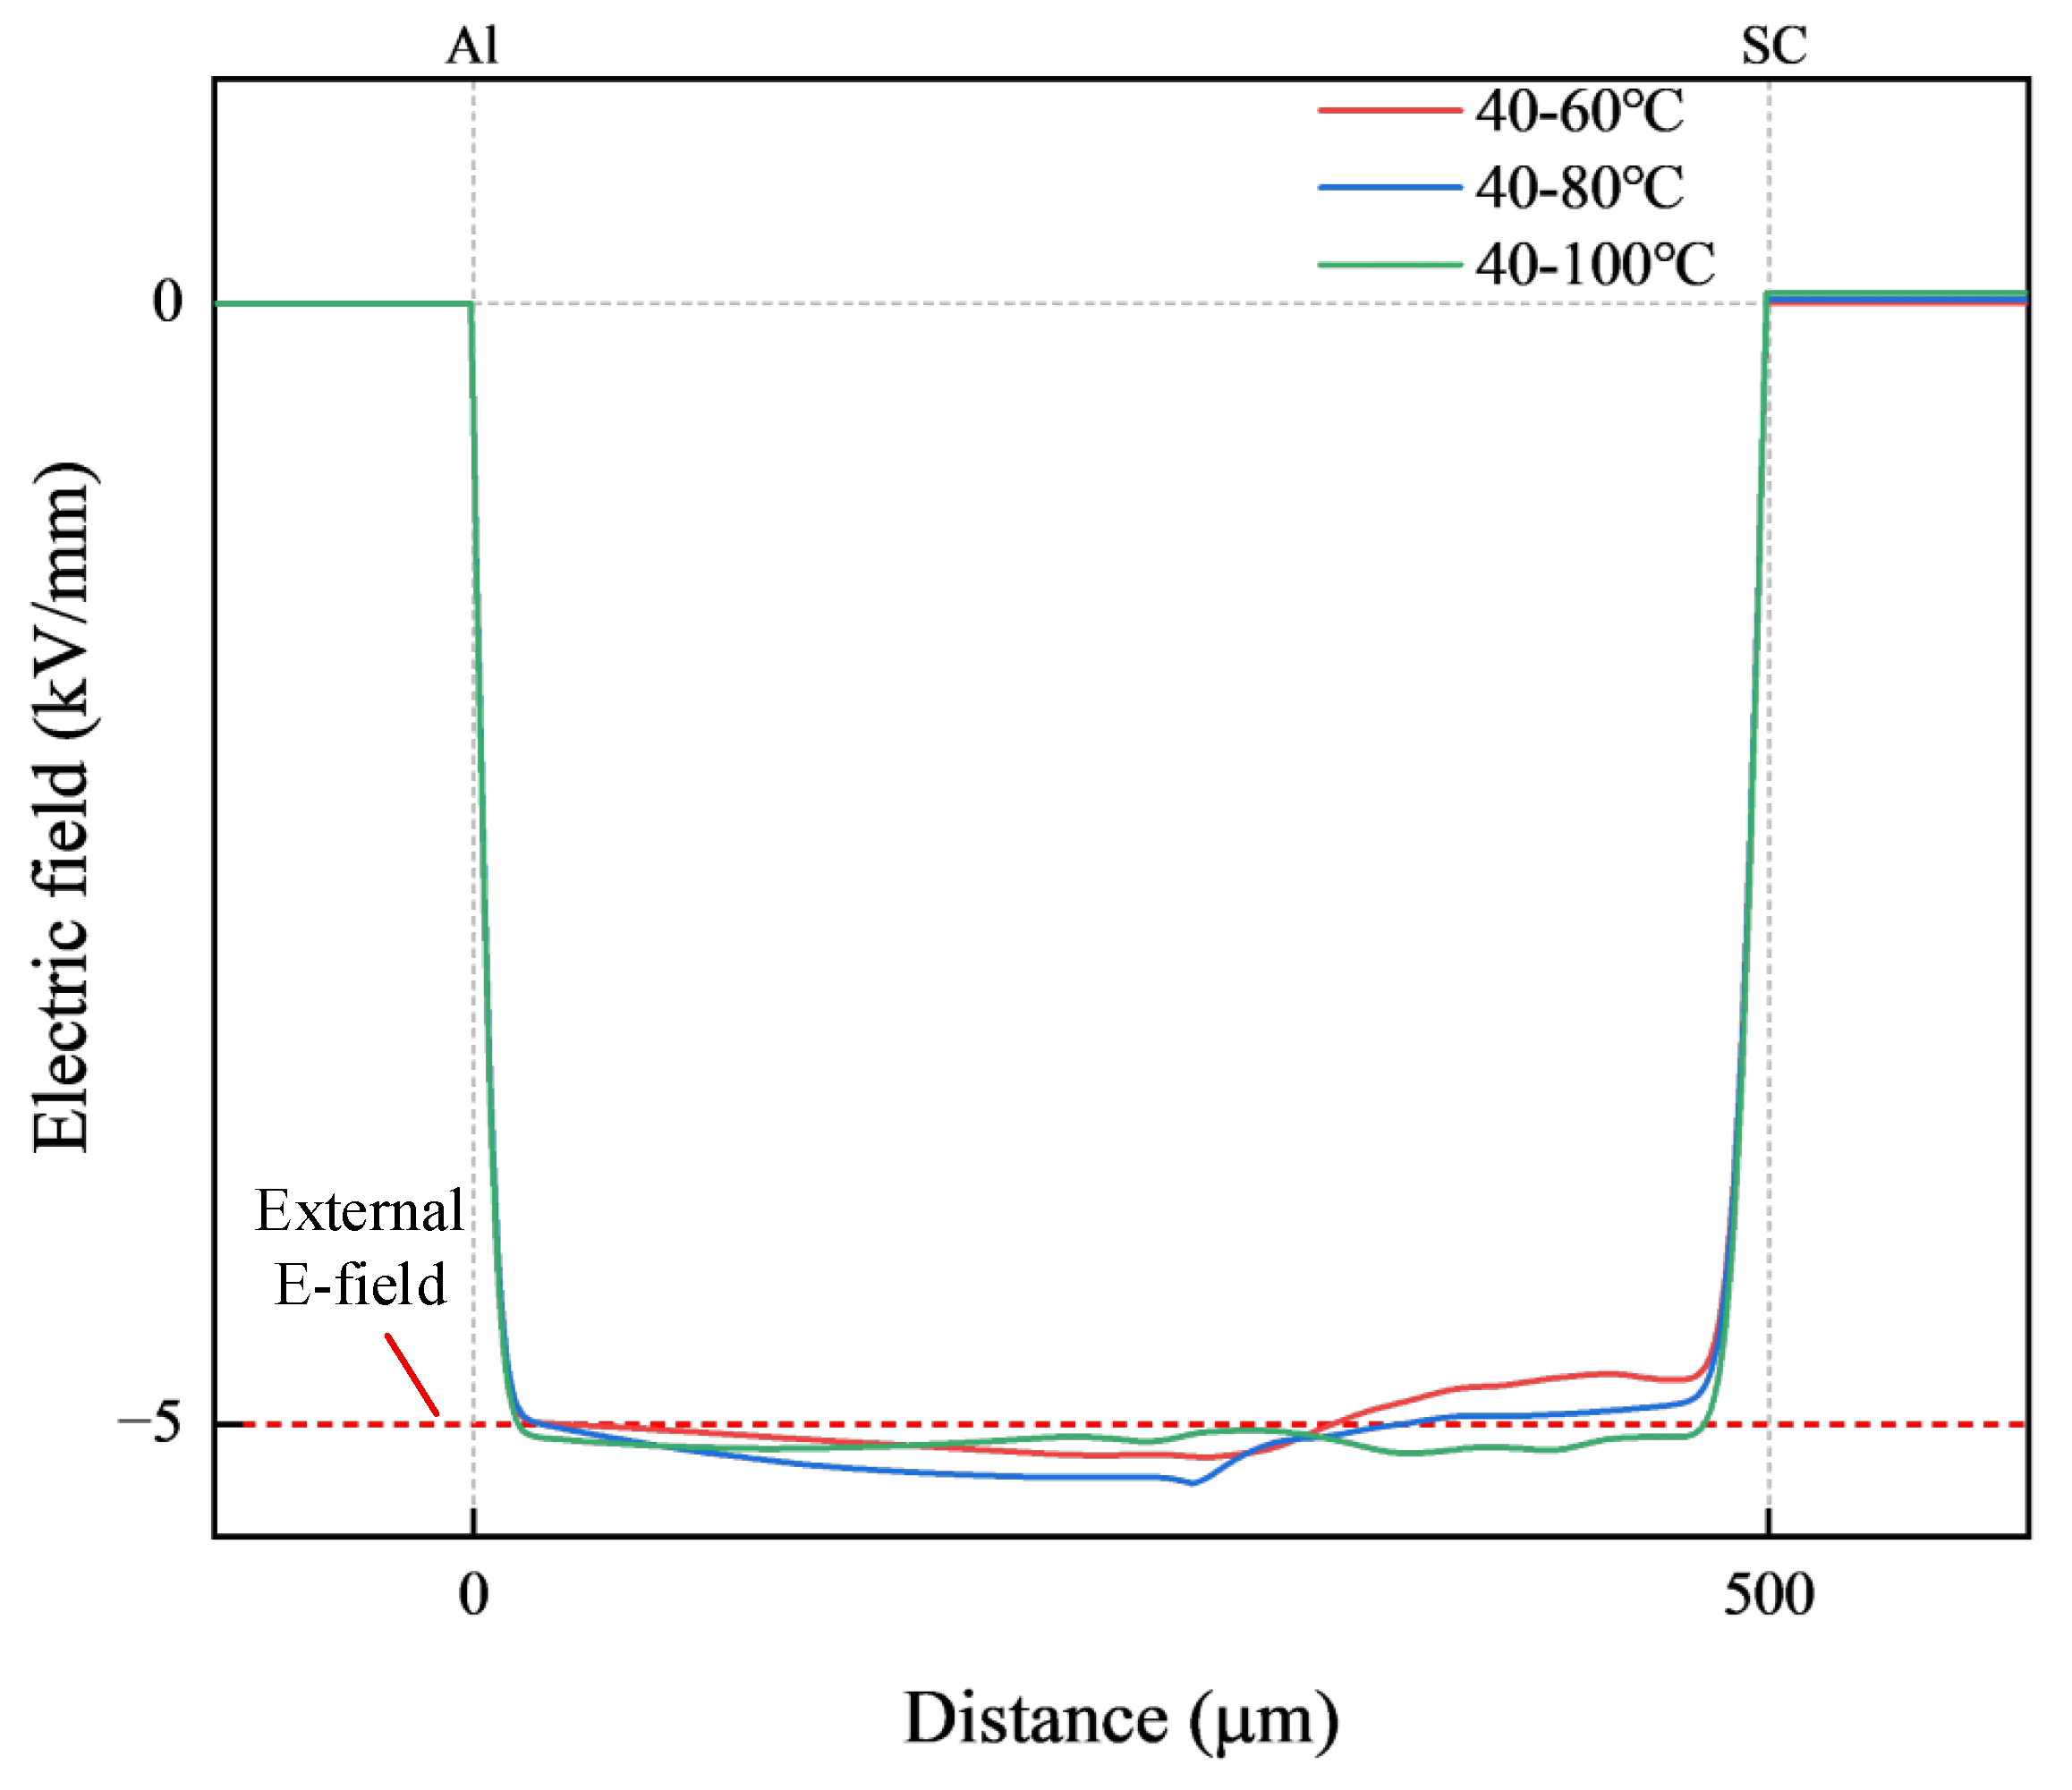
The internal electric field distribution corresponding to the recovered space charge distribution can be calculated using the Poisson equation. The formula for calculating the internal electric field distribution in XLPE specimens is as follows:
E x , t = 1 ε 0 0 x ρ x , t ε r x d x
where E x , t is the internal electric field distribution, ε 0 is the dielectric constant in a vacuum, ε r x is the relative permittivity at position x , and ρ x , t is the space charge density at position x at time t . The results shown in Figure 12 are consistent with the theoretically calculated values, which means that the accuracy of the proposed space charge recovery algorithm is verified.

4.4. Application and Verification of the Recovery Algorithm in XLPE Testing

There are two main sources of space charge inside cross-linked polyethylene. One is mobile carriers injected by the electrodes, generally having the same polarity as the injecting electrode, hence also called homo-charge. The other is generated by the ionization of impurities or molecules present inside the sample under the applied electric field, and such carriers typically migrate towards the oppositely poled electrode under the field, called a hetero-charge. Research indicates that for cross-linked polyethylene, under high field strength, the main accumulation inside the sample is homo-charge. However, under aging conditions, carrier mobility increases with the degree of aging, and the hetero-charge appears within the material [19,20,21,22].
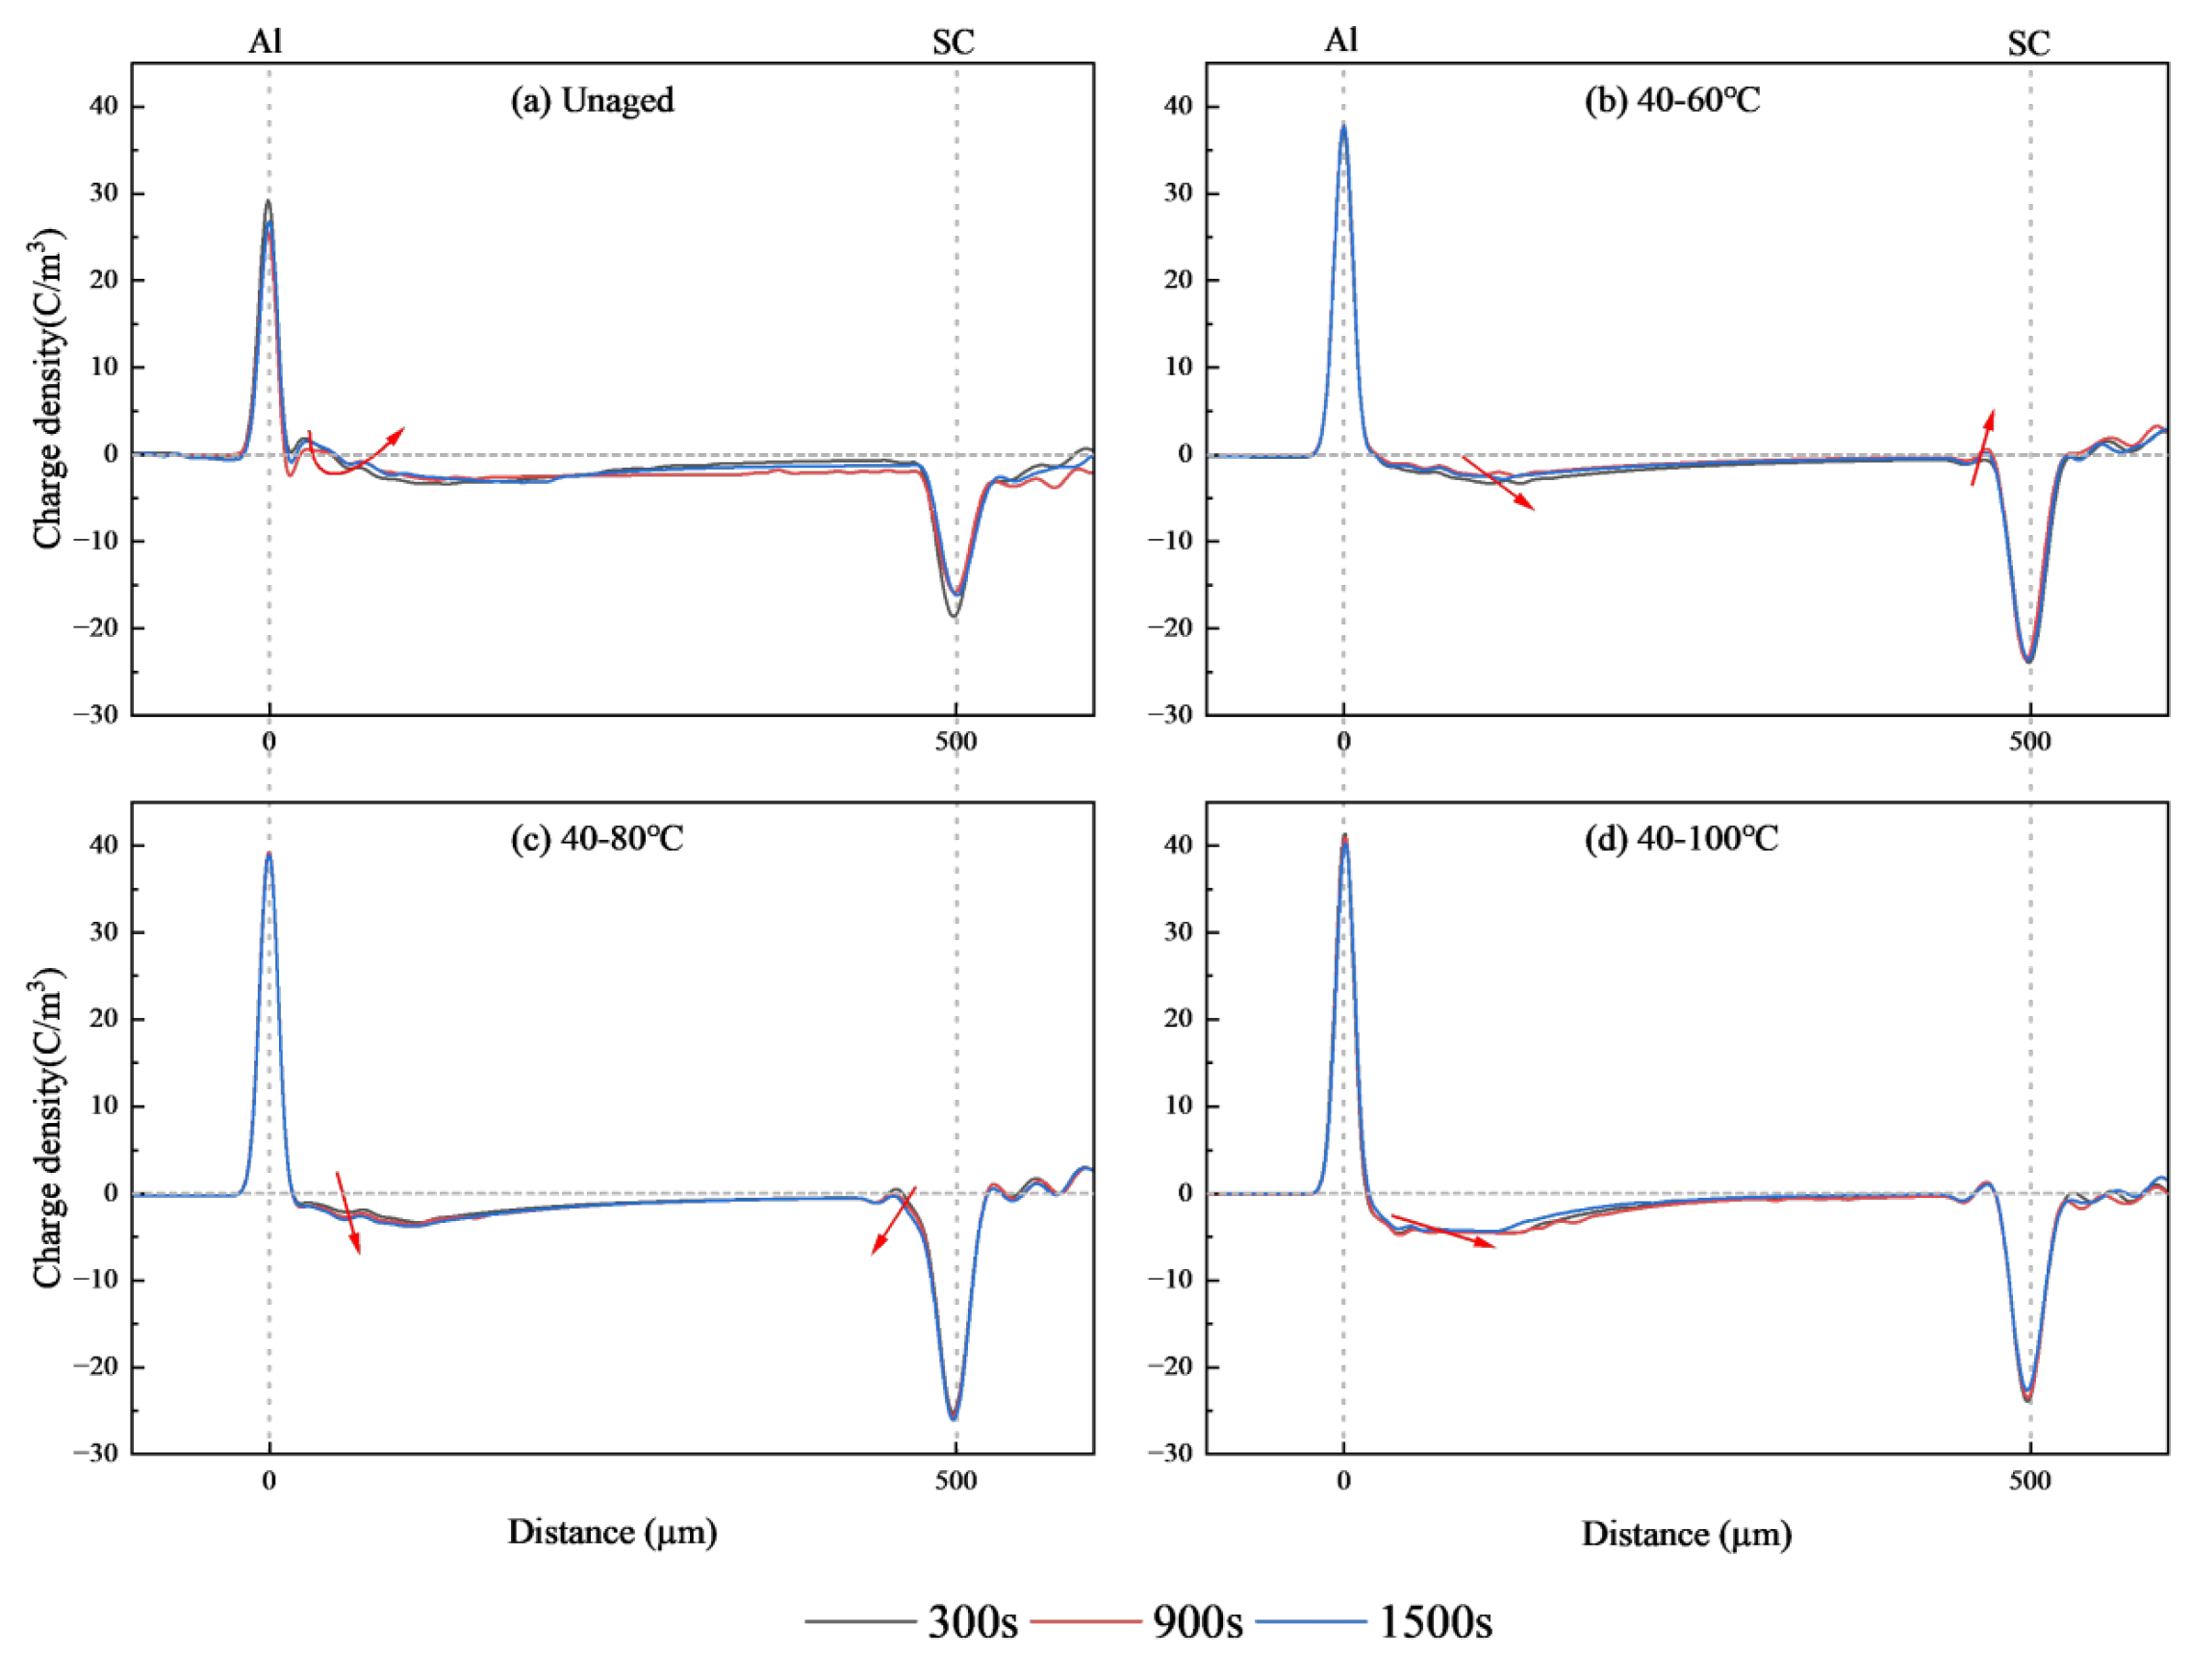
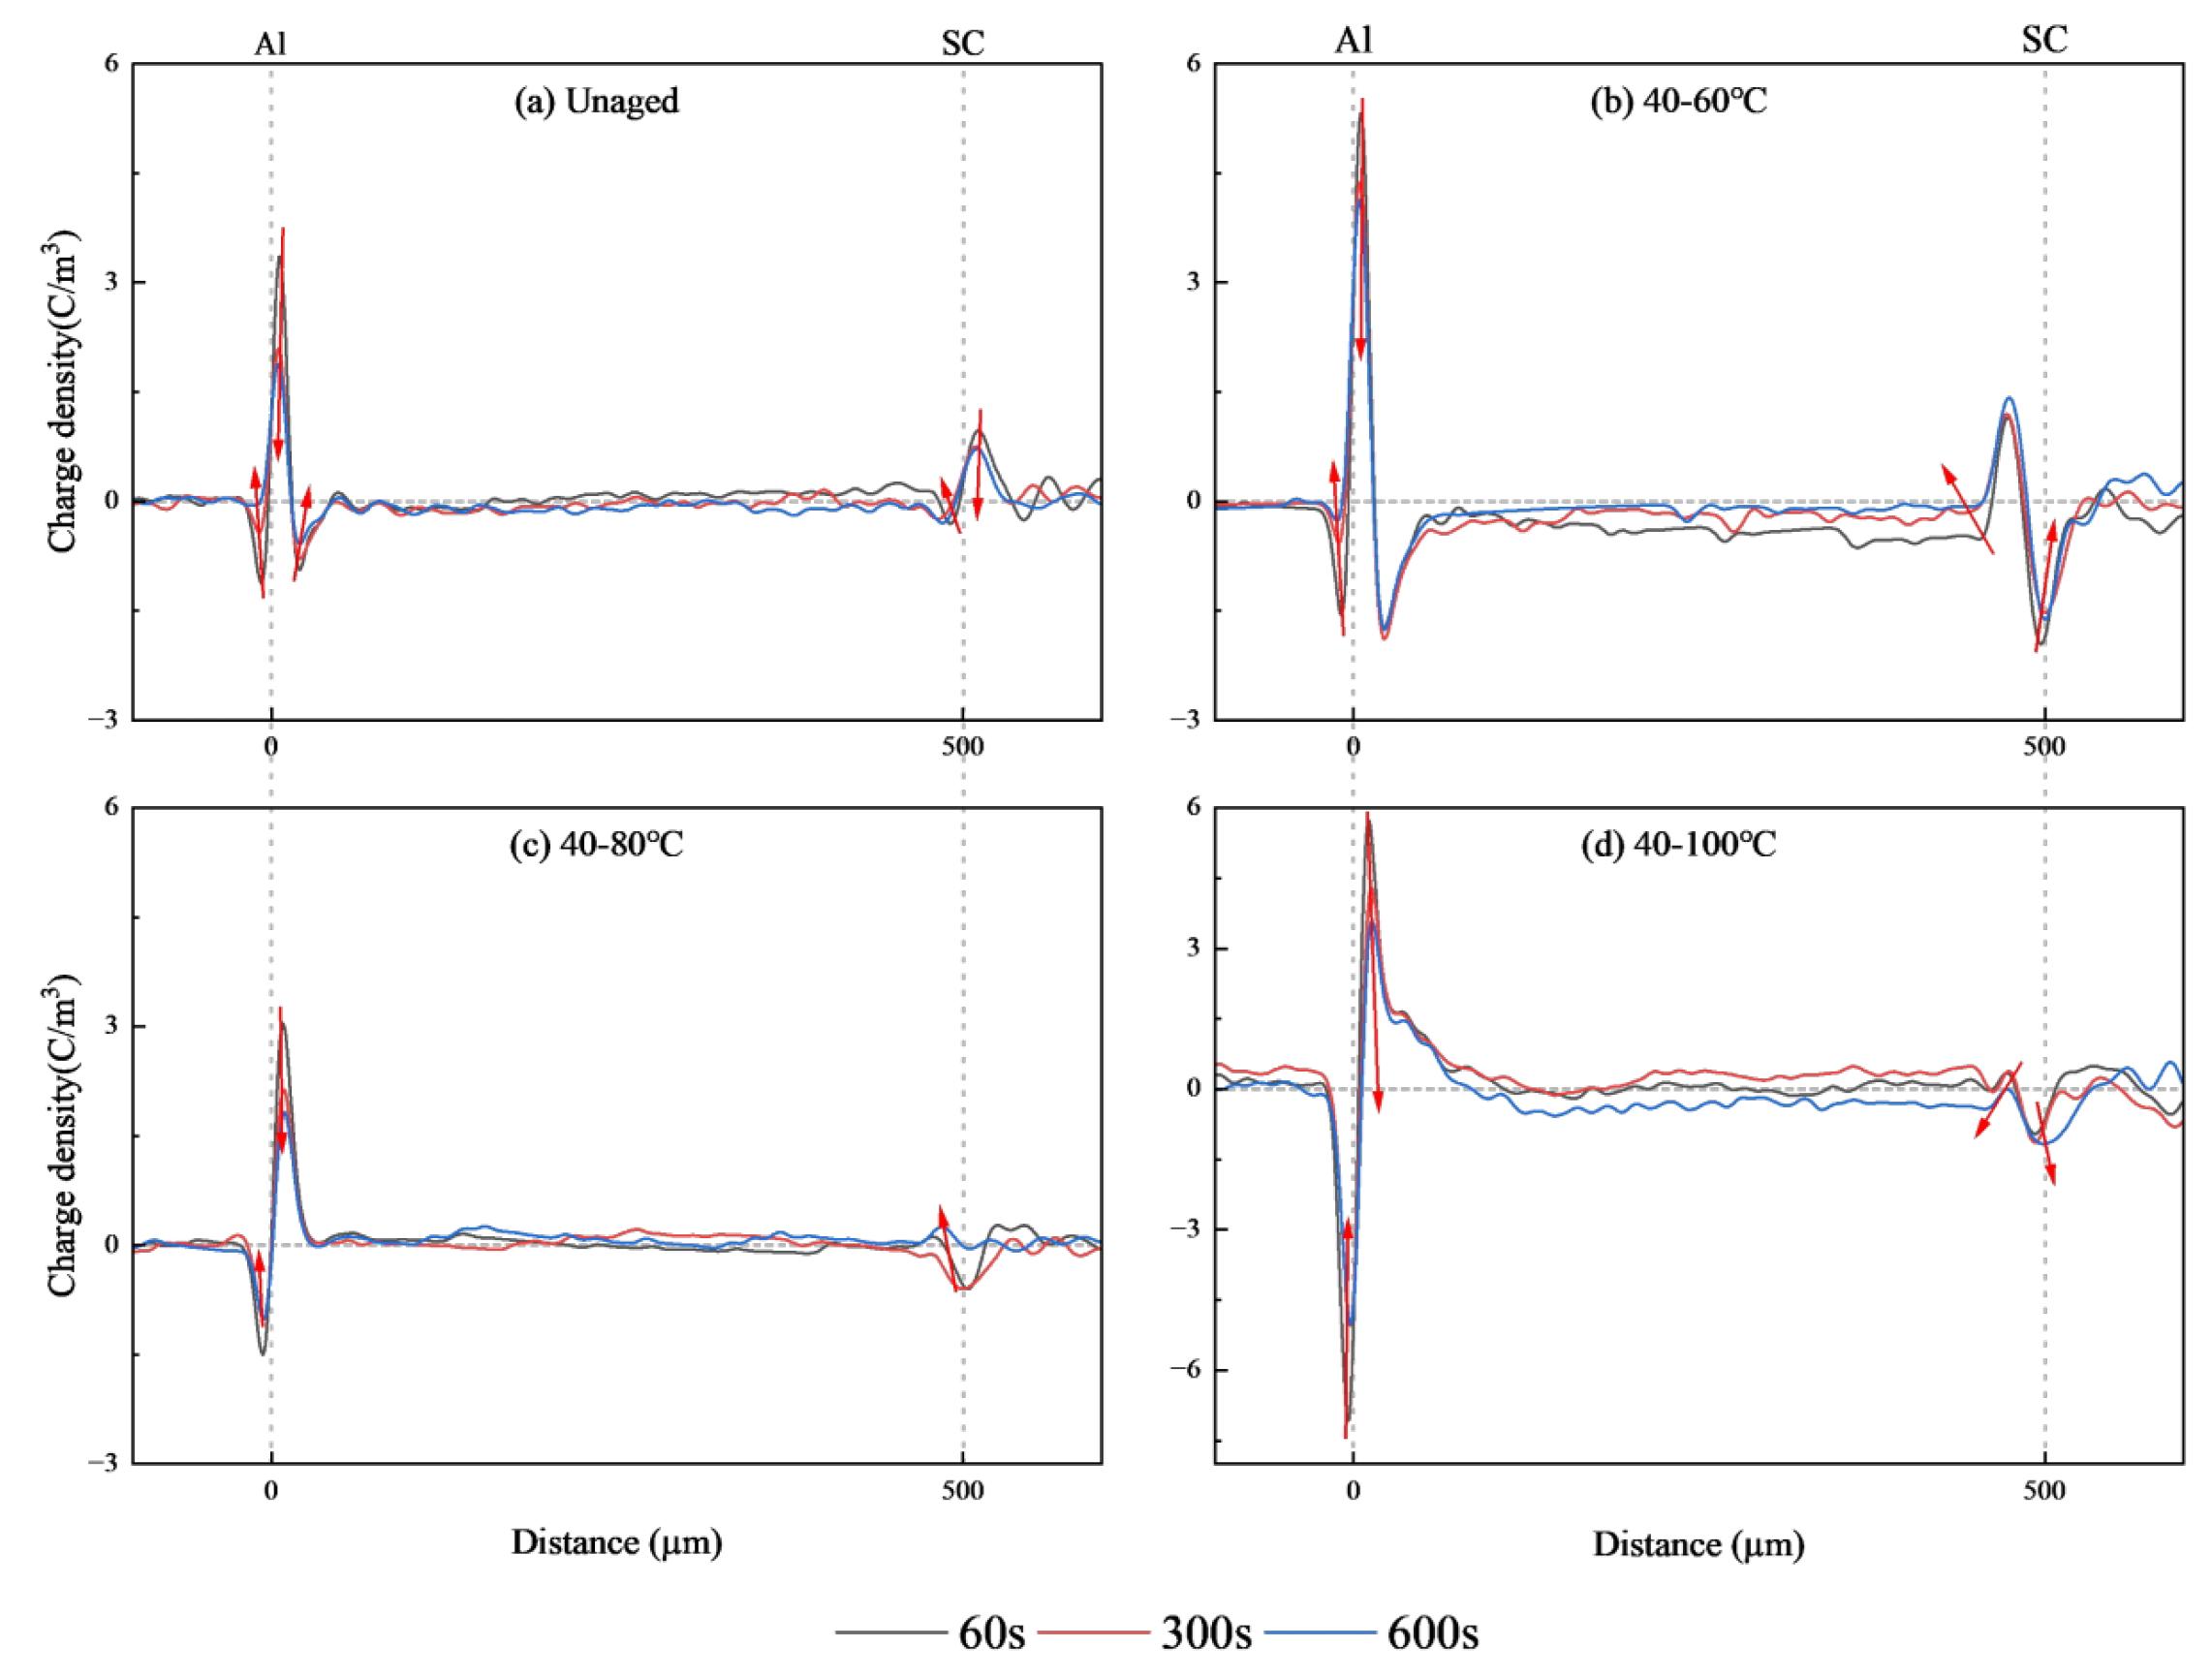
The modified space charge recovery algorithm was used to recover the waveforms from polarization and short-circuit tests on samples aged for 49 days under temperature gradients. The samples are polarized for 30 min at −40 kV/mm and depolarized for 10 min. The recovered space charge signals from unaged samples were used as a reference group. The recovery results are shown in Figure 13 and Figure 14. In the two figures, the Al electrode corresponds to the low-temperature side during aging, and the SC electrode corresponds to the high-temperature side during aging. The red arrows in the figure represent the trend of the charge over time.
As shown in Figure 13, significant homo-charge injection is observed near the cathode in the unaged sample under the applied electrical field. It also shows that there are hetero-charges at both electrodes after temperature gradient aging. It can also be observed that as the temperature gradient increases, the homo-charge peak at the anode becomes larger, and more hetero-charge accumulates near the anode.
Figure 14 shows the waveform recovery results during the short-circuit period. Compared to the unaged specimens, the high-temperature side of the temperature gradient-aged specimens exhibited a pronounced dipolar charge. As the aging temperature gradient increases, the heteropolar charges on the high-temperature side of the specimen decrease, while a large number of homopolar charges appear. This may be related to the competition between post-crosslinking and molecular chain scission during aging [23].

5. Conclusions

This paper considers the uneven aging of actual submarine cable cross-linked polyethylene insulation under long-term temperature gradient conditions. Combining the effects of aging on the wave velocity, attenuation, and dispersion characteristics of acoustic waves in XLPE, as well as the influence of aging on the dielectric constant, the recovery algorithm for the PEA method is modified. The space charge characteristics of the samples subjected to long-term temperature gradient aging are measured. The following conclusions are drawn:
  • The propagation characteristics of acoustic waves in the material are affected by the degree of aging. Aging causes the sound velocity in the material to initially decrease and then increase. With the increasing aging temperature, the rate and magnitude of the decrease in the early stage of aging are greater. As aging continues, the sound velocity in the material gradually increases, and the rate of increase shows a linear trend with aging time. Furthermore, the attenuation coefficient of sound velocity is related to the degree of aging.
  • As the degree of aging deepens, the low-frequency dielectric constant of the material increases. Under aging conditions, the dielectric constant of the materials exhibits a trend of first decreasing and then increasing. This may be because during the initial stages of XLPE aging, post-crosslinking processes dominate, causing impurities and small molecules within the material to recrystallize into larger molecules, thereby leading to a decrease in the dielectric constant.
  • The improved space charge recovery algorithm not only corrects the distortion in spatial charge distribution caused by aging, but also compensates for the amplitude attenuation of the signal resulting from non-uniform aging. The use of a space charge recovery algorithm that accounts for temperature-gradient-induced, non-uniform aging can effectively improve the accuracy of space charge measurements in cables after aging during actual operation, and enhance the accuracy of health assessments for the XLPE insulation of these cables.
  • Applying the new algorithm, the polarization and short-circuit space charge measurement results were recovered. It was found that the hetero-charge in the material under temperature gradient aging first increases and then decreases. With the increasing aging temperature, the injection depth and migration rate of both the homo-charge and hetero-charge increase.

Author Contributions

Conceptualization, T.H. and J.C.; methodology, T.H. and J.C.; software, J.C. and H.Y.; validation, H.Y.; formal analysis, J.C. and Y.L.; investigation, J.C. and Y.L.; resources, T.H. and J.C.; data curation, J.C. and T.H.; writing—original draft preparation, T.H., J.C., and H.Y.; writing—review and editing, T.H. and J.C.; funding acquisition, T.H. All authors have read and agreed to the published version of the manuscript.

Funding

This research received no external funding.

Data Availability Statement

Data available upon request from the authors. The data are not publicly available due to [The cable materials are subject to trade secrets.].

Conflicts of Interest

The authors declare no conflicts of interest.

References

  1. Zhou, Y.; He, J.L.; Hu, J.; Huang, X.; Jiang, P. Evaluation of polypropylene/polyolefin elastomer blends for potential recyclable HVDC cable insulation applications. IEEE Trans. Dielectr. Electr. Insul. 2015, 22, 673–681. [Google Scholar] [CrossRef]
  2. Meziani, M.; Mekhaldi, A.; Teguar, M. Space Charge and Associated Electric Field Distribution in Presence of Water Trees in XLPE Insulation Under DC and AC Voltages. IEEE Trans. Dielectr. Electr. Insul. 2025, 32, 1343–1352. [Google Scholar] [CrossRef]
  3. Sepulveda-Garcia, M.E.; Martinez-Tarifa, J.M.; Sanz-Feito, J. Electrical ageing markers for polyethylene insulation based on space charge accumulation and apparent mobility. IEEE Trans. Dielectr. Electr. Insul. 2013, 20, 2222–2229. [Google Scholar] [CrossRef]
  4. Castellon, J.; Agnel, S.; Notingher, P. Review of space charge measurements in high voltage DC extruded cables by the thermal step method. IEEE Electr. Insul. Mag. 2017, 33, 34–41. [Google Scholar] [CrossRef]
  5. Boggs, S.; Damon, D.H.; Hjerrild, J.; Holboll, J.T.; Henriksen, M. Effect of insulation properties on the field grading of solid dielectric DC cable. IEEE Trans. Power Deliv. 2001, 16, 456–461. [Google Scholar] [CrossRef]
  6. Takada, T.; Sakai, T. Measurement of electric fields at a dielectric/electrode interface using an acoustic transducer technique. IEEE Trans. Electr. Insul. 1983, 1, 619–628. [Google Scholar] [CrossRef]
  7. Li, Y.; Murata, K.; Tanaka, Y.; Takada, T.; Aihara, M. Space charge distribution measurement in lossy dielectric materials by pulsed electroacoustic method. In Proceedings of the 4th International Conference on Properties and Applications of Dielectric Materials, Brisbane, Australia, 4–7 August 1994. [Google Scholar]
  8. Vissouvanadin, B.; Laurent, C.; Roy, S.L.; Teyssèdre, G.; Denizet, I.; Mammeri, M.; Poisson, B. A deconvolution technique for space charge recovery in lossy and dispersive dielectrics using PEA method. In Proceedings of the 2010 Annual Report Conference on Electrical Insulation and Dielectric Phenomena (CEIDP), West Lafayette, Indiana, 17–20 October 2010. [Google Scholar]
  9. Fabiani, D.; Montanari, G.C.; Bodega, R.; Morshuis, P.H.F.; Laurent, C.; Dissado, L.A. The effect of temperature gradient on space charge and electric field distribution of HVDC cable models. In Proceedings of the 2006 IEEE 8th International Conference on Properties and Applications of Dielectric Materials (ICPADM), Bali, Indonesia, 26–30 June 2006. [Google Scholar]
  10. Choo, W.; Chen, G. Electric field determination in DC polymeric power cable in the presence of space charge and temperature gradient under DC conditions. In Proceedings of the 2008 International Conference on Condition Monitoring and Diagnosis (CMD), Beijing, China, 21–24 April 2008. [Google Scholar]
  11. Wang, H.S.; Wu, K.; Zhu, Q.D.; Wang, X. Recovery algorithm for space charge waveform under temperature gradient in PEA method. IEEE Trans. Dielectr. Electr. Insul. 2015, 22, 1213–1218. [Google Scholar] [CrossRef]
  12. Zhu, Q.; Wu, K.; Wang, H.; Xia, W.; Lv, S. The study of PEA space charge waveform recovery under temperature gradient. In Proceedings of the 2013 IEEE International Conference on Solid Dielectrics (ICSD), Bologna, Italy, 30 June–4 July 2013. [Google Scholar]
  13. Chen, C.; Cheng, C.; Wang, X.; Wu, K. Space Charge Characteristics for XLPE Coaxial Cable Insulation Under Electrothermal Accelerated Aging. IEEE Trans. Dielectr. Electr. Insul. 2022, 29, 727–736. [Google Scholar] [CrossRef]
  14. Takada, T.; Tanaka, Y.; Adachi, N.; Qin, X. Comparison between the PEA method and the PWP method for space charge measurement in solid dielectrics. IEEE Trans. Dielectr. Electr. Insul. 1998, 5, 944–951. [Google Scholar] [CrossRef]
  15. Li, Y.; Yasuda, M.; Takada, T. Pulsed electroacoustic method for measurement of charge accumulation in solid dielectrics. IEEE Trans. Dielectr. Electr. Insul. 1994, 1, 188–195. [Google Scholar] [CrossRef]
  16. Bokuniaeva, A.O.; Vorokh, A.S. Estimation of particle size using the Debye equation and the Scherrer formula for polyphasic TiO2 powder. J. Phys. Conf. Ser. 2019, 1410, 012057. [Google Scholar] [CrossRef]
  17. Lan, L.; Wu, J.D.; Yin, Y.; Li, X.; Li, Z. Effect of temperature on space charge trapping and conduction in cross-linked polyethylene. IEEE Trans. Dielectr. Electr. Insul. 2014, 21, 1784–1791. [Google Scholar] [CrossRef]
  18. Liu, Y.; Sun, J.; Chen, S.; Sha, J.; Yang, J. Thermophysical properties of cross-linked polyethylene during thermal aging. Thermochim. Acta 2022, 713, 179213. [Google Scholar] [CrossRef]
  19. Morita, S.; Fuse, N.; Takahashi, T.; Takahashi, T.; Zahra, S.; Hozumi, N. Space Charge Measurement of 23-mm-Thick XLPE Cable at Ambient and High Temperatures. IEEE Trans. Dielectr. Electr. Insul. 2022, 29, 1491–1497. [Google Scholar] [CrossRef]
  20. Chaudhuri, S.K.; Sajjad, M.; Kleppinger, J.W.; Mandal, K.C. Correlation of Space Charge Limited Current and γ-Ray Response of CdxZn1-xTe1-ySey Room-Temperature Radiation Detectors. IEEE Electron. Device Lett. 2020, 41, 1336–1339. [Google Scholar] [CrossRef]
  21. Wang, X.; Jiang, Q.; Wu, C.; Liu, S.; Wu, K. Space Charge Characteristics at the XLPE/EPDM Interface Under DC Voltage Superimposed by a Repetitive Impulse Voltage. IEEE Trans. Dielectr. Electr. Insul. 2023, 30, 2084–2091. [Google Scholar] [CrossRef]
  22. Zhang, Y.; Li, S.; Gao, J.; Wang, S.; Wu, K.; Li, J. Ageing Assessment of XLPE Cable Insulation by Residual Antioxidant Content. IEEE Trans. Dielectr. Electr. Insul. 2020, 27, 1795–1802. [Google Scholar] [CrossRef]
  23. Liu, Y.; Liu, H.; Yu, L.; Li, Y.; Gao, L. Effect of thermal stress on the space charge distribution of 160 kV HVDC cable insulation material. IEEE Trans. Dielectr. Electr. Insul. 2017, 24, 1355–1364. [Google Scholar] [CrossRef]
Figure 1. Schematic diagram of the ring-cutting process.
Energies 19 02222 g001
Figure 2. Temperature gradient aging device.
Energies 19 02222 g002
Figure 3. The PEA space charge measurement system.
Energies 19 02222 g003
Figure 4. The Novocontrol Concept 40 broadband impedance spectrometer.
Energies 19 02222 g004
Figure 5. Acoustic wave propagation velocity under different aging conditions.
Energies 19 02222 g005
Figure 6. Attenuation coefficients in different aging conditions.
Energies 19 02222 g006
Figure 7. Dispersion coefficients in different aging conditions.
Energies 19 02222 g007
Figure 8. The fit result of attenuation.
Energies 19 02222 g008
Figure 9. Dielectric constants under different aging conditions.
Energies 19 02222 g009
Figure 10. Dielectric constant of XLPE slices at different aging stages at the frequency of 0.1 Hz.
Energies 19 02222 g010
Figure 11. Space charge distribution of reference test.
Energies 19 02222 g011
Figure 12. The recovered reference E-field.
Energies 19 02222 g012
Figure 13. Space charge distribution under the polarization process.
Energies 19 02222 g013
Figure 14. Space charge distribution under the depolarization process.
Energies 19 02222 g014
Disclaimer/Publisher’s Note: The statements, opinions and data contained in all publications are solely those of the individual author(s) and contributor(s) and not of MDPI and/or the editor(s). MDPI and/or the editor(s) disclaim responsibility for any injury to people or property resulting from any ideas, methods, instructions or products referred to in the content.