Article

Effects of Reactor Geometry on Plasma-Assisted Ammonia Decomposition in Coaxial DBD Reactors at Low Pressures

State Key Laboratory of Engines, Tianjin University, Tianjin 300072, China
*
Authors to whom correspondence should be addressed.
Energies 2026, 19(9), 2171; https://doi.org/10.3390/en19092171
Submission received: 16 March 2026 / Revised: 23 April 2026 / Accepted: 27 April 2026 / Published: 30 April 2026

Abstract

Plasma-assisted ammonia (NH3) decomposition is a promising strategy for hydrogen production. However, reactor geometry remains a key factor limiting its hydrogen yield per energy input ( Y H 2 ). This study systematically investigates H2 production in outer-dielectric (OD), inner-dielectric (ID), and double-dielectric (DD) coaxial DBD reactors. The results show that the ammonia decomposition performance of OD- and ID-coaxial DBDs is significantly higher than that of the DD-coaxial DBD. OD- and ID-coaxial DBDs generate abundant micro-discharge pulses, enabling effective discharge energy deposition at lower peak voltages. Consequently, the reduced electric fields E/N are maintained within the optimal kinetic window for NH3 dissociation and H2 production. Moreover, by balancing residence time and energy density, the 8 cm length electrode achieves a peak Y H 2 of 1.22–1.24 gH2/kWh in the OD-coaxial DBD. For the ID-coaxial DBD, a 1 mm dielectric thickness yields a maximum capacitance of 86 pF, achieving a peak Y H 2 of ~1.35 gH2/kWh at the optimum E/N. In contrast, the DD-coaxial DBD exhibits the lowest Y H 2 (≤0.82 gH2/kWh) with minimal temperature rise. This is caused by the reduced current pulse numbers and the deviation of E/N from the optimal range with elevated operating voltages. This work provides guidance for the optimization of DBD reactors in plasma-assisted NH3 decomposition for efficient H2 production.

1. Introduction

Plasma-driven NH3 decomposition is rapidly emerging as a transformative strategy for decentralized, on-demand hydrogen production, offering a promising pathway to bypass the severe bottlenecks of the global hydrogen economy [1,2,3]. Unlike conventional thermal methods, plasma-assisted decomposition presents significant advantages, including instantaneous start-up capabilities, operation at near-ambient gas temperatures, and the direct activation of NH3 molecules via high-energy electrons [4,5,6,7]. Plasma generates a rich pool of chemically reactive species, such as vibrationally and electronically excited molecules, radicals, ions, and energetic electrons, thereby inducing new reaction pathways with significantly reduced activation energies. Furthermore, plasma-catalyst synergy can drastically enhance reaction rates and product selectivity at a temperature lower (<400 °C) than that of traditional thermal catalysis (>450 °C) [4,8,9,10]. These attributes make plasma-assisted NH3 decomposition particularly attractive for decentralized, on-site H2 production powered by intermittent renewable electricity. However, plasma-assisted NH3 decomposition is currently bottlenecked by relatively low hydrogen yield per energy input, which is determined by discharge characteristics and reactor geometry. While substantial efforts have been devoted to optimizing plasma power supplies, tuning gas compositions, and integrating highly active catalysts [11,12,13], the fundamental influence of reactor structure on NH3 decomposition performance has received comparatively less systematic attention. Reactor geometry directly dictates critical plasma parameters, including electric field distribution, discharge uniformity, micro-discharge dynamics, gas residence time, and the effective plasma–gas interaction volume, which consequently exert a decisive impact on both NH3 conversion and H2 yield.
In plasma-assisted systems, optimizing the reactor structure has been identified as a crucial determinant for enhancing NH3 decomposition performance [14,15]. For instance, Akiyama et al. [16] reported that the decomposition rate was heavily affected by residence time and applied power, though it remained independent of the inner electrode’s metal type. Furthermore, Niu et al. [17] demonstrated that optimizing the gas flow field via inlet adjustments, metal rod insertion, and flow rate tuning significantly improved NH3 collision efficiency and the final hydrogen yield. Zhao et al. [18] found that the dielectric barrier played an important role in plasma-assisted NH3 decomposition. The results showed that barrier materials (e.g., aluminum nitride or epoxy resin) with distinct surface traps significantly modulate plasma optical emission intensity. Meanwhile, higher dielectric constants elevate current pulse amplitudes and drive the discharge transition from Townsend to glow and filamentary modes. Besides studies on plasma-assisted NH3 decomposition, research on plasma-assisted conversion of other fuels further emphasizes that the reactor structure fundamentally dictates discharge behavior and subsequent conversion efficiency [19,20,21,22]. As evidenced by Mei et al. [23] in CO2/CH4 discharges, the number of dielectric barriers drastically alters current pulse intensity and electron density, directly affecting reactive species generation. Additionally, Wang et al. [24] found that NO removal efficiency decreased with a smaller inner electrode diameter and was highly sensitive to the inner electrode material.
These studies have revealed the critical role of reactor design in barrier properties and electrode configurations. However, there is a distinct lack of research systematically analyzing the combined effects of key structural parameters (e.g., electrode length, dielectric thickness, and discharge gap) on NH3 decomposition in plasma reactors. Notably, the arrangement, number, and thickness of dielectric layers profoundly reshape the equivalent capacitance during the dielectric barrier discharge (DBD) process, which in turn governs the overall discharge behavior. Yet systematic studies focusing on this underlying mechanism in the context of DBD-assisted NH3 decomposition remain limited. Therefore, investigating the effects of the configuration, number, and thickness of dielectric layers is of profound scientific significance, filling a critical theoretical gap and providing essential guidance for the rational design and scale-up of highly efficient plasma-assisted NH3 decomposition reactors.
Motivated by these considerations, this study systematically investigates the impact of dielectric barrier discharge (DBD) reactor structure on plasma-assisted NH3 decomposition. An 80% Ar gas mixture was used as the model system to ensure stable discharge and lower the breakdown voltage, thereby enabling precise separation of geometric and electrical variables. At first, three representatives of coaxial DBD configurations, including outer-dielectric (OD), inner-dielectric (ID), and double-dielectric (DD) reactors, are designed. Then, the evolutions of key performance metrics for plasma-assisted NH3 decomposition, including H2 mole fraction, NH3 conversion, and H2 yield per energy input, as a function of geometric parameters (such as electrode length and dielectric thickness) are compared and investigated. Finally, electrical diagnostics are employed to elucidate the underlying correlations among reactor structure, energy coupling mechanisms, and hydrogen production. These findings provide insights and guidance to understand the mechanism of dielectric barrier discharge and the effects of reactor structures for the optimization of plasma-electrified hydrogen production systems.

2. Experimental Methods

2.1. Experimental Setup

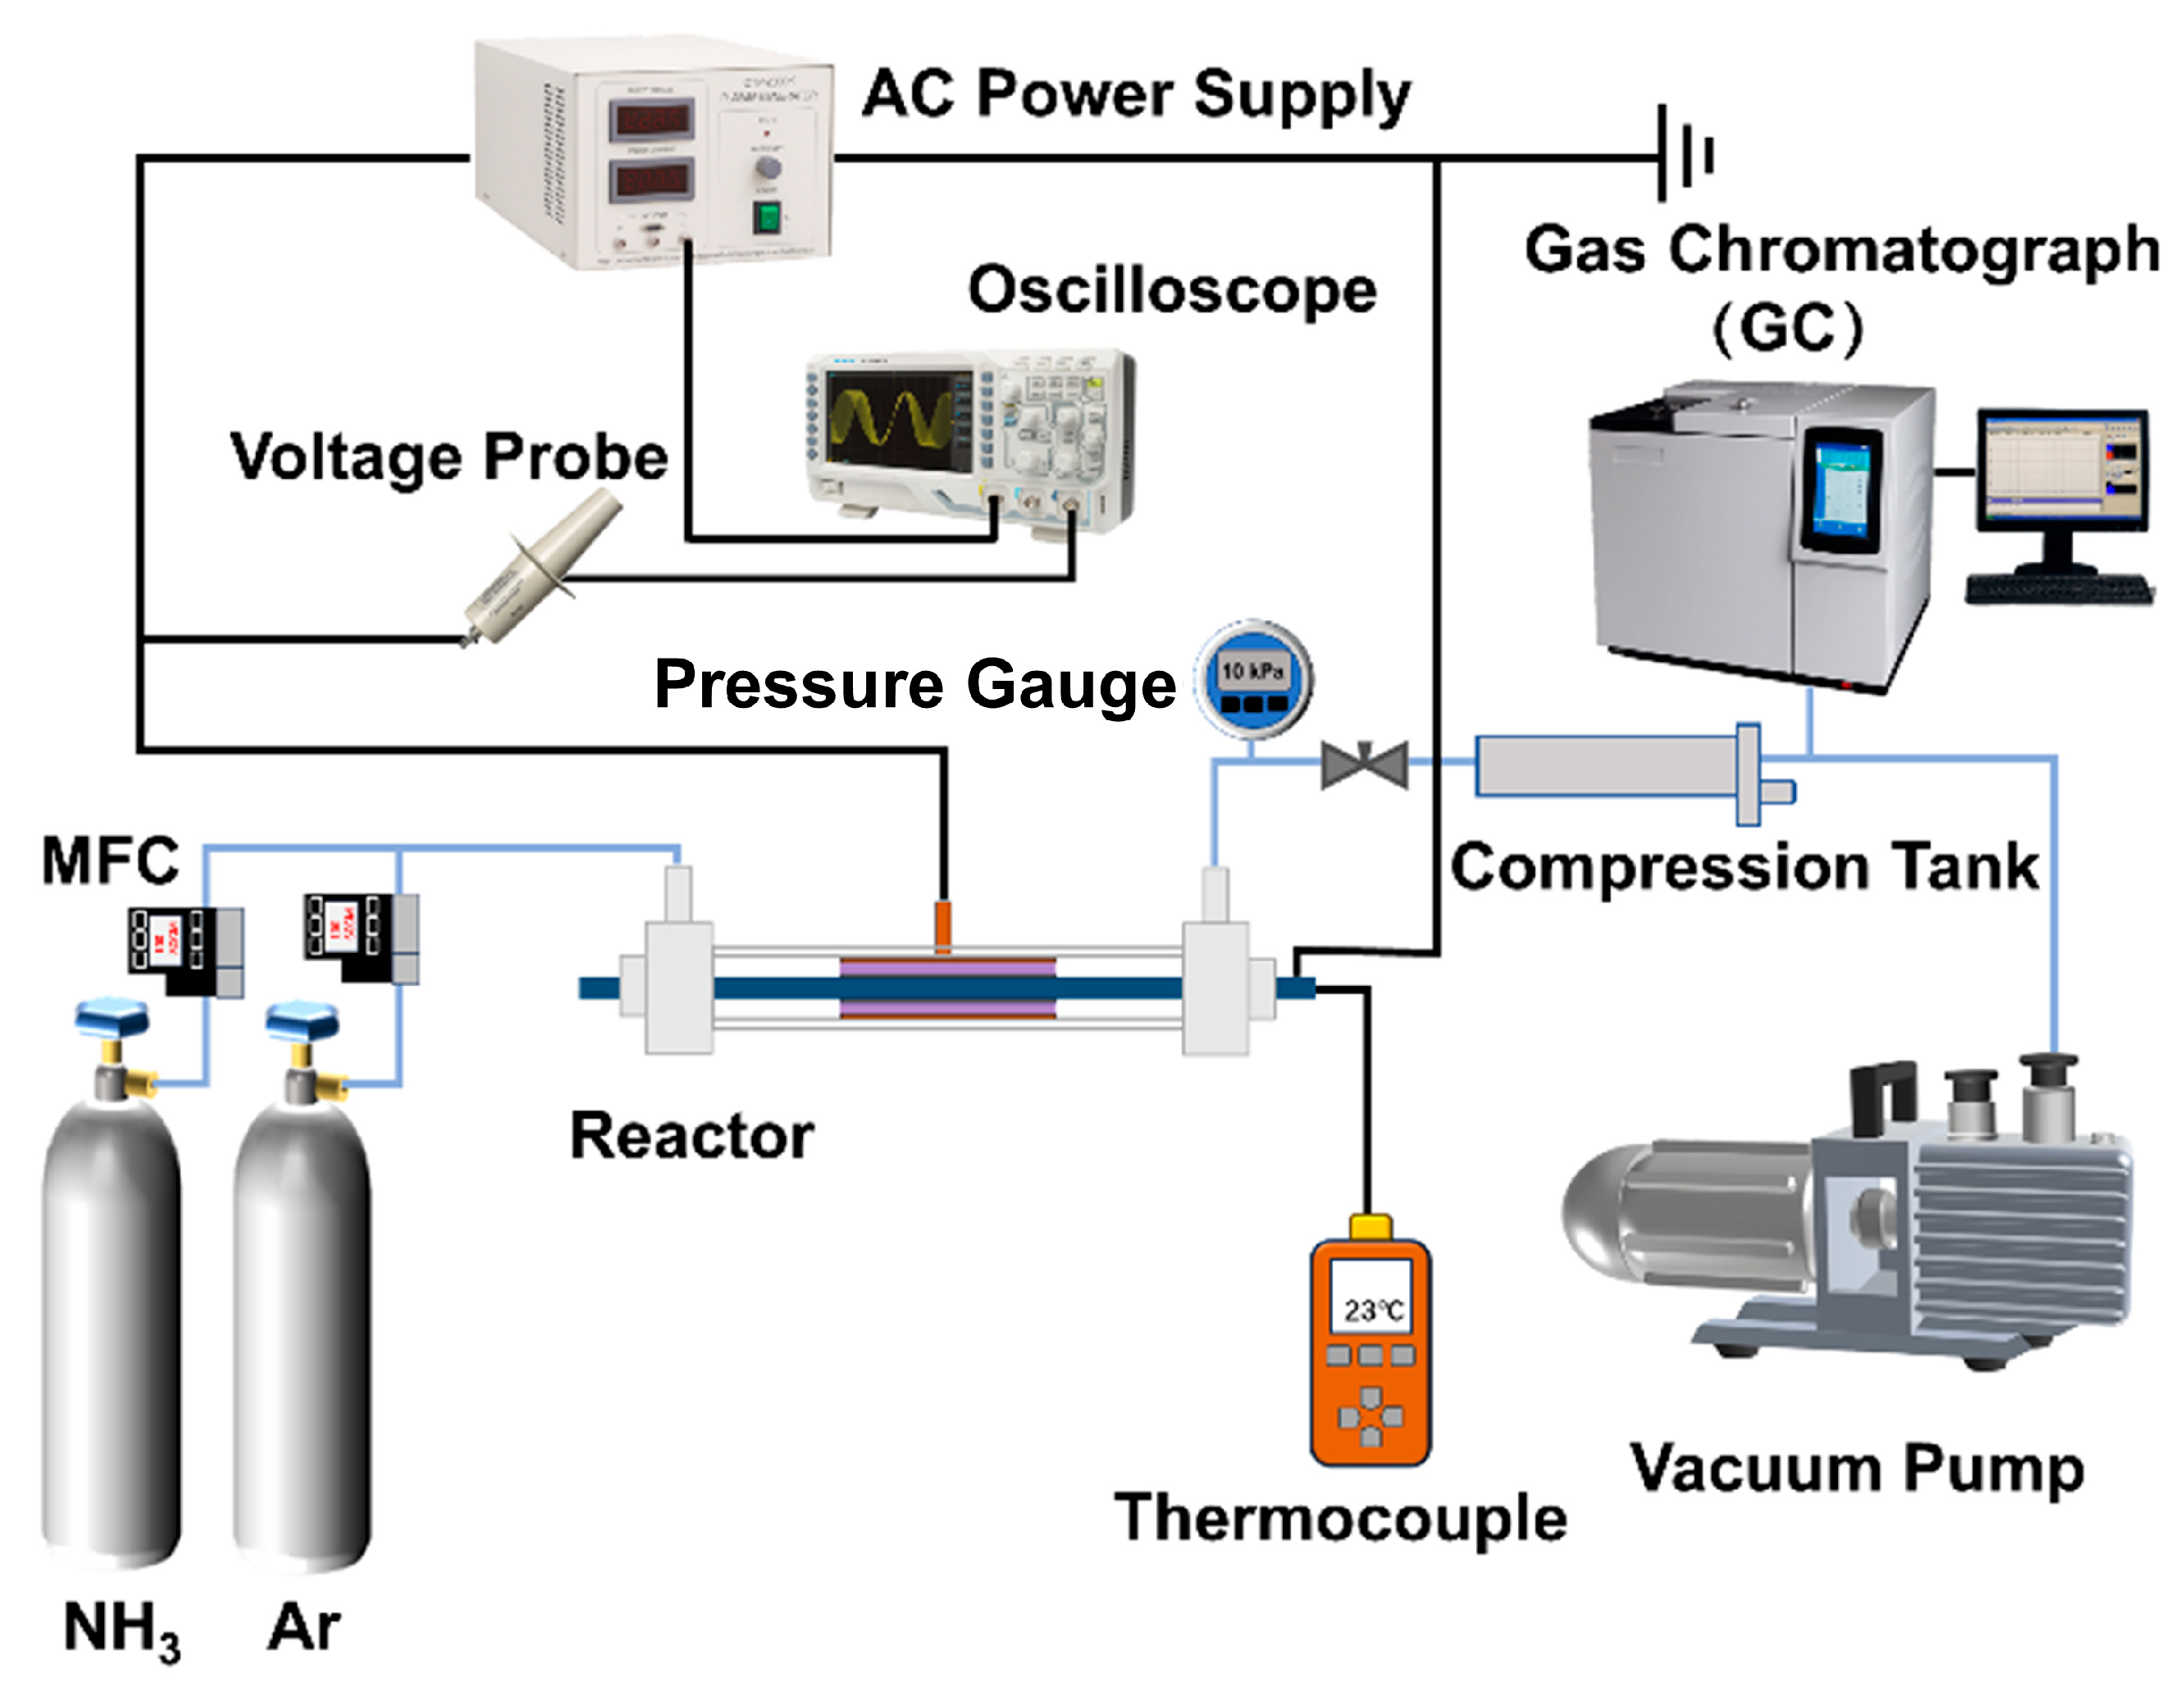
The schematic diagram of the experimental setup for plasma-assisted ammonia decomposition is illustrated in Figure 1. The experimental system primarily consists of a gas supply and control unit, a plasma reactor, a high-voltage alternating current (AC) power supply with electrical diagnostic modules, and a gas chromatography (GC) analysis unit. The gas flow rates are precisely controlled using mass flow meters from ALICAT (Tucson, AZ, USA), and the error of each mass flowmeter is within 0.6%. In all experiments, the feed gas mixture was fixed at 10 sccm of NH3 (purity of 99.999%) and 40 sccm of Ar (purity of 99.999%) carrier gas, maintaining a constant total flow rate of 50 sccm. The gases are thoroughly premixed before entering the reactor. In order to further improve the uniformity of the plasma discharge and enhance the reduced electric field, a vacuum pump is connected downstream of the reactor. The pressure in the reactor is accurately maintained at 10 kPa using a back pressure valve and a digital pressure gauge. A K-type thermocouple (Wanshun Tang Electric Heating Technology Co., Ltd., Yancheng, China) is installed at the reactor outlet, which is located downstream of the active discharge zone to continuously monitor the temperature of the discharged gas. The temperature measurement uncertainty of the thermocouple is within ±1 K. The plasma discharge is generated by a high-voltage AC power supply (CTP-2000K, Nanjing Suman Electronic Technology Co., Ltd., Nanjing, China), with the discharge frequency fixed at 8 kHz. During the discharge process, the applied voltage is measured in real-time using a high-voltage probe (Tektronix Inc., Beaverton, OR, USA). The current is measured using the built-in probe on the oscilloscope. The voltage and current profiles are recorded by a Tektronix MDO3054 oscilloscope (Tektronix Inc., Beaverton, OR, USA) (100 MHz) for subsequent electrical characteristic analysis and discharge power calculation. The reaction products are measured by GC, and the measurement error of the GC is kept within less than 2%. Preliminary tests confirm that key parameters (H2 concentration, specific energy input, and gas temperature) reach a steady state at 10 min. Therefore, a 10 min stabilization period is implemented before data collection in all subsequent experiments. To ensure the accuracy and reliability of the experimental data and to minimize random errors, all experiments under key testing conditions were performed in at least triplicate. The experimental results are expressed as the mean ± standard deviation (SD). During the data preprocessing stage, any significant outliers resulting from instrumental fluctuations or incidental factors are excluded. Furthermore, the error bars shown in all line graphs and bar charts throughout this paper represent the standard deviation of these repeated measurements.

2.2. Reactor Configurations

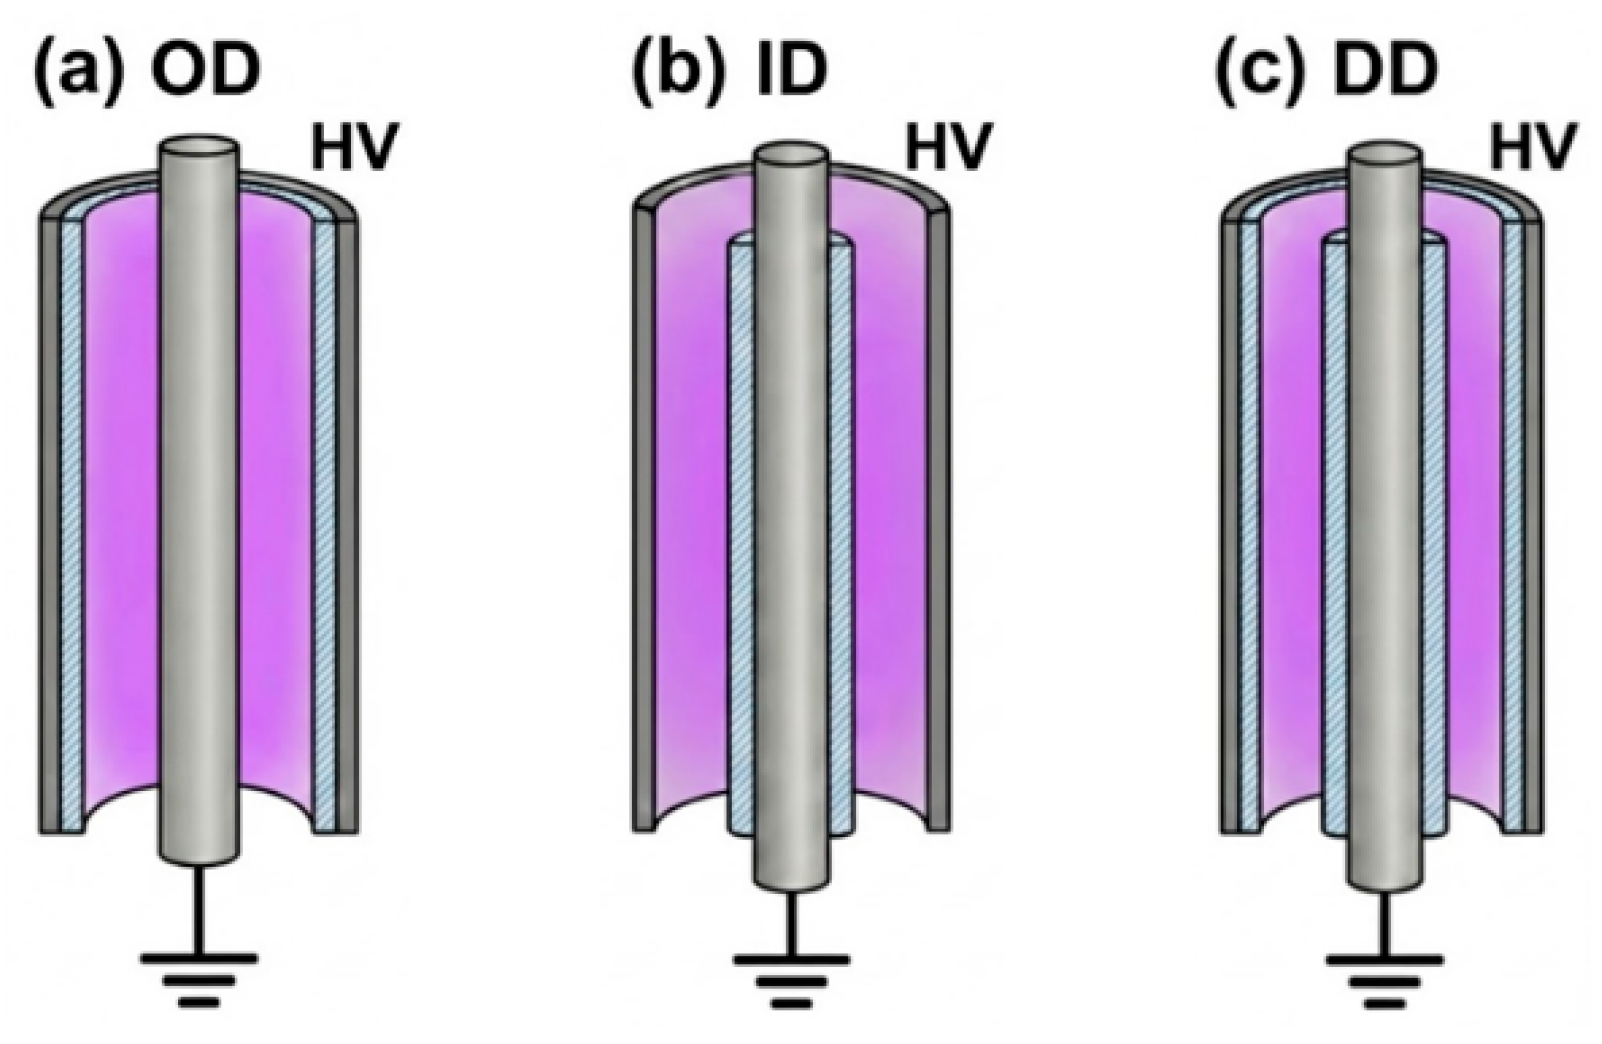
To systematically investigate the effects of reactor geometry on ammonia decomposition performance, three different dielectric barrier discharge (DBD) reactor configurations are designed (as shown in Figure 2a–c), i.e., the outer-dielectric coaxial DBD reactor (OD-coaxial DBD), the inner-dielectric coaxial DBD reactor (ID-coaxial DBD), and the double-dielectric coaxial DBD reactor (DD-coaxial DBD).
The outer-dielectric (OD) coaxial DBD reactor is primarily utilized to investigate the effect of electrode length on discharge characteristics. Adopting a typical coaxial cylindrical configuration, the central grounded electrode is a bare stainless-steel rod with a diameter of 6 mm. A quartz glass tube with an inner diameter of 10 mm and a wall thickness of 2 mm serves as the dielectric barrier, creating a constant radial discharge gap of 2 mm. A stainless-steel cylinder acts as the high-voltage electrode, tightly enveloping the outer surface of the quartz tube. By varying the coverage length of this outer cylinder, three effective discharge lengths of 4 cm, 8 cm, and 12 cm are achieved.
The inner-dielectric (ID) coaxial DBD reactor is designed to study the impact of dielectric layer thickness on plasma-assisted ammonia decomposition. In this configuration, the discharge length is 4 cm, and the high-voltage electrode is also an outer bare stainless-steel cylinder with a fixed inner diameter of 13 mm. The central grounded electrode is a 5 mm diameter stainless-steel rod, tightly enveloped by a quartz glass tube acting as the dielectric barrier. While maintaining constant dimensions for both the inner and outer metallic electrodes, three different thicknesses of the inner quartz layer (1 mm, 1.5 mm, and 2 mm) are comparatively tested. Notably, when the inner dielectric thickness is 2 mm, the radial gas discharge gap is exactly 2 mm, which is consistent with the gas discharge gap of an OD-coaxial DBD.
The double-dielectric (DD) coaxial DBD reactor employs a dual-dielectric barrier structure. The outer boundary consists of a quartz glass tube with a fixed inner diameter of 10 mm, which is tightly wrapped by a stainless-steel cylinder serving as the high-voltage electrode. Simultaneously, to preserve the constant 2 mm radial discharge gap, the central bare electrode is replaced by a 5 mm diameter grounded stainless-steel rod tightly encased by a 0.5 mm thick quartz glass layer. This specific combination also enables the achievement of three effective discharge lengths of 4 cm, 8 cm, and 12 cm, ensuring a comprehensive comparative analysis.

2.3. Product Analysis and Discharge Parameter Calculation

The gas composition from the reactor outlet is introduced into an Agilent 8860 GC (Agilent Technologies, Inc., Santa Clara, CA, USA) for quantitative analysis. The GC is equipped with a thermal conductivity detector (TCD) and utilizes Ar as the carrier gas to accurately quantify the concentrations of H2.
The hydrogen production rate R H 2 is obtained as,
R H 2 = 1 . 5 × y H 2 out × F total 1.5 y H 2 out
where y H 2 out is the hydrogen concentration and Φ total is the inlet flow rate at standard conditions [25].
The discharge power P is a critical parameter for evaluating the hydrogen yield per energy input. In this study, a non-inductive measuring capacitor (C = 0.47 μF) is connected in series to the grounded side of the discharge circuit. The voltage across the capacitor U ( t ) is measured to obtain the transferred charge Q ( t ) , thereby generating the Lissajous figure (Q-U curve). The discharge power is calculated by integrating the area of the Lissajous figure and multiplying it by the discharge frequency f .
P = f U ( t ) dQ ( t )
The specific energy input (SEI), representing the energy consumed per unit volume of the gas mixture, is calculated by using the following equation,
SEI = P / Φ total
where Φ total is the volumetric gas flow rate.
The hydrogen yield per energy input Y H 2 for H2 production is calculated as,
Y H 2 = R H 2 ρ H 2 / P
where ρ H 2 is the density of hydrogen at the standard conditions.
The NH3 conversion C NH 3 is obtained as,
C NH 3 = y H 2 out × Φ total Φ NH 3 × ( 1.5 y H 2 out ) × 100 %
where Φ NH 3 is the NH3 flow rate [26].
The residence time of the gas flowing through the plasma region is calculated as,
τ = β V / Φ
where V is the effective plasma volume within the discharge zone; Φ is the actual gas volume flow rate in the plasma region calculated using the ideal gas state equation; and β is derived from electrical diagnostics [27].

3. Results and Discussion

3.1. Discharge Properties

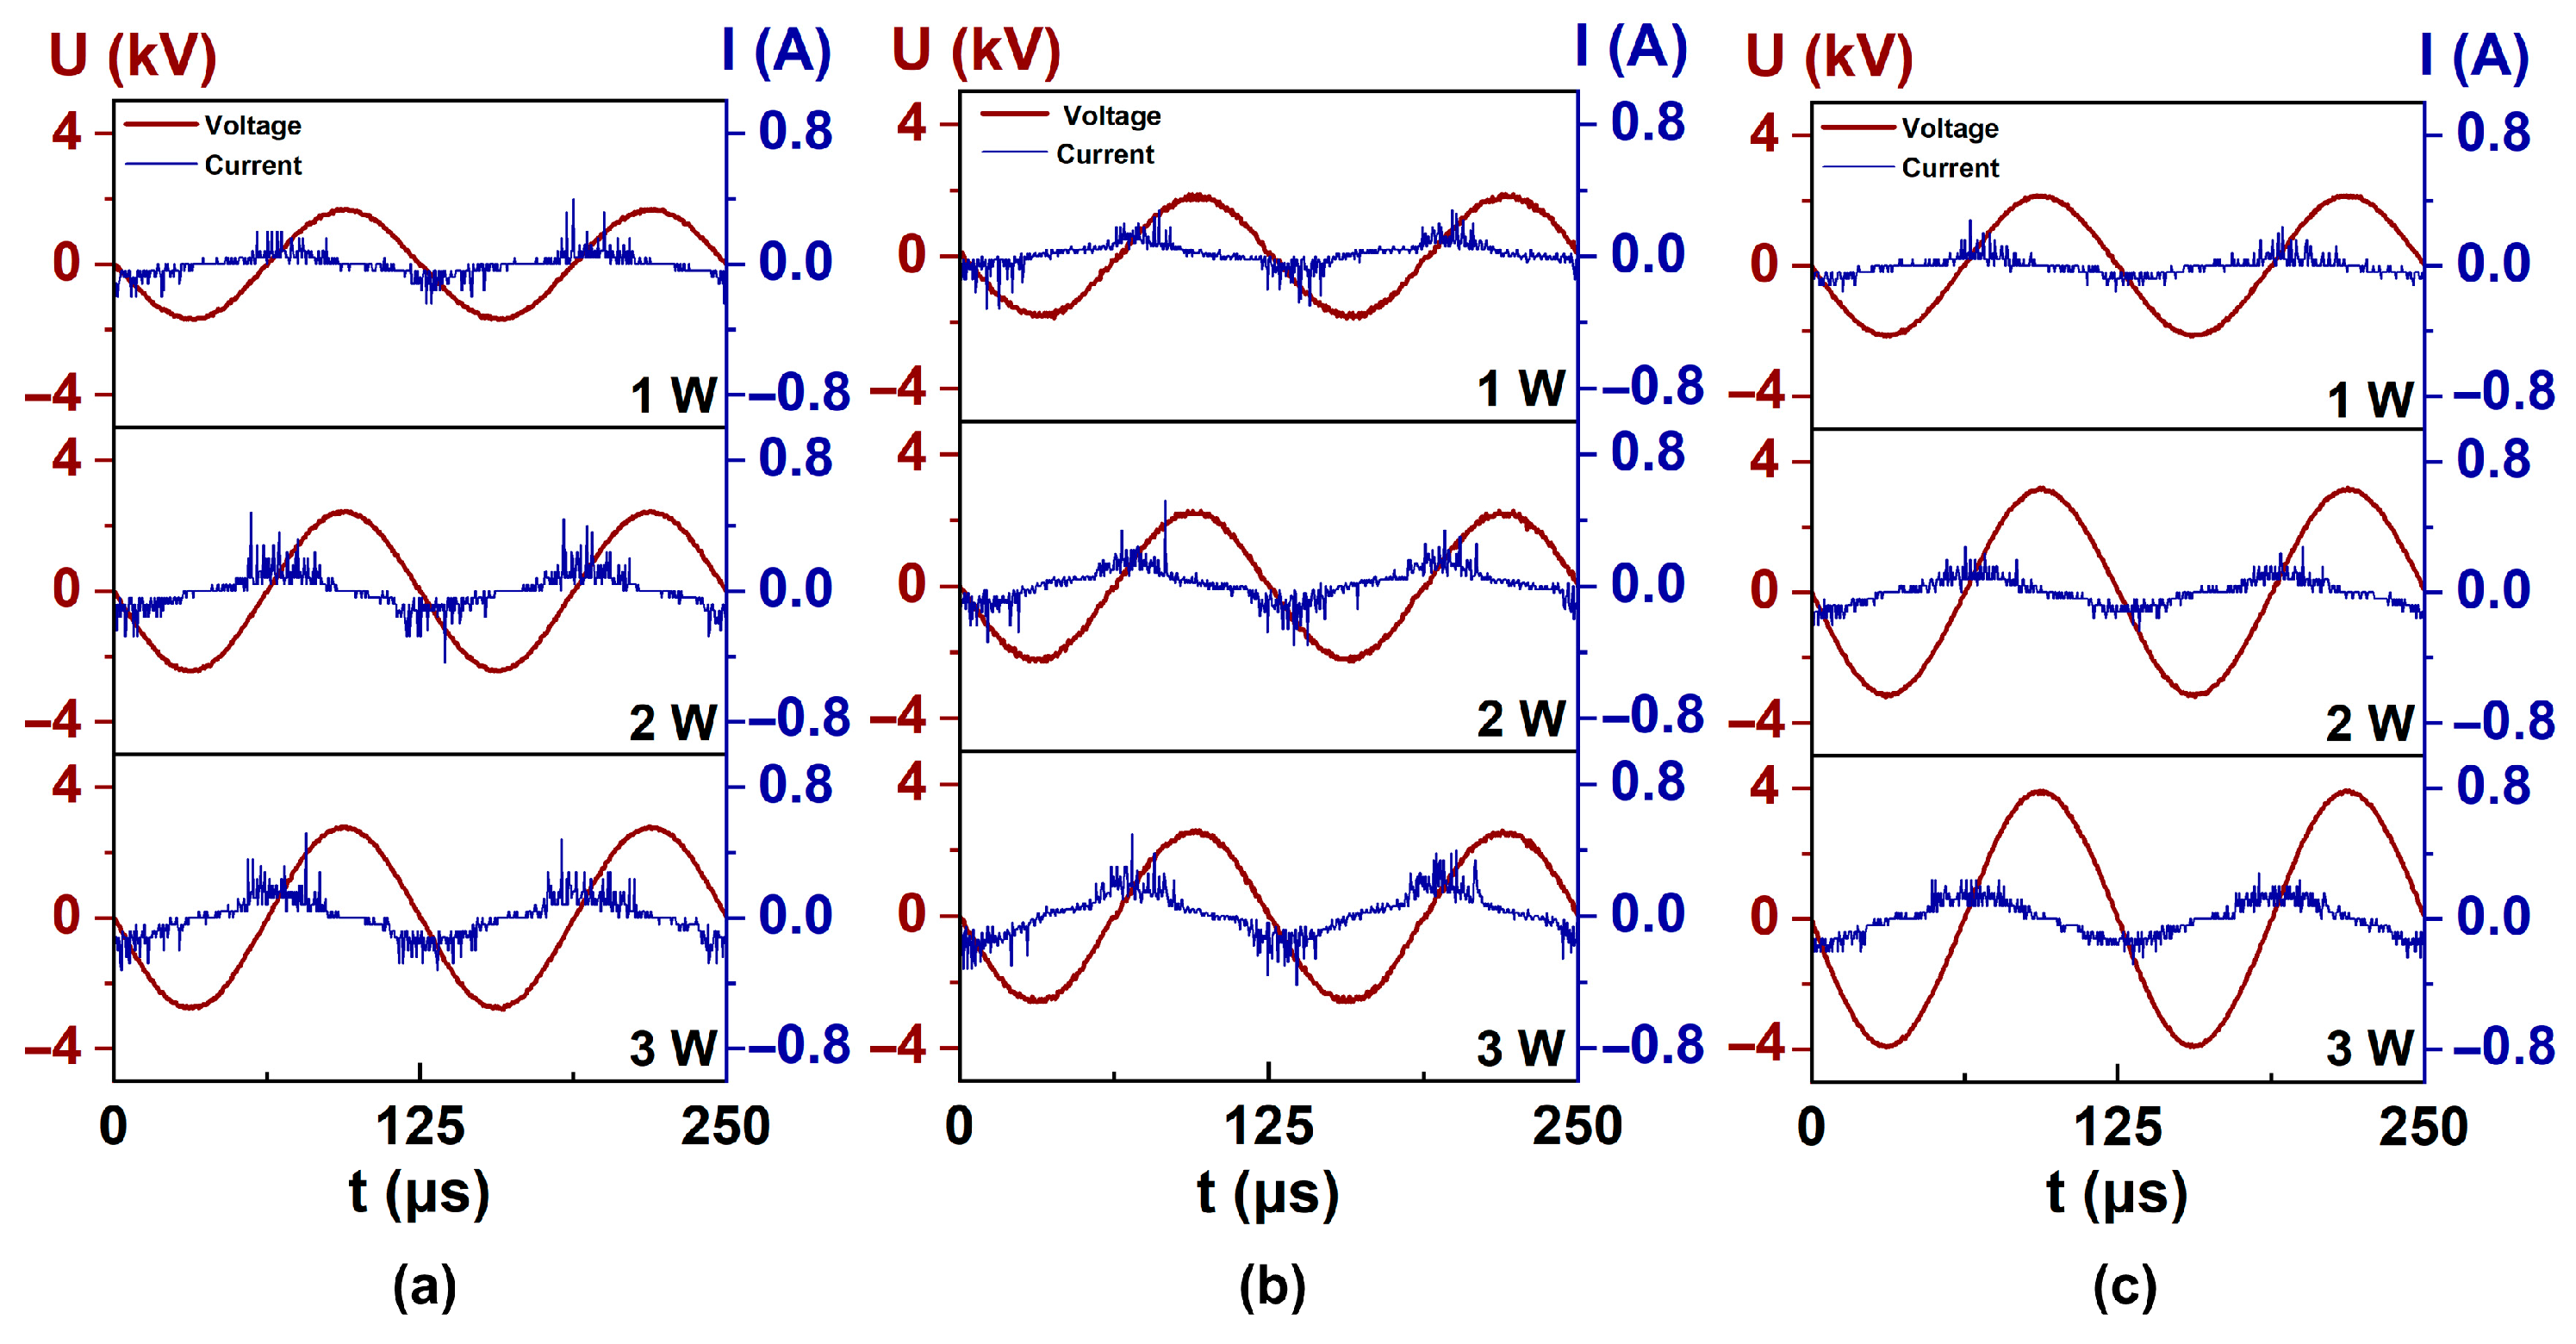
In order to have a clearer understanding of the influence of different reactor structures on the plasma discharge behavior, Figure 3a–c illustrates the typical voltage–current (U-I) waveforms of three DBD configurations (OD-coaxial DBD, ID-coaxial DBD, and DD-coaxial DBD) driven by an 8 kHz sinusoidal AC power supply. The results show that all waveforms exhibit a large number of sharp transient current pulses, presenting typical features of a filamentary dielectric barrier discharge (DBD) [28]. As shown in Figure 3a–c, as the input power increases, the voltage amplitudes and micro-discharge densities across all three reactor configurations escalate synchronously. This indicates that the enhanced energy deposition stimulates the formation of more abundant and intense micro-discharge channels within the gas gap, thereby transferring more energy into the plasma system. Further comparative analysis reveals that the reactor geometry profoundly influences its discharge behavior. Figure 3a,b shows that the OD- and ID-coaxial DBD reactors demonstrate highly similar and relatively low system peak voltages. For instance, at an input power of 3 W, the peak voltages of the OD- and ID-coaxial DBD reactors are 2.7 kV and 2.6 kV, respectively. In contrast, the peak voltage of the DD-coaxial reactor reaches as high as 3.9 kV. This phenomenon is primarily attributed to the series integration of a second dielectric layer (the total equivalent capacitance of the entire discharge circuit) in the DD-coaxial DBD reactor, which dramatically reduces the total equivalent capacitance of the discharge circuit and significantly increases the system’s equivalent impedance (capacitive reactance), thereby substantially elevating the threshold voltage required for gas breakdown. Consequently, a significant portion of the input power in the DD-coaxial DBD reactor is consumed in sustaining the high system breakdown voltage rather than being converted into effective current pulses that promote chemically active species production.
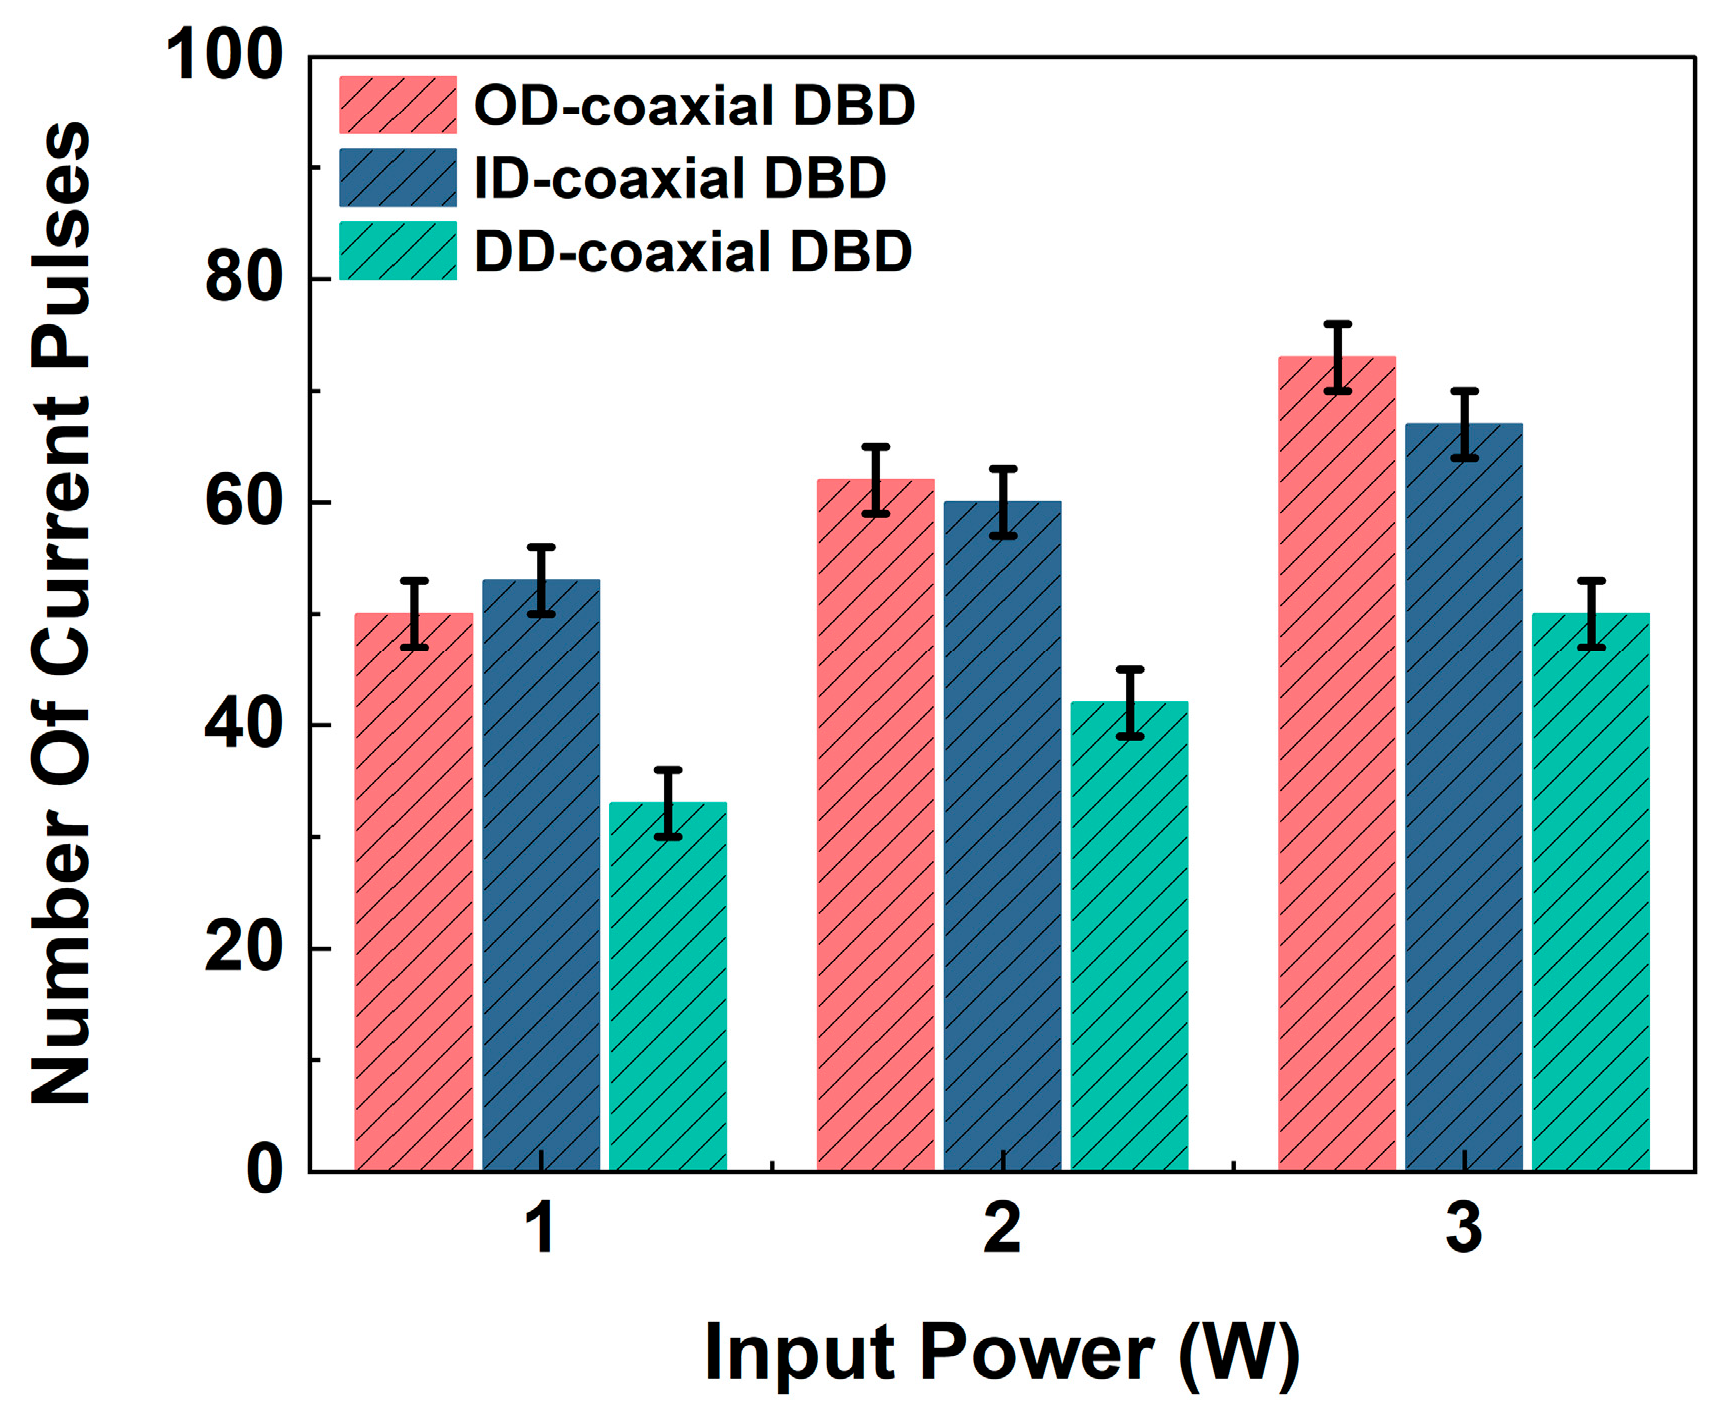
Figure 4 illustrates the variation in the number of current pulses as a function of input power for the three reactor configurations. All electrical measurements are conducted using a digital oscilloscope, and the micro-discharges are characterized by the observed current peaks. Specifically, the low-frequency dielectric displacement current is mathematically modeled and defined as the baseline. By subtracting this baseline from the total measured current, the active micro-discharge current is isolated. Subsequently, a “current pulse” is explicitly defined as a discrete transient peak within the isolated signal that exceeds a specific amplitude threshold (0.04 A). Only peaks exceeding this objective threshold are automatically identified and counted as valid micro-discharges. This threshold-based methodology effectively eliminates subjective bias and can be used as a qualitative approach for capturing trends [29]. The results demonstrate that as the input power increases from 1 W to 3 W, the number of current pulses in all three reactors increases correspondingly. Specifically, the number of pulses increases from 50 to 73, 53 to 67, and 33 to 50 in the OD-, ID-, and DD-coaxial DBD reactors, respectively, as the input power increases from 1 to 3 W. This further substantiates that a stronger applied electric field triggers the formation of more numerous and intense micro-discharge channels within the gas gap, effectively intensifying the accumulation and release processes of space charges. Furthermore, under identical power conditions, the total numbers of current pulses in the OD- and ID-coaxial DBD reactors are comparable, whereas the pulse count in the DD-coaxial DBD remains significantly lower than those of the former two. These observations clearly indicate that the single-dielectric configurations (OD- and ID-coaxial DBD reactors) are capable of generating more discharge channels within the reaction space, thereby establishing a reactive environment for plasma reactions.
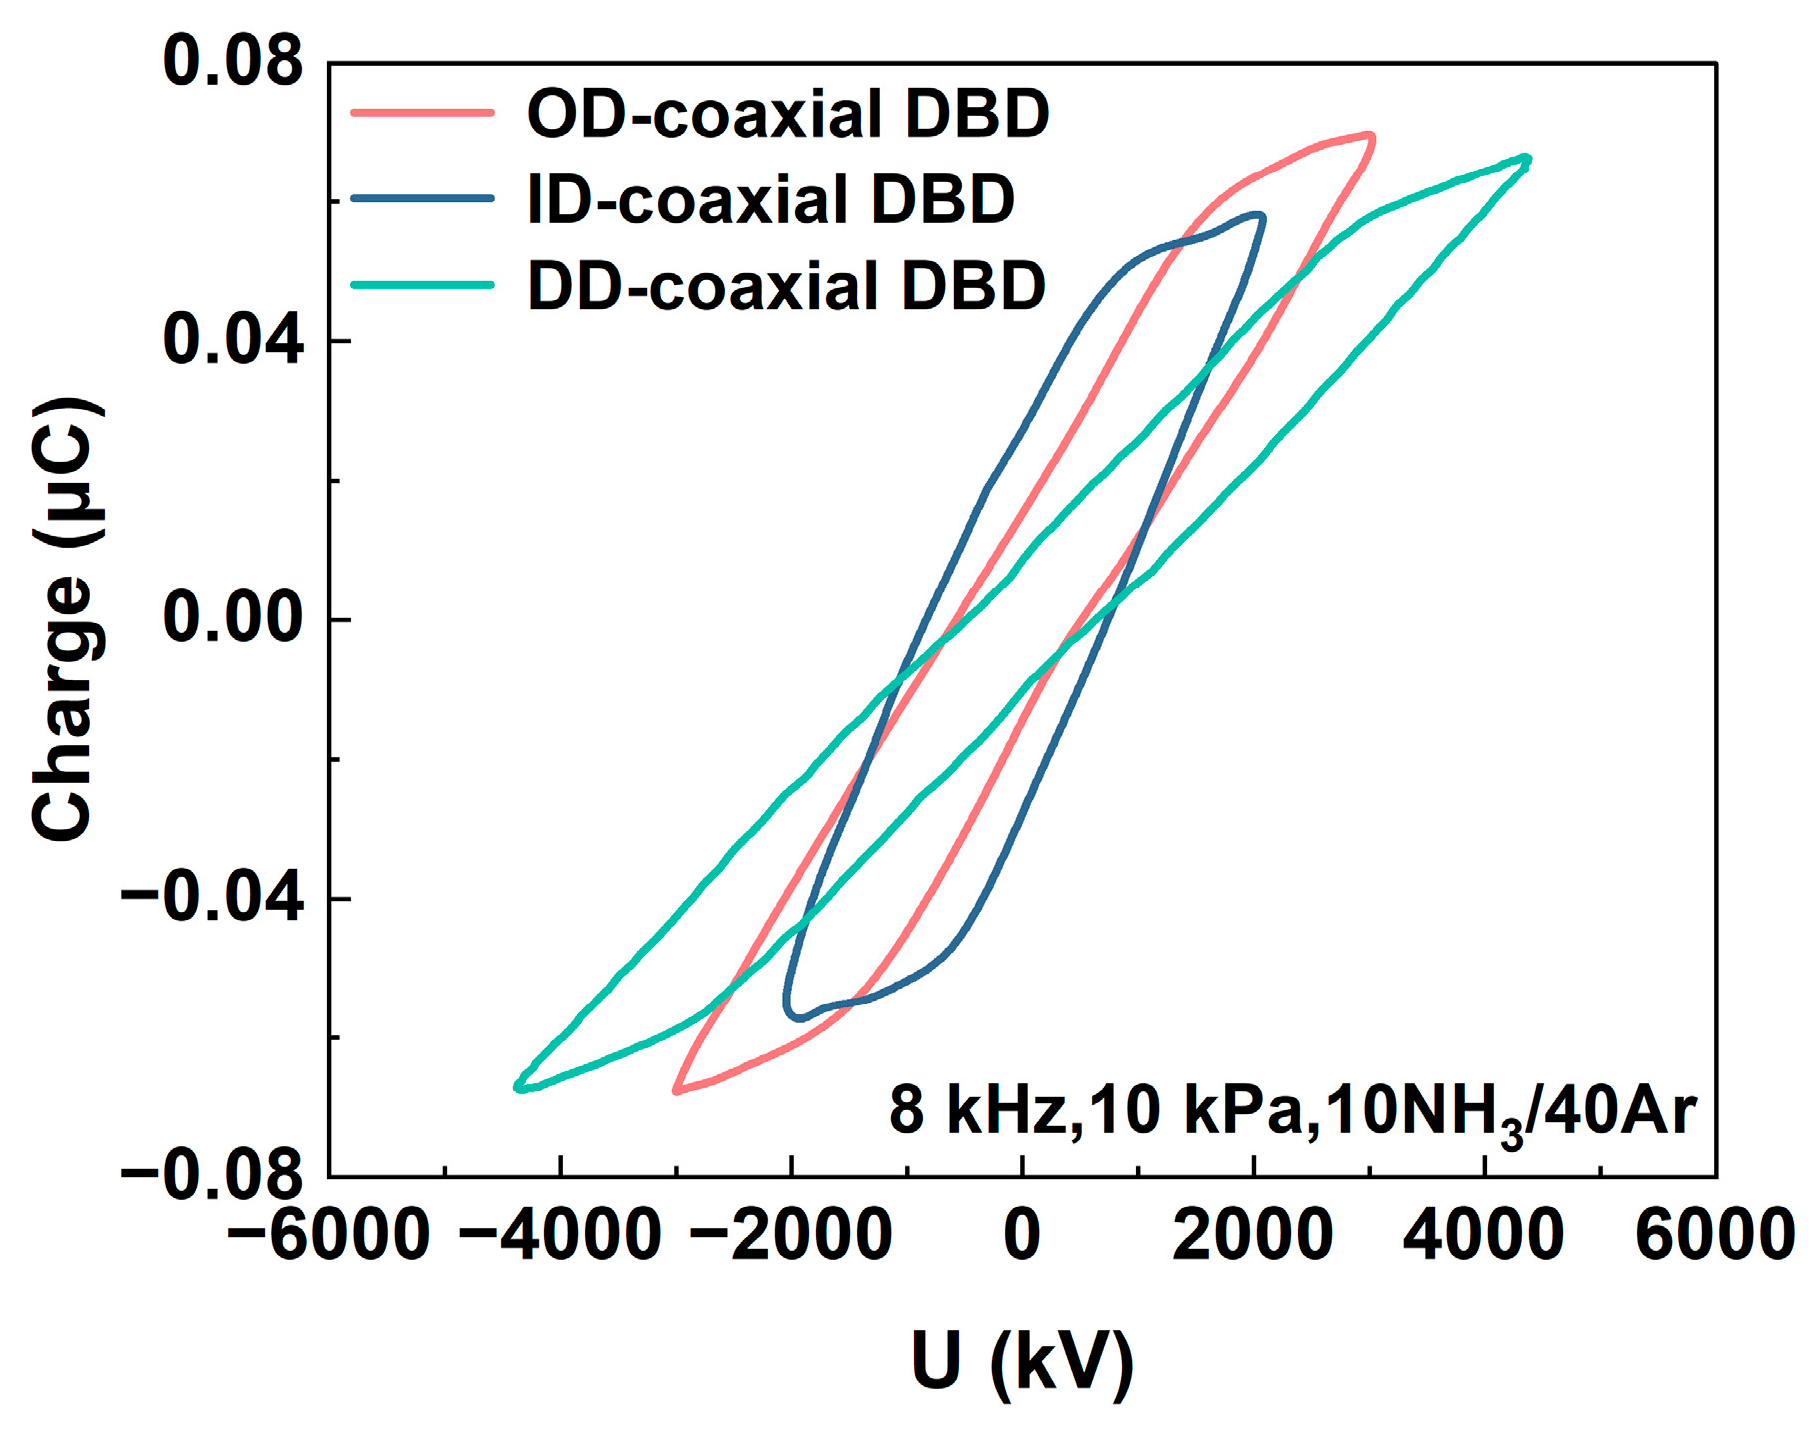
To further investigate the effects of varying geometric configurations on the deposited discharge energy of the reactors, Figure 5 presents the Lissajous figures for the three configurations under constant input power. The Lissajous figure is employed to determine the dielectric capacitance (Cd) and charge transfer characteristics of the reactors under various operating conditions [30,31]. The enclosed area of a Lissajous figure directly represents the actual energy deposited into the plasma per alternating current (AC) cycle. Figure 5 shows that at a constant applied power of 3 W, the actual discharge powers deposited into the plasma zone for the OD-coaxial DBD, ID-coaxial DBD, and DD-coaxial DBD configurations are 0.85 W, 0.81 W, and 0.66 W, respectively. This is caused by the significant variation in the reactor’s dielectric capacitance. Notably, the curves representing the single-dielectric configurations (ID-coaxial DBD and OD-coaxial DBD) exhibit nearly parallel and steep slopes during the discharge phase. Linear fitting of these steep segments indicates that the dielectric capacitances (i.e., the effective capacitance of the system during the discharge phase) for the OD- and ID-coaxial DBD configurations are approximately 60 pF and 58 pF, respectively. This highly consistent quantitative result objectively corroborates the structural premise that both utilize a single dielectric layer of identical thickness. However, the ID-coaxial DBD configuration displays the most compact “narrow and tall” profile, requiring the lowest peak voltage (~2500 V) to achieve substantial charge transfer, whereas the voltage span for the OD-coaxial DBD configuration broadens to approximately 2800 V. In contrast, due to the series integration of the two dielectric layers, the equivalent capacitance of the double-dielectric (DD-coaxial DBD) configuration decreases significantly to roughly 37 pF. As shown in Figure 5, the DD-coaxial DBD structure possesses the minimum gradient and the widest voltage span (approx. 4200 V). This indicates that the lower capacitance of the DD-coaxial DBD configuration endows the system with a higher capacitive reactance, forcing a substantial portion of the applied high voltage to drop across the thick dielectric layers, thereby noticeably limiting the effective injection of electrical energy into the plasma region.
In summary, the electrical diagnostics, including the voltage–current characteristics, current pulse statistics, and Lissajous figures, clearly demonstrate that the placement of the dielectric barrier plays an important role in governing the equivalent capacitance and energy coupling efficiency of the reactor. Building upon this physical basis, the following section systematically evaluates the impacts of these three configurations on the H2 production and overall Y H 2 during plasma-assisted ammonia decomposition.

3.2. NH3 Decomposition in Outer-Dielectric Coaxial DBD

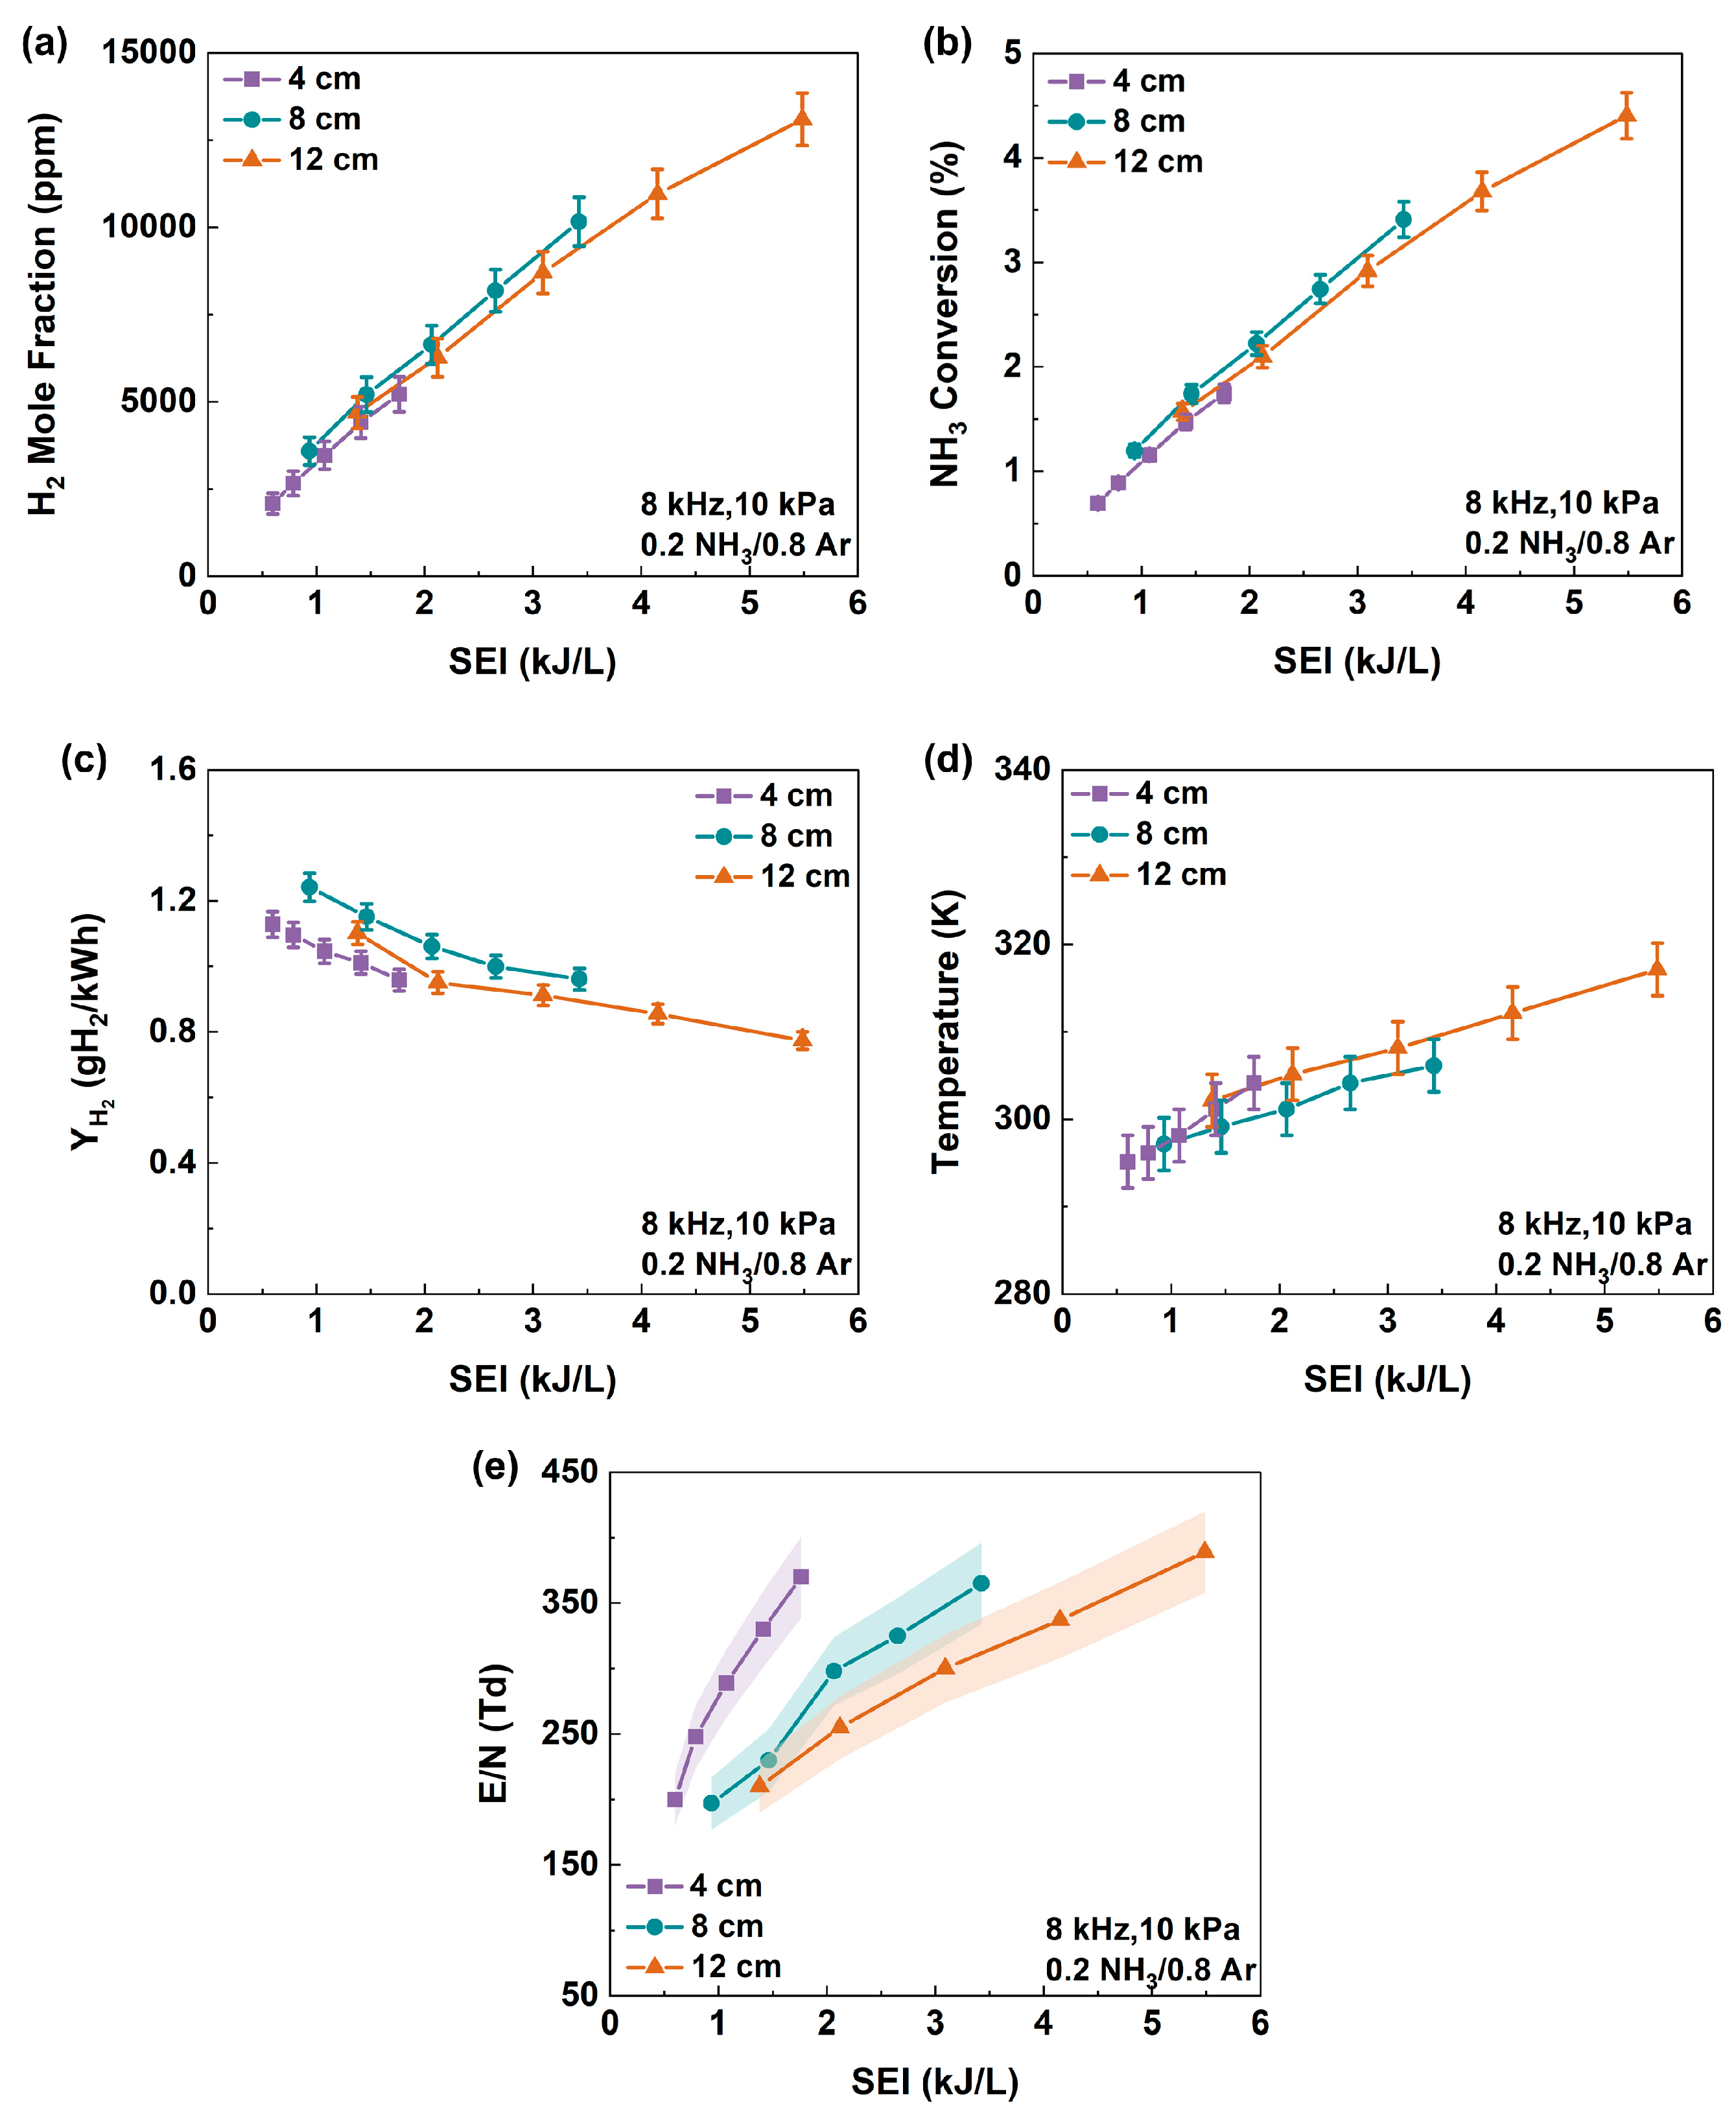
Figure 6a–e systematically presents the variations in the H2 mole fraction, NH3 conversion, hydrogen yield, gas temperature, and E/N as a function of the SEI in the OD-coaxial DBD. The electrode lengths are 4 cm, 8 cm, and 12 cm, while the outer dielectric thickness and discharge gap are both 2 mm. E is obtained by the formula E = U gap / d , where U gap represents the voltage across the gas gap during the discharge process and d represents the discharge gap distance. The U gap calculation for the AC discharge is based on the method proposed by Pipa et al. [32]. In this study, power regulation is achieved by adjusting the applied voltage within the range of 1500 V to 3000 V while maintaining a constant discharge frequency of 8 kHz. The experimental results show that the SEI ranges corresponding to the electrode length of 4, 8, and 12 cm are 0.60–1.76 kJ/L, 1.20–3.41 kJ/L, and 1.38–5.49 kJ/L, respectively, while the corresponding plasma power ranges are 0.50–1.47 W, 0.78–2.85 W, and 1.15–4.57 W. This indicates that under the same applied voltage, a longer electrode injects more total energy into the plasma region.
As shown in Figure 6a,b, the H2 mole fraction and NH3 conversion increases almost linearly with SEI across all electrode lengths, indicating that higher energy input consistently enhances hydrogen production. Specifically, as the SEI increases, the H2 mole fraction of the 4 cm, 8 cm and 12 cm electrodes rises from 2082, 3584, and 4691 ppm to 5216, 10,161, and 13,095 ppm, respectively. Meanwhile, the NH3 conversion increases from 0.77%, 1.2%, and 1.6% to 1.7%, 3.4%, and 4.4%. However, Figure 6c reveals a decrease in Y H 2 as SEI increases. To further elucidate the underlying mechanisms governing these discrepancies, the gas temperature and the corresponding E/N values are compared. As shown in Figure 6d, under the same SEI conditions, the 8 cm electrode configuration exhibited the smallest temperature increase. Furthermore, correlating this with the reduced electric field in Figure 6e, it is evident that the 4, 8, and 12 cm electrodes achieve their peak energy efficiencies within the E/N ranges of approximately 180–220 Td, 177–217 Td, and 190–210 Td, respectively.
To further understand the underlying mechanisms at different discharge voltages, the Boltzmann equation solver BOLSIG+ [33] is employed to calculate electron energy fractions deposited into different excitation modes as a function of E/N. The electron-impact cross-section data are primarily obtained from the LXCat online database [34]. The cross-sections of reactions e + NH3 → e + NH + H2 and e + NH3 → e + NH2 + H updated most recently by Chen et al. [35] are used. The cross-sections of Ar are from the Phelps database [36]. The above cross-sections have been validated in plasma-assisted NH3 combustion systems [37,38,39].
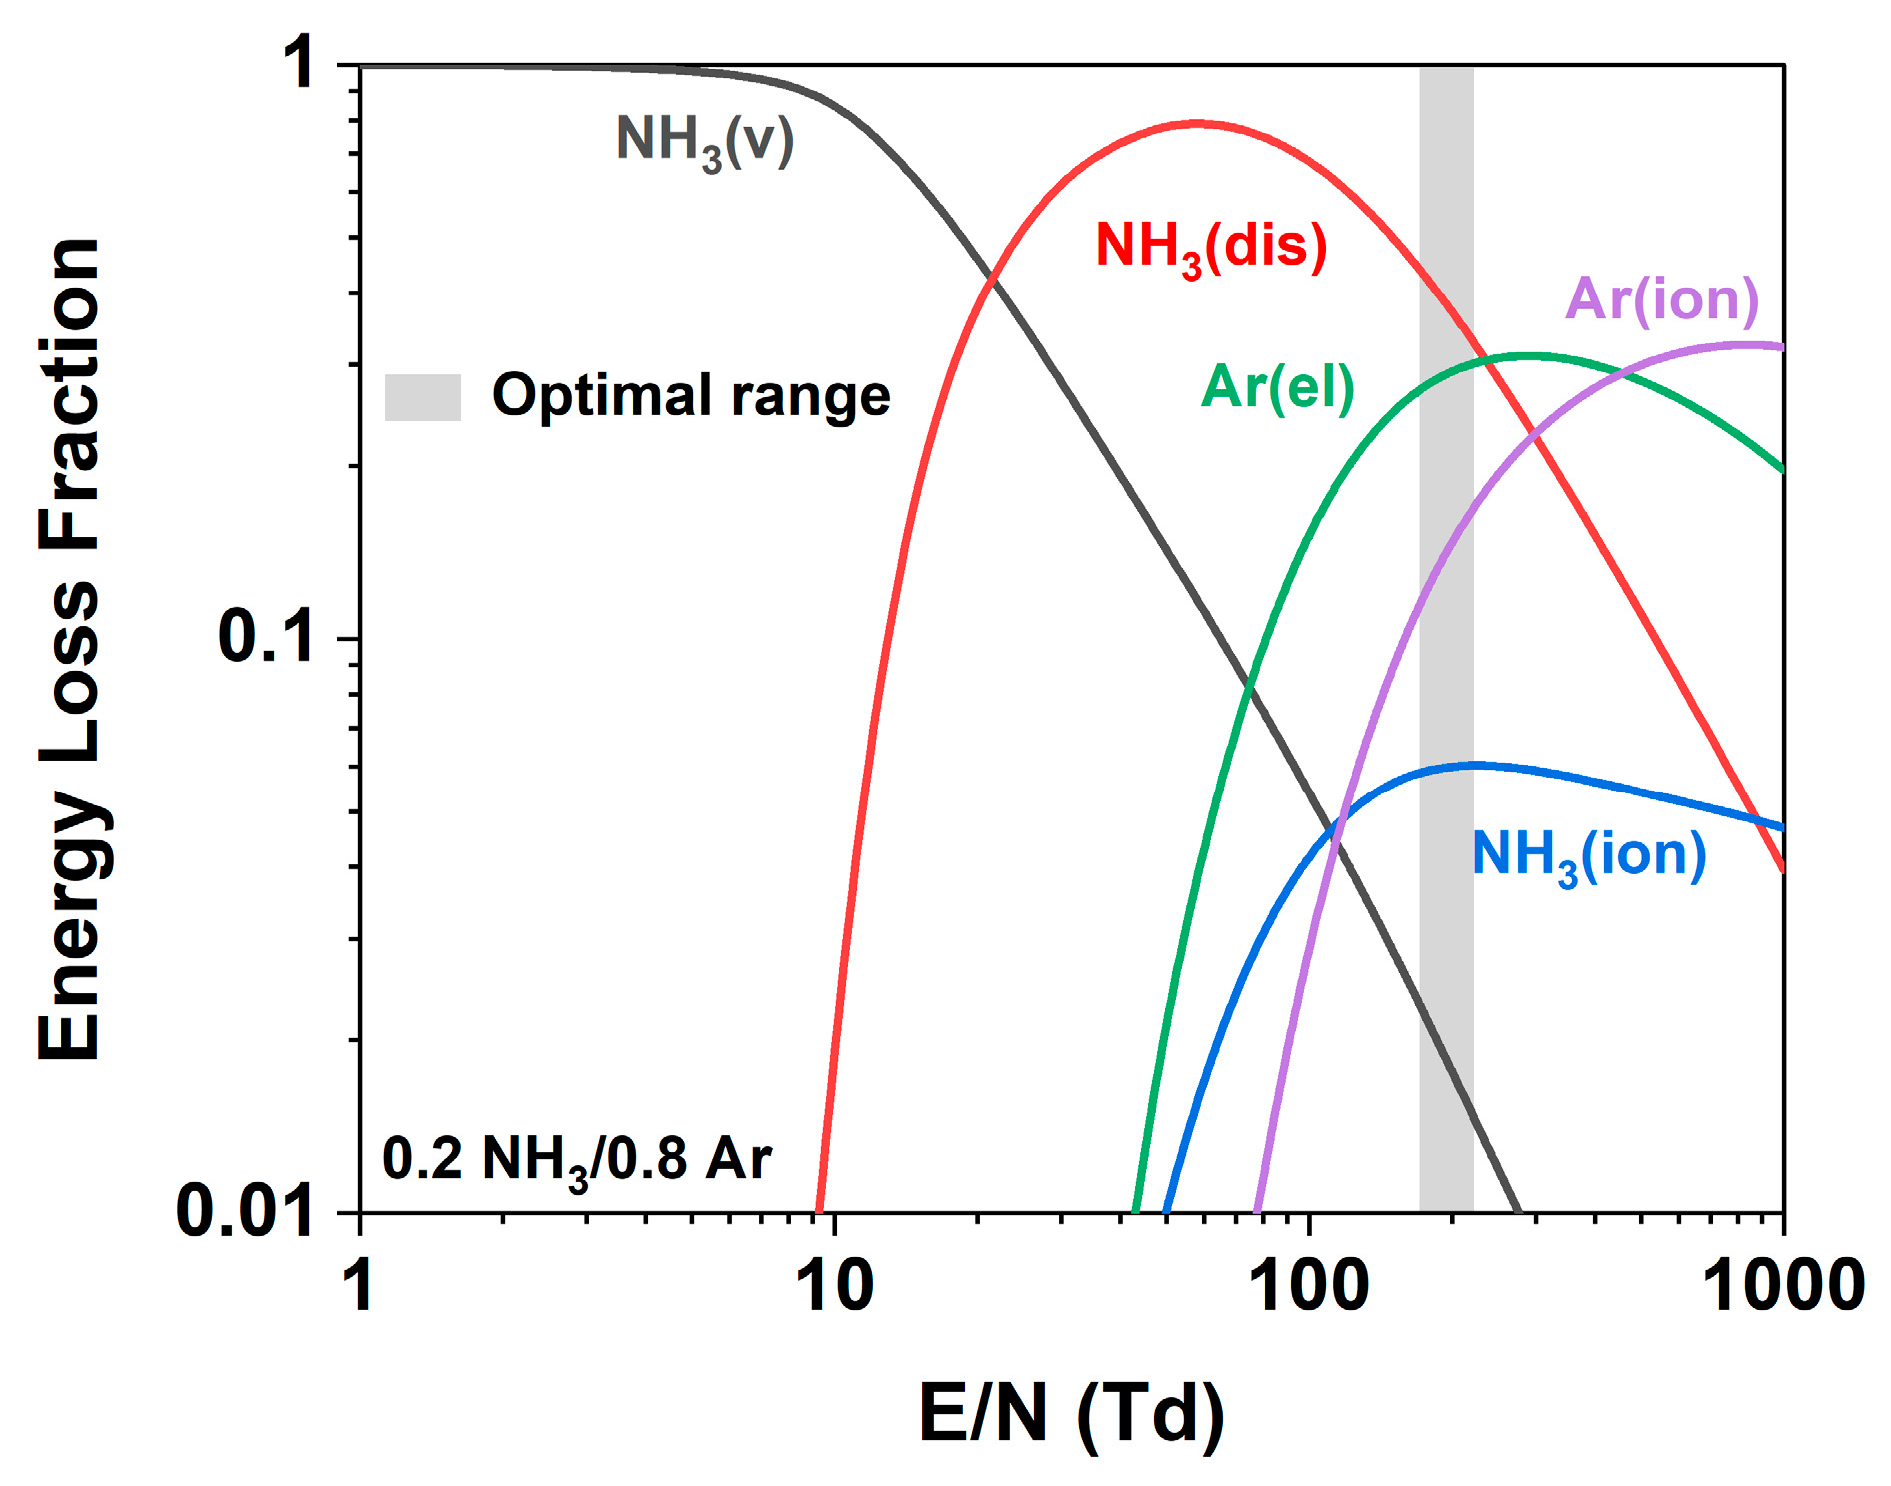
Figure 7 shows that in the 0.2 NH3/0.8 Ar mixture, the optimum reduced electric fields (180–220 Td) for H2 production are achieved when the NH3 dissociation and the electronic excitation and ionization of Ar all occur effectively. Fundamentally, hydrogen generation during the plasma discharge of 0.2 NH3/0.8 Ar mixture is determined by electron-impact dissociation and intermediate species reactions. Specifically, direct electron-impact dissociation reaction e + NH3 → e + NH + H2 is the primary pathway for H2 and NH radical production. In addition, the reaction e + NH3 → e + NH2 + H also provides sufficient NH2 and H radicals, which are the key species for H2 production. Subsequently, these heavy active NH, NH2, and H radicals promote the H2 production through NH + H = N + H2 and NH2 + H = NH + H2. Furthermore, the excitation and ionization of Ar also play a critical role for H2 production. The production of electronically excited Ar* further accelerates H2 and intermediate radical formation through reactions such as Ar* + NH3 → Ar + NH + H2 and Ar* + NH3 → Ar + NH2 + H [40]. The electron energy loss in the excitation of products and intermediate species can be neglected due to their low concentrations.
However, once the reduced electric field exceeds the optimal range (180–220 Td), the fraction of electron energy deposited into NH3 dissociation decreases. As a result, a larger portion of the input energy is diverted to Ar electronic excitation and ionization, which are considerably less effective in promoting NH3 decomposition compared with direct electron-impact dissociation of NH3 for H2 production. Consequently, Y H 2 decreases monotonically with increasing SEI. This is consistent with the decrease in Y H 2 with increasing SEI observed in Figure 6c, which occurs when the corresponding E/N value increases beyond 220 Td as shown in Figure 6e. Among these three configurations, the 8 cm electrode demonstrated a slightly higher Y H 2 compared to the 4 and 12 cm electrodes. The reason for this phenomenon might be that there is an optimal matching window between the residence time in the plasma reactor and the energy density. When the discharge zone is too short, the residence time is insufficient, causing some NH3 molecules to leave the reactor before undergoing effective collisions with high-energy electrons. On the contrary, when the discharge zone is too long, the extended residence time leads to an increase in energy dissipation in thermal heating, thereby reducing the overall Y H 2 related to the energy effectively utilized for NH3 decomposition through the kinetic energy pathway influenced by electron collisions.

3.3. NH3 Decomposition in Inner-Dielectric Coaxial DBD

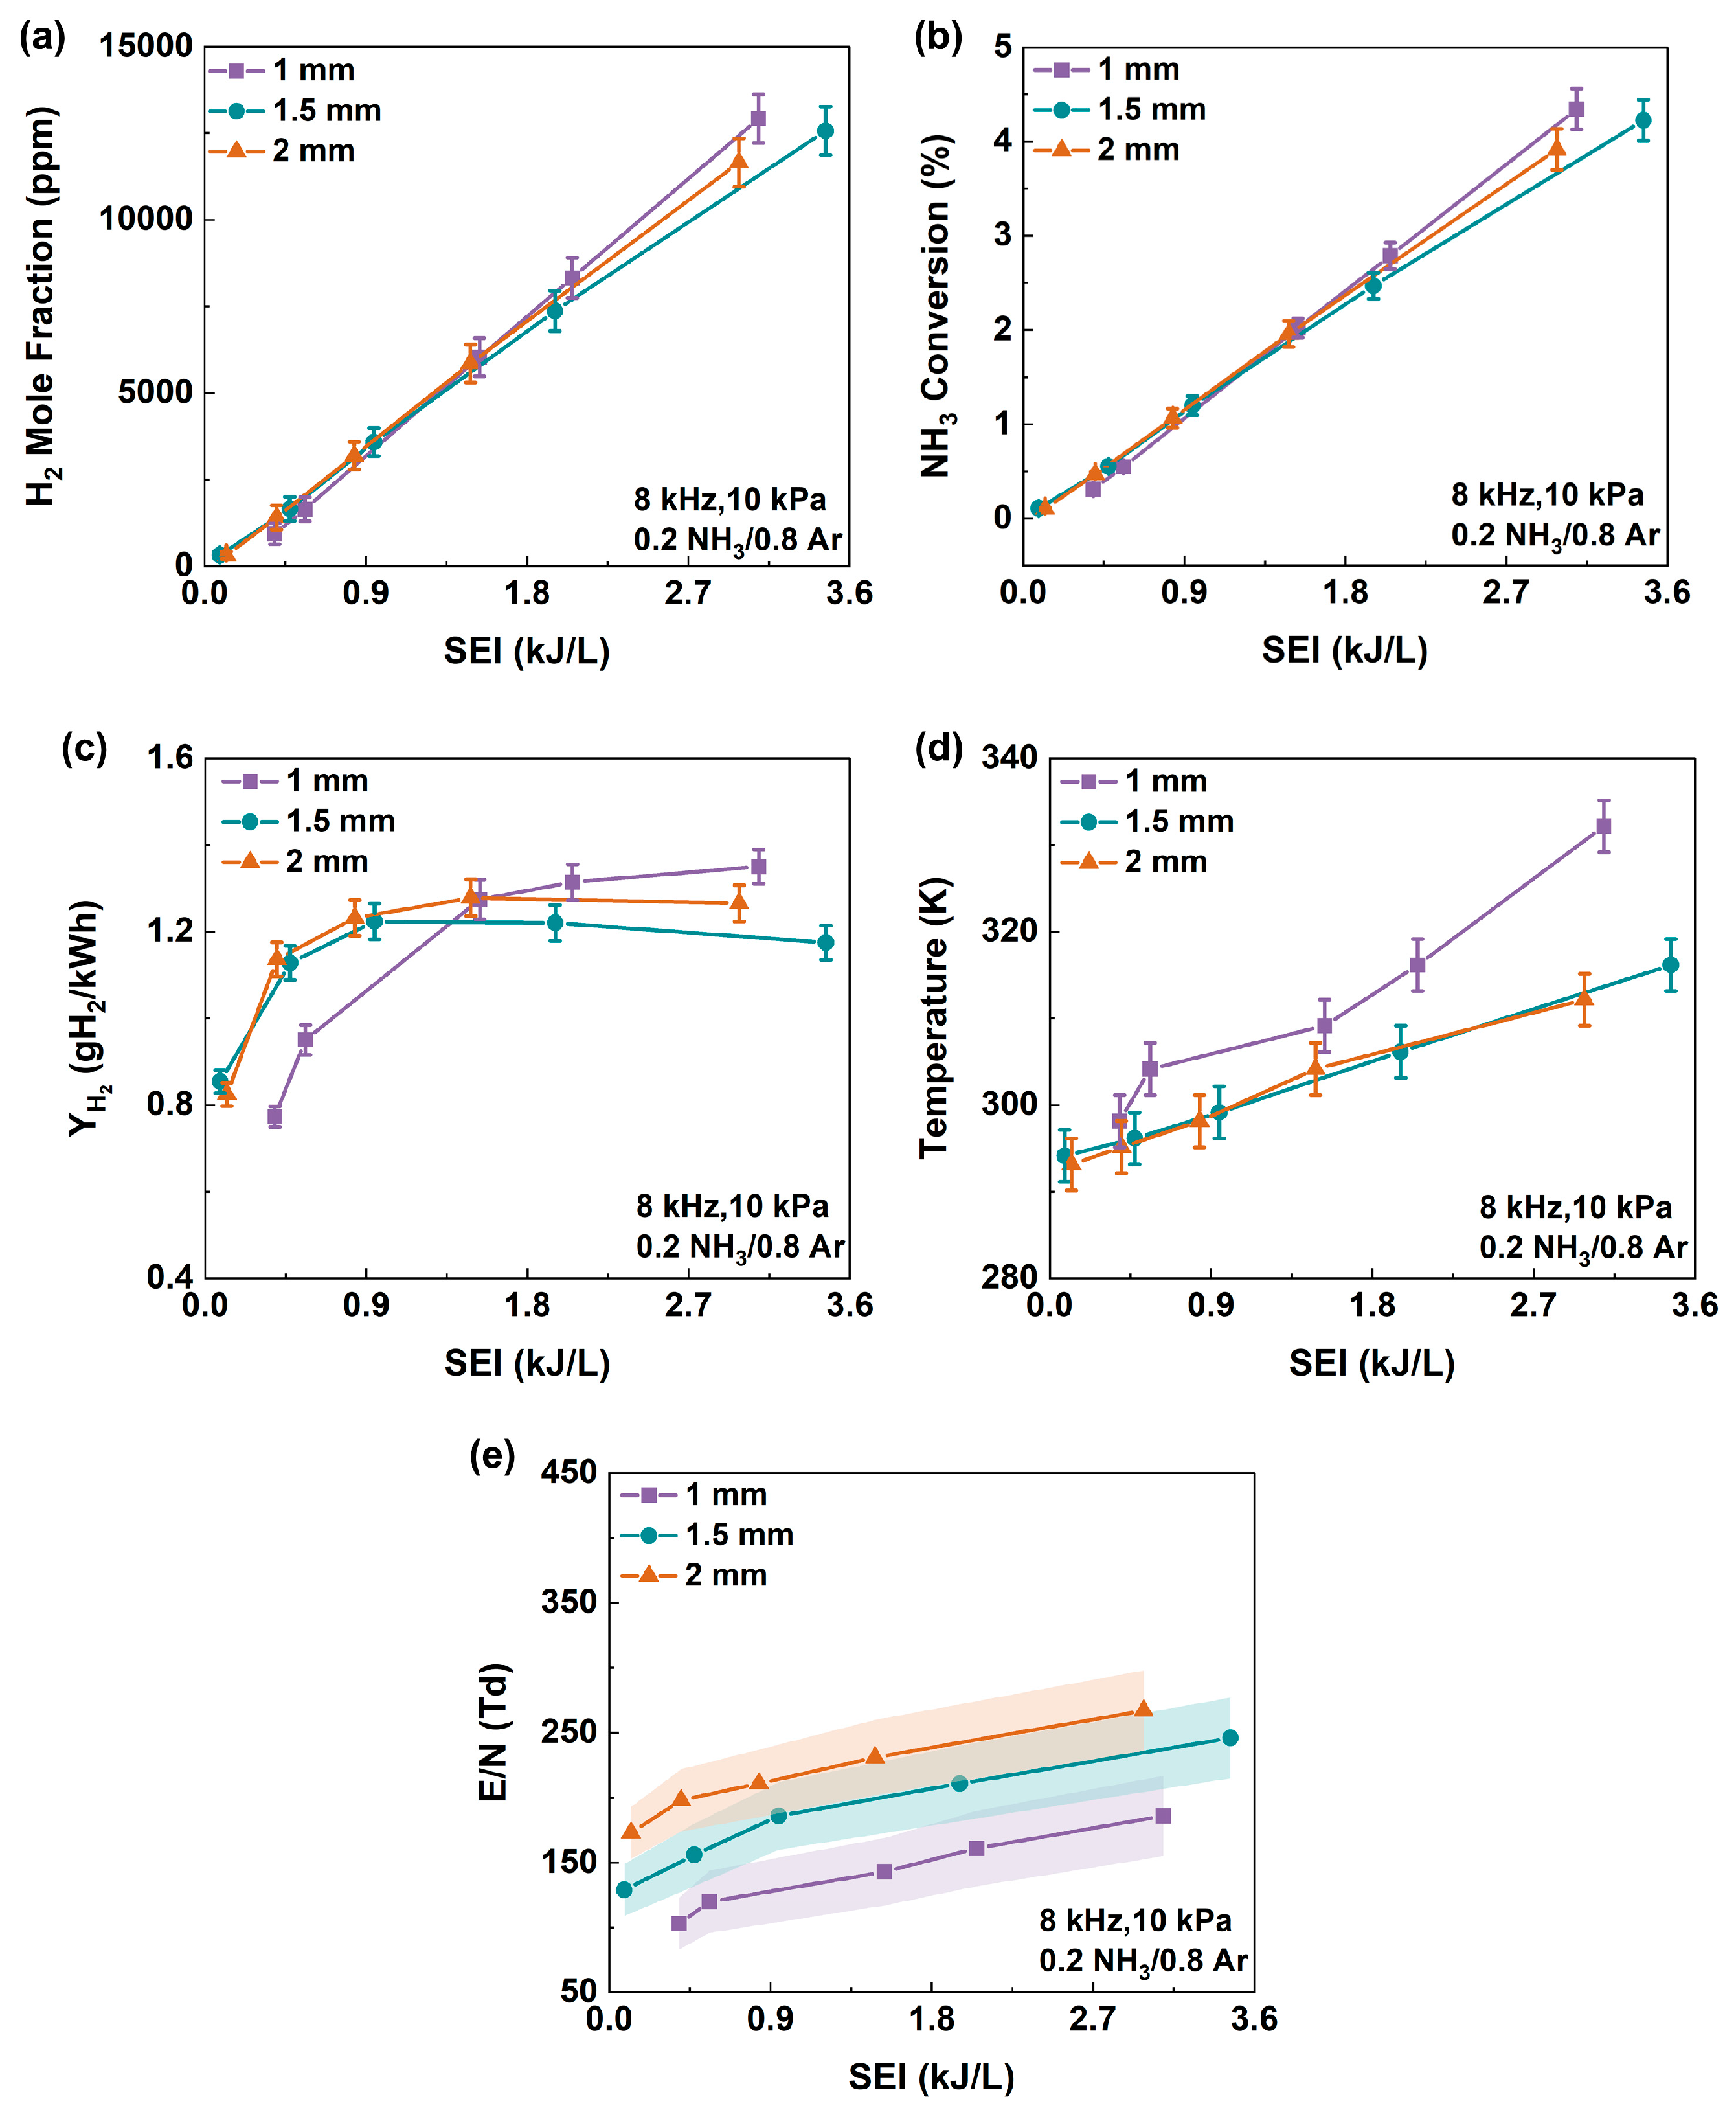
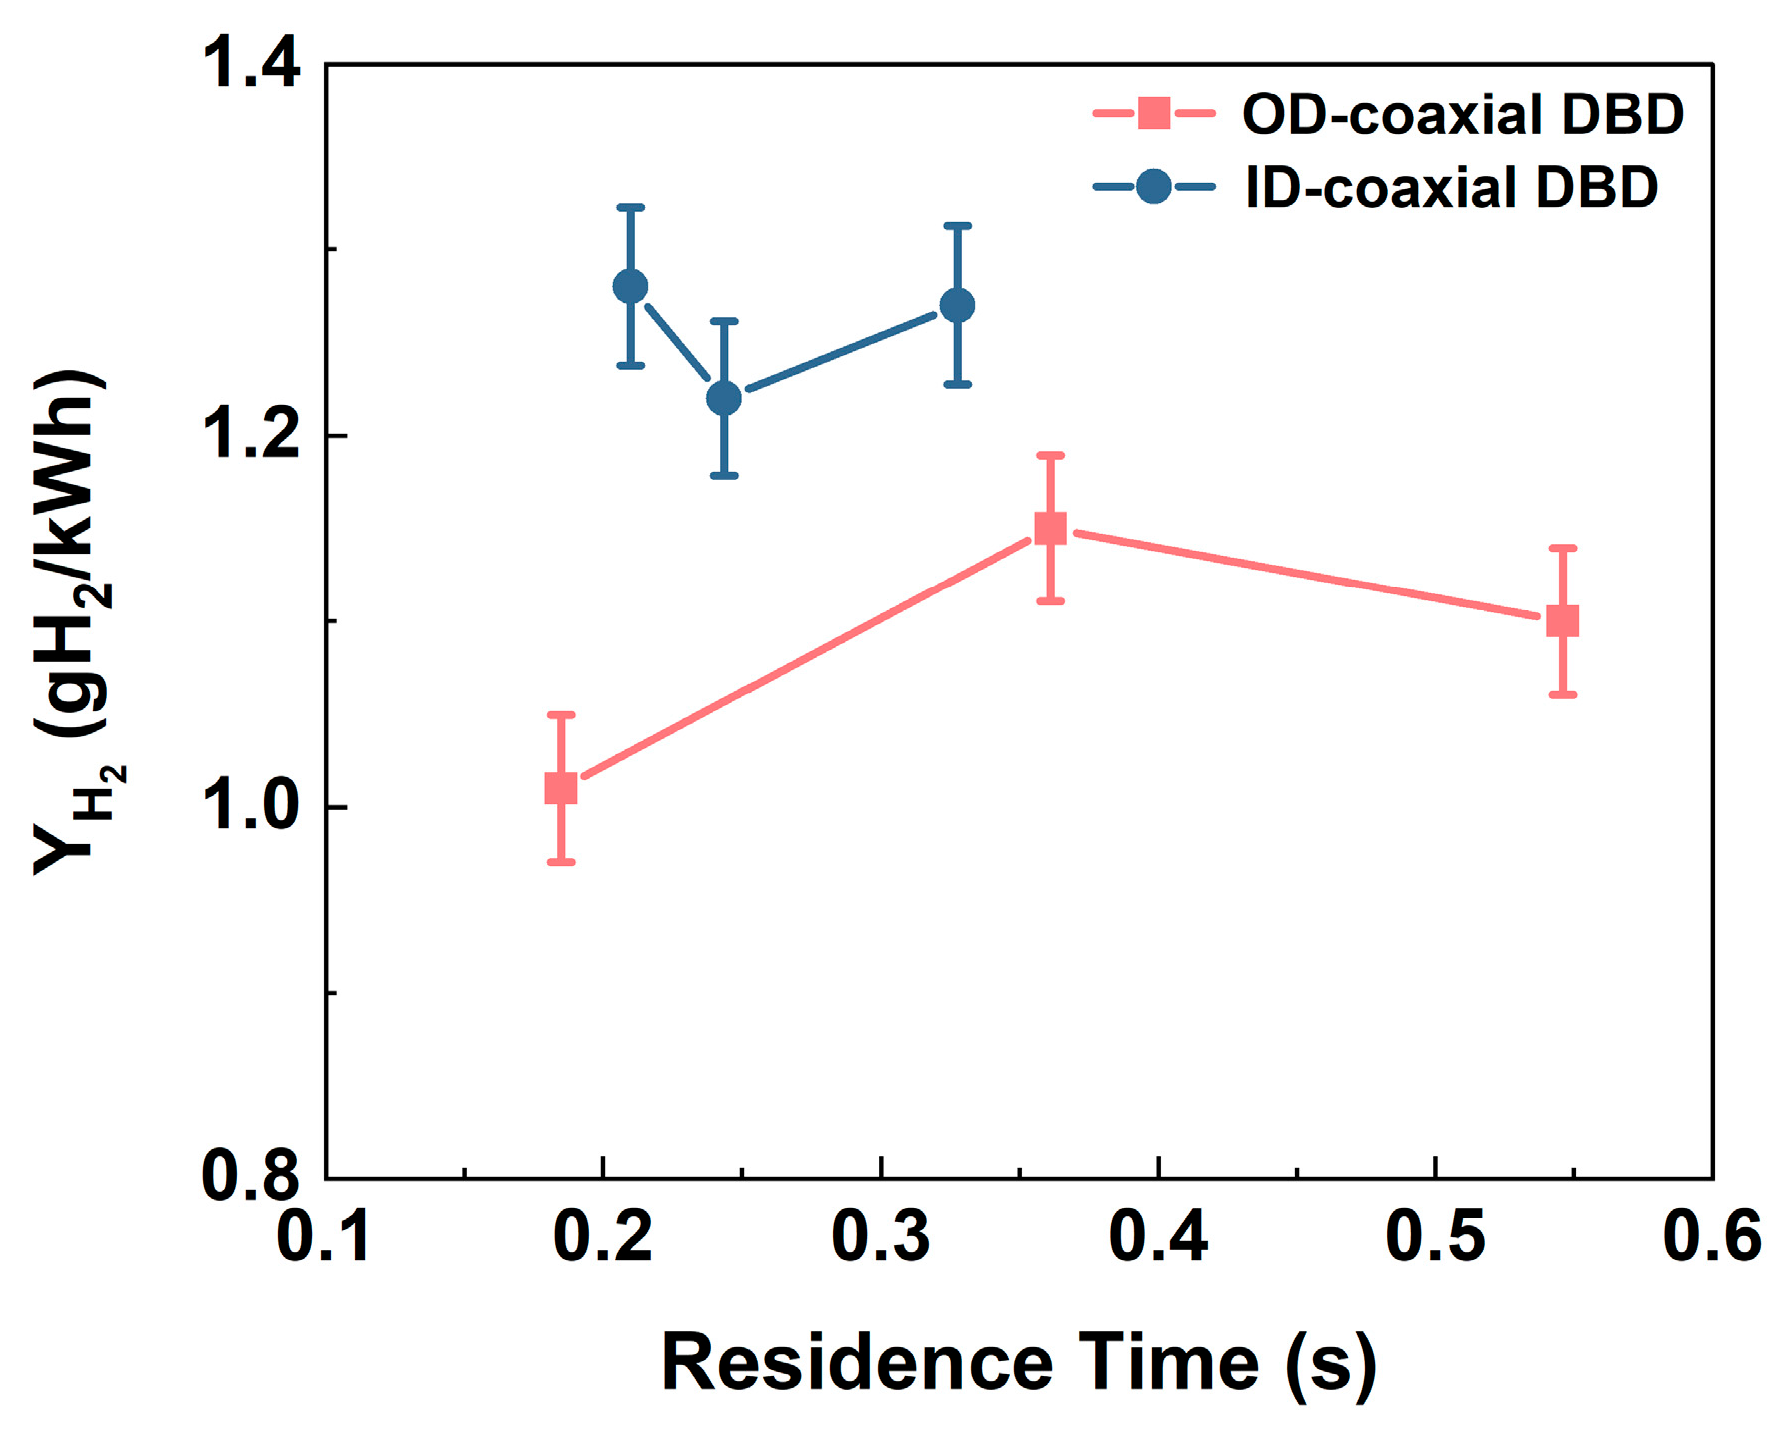
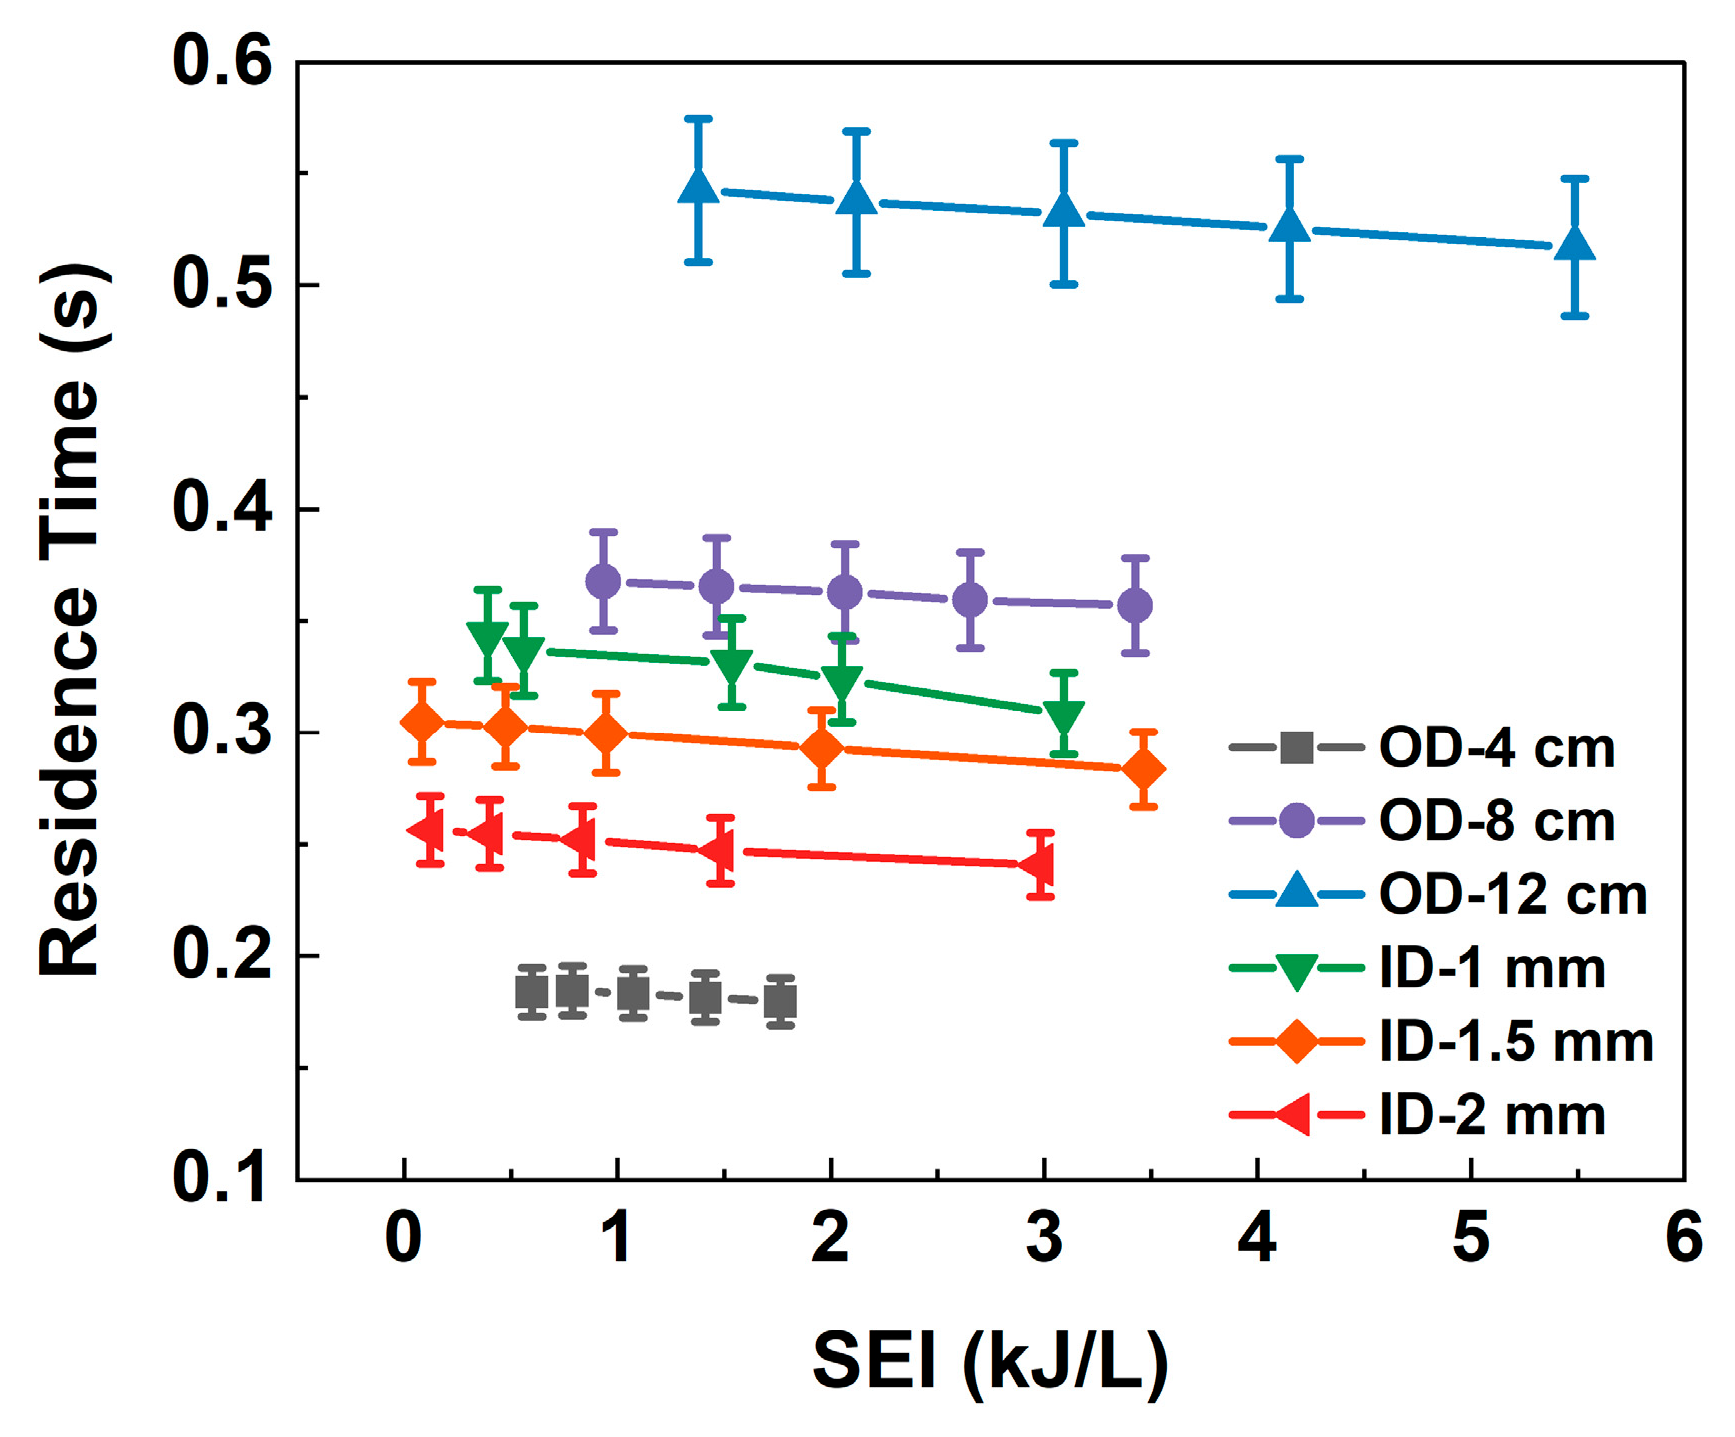
Figure 8a–e illustrates the variations in H2 mole fraction, NH3 conversion, hydrogen yield, gas temperature, and E/N as a function of the SEI in an ID-coaxial DBD reactor with dielectric thicknesses of 1, 1.5, and 2 mm. In particular, when the dielectric thickness is 2 mm, the discharge gap of this reactor configuration is 2 mm. The experimental results show that the SEI ranges corresponding to dielectric thicknesses of 1 mm, 1.5 mm and 2 mm are 0.39–3.09 kJ/L, 0.10–3.47 kJ/L, and 0.12–2.98 kJ/L, respectively, while the plasma power ranges are 0.27–2.58 W, 0.07–2.89 W, and 0.10–2.49 W. As shown in Figure 8a,b, the H2 mole fraction and NH3 conversion exhibits a linear increasing trend with SEI across all dielectric thicknesses. When SEI reaches its maximum value within the testing range, for dielectric thicknesses of 1 mm, 1.5 mm, and 2 mm, the H2 mole fraction increases to approximately 13,000 ppm, 12,500 ppm, and 11,500 ppm, respectively, and the corresponding NH3 conversion are 4.3%, 4.2%, and 3.9%, respectively. However, as depicted in Figure 8c, the Y H 2 of the reactor demonstrates a distinct non-monotonic dependence on dielectric thickness. The configurations with 1.5 mm and 2 mm thick dielectrics both display a trend of initial increase followed by a decline, achieving their optimal Y H 2 of 1.22 and 1.28 gH2/kWh at SEI values of 0.90 kJ/L and 1.48 kJ/L, respectively. In contrast, the 1 mm dielectric thickness exhibits a different behavior: although its Y H 2 is relatively lower at initial SEI levels, it rises continuously with increasing SEI, ultimately surpassing the thicker dielectric configurations and peaking at ~1.35 gH2/kWh at the highest SEI. To better understand the evolutionary trends of Y H 2 in the ID-coaxial DBD, Figure 9 plots the Y H 2 of both the OD- and ID-coaxial DBDs as a function of residence time. As shown, the Y H 2 in both configurations exhibits a clear dependence on the residence time. Figure 10 further illustrates the actual residence time as a function of specific energy input (SEI). Notably, the residence time across all OD- and ID-coaxial DBDs remain nearly constant as the SEI increases, exhibiting only a marginal decrease attributed to gas heating-induced expansion. Therefore, the dynamic variation in residence time cannot be the primary factor driving the distinct Y H 2 trends against SEI observed in the two configurations.
To understand the underlying mechanisms behind this hydrogen yield divergence, Figure 8d,e provides experimental data on gas temperature and E/N, respectively. Figure 8d shows that gas temperature increases with SEI, which not only causes more energy to be dissipated as Joule heating but also directly reduces the gas number density, thereby elevating the E/N in the gas gap. The 2 mm and 1.5 mm thick dielectrics maintain overall higher E/N ranges (approximately 173–267 Td and 129–246 Td, respectively), whereas the 1 mm thick dielectric maintains a lower E/N range (103–186 Td). This divergence in electric field distribution is attributed to the dual effects induced by altering the dielectric thickness: an increase in thickness significantly reduces the dielectric capacitance of the system (the calculated Cd values for 1 mm, 1.5 mm, and 2 mm are 86 pF, 73 pF, and 60 pF, respectively) and alters the effective discharge gap correspondingly. The synergistic effect of these two factors directly governs the E/N in the gas gap.
This experimental observation is highly consistent with the optimal E/N window discussed in the previous section. For the 1.5 mm and 2 mm dielectric configurations, when the SEI reaches their respective inflection points (0.90 kJ/L and 1.48 kJ/L), their corresponding E/N values reach 186 Td and 231 Td. These values approach or begin to deviate from the optimal E/N window for NH3 decomposition. In contrast, for the 1 mm dielectric configuration, even as the SEI increases to its maximum, the E/N just reach 186 Td, which is close to the upper limit of the optimal E/N range. This reasonably explains why the Y H 2 of the 1 mm dielectric configuration maintains an increasing trend and ultimately surpasses the 1.5 mm and 2 mm configurations at higher SEIs. In addition, the ratio between the area of the electrode contacting with the gas and the ratio of surface area to volume (A/V) may also have an impact on the dependence of Y H 2 on SEI [41]. For example, for a dielectric with a thickness of 2 mm, the A/V ratio of the ID structure is approximately 1.6 times that of the OD structure. This geometric difference implies that the surface-mediated dissociation and catalytic effects could affect the overall conversion process in the ID configuration, which need to be studied in future works.

3.4. NH3 Decomposition in Double-Dielectric Coaxial DBD

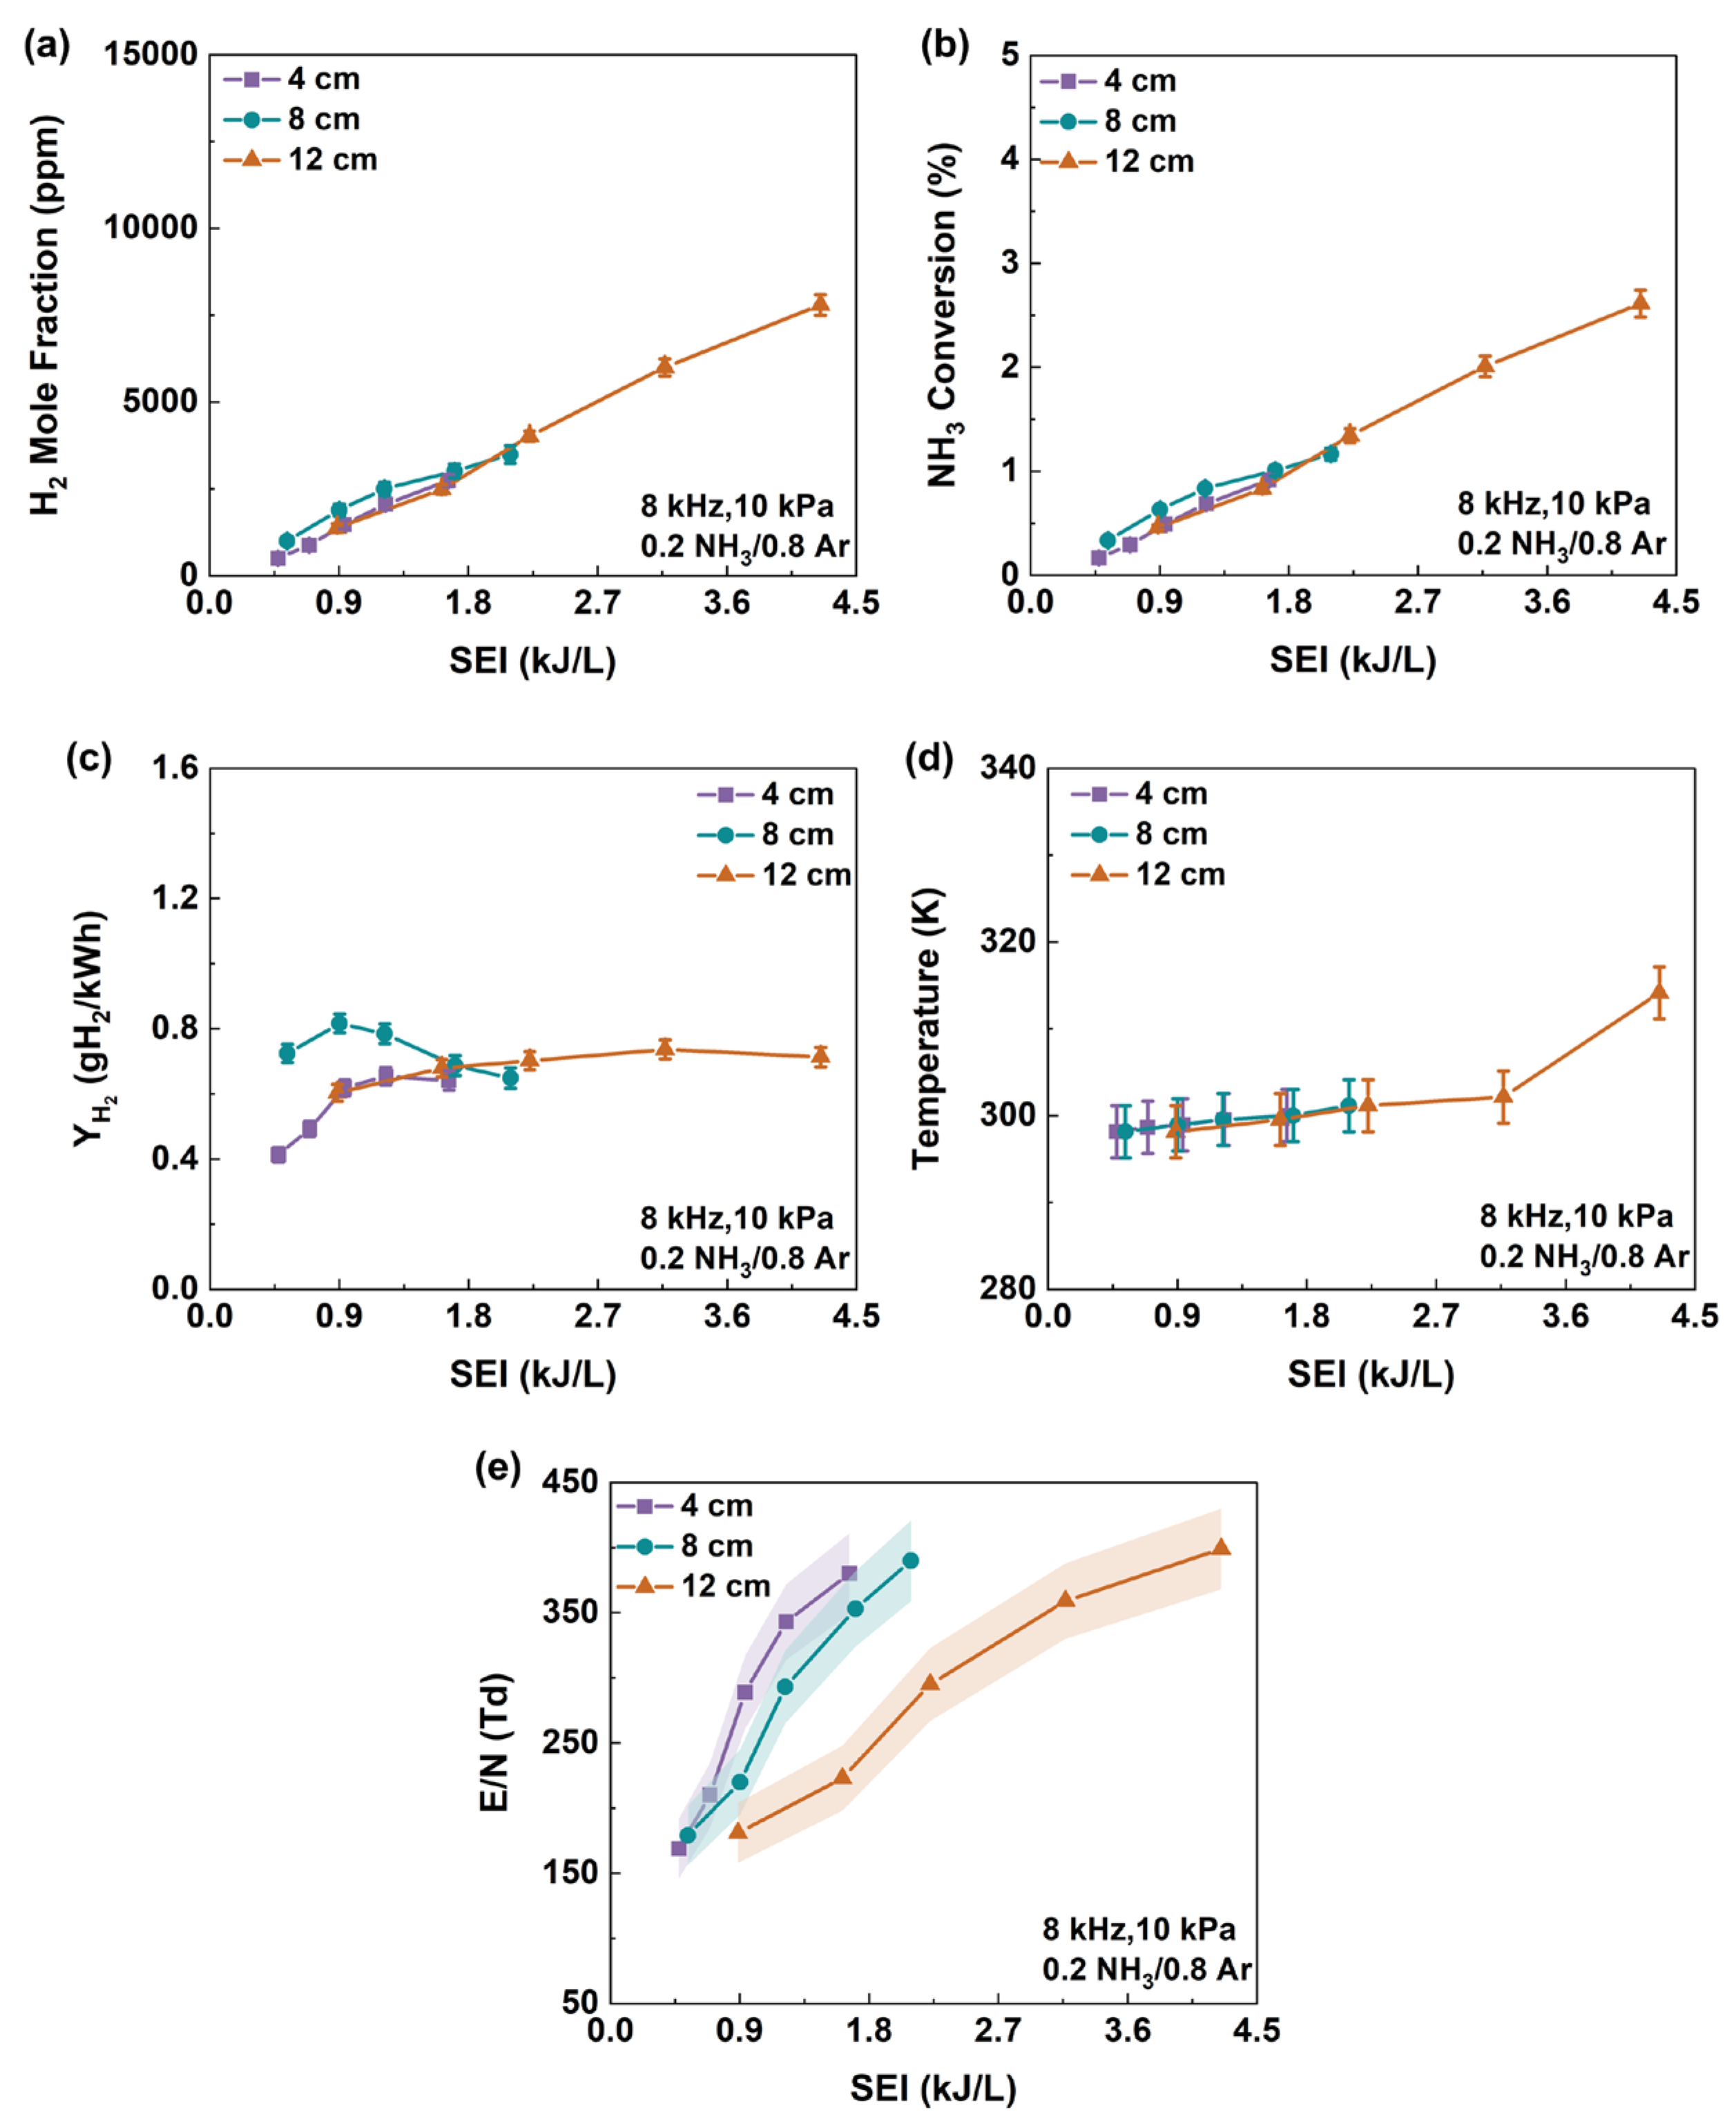
Figure 11a–e shows the dependence of H2 mole fraction, NH3 conversion, hydrogen yield, gas temperature, and E/N on SEI in a DD-coaxial DBD with electrode lengths of 4, 8, and 12 cm. The reactor employs an outer dielectric thickness of 2 mm, an inner dielectric thickness of 0.5 mm, and a discharge gap of 2 mm. The experimental results show that the SEI ranges corresponding to the 4, 8, and 12 cm electrodes are 0.48–1.66 kJ/L, 0.54–2.09 kJ/L, and 0.89–4.25 kJ/L, respectively, and the plasma power ranges are 0.40–1.38 W, 0.45–1.74 W, and 0.74–3.54 W. As shown in Figure 11a,b, the H2 mole fraction and NH3 conversion maintain a linear growth with SEI. Even under the highest intensity electric field conditions, the optimal H2 mole fraction for the 4 cm, 8 cm and 12 cm electrodes is only approximately 2742 ppm, 3490 ppm, and 7798 ppm, respectively, and the optimal NH3 conversion is only approximately 0.9%, 1.2%, and 2.6%, respectively. These values are significantly lower than those of the ID-coaxial DBD and OD-coaxial DBD structures mentioned above. This indicates that DD-coaxial DBD limits the production of H2. Furthermore, Figure 11c shows that the overall Y H 2 of the DD-coaxial DBD is not only at a lower level but also exhibits a much more pronounced non-monotonic trend with SEI compared to the ID-coaxial DBD at the same electrode length of 4 cm. Specifically, the 4 cm, 8 cm, and 12 cm electrodes reach their peak energy efficiencies at SEI values of 1.22 kJ/L, 0.90 kJ/L, and 3.17 kJ/L, yielding 0.65 gH2/kWh, 0.82 gH2/kWh, and 0.74 gH2/kWh, respectively. This is mainly due to the series coupling of the inner- and outer-dielectric layers in the dual-medium structure. This results in an increase in capacitance resistance, requiring more energy to maintain a higher voltage, thereby significantly reducing the number of current pulses that are more conducive to the generation of plasma. Furthermore, since the electrodes in the DD-coaxial DBD have no contact with the gas, the catalytic effect of the electrodes on the ammonia decomposition reaction is almost zero. Therefore, the hydrogen production performance and Y H 2 of the DD-coaxial DBD are significantly inferior to those of the OD and ID-coaxial DBDs.
As illustrated in Figure 4, the number of current spikes increases progressively with the specific energy input (SEI). Due to the inherent limitations of the DD-coaxial DBD, the increase in the number of micro-discharges in this configuration has a greater impact on the production of reactive species. Consequently, this dynamic effectively drives the ascending trend in Y H 2 observed at the initial SEI stage. Figure 11d shows that there is almost no difference in the exhaust gas temperature among the various configurations of the DD-type coaxial DBD. This indicates that temperature is not the cause of the trend change in Y H 2 . To understand the trend of Y H 2 , the E/N values are presented in Figure 11e. The results reveal that as the SEI increases, the E/N of the DD-coaxial DBD for the 4 cm, 8 cm, and 12 cm electrodes increases substantially from 169, 179, and 181 Td to 380, 390, and 399 Td, respectively. As discussed in Section 3.1, the large capacitive reactance forces the system to operate under elevated applied voltages to sustain the discharge. When this high voltage is applied, the E/N rapidly overshoots and substantially deviates from the optimal electric field window (186–231 Td) for efficient NH3 decomposition. In conclusion, because of the reduced current pulse numbers and the deviation of E/N from the optimal range with elevated operating voltages, the final hydrogen production and Y H 2 of the DD-coaxial DBD are significantly inferior to those of the single-dielectric (ID/OD)-coaxial DBDs.

4. Conclusions

This study systematically studied the effects of reactor geometry on plasma-assisted ammonia (NH3) decomposition for hydrogen production. Through a comparative analysis of outer-dielectric (OD), inner-dielectric (ID), and double-dielectric (DD) coaxial DBD reactors, the following key conclusions are obtained.
Electrical diagnostics show that single-dielectric (OD and ID) coaxial DBD reactors exhibit higher equivalent capacitances (60 and 58 pF, respectively). This enables the generation of abundant micro-discharge pulses at lower peak voltages, allowing more effective energy deposition into the plasma zone. In contrast, the DD-coaxial DBD experiences a substantial decrease in system capacitance (~37 pF) due to the series integration of the second dielectric layer. This forces the discharge to be sustained at higher voltages and significantly limits the discharge energy deposited into the plasma.
Both OD- and ID-coaxial DBDs maintain the reduced electric fields E/N within the optimal kinetic window for ammonia dissociation. Specifically, in the OD reactor, employing an 8 cm discharge length effectively balances gas residence time and energy density, achieving a peak hydrogen yield per energy input of 1.22–1.24 gH2/kWh.
For the ID-coaxial DBD reactor, reducing the thickness of the dielectric layer significantly increases the system capacitance. When the thickness is reduced to 1 mm, the capacitance rises to approximately 86 pF, enabling the E/N to be maintained within the optimal kinetic window (180–220 Td) and achieving a global peak hydrogen yield of ~1.35 gH2/kWh.
Despite exhibiting a lower temperature rise, the DD-coaxial DBD shows the lowest hydrogen yield (≤0.82 gH2/kWh). This is caused by the reduced current pulse numbers and the deviation of E/N from the optimal range with elevated operating voltages.
Overall, this work provides insights into the effects of reactor geometry on plasma discharge behavior and offers practical guidance for the design and optimization of DBD reactors for efficient plasma-assisted NH3 decomposition and hydrogen production.

Author Contributions

Conceptualization, D.L. and X.M.; methodology, D.L. and X.M.; formal analysis, D.L. and X.M.; investigation, D.L., X.M., X.H. and J.P.; writing—original draft preparation, D.L. and X.M.; writing—review and editing, D.L., X.M., X.H., H.W. and J.P.; funding acquisition, X.M. and J.P.; supervision: X.M., H.W. and J.P. All authors have read and agreed to the published version of the manuscript.

Funding

This work was supported by the National Natural Science Foundation of China (52506163), and the Natural Science Foundation of Tianjin (24JCQNJC01540, 25JCJQJC00360).

Data Availability Statement

The original contributions presented in this study are included in the article. Further inquiries can be directed to the corresponding authors.

Conflicts of Interest

The authors declare there are no conflicts of interest.

References

  1. Ballentine, C.J.; Karolytė, R.; Cheng, A.; Lollar, B.S.; Gluyas, J.G.; Daly, M.C. Natural hydrogen resource accumulation in the continental crust. Nat. Rev. Earth Environ. 2025, 6, 342–356. [Google Scholar] [CrossRef]
  2. Yu, L.; Ning, M.; Wang, Y.; Yuan, C.; Ren, Z. Direct seawater electrolysis for hydrogen production. Nat. Rev. Mater. 2025, 10, 857–873. [Google Scholar] [CrossRef]
  3. Guan, D.; Wang, B.; Zhang, J.; Shi, R.; Jiao, K.; Li, L.; Wang, Y.; Xie, B.; Zhang, Q.; Yu, J. Hydrogen society: From present to future. Energy Environ. Sci. 2023, 16, 4926–4943. [Google Scholar] [CrossRef]
  4. El-Shafie, M.; Kambara, S.; Hayakawa, Y. Alumina particle size effect on H2 production from ammonia decomposition by DBD plasma. Energy Rep. 2020, 6, 25–30. [Google Scholar] [CrossRef]
  5. Andersen, J.A.; Christensen, J.M.; Østberg, M.; Bogaerts, A.; Jensen, A.D. Ammonia decomposition in a dielectric barrier discharge plasma: Insights from experiments and kinetic modeling. Chem. Eng. Sci. 2023, 271, 118550. [Google Scholar] [CrossRef]
  6. Yu, X.; Hu, K.; Zhang, H.; He, G.; Xia, Y.; Deng, M.; Shi, Y.; Yang, C.; Mao, X.; Wang, Z. Plasma-catalytic ammonia decomposition for carbon-free hydrogen production using low pressure-synthesized Mo2N catalyst. Plasma Chem. Plasma Process. 2023, 43, 183–197. [Google Scholar] [CrossRef]
  7. Andersen, J.A.; Christensen, J.; Østberg, M.; Bogaerts, A.; Jensen, A. Plasma-catalytic ammonia decomposition using a packed-bed dielectric barrier discharge reactor. Int. J. Hydrogen Energy 2022, 47, 32081–32091. [Google Scholar] [CrossRef]
  8. Yang, S.; Yang, H.; Yang, J.; Qi, H.; Kong, J.; Bo, Z.; Li, X.; Yan, J.; Cen, K.; Tu, X. Three-dimensional hollow urchin α-MnO2 for enhanced catalytic activity towards toluene decomposition in post-plasma catalysis. Chem. Eng. J. 2020, 402, 126154. [Google Scholar] [CrossRef]
  9. Wang, Z.; He, G.; Zhang, H.; Liao, C.; Yang, C.; Zhao, F.; Lei, G.; Zheng, G.; Mao, X.; Zhang, K. Plasma-Promoted Ammonia Decomposition over Supported Ruthenium Catalysts for COx-Free H2 Production. ChemSusChem 2023, 16, e202202370. [Google Scholar] [CrossRef]
  10. Loenders, B.; Michiels, R.; Bogaerts, A. Is a catalyst always beneficial in plasma catalysis? Insights from the many physical and chemical interactions. J. Energy Chem. 2023, 85, 501–533. [Google Scholar] [CrossRef]
  11. Ali, S.A.; Usman, M.; Shaikh, M.N. Advancements in Catalytic Technologies for Chemical Hydrogen Storage: Materials, Mechanisms, and Future Prospects. Small 2026, 22, e11191. [Google Scholar] [CrossRef]
  12. Spatolisano, E.; Pellegrini, L.A.; de Angelis, A.R.; Cattaneo, S.; Roccaro, E. Ammonia as a carbon-free energy carrier: NH3 cracking to H2. Ind. Eng. Chem. Res. 2023, 62, 10813–10827. [Google Scholar] [CrossRef]
  13. Niu, Y.-L.; Li, S.-Z.; Xu, G.-B.; Wen, X. Cracking ammonia in atmospheric-pressure nitrogen microwave discharge plasma to produce hydrogen. Plasma Sources Sci. Technol. 2025, 34, 115009. [Google Scholar] [CrossRef]
  14. Gao, Y.; Zhou, M.; Hu, E.; Zhao, Y.; Yin, G.; Huang, Z. Hydrogen generation by dielectric barrier discharge plasma assisted ammonia decomposition. Energy Convers. Manag. 2024, 306, 118271. [Google Scholar] [CrossRef]
  15. Liu, J.; Chu, Z.; Yang, C.; Saifutdinova, A.; Saifutdinov, A.; Zhou, C.; Wang, Y.; Zhou, Z.; Yuan, C. Investigation of chemical kinetics in plasma-assisted ammonia conversion processes. Phys. Plasmas 2025, 32, 103505. [Google Scholar] [CrossRef]
  16. Akiyama, M.; Aihara, K.; Sawaguchi, T.; Matsukata, M.; Iwamoto, M. Ammonia decomposition to clean hydrogen using non-thermal atmospheric-pressure plasma. Int. J. Hydrogen Energy 2018, 43, 14493–14497. [Google Scholar] [CrossRef]
  17. Niu, Y.-L.; Li, S.-Z.; Wang, X.-C.; Yu, Q.-K.; Yang, D.; Wen, X.; Zhang, J. Characteristic study of nitrogen microwave plasma decomposition of ammonia at atmospheric pressure for hydrogen production. Plasma Sources Sci. Technol. 2024, 33, 105018. [Google Scholar] [CrossRef]
  18. Zhao, N.; Tian, H.; Fu, Q.; Wang, X.; Chang, Z. Experimental Study on the Effects of Gas Mixture and Barrier Dielectric on the Discharge Characteristics and Plasma-Chemical Reactions of Ar-NH3 DBD. IEEE Trans. Plasma Sci. 2024, 52, 5506–5514. [Google Scholar] [CrossRef]
  19. Lian, H.-Y.; Lv, Y.; Cheng, X.; Yang, H.-C.; Chao, X.-D.; Lv, Y.-P. Reverse water-gas shift reaction in a foam electrode structure plasma catalytic reactor: Proper evaluation of the synergistic effect. Int. J. Hydrogen Energy 2025, 157, 150525. [Google Scholar] [CrossRef]
  20. Xu, Y.; Gao, Y.; Dou, L.; Xi, D.; Qi, C.; Lu, B.; Shao, T. Low-temperature plasma-enabled CO2 dissociation: A critical analysis of plasma setups and conversion mechanisms toward scale-up valorization. Green Chem. 2025, 27, 9332–9356. [Google Scholar] [CrossRef]
  21. Wu, X.; Shen, C.; Zhang, X.; Wang, Y.; Liu, C.-J. Dielectric surface engineering via TiO2 coating for enhanced plasma-driven efficient CO2 decomposition. Chem. Eng. J. 2025, 505, 159743. [Google Scholar] [CrossRef]
  22. Zhang, S.; Gao, Y.; Sun, H.; Fan, Z.; Shao, T. Dry reforming of methane by microsecond pulsed dielectric barrier discharge plasma: Optimizing the reactor structures. High Volt. 2022, 7, 718–729. [Google Scholar] [CrossRef]
  23. Mei, D.; Zhang, P.; Duan, G.; Liu, S.; Zhou, Y.; Fang, Z.; Tu, X. CH4 reforming with CO2 using a nanosecond pulsed dielectric barrier discharge plasma. J. CO2 Util. 2022, 62, 102073. [Google Scholar] [CrossRef]
  24. Wang, T.; Sun, B.-M.; Xiao, H.-P.; Zeng, J.-Y.; Duan, E.-P.; Xin, J.; Li, C. Effect of reactor structure in DBD for nonthermal plasma processing of NO in N2 at ambient temperature. Plasma Chem. Plasma Process. 2012, 32, 1189–1201. [Google Scholar] [CrossRef]
  25. Antunes, R.; Meindl, A.; Kranig, C.; Hecimovic, A.; Fantz, U. Hydrogen production from ammonia using a microwave plasma torch at atmospheric pressure. Int. J. Hydrogen Energy 2025, 170, 151121. [Google Scholar] [CrossRef]
  26. Fedirchyk, I.; Tsonev, I.; Marnef, R.Q.; Bogaerts, A. Plasma-assisted NH3 cracking in warm plasma reactors for green H2 production. Chem. Eng. J. 2024, 499, 155946. [Google Scholar] [CrossRef]
  27. Antunes, R.; Meindl, A.; Hecimovic, A.; Fantz, U. NH Synthesis in a Dielectric Barrier Discharge Reactor: A Study from Atmospheric to Low Pressure. Plasma Chem. Plasma Process. 2026, 46, 44. [Google Scholar] [CrossRef]
  28. Mei, D.; Duan, G.; Fu, J.; Liu, S.; Zhou, R.; Zhou, R.; Fang, Z.; Cullen, P.J.; Ostrikov, K.K. CO2 reforming of CH4 in single and double dielectric barrier discharge reactors: Comparison of discharge characteristics and product distribution. J. CO2 Util. 2021, 53, 101703. [Google Scholar] [CrossRef]
  29. Ozkan, A.; Dufour, T.; Silva, T.; Britun, N.; Snyders, R.; Bogaerts, A.; Reniers, F. The influence of power and frequency on the filamentary behavior of a flowing DBD—application to the splitting of CO2. Plasma Sources Sci. Technol. 2016, 25, 025013. [Google Scholar] [CrossRef]
  30. Tu, X.; Gallon, H.J.; Twigg, M.V.; Gorry, P.A.; Whitehead, J.C. Dry reforming of methane over a Ni/Al2O3 catalyst in a coaxial dielectric barrier discharge reactor. J. Phys. D Appl. Phys. 2011, 44, 274007. [Google Scholar] [CrossRef]
  31. Mei, D.; Zhu, X.; He, Y.-L.; Yan, J.D.; Tu, X. Plasma-assisted conversion of CO2 in a dielectric barrier discharge reactor: Understanding the effect of packing materials. Plasma Sources Sci. Technol. 2014, 24, 015011. [Google Scholar] [CrossRef]
  32. Pipa, A.V.; Brandenburg, R. The equivalent circuit approach for the electrical diagnostics of dielectric barrier discharges: The classical theory and recent developments. Atoms 2019, 7, 14. [Google Scholar] [CrossRef]
  33. Hagelaar, G.J.M.; Pitchford, L.C. Solving the Boltzmann equation to obtain electron transport coefficients and rate coefficients for fluid models. Plasma Sources Sci. Technol. 2005, 14, 722–733. [Google Scholar] [CrossRef]
  34. Pancheshnyi, S.; Biagi, S.; Bordage, M.C.; Hagelaar, G.J.M.; Morgan, W.L.; Phelps, A.V.; Pitchford, L.C. The LXCat project: Electron scattering cross sections and swarm parameters for low temperature plasma modeling. Chem. Phys. 2012, 398, 148–153. [Google Scholar] [CrossRef]
  35. Chen, Y.; Jiang, X.; Yao, L.; Jiang, W.; Liu, H.; Zhang, Y. Electron scattering cross sections from NH3: A comprehensive study based on R-matrix method. Plasma Sources Sci. Technol. 2023, 32, 045017. [Google Scholar] [CrossRef]
  36. Phelps Database. Available online: https://nl.lxcat.net/data/set_type.php (accessed on 1 January 2026).
  37. Liu, N.; Mei, B.; Mao, X.; Wang, Z.; Sun, Z.; Xu, Y.; Shi, Z.; Ju, Y. Kinetics of low temperature plasma assisted NH3/H2 oxidation in a nanosecond-pulsed discharge. Proc. Combust. Inst. 2024, 40, 105353. [Google Scholar] [CrossRef]
  38. Mao, X.; Zhong, H.; Liu, N.; Wang, Z.; Ju, Y. Ignition enhancement and NO formation of NH3/air mixtures by non-equilibrium plasma discharge. Combust. Flame 2024, 259, 113140. [Google Scholar] [CrossRef]
  39. Zhong, H.; Mao, X.; Liu, N.; Wang, Z.; Ombrello, T.; Ju, Y. Understanding non-equilibrium N2O/NOx chemistry in plasma-assisted low-temperature NH3 oxidation. Combust. Flame 2023, 256, 112948. [Google Scholar] [CrossRef]
  40. Arakoni, R.A.; Bhoj, A.N.; Kushner, M.J. H2 generation in Ar/NH3 microdischarges. J. Phys. D Appl. Phys. 2007, 40, 2476–2490. [Google Scholar] [CrossRef]
  41. Le, T.V.; Mullins, C.B.; Underwood, T.C. Are plasma discharges really “catalyst-free”? EES Catal. 2026. [Google Scholar] [CrossRef]
Figure 1. Experimental setup of plasma-assisted NH3 decomposition.
Energies 19 02171 g001
Figure 2. Schematics of the three dielectric barrier discharge (DBD) reactor configurations in this study: (a) OD-coaxial DBD, (b) ID-coaxial DBD, and (c) DD-coaxial DBD.
Energies 19 02171 g002
Figure 3. Voltage–current (U-I) waveforms of the three reactor configurations (a) OD-coaxial DBD, (b) ID-coaxial DBD, and (c) DD-coaxial DBD at different input powers.
Energies 19 02171 g003
Figure 4. Quantitative analysis of discharge channel density as a function of input power.
Energies 19 02171 g004
Figure 5. Lissajous figure of 0.2 NH3/0.8 Ar discharge with discharge power of 3 W.
Energies 19 02171 g005
Figure 6. (a) H2 mole fraction, (b) NH3 conversion, (c) hydrogen yield, (d) gas temperature, and (e) E/N as a function of SEI at different electrode lengths of the OD-coaxial DBD reactor in 0.2 NH3/0.8 Ar mixtures at f = 8 kHz and P = 10 kPa.
Energies 19 02171 g006
Figure 7. Energy loss fraction in 0.2 NH3/0.8 Ar. (rot: rotational excitation; v: vibrational excitation; el: electronic excitation; dis: dissociation; ion: ionization).
Energies 19 02171 g007
Figure 8. (a) H2 mole fraction, (b) NH3 conversion, (c) hydrogen yield, (d) gas temperature, and (e) E/N as a function of SEI at different dielectric thicknesses of the ID-coaxial DBD reactor in 0.2 NH3/0.8 Ar mixtures at f = 8 kHz and P = 10 kPa.
Energies 19 02171 g008
Figure 9. Hydrogen yield per energy input as a function of residence time.
Energies 19 02171 g009
Figure 10. Residence time as a function of SEI.
Energies 19 02171 g010
Figure 11. (a) H2 mole fraction, (b) NH3 conversion, (c) hydrogen yield, (d) gas temperature, and (e) E/N as a function of SEI at different electrode lengths of the DD-coaxial DBD reactor in 0.2 NH3/0.8 Ar mixtures at f = 8 kHz and P = 10 kPa.
Energies 19 02171 g011
Disclaimer/Publisher’s Note: The statements, opinions and data contained in all publications are solely those of the individual author(s) and contributor(s) and not of MDPI and/or the editor(s). MDPI and/or the editor(s) disclaim responsibility for any injury to people or property resulting from any ideas, methods, instructions or products referred to in the content.