Article

Improvements of the Reactor Dynamics Code RESTA3D and Its Application to the 2 MWth TMSR Transient Safety Analysis


1
Shanghai Institute of Applied Physics, Chinese Academy of Sciences, Shanghai 201800, China
2
National Key Laboratory of Thorium Energy, Shanghai Institute of Applied Physics, Chinese Academy of Sciences, Shanghai 201800, China
3
University of Chinese Academy of Sciences, Beijing 100049, China
4
Department of Nuclear Engineering, Hanyang University, Seoul 04763, Republic of Korea
*
Authors to whom correspondence should be addressed.
Energies 2026, 19(4), 964; https://doi.org/10.3390/en19040964
Submission received: 17 January 2026 / Revised: 10 February 2026 / Accepted: 11 February 2026 / Published: 12 February 2026
(This article belongs to the Section B4: Nuclear Energy)

Abstract

Molten salts act as fuel carriers and coolants in liquid-fueled molten salt reactors (MSRs), characterized by strong coupling between neutronics and thermal hydraulics (N-TH) in practical MSR operations. In this study, an in-house light water reactor static and transient analysis code, RESTA-3D, has been extended and applied to MSR transient safety analysis. A parallel multi-channel TH model and a neutron kinetics model incorporating the transport of delayed neutron precursors were implemented into RESTA-3D to account for the MSR-specific N-TH coupling characteristics. Few-group cross-section parameters were generated by the TMSR-LINK code and tabulated for use in RESTA-3D to support MSR transient analysis. The code system was verified against simulation results from well-established MSR dynamics codes and validated against experimental data from the MSRE (Molten Salt Reactor Experiment), covering steady-state temperature distributions, fuel pump-driven transients, and the MSRE natural convection test. Good agreement of the improved RESTA-3D results with the experiment data of MSRE was confirmed, with key parameters such as temperature within a 1% deviation margin, thereby confirming that RESTA-3D is suitable for MSR dynamics analysis. Furthermore, this code was applied to assess the transient characteristics of a 2 MWth thorium-based molten salt reactor (TMSR). The core characteristics, including the inlet fuel overcooling and overheating, unprotected fuel pump start-up and coast-down, were simulated and discussed, indicating that the 2 MWth TMSR design possesses high inherent safety.

1. Introduction

As the only liquid-fueled Generation-IV reactors, Molten Salt Reactors (MSRs) have attracted increased attention around the world over the past 20 years [1,2]. The development of MSRs can be traced back to as early as the 1940s, and a 2.5 MWth MSR design was first proposed for the ARE (Aircraft Reactor Experiment) project [3]. The first MSR in the world is the MSRE (Molten Salt Reactor Experiment), constructed in 1965 [4] and operated approximately 5 years with three fissile materials 235U, 239Pu, 233U [5]. Based on the successful experience of ARE and MSRE, a 1 GWe Molten Salt Breeder Reactor (MSBR) concept design was proposed for 232Th-233U breeding. However, the MSBR project was ultimately discontinued due to budgetary reasons and reallocation of resources toward research on Liquid-Metal Cooled Fast Reactors [6].
MSR research becomes more and more active in the 21st century. In Europe, the Molten Salt Fast Reactor was developed to break graphite moderator lifetime limitations and achieve attractive fissile breeding [7]. The FUJI series of MSR concept designs was proposed in Japan for different applications, such as THORIMS-NES [8], FUJI-II, FUJI-U3 [9], and FUJI-12 [10]. Russia and South Korea have focused on the transmutation of spent nuclear fuels using fast MSR design, e.g., the Molten Salt Actinide Recycler and Transmuter [11] and the Passively Cooled Molten Salt Fast Reactor [12]. Meanwhile, the United States has proposed the concept of the Molten Chloride Fast Reactor, which utilizes chloride salts as the fuel carrier and operates with a fast neutron spectrum, enabling highly efficient nuclear waste transmutation [13,14]. In January 2011, the Chinese Academy of Sciences (CAS) launched the Strategic Priority Program on Thorium Molten Salt Reactor (TMSR) Nuclear Energy Systems [15].
This study aims to support the design and interpretation of the TMSR-LF1 transient tests by enhancing our in-house light water reactor (LWR) dynamics code to address the unique physics of MSRs. The circulation of MSR fuel salts in the primary loop results in the partial loss of delayed neutron precursors (DNPs) from the core, thereby reducing both the effective delayed neutron fraction and the reactivity in the active core. While the majority of fission energy is deposited directly in the molten salt coolant, approximately 4–7% is generated in the graphite moderator due to gamma heating, prompt neutron moderation, and fuel salt penetration [16]. This flow-driven N-TH coupling is substantially stronger than in solid-fueled reactors and plays a decisive role in MSR transient safety.
Conventional solid-fueled transient analysis tools are inadequate for capturing these MSR-specific phenomena, particularly the transport of DNPs and the thermal hydraulics (TH) behavior of molten salt flowing through graphite channels. To this end, our in-house dynamics code RESTA-3D (Reactor System Transient Analysis—Three Dimensional) [17] has been extended with a neutron kinetics model that explicitly accounts for DNP drifts and a parallel multi-channel TH model to simulate salt flow and convective heat transfer. In addition, a few-group cross-section processing tool, TMSR-LINK, has been integrated to enable on-the-fly cross-section interpolations during RESTA-3D transient simulations. The enhanced code system was verified and validated against established MSR simulation codes and the MSRE experimental data. The validated capabilities were subsequently applied to transient analyses of a representative 2 MWth TMSR core model that preserves the key N-TH characteristics of the practical TMSR-LF1 configuration.
The remainder of the paper is organized as follows. Theory and methodologies are introduced in Section 2. The computational code system is described in Section 3. Validation of the RESTA-3D is presented in Section 4. Analysis of the 2 MWth TMSR using the improved RESTA-3D is discussed in Section 5. Finally, the conclusions are summarized.

2. Theory and Methodologies

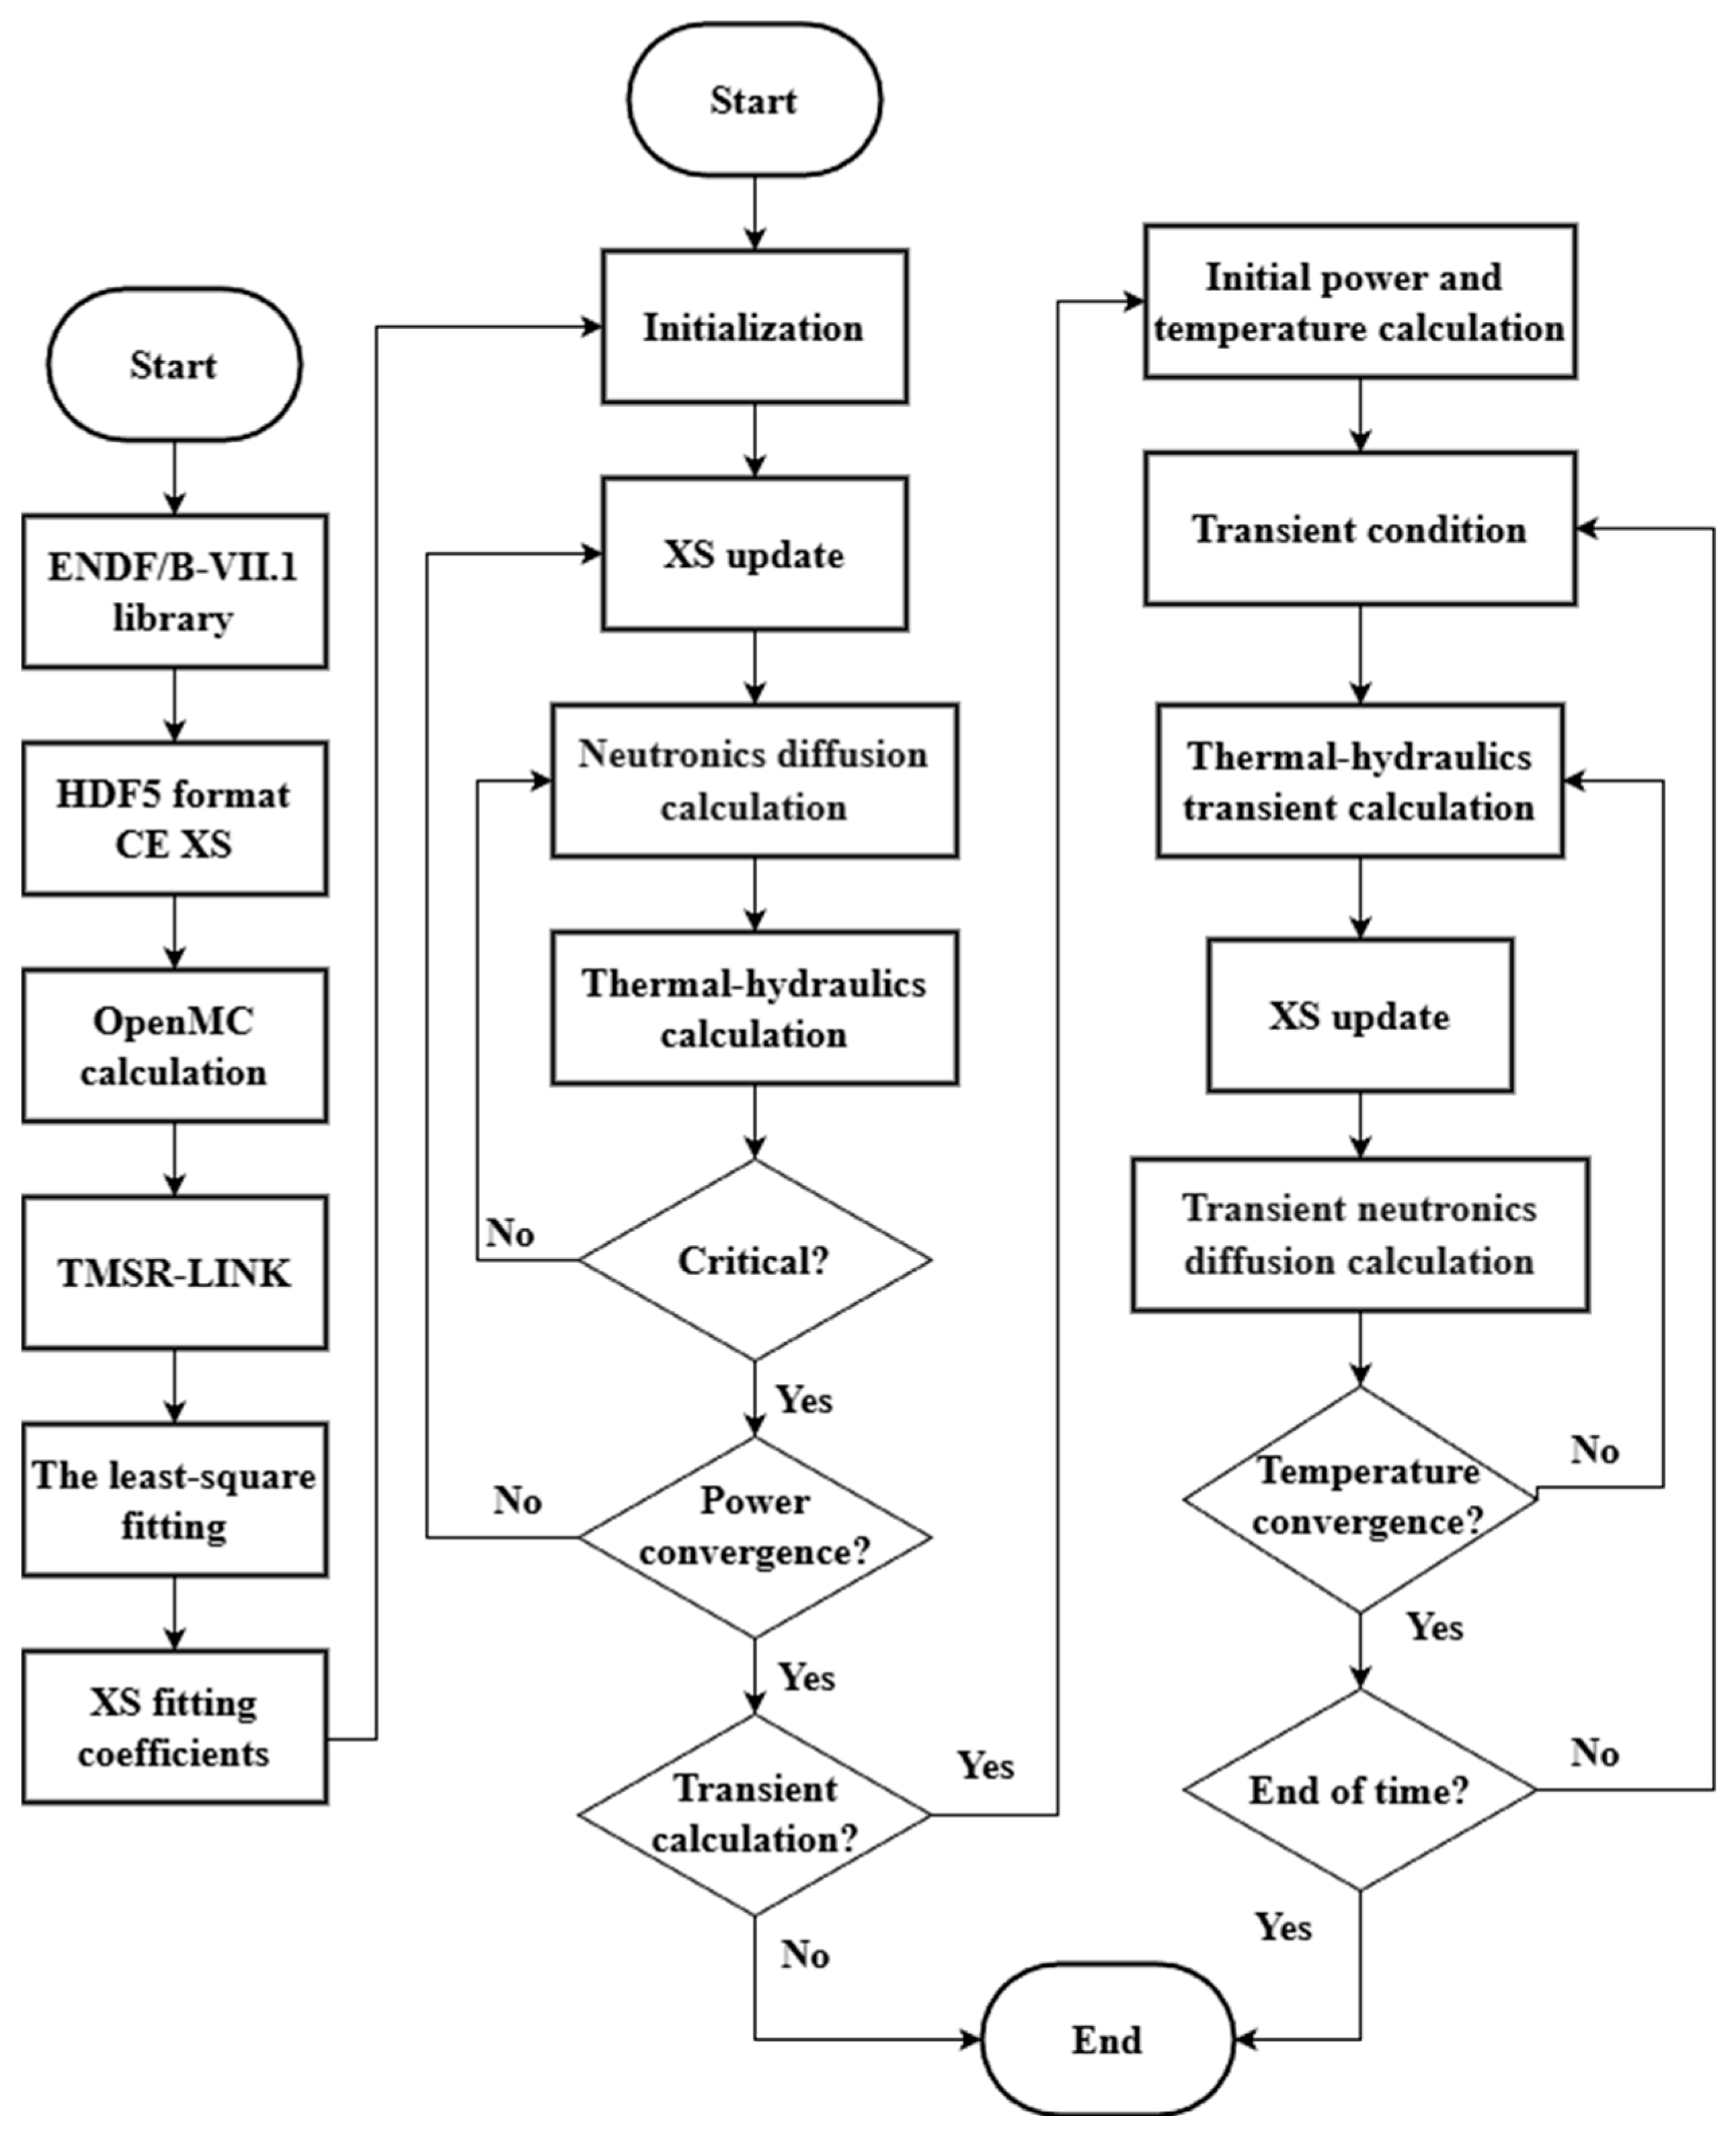
This section presents the theory and methodologies employed in this work. The neutron diffusion equation is solved using the nodal expansion method (NEM) to achieve a high-precision nodal average flux. The TH analysis is performed using a parallel multi-channel model, with an implicit coupling strategy implemented to facilitate strongly coupled neutronics and thermal hydraulics computations. To address the stiffness issue in solving the neutron kinetics equation, the exponential transformation method is utilized in this study, which can effectively alleviate the solution constraints of the stiffness matrix and reduce the truncation error in the neutron flux discretization process. A flowchart of the RESTA-3D is illustrated in Figure 1.

2.1. Time–Space Neutron Kinetics Model

The time–space neutron kinetics model in RESTA-3D was improved by introducing DNP drift terms in the transient multi-group diffusion equation [18]:
1 v g ϕ g ( r , t ) t D g ( r , t ) ϕ g ( r , t ) + Σ r , g ( r , t ) ϕ g ( r , t ) = Q g ( r , t )
C i ( r , t ) t = β i g = 1 G ν Σ f , g ( r , t ) ϕ g ( r , t ) λ i C i ( r , t ) u ( r , t ) C i ( r , t ) r   i = 1 , 2 , , I
where g is the index of neutron energy group (g = 1, 2, ,   g ), v g is the neutron velocity, Σ r ,   g is the removal cross-section, i denotes the index of DNP group, C i is the DNP concentration, β i is the DNP fraction, λ i is the decay constant of DNP, u is the fuel flow velocity, ϕ g is the neutron flux, D g is the diffusion coefficient, r is the vector of position, Q g is the total source and can be expressed as:
Q g ( r , t ) = S g ( r , t ) + 1 β χ g p k eff F g ( r , t ) + i = 1 I χ g , i d λ i C i ( r , t )
where χ g p is the prompt fission neutron energy spectrum, χ g , i d is the delayed fission neutron energy spectrum, keff is the effective multiplication factor, S g is the scattering source and can be expressed as:
S g ( r , t ) = g = 1 g g G Σ s , g g ( r , t ) ϕ g ( r , t )
F g is the fission source and can be expressed as:
F g ( r , t ) = g = 1 G ν Σ f , g ( r , t ) ϕ g ( r , t )
where Σ s , g g and v Σ f , g are the scattering matrix and the neutron production cross-section, respectively.

2.1.1. Nodal Expansion Method

RESTA-3D employs the NEM for the spatial discretization of Equation (1), producing a group-wise nodal balance equation in the Cartesian coordinate system as:
1 Δ x k J g x + k J g x k + 1 Δ y k J g y + k J g y k + 1 Δ z k J g z + k J g z k + Σ r , g k ϕ g k ( x , y , z ) = Q g k ( x , y , z )
where Δ x k / 2    x    Δ x k / 2 , Δ y k / 2    y    Δ y k / 2 , Δ z k / 2    z    Δ z k / 2 , and the node volume can be presented as Vk =   Δ x k Δ y k Δ z k , k denotes the index of node; x k , y k and z k stand for the width of node k in x-direction, y-direction and z-direction, respectively; J g , x k is the partial neutron currents in the x-direction and can be expressed as:
J g k ( x ) = D g k d ϕ g k ( x ) d x
The NEM applies transverse integration to Equation (6), reducing the 3D equation to three coupled 1D equations with transverse leakage term, e.g., the x-direction equation becomes:
D g k d 2 Φ g x k ( x ) d x 2 + Σ r , g k Φ g x k ( x ) = S g ( r , t ) + 1 β χ g p k eff F g ( r , t ) + i = 1 I χ g i d λ i C i ( x ) L g x k ( x )
where D g k is the diffusion coefficient, the transverse integral of the partial flux Φ gx k in 1D can be written as:
Φ g x k ( x ) = 1 Δ y k Δ z k Δ y k / 2 Δ y k / 2 Δ z k / 2 Δ z k / 2 ϕ g k ( x , y , z ) dydz
And the transverse-leakage term is defined as:
L g x k ( x ) = 1 Δ y k Δ z k Δ y k / 2 Δ y k / 2 Δ z k / 2 Δ z k / 2 D g k ϕ g k y + ϕ g k z d y d z
Then, the partial flux is expanded using a fourth-order polynomial approximation and can be expressed as:
Φ g x k ( x ) = ϕ ¯ g k + n = 1 4 a g , x , n k f n x
where a g ,   x ,   n k are the expansion coefficients, and f n is the Legendre polynomials [19]. The higher-order fitting coefficients a g , u , 3 k and a g , u , 4 k can be obtained by using weighted residual treatment on Equation (8). The low-order fitting coefficients a g , u , 1 k and a g , u , 2 k can be calculated from the node-average flux ϕ - g k and currents on the surfaces J g , u ± k , in and J g , u ± k , out by using the node boundary conditions.
The final form of the partial neutron current equations in the x-direction can be expressed as:
J g , x o u t , k = P g , x k J g , x i n , k + R g , x k Q g , x k L g , x k
where J g , x o u t , k is the outgoing partial neutron currents, J g , x i n , k is the incoming partial neutron currents; L g , x k represent the leakage vector, P g , x k and R g , x k denote the response matrices containing nodal coupling coefficients, Q g , x k denote the source term. Equation (12) is closed and well-posed, and the source iteration method is employed for its numerical solution.

2.1.2. Exponential Transformation Method

The multi-group neutron diffusion Equations (1) and (2) for MSRs are time-dependent partial differential equations characterized by widely separated temporal scales. The generation time of prompt neutrons is much shorter than that of delayed neutrons, resulting in significant stiffness in the transient neutronics model. To address this computational challenge, the exponential transformation method is adopted to alleviate the stiffness problem by reducing the truncation error in neutron flux discretization.
The time-dependent neutron flux is expanded using the exponential transformation method [20]:
ϕ g k ( r , t ) = e ψ g k Δ t φ g k ( r , t )
where ψ g k is the exponential transformation frequency, φ g k is the transformed flux varying slowly with time, Δ t is the time step and t     Δ t     t     t ; the following condition is satisfied for these quantities:
ϕ g k ( r , t Δ t ) = φ g k ( r , t Δ t )
The time derivative of neutron flux can be expressed as:
d ϕ g k ( t ) d t ( 1 + ψ g k Δ t ) · ϕ g k ( t ) e ψ g k Δ t · ϕ g k ( t Δ t ) Δ t
The exponential transformation [21] frequencies ψ g k can be obtained from the nodal average flux calculation:
ψ g k = 1 Δ t · ln g = 1 n ϕ g k ¯ ( t ) g = 1 n ϕ g k ¯ ( t Δ t )
where ϕ g k ¯ represents the average flux of k nodal. Substituting Equation (13) for Equation (1), one can obtain:
D g k . n + 1 ϕ g k . n + 1 + Σ ^ r , g k . n + 1 ϕ g k . n + 1 = S g k . n + 1 + 1 β χ g p , k F k . n + 1 k eff + i = 1 I χ g , i d , k λ i C i k . n + 1 + e ψ g k Δ t n v g Δ t n ϕ g k . n
where n is the time step, and the general removal cross section is defined as:
Σ ^ r , g n + 1 1 v g Δ t n + ψ g k v g + Σ r , g n + 1
Given that the source term on the right side of Equation (17) has a similar form to that in Equation (8), the NEM is consequently employed to carry out the process of solving this equation.

2.1.3. DNP Drift Model

The balance equation for the DNPs in MSR is in the form of Equation (2). When only DNP axial flow is considered, the transient balance equation for DNPs is described as:
C i k ( t ) t = Q i k ( t ) λ i C i k ( t ) u k ( t ) C i k ( t ) z
where u k is the axial flow velocity of fuel salt in k-th node. The DNP source term Q i k can be expressed as:
Q i k ( z , t ) = β i g = 1 G ν Σ f g ( x , y , z , t ) ϕ g ( x , y , z , t ) d x d y
In Equation (18), the time derivative term is discretized using the implicit Euler method, and the spatial derivative term is discretized using a second-order accurate two-step central difference method. It can be expressed as:
C i k , n + 1 C i k , n Δ t n = Q i k , n + 1 λ i C i k , n + 1 u k , n + 1 C i k + 1 , n + 1 C i k 1 , n + 1 2 Δ z k
Then, through further transformation, the formula can be expressed as:
u k , n + 1 Δ t n 2 Δ z k C i k 1 , n + 1 + ( 1 + λ i Δ t n ) C i k , n + 1 + u k Δ t n 2 Δ z k C i k + 1 , n + 1 = Δ t n Q i k , n + 1 + C i k , n
The simplified equation takes the form of a system of linear equations, Ax = B , and it can be solved with a normal linear solver.

2.2. Thermal Hydraulics

In this work, the RESTA-3D employs the parallel multi-channel TH model to simulate salt flow and convective heat transfer, whereas a lumped parameter model is used for calculating temperature distributions in the upper and lower plena. The boiling of liquid fuel is not considered, and the shear forces arising from velocity gradients in the fuel salt are also neglected [5]. The mass, momentum and energy balance equations [22] for a 1D flow fuel salt model can be expressed as:
ρ t + ( ρ u ) z = 0
( ρ u ) t + ( ρ u 2 ) z + P z + P f r i c z + ρ g = 0
( ρ h ) t + ( ρ u h ) z = z ( λ T z ) + Q f
where ρ is the fuel density, h is the enthalpy, u is the velocity, P denotes the fuel salt pressure, T is the fuel temperature, λ is the coefficient of heat conduction, Q f is the volumetric thermal source.
The energy balance equation of the upper and lower plena is expressed as:
T f t = W f , i n c f T f , i n ( t ) W f , o u t c f T f , o u t ( t ) + Q f ( t ) c f M f
where W f , in , W f , out , T f , in , T f , out are the inlet mass flow, outlet mass flow, inlet fuel temperature, and outlet fuel temperature at the upper or lower plena, respectively, Q f is energy released by fuel, M f is mass of fuel inside the plena, T f is the average temperature of the plena, c f is specific heat capacity of fuel.
The equivalent hydraulic diameter method is employed for TH analysis in the parallel-channel model, and the core graphite assembly is approximated as a cylinder with a central circular hole. The outer radius of the cylinder is denoted as R2 and the inner radius as R1. Therefore, the heat conduction equation of graphite is defined as:
ρ g c g T g t = · ( λ g T g ) + Q g
The inner surface adopts the third type of boundary condition. It is expressed as:
λ g d T g ( r ) d r r = R 1 = α ( T g ( R 1 ) T f )
The outer surface adopts the adiabatic type boundary condition, which is described as:
λ g d T g ( r ) d r r = R 2 = 0
where α is the convective heat transfer coefficient, T g is the graphite temperature, Q g is the volumetric heat source of graphite, which is derived from fuel permeation, and neutron slowing down and γ radiation account for approximately 7% of the total power [4].
In the TH calculation of the RESTA-3D, several assumptions are introduced: (1) the radial heat conduction in graphite is considered, while the axial heat conduction is ignored [23], (2) the molten salt is assumed to be uniformly mixed in the upper and lower plena. Then, the mass flow in each fuel channel is calculated based on the coupling of the governing equations with the same pressure drop condition. Subsequently, the enthalpy change distribution of fuel salt is calculated. Finally, the temperature field of the fuel salt is obtained based on the corresponding mass flow and enthalpy change distribution.

3. Computational Code System

As shown in Figure 1, the entire computational procedure encompasses the TMSR-LINK and RESTA-3D, partitioning into the preparation of few-group cross-section coefficients, steady-state and transient calculations. TMSR-LINK automatically leverages OpenMC to simulate fuel assembly criticality. In the OpenMC cross-section calculations, a single fuel assembly was modeled and simulated using 100,000 neutrons per cycle, with 100 inactive cycles and 200 active cycles. Among the generated two-group cross-section sets, the maximum statistical uncertainty of macroscopic cross sections is smaller than 0.15%, presenting good precision for the use in full core simulation. A set of temperature points to generate temperature-dependent homogenized few-group cross sections, on which a least-squares fitting is performed to produce temperature-dependent cross-section coefficients. The cross-section interpolation formula is expressed by:
Σ n ( T f , T g ) = i = 1 m a i · r i ( T f , T g )
where Σ n is the macroscopic cross-section of the reaction type n, a i is fitter coefficient, r i is the base function used for expansion, T f is fuel temperature, and T g is graphite temperature, m is fitting order, and the third-order least squares method is employed.
In this study, two energy groups were employed, and the DNPs were classified into 6 groups by their half-lives. The maximum temperatures of graphite and molten salt in the 2 MWth TMSR are both below 1000 K during its normal operation. Hence, the temperatures of fuel salt and graphite for cross-section generation are set from 700 K to 1500 K with an interval of 50 K, ensuring accurate cross-section interpolations during MSR transient simulations [24]. For the reactivity control blocks, their few-group cross sections were generated at the same temperature points. Two sets of cross sections were prepared, i.e., one with the control rod fully inserted and another with it fully withdrawn.
For the steady-state calculation process, the core power density was obtained by assuming a uniform temperature distribution for both the fuel salt and graphite. Then, the neutron diffusion equation was solved using the NEM and coupled with the parallel multi-channel TH solver to obtain the new temperature distribution. The new temperature was then used to update the few-group constants and kinetics parameters that needed to be stored for the next coupling calculation. This iterative process was carried out until the power density converged. For transient simulations, the critical steady-state results serve as the initial conditions. The transient calculation initializes the power and temperature, after which the exponential transformation method is applied to update the removal cross sections, resulting in the new neutron flux distribution. The inner iteration follows a procedure similar to that of the steady-state calculation. The computation advances to the next time step within the outer iteration until the specified stop time is reached.

4. Code Validation Against MSRE Measurements

4.1. MSRE Core Model

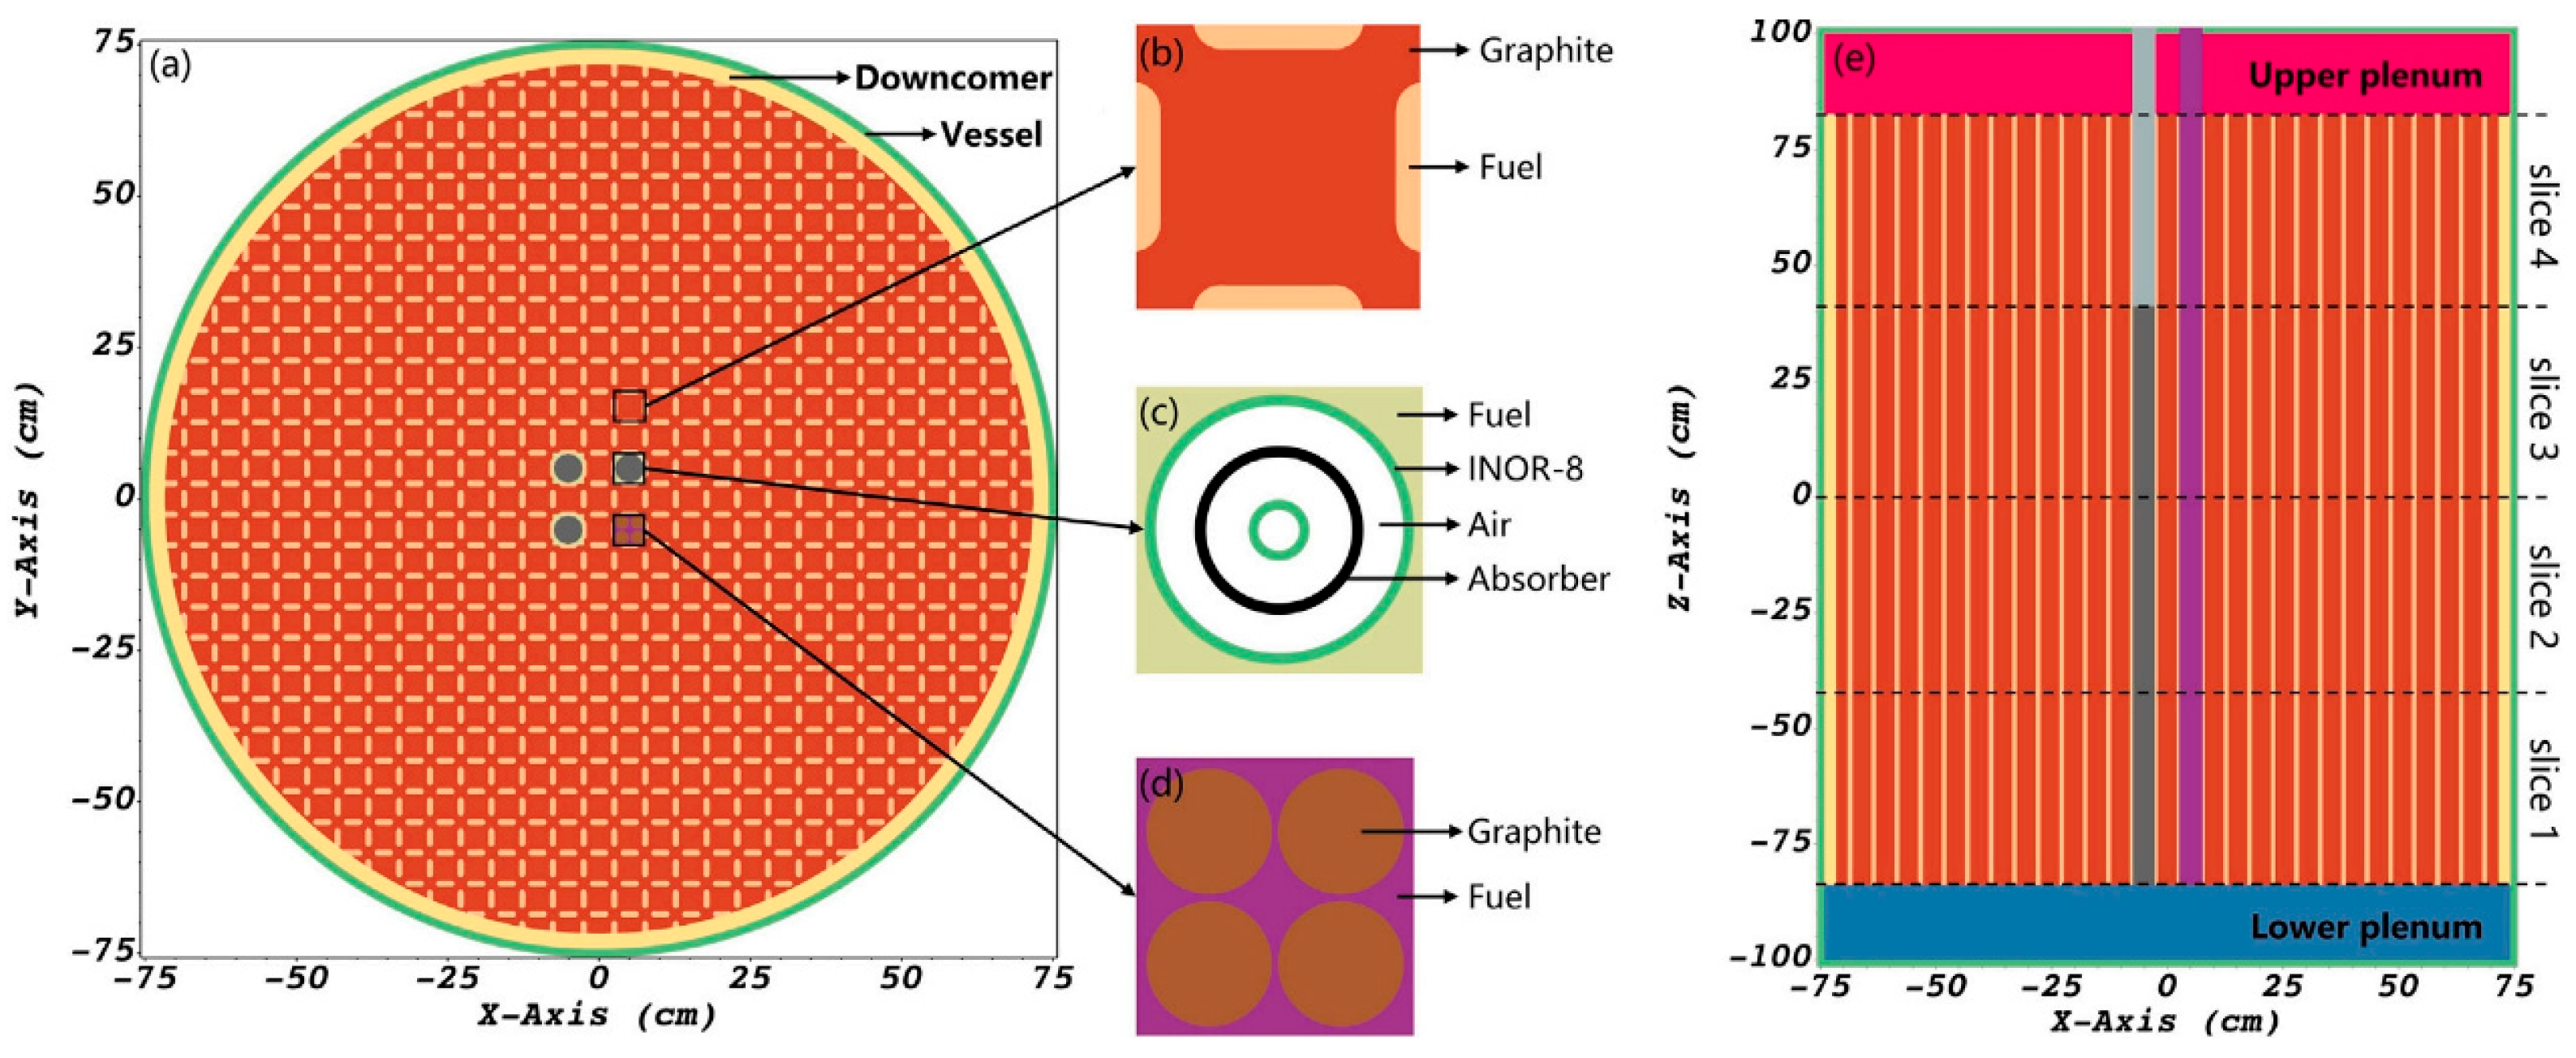
The MSRE [4] is an 8 MWth thermal reactor moderated by graphite. As shown in Figure 2, the elementary assembly of the MSRE is a quadrilateral graphite block; each square graphite block with a side length of 5.08 cm is grooved on four sides, and two grooves of neighboring blocks form a fuel salt channel. The active core of MSRE comprises 618 fuel assemblies, three control rod channels and an irradiation channel, which contains approximately 1150 fuel channels. During normal operation of MSRE, the molten fluoride salt enters the reactor at the bottom of the vessel at a temperature of 908 K and a mass flow rate of 180 kg/s, with the outlet fuel temperature reaching 936 K. The absorber material of the control rod is a mixture of Gd2O3 and Al2O3, while the reactor vessel is constructed from Hastelloy-N. The primary loop is loaded with the fuel salt of the mole composition 65% LiF-29.2% BeF2-5.0% ZrF4-0.8% UF4. The enrichments of 235U and 7Li in the fuel salt are 32% and 99.995%, respectively. The main parameters of MSRE are listed in Table 1.

4.2. Steady-State Measurements

The MSRE experimental data with 235U fuel is employed for the validation of the RESTA-3D [5]. The code is used to simulate the DNP loss under zero power conditions in the MSRE. As displayed in Table 2, the DNP loss calculated by RESTA-3D is 206.8 pcm, which compares well with the MSRE experimental value of 212.0 pcm and the ORNL calculated result of 222.0 pcm [26]. The RESTA-3D result exhibits a deviation of only 5.2 pcm from the experimental data. Furthermore, the results obtained with RESTA-3D demonstrate good agreement with benchmark results from established codes. The discrepancies among different computational results can be attributed to the simplification of the core geometry model and the adoption of different delayed neutron data [26]. The keff and temperature reactivity coefficients for the MSRE loaded with 235U fuel are validated, as presented in Table 3 [27]. The RESTA-3D results demonstrate good agreement with both the MSRE experimental data and the results of other codes.
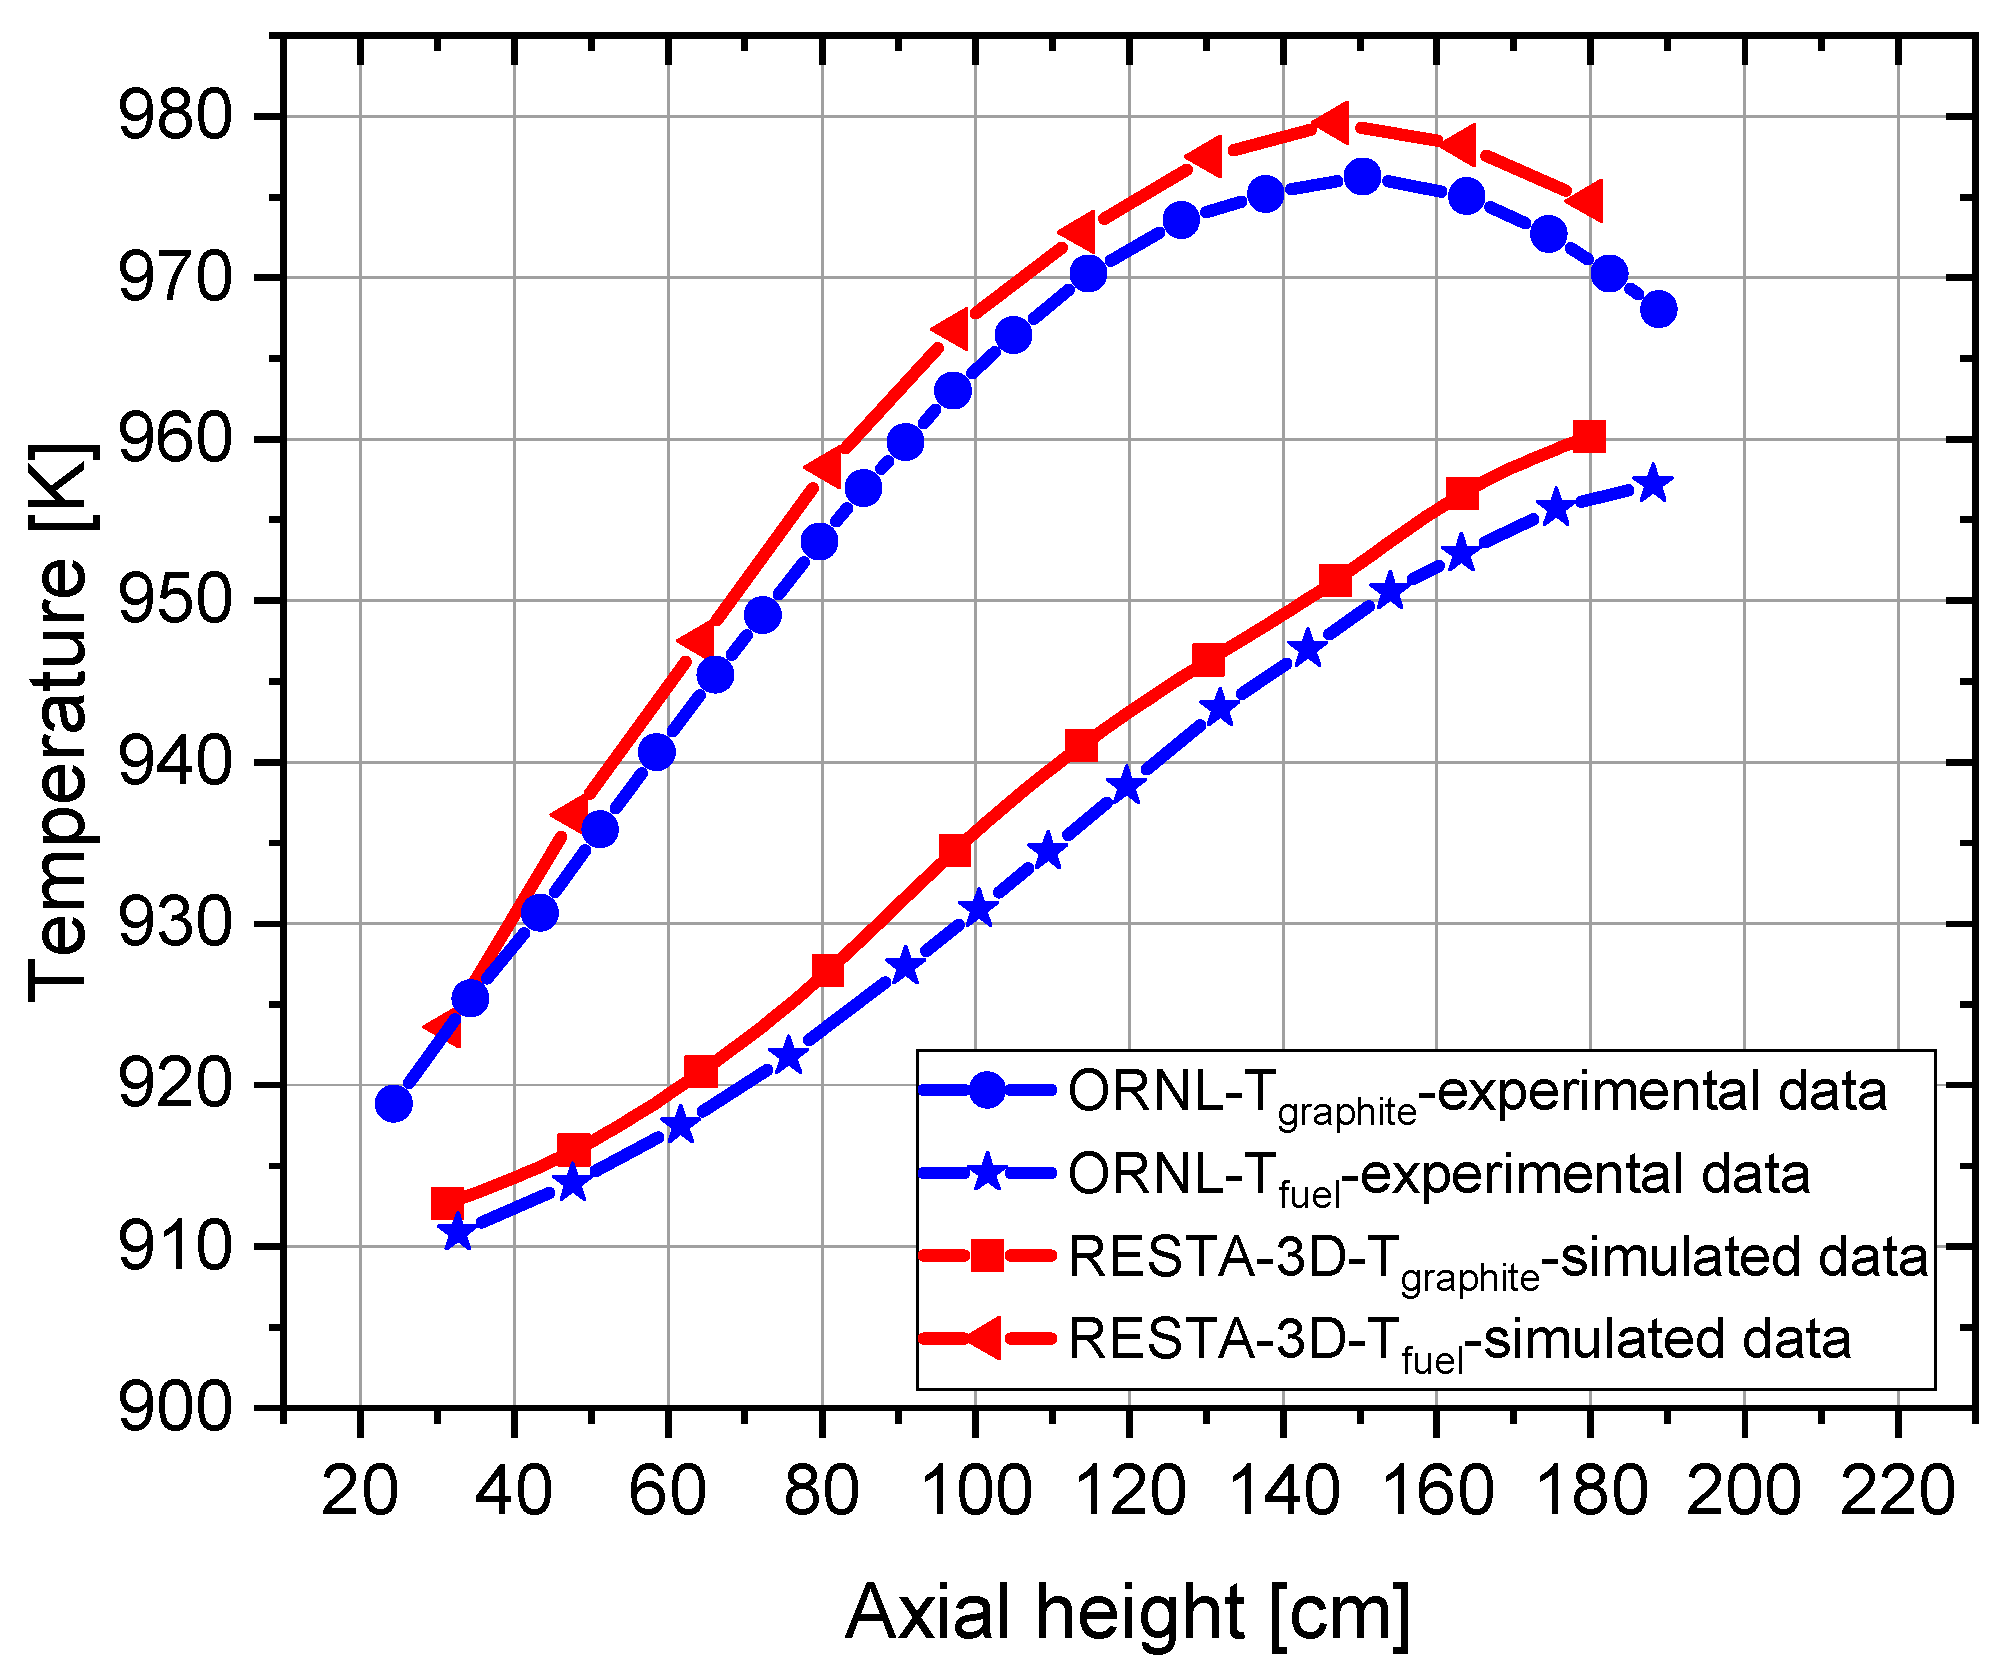
The steady-state temperature distributions of fuel salt and graphite were calculated for the hottest channel of the MSRE. As shown in Figure 3, the results obtained from RESTA-3D show good agreement with the MSRE experimental data, and the maximum error is only about 1%.
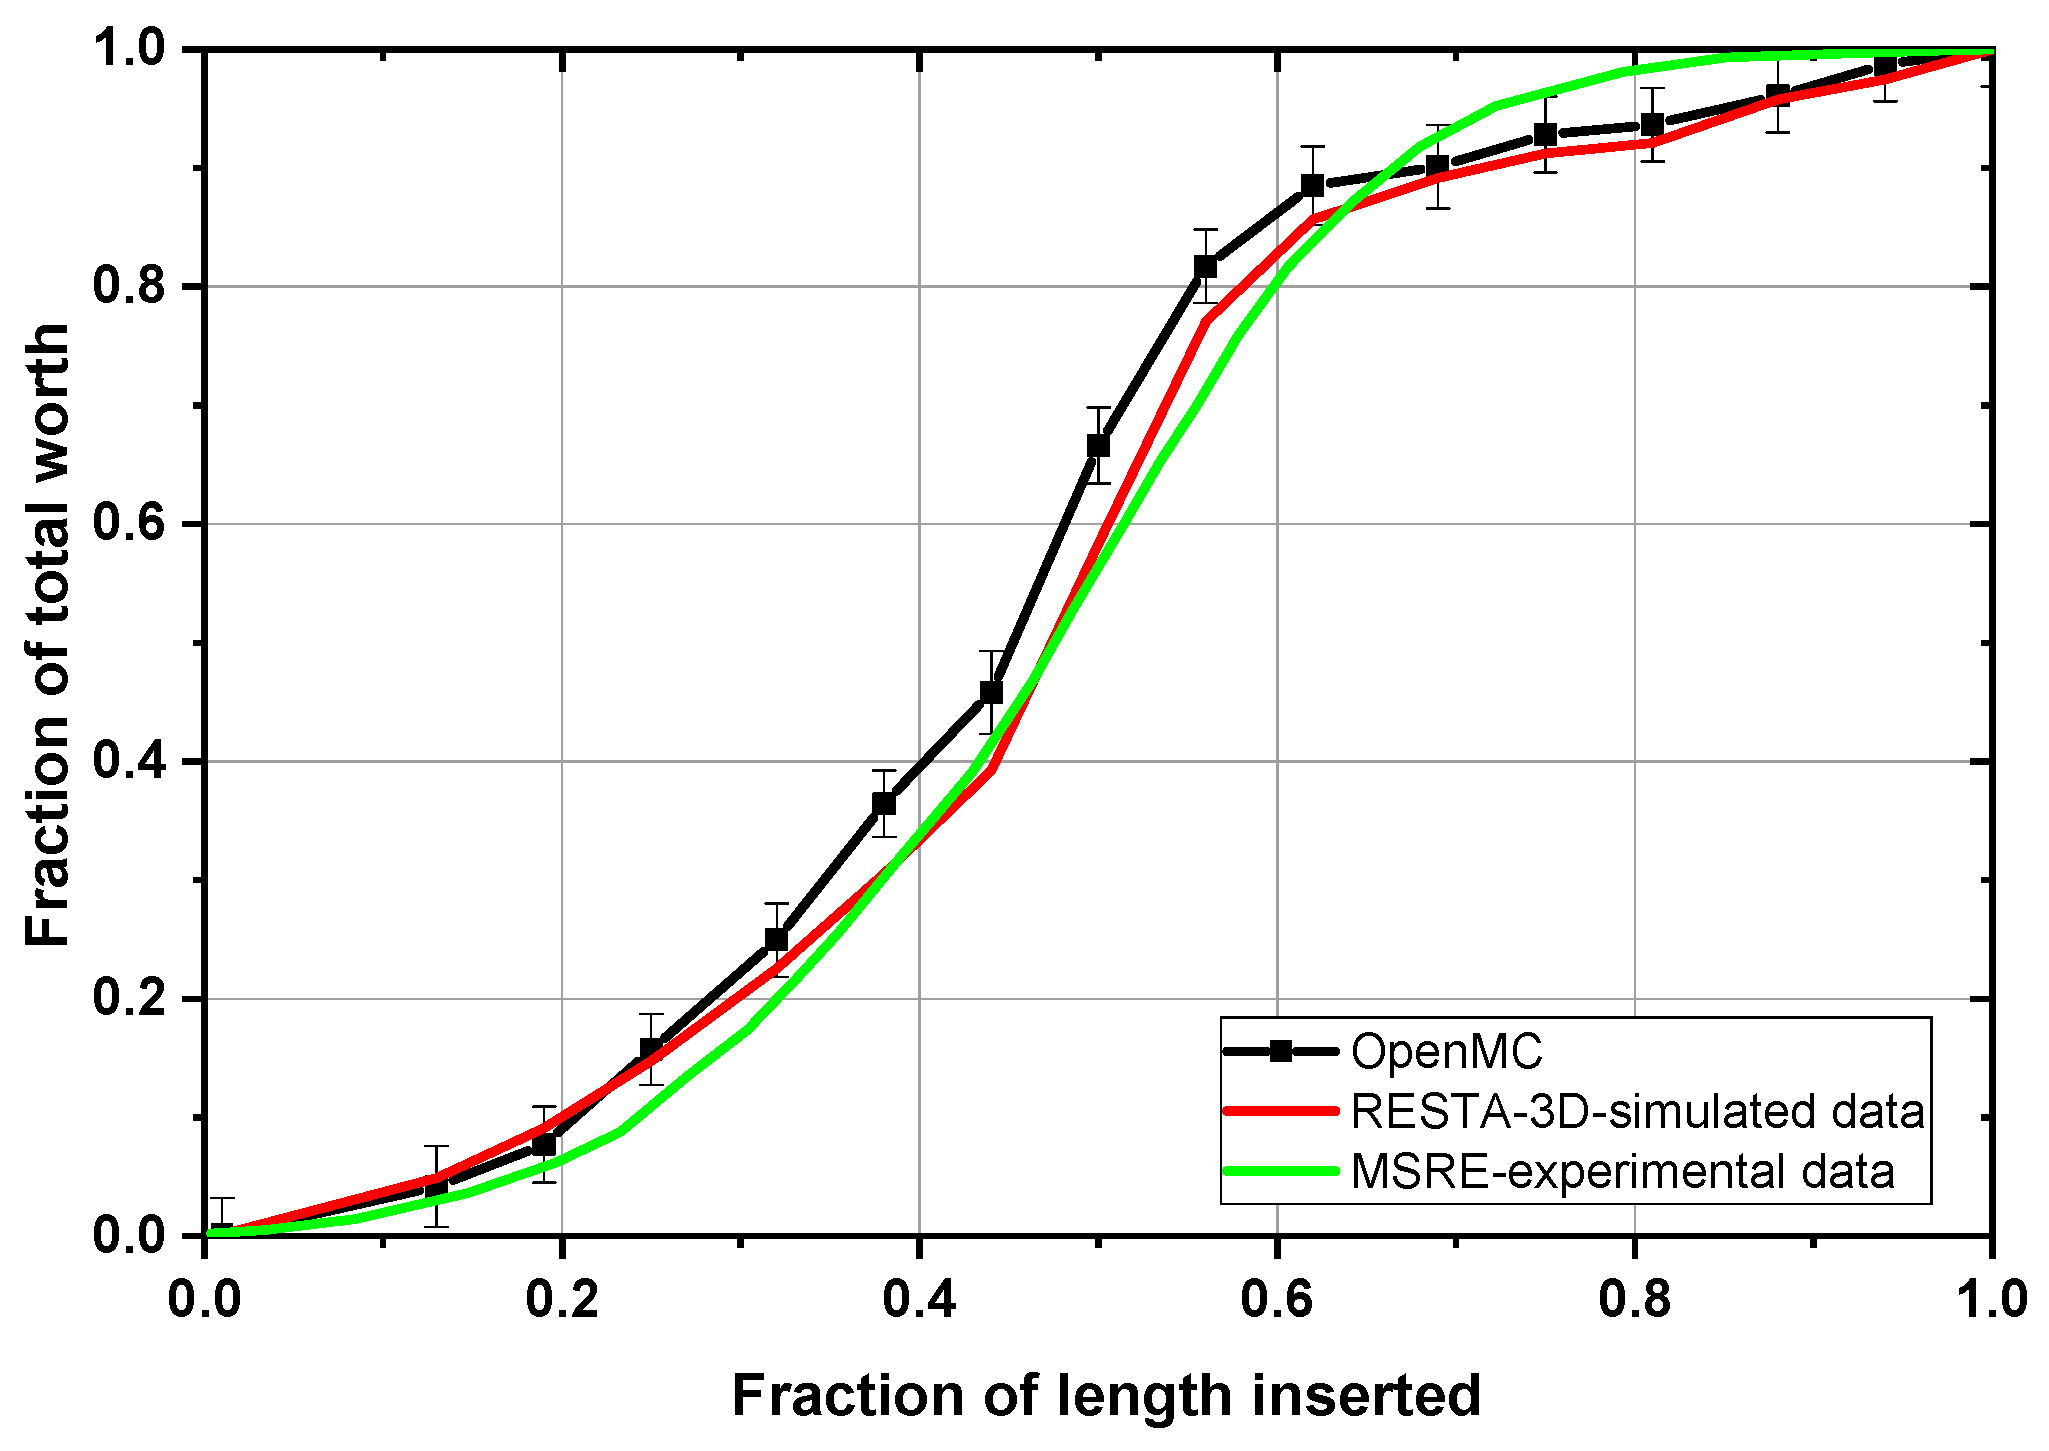
The control rod worth obtained by RESTA-3D results shows good agreement with both MSRE experimental data [4] and the OpenMC simulation results, as illustrated in Figure 4. For the calculation of control rod worths through OpenMC, we set the computational parameters as 100,000 neutrons per generation, 100 inactive generations and 200 active generations. With the mentioned simulation parameters, all the statistical uncertainties of keff for control rod worth calculations are smaller than 0.04%. In RESTA-3D, the control rod worth was calibrated through stepwise insertion, with the control rod cuspate effect corrected by the volume-approximate flux weight method [5]. The discrepancies observed during transient initiation and termination phases are attributed to simplifications in the control rod modeling.

4.3. Protected Fuel Pump Start-Up and Coast-Down

During the fuel pump start-up and coast-down transient conditions, the DNP redistribution drives a reactivity loss and significantly impacts MSR dynamics. The fuel circulation loss of the effective delayed neutron fraction β loss is defined as:
β l o s s = i = 1 n β e f f i , s t a t i c i = 1 n β e f f i , f l o w
where the effective delayed fraction is represented by β eff i , static for the static fuel salt and β eff i , flow for flowing fuel salt.

4.3.1. Protected Fuel Pump Start-Up at Zero Power

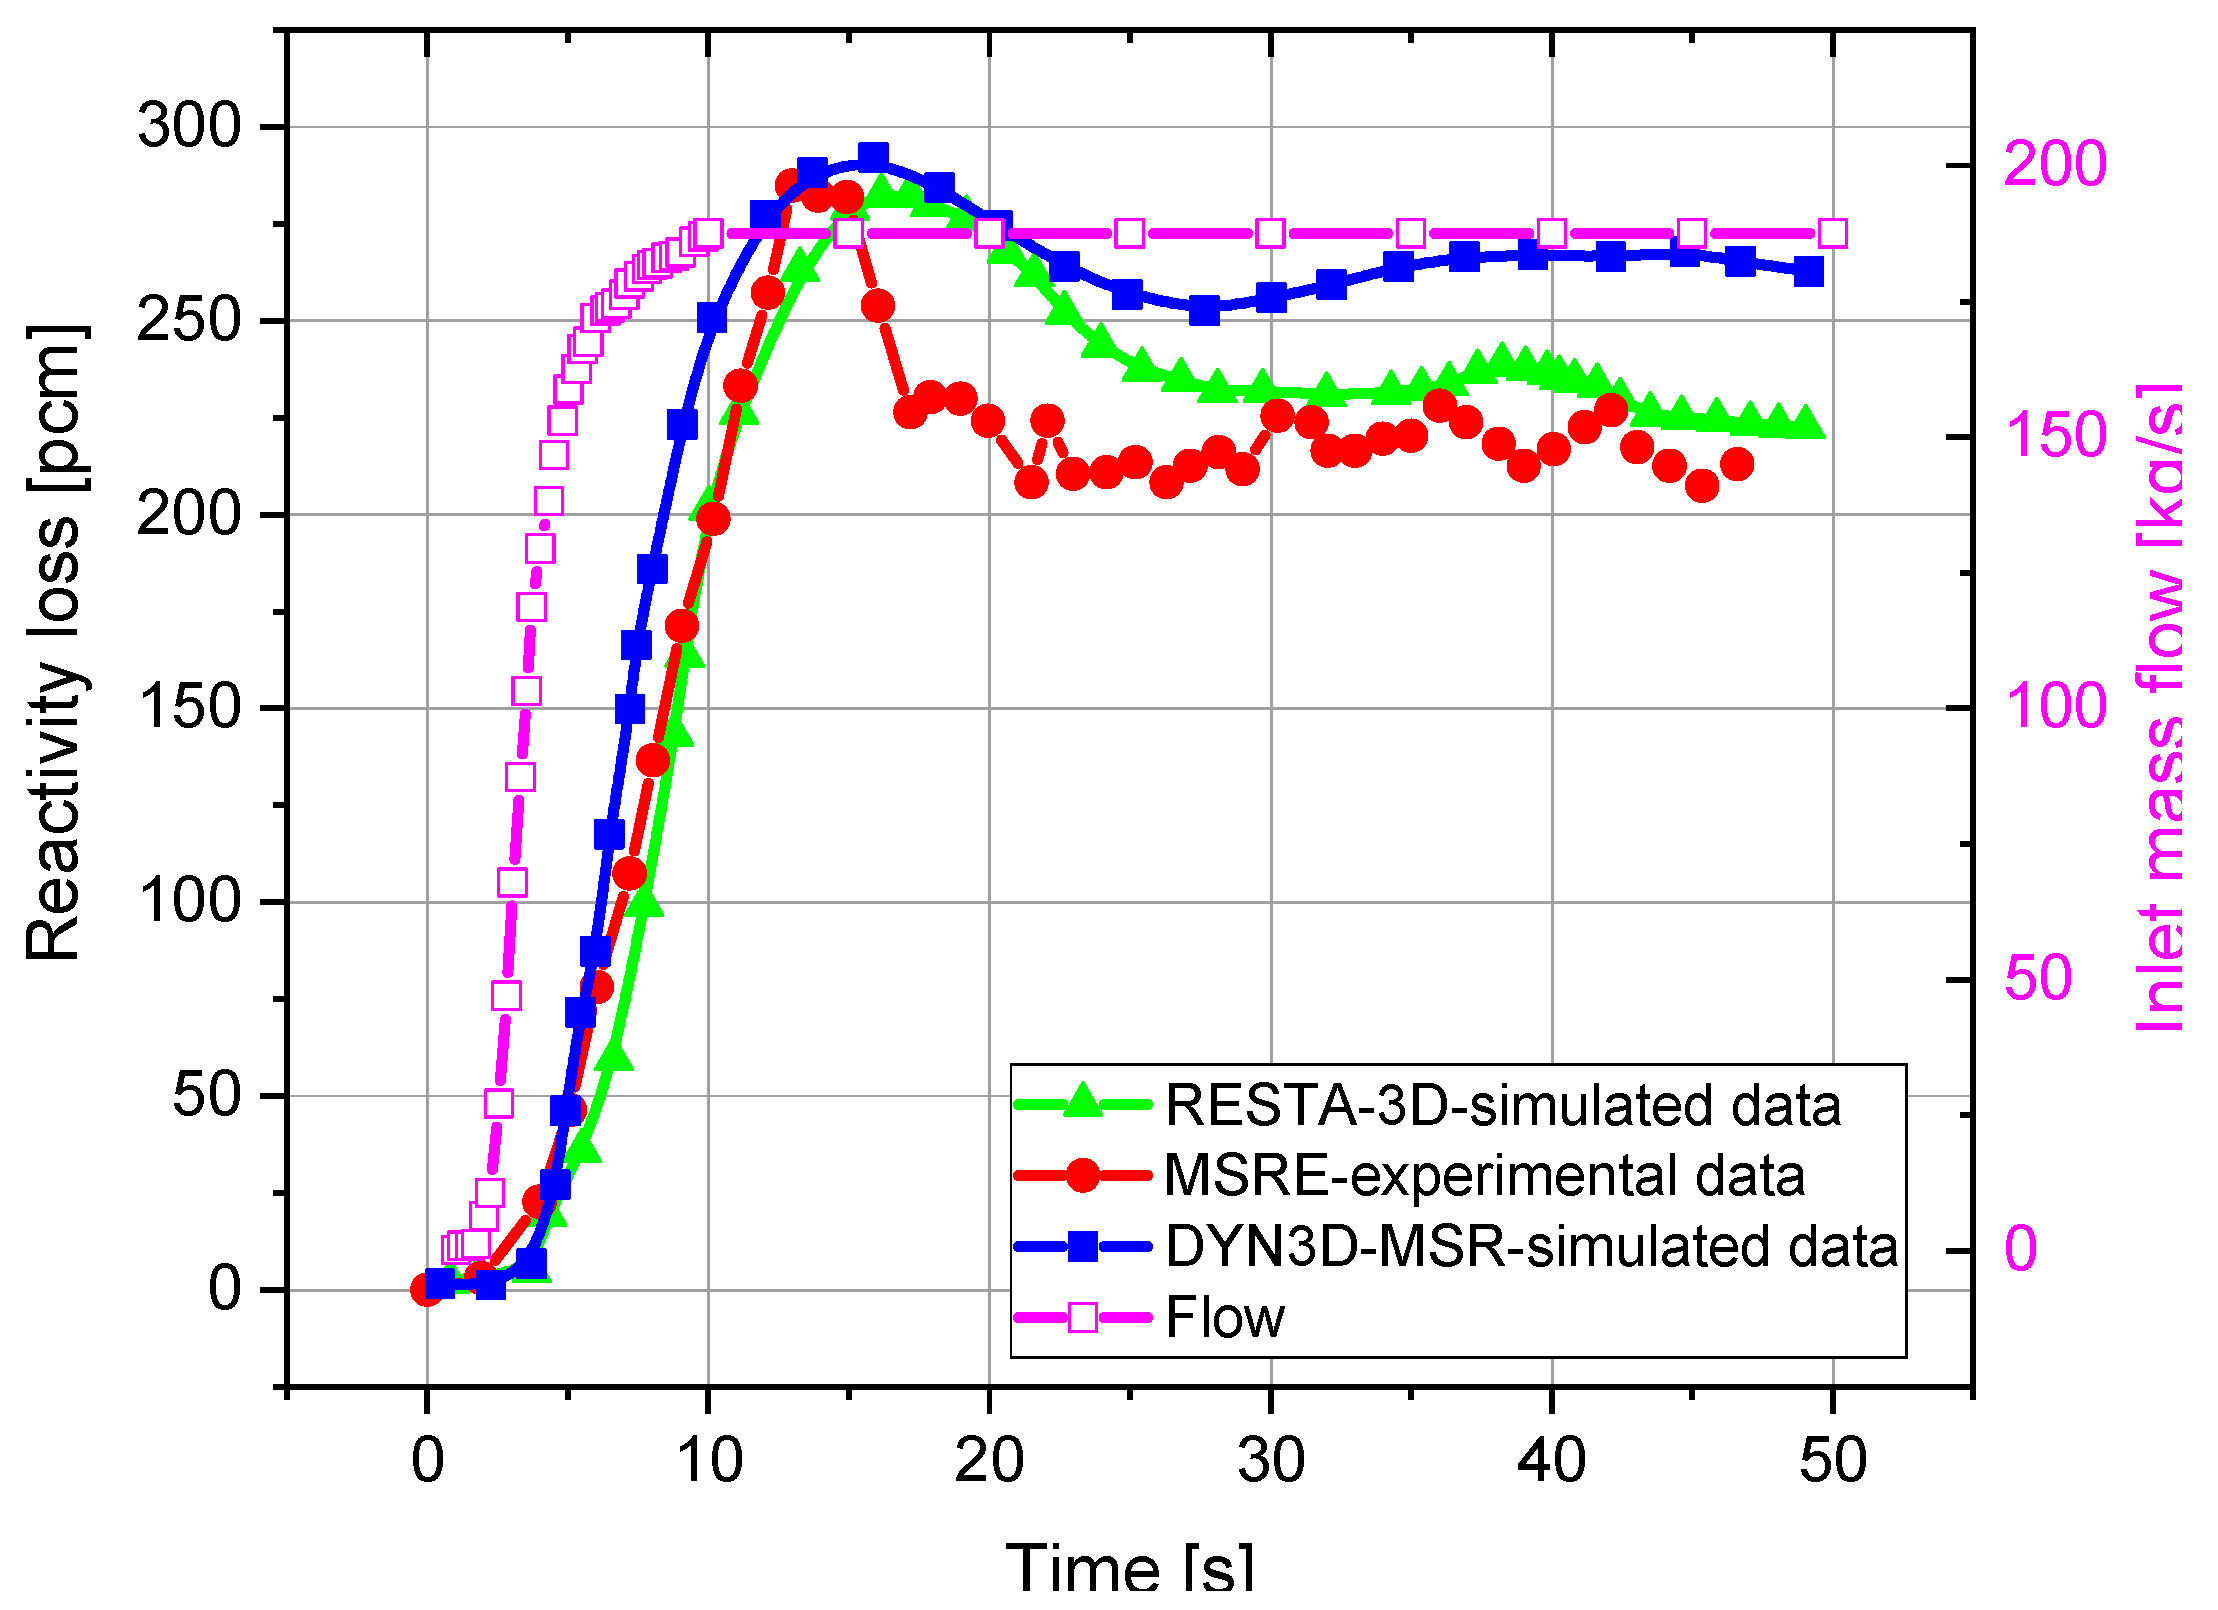
The first transient case simulates the protected fuel pump start-up in the MSRE at zero power (1 kW) [26]. The fuel mass flow rate increases from zero to its rated value within 10 s [28], as shown in Figure 5. During the protected fuel pump start-up at zero power transient condition, the reactivity loss induced by DNP redistribution is compensated by the movement of the control rods. Since the reactor operates at zero power and the core temperature change is minimal, the temperature feedback can be neglected. The whole transient process lasted for 50 s, and a time interval of 0.01 s was adopted in the calculation. The results of reactivity loss during the fuel pump start-up process are presented in Figure 5.
During fuel pump start-up, the rising flow flushes some delayed neutron precursors outside the core to decay, reducing the effective delayed neutron fraction, while the fraction of undecayed DNPs returning to the core increases. This imbalance induces reactivity oscillations that dampen and stabilize over time. The reactivity loss reaches a maximum at approximately 16 s. As shown in Figure 5, the results obtained with RESTA-3D agree well with both the MSRE experimental data and DYN3D-MSR simulations. It is important to note that DYN3D-MSR and RESTA-3D compute higher reactivity than MSRE experiment data due to the exclusion of control rod withdrawal speed limitations in simulations [29]. These results validate the physical consistency and reliability of the RESTA-3D DNP transient flow model and MSR neutron dynamics framework.

4.3.2. Protected Fuel Pump Coast-Down at Zero Power

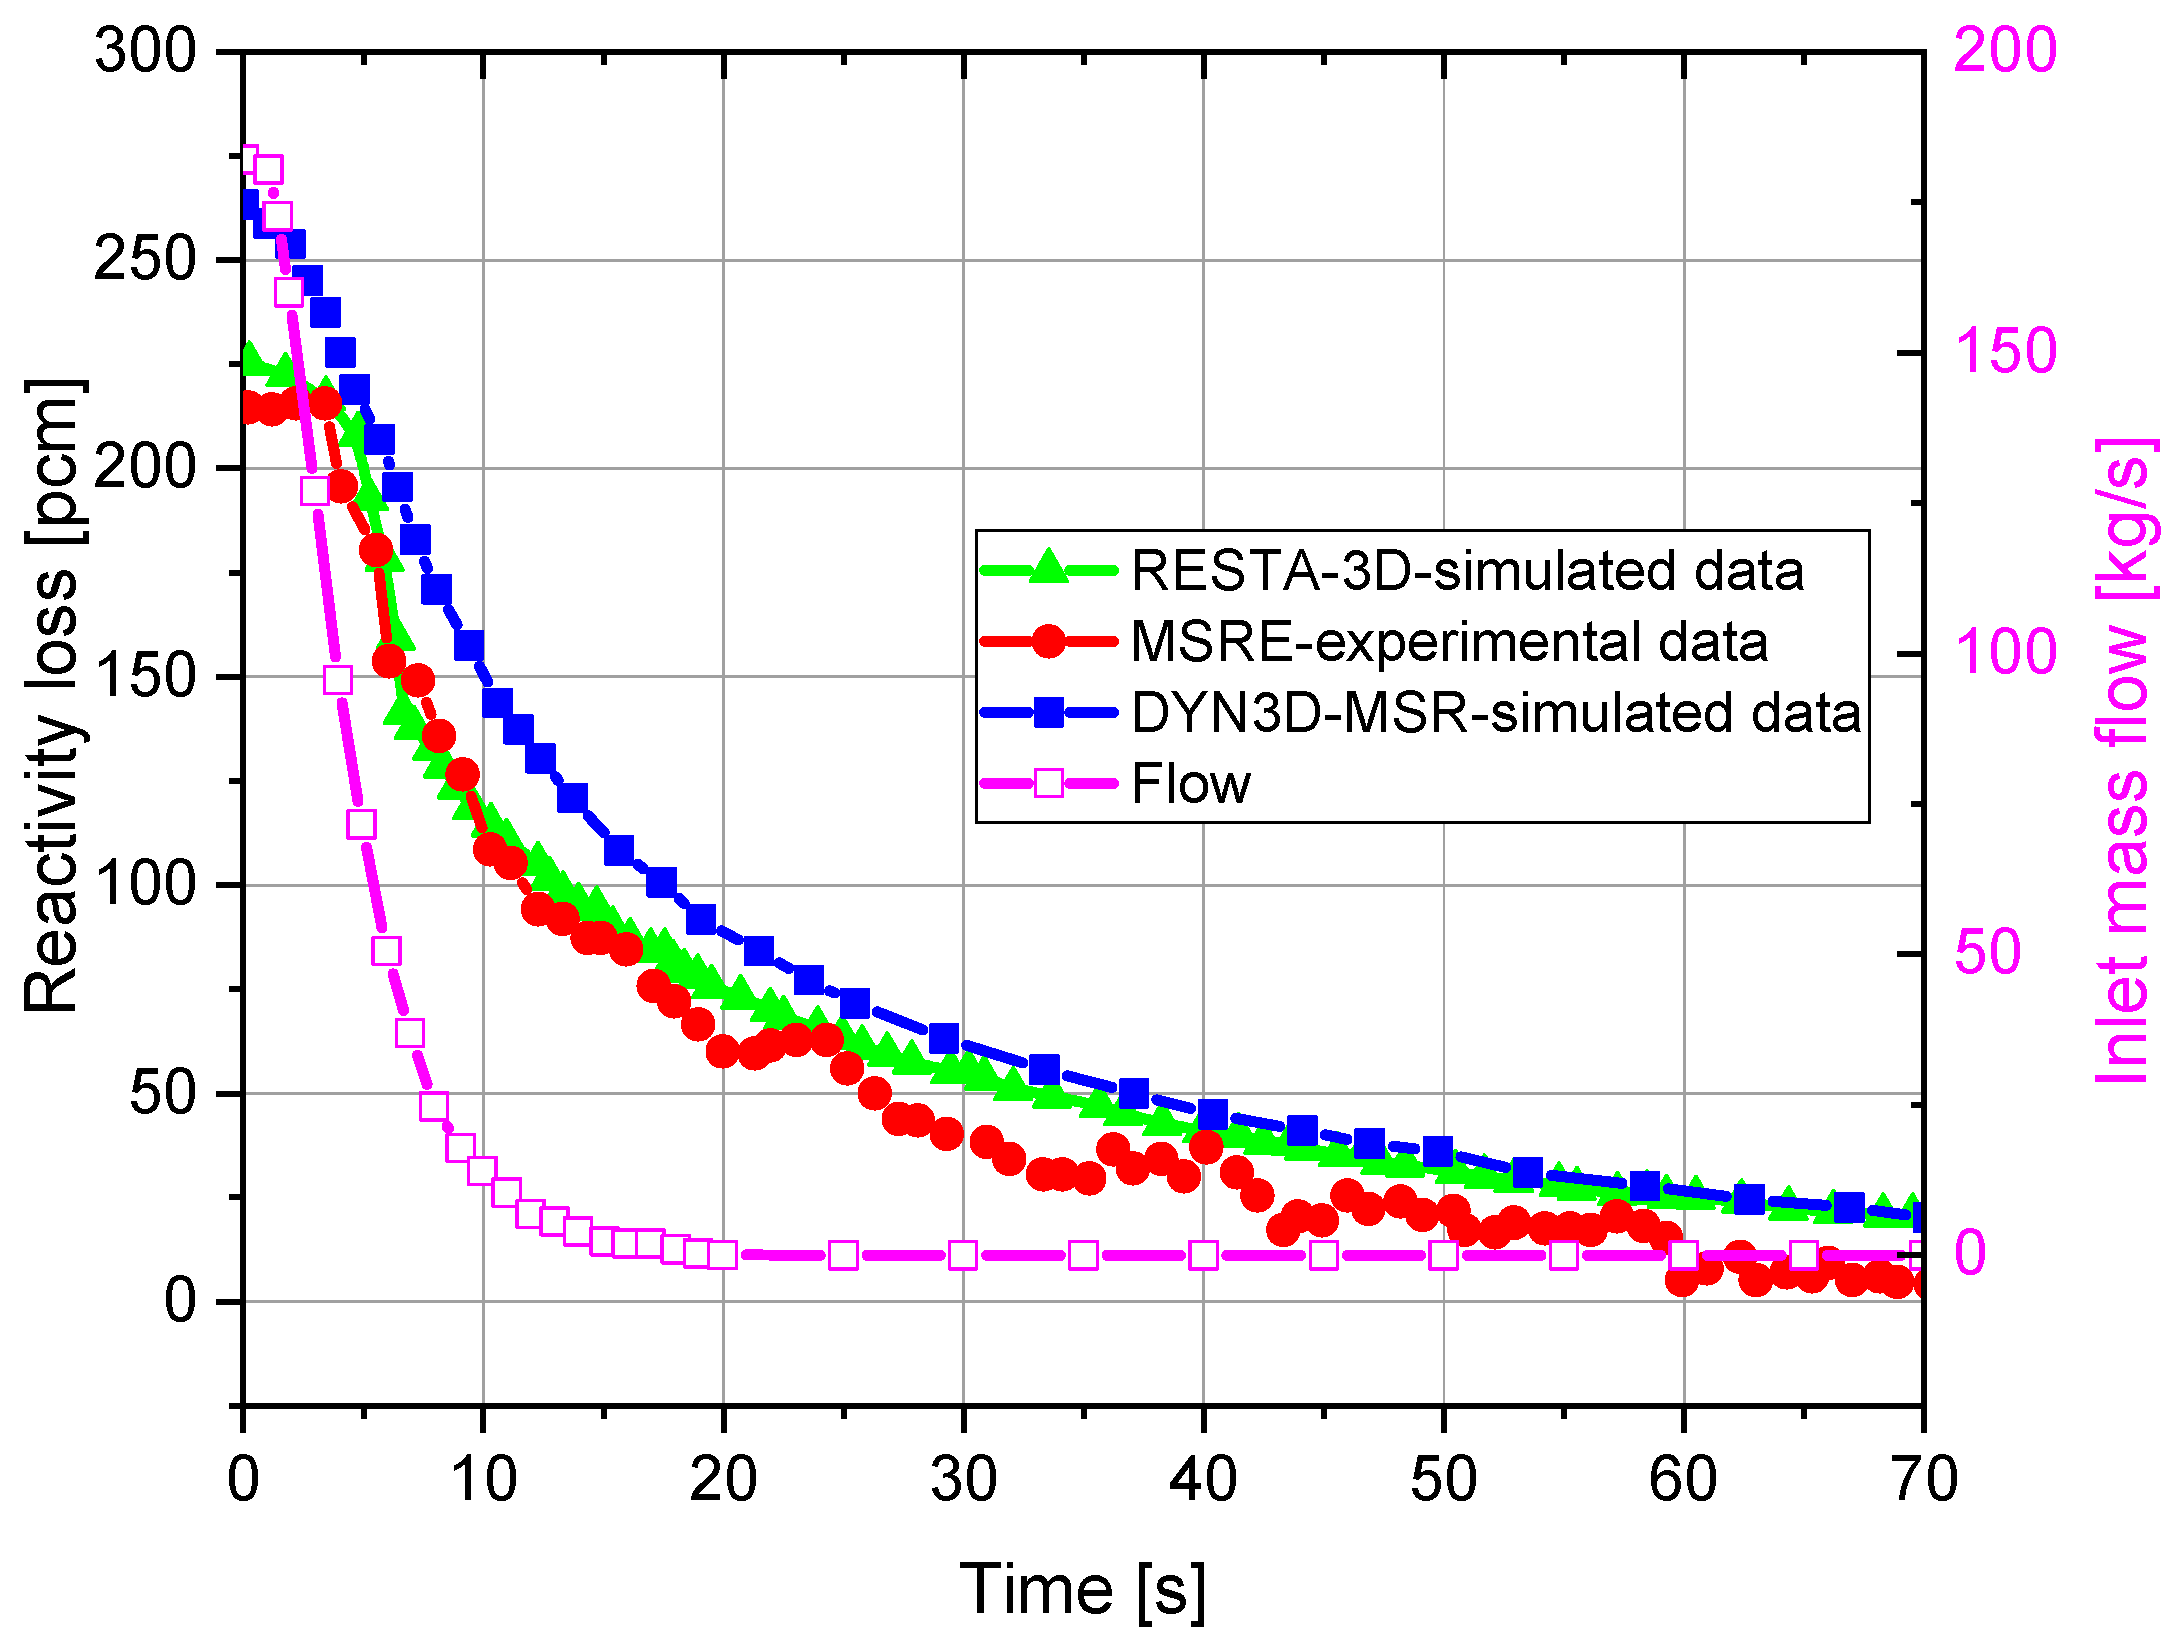
The second transient case simulates the fuel pump coast-down from nominal to zero flow over 20 s at zero power [26]. The flow transient [28] and the corresponding reactivity loss are shown in Figure 6. The decreasing flow rate reduces the transport of DNPs out of the core, thereby diminishing the required negative reactivity compensation. As shown in Figure 6, the RESTA-3D results agree well with both the MSRE experimental data and DYN3D-MSR simulations. Furthermore, the numerical simulation curves from RESTA-3D and DYN3D-MSR appear smoother than the experimental data, which is attributed to the absence of control rod movement step-size constraints in the numerical models.

4.4. Natural Convection Experiment

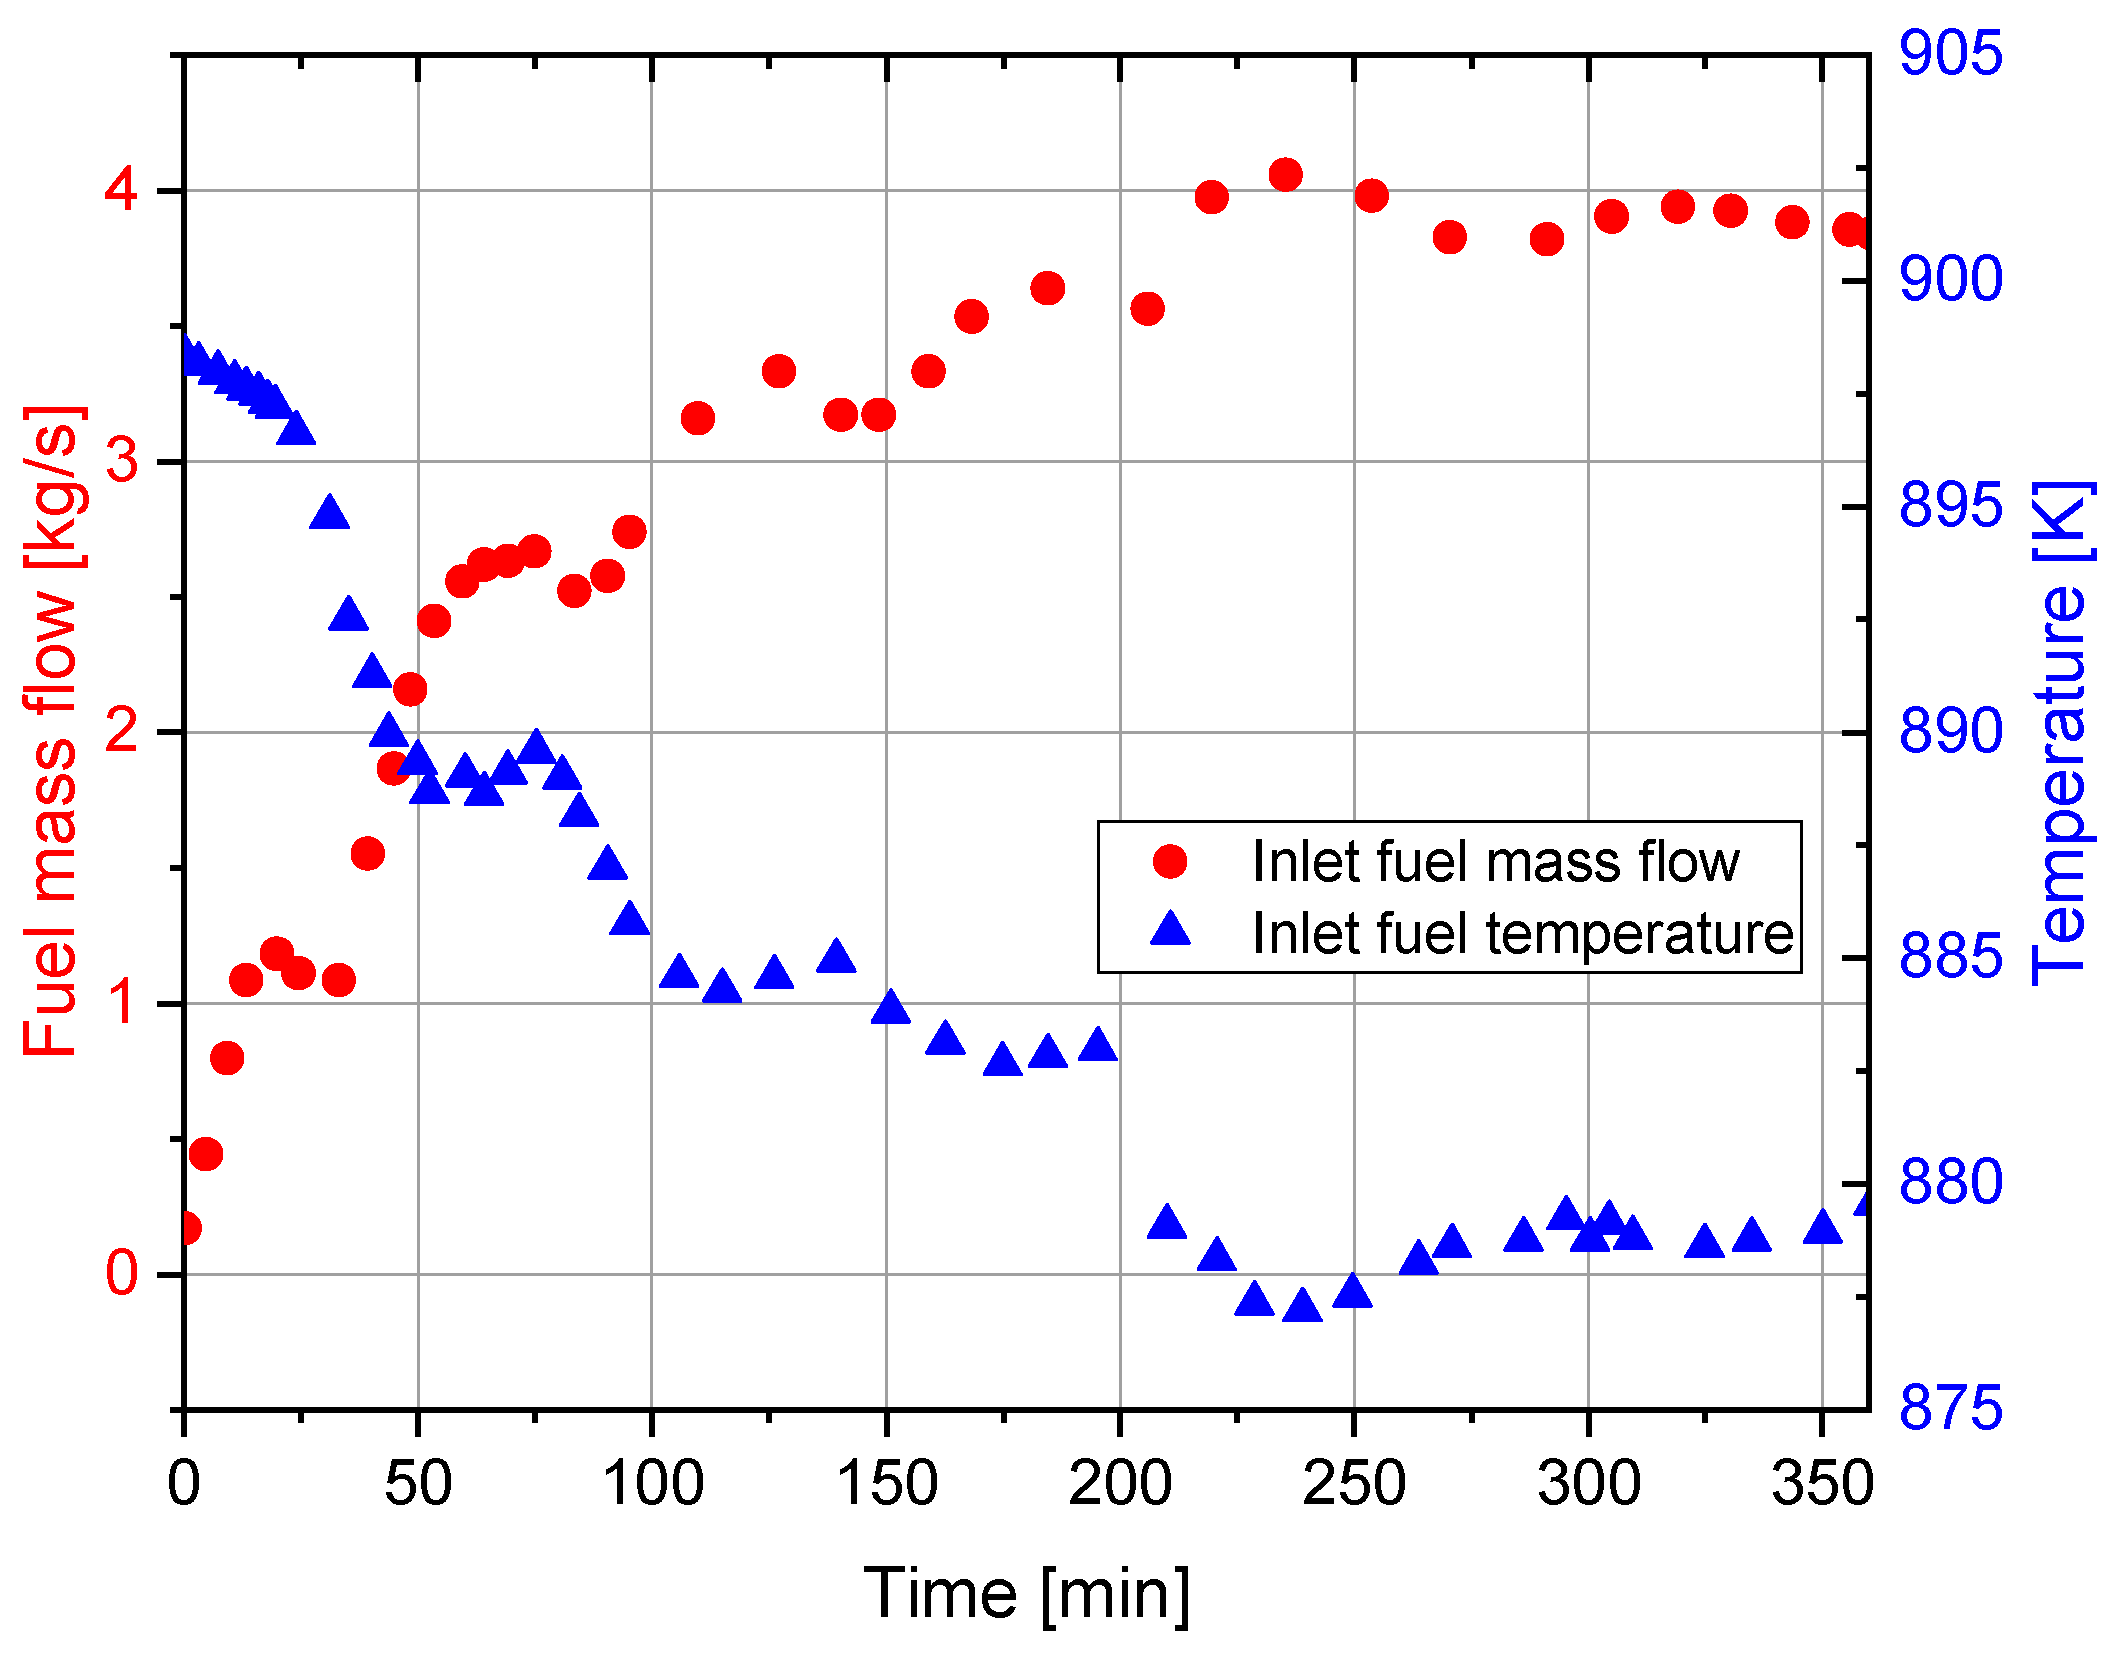
The third transient case is from the natural circulation experiment in the MOST [26]. Natural convection is driven by density gradients arising from temperature differences across the secondary loop heat exchanger. This experiment adjusts the inlet fuel temperature and mass flow rate and neglects external loop dynamics, aiming to compare the reactor power response from fuel and graphite temperature feedback [22]. The variations in inlet temperature and flow rate during the transient case are shown in Figure 7.
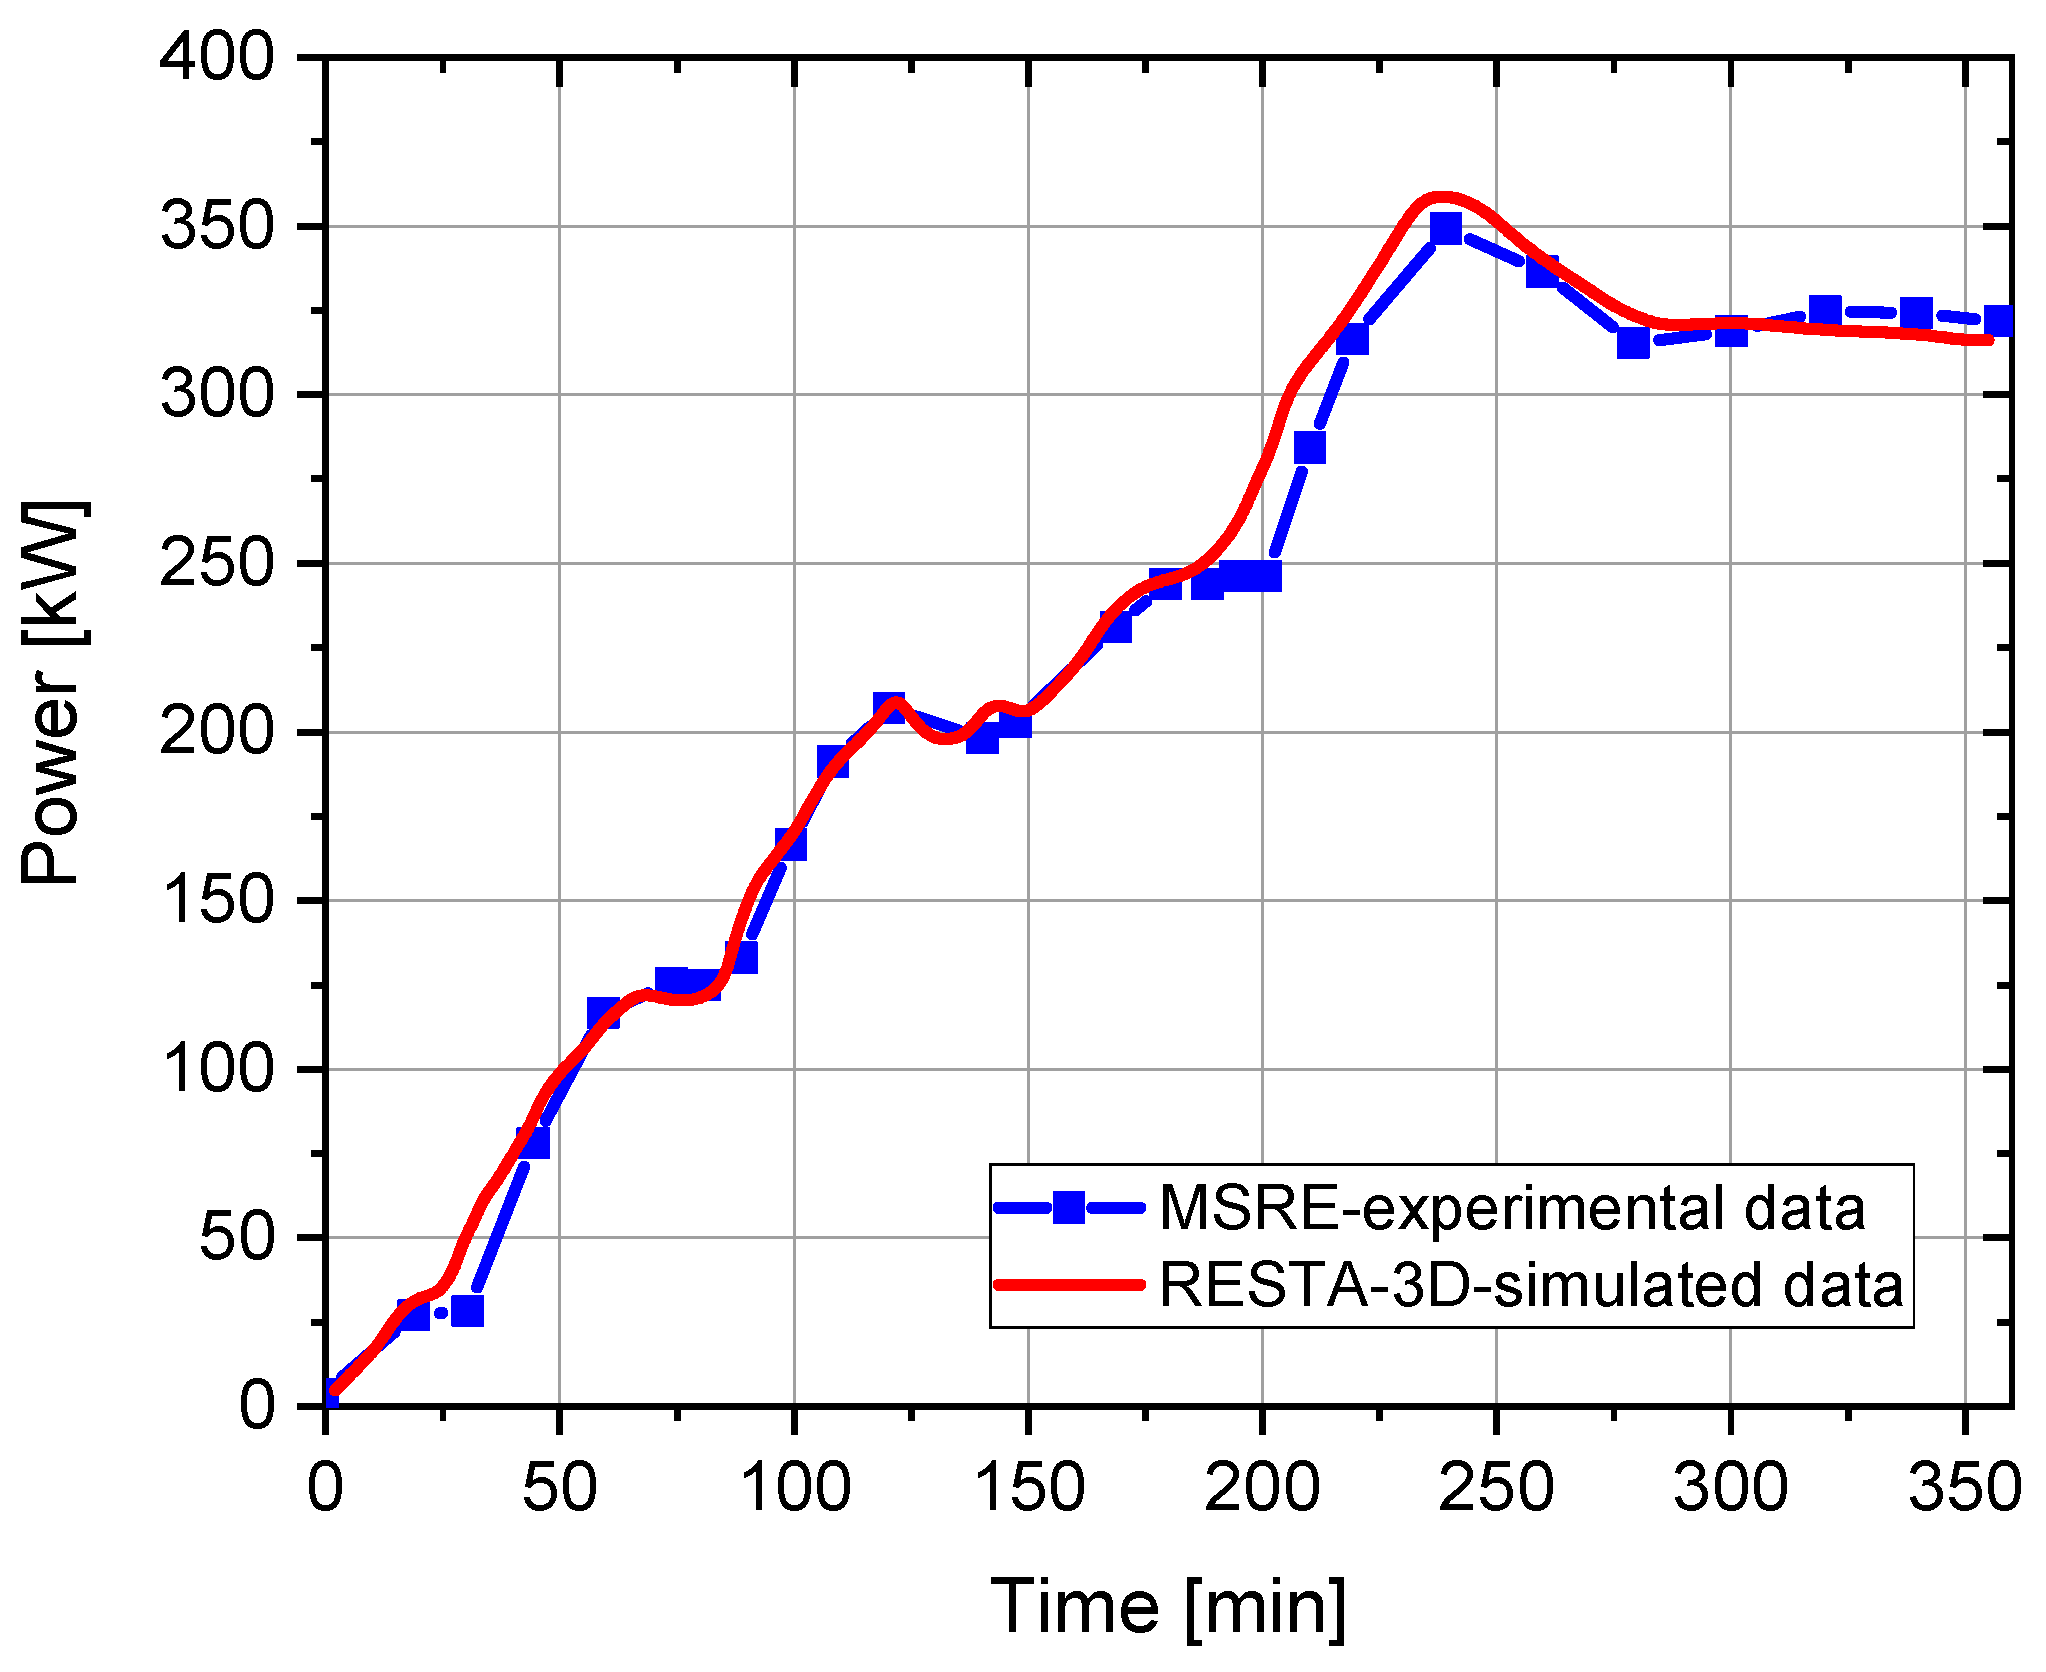
During this transient condition, the fuel is not flowing, with the reactor operating at the minimum level, and the inlet fuel temperature is 898 K. The calculation is performed based on the MOST benchmark rather than the experimental report [26]. Following the initiation of the transient, the increasing mass flow rate enhances DNP outflow from the core, introducing negative reactivity. Meanwhile, the decreasing inlet temperature introduces positive reactivity due to the negative fuel salt temperature coefficient. As shown in Figure 8, the core power exhibits an increasing trend. This indicates that the positive reactivity from the negative temperature feedback dominates over the negative reactivity effect from the reduced effective delayed neutron fraction. The power response predicted by RESTA-3D demonstrates good agreement with the MSRE experimental data. The discrepancy observed at the initial stage can be attributed to the MSRE experimental data not starting from a true steady-state condition [26].

5. Transient Analysis of 2 MWth Thorium-Based Molten Salt Reactor (TMSR)

5.1. 2 MWth TMSR Core Model

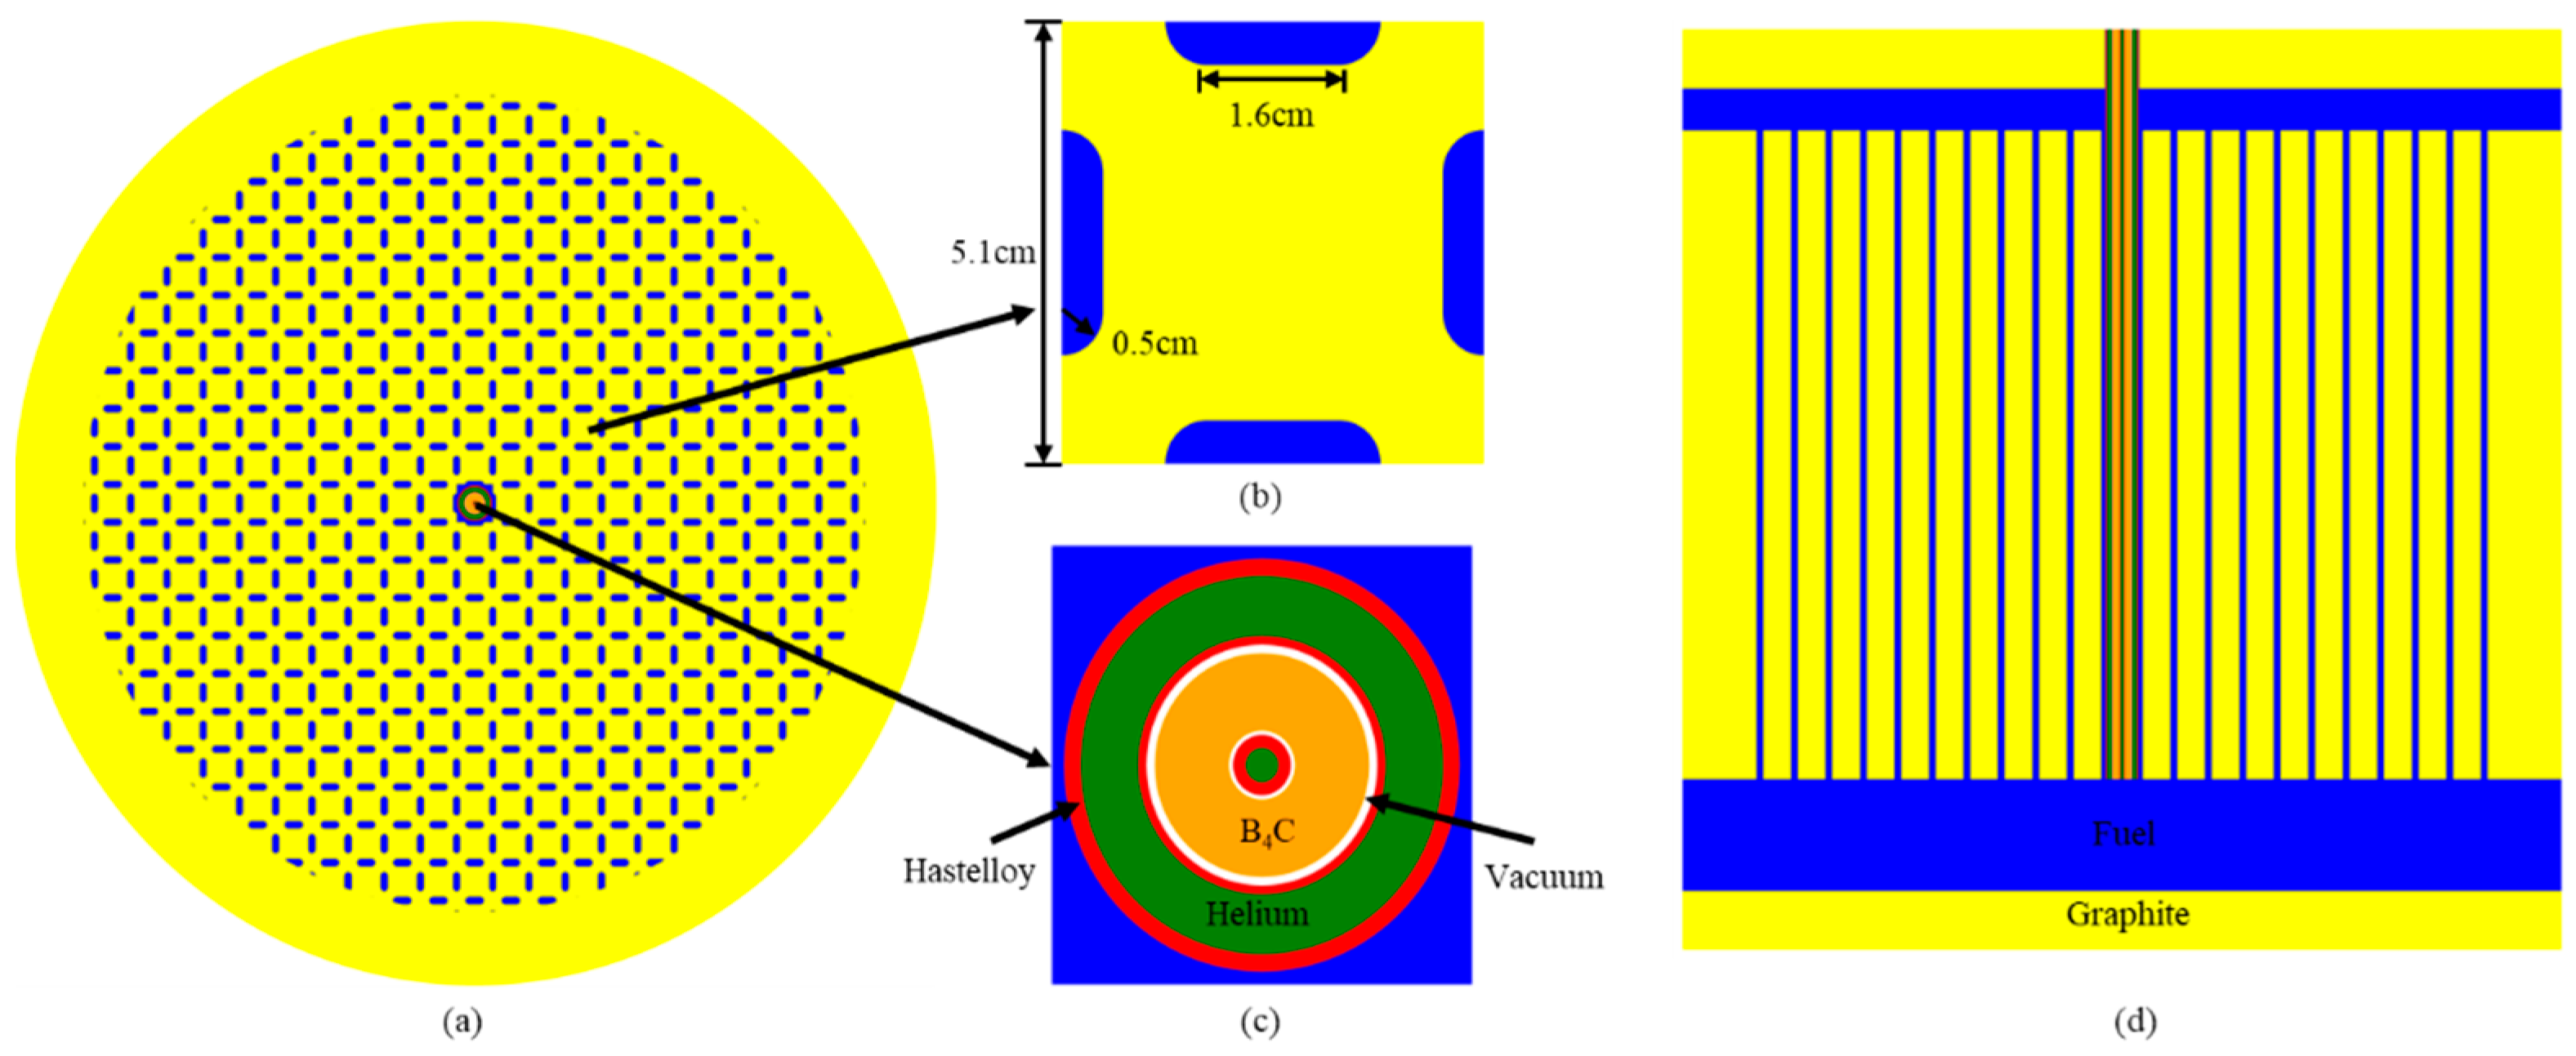
For the initial experimental validation of the thorium–uranium fuel cycle, the Shanghai Institute of Applied Physics of the Chinese Academy of Sciences has designed a 2 MWth TMSR [30]. As shown in Figure 9, the active core of the 2 MWth TMSR consists of 696 fuel channels. Graphite is used as the moderator and reflector material, while the reactor vessel is constructed with Hastelloy-N. The primary loop is loaded with the fuel salt of the mole composition 68% LiF-28% BeF2-0.1% ThF4-3.9% UF4; the enrichments of 235U and 7Li in the fuel salt are 16% and 99.95%, respectively. The coolant salt mole composition in the secondary loop is 46.5% LiF-11.5% NaF-42% KF. The core inlet and outlet temperatures are 873 K and 893 K, respectively. The mass flow rate of molten salt is 55 kg/s, and the residence time out of the core is 55.25 s. The main parameters of 2 MWth TMSR are listed in Table 4.

5.2. Inlet Fuel Temperature Driven Transients

This section investigates transient processes induced by perturbations in the inlet fuel temperature. The inlet fuel temperature is investigated for overcooled or overheated by 20 K within 10 s under the zero or nominal power conditions, respectively. In addition, the total simulation time for these transient scenarios is 1000 s, with a time step of 0.01 s adopted for the analysis. Given the negative temperature feedback coefficients of the graphite moderator and the fuel salt in the 2 MWth TMSR [24], the reactor power is expected to either stabilize at a new level or decrease to zero in these scenarios.

5.2.1. Overcooling of Inlet Fuel Temperature

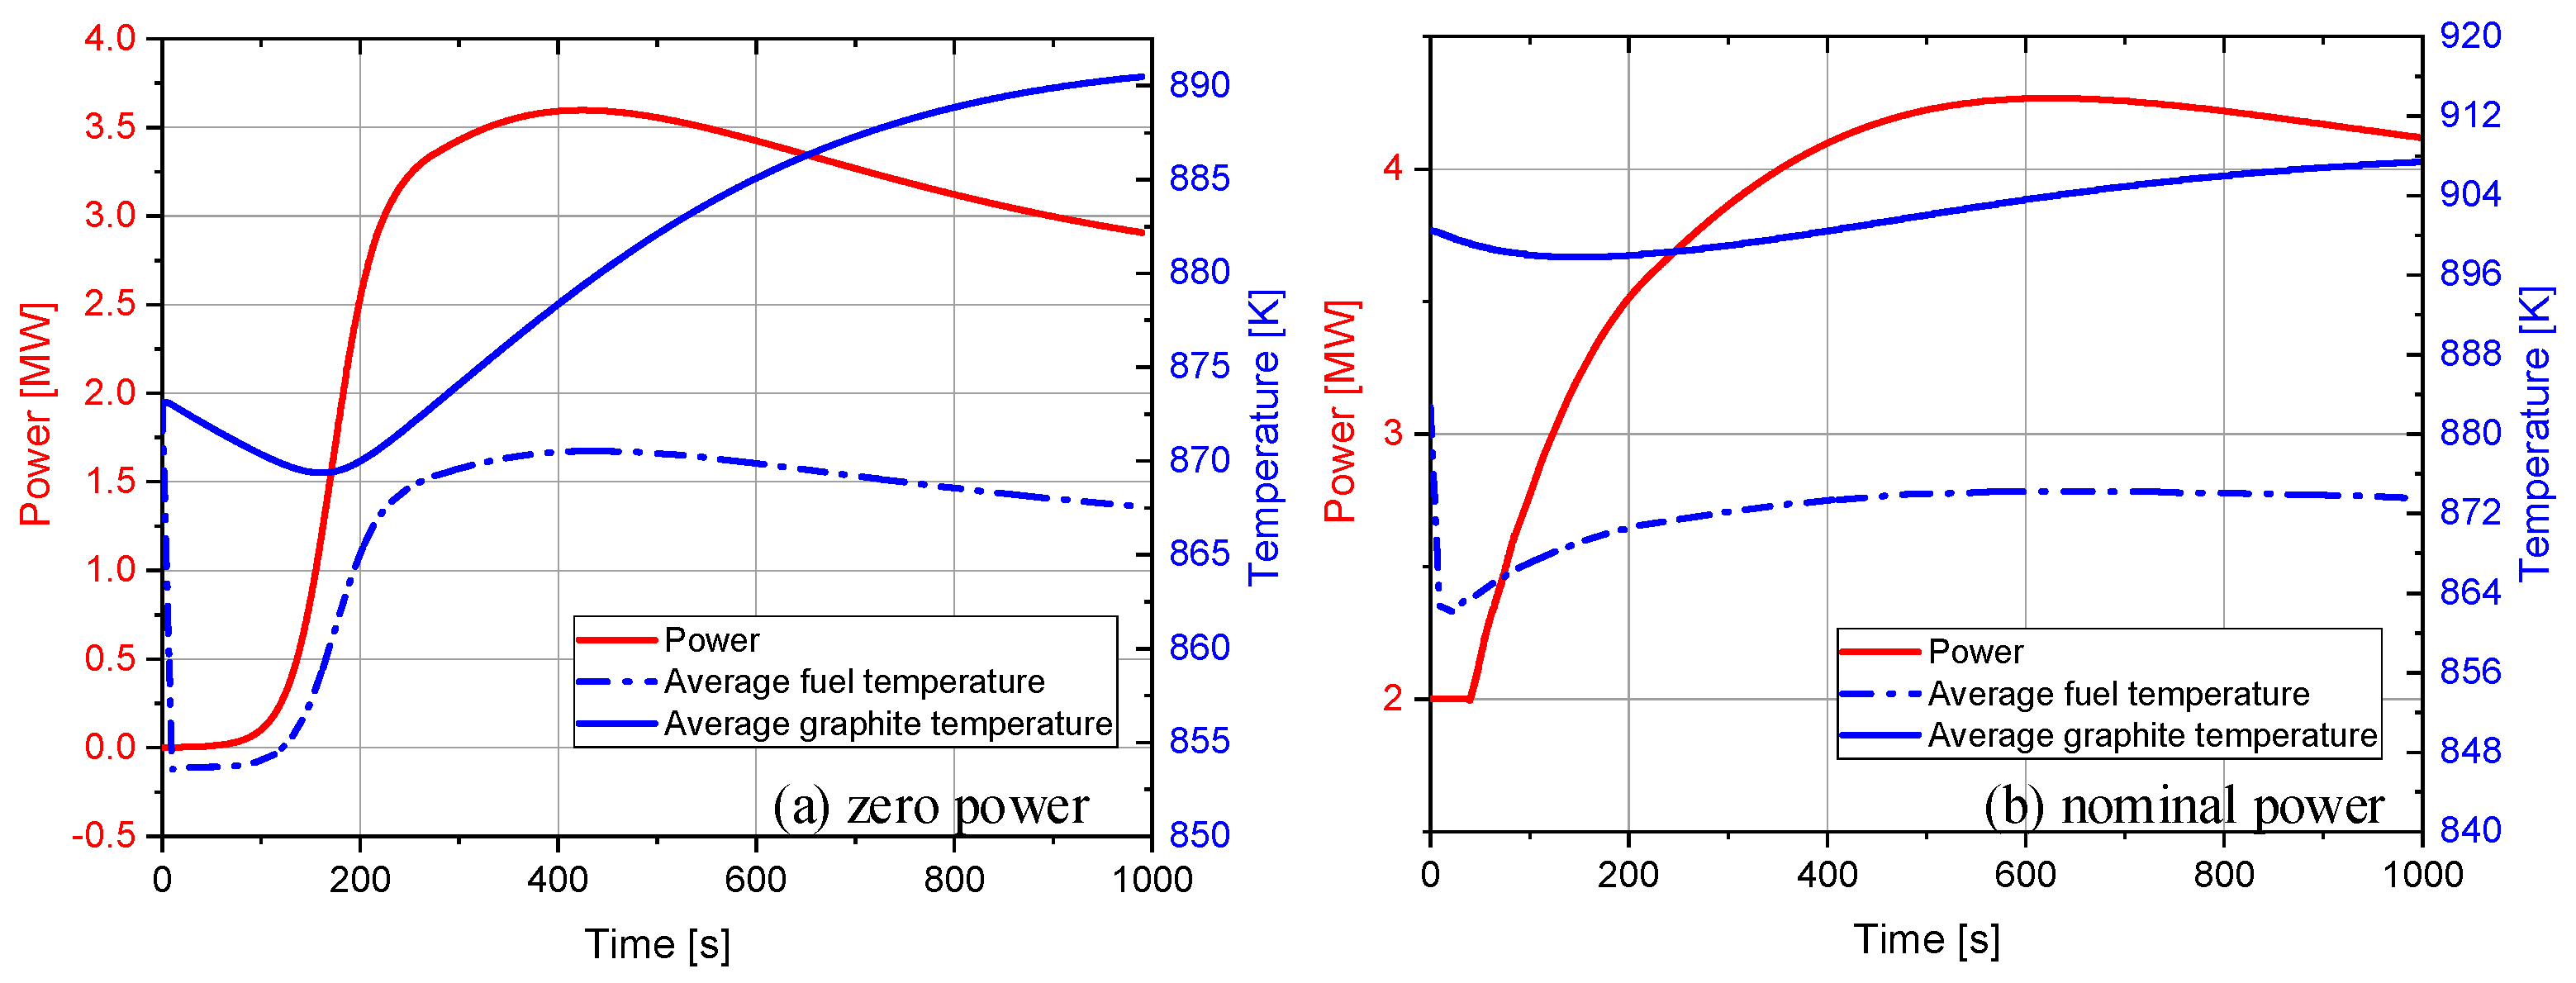
At the beginning of the transient process, the reactor operates at the nominal fuel mass flow rate under two power conditions: zero power and nominal power. Under the two conditions, the inlet fuel temperature is linearly overcooled by 20 K during the first 10 s of the transient. Due to the temperature reduction, a positive reactivity is introduced with the negative temperature feedback in the reactor core, resulting in increased power and core temperature, as shown in Figure 10.
A continuous insertion of positive reactivity drives the core into a prompt supercritical state. As shown in Figure 10, the core power increased sharply to a peak before gradually stabilizing at a new equilibrium level under both conditions. Given the low initial power level under the zero power condition, the deposited power density in the fuel salt and the graphite moderator was also low. As a result, during the initial phase of the transient, the average temperatures of the graphite and fuel were initially decreased due to the overcooled inlet fuel temperature. Subsequently, the core temperatures rose rapidly with increasing power. The increased temperature introduced negative reactivity, eventually balancing the initial positive reactivity, which stabilizes the power at a new equilibrium. Compared with the zero power transient case, the nominal power condition exhibited a faster dynamic response to the inlet fuel temperature change, producing a faster power rise, a higher peak power, and a greater maximum core temperature. The graphite temperature remained consistently higher than the fuel temperature throughout the entire transient process under both conditions. For the zero power and nominal power conditions, the maximal fuel temperature was 869 K and 875 K, respectively, while the maximal graphite temperatures were 890 K and 908 K, respectively. These temperatures are far below the allowable values (the boiling point of fuel salt 1676 K and the allowable temperature of graphite 1125 K) [18].

5.2.2. Overheating of Inlet Fuel Temperature

In this unprotected transient case, the reactor operated at both zero power and nominal power levels at the nominal flow rate prior to the transient. During the initial 10 s, the inlet fuel temperature was increased linearly by 20 K under both transient conditions. The evolution of the average temperature of the fuel and graphite, along with the core power, is shown in Figure 11.
For both the zero power and nominal power conditions, a negative reactivity was introduced by increasing the inlet fuel temperature, driving the core into a subcritical state and reducing the core power. As shown in Figure 11a, the average fuel temperature increased with the inlet fuel temperature during the first 20 s of the transient case, and then stabilized gradually at a new level. Throughout this transient case, the average temperature of graphite remained lower than the average temperature of fuel. This is because the initial core temperature was nearly uniform due to low power operation, thus heat was continuously transferred from the fuel salt to the graphite. As demonstrated in Figure 11b, compared with the zero power transient case, the average fuel temperature under nominal power first increased to a maximum and then gradually decreased.
The initial rise in inlet temperature caused a rapid increase in fuel temperature, which, through negative temperature feedback, introduced additional negative reactivity. The resulting power reduction eventually led to a decrease in the fuel temperature. Furthermore, the average fuel temperature remained below the graphite temperature throughout the transient, indicating the heat was transferred by conduction from the graphite to the fuel. The heat transfer delay between graphite and fuel, and the decrease in the nuclear heat instantly released in the graphite, resulted in the average graphite temperature declining slightly at first during the transient. In both transient cases, the peak temperatures of fuel and graphite remained below the temperature safety limit.

5.3. Fuel Pump Driven Transient

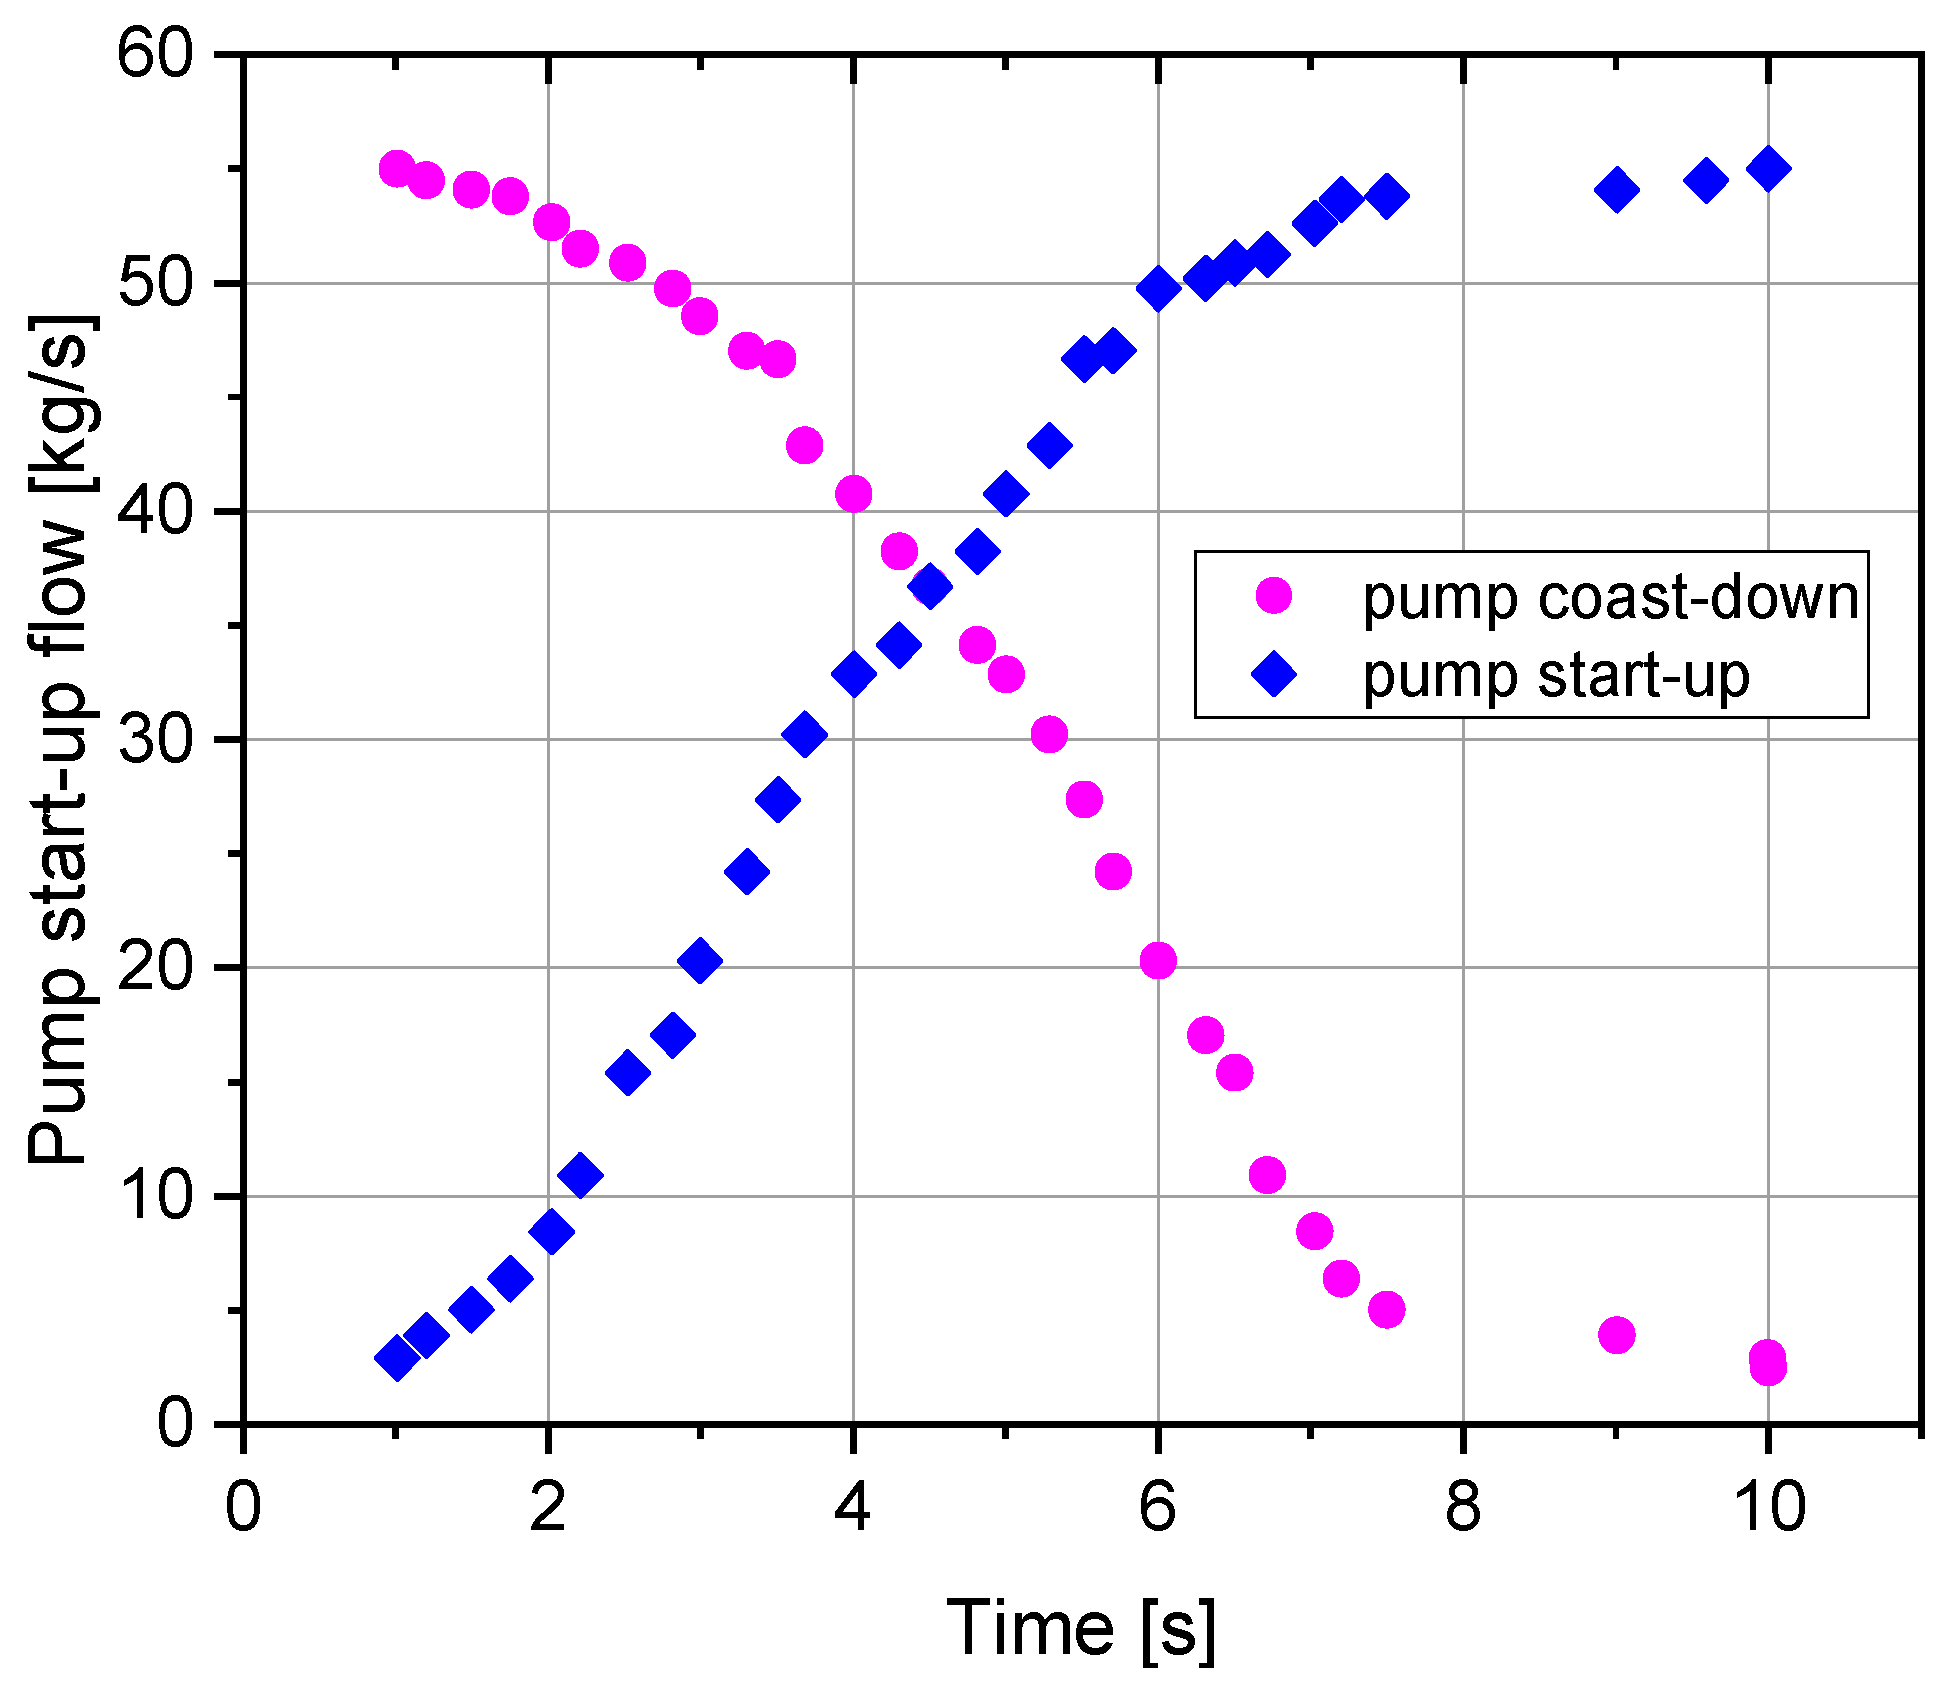
In the previous section, the influence of inlet temperature overcooling and overheating on reactor core power and temperature was discussed, demonstrating the reactor safety under different temperature conditions. This section focuses on the transient processes of fuel pump start-up and coast-down. Figure 12 displays the variation in the reactor flow rate, and the pump flow rate variation only indicates changes in the inlet flow rates.

5.3.1. Unprotected Fuel Pump Start-Up Transient at Zero Power

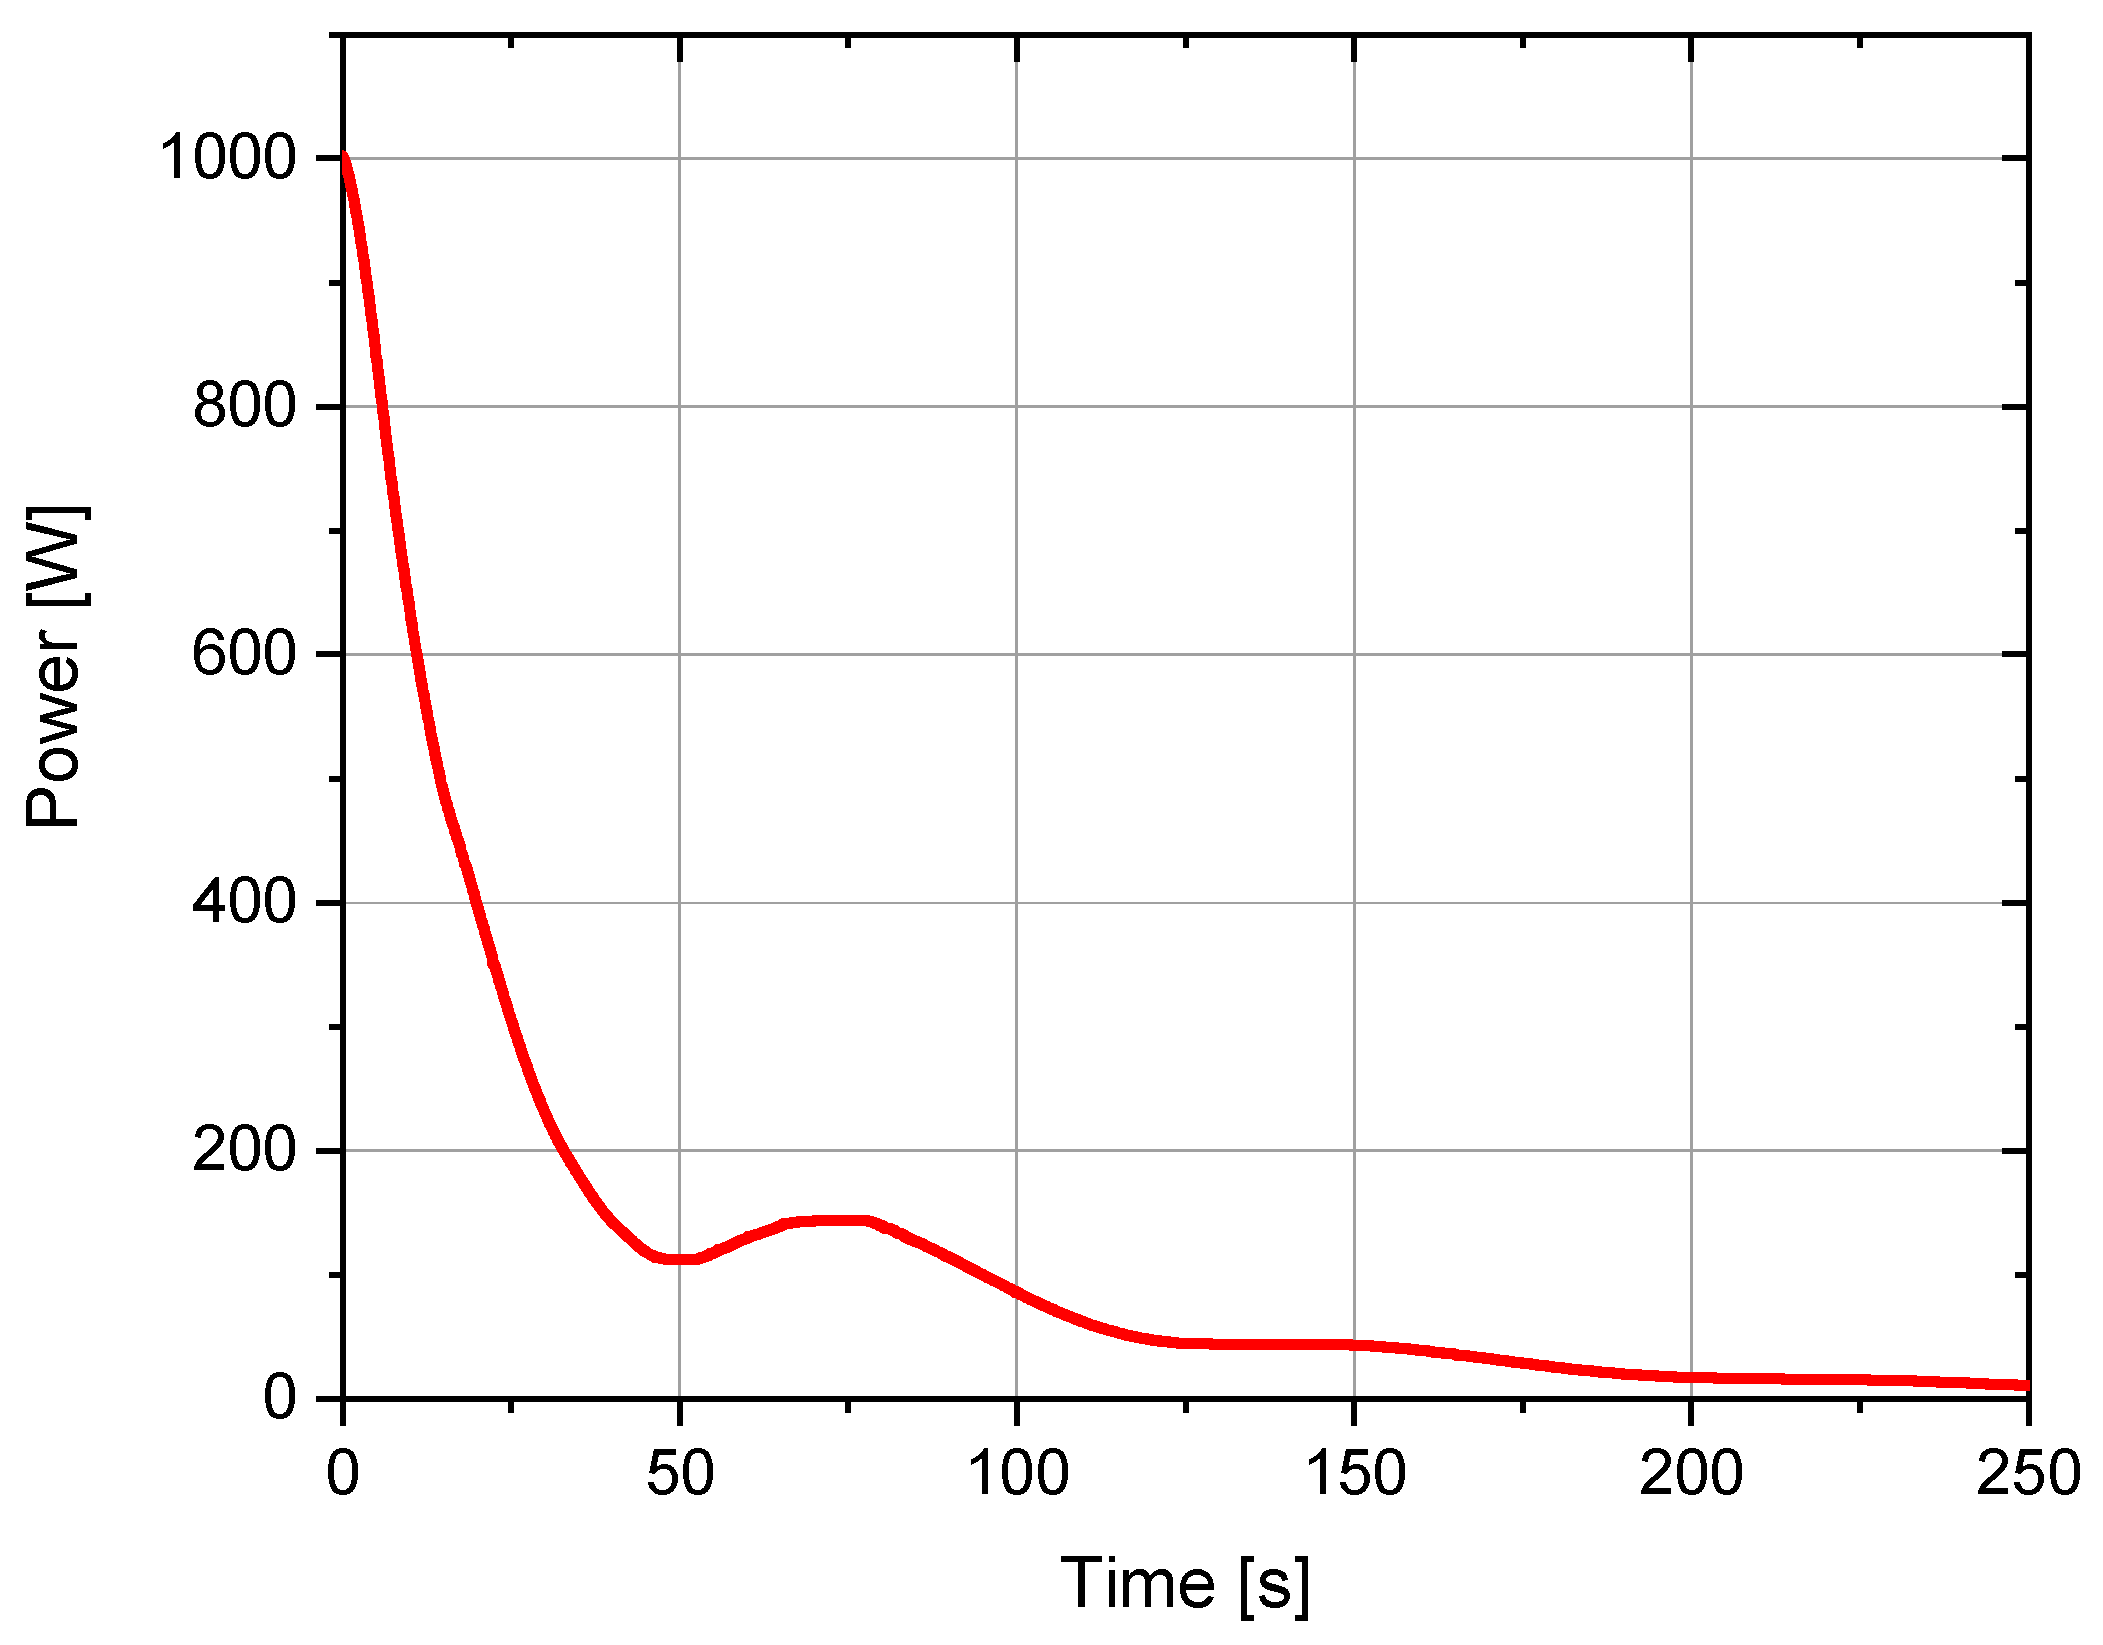
In this unprotected fuel pump start-up transient, the reactor was initially at 1 kW with no fuel flow. At the beginning of the transient, the inlet fuel flow rate increased from zero to the nominal mass flow rate in 10 s, as shown in Figure 12. Given the nearly uniform core temperature profile under low-power conditions, the variation in mass flow rate became the dominant factor influencing power evolution.
As illustrated in Figure 13, the transient lasted for 250 s. The core power decreased sharply during the first 55 s, followed by sustained oscillations. This behavior occurred because the fuel remained static before the fuel pump was activated, during which the DNPs generated from fission decayed completely within the core. Subsequently, as the flow increased, DNPs were redistributed, some were carried out of the core and decayed, reducing core reactivity and driving the system toward a subcritical state, which caused the initial power drop. Meanwhile, a positive reactivity insertion occurred as undecayed DNPs from the external loop re-entered the core, increasing power and initiating oscillations. Finally, the core power returned to a new stable state, demonstrating the inherent safety of the 2 MWth TMSR during the mass flow variations.

5.3.2. Unprotected Fuel Pump Coast-Down Transient at Zero Power

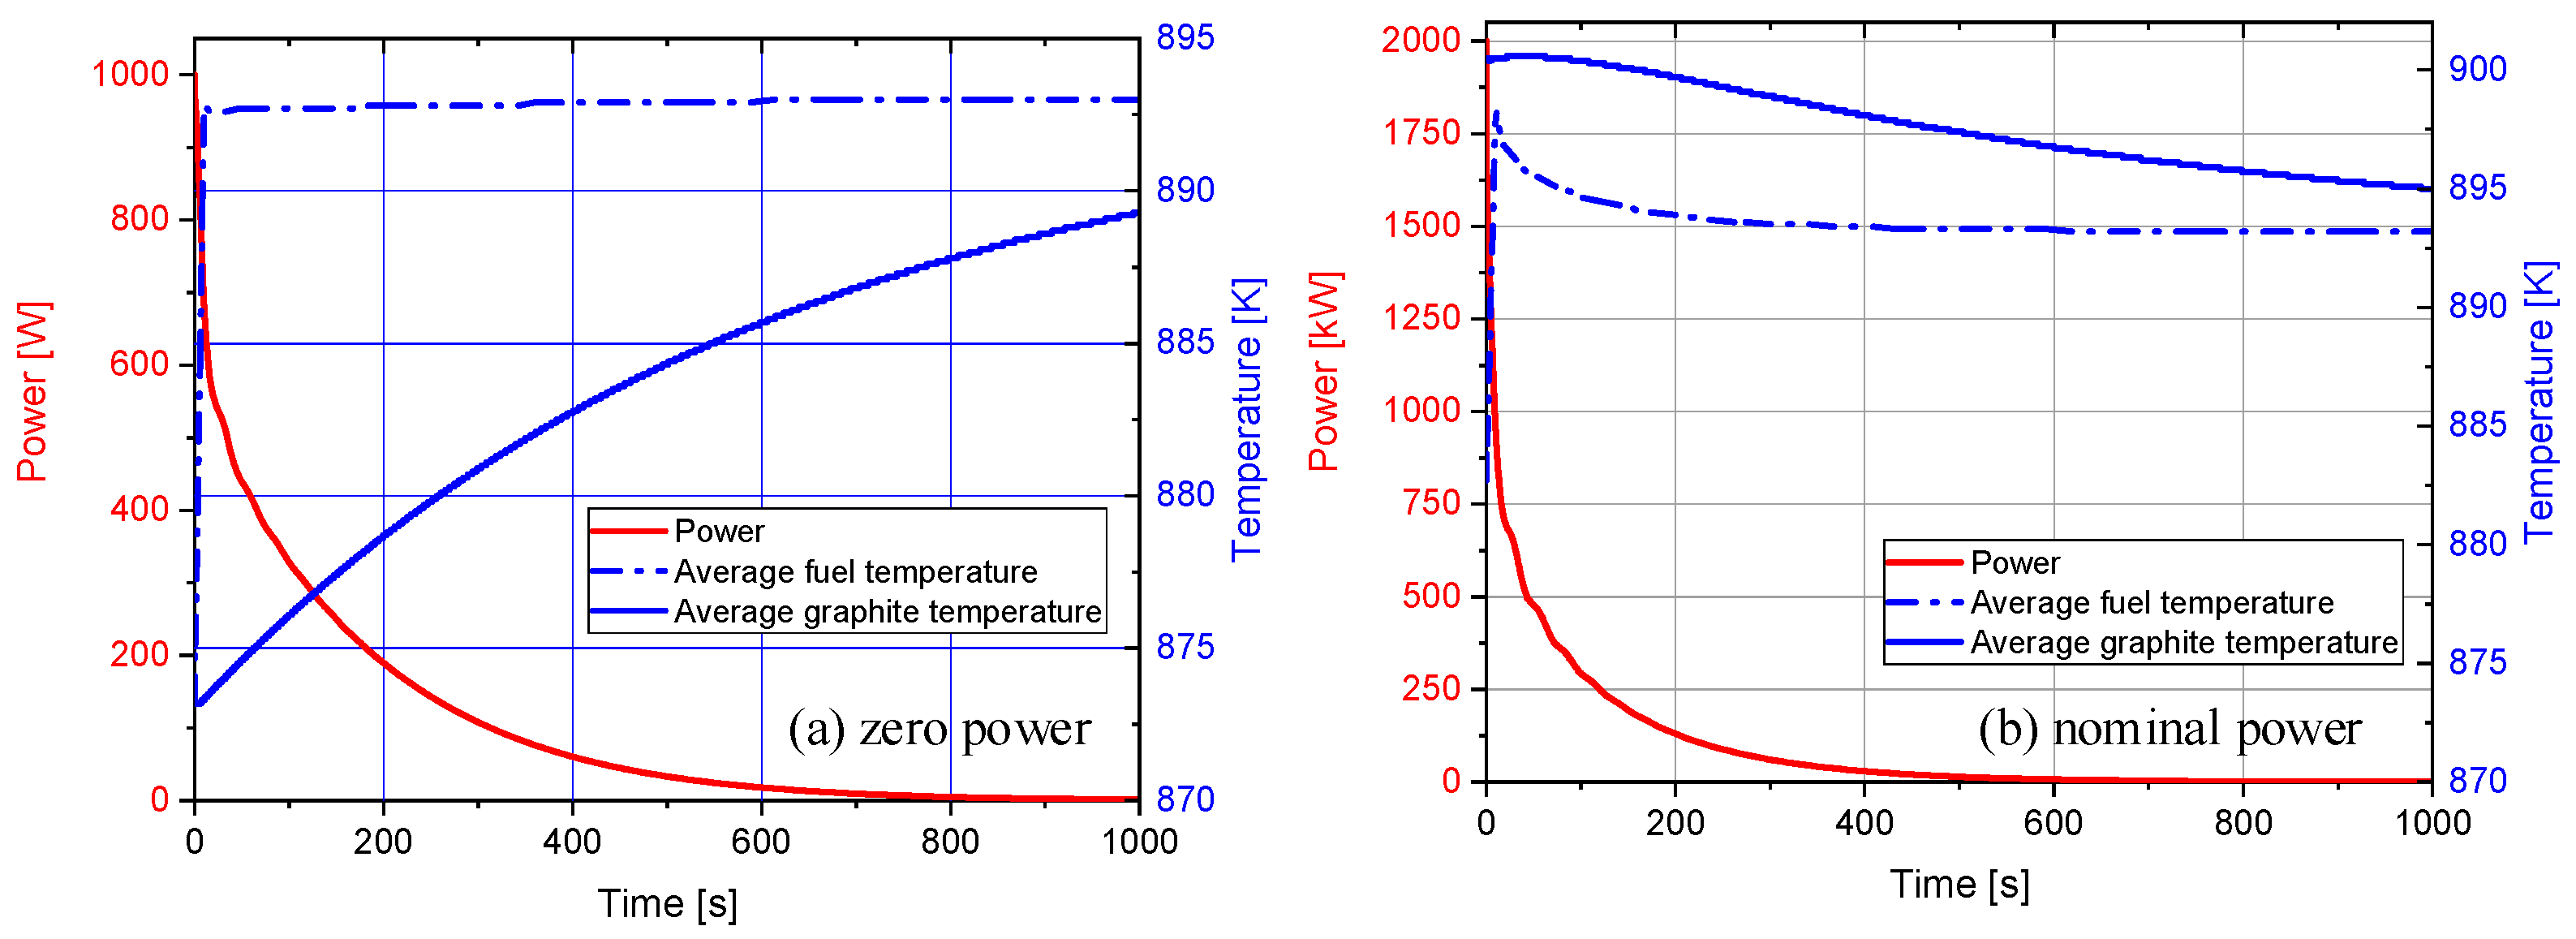
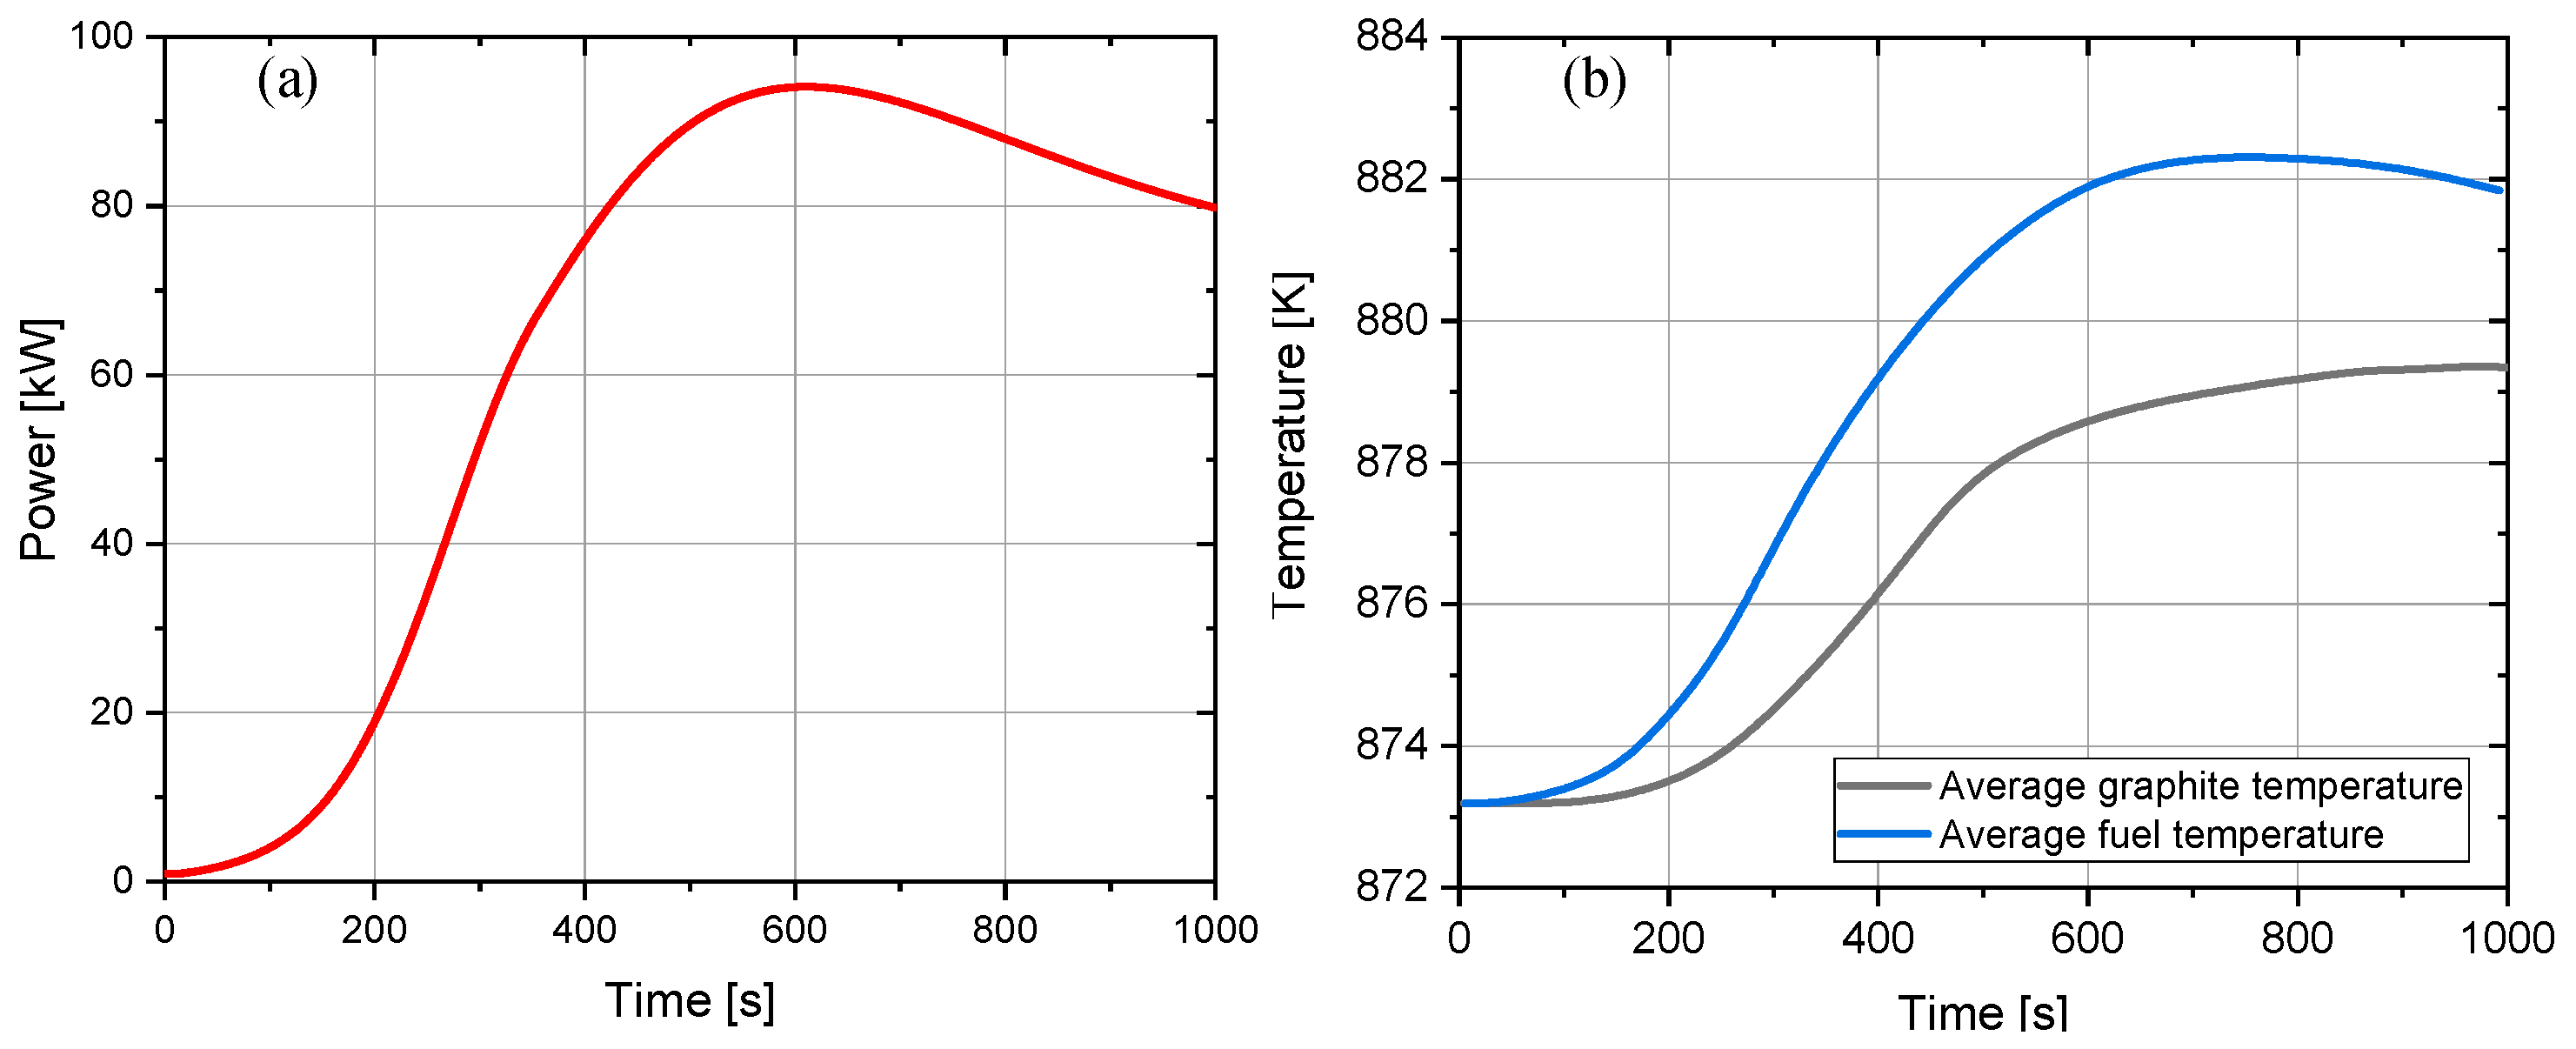
The unprotected fuel pump coast-down transient started from a zero-power condition at the nominal mass flow rate. The inlet fuel mass flow was reduced from the rated mass flow to zero within 10 s. The whole transient process lasted for 1000 s. The time-dependent variations in the inlet mass flow rate, core power, and the average temperatures of fuel and graphite in the hottest channel are presented in Figure 12 and Figure 14, respectively.
During the pump coast-down transient, the decreasing flow rate reduced the outflow transport of DNPs from the core, thereby introducing positive reactivity. This caused a sharp increase in core power, which reached a peak before gradually stabilizing at a new equilibrium level, as shown in Figure 14a. The average temperatures of the fuel and graphite increased with the core power. Subsequently, the negative temperature feedback effect induced a decrease in power, as depicted in Figure 14b. Throughout the transient, the maximum core power reached 87 kW, and the peak average fuel temperature in the hottest channel was 883 K. As the fuel pump coast-down, the nuclear reaction continued with most heat released directly in the fuel salt, and the specific heat capacity of graphite is smaller than that of the fuel salt. This resulted in the fuel temperature remaining higher than the graphite temperature. Furthermore, the temperature variation range of both fuel salt and graphite stays within the safety margin.

6. Conclusions

In this work, the in-house N-TH coupled three-dimensional spatial dynamics code RESTA-3D was further developed and verified for MSR analysis. Within RESTA-3D, the neutron diffusion equation is solved using the NEM and coupled with a multi-channel TH solver to obtain the core power and temperature distribution. RESTA-3D was validated against experimental data from the MSRE and simulation results from the well-established code DYN3D-MSR for both steady-state and transient conditions. Meanwhile, RESTA-3D was applied to analyze the transient in a 2 MWth TMSR induced by inlet fuel temperature and pump flow variations. The main conclusions are summarized as follows:
(1) The DNP loss, keff and temperature reactivity coefficients for the MSRE loaded with 235U fuel were calculated. The results show good agreement with documented MSRE experimental data and other code simulations, validating the reliability of RESTA-3D. Meanwhile, the temperature distribution in the hottest channel calculated by RESTA-3D agrees well with experimental data from ORNL. The comparison validated the applicability of RESTA-3D for the physical analysis of liquid molten salt reactors.
(2) The two transient conditions of the protected pump start-up and coast-down were simulated and compared with MSRE experimental data and DYN3D-MSR simulated results. It is verified that the RESTA-3D can predict the core transient responses when DNP redistribution results from alterations in flow rate. Meanwhile, simulations of natural circulation were performed and verified.
(3) Furthermore, the RESTA-3D was used to analyze transient safety responses to inlet fuel temperature overcooling and overheating for operations at zero and nominal power. The analysis of the resulting core power and temperature evolution demonstrated that the peak temperatures of the graphite moderator and the fuel salt remain well below their respective safety limits under all investigated scenarios.
(4) Due to the negative temperature coefficients of the graphite and fuel, the 2 MWth TMSR exhibits inherent stability. Such inherent stability ensures that unprotected pump start-up and coast-down cannot lead to severe accidents.

Author Contributions

Conceptualization, K.W.; methodology, K.W. and Y.C.; software, K.W.; validation, K.W.; formal analysis, K.W.; investigation, K.W.; data curation, K.W.; writing—original draft preparation, K.W.; writing—review and editing, A.Z. and C.Z. and J.C.; visualization, A.Z. and C.Z. Supervision, Y.L. and X.C. All authors have read and agreed to the published version of the manuscript.

Funding

This work is supported by the National Natural Science Foundation of China (Grant No. 12205362 and No. 12175300) and Youth Innovation Promotion Association, CAS (No. 2022258).

Data Availability Statement

The original contributions presented in the study are included in the article; further inquiries can be directed to the corresponding author.

Conflicts of Interest

The authors declare no conflicts of interest.

References

  1. Serp, J.; Allibert, M.; Beneš, O.; Delpech, S.; Feynberg, O.; Ghetta, V.; Heuer, D.; Holcomb, D.; Ignatiev, V.; Kloosterman, J.L.; et al. The molten salt reactor (MSR) in generation IV: Overview and perspectives. Prog. Nucl. Energy 2014, 77, 308–319. [Google Scholar] [CrossRef] [Scilit]
  2. Wu, J.; Chen, J.; Cai, X.; Zou, C.; Yu, C.; Cui, Y.; Zhang, A.; Zhao, H. A Review of Molten Salt Reactor Multi-Physics Coupling Models and Development Prospects. Energies 2022, 15, 8296. [Google Scholar] [CrossRef] [Scilit]
  3. Bettis, E.S.; Schroeder, R.W.; Cristy, G.A.; Savage, H.W.; Affel, R.G.; Hemphill, L.F. The Aircraft Reactor Experiment—Design and Construction. Nucl. Sci. Eng. 1957, 2, 804–825. [Google Scholar] [CrossRef] [Scilit]
  4. Haubenreich, P.N. Molten Salt Reactor Experiments; Oak Ridge National Laboratory: Oak Ridge, TN, USA, 1969.
  5. Křepel, J. Dynamics of Molten Salt Reactors; Czech Technical University in Prague: Prague, Czech Republic; Institute of Safety Research in the Research Centre: Rossendorf, Germany, 2008. [Google Scholar]
  6. MacPherson, H.G. The molten salt reactor adventure. Nucl. Sci. Eng. 1985, 90, 374–380. [Google Scholar] [CrossRef] [Scilit]
  7. Mathieu, L.; Heuer, D.; Merle-Lucotte, E.; Brissot, R.; Le Brun, C.; Liatard, E.; Loiseaux, J.M.; Méplan, O.; Nuttin, A.; Lecarpentier, D. Possible Configurations for the Thorium Molten Salt Reactor and Advantages of the Fast Nonmoderated Version. Nucl. Sci. Eng. 2009, 161, 78–89. [Google Scholar] [CrossRef] [Scilit]
  8. Furukawa, K.; Arakawa, K.; Erbay, L.B.; Ito, Y.; Kato, Y.; Kiyavitskaya, H.; Lecocq, A.; Mitachi, K.; Moir, R.; Numata, H.; et al. A road map for the realization of global-scale thorium breeding fuel cycle by single molten-fluoride flow. Energy Convers. Manag. 2008, 49, 1832–1848. [Google Scholar] [CrossRef] [Scilit]
  9. Mitachi, K.; Yamamoto, T.; Yosioka, R. Performance of a 200 MWe Molten-Salt Reactor Operated in Thorium-Uranium Fuel-Cycle. In Proceedings of the GLOBAL 2005 International Conference on Nuclear Fuel Cycle, Tsukuba, Japan, 9–13 October 2005; Paper No. 089. [Google Scholar]
  10. Suzuki, N.; Shimazu, Y. Preliminary Safety Analysis on Depressurization Accident without Scram of a Molten Salt Reactor. J. Nucl. Sci. Technol. 2006, 43, 720–730. [Google Scholar] [CrossRef]
  11. Ignatiev, V.; Feynberg, O.; Gnidoi, I.; Merzlyakov, A.; Smirnov, V.; Surenkov, A.; Tretiakov, I.; Zakirov, R.; Afonichkin, V.; Bovet, A.; et al. Progress in development of Li, Be, Na/F molten salt actinide recycler & transmuter concept. In Proceedings of the ICAPP 2007 International Congress on Advances in Nuclear Power Plants, Nice, France, 13–18 May 2007; pp. 13–18. [Google Scholar]
  12. Aufanni, N.N.; Lee, E.; Oh, T.; Kim, Y. Burnable Absorber Design Study for a Passively-Cooled Molten Salt Fast Reactor. Nucl. Eng. Technol. 2024, 56, 900–906. [Google Scholar] [CrossRef] [Scilit]
  13. Mausolff, Z.; DeHart, M.; Goluoglu, S. Design and assessment of a molten chloride fast reactor. Nucl. Eng. Des. 2021, 379, 111181. [Google Scholar] [CrossRef] [Scilit]
  14. Krepel, J.; Kramer, K.J. Molten Chloride Fast Reactors (MCFRs). Encycl. Nucl. Energy 2021, 625–642. [Google Scholar] [CrossRef] [Scilit]
  15. Jiang, M.; Xu, H.; Dai, Z. Advanced fission energy program-TMSR nuclear energy system. Bull. Chin. Acad. Sci. 2012, 27, 366–374. [Google Scholar]
  16. Kópházi, J.; Lathouwers, D.; Kloosterman, J.L. Development of a Three-Dimensional Time-Dependent Calculation Scheme for Molten Salt Reactors and Validation of the Measurement Data of the Molten Salt Reactor Experiment. Nucl. Sci. Eng. 2009, 163, 118–131. [Google Scholar] [CrossRef] [Scilit]
  17. Cui, Y.; Shang, J.; Mei, L.; Tong, J. Development and Verification of a Spatial Dynamics Code RESTA-3D for Light Water Reactors. Int. J. Energy Res. 2025, 2025, 5377974. [Google Scholar] [CrossRef] [Scilit]
  18. Zhuang, K.; Cao, L. Numerical analysis on the dynamic behaviors of a graphite-moderated molten salt reactor based on MOREL2.0 code. Ann. Nucl. Energy 2018, 117, 3–11. [Google Scholar] [CrossRef] [Scilit]
  19. Cui, Y.; Chen, J.G.; Dai, M.; Cai, X.Z. Development of a steady state analysis code for molten salt reactor based on nodal expansion method. Ann. Nucl. Energy 2021, 151, 107950. [Google Scholar] [CrossRef] [Scilit]
  20. Cho, N.Z. Fundamentals and recent developments of reactor physics methods. Nucl. Eng. Technol. 2005, 37, 25–78. [Google Scholar]
  21. Kim, D.S.; Cho, N.Z. Kinetics calculation under space-dependent feedback in analytic function expansion nodal method via solution decomposition and Galerkin scheme. Nucl. Sci. Eng. 2002, 140, 267–284. [Google Scholar] [CrossRef] [Scilit]
  22. Zhuang, K.; Zheng, Y.; Cao, L.; Hu, T.; Wu, H. Improvements and validation of the transient analysis code MOREL for molten salt reactors. J. Nucl. Sci. Technol. 2017, 54, 878–890. [Google Scholar] [CrossRef] [Scilit]
  23. Robertson, R.C.; Briggs, R.B.; Smith, O.L.; Bettis, E.S. Two-Fluid Molten-Salt Breeder Reactor Design Study (Status as of January 1, 1968); Oak Ridge National Laboratory: Oak Ridge, TN, USA, 1970. [CrossRef] [Scilit]
  24. Cui, Y.; Cui, L.; Xia, S.P.; Chen, J.G.; Cai, X.Z. Dynamic analysis for a 2 MW liquid-fueled molten salt reactor. Prog. Nucl. Energy 2020, 126, 103381. [Google Scholar] [CrossRef] [Scilit]
  25. Zhang, A.; Dai, M.; Cheng, M.; Zou, C.; Chen, J. High-fidelity neutronics simulation of channel-type molten salt reactors. Nucl. Eng. Des. 2023, 401, 112063. [Google Scholar] [CrossRef] [Scilit]
  26. Delpech, M.; Dulla, S.; Garzenne, C.; Kópházi, J.; Křepel, J.; Lebrun, C.; Lecarpentier, D.; Mattioda, F.; Ravetto, P.; Rineiski, A.; et al. Benchmark of Dynamic Simulation Tools for Molten Salt Reactors; OECD/NEA: Paris, France, 2003. [Google Scholar]
  27. Li, Z.; Cai, J. Dynamics analysis of the graphite-moderated channel-type molten salt reactors based on Serpent/NTH3D-MSR. Ann. Nucl. Energy 2018, 121, 128–134. [Google Scholar] [CrossRef] [Scilit]
  28. Krepel, J.; Grundmann, U.; Rohde, U.; Weiss, F.P. DYN1D-MSR dynamics code for molten salt reactors. Ann. Nucl. Energy 2005, 32, 1799–1824. [Google Scholar] [CrossRef] [Scilit]
  29. Křepel, J.; Rohde, U.; Grundmann, U.; Weiss, F.P. DYN3D-MSR spatial dynamics code for molten salt reactors. Ann. Nucl. Energy 2006, 34, 449–462. [Google Scholar] [CrossRef] [Scilit]
  30. Xu, H. Thorium Energy and Molten Salt Reactor R&D in China. In Thorium Energy for the World; Springer: Berlin/Heidelberg, Germany, 2016; pp. 37–44. [Google Scholar]
Figure 1. Flowchart of the RESTA-3D.
Energies 19 00964 g001
Figure 2. Radial core layout (a), fuel block (b), control rod block (c), sample basket (d), axial core layout (e) of the MSRE model [25].
Energies 19 00964 g002
Figure 3. Temperature distributions of fuel salt and graphite in the hottest channel of MSRE.
Energies 19 00964 g003
Figure 4. Control rod worth curve of the MSRE.
Energies 19 00964 g004
Figure 5. Reactivity evolution and inlet fuel flow change during pump start-up of MSRE.
Energies 19 00964 g005
Figure 6. Reactivity evolution and inlet fuel flow change during pump coast-down of MSRE.
Energies 19 00964 g006
Figure 7. Fuel mass flow rate and inlet fuel temperature in the MOST benchmark.
Energies 19 00964 g007
Figure 8. Power history during 360 min of the natural circulation experiment and comparison with the MSRE experiment results.
Energies 19 00964 g008
Figure 9. Radial configuration (a), fuel assembly (b), control rod (c), axial configuration (d) of the 2 MWth TMSR.
Energies 19 00964 g009
Figure 10. Core response in transient of unprotected overcooling inlet fuel temperature at zero power (a), nominal power (b).
Energies 19 00964 g010
Figure 11. Core response in transient of unprotected overheating inlet fuel temperature at zero power (a), nominal power (b).
Energies 19 00964 g011
Figure 12. Fuel flow changing curve during start-up and coast-down.
Energies 19 00964 g012
Figure 13. Core power response in transient of unprotected pump start-up at zero power.
Energies 19 00964 g013
Figure 14. Core power (a) and temperature (b) response in transient of unprotected pump coast-down at zero power.
Energies 19 00964 g014
Table 1. Main parameters of the MSRE.
ParametersValues/Correlations
Core power (MWth)8
Core fuel salt composition (mol%)65% LiF-29.2% BeF2-5.0% ZrF4-0.8% UF4
235U enrichment32%
7Li enrichment99.995%
Outer radius of active core (cm)71.12
Active core height (cm)165
Upper plenum height (cm)24.468
Lower plenum height (cm)20.224
Reactor vessel thickness (cm)2.8448
Number of graphite assembly618
Number of molten salt channels1150
Inlet   mass   flow   rate   ( kg · s−1)187.5
Fuel   salt   density   ( g · cm−3) 2.263 ×   [ 1     2.12   ×   10     4 × (Tf − 923.15)]
Inlet temperature (K)908
Table 2. DNP loss of MSRE loaded with 235U fuel at the zero power steady-state.
Institutions/
Code
DNP Loss (pcm)
Total123456
EDF207.612.865.655.371.42.50.0
ENEA234.514.976.262.977.92.90.0
TMSR3D250.316.191.067.468.16.41.3
MOREL246.313.688.867.773.62.50.0
POLITO251.717.084.665.580.44.00.1
FZR223.010.274.660.575.12.60.0
RESTA-3D206.89.965.152.474.23.41.8
Table 3. keff and temperature reactivity coefficients of MSRE loaded with 235U fuel.
Institutions/
Codes
keffCoefficients for 235U System (pcm/K)
GraphiteSaltTotal
MSRE −4.7−8.5−13.2
ORNL −7.3−7.5−14.8
BUTE1.05980−4.8−6.2−11.0
ENEA1.07513−4.3−6.8−11.1
EDF1.06752−4.6−7.8−12.4
FZR1.06966−4.0−6.9−10.9
POLITO1.07060−3.8−6.3−10.1
TMSR3D1.06139−4.6−7.5−12.1
RESTA-3D1.06812−4.2−6.7−11.9
Table 4. Main parameters of the 2 MWth TMSR.
ParametersValues/Correlations
Core power (MWth)2
Core fuel salt composition (mol%)68%LiF-28% BeF2-0.1% ThF4-3.9% UF4
235U enrichment16%
7Li enrichment99.95%
Outer radius of active core (cm)55
Active core height (cm)110
Upper plenum height (cm)7.09
Lower plenum height (cm)18.90
Radial dimensions of graphite block (cm)5.1
Inlet   mass   flow   rate   ( kg · s−1)55.0
Inlet/Outlet temperature (K)873/893
Disclaimer/Publisher’s Note: The statements, opinions and data contained in all publications are solely those of the individual author(s) and contributor(s) and not of MDPI and/or the editor(s). MDPI and/or the editor(s) disclaim responsibility for any injury to people or property resulting from any ideas, methods, instructions or products referred to in the content.