Article

Multi-Dimensional Effect Analysis of Policy Synergy Degree of China’s Coal Capacity Governance Based on the Hierarchical Linear Model
1
School of Management Engineering, Xuzhou University of Technology, Xuzhou 221018, China
2
School of Mechanics & Civil Engineering, China University of Mining and Technology, Xuzhou 221018, China
*
Author to whom correspondence should be addressed.
Energies 2026, 19(4), 902; https://doi.org/10.3390/en19040902
Submission received: 12 December 2025 / Revised: 27 January 2026 / Accepted: 29 January 2026 / Published: 9 February 2026

Abstract

Achieving a secure and stable energy supply while steadily advancing the dual-carbon goals constitutes a dual strategic task for China’s sustainable development. Capacity governance policies serve as an effective tool for the government to regulate industrial capacity, facilitating a balance between supply and demand through interventions on both the production and consumption sides. As a fundamental energy source in China, coal capacity governance policies involve complexity and span multiple domains, with their effectiveness relying on synergy across different levels and departments. Using a hierarchical linear model, this study examines the specific impacts of policy synergy in capacity governance—from both the central and local government perspectives—on local economic, environmental, and social outcomes. The findings indicate that policy synergy at the central level yields significant economic and social benefits, while its environmental benefits remain less evident. In contrast, policy synergy at the local level demonstrates significant positive effects across all three dimensions: economic, environmental, and social. By quantitatively assessing the tiered differences in the multidimensional benefits of policy synergy, this study provides a scientific basis and theoretical support for both central and local governments to pursue maximized economic, environmental, and social benefits.

1. Introduction

As a fundamental energy source in China, the supply and demand of coal are influenced by multiple factors, rendering it difficult to achieve synchronized growth or decline. A certain level of imbalance between coal supply and demand can be automatically mitigated by the “invisible hand” of the market. However, government intervention becomes necessary when such imbalance exceeds a certain threshold [1]. As an effective instrument for capacity adjustment, coal capacity governance policies play a pivotal role in balancing coal supply and demand. Nevertheless, within China’s institutional context characterized by fragmented sectors and departments, the goals, measures, and safeguards of these policies differ across various levels of government and departments. The effectiveness of policy implementation is affected not only by the policies themselves but also by the hindering, complementary, hedging, or cumulative effects between these policies and other relevant policies [2]. The impact of capacity governance policies is characterized by multidimensionality and complexity, given that their implementation typically depends on inter-departmental and inter-level synergies.
The formulation of the “Dual-Carbon Strategic Goal” signals China’s intention to gradually reduce the share of fossil fuels—particularly coal—in its energy mix. Nonetheless, as the nation’s dominant energy source, coal is expected to continue serving as a “stabilizer” and “ballast stone” for securing a safe and stable energy supply in the foreseeable future [3]. Amid the dual pressures of advancing carbon peaking and neutrality while ensuring energy security and stable supply, it is imperative to establish mechanisms for information sharing, policy coordination, and joint decision-making among central and local governments as well as across different departments. Such mechanisms would help maintain the consistency and coherence of capacity governance policies throughout their formulation and implementation. Against this backdrop, a systematic and quantitative assessment of the mechanisms and effects of coal capacity governance policy synergy gains particular significance. This evaluation would not only shed light on the synergistic outcomes of coal industry capacity policies but also offer valuable insights and references for the scientific management of capacity in other industrial sectors.
Existing research on the analysis of policy synergy effects remains relatively scarce, and the limited available literature exhibits certain limitations, which manifest themselves primarily in the following three aspects. First and foremost, the extant literature focuses predominantly on qualitative analysis and case studies (e.g., [4]). Such studies typically analyze policy synergy effects based on the most recent data or current conditions. While they have laid a certain theoretical foundation and provided insights for the optimization and design of coal capacity governance policies, the research findings lack sufficient scientific rigor and empirical data support, and their timeliness and applicability warrant further scrutiny. Secondly, only a small subset of studies conducts quantitative analysis on policy synergy effects (e.g., [5]). However, these quantitative studies primarily explore the economic impacts of policy synergy from a unidimensional perspective—such as production output, prices, and efficiency—failing to consider environmental effects (e.g., work safety and green development levels) and social effects (e.g., employee welfare). This omission neglects the core objective of “quality improvement and efficiency enhancement” in capacity governance, resulting in inaccurate, incomplete, and unscientific evaluations of policy coordination effects. Finally, existing research predominantly adopts single-level analytical models to examine policy synergy effects, which contradicts the inherent goal inconsistencies between the central and local governments. Consequently, it is challenging to accurately capture the multi-dimensional impacts of policy synergy between the central and local governments within the context of China’s political centralization and economic decentralization.
Given the limitations of existing research, this study focuses on coal capacity governance policy documents issued between 2009 and 2020. Using panel data from ten major coal-producing provinces in China, it employs a Hierarchical Linear Model (HLM) to quantitatively assess the mechanisms and effects of the Synergy Degree of Governance Policies (SDGP) in coal capacity governance across three dimensions: economic, environmental, and social benefits. The marginal contributions of this study are primarily reflected in the following two aspects: First, in terms of analytical dimensions, we move beyond the previous narrow focus on economic outcomes by constructing—for the first time—a comprehensive evaluation framework that incorporates economic, environmental, and social benefits. This approach not only better aligns with the multi-objective orientation of China’s capacity governance, which emphasizes “quality improvement and efficiency enhancement,” but also renders the assessment of policy synergy effects more systematic and holistic. Second, methodologically, while existing quantitative studies have predominantly relied on single-level models, they often overlook the differing objectives and behavioral patterns between central and local governments during policy implementation. By introducing the HLM, this study effectively captures the heterogeneity of policy synergy effects across different governmental levels, thereby offering a more accurate depiction of the complex operational mechanisms of policy synergy within China’s distinctive governance structure. Overall, this research not only enriches the theoretical framework of policy synergy but also provides robust theoretical support for central and local governments to jointly maximize economic, environmental, and social benefits.

2. Literature Review and Theoretical Analysis

2.1. Coal Capacity Governance Policies

Capacity governance encompasses two core dimensions: overcapacity governance and under-capacity governance, with its primary focus on addressing supply-demand imbalances within an industry. Its priorities shift dynamically in response to national policy adjustments, market fluctuations, and industrial development trends. Back in 2016, severe overcapacity plagued multiple industries across China, particularly the steel and coal sectors. In response, both the central and local governments rolled out a suite of targeted policies to curb redundant capacity, where phasing out backward production capacity and incentivizing mergers and acquisitions emerged as pivotal approaches to resolving the overcapacity issue. As the industrial governance paradigm evolves, the core contradictions facing the industry have also undergone corresponding shifts [6]. In December 2022, the Central Committee of the Communist Party of China and the State Council issued the Strategic Planning Outline for Expanding Domestic Demand (2022–2035), mandating the integrated implementation of the domestic demand expansion strategy and the deepening of supply-side structural reform.
As the “ballast stone” and “stabilizer” of China’s energy sector, both the coal supply side and the demand side have received the attention of the Chinese government, and the country has successively introduced a large number of policies to ensure the orderly development of the coal industry. By systematically analyzing the relevant policy in the field of coal production and consumption since 2009, national coal capacity governance policies can be categorized into three characteristic types: encouraging mergers and reorganizations, resolving excess production capacity, and emphasizing safety and security of supply, as shown in Appendix A.

2.2. Theoretical Explanation of Policy Synergy Mechanism

The policy synergy theory posits that, under the guidance of shared goals, government departments ought to achieve mutual coordination and collaboration in terms of policy objectives, instruments, and measures throughout the entire process—from policy formulation to implementation. This coordinated approach serves to mitigate organizational conflicts and maximize overall policy benefits [3,7]. Against the backdrop of China’s current fiscal power allocation system, fiscal power has been gradually centralized, while fiscal resources are unevenly distributed across different government departments [8]. Consequently, the resource mobilization capacity of a single department at a single administrative level pales in comparison to the combined capacity of multi-departmental and multi-level collaborative bodies. For the coal industry in particular, the impacts of capacity governance policies are cross-cutting and intricate by nature. A single department is rarely capable of independently fulfilling such cross-cutting and complex tasks; instead, multi-level and multi-departmental collaboration is imperative throughout the full cycle from policy design to execution. Only by integrating resources across all levels and departments can robust support be secured for coal capacity governance initiatives. As the policy synergy theory illustrates, only by developing mutually aligned and complementary policies can we facilitate environmental optimization, sustain long-term economic development, and ensure people’s living and working in peace and contentment [9].
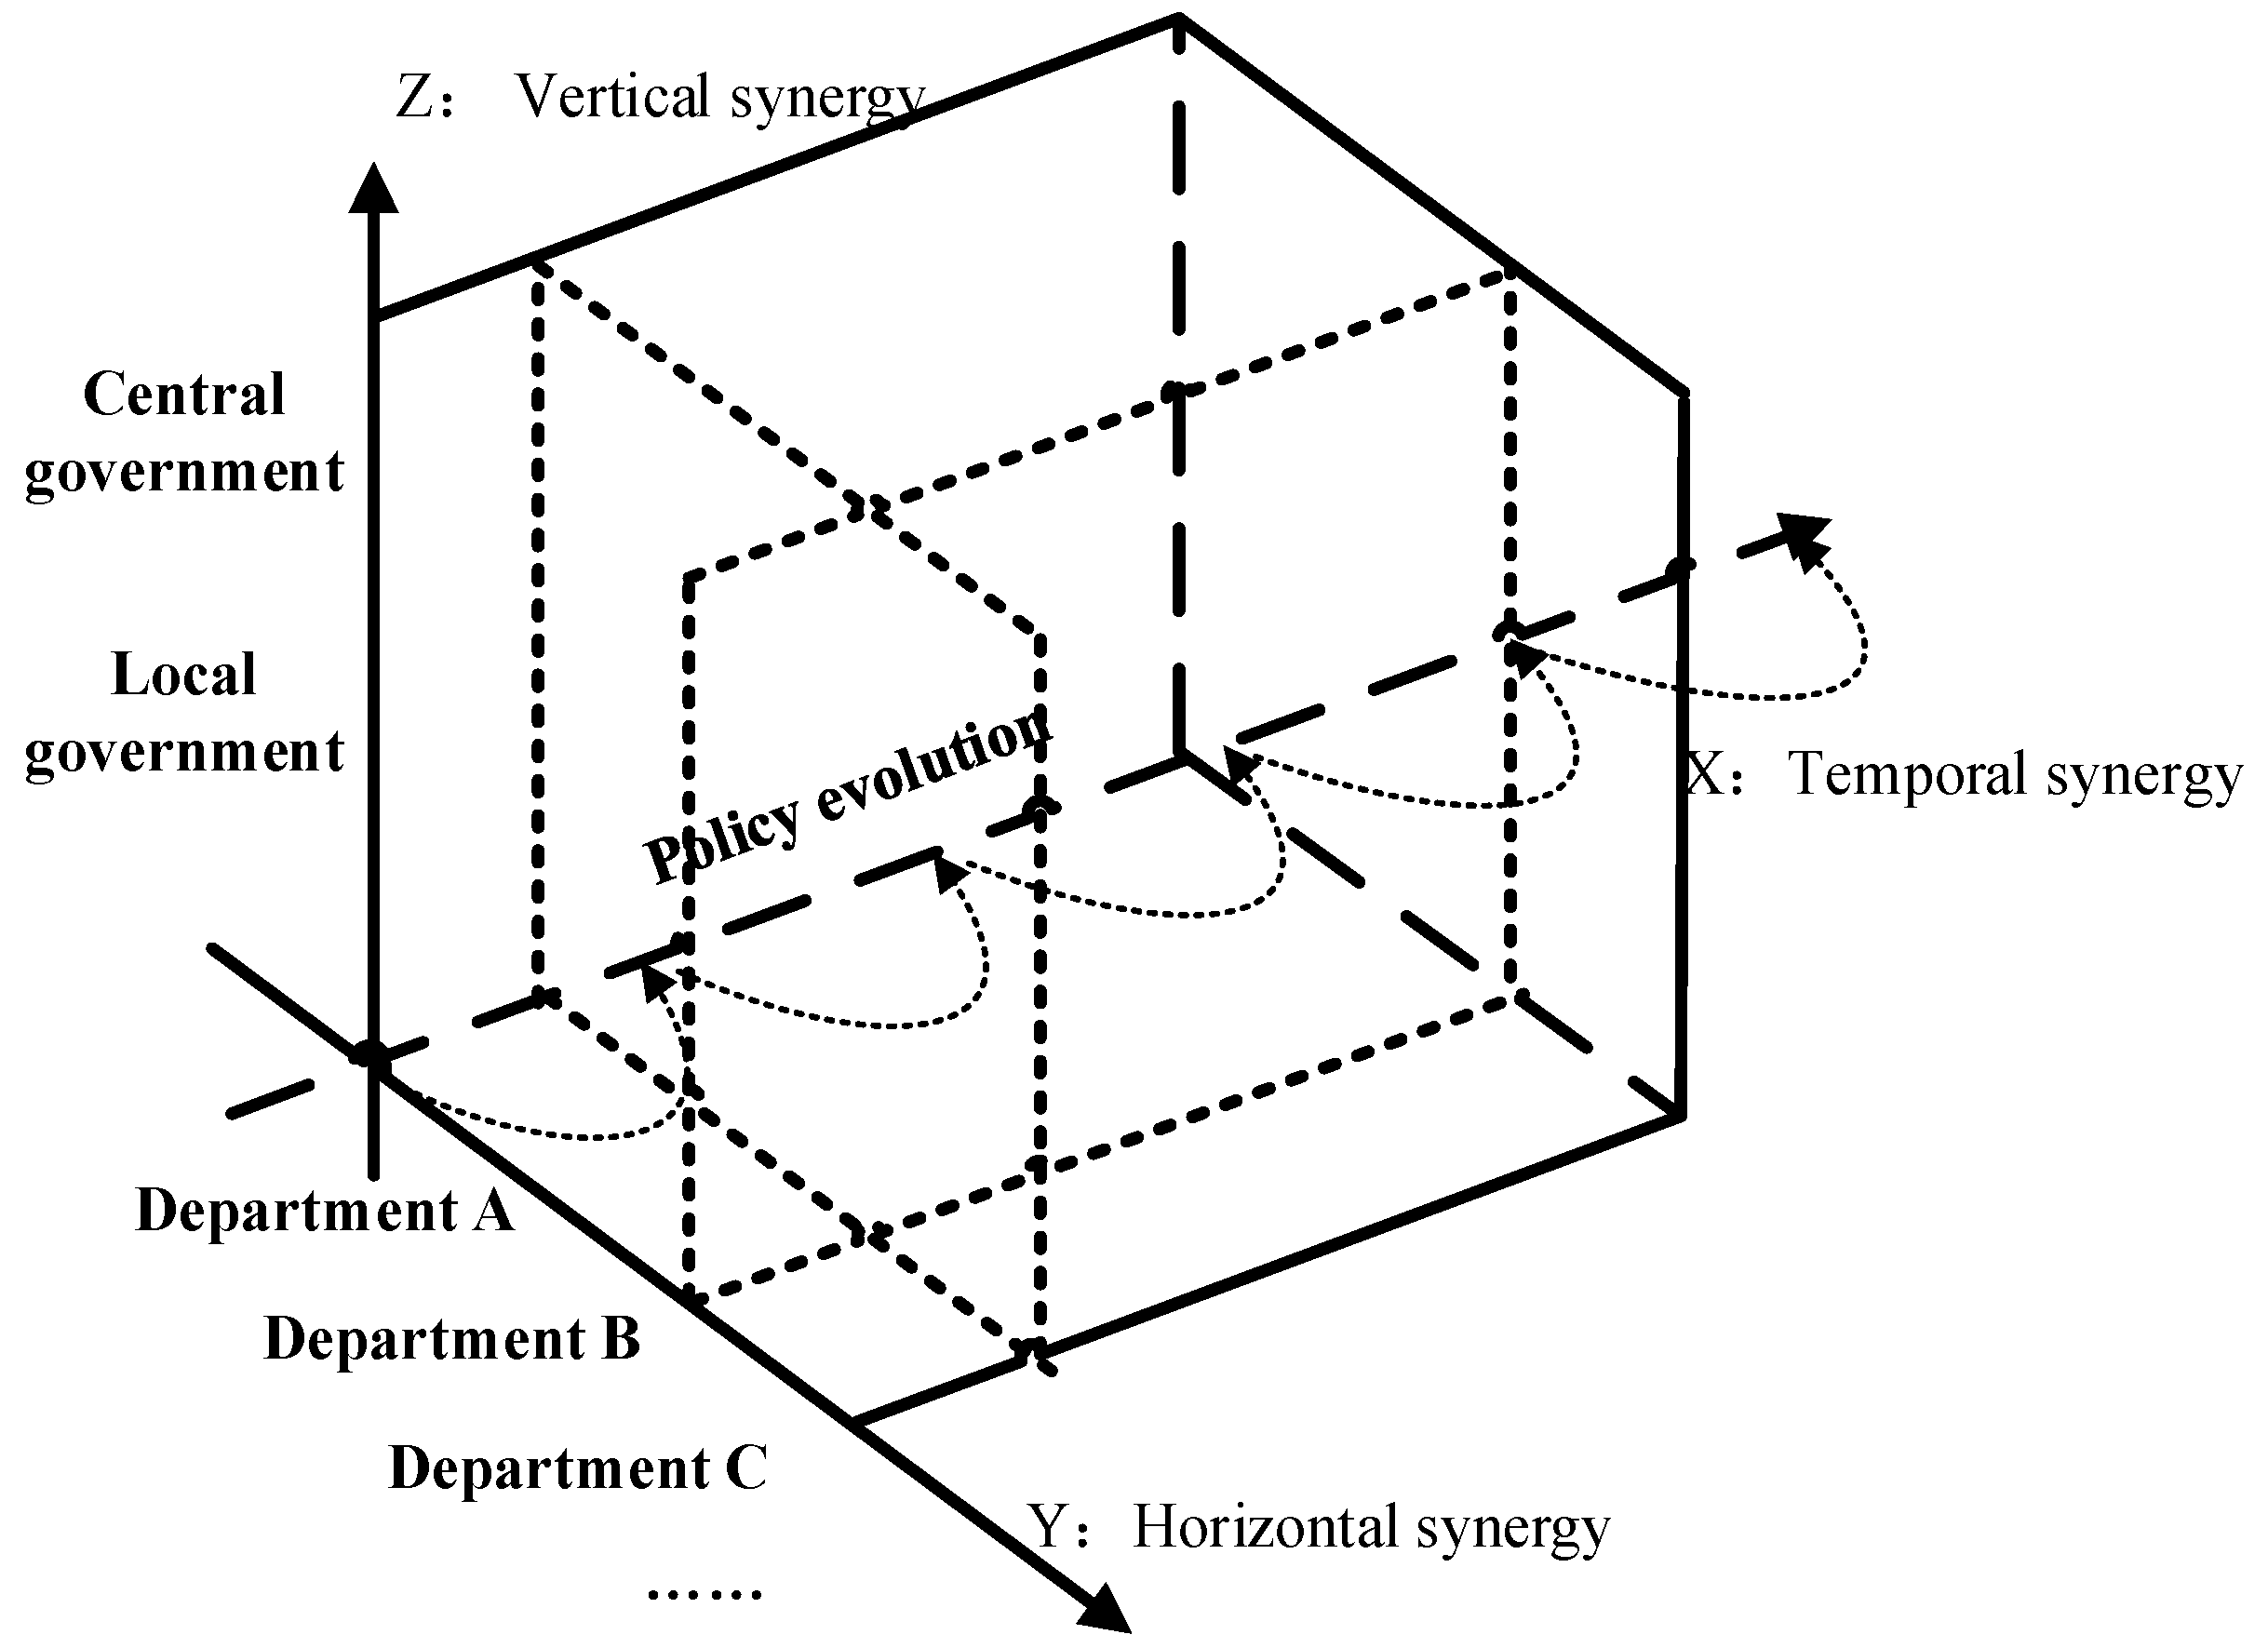
Compared to capacity governance policies formulated by individual departments, policy synergy is examined across three distinct dimensions: the horizontal synergy degree of governance policies (HSDGP), the vertical synergy degree of governance policies (VSDGP), and the temporal synergy degree of governance policies (TSDGP). Figure 1 presents the framework for assessing policy synergy. Horizontal synergy refers to the mutual support and information transfer between departments at the same level [7]. Coal capacity governance involves areas such as economic development, environmental protection, industrial structure adjustment, and employee placement. If policies are formulated only from a single perspective of a certain department, the goals may be too narrow to take into account other areas. For example, the financial department pays attention to the distribution of assets and debts; the human resources and social security department pays more attention to employee placement and social stability; the financial department can provide policy recommendations for the implementation of financial guarantees; the industry and information department can provide transformation support for backward production capacity. This is determined by the government characteristics of a “departmental union”, which means each department is very familiar with and attaches great importance to affairs within its business scope, but its familiarity with and attention to affairs outside its business scope will be greatly reduced [10]. The horizontal synergy of production capacity governance policies can effectively overcome those shortcomings, achieve target optimization, and enhance the scientific nature of policies.
Vertical synergy aims to ensure that lower-level policies are consistent with the original intent of higher-level policies [7]. In the project of capacity governance, the central government, as a representative of the public interest, is mainly committed to optimizing the industrial structure to ensure sustainable economic and environmental development. However, local governments have more diverse goals than the central government. Economic development is the most critical task for regions heavily dependent on the coal industry, and environmental protection and improving people’s livelihoods are more critical for the eastern coastal areas with better economic development. Through the vertical synergy of policy, the upper and lower departments will jointly participate in the policy formulation and implementation process. The leading department will solicit professional opinions from cooperating departments by means of soliciting opinions and constantly revise and improve the policy rules [3]. For example, according to statistical reports, Shanxi Province will reduce coal production capacity by 134 million tons within five years starting from 2016, involving 118,000 coal enterprise employees. The employment and placement of employees have become the key and difficult points in the work of reducing production capacity. Focusing on how to resettle employees, under the lead of the State Council, Shanxi Province can take the initiative to conduct policy consultations with the central government according to its own economic, environmental, and people’s livelihood and other realities. The policy text finalized after consultation will help reduce the superimposed effects of ineffective interventions by the central government and local governments. Its breadth and depth will definitely far exceed the “one size fits all” production capacity management policy and will have a beneficial impact on the regional economy, environment, and society.
Temporal synergy refers to ensuring that today’s policies will continue to be effective for the foreseeable future [7]. Temporal synergy promotes the orderly upgrading and patching of policies in capacity governance. Policy consistency and coherence are essential for the achievement of policy goals. The fact that China is a major energy producer and consumer will continue to exist in the short term. The central and local governments should deeply understand the long-term and arduous nature of coal capacity management and clarify the effectiveness and continuity of capacity governance policies. At the same time, the governance of coal production capacity should be incorporated into all stages of social development to promote sustainable economic development and enhance social stability.
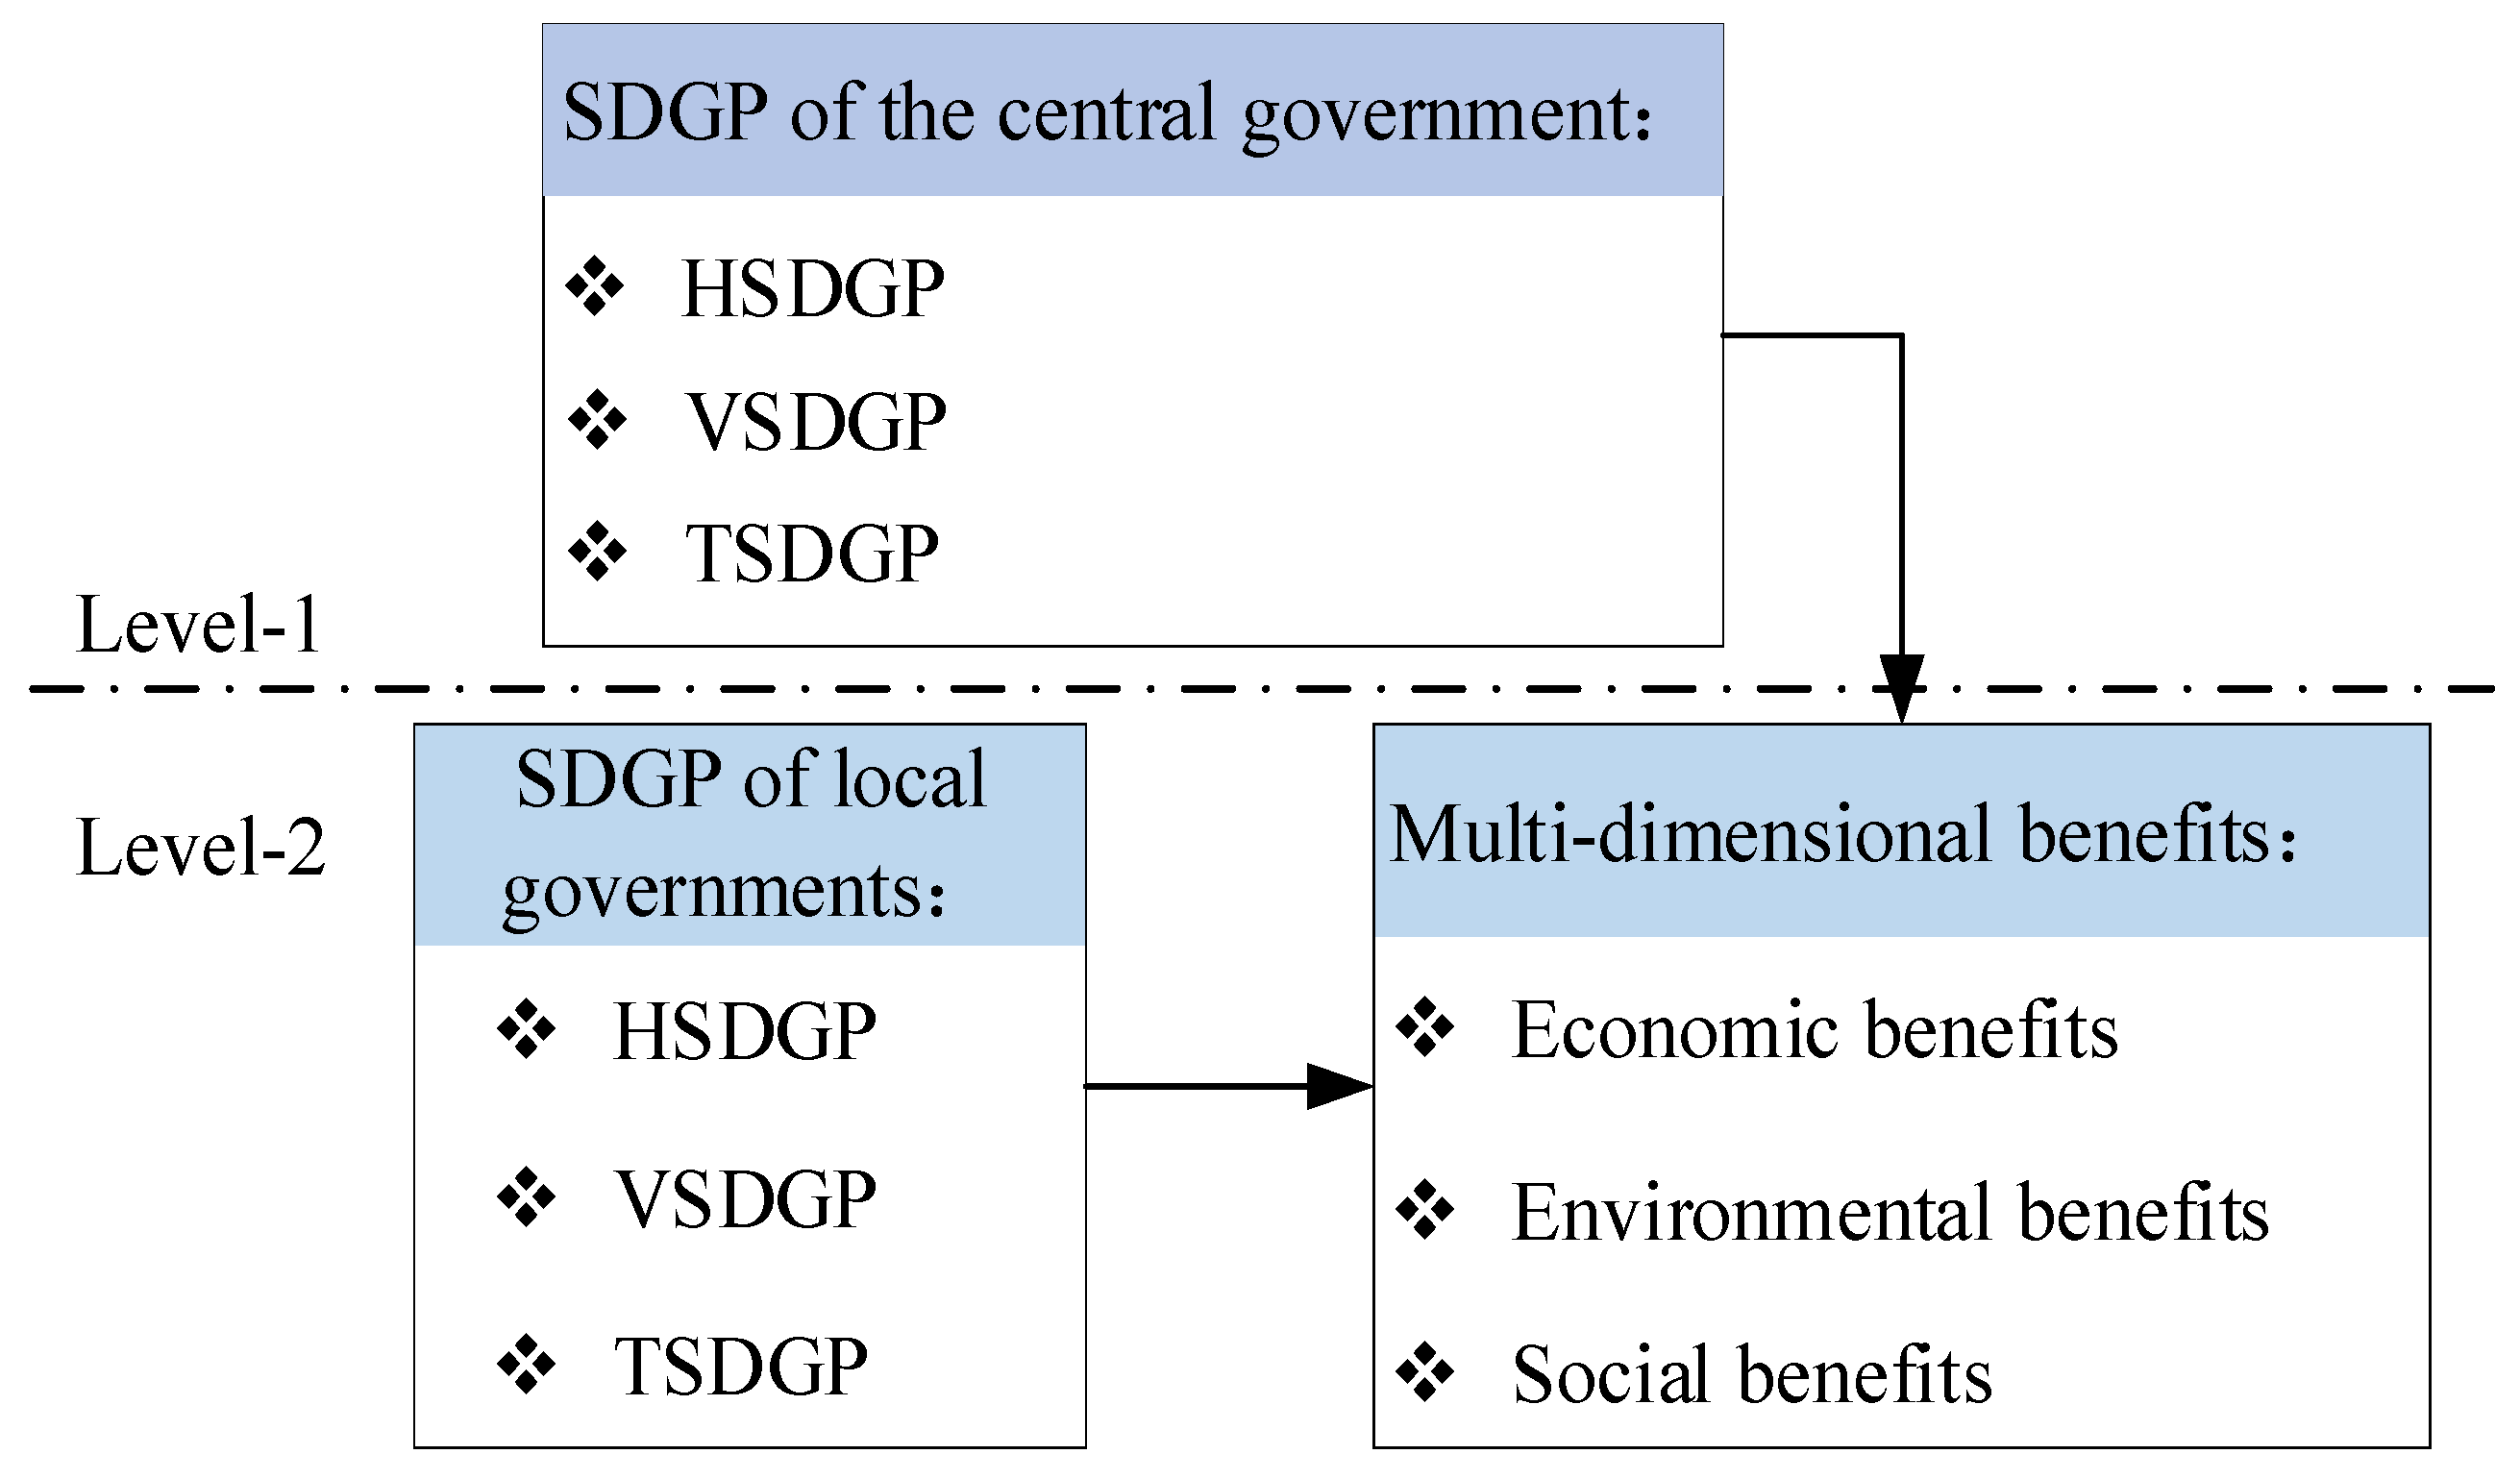
China’s administrative management model presents a typical nested structure, and the overall environment or environmental changes in the upper structure will affect the development of the lower structure. The local economy, environment, and society will be affected not only by the SDGP of local governments but also by the SDGP of the central government. Therefore, this study explores the influence of independent variables on dependent variables from local and central levels. Among them, the SDGP of both the central government and local governments consists of three dimensions: HSDGP, VSDGP, and TSDGP. Therefore, the conceptual model of the multi-dimensional effect discussion on the degree of the synergy of China’s coal capacity governance policies is shown in Figure 2.
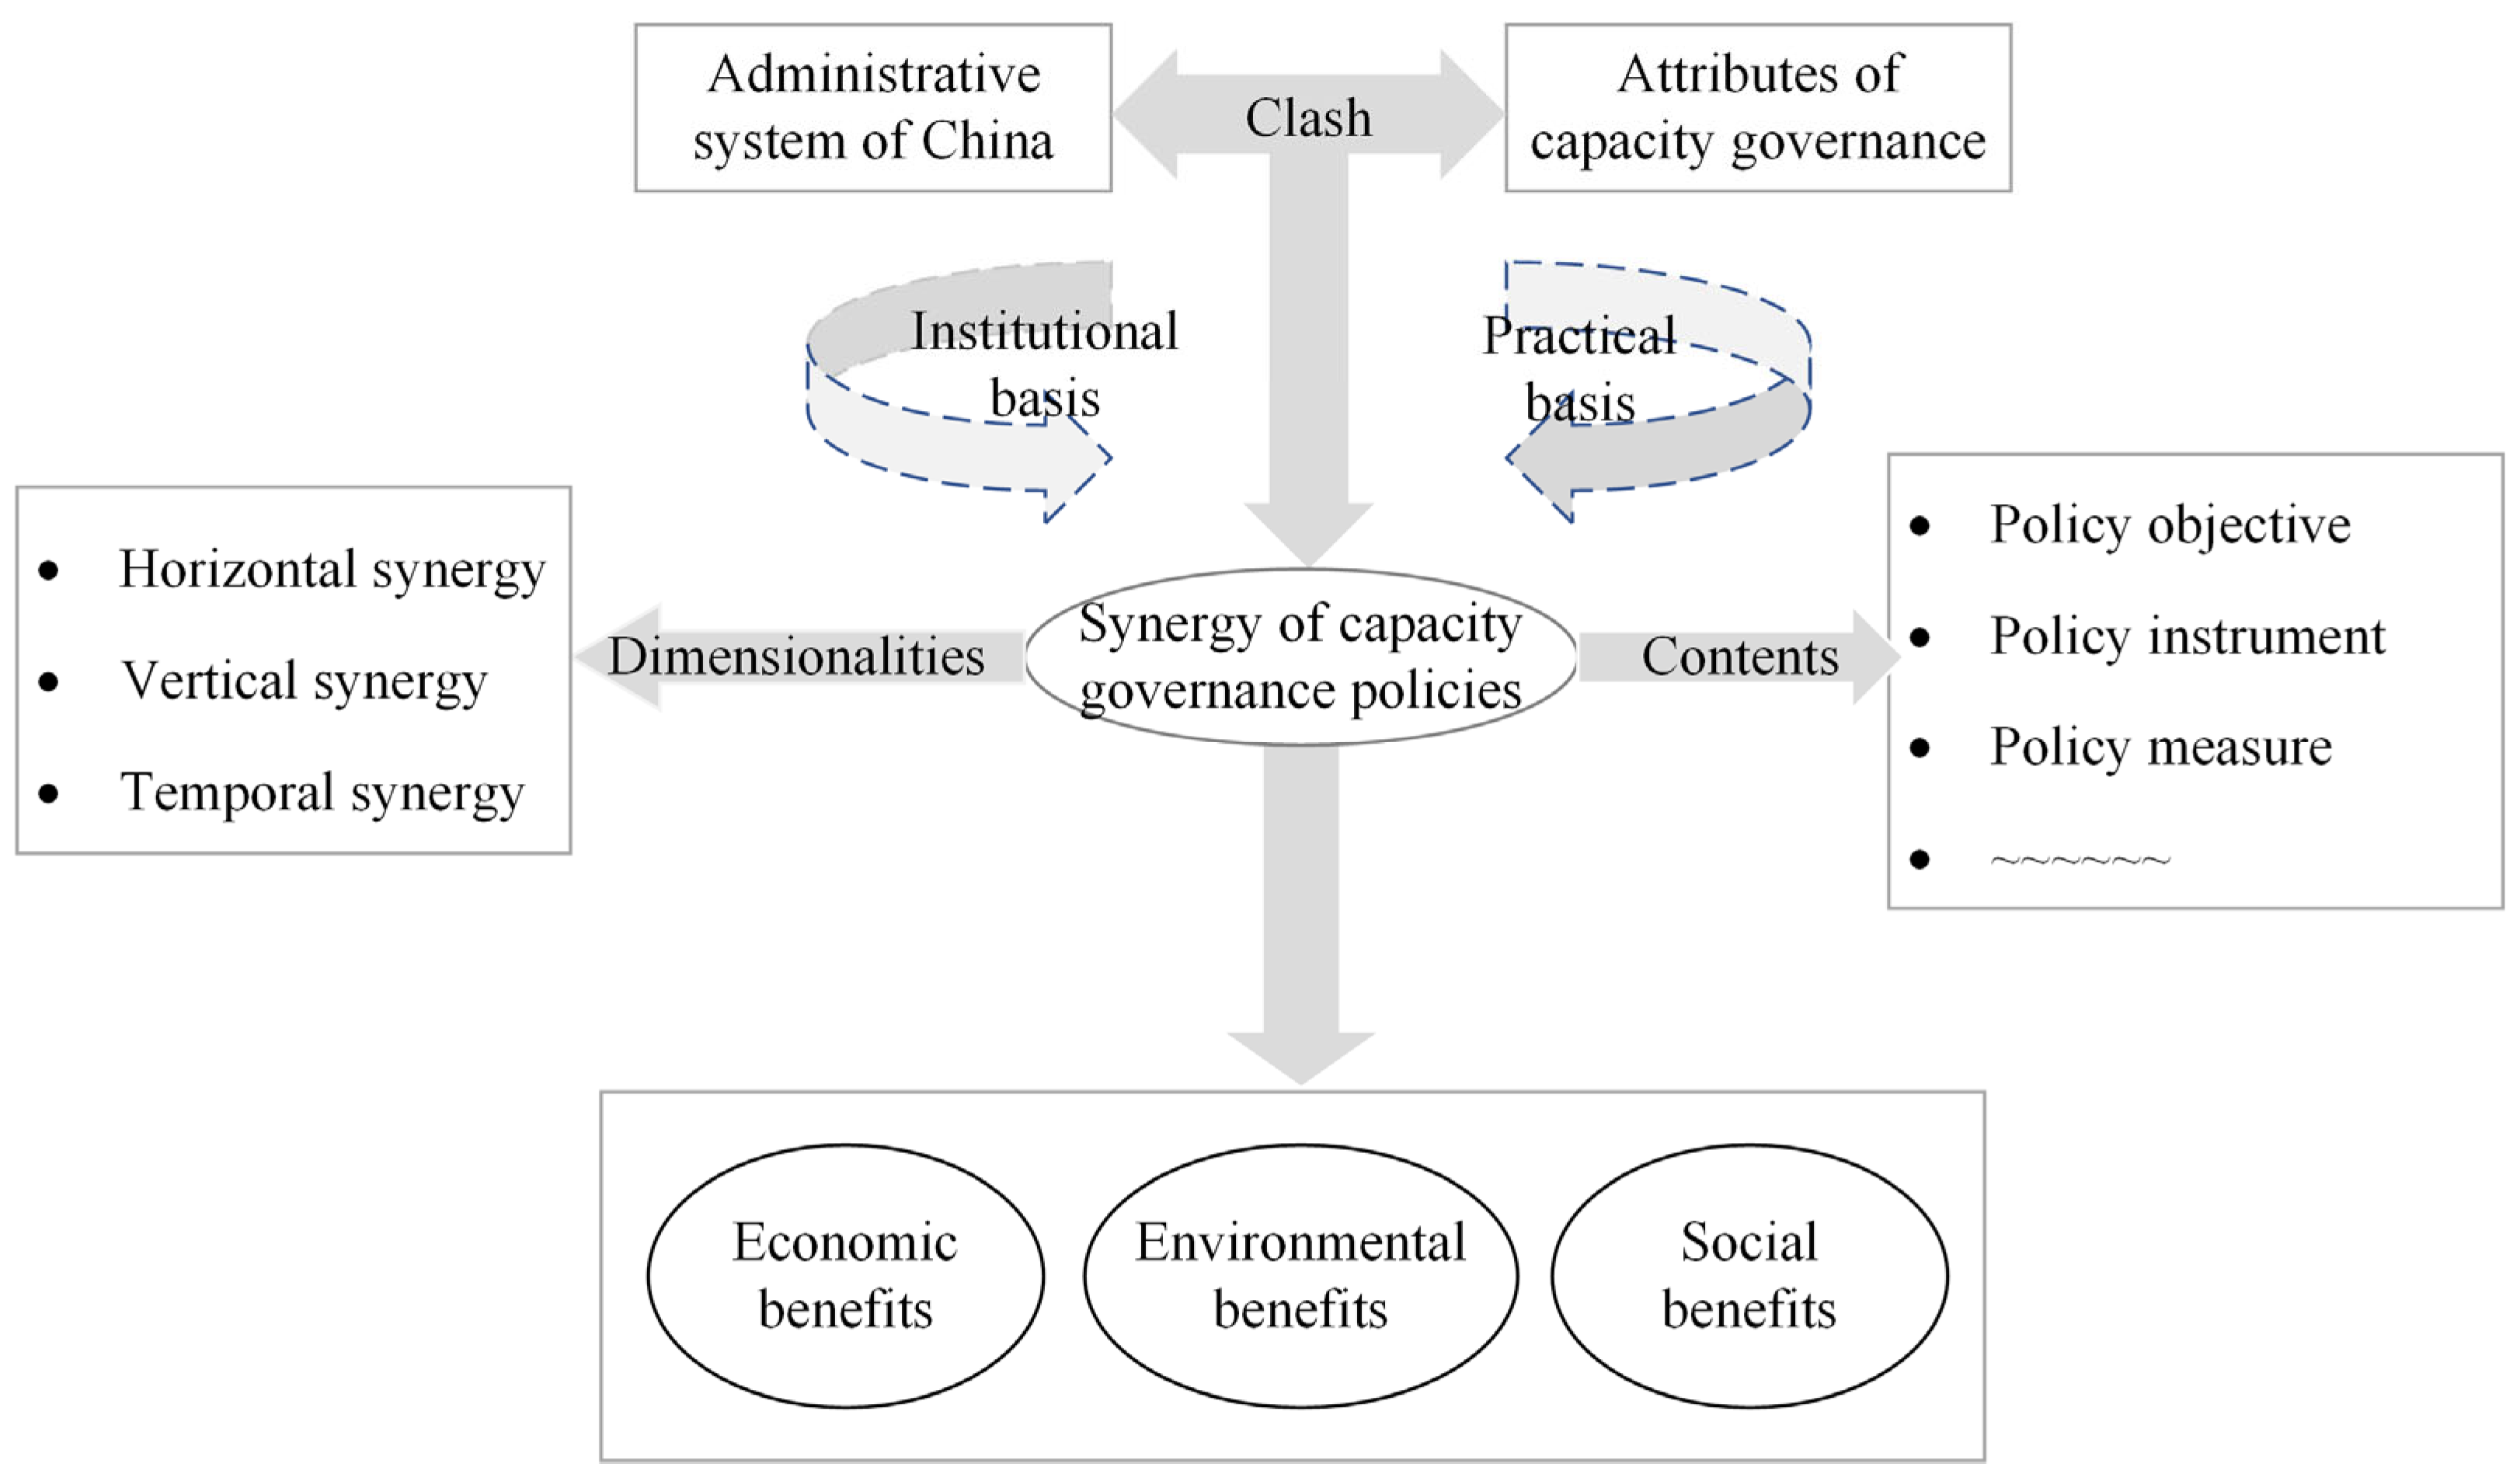
To sum up, the impact mechanism of SDGP on the local economy, environment, and society can be expressed in Figure 3. The administrative system of segmentation and division of departments constitutes the institutional basis for the synergy of capacity governance policies, and the attributes of coal productivity governance constitute the practical basis for the synergy of capacity governance policies. The multi-field and multi-stage nature of capacity governance work determines that capacity governance policies go beyond the boundaries of existing policy areas and the responsibilities of individual departments. If we only emphasize a certain level and a certain stage of policy, it may be unfavourable to the sustainable development of the economy, environment, and society and the effective promotion of capacity management.

3. Study Design and Data Description

3.1. Variable Selection

(1)
Dependent variable
Based on the theoretical interpretation of the connotation and synergistic mechanism of the coal capacity governance policy, this study analyzes the policy’s synergistic mechanism and effect from three aspects: economic, environmental, and social benefits.
Economic benefits refer to benefits or effects achieved through effective capacity governance and policy coordination. This study selects three indicators of the ratio of profits to cost (RPC), capacity utilization rate (CUR), and total factor productivity growth rate (TFPGR) to measure the economic benefits of SDGP in the coal industry. Among them, RPC is the ratio of total profit to total cost, which reflects the relationship between cost and profit in the coal industry. TFPGR is an excellent index to measure the improvement of production capacity or technological change, which can truly reflect the efficiency of transforming the overall economic input into output. CUR can be used to measure the level of overcapacity in the coal industry.
Environmental benefit refers to the effect of environmental protection and sustainable development through effective capacity governance and policy cooperation. This study selects the two indicators of coal-production energy consumption (CPEC) and investment in industrial pollution control (IIPC) to measure the environmental benefits of SDGP in the coal industry. Among them, CPEC uses standard coal to represent the various energy consumed in the production of raw coal. The lower the CPEC, the less energy is consumed in the production of raw coal and the higher the environmental benefits of the industry [11]. IIPC serves as a core indicator for measuring the annual industrial pollution control expenditures across provinces, and its fluctuations are closely linked to regional ecological and environmental quality. An isolated observation of a decline in this indicator may lead to dual interpretations: on the one hand, it may reflect improved pollution control efficiency or industrial structure optimization, resulting in reduced emissions; on the other hand, it could suggest weakened environmental governance efforts or regulatory laxity. However, the period examined in this study, spanning 2009–2020, coincides with a critical phase in China’s ongoing strengthening of environmental regulatory frameworks and the deepening of the nationwide campaign against pollution. Against this policy backdrop, this study contends that the decline in IIPC should be primarily interpreted within the analytical framework of “efficiency improvement and structural transformation,” thereby contributing to a more accurate understanding of its environmental and economic implications.
Social benefits denote the promotion of social welfare and the generation of positive societal impacts derived from efficient capacity governance and policy coordination. To systematically evaluate the social benefits of coal capacity governance policies, this study adopts the death rate per million tons (DRPMT) and average annual salary of employees (AASE) as core metrics for gauging the social dividends of SDGP in the coal sector. Rational resettlement of employees and safeguarding the fundamental interests of coal workers are recognized as the linchpin of capacity governance initiatives [12]. Specifically, these two indicators perform distinct but complementary roles: the DRPMT quantifies the industry’s work safety performance, where a lower value signifies more effective safety governance and, accordingly, greater social benefits; the AASE reflects the level of labor remuneration and income security, where a higher figure indicates improved employee welfare and also mirrors the enhancement of social benefits.
(2)
Independent variables
This study explores the impact of the degree of synergy of production capacity governance policies on the economic, environmental, and social benefits of provinces and regions from the central and local levels, and the degree of synergy at each level can be divided into three dimensions: HSDGP, VSDGP, and TSDGP. VSDGP measures the alignment of policy objectives and core intentions across different levels of government; HSDGP assesses the coordination and complementarity of policy tools and action measures among peer departments; and TSDGP reflects the continuity and dynamic adaptability of policies over time. The specific measurement methods and the logical framework for constructing these indicators have been systematically elaborated in Appendix B for further reference.
(3)
Control variables
There are many factors that affect the implementation effect of production capacity government policies, but it is impossible to include all factors in the investigation atmosphere. Previous studies have shown that government intervention capacity, regional economic development level, and technical level all have an impact on the implementation effect of coal capacity governance policies [13]. Therefore, this paper chooses a characteristic index to represent the above factors according to the previous mature research. In this study, the marketization index (MI) is selected to measure the intervention ability of local governments; the GDP index (GDPI) is selected to measure the level of regional economic development; investment of R&D expenditure in industrial sectors (IRDE) is selected to measure the level of regional technological innovation.
In summary, there are seven dependent variables, three control variables, and six independent variables, as shown in Table 1.

3.2. Sample Selection and Data Source

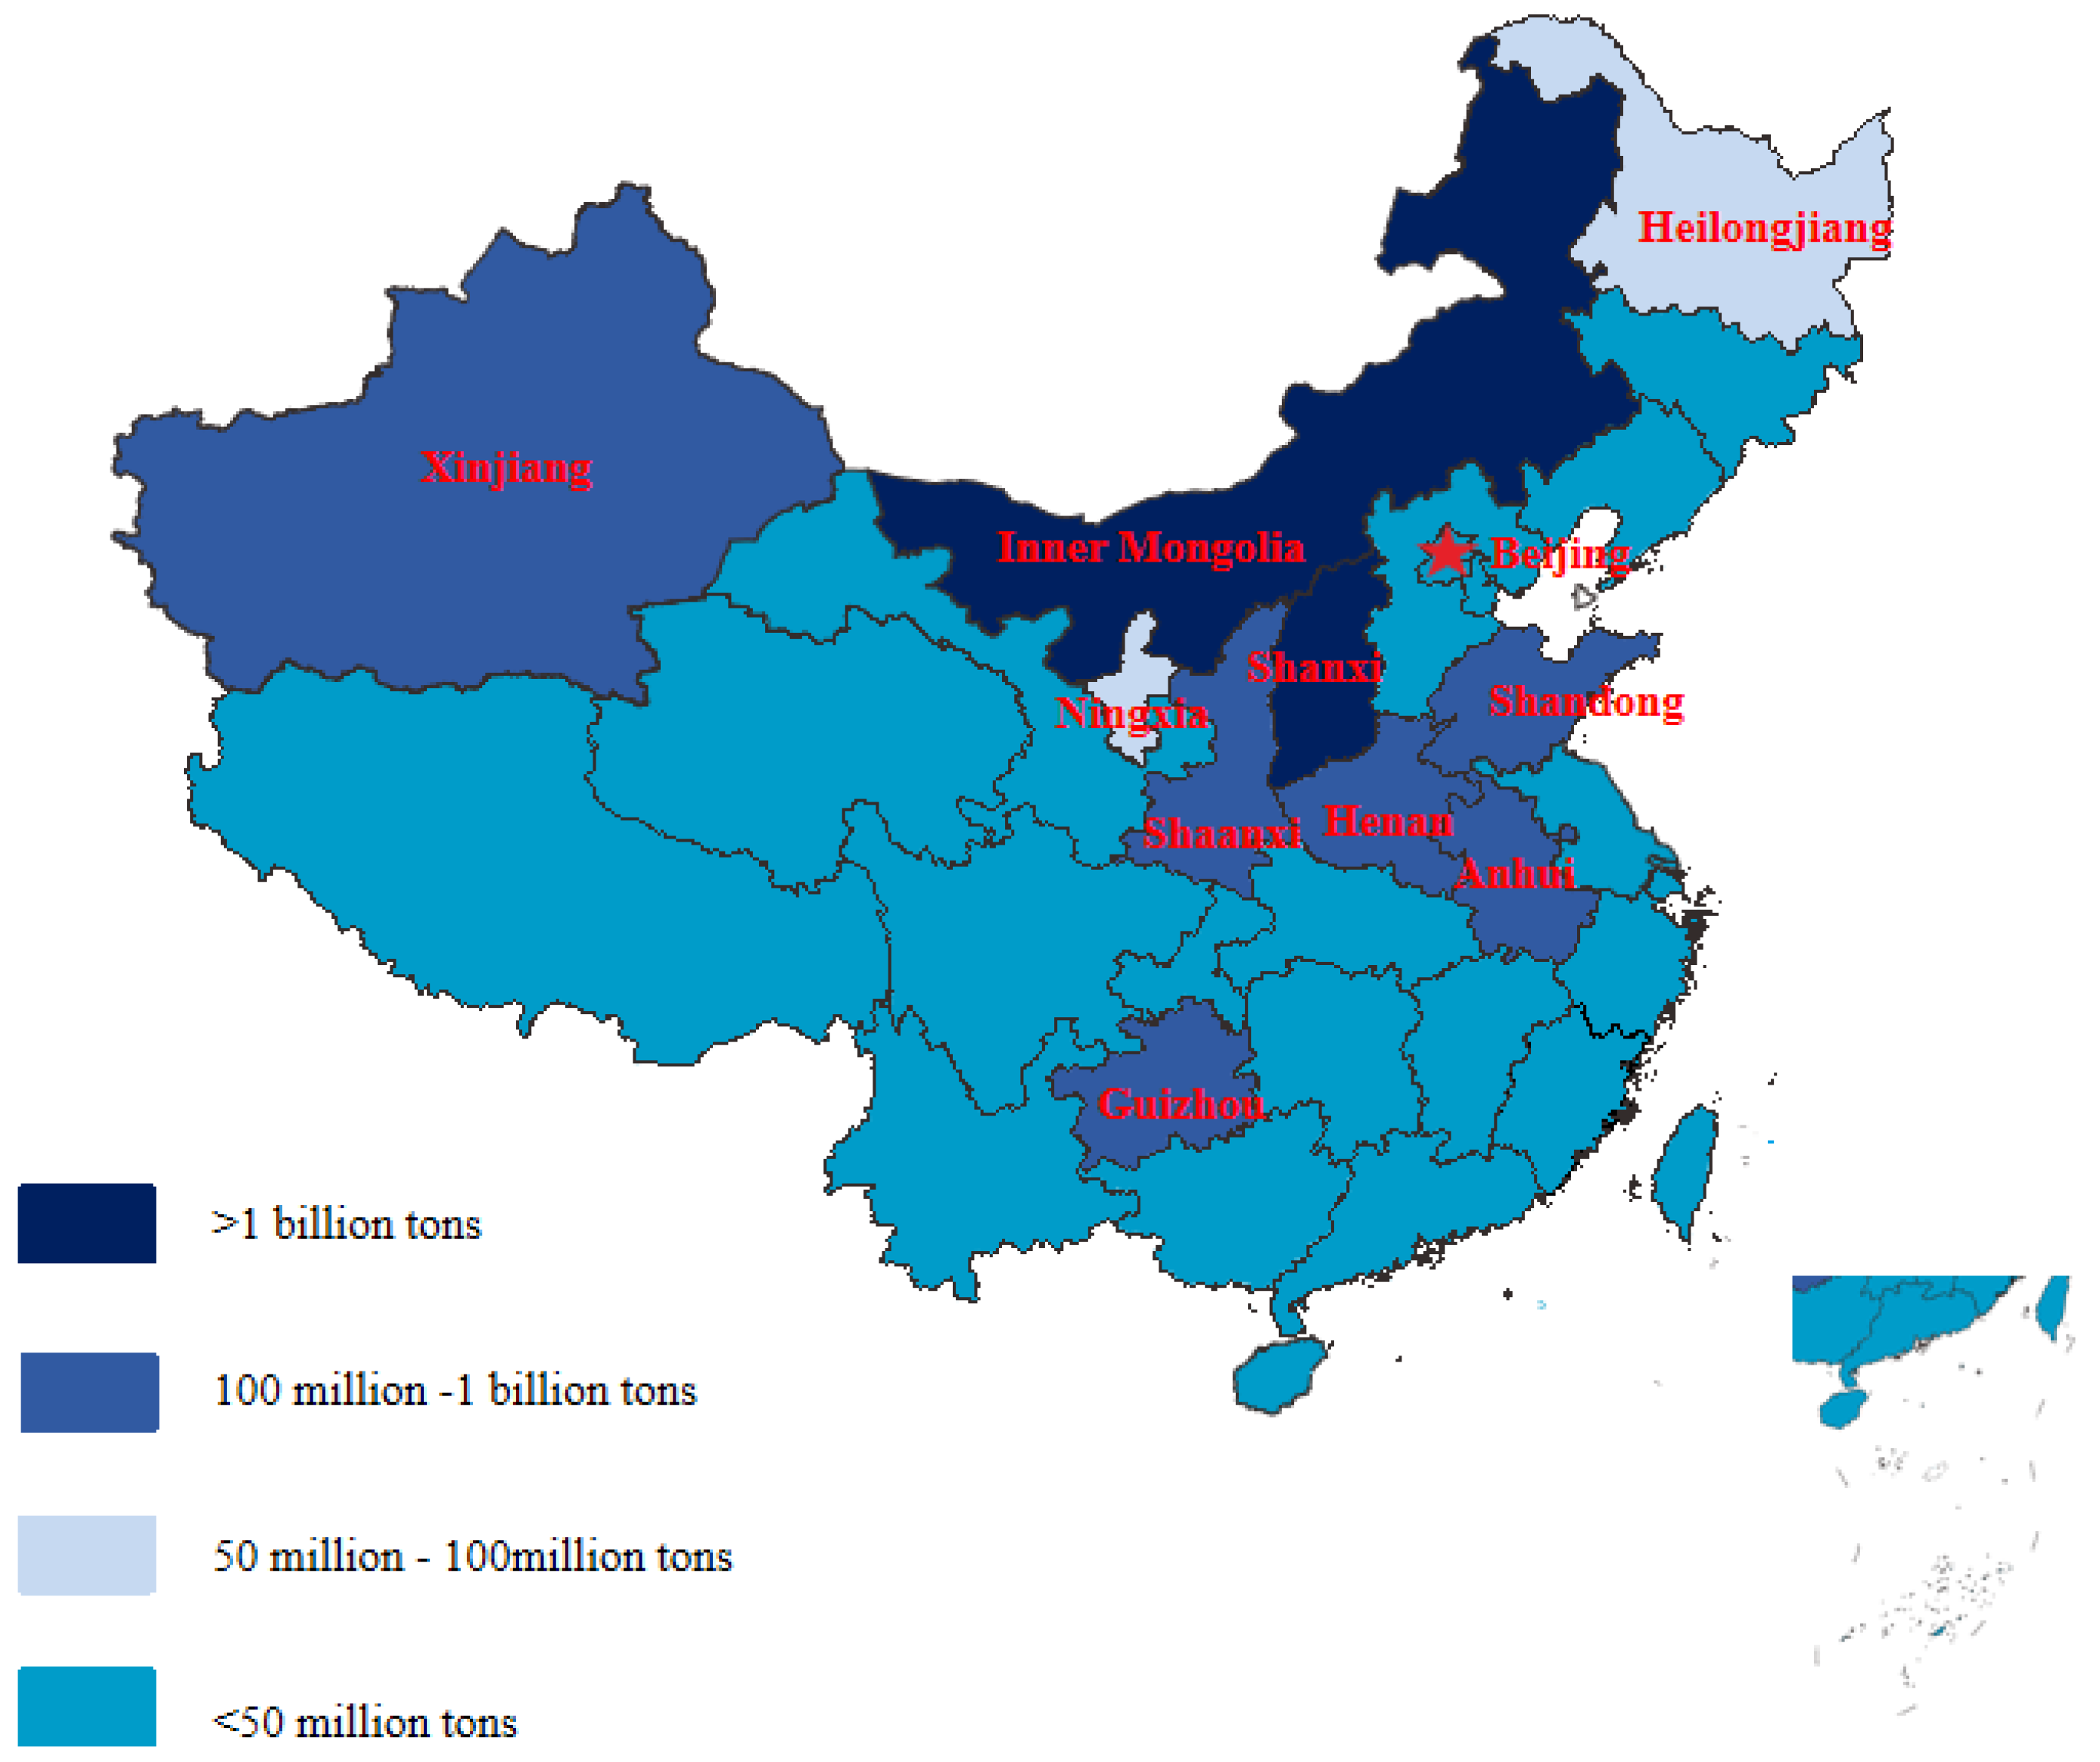
From the open documents of provincial governments, it is found that the top 10 coal-producing provinces in China are Shanxi, Inner Mongolia, Henan, Shandong, Shaanxi, Guizhou, Anhui, Ningxia, Heilongjiang, and Xinjiang, respectively. The total raw coal production of these ten provinces exceeds 90% of the national total. During the “13th Five-Year Plan” period, the total energy output of the ten provinces exceeded 80% of the national total. Among the top 10 provinces in raw coal production, there are both densely populated and more developed central and eastern provinces and sparsely populated and less developed northwestern provinces (as shown in Figure 4). Considering the availability and applicability of sample data, we selected panel data of ten coal-producing provinces from 2009 to 2020 for empirical test and explored the mechanism and effect of the synergy degree of coal capacity governance policies from three dimensions of economy, environment, and society.
There are three main sources of data used in this study. Firstly, the data of variables such as PRC, CPEC, IIPC, DRPMT, AASE, GDPI, and IRDE are sourced from the National Bureau of Statistics, statistical bulletins on the national economic and social development of each province, or statistical yearbooks of each province. As for the missing data, this study was obtained through internet searching, media reports, government documents, etc. Second, the data of HSDGP, VSDGP, and TSDGP of the central government and local governments are all derived from the study of [7]; the data of MI is derived from the latest research of [22]. Third, CUR is indirectly calculated based on the production function of the provincial boundary, and TFPGR is measured by the Solow residual method in the form of a two-factor Cobb–Douglas production function [13]. The calculation results of CUR and TFPGR are shown in Appendix C.

3.3. Descriptive Statistics of Data

Drawing on the availability and applicability of sample data, panel data spanning 2009–2020 for 10 major coal-producing provinces were selected for empirical testing, yielding a total of 120 observations. The descriptive statistics of the variables are presented in Table 2. Given the discrepancies in dimensions, magnitudes, and variable characteristics across the raw data, this study performed standardization on all dependent, independent, and control variables prior to conducting formal empirical analyses. This approach represents one of the most prevalent data preprocessing techniques in contemporary empirical research [23]. Specifically, according to x * = ( x x ¯ ) / σ , the mean and standard deviation of sample data are processed into 0 and 1. For ratio/index variables (such as CUR, TFPGR, etc.), although theoretically dimensionless, they are still standardized to maintain a consistent scale when regressed alongside absolute value variables in the same model. For absolute value variables (such as AASE, IIPC, etc.), standardization allows the regression coefficients to be interpreted as “the effect of a one standard deviation change in the independent variable on the standard deviation of the dependent variable.”

3.4. Model Building

In China, influenced by the nested implementation system, the promulgation and implementation of policies at the central government level will affect the development at the local government level. Therefore, the factors affecting local economic, environmental, and social benefits are hierarchical. For data with a hierarchical structure, there is no way to meet the basic assumptions of homogeneous variance and independence required by traditional linear models [24]. Simply analyzing the data with a traditional linear model will reduce the accuracy of the standard error [25]. At the same time, simply placing the influence factors at different levels in the same level for analysis may cause the cross-level effects of the influence factors to be ignored [26,27]. In this case, the research results are often the comprehensive effects of multiple levels. In view of the above analysis, this paper adopts HLM to analyze the data. The specific research model is as follows.
(1)
Null model
The function of the null model is to diagnose whether the research data is suitable for multi-level linear analysis. The main principle is that Level-1 and Level-2 of HLM do not include any independent variables of the local government level and the central government level to verify whether the residual variation in intercept term in Level-2 is significant. The model equation is as follows:
Level - 1 :   Y i j = β 0 j + γ i j Level - 2 :   β 0 j = γ 00 + μ 0 j
In Equation (1), Level-1 represents the local government level; Level-2 represents the central government level. At Level-1, the dependent variable Y i j indicates the economic, environmental, or social effects of local government, while β 0 j and γ i j represent the layer intercept and the random difference among local government, respectively. At Level-2, γ 00 and μ 0 j indicate the fixed effect and random effect of the first layer intercept on the second layer, respectively. δ 2 is the intra-group variance, which is equal to V a r ( γ i j ) ; τ 00 is the inter-group variance, which is equal to V a r ( μ 0 j ) .
(2)
Random effect regression model
Based on the null model, the random effect regression model adds the independent variables of the local government level, which is mainly used to determine the influence of each independent variable at Level-1 on the dependent variable. Variables at the local government level are included in the null model, and the random effects model obtained is as follows:
Level - 1 :   Y i j = β 0 j + β 1 j ( X i j ) + γ i j Level - 2 :   β 0 j = γ 00 + μ 0 j                                         β 1 j = γ 10 + μ 1 j
In Equation (2), X i j represents the independent variable at the local government level; γ 10 represents the relationship between independent variables and dependent variables at the local government level; μ 1 j represents residual or randomness; the rest of the letters have the same meaning as Equation (1).
(3)
Intercept effect regression model
Based on the null model, the intercept effect regression model is carried out for the independent variables of the central government level, which is mainly used to determine the influence of each independent variable at Level-2 on the dependent variable. Variables at the central government level are included in the null model, and the intercept effect regression model is as follows:
Level - 1 :   Y i j = β 0 j + γ i j Level - 2 :   β 0 j = γ 00 + γ 01 ( W i j ) + μ 0 j
In Equation (3), W i j represents the independent variable at the central government level, and the rest of the letters have the same meaning as Equation (1).

4. Empirical Results and Discussion

In this paper, HLM7 software is used to explore the effects and paths of SDGP of the central government and local governments on the local economy, environment, and society.

4.1. Analysis Results of the Null Model

This study uses the null model analysis results to determine whether the local economy, environment, and society are affected by the SDGP of the central government policies. When the dependent variables are local economic, environmental, and social effects, this study establishes null models with RPC (Model 1), CUR (Model 2), TFPGR (Model 3), CPEC (Model 4), IIPC (Model 5), DRPMT (Model 6), and AASE (Model 7) as dependent variables, respectively. The results of the null model analysis are shown in Table 3.
In Table 3, the μ 0 j of both Model 2 and Model 4 fails to pass the significance test, which indicates that Model 2 and Model 4 are not suitable for HLM analysis. This statistical finding possesses inherent theoretical rationality. As micro-level operational indicators reflecting production efficiency and energy use intensity, the fluctuations of CUR and CPEC are more directly and rapidly influenced by localized factors such as provincial resource endowments, local market conditions, enterprise technological levels, and immediate management decisions. Central-level capacity governance policies typically operate through indirect transmission channels, such as setting macro objectives, adjusting assessment mechanisms, or providing fiscal incentives. These policies first influence local government behavior and the regional industrial environment, which subsequently affect enterprise-level micro-decisions, ultimately manifesting as changes in capacity utilization or energy consumption. Consequently, the response mechanisms of CUR and CPEC are inherently more aligned with local contexts, and their data exhibit low between-group variation, which is consistent with the statistical test results. To maintain the systematicity of the multidimensional benefit assessment, this study conducted supplementary analyses of CUR and CPEC at the provincial level (i.e., using a standard fixed-effects panel model), as detailed in Appendix D.
The μ 0 j of the other models all pass the significance test, and the inter-class correlation coefficient (ICC) needs to be further calculated to determine whether the HLM is suitable for use [28]. ICC is mainly used to illustrate how much of the variation in the dependent variable is due to the difference between groups level (the rest comes from differences at the individual level), indicating the degree of interdependence between individuals in the group. The calculation formula of IIC is: I I C = τ 00 / ( δ 2 + τ 00 ) = V a r ( μ 0 j ) / ( ( V a r ( γ i j ) + V a r ( μ 0 j ) ) . By calculating, the ICC values of RPC, TFPGR, IIPC, DRPMT, and AASE are 0.136, 0.478, 0.060, 0.164, and 0.596, respectively. The ICCs of those models are greater than the standard 0.059 suggested by [29], indicating that the variation components within and between groups are significant, which is not suitable for analysis by general regression models, and an HLM should be constructed for further testing.

4.2. Results of Random Coefficient Regression Model Analyses

The random coefficient regression model mainly analyzes the influence of the HSDGP, VSDGP, and TSDGP of local governments on local environmental, economic, and social benefits without considering the differences in central-government horizontal and temporal synergy degree in each year. In this study, the independent variables (HSDGP, VSDGP, and TSDGP of local governments) and three control variables (GDPI, MI, and IRDE) were put into the Level-1 of the model, and no variables were put into the Level-2 of the model. For example, when RPCE is the dependent variable, and the HSDGP is the independent variable, the random coefficient regression model equation is as Equation (4). Other random coefficient regression model equations are shown in Appendix E, and the analysis results are shown in Table 4.
Level - 1 :   R P C ij = β 0 j   + β 1 j ( H S D G P )   + β 2 j ( M I )   + β 3 j ( G D P I )   + β 4 j ( I R D E )   + γ ij Level - 2 : β 1 j = γ 10 + μ 1 j β 1 j = γ 10 + μ 1 j β 2 j = γ 20 + μ 2 j β 3 j = γ 30 + μ 3 j
Table 4 presents fixed and random effect estimates from random coefficient regression models, evaluating model performance across five dependent variables (RPC, TFPGR, IIPC, DRPMT, AASE) with varying control variables. Relative to the baseline Model 1, Model 1a, Model 1b, and Model 1c exhibit respective reductions in Level-2 intra-group variance from 0.844 to 0.669, 0.677, and 0.649, concomitant with increases in Level-1 residual variance of 26.2% ((0.844–0.669)/0.669), 24.7% ((0.844–0.677)/0.677), and 30.0% ((0.844–0.649)/0.649). The deviance statistic also decreased from 332.605 to 321.942, 322.775, and 320.573, respectively. These findings collectively indicate that the goodness of fit of the random coefficient regression model with RPC as the dependent variable has been enhanced. Using the same comparative framework, this study further confirms that the goodness of fit of random coefficient regression models with TFPGR, IIPC, DRPMT, and AASE as dependent variables has also improved. Specifically, the model groups Model 3a–3c, Model 5a−5c, Model 6a-6c, and Model 7a−7c all demonstrate enhanced fitting performance.
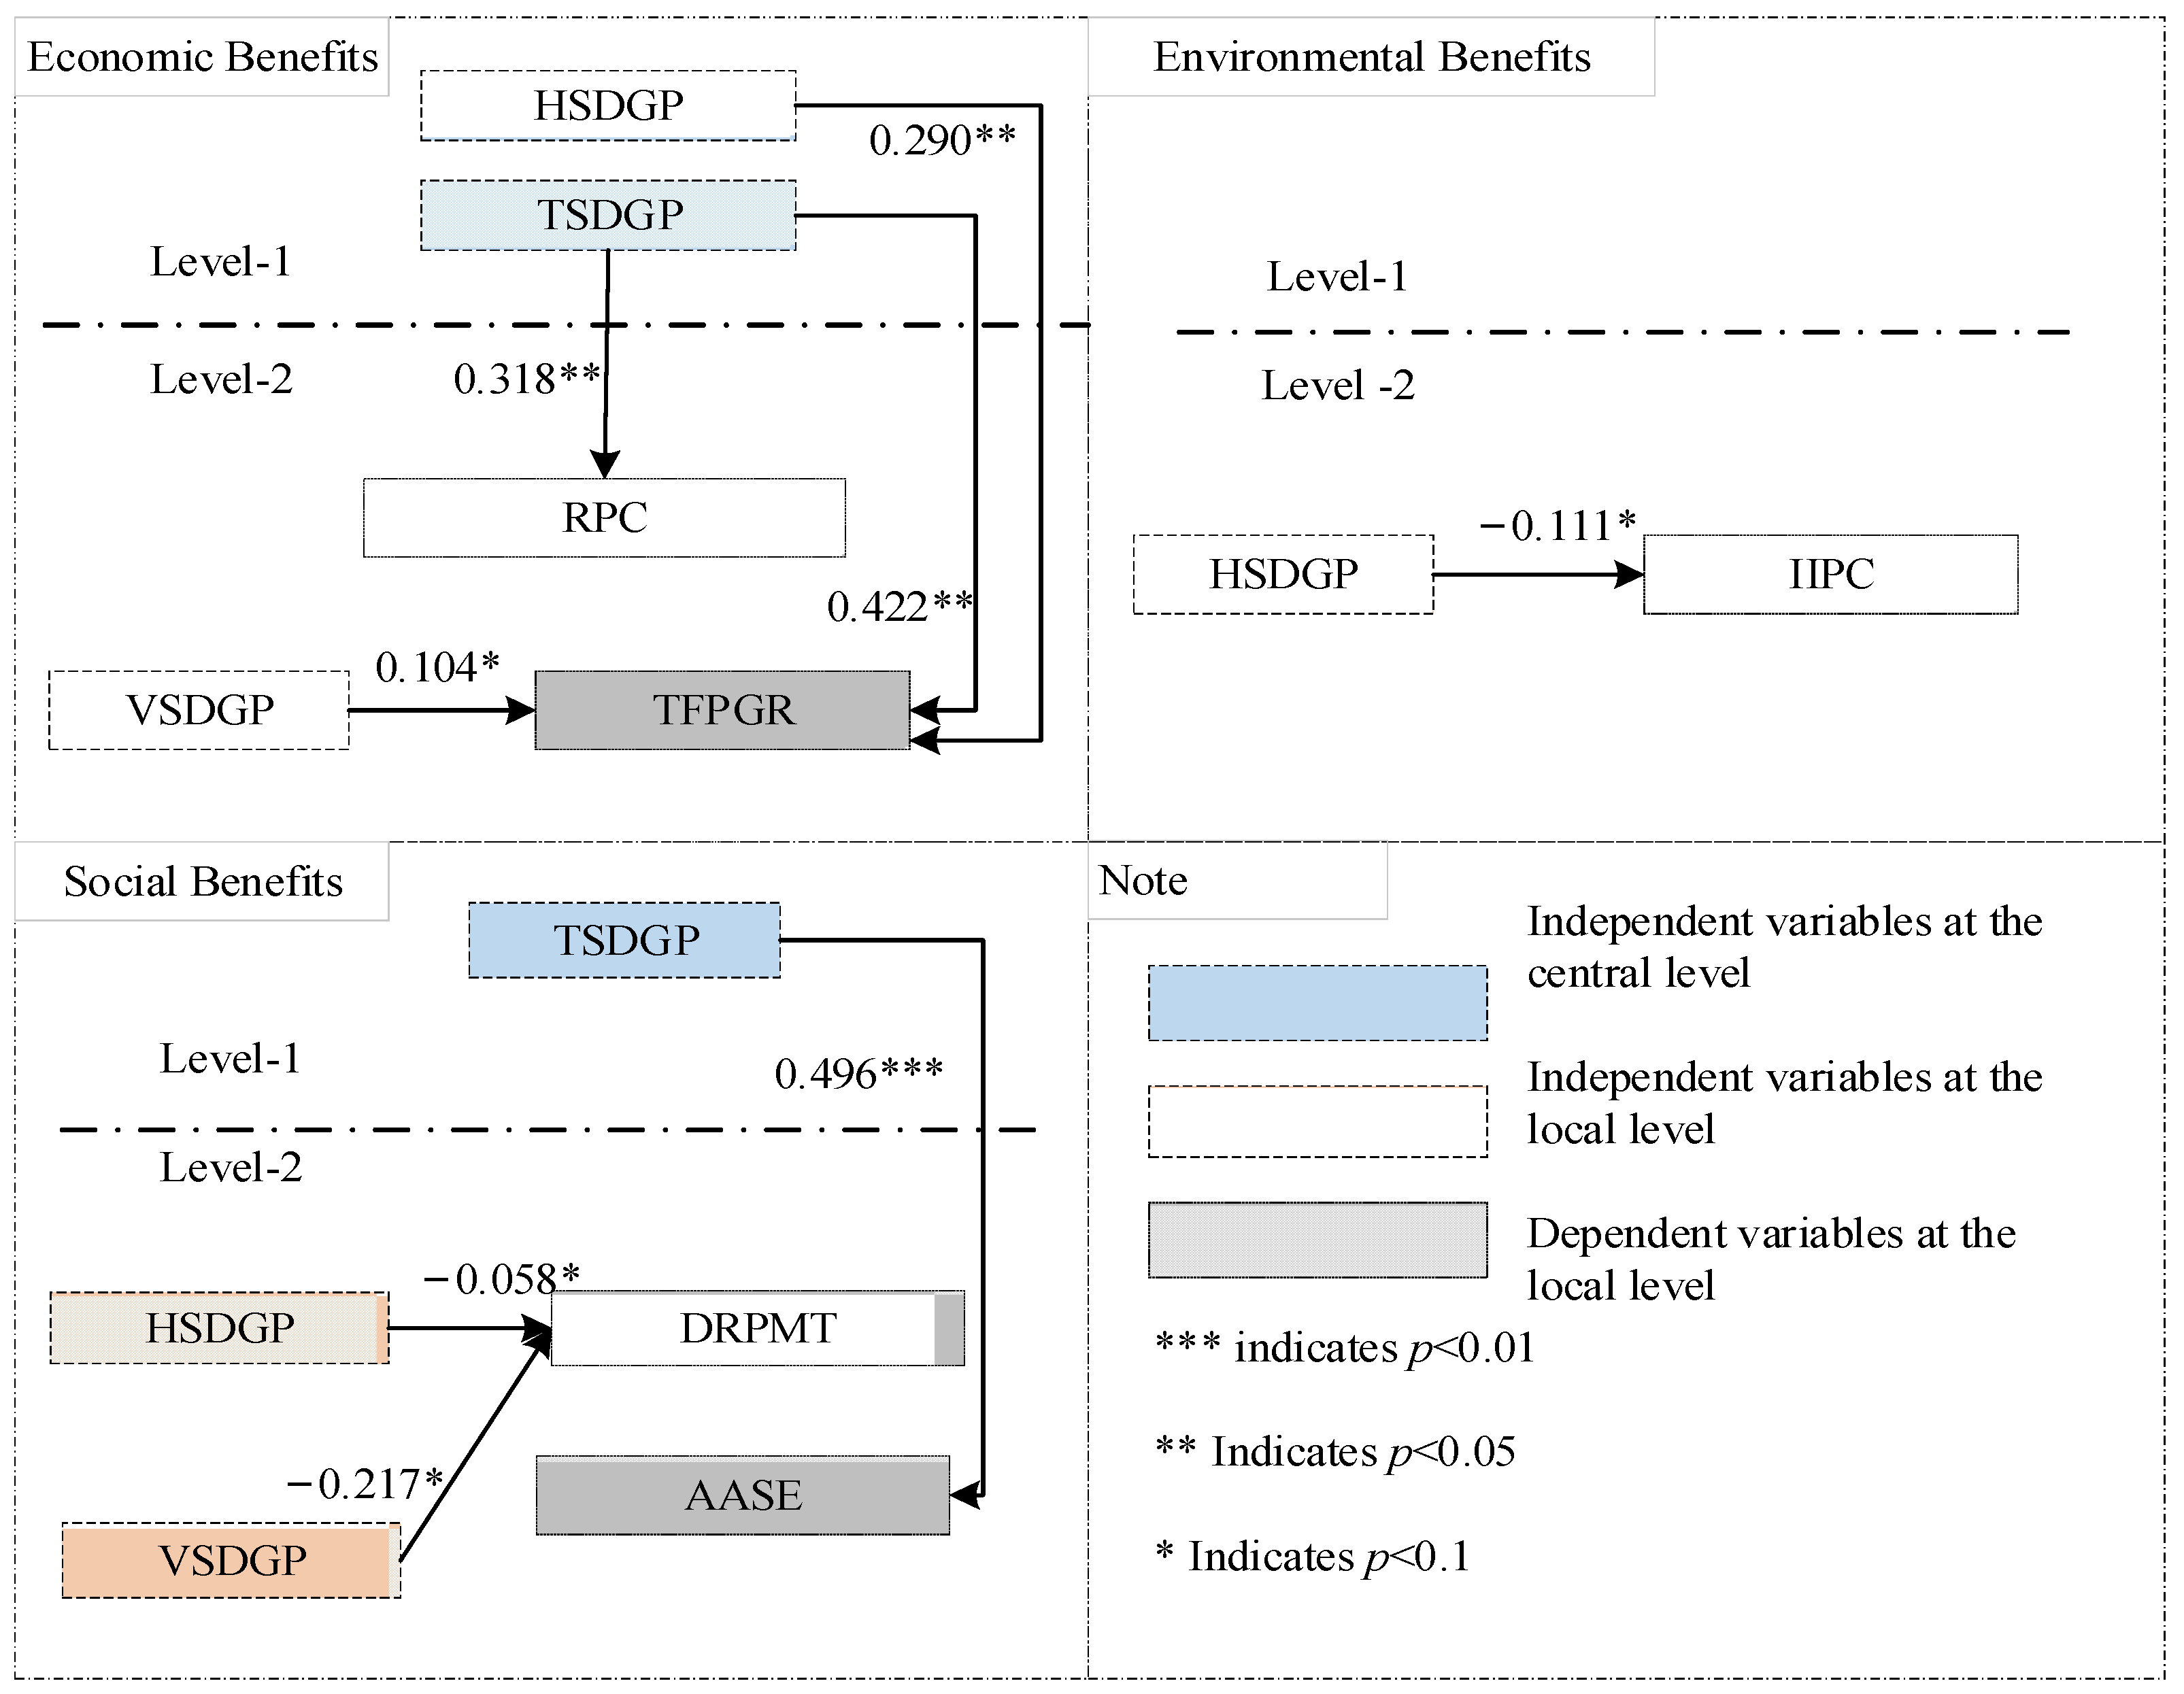
When the economic benefits (RPC and TFPGR) are dependent variables in Table 4, we can see the regression coefficients of fixed effects of Model 1a, Model 1b, Model 1c, Model 3a, and Model 3c are insignificant, which indicates that HSDGP, VSDGP, and TSDGP of local governments have no significant influence on RPC and HSDGP and TSDGP have no significant influence on TFPGR. The regression coefficient of fixed effects in Model 3b is 0.104 (p < 0.1), indicating VSDGP of local governments has a positive impact on TFPGR. The focus of vertical synergy of policies lies in the feedback mechanism [9]. Local governments will feed back the difficulties encountered in formulating and implementing policies to the previous department to help the central department understand the overall situation and dynamically adjust the policy content to serve the policy objectives better. By consulting with the central government, local governments maintain the convergence of old and new coal capacity governance policies and avoid the phenomenon of layer-by-layer coding and super-plan implementation, which will help scientifically guide enterprises to eliminate backward production capacity and improve production efficiency. Studies have shown that improper government intervention and a lower level of industry opening to the outside world will reduce the overall efficiency of the industry, and the intervention and adjustment of reasonable government policies based on regional conditions will help improve the overall TFPGR of the industry [30].
When the environmental benefit (IIPC) is the dependent variable in Table 4, we can see the regression coefficients of fixed effects of Model 5a and Model 5c are insignificant, indicating that HSDGP and TSDGP of local governments have no significant influence on IIPC. The regression coefficient of fixed effects in Model 5b is −0.111 (p < 0.1), indicating that the VSDGP of local governments had a negative impact on IIPC. Ref. [30] pointed out that only by strengthening coordination and joint efforts between different governments can we solve increasingly complex and serious problems such as intensified competition, turbulent situations, increased pollution, and environmental degradation. Since 2014, with the gradual achievement of industrial pollution control in China, China has gradually invested less in pollution control, and policy coordination among departments at the same level is also helpful in reducing the investment quota for industrial pollution control.
When the social benefits (DRPMT and AASE) are dependent variables in Table 4, we can see the regression coefficients of fixed effects of Model 6c, Model 7a, Model 7b, and Model 7c are not significant, which indicates that TSDGP of local governments has no significant influence on DRPMT and HSDGP, VSDGP, and TSDGP of local governments have no significant influence on AASE. The regression coefficients of fixed effects in Model 6a and Model 6b are −0.058 (p < 0.1) and −0.217 (p < 0.05), respectively, indicating that both HSDGP and VSDGP of local governments have a negative impact on DRPMT. The problem of coal safety production is affected by many factors, including social development, industry characteristics, supervision mechanism, and internal micro-factors of coal enterprises [31]. Local government departments coordinate with each other in the formulation and implementation of capacity governance policies, properly arrange workers, maintain social stability, and eliminate dangerous production capacity that is backward or fails to meet safe production conditions, thereby reducing the mortality rate of one million tons of coal. At the same time, as a representative of public interests, the central government pays more attention to people’s livelihood and civil rights, and the improvement of the VSDGP of local government policies is also conducive to improving the level of coal safety production [32].

4.3. Results of Intercept Model Analysis

The intercept model mainly analyzes the influence of HSDGP, VSDGP, and TSDGP of the central government policies on local environmental, economic, and social benefits. Three control variables (GDPI, MI, and IRDE) were put into the Level-1 of the model, and independent variables (HSDGP, VSDGP, and TSDGP of the central government) were put into the Level-2 of the model. For example, when RPC is the dependent variable, and the HSDGP of the central government is the independent variable, the intercept model equation is as Equation (5). Other intercept model equations are shown in Appendix F, and the analysis results of intercept model are shown in Table 5.
Level - 1 :   R P C ij = β 0 j   + β 1 j ( M I )   + β 2 j ( G D P I )   + β 3 j ( I R D E )   + γ ij Level - 2 : β 0 j =   γ 00 +   γ 01 ( H S D G P ) + μ 0 j β 1 j   =   γ 10 + μ 1 j β 2 j   =   γ 20 + μ 2 j β 3 j   =   γ 30 + μ 3 j
Table 5 presents fixed and random effect estimates of intercept models, evaluating the impact of Level-2 independent variables and control variables on five dependent variables (RPC, TFPGR, IIPC, DRPMT, AASE). Relative to the baseline Model 1, Model 1d exhibits a reduction in Level-2 intra-group variance from 0.844 to 0.677, alongside a decrease in the deviance statistic from 332.605 to 322.390. These findings collectively indicate that the goodness of fit of the intercept model with RPC as the dependent variable has been enhanced. Using the same comparative framework, this study further confirms that the goodness of fit of intercept models with TFPGR, IIPC, DRPMT, and AASE as dependent variables has also improved. Specifically, the model groups Model 1d–1f, Model 3d–3f, Model 5d–5f, Model 6d–6f, and Model 7d–7f all demonstrate enhanced fitting performance.
From Table 5, we can see the results of the intercept model when the HSDGP, VSDGP, and TSDGP of the central government are used as the independent variable. The regression coefficients of fixed effects of Model 1d, Model 1e, Model 5d, Model 5e, Model 5f, Model 6d, Model 6e, Model 6f, Model 7d, and Model 7e are not significant. The regression coefficients of fixed effects in Model 1f, Model 3d, Model 3f, and Model 7f are 0.318 (p < 0.05), 0.290 (p < 0.05), 0.422 (p < 0.01), and 0.496 (p < 0.001), respectively, indicating that HSDGP of the central government has a positive impact on TFPGR, and TSDGP of the central government have positive impacts on RPC, TFPGR, and AASE. TFPGR is more often used to measure the productivity growth caused by pure technological improvement outside of the productive factors [33].
The comprehensive graphical summary provided in Figure 5 illustrates the cross-level regression results discussed above. However, it should be noted that although the aforementioned coefficients are statistically significant, due to the limited sample size at the central level, such estimates should be regarded as exploratory and directional findings. Their primary value lies in revealing the potential moderating mechanisms and pathways of central policy synergy in cross-level governance, rather than in providing precise quantification of the magnitude of policy effects. For instance, the central government’s policy has the characteristics of overall, strategic, and coherent, which is conducive to local enterprises to avoid local governments’ narrow protectionism and short-term interest pursuit. It promotes large coal enterprises, such as high energy consumption and high pollution, to eliminate backward production capacity and improve technical level, thus improving the overall TFPGR of the coal industry [34]. The economic benefit of an enterprise is a prerequisite for determining the salary of employees. Under the condition of the high-level continuity and stability of the central government policy, the economic benefit of the enterprise can be improved, and the AASE of employees will also be improved accordingly.

4.4. Robustness Test

In order to ensure the robustness of the above research results, this study conducted robustness tests by adding control variables and changing the sample size.
(1)
Robustness test after controlling resource endowment conditions
Coal resource endowment refers to the characteristics of coal resources itself, which is mainly composed of coal resource reserves, coal quality, geological conditions, and mine disasters. It is the primary factor affecting the cost of coal production. Based on the research of [13], this study selects the annual output of raw coal (AORC) in each province to measure its resource endowment conditions. Adding this control variable to the model to investigate the impact of the synergy degree of central and local government capacity governance policies on the local economy, environment, and society (in Table 6). The regression coefficients of RPCE, TFPGR, DRPMT, and AASE still remain significant and have little difference from the previous analysis. The regression coefficient of IIPC is not significant, but the direction does not change, and the coefficient value is not much different from the above. Therefore, the results of this study are robust, and the results are still valid after controlling the resource endowment conditions of each province.
(2)
Robustness test for changing sample size
In order to better manage production capacity, the State Council clearly stated that “we must not only focus on the role of market mechanisms, but also innovate institutional mechanisms, accelerate the transformation of government functions, and establish a long-term mechanism to resolve overcapacity” in 2013. Subsequently, various localities introduced intensive capacity governance policies. Based on this, this study adjusted the sample interval to the period from 2013 to 2019, when a large number of policies were promulgated, and changed the sample size to conduct a robustness test. The research results are shown in Table 7. The regression coefficients of RPC, TFPGR, DRPMT, and AASE still remain significant, and the regression coefficient of IIPC is not significant, but the direction does not change. Therefore, the research results of this paper are robust, and the research results are still valid after changing the sample size.

5. Conclusions and Policy Implications

5.1. Main Conclusions

Capacity governance constitutes a pivotal driver for advancing the transformation of China’s energy system and the sustainable development of its economy. It must not only fully leverage coal’s role as an energy backstop but also effectively reconcile the inherent contradiction between short-term capacity shortages and long-term overcapacity. Against this backdrop, this paper explores the synergy mechanisms and effects underpinning China’s coal capacity governance policies. Based on theoretical analysis, HLM was used to analyze the effects of HSDGP, VSDGP, and TSDGP of the central government and local governments on local economic, environmental, and social benefits. This study empirically reveals the effects, mechanisms, and hierarchical heterogeneity of policy synergy across economic, environmental, and social dimensions. This research not only expands and deepens the theoretical framework of policy synergy but also provides a solid theoretical basis and decision-making support for central and local governments to synergistically optimize the integrated economic, environmental, and social benefits.
At the central level, the synergy of coal capacity governance policies yields notable economic and social benefits, whereas environmental benefits remain less pronounced. Specifically, the horizontal synergy of central policies exerts a significant positive impact on TFPGR of the local coal industry, which aligns with the proposition of the policy mix theory that complementary policies can boost economic dynamism. The temporal synergy of central policies has a significant positive effect on RPC, TFPGR, and AASE in the local coal industry. This finding indicates that the temporal coherence of policies can effectively stabilize market expectations and protect labor income, thereby validating the applicability of the policy coherence hypothesis in transitional economies. The vertical synergy of central policies shows no significant impact on economic, environmental, or social benefits. This phenomenon may be attributed to the misalignment between central and local governments in policy objectives, performance incentives, and information structures, which resonates with the discussions of the multi-level governance theory regarding the challenges of vertical coordination.
At the local level, local capacity governance policies generate favorable economic, environmental, and social benefits. Specifically, the horizontal synergy of local government policies exerts a significant negative impact on IIPC and DRPMT. This suggests that local governments can achieve a degree of “synergistic enhancement” in environmental governance and workplace safety through policy integration, providing empirical support for the viewpoint of the local innovation theory concerning policy experimentation and implementation flexibility. The vertical synergy of local government policies has a significant positive effect on TFPGR while exerting a significant negative effect on DRPMT. This reflects how local governments can attain the dual goals of economic growth and safety improvement by making localized adjustments when implementing central policies. The temporal synergy of local capacity governance policies exerts no significant impact on economic, environmental, or social benefits. This may stem from the fact that local governments face dual constraints from central mandates and short-term performance assessments in policy sequencing, making it challenging to formulate a consistent and coherent set of autonomous policies.

5.2. Policy Implications

Employing cross-level regression analysis, this study quantifies the causal impacts of the SDGP rolled out by both central and local governments on provincial economic, environmental, and social performance. Furthermore, it systematically analyzes and synthesizes the hierarchical variations in the policy’s multi-dimensional outcomes, with the aim of providing targeted, evidence-based policy recommendations to deepen coal overcapacity governance, drive environmental optimization, and advance sustainable socio-economic development.
(1)
The central government should optimize policy design to strengthen macro-level coordination and targeted implementation. Given the weak transmission of environmental policy effects resulting from the SDGP of the central government, it is necessary to further “harden” environmental constraint indicators in top-level design. This includes explicitly incorporating objectives such as regional environmental quality improvement and reductions in carbon emission intensity into the local performance evaluation system, and linking them to fiscal transfers, project approvals, and other mechanisms to enhance the policy rigidity of environmental targets. Simultaneously, the central government should assist local governments in formulating reasonable overcapacity governance policies adapted to local industrial and environmental conditions, while appropriately increasing administrative penalties to strike a balance between incentives and disincentives. For regions with a concentration of overcapacity industries or economically underdeveloped areas, the central government may provide special tax incentives or adopt a moderated pace of overcapacity governance to support their economic development.
(2)
Local governments should strengthen implementation accountability and promote the coordinated and precise execution of multi-dimensional objectives. Given that local governments’ implementation of the SDGP has exerted critical effects in environmental and social dimensions, local governments should fully leverage their role as a bridge between the central government and local industries. This includes actively soliciting input from enterprises while ensuring enterprises understand the risks associated with supply and demand imbalances in the coal industry’s capacity. Proactively engaging with central government departments to accurately convey industry interests is essential, fostering a collaborative effort between central and local levels to address overcapacity governance challenges. At the same time, local governments can enhance the willingness of coal enterprises to participate in overcapacity governance by creating more employment opportunities and promoting livelihood diversification. Specific measures may include promoting inclusive finance, providing microloans to miners to stimulate entrepreneurship and innovation, strengthening vocational skills training for miners, and expanding non-mining employment opportunities.
(3)
Central and local governments should establish a dynamic evaluation and adaptive adjustment mechanism to enhance overall governance efficacy. To bridge the gap in the synergistic effects of central and local overcapacity governance policies and achieve continuous optimization, it is necessary to establish a dynamic monitoring and evaluation system for policy synergy covering economic, environmental, and social dimensions [1]. Based on the evaluation results, the central government can adjust its macro-level guidance strategies and support measures in a timely manner. Local governments, in turn, should provide feedback on specific implementation obstacles and needs encountered during policy implementation, thereby forming a closed-loop, two-way interaction system for policy learning and adaptation [35]. At the same time, it is essential to systematically summarize and promote “best practices” from various regions in areas such as environmental governance, work safety, and social transition. Differentiated incentives, such as special subsidies and approval for pilot initiatives, should be implemented to cultivate a policy ecosystem featuring mutual learning, healthy competition, and continuous improvement.

5.3. Limitations and Future Research Directions

This study represents a phased achievement of the research team’s serial studies, focusing primarily on the impact effects of policy synergy in coal capacity governance across the three core dimensions of economy, environment, and society. Despite our efforts to balance the depth and breadth of the analysis, this study still has certain limitations, which identify clear directions and scope for further expansion and deepening of subsequent research.
The dataset of this study is limited to the period from 2009 to 2020, covering ten major coal-producing provinces in terms of spatial scope. Such constraints on the data scope may not only lead to the neglect of the lagged transmission effects of relevant early-stage policies, but also make it difficult to exhaust all other potential influencing factors that may affect policy synergy effects. To construct a more comprehensive and precise analytical framework, it is recommended that future research further expand the 21time span and spatial coverage of the dataset, incorporating longer time series and samples from more coal-producing and coal-consuming provinces, so as to improve the generalizability of the research conclusions.
In addition, to further enhance the accuracy of empirical analysis and the robustness of results, subsequent research can introduce cutting-edge econometric methods such as the Difference-in-Differences, System Generalized Method of Moments, system dynamics models, and Panel Vector Autoregression models for in-depth analysis. This will help to more precisely identify the causal relationships between policy synergy and multi-dimensional effects, thereby strengthening the reliability and persuasiveness of the research conclusions.

Author Contributions

Conceptualization, D.L. and H.M.; methodology, D.L.; software, F.X.; validation, J.W. formal analysis, D.L.; investigation, H.M.; resources, S.B.; data curation, J.W.; writing—original draft preparation, D.L.; writing—review and editing, W.C. and S.B.; visualization, F.X.; supervision, S.B.; project administration, S.B.; funding acquisition, D.L. and W.C. All authors have read and agreed to the published version of the manuscript.

Funding

This research was funded by Philosophy and Social Sciences Research Project of Jiangsu Universities (Grant No. 2025SJYB0829) and Xuzhou Science and Technology Plan Project (Grant No. KC23286).

Data Availability Statement

The original contributions presented in this study are included in the article material. Further inquiries can be directed to the corresponding author.

Conflicts of Interest

The authors declare no conflicts of interest.

Appendix A

Table A1. Summary of production capacity governance policies in coal industry.
YearDepartments of RPCPolicy NamePolicy TargetsSide
2010National Development and Reform CommissionSeveral opinions on accelerating the merger and reorganization of coal mining enterprises Forming a number of super-large coal mining enterprise groups with an annual output of more than 50 million tons, increasing the average annual production capacity of coal mining enterprises to more than 800,000 tons, and increasing the coal output of super-large coal mining groups to more than 50% of the country’s total output. Supply side
2012National Development and Reform CommissionThe 12th Five-Year Plan for the development of the coal industryFrom 2011 to 2015, the number of coal enterprises will be reduced from 11,000 to 4000; the coal output of super-large coal groups will account for more than 60% of the country’s total output. Supply side
2013State CouncilThe 12th Five-Year Plan for energy developmentFrom 2011 to 2015, the coal output of super-large coal mining groups will account for more than 60% of the country’s total output and the proportion of energy consumption will be reduced by about 65%.Demand and supply side
2013General Office of the State CouncilOpinions on promoting the smooth operation of the coal industryStarting in 2013, Coal enterprises will be encouraged to merge and reorganize, and 90,000 tons/year and below coal mines will be phased out.Supply side
2014Ministry of Industry and Information Technology, Ministry of Finance, etc.Interim measures for the replacement management of coal consumption reduction in key areasBy 2017, coal consumption in Beijing, Tianjin, Hebei, and Shandong will be reduced by 13, 10, 40, and 20 million tons, respectively, compared with 2012.Demand
Side
2016State CouncilOpinions on resolving excess capacity in coal industry to achieve developmentStarting from 2016, it will take three to five years to withdraw the production capacity of 500 million tons and reduce and reorganize about 500 million tons.Supply side
2016National Development and Reform CommissionThe 13th Five-Year Plan for the development of the coal industryBy 2020, the output of small coal mines of 300,000 tons/year or less will account for less than 10%, the number of coal enterprises will be less than 3000, the number of coal mines will be controlled to 6000, and the output of large enterprises above 50 million tons will account for more than 60% of the country’s total output.Supply side
2017National Development and Reform Commission, etc.The 13th Five-Year Plan for energy developmentBy 2020, the total consumption of coal will be controlled by 4.1 billion, and the proportion of coal consumption will be reduced to less than 58%.Demand Side
2021National Energy AdministrationGuidelines on energy work in 2021By the end of 2021, the share of coal consumption will be reduced to less than 56%.Demand Side
2022National Development and Reform Commission and National Energy AdministrationThe 14th Five-Year Plan for the modern energy systemStrengthening the role of coal in ensuring the safety of coal and promoting the transition to energy conservation and carbon reduction in an orderly manner.Demand Side

Appendix B

Quantitative Analysis Framework for De-Capacity Policy

(1)
Evaluation indicator framework
The synergy theory was first proposed by the German physicist Hermann Haken, which states that a system can be organized by itself within a system under certain conditions. In recent years, with the emergence of network patterns among the different governmental bodies, levels, and departments, scholars have focused on the application of synergy theory in the process of public policy analysis and formulation. China’s fragmented and departmentalized administrative system leads to problems such as lack of coordination among closely related organizations, lack of coordination among departments with overlapping functions, and coexistence of opposing agencies. At the same time, there is a complex and multi-domain impact of industrial de-capacity policies, and single or excessive emphasis on any level, department, and time period may have adverse effects on the sustainable development of the economy and social stability. Thus, formulating policies that complement and support the other is the only way to deepen supply-side reforms and promote rapid economic development.
Following to the synergy theory and existing literature on policy synergy, the OECD and most scholars agree that policy synergy can be divided into horizontal, vertical, and temporal synergies. Therefore, considering the literature, China’s unique administrative system, and the multidisciplinary and complex nature of industrial de-capacity, this paper focuses on three dimensions of policy synergy in the analysis of industrial de-capacity: “horizontal synergy, vertical synergy and temporal synergy” as shown in Figure 1.
(2)
Text mining
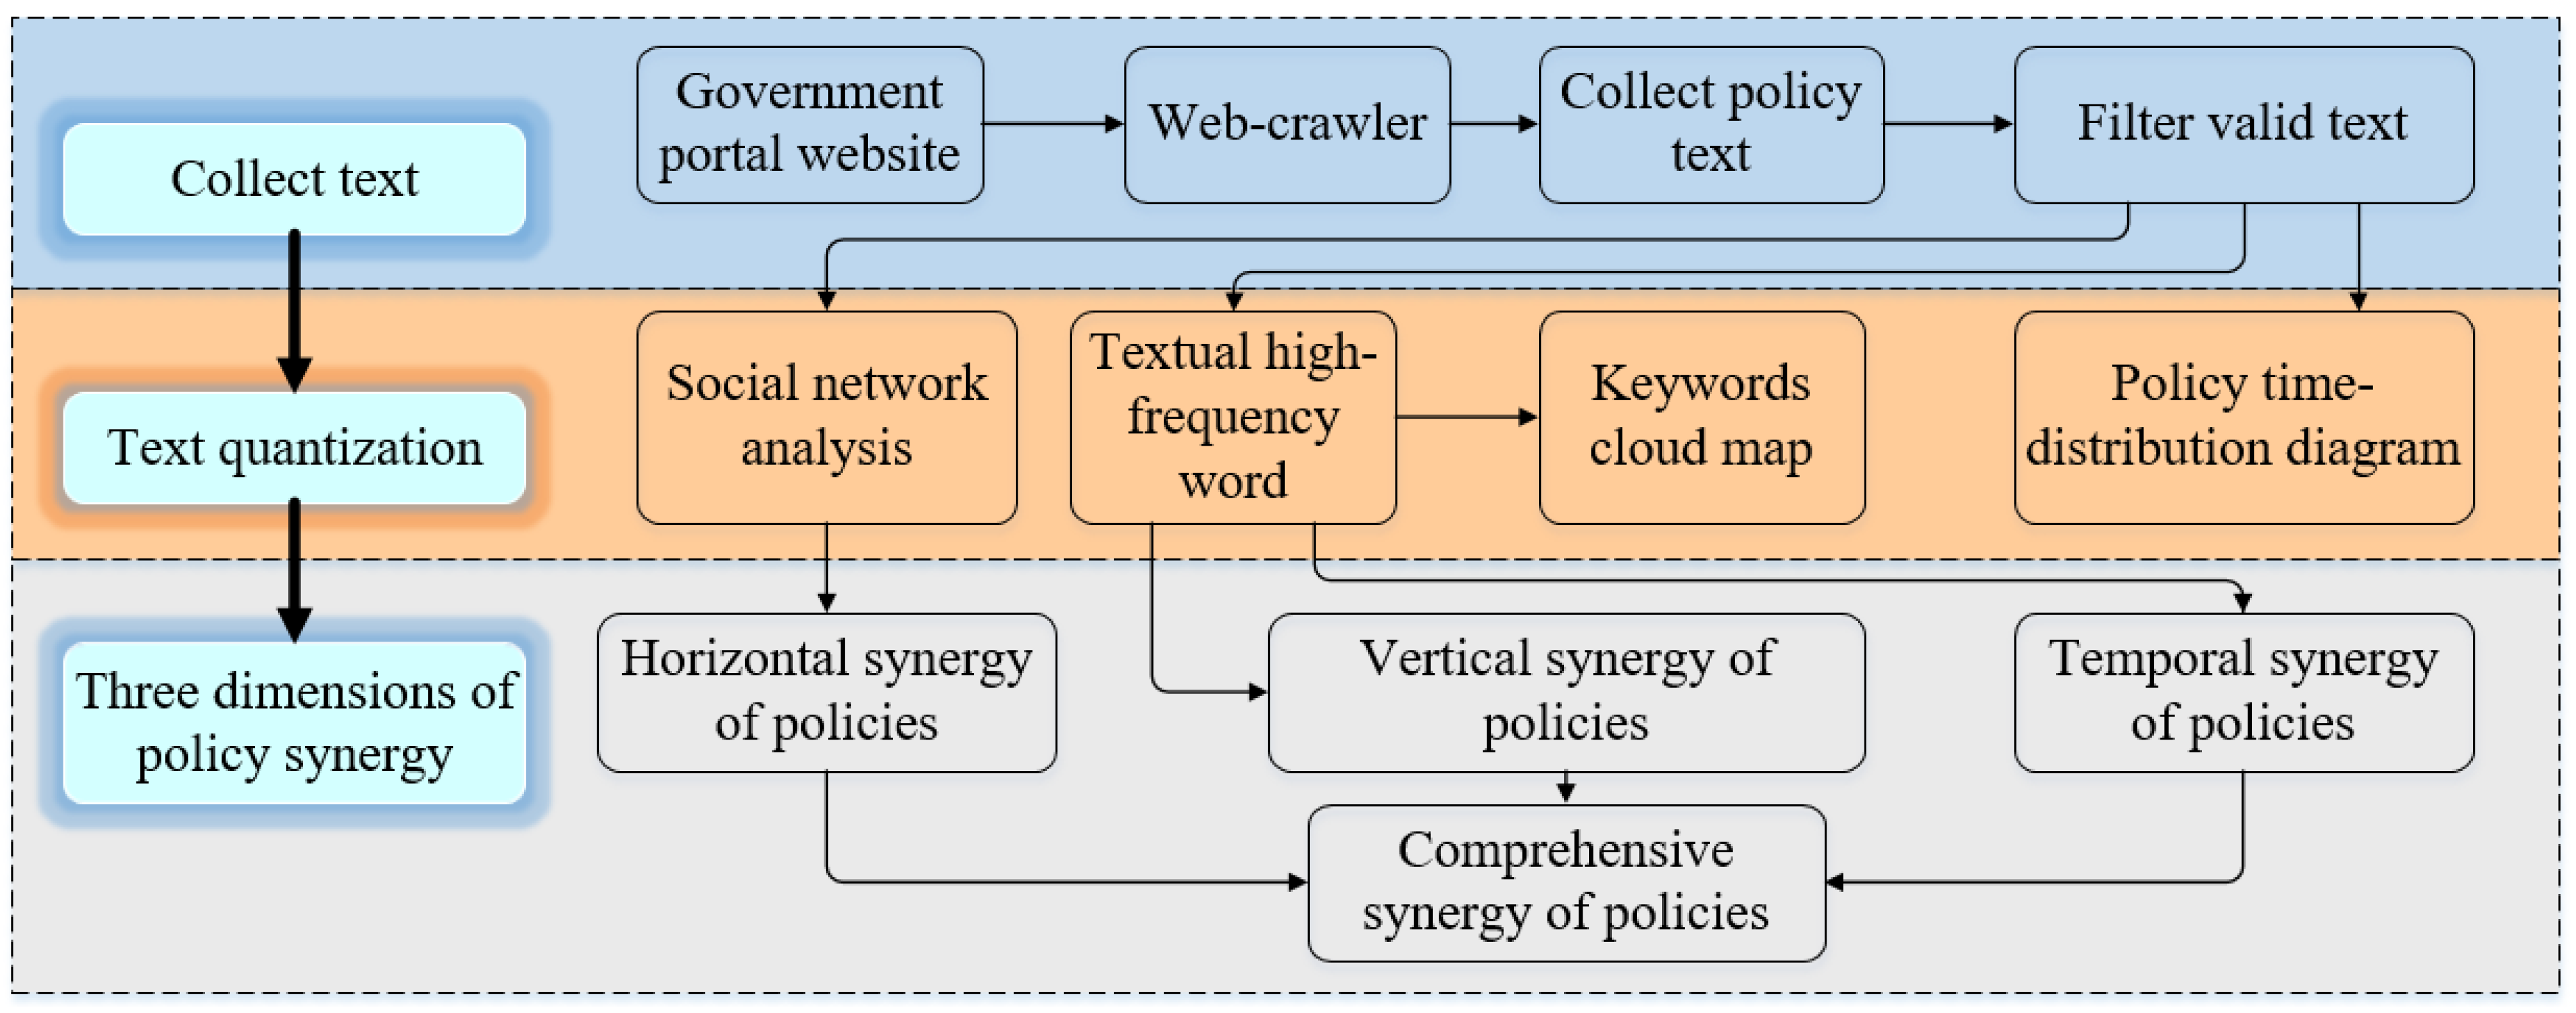
The policy text is characterized by a considerable text, complete semantics, many terms, and no fixed structure. Thus, based on previous research and related characteristics of overcapacity policy, we construct a text-mining model of de-capacity policy, as shown in Figure A1. The model is divided into three dimensions: collect text, text quantification, and three dimensions of policy synergy.
Figure A1. Process of mining the text of policies.
Energies 19 00902 g0a1
(3)
Quantitative criteria of horizontal synergy evaluation
This study uses the social network analysis method to analyze the degree of policy horizontal synergy. First, we extract the policy promulgator from policy text, count the frequency of pairwise cooperation among policy promulgators, and use Excel to construct the co-occurrence matrix of the promulgator of de-capacity policy. Second, we use UCINET 6.0 and NETDRAW 2.0 to analyze the co-occurrence matrix file and illustrate the policy structure indicators and network relationship diagram of the policy promulgators, respectively. In the indicator of policy structure, network density represents the horizontal synergy degree, and its calculation formula is, d = f n × n 1 where n represents network size and f represents Internet link frequency.
(4)
Quantitative criteria of vertical synergy evaluation
Based on the original policy text, this study extensively explores the core and key issues of local and central government policy to investigate the consistency of the policy text. It is generally believed that a person’s cognitive tendency is mainly reflected in the words they often use. The change in the frequency of word use reflects the change in a person’s attention to things. The analysis of the key words of the policy text can reflect the changes in the focus of the policy document, and then obtain the internal logic of the overcapacity reduction policy, text correlation characteristics, and other information. According to the previous research, the components of a special planning text generally include the current situation, trend, policy, goal, task, layout, project, implementation safeguard measures, and so on. However, a closer reading of the planning texts in the study sample demonstrates that not all elements appear in the specific planning. Therefore, through a comprehensive consideration of text mining, text computing, existing research, and reality, this paper primarily quantifies the vertical synergy of policies from three aspects: policy objectives, policy measures, and policy guarantees. Among them, policy objectives imply the expected goals, requirements, and results of policy implementation. Policy measures refer to the methods and means used in formulating and implementing policies while policy guarantees refer to the formulation of a series of policies on social insurance, relief, welfare, and comfort to help achieve policy goals.
In this study, government policy texts were classified by a policy promulgator to form a database for the vertical synergy evaluation of policy texts. The vertical synergy degree is calculated based on the proportion of keywords in the total word frequency as follows:
S x y i = x = 1 n a x y i x = 1 a x y i , x 0 , y 1 , 2 , 3
Z x y i = y = 1 3 S x y i y = 1 3 S x y i , x 0 , y 1 , 2 , 3
where x represents keywords of the policy, y represents a policy dimension (i.e., policy objectives, policy measures, and policy guarantees); i represents the policy promulgator; a x y i represents the total frequency of the policy keywords of dimension y of the policy promulgator i ; S x y i represents the intensity of policy of dimension y of policy promulgator i ; S x y i represents the intensity of the policy for dimension y in all policy promulgators; and Z x y i represents the synergy degree of policy promulgator i .
(5)
Quantitative criteria of temporal synergy evaluation
The temporal synergy evaluation of a policy is based on the analysis of the original policy text and an in-depth exploration of the core and key issues of the policy text response in different years. This is done to explore the continuity of the policy text. Consistent with vertical collaboration, this study uses text mining to evaluate policy temporal synergy. In this study, government policy texts are classified by year to form a database for the temporal synergy evaluation of policy texts. Accordingly, the temporal synergy degree is calculated based on the proportion of keywords in the total word frequency as follows:
Z x y i z = x = 1 n a x y i z x = 1 a x y i z , x 0 , y 1 , 3
Z x y i z = y = 1 3 S x y i z y = 1 3 S x y , x 0 , y 1 , 3
where x is keywords of the policy; y represents a policy dimension (i.e., policy objectives, policy measures, and policy guarantees); i represents the policy promulgator z represents the year; and a x y i z represents the total frequency of policy keywords of the dimension y of policy promulgator i in year z . Correspondingly, S x y i z represents the policy intensity of dimension y of the policy promulgator i in year z ; S x y i represents the policy intensity of dimension y in all policy promulgators; and Z x y i z represents the synergy degree of policy promulgator i in year z .
(6)
Quantitative criteria of comprehensive synergy evaluation
To comprehensively compare the synergy degree of the central and local governments, this study further constructs an index of comprehensive synergy evaluation based on the entropy method. The basic structure is as follows: comprehensive synergy degree = ω 1 × horizontal synergy degree + ω 2 × vertical synergy degree + ω 3 × temporal synergy degree. The specific process is as follows:
This study considers n evaluation objects and m evaluation indicators to construct the original data judgment matrix: X = ( x i j ) n × m   i = 1 , 2 , n , j = 1 , 2 , m .
A standardized judgment matrix is a classification of system contribution types that is made according to different indicators. In this study, the larger the index, the better the index. Therefore, the formula is as follows:
V i j = x i j min ( x j ) max ( x j ) - min ( x j )
Consequently, the proportion of the i evaluation object to the j indicator is calculated as follows:
E i j = V i j i = 1 n V i j
Further, the entropy value ( F j ) and difference degree ( G j )are calculated for each index:
F j = 1 ln ( n ) i = 1 n E i j ln E i j
G j = 1 F j
The weight ( ω j ) of each indicator is calculated as follows:
ω j = G j j = 1 m G j
Finally, the score ( S i j ) of each indicator is calculated from the following:
S i j = ω j × x i j

Appendix C

Table A2. CUR of coal industry of 10 major coal-producing provinces from 2009–2020.
YearShanxiInner MongoliaHenanShandongShaanxiGuizhouAnhuiNingxiaHeilongjiangXinjiang
20090.6650.6230.9740.8390.5910.7820.8790.6630.9590.489
20100.8020.7721.0001.0000.6270.9460.9080.7820.8780.495
20110.9010.9500.8160.9830.6070.7880.9380.8690.9090.651
20120.8900.9890.7500.8220.6190.8390.9970.8370.8290.800
20130.7630.8750.6870.9590.5700.8880.9630.8260.7730.919
20140.8160.8180.7210.8840.5860.8410.8970.9390.8330.746
20150.8220.8930.8400.8900.5950.8810.9750.9110.8350.626
20160.7250.8460.9040.8350.5791.0000.9380.8770.8440.582
20170.7050.7850.7800.8510.6590.9390.9260.9000.7810.681
20180.7440.9100.8960.8760.7490.8840.8910.8710.8780.598
20190.9281.0000.8240.9710.7670.8560.9250.8440.8390.710
20200.9860.9060.8220.9841.0000.7860.9470.9190.7990.634
Table A3. TFPGR of coal industry of 10 major coal-producing provinces from 2009–2020.
YearShanxiInner MongoliaHenanShandongShaanxiGuizhouAnhuiNingxiaHeilongjiangXinjiang
20090.1500.0790.1570.0240.1520.174−0.0240.2570.0680.062
20100.151−0.0870.1070.0360.0810.116−0.0420.136−0.039−0.065
20110.0940.283−0.004−0.012−0.1110.0140.186−0.341−0.0620.170
2012−0.075−0.089−0.0730.078−0.1580.001−0.093−0.19−0.045−0.060
2013−0.069−0.376−0.085−0.164−0.2450.119−0.167−0.01−0.087−0.340
2014−0.032−0.116−0.015−0.057−0.203−0.067−0.074−0.053−0.064−0.243
20150.053−0.1000.165−0.123−0.032−0.0750.173−0.1780.0330.016
20160.178−0.0870.289−0.1980.019−0.0130.209−0.0090.0780.019
20170.2890.0120.3090.0090.189−0.1790.3150.1690.1280.138
20180.3950.1380.3890.1780.205−0.0980.3890.2040.2090.264
20190.4110.2560.0000.2940.2910.0130.4980.2810.3170.309
20200.2450.2060.0120.2230.233−0.0050.3770.1740.1900.309

Appendix D

Table A4. Cluster-Robust OLS Regression Results (Dependent Variables: CUR and CPEC).
CURCPEC
Control variable
MI0.179 (0.075)−0.205 (0.140)
GDPI0.182 (0.058)−0.210 (0.205)
IRDE0.065 (0.040)0.042 (0.037)
Independent variable level-1
HSDGP0.034 (0.168)0.038 (0.170)0.054 (0.118)0.057 (0.120)
VSDGP0.188 (0.119)0.192 (0.121)0.005 (0.141)0.006 (0.143)
TSDGP0.308 * (0.108)0.315 * (0.110)−0.090 (0.071)−0.094 (0.073)
Model Summary Indicators
Adjusted R²0.2650.3180.2380.279
With controlNo YesNo Yes
F-statistic (p-value)0.2860.3240.2510.283
Clustering LevelProvincialProvincialProvincialProvincial
Observations (N)120120120120
Note: * indicate statistical significance at the 10% percent levels.

Appendix E

Table A5. Equations of the random coefficient regression model.
ModelLevel-1Level-2
Model 1a R P C i j = β 0 j + β 1 j ( H S D G P ) + β 2 j ( M I ) + β 3 j ( G D P I ) + β 4 j ( I R D E ) + γ i j β 0 j = γ 00 + μ 0 j
β 1 j = γ 10 + μ 1 j
β 2 j = γ 20 + μ 2 j
β 3 j = γ 30 + μ 3 j
β 4 j = γ 40 + μ 4 j
Model 1b R P C i j = β 0 j + β 1 j ( V S D G P ) + β 2 j ( M I ) + β 3 j ( G D P I ) + β 4 j ( I R D E ) + γ i j Same with Level-2 of Model 1a
Model 1c R P C i j = β 0 j + β 1 j ( T S D G P ) + β 2 j ( M I ) + β 3 j ( G D P I ) + β 4 j ( I R D E ) + γ i j Same with Level-2 of Model 1a
Model 3a T F P G R i j = β 0 j + β 1 j ( H S D G P ) + β 2 j ( M I ) + β 3 j ( G D P I ) + β 4 j ( I R D E ) + γ i j Same with Level-2 of Model 1a
Model 3b T F P G R i j = β 0 j + β 1 j ( V S D G P ) + β 2 j ( M I ) + β 3 j ( G D P I ) + β 4 j ( I R D E ) + γ i j Same with Level-2 of Model 1a
Model 3c T F P G R i j = β 0 j + β 1 j ( T S D G P ) + β 2 j ( M I ) + β 3 j ( G D P I ) + β 4 j ( I R D E ) + γ i j Same with Level-2 of Model 1a
Model 5a I I P C i j = β 0 j + β 1 j ( H S D G P ) + β 2 j ( M I ) + β 3 j ( G D P I ) + β 4 j ( I R D E ) + γ i j Same with Level-2 of Model 1a
Model 5b I I P C i j = β 0 j + β 1 j ( V S D G P ) + β 2 j ( M I ) + β 3 j ( G D P I ) + β 4 j ( I R D E ) + γ i j Same with Level-2 of Model 1a
Model 5c I I P C i j = β 0 j + β 1 j ( T S D G P ) + β 2 j ( M I ) + β 3 j ( G D P I ) + β 4 j ( I R D E ) + γ i j Same with Level-2 of Model 1a
Model 6a D R P M T = β 0 j + β 1 j ( H S D G P ) + β 2 j ( M I ) + β 3 j ( G D P I ) + β 4 j ( I R D E ) + γ i j Same with Level-2 of Model 1a
Model 6b D R P M T i j = β 0 j + β 1 j ( V S D G P ) + β 2 j ( M I ) + β 3 j ( G D P I ) + β 4 j ( I R D E ) + γ i j Same with Level-2 of Model 1a
Model 6c D R P M T i j = β 0 j + β 1 j ( T S D G P ) + β 2 j ( M I ) + β 3 j ( G D P I ) + β 4 j ( I R D E ) + γ i j Same with Level-2 of Model 1a
Model 7a A A S E i j = β 0 j + β 1 j ( H S D G P ) + β 2 j ( M I ) + β 3 j ( G D P I ) + β 4 j ( I R D E ) + γ i j Same with Level-2 of Model 1a
Model 7b A A S E i j = β 0 j + β 1 j ( V S D G P ) + β 2 j ( M I ) + β 3 j ( G D P I ) + β 4 j ( I R D E ) + γ i j Same with Level-2 of Model 1a
Model 7c A A S E i j = β 0 j + β 1 j ( T S D G P ) + β 2 j ( M I ) + β 3 j ( G D P I ) + β 4 j ( I R D E ) + γ i j Same with Level-2 of Model 1a

Appendix F

Table A6. Equations of the intercept model.
ModelLevel-1Level-2
Model 1d R P C i j = β 0 j + β 1 j ( M I ) + β 2 j ( G D P I ) + β 3 j ( I R D E ) + γ i j β 0 j = γ 00 + γ 01 ( H S D G P ) + μ 0 j
β 1 j = γ 10 + μ 1 j
β 2 j = γ 20 + μ 2 j
β 3 j = γ 30 + μ 3 j
Model 1e R P C i j = β 0 j + β 1 j ( M I ) + β 2 j ( G D P I ) + β 3 j ( I R D E ) + γ i j β 0 j = γ 00 + γ 01 ( V S D G P ) + μ 0 j
β 1 j = γ 10 + μ 1 j
β 2 j = γ 20 + μ 2 j
β 3 j = γ 30 + μ 3 j
Model 1f R P C i j = β 0 j + β 1 j ( M I ) + β 2 j ( G D P I ) + β 3 j ( I R D E ) + γ i j β 0 j = γ 00 + γ 01 ( T S D G P ) + μ 0 j
β 1 j = γ 10 + μ 1 j
β 2 j = γ 20 + μ 2 j
β 3 j = γ 30 + μ 3 j
Model 3d T F P G R i j = β 0 j + β 1 j ( M I ) + β 2 j ( G D P I ) + β 3 j ( I R D E ) + γ i j Same with Level-2 of Model 1d
Model 3e T F P G R i j = β 0 j + β 1 j ( M I ) + β 2 j ( G D P I ) + β 3 j ( I R D E ) + γ i j Same with Level-2 of Model 1e
Model 3f T F P G R i j = β 0 j + β 1 j ( M I ) + β 2 j ( G D P I ) + β 3 j ( I R D E ) + γ i j Same with Level-2 of Model 1f
Model 5d I I P C i j = β 0 j + β 1 j ( M I ) + β 2 j ( G D P I ) + β 3 j ( I R D E ) + γ i j Same with Level-2 of Model 1d
Model 5e I I P C i j = β 0 j + β 1 j ( M I ) + β 2 j ( G D P I ) + β 3 j ( I R D E ) + γ i j Same with Level-2 of Model 1e
Model 5f I I P C i j = β 0 j + β 1 j ( M I ) + β 2 j ( G D P I ) + β 3 j ( I R D E ) + γ i j Same with Level-2 of Model 1f
Model 6d D R P M T i j = β 0 j + β 1 j ( M I ) + β 2 j ( G D P I ) + β 3 j ( I R D E ) + γ i j Same with Level-2 of Model 1d
Model 6e D R P M T i j = β 0 j + β 1 j ( M I ) + β 2 j ( G D P I ) + β 3 j ( I R D E ) + γ i j Same with Level-2 of Model 1e
Model 6f D R P M T i j = β 0 j + β 1 j ( M I ) + β 2 j ( G D P I ) + β 3 j ( I R D E ) + γ i j Same with Level-2 of Model 1f
Model 7d A A S E i j = β 0 j + β 1 j ( M I ) + β 2 j ( G D P I ) + β 3 j ( I R D E ) + γ i j Same with Level-2 of Model 1d
Model 7e A A S E i j = β 0 j + β 1 j ( M I ) + β 2 j ( G D P I ) + β 3 j ( I R D E ) + γ i j Same with Level-2 of Model 1e
Model 7f A A S E i j = β 0 j + β 1 j ( M I ) + β 2 j ( G D P I ) + β 3 j ( I R D E ) + γ i j Same with Level-2 of Model 1f

References

  1. Mao, J.; Wang, D.; Chen, F.; Li, C.; Shi, X.; Zhang, Y. A novel text-based framework for forecasting coal power overcapacity in China from the industrial correlation perspective. Technol. Forecast. Soc. Change 2024, 208, 123690. [Google Scholar] [CrossRef]
  2. Zhang, G.; Zhang, P.; Zhang, Z.G.; Li, J. Impact of environmental regulations on industrial structure upgrading: An empirical study on Beijing-Tianjin-Hebei region in China. J. Clean. Prod. 2019, 238, 117848. [Google Scholar] [CrossRef]
  3. Liu, D.; Wang, D.; Mao, J. Study on policy synergy strategy of the central government and local governments in the process of coal de-capacity: Based on a two-stage evolutionary game method. Resour. Policy 2023, 80, 103132. [Google Scholar] [CrossRef]
  4. Drews, S.; Exadaktylos, F.; Bergh, J. Assessing synergy of incentives and nudges in the energy policy mix. Energy Policy 2020, 144, 111605. [Google Scholar] [CrossRef]
  5. Li, C.; Liu, J.; Wang, L. Research on the influence mechanism of public green behavior guiding policy effect: From the perspective of policy synergy system. Environ. Dev. Sustain. 2025, 27, 12703–12744. [Google Scholar] [CrossRef]
  6. Wang, Y.; Mao, J.; Chen, F.; Wang, D. Uncovering the dynamics and uncertainties of substituting coal power with renewable energy resources. Renew. Energy 2022, 193, 669–686. [Google Scholar] [CrossRef]
  7. Liu, D.; Wang, D. Evaluation of the synergy degree of industrial de-capacity policies based on text mining: A case study of China’s coal industry. Resour. Policy 2022, 76, 102547. [Google Scholar] [CrossRef]
  8. Funashima, Y. Macroeconomic policy coordination between Japanese central and local governments. Empir. Econ. 2018, 54, 1631–1651. [Google Scholar] [CrossRef]
  9. Yao, C.Y.; Sun, M.G.; Liu, L. Evaluation of policy synergy in coastal ocean pollution prevention and control: The case from China. Front. Mar. Sci. 2023, 10, 102–135. [Google Scholar] [CrossRef]
  10. Zhang, X. The institutional structuring of innovation policy coordination: Theory and evidence from East Asia. Policy Sci. 2019, 53, 101–138. [Google Scholar] [CrossRef]
  11. Ma, G.; Li, X.; Zheng, J. Efficiency and equity in regional coal de-capacity allocation in China: A multiple objective programming model based on gini coefficient and data envelopment analysis. Resour. Policy 2020, 66, 102256. [Google Scholar] [CrossRef]
  12. Wang, D.; Wan, K.; Song, X. Quota allocation of coal overcapacity reduction among provinces in China. Energy Policy 2018, 116, 170–181. [Google Scholar] [CrossRef]
  13. Wang, Y.; Wang, D.; Shi, X. Exploring the multidimensional effects of China’s coal de-capacity policy: A regression discontinuity design. Resour. Policy 2022, 75, 102504. [Google Scholar] [CrossRef]
  14. Wang, D.; Liu, Y.; Wang, Y.; Shi, X.; Song, X. Allocation of coal de-capacity quota among provinces in China: A bi-level multi-objective combinatorial optimization approach. Energy Econ. 2020, 87, 104709. [Google Scholar] [CrossRef]
  15. Wang, D.; Wan, K.; Song, X.; Liu, Y. Provincial allocation of coal de-capacity targets in China in terms of cost, efficiency, and fairness. Energy Econ. 2019, 78, 109–128. [Google Scholar] [CrossRef]
  16. Zhang, W.; Meng, J.; Tian, X. Does de-capacity policy enhance the total factor productivity of China’s coal companies? A Regression Discontinuity design. Resour. Policy 2020, 68, 101741. [Google Scholar] [CrossRef]
  17. Luo, T.; Jin, J.; Chen, W. An empirical study on the investment status of industrial pollution control in China. J. Econ. Res. 2019, 32, 99–103. [Google Scholar]
  18. Liu, Q.; Li, X.; Meng, X. Effectiveness research on the multi-player evolutionary game of coal-mine safety regulation in China based on system dynamics. Saf. Sci. 2019, 111, 224–233. [Google Scholar] [CrossRef]
  19. Wang, D.L.; Wan, K.D.; Song, X.F. Coal miners’ livelihood vulnerability to economic shock: Multi-criteria assessment and policy implications. Energy Policy 2018, 114, 301–314. [Google Scholar] [CrossRef]
  20. Fu, Y.; He, C.; Luo, L. Does the low-carbon city policy make a difference? Empirical evidence of the pilot scheme in China with DEA and PSM-DID. Ecol. Indic. 2021, 122, 107238. [Google Scholar] [CrossRef]
  21. Qin, X.; Zhuang, C.C.; Yang, R. Does the one-child policy improve children’s human capital in urban China? A regression discontinuity design. J. Comp. Econ. 2017, 45, 287–303. [Google Scholar] [CrossRef]
  22. Wang, Z.; Zhao, X.G.; Zhou, Y. Biased technological progress and total factor productivity growth: From the perspective of China’s renewable energy industry. Renew. Sustain. Energy Rev. 2021, 146, 111136. [Google Scholar]
  23. Milligan, G.; Cooper, M.; Steinley, D. A study of standardization of variables in cluster analysis. J. Classif. 1998, 5, 181–204. [Google Scholar] [CrossRef]
  24. Zhang, Y.J.; Jin, Y.L.; Zhu, T. The health effects of individual characteristics and environmental factors in China: Evidence from the hierarchical linear model. J. Clean. Prod. 2018, 194, 554–563. [Google Scholar] [CrossRef]
  25. Bryk, A.S.; Raudenbush, S.W. Hierarchical Linear Models: Applications and Data Analysis Methods; SAGE Publications, Inc.: Thousand Oaks, CA, USA, 1992; Volume 16, pp. 188–233. [Google Scholar]
  26. Agasisti, T.; Cordero-Ferrera, J.M. Educational disparities across regions: A multilevel analysis for Italy and Spain. J. Policy Model. 2013, 35, 55–88. [Google Scholar] [CrossRef]
  27. Diez-Roux, V.A. Bringing context back into epidemiology: Variables and fallacies in multilevel analysis. Am. J. Public Health 1998, 88, 216–222. [Google Scholar] [CrossRef]
  28. James, L.R. Aggregation bias in estimates of perceptual agreement. J. Appl. Psychol. 1982, 67, 219–229. [Google Scholar] [CrossRef]
  29. Bash, K.L.; Howell Smith, M.C.; Trantham, P.S. A systematic methodological review of hierarchical linear modeling in mixed methods research. J. Mix. Methods Res. 2021, 15, 190–211. [Google Scholar] [CrossRef]
  30. Pollitt, C. Joined-Up Government: A Survey. Political Stud. Rev. 2003, 1, 34–49. [Google Scholar] [CrossRef]
  31. Zhou, K.; Wang, Q.; Tang, J.; Wang, X. Tripartite Evolutionary Game and Simulation Analysis of Coal Mining Safe Production Supervision under the Chinese Central Governments Reward and Punishment Mechanism. Math. Probl. Eng. 2021, 21, 55–82. [Google Scholar]
  32. Zhang, Y.; Yuan, Z.W.; Margni, M.; Bulle, C.; Hua, H.; Jiang, S.Y.; Liu, X.W. Intensive carbon dioxide emission of coal chemical industry in China. Appl. Energy 2019, 236, 540–550. [Google Scholar] [CrossRef]
  33. Sahoo, A.K.; Sahu, N.C.; Sahoo, D. Impact of policy reforms on the productivity growth of Indian coal mining: A decomposition analysis. Resour. Policy 2018, 59, 460–467. [Google Scholar] [CrossRef]
  34. Wen, S.; Jia, Z. The energy, environment and economy impact of coal resource tax, renewable investment, and total factor productivity growth. Resour. Policy 2022, 77, 120231. [Google Scholar] [CrossRef]
  35. Yang, Q.; Liu, Y.; Du, X.; Wang, D.; Zou, S.; Zhang, L. How to improve energy efficiency in China: A novel integrated approach based on resource allocation. Sustain. Energy Technol. Assess. 2024, 69, 103883. [Google Scholar] [CrossRef]
Figure 1. Policy synergy assessment framework.
Energies 19 00902 g001
Figure 2. Research conceptual model.
Energies 19 00902 g002
Figure 3. Multi-dimensional effect analysis of coal capacity governance policy synergy.
Energies 19 00902 g003
Figure 4. Raw coal production by provinces in 2020.
Energies 19 00902 g004
Figure 5. Summary graph of cross-level regression results.
Energies 19 00902 g005
Table 1. Summary of the implication of variables.
VariablesSymbolImplication of VariablesReferences
Dependent variablesEconomic
benefits
PRCIt shows how much profit can be obtained for each dollar cost, which reflects the operating results brought by operating expenses.[14]
CURIt represents the degree of capacity utilization of the industry, obtained by calculating the ratio of production to capacity.[15]
TFPGRIt represents the development of industrial upgrading and productivity, which is used to measure production efficiency.[16]
Environmental benefits CPECIt represents the energy consumption of coal production expressed by the standard coal volume.[11]
IIPCThe index refers to the total amount of funds each province spends on industrial pollution control each year.[17]
Social benefitsDRPMTThe index is used to measure the level of safety production in the coal industry.[18]
AASEThe index is used to measure the average labour compensation of workers in the coal industry.[19]
Independent variablesSDGP of the central governmentHSDGPIt represents the degree of synergy between the central government departments in formulating and implementing policies in the planning of similar matters.[7]
VSDGPIt represents the degree to which the central government is consistent with the original intentions of local governments.
TSDGPIt represents the continuity of the central government’s policy texts in terms of objectives, measures, and guarantees.
SDGP of local governmentsHSDGPIt represents the degree of synergy between local government departments in formulating and implementing policies in the planning of similar matters.
VSDGPIt represents the degree to which local governments are consistent with the original intent of the central government’s policies.
TSDGPIt represents the continuity of local government’s policy texts in terms of objectives, measures, and guarantees.
Control variablesMarketization indexMIIt represents the level and degree of regional marketization development.[20]
GDP index (last year = 100)GDPIIt represents the relative number of trends and extent of changes in GDP over a given period of time.[21]
investment of R&D expenditureIRDEIt represents expenditures for basic research, applied research, and experimental development.[20]
Table 2. Descriptive statistics of the main variables.
VariablesNumberMean ValueUnitSDMin ValueMax Value
Local
Level
Control variablesMI1205.670-----1.3802.8108.530
GDPI120102.286-----1.41998.700106.300
IRDE120235.188100 million yuan338.8616.5691563.679
Dependent variableRPC1200.116-----0.132−0.1300.537
CUR1200.824-----0.1230.4891
TFPGR1200.061-----0.175−0.3760.498
CPEC120891.786Ten-kiloton standard coal1070.7832.1264525.150
IIPC12028.213100 million yuan25.2653.185141.646
DRPMT1200.335-----0.6010.0063.170
AASE1207.019100 million yuan2.4382.72814.720
Independent variableHSDGP1200.058-----0.16501
VSDGP1200.217-----0.23400.868
TSDGP1200.093-----0.11900.419
Central LevelIndependent variableHSDGP120.767-----0.2290.2001
VSDGP120.217-----0.1220.0760.437
TSDGP120.383-----0.2610.0360.809
Note: ‘-----’ indicates no unit.
Table 3. The results of null models analysis.
Model EquationRandom Effect
SymbolSDVard.f. χ 2 p-ValueDeviance
Model 1 R P C i j = β 0 j + γ i j μ 0 j 0.4100.1681132.9000.001332.605
β 0 j = γ 00 + μ 0 j γ i j 0.9190.844
Model 2 C U R i j = β 0 j + γ i j μ 0 j 0.0150.000118.113>0.500340.663
β 0 j = γ 00 + μ 0 j γ i j 0.9990.999
Model 3 T F P G R i j = β 0 j + γ i j μ 0 j 0.7040.49611111.8500.000293.124
β 0 j = γ 00 + μ 0 j γ i j 0.7350.541
Model 4 C P E C i j = β 0 j + γ i j μ 0 j 0.0160.000118.691>0.500340.663
β 0 j = γ 00 + μ 0 j γ i j 0.9990.999
Model 5 I I P C i j = β 0 j + γ i j μ 0 j 0.2250.0611116.8930.100339.624
β 0 j = γ 00 + μ 0 j γ i j 0.9760.952
Model 6 D R P M T i j = β 0 j + γ i j μ 0 j 0.4070.1661132.5390.001332.789
β 0 j = γ 00 + μ 0 j γ i j 0.9200.847
Model 7 A A S E i j = β 0 j + γ i j μ 0 j 0.7900.62411173.5430.000268.522
β 0 j = γ 00 + μ 0 j γ i j 0.6500.422
Note: SD means standard deviation; Var means variance component; d.f. means the degree of freedom; χ 2 means the chi-square test.
Table 6. Robustness tests for control variables.
RPCTFPGRIIPCDRPMTAASE
Fix effect: Control variable
MI0.0390.277 *0.290 **0.298 **−0.152−0.313 *−0.371 **−0.194 **
GDPI0.732 ***−0.121−0.124−0.138−0.097−0.230−0.405−0.237
RD−0.005−0.198 *−0.197 **−0.213 *0.878 ***0.0410.0310.081 *
AORC0.466 **0.0070.016−0.0080.172 **−0.366 ***−0.456 ***0.047
Fix effect: Independent variable in Level-1
HSDGP −0.055−0.058 **
VSDGP 0.104 * −0.217 *
TSDGP
Fix effect: Independent variable in Level-2
HSDGP 0.190 *
TSDGP0.318 **0.422 ** 0.495 ***
Random effect
Level - 2 ,   μ 0 j 0.200 ***0.368 ***0.506 ***0.501 ***0.124 ***0.196 ***0.200 ***0.574 ***
Level - 1 ,   γ i j 0.6820.5020.5040.4970.2290.7140.6140.261
Deviance318.748289.077292.205292.627202.457324.029314.321234.103
Note: ***, **, and * indicate statistical significance at the 1%, 5%, and 10% percent levels, respectively.
Table 7. Robustness tests for changing sample size.
RPCTFPGRIIPCDRPMTAASE
Fix effect: Control variable
MI−0.463 **0.1340.0980.089−0.264 **−0.521 *−0.622 *−0.120
GDPI0.686 **−0.295−0.226−0.262−0.151−0.432−0.6800.044
RD0.426 **−0.115−0.075−0.0850.1230.0470.0540.014
Fix effect: Independent variable in Level-1
HSDGP −0.023−0.163 **
VSDGP 0.143 * −0.411 *
TSDGP
Fix effect: Independent variable in Level-2
HSDGP 0.139 *
TSDGP0.226 * 0.178 * 0.160 *
Random effect
Level - 2 , μ 0 j 0.252 ***0.205 ***0.247 ***0.245 ***0.179 ***0.167 ***0.177 ***0.202 ***
Level - 1 , γ i j 0.5910.4010.4440.4330.2481.2041.0110.165
Deviance174.526154.301156.619154.964121.059217.967211.65399.483
Note: ***, **, and * indicate statistical significance at the 1%, 5%, and 10% percent levels, respectively.
Table 4. The estimation of fixed effects and random effects of the random coefficient regression model.
Dependent
Variable
ModelFix EffectRandom Effect
Control VariableIndependent Variable (Level-1)Level-2,
  μ 0 j
Level-1
γ i j
Deviance
MIGDPIIRDEHSDGPVSDGPTSDGP
RPCModel 1a0.029
(0.168)
0.737 ***
(0.207)
0.012
(0.131)
−0.006
(0.073)
0.192 **0.669321.924
Model 1b0.013
(0.178)
0.713 ***
(0.201)
0.003
(0.143)
−0.058
(0.077)
0.190 ***0.677322.775
Model 1c−0.001
(0.186)
0.642 ***
(0.206)
0.024
(0.152)
−0.119
(0.076)
0.193 ***0.649320.573
TFPGRModel 3a0.286 **
(0.114)
−0.133
(0.182)
−0.213 **
(0.096)
0.030
(0.034)
0.500 ***0.501292.408
Model 3b0.298 **
(0.112)
−0.138
(0.183)
−0.213 **
(0.092)
0.104 *
(0.059)
0.501 ***0.497292.627
Model 3c0.286 **
(0.106)
−0.112
(0.184)
−0.217 *
(0.085)
0.043
(0.094)
0.502 ***0.491291.402
IIPCModel 5a−0.180 **
(0.057)
−0.121
(0.105)
0.945 ***
(0.109)
−0.111 *
(0.052)
0.119 ***0.280217.02
Model 5b−0.143 **
(0.056)
−0.036
(0.107)
0.883 ***
(0.101)
0.081
(0.059)
0.126 ***0.210196.187
Model 5c−0.162 **
(0.059)
−0.077
(0.110)
0.890 ***
(0.100)
0.033
(0.020)
0.126 ***0.221199.238
DRPMTModel 6a−0.312 *
(0.147)
−0.230
(0.206)
0.041
(0.055)
−0.058 *
(0.022)
0.196 ***0.714324.029
Model 6b−0.372 **
(0.164)
−0.405
(0.259)
0.031
(0.056)
−0.217 *
(0.116)
0.200 ***0.611314.322
Model 6c−0.309 **
(0.148)
−0.252
(0.212)
0.033
(0.058)
−0.040
(0.094)
0.197 ***0.697323.635
AASEModel 7a−0.173 **
(0.077)
−0.296
(0.372)
0.070
(0.047)
−0.036
(0.040)
0.640 ***0.267243.298
Model 7b−0.188 *
(0.088)
−0.249
(0.357)
0.075
(0.044)
0.004
(0.051)
0.640 ***0.270243.603
Model 7c−0.190 **
(0.074)
−0.283
(0.329)
0.078
(0.046)
−0.095
(0.065)
0.641 ***0.262238.624
Note: ***, **, and * indicate statistical significance at the 1%, 5%, and 10% percent levels, respectively.
Table 5. The estimation of fixed effects and random effects of intercept model.
Dependent
Variable
ModelFix EffectRandom Effect
Control VariableIndependent Variable (Level-2)Level-2,
μ 0 j
Level-1
γ i j
Deviance
MIGDPIIRDEHSDGPVSDGPTSDGP
RPCModel 1d0.036
(0.172)
0.737 ***
(0.199)
−0.012
(0.138)
−0.026
(0.104)
0.201 ***0.677322.39
Model 1e0.037
(0.172)
0.754 ***
(0.188)
−0.014
(0.137)
−0.088
(0.085)
0.189 ***0.678321.99
Model 1f0.039
(0.177)
0.732 ***
(0.197)
−0.005
(0.139)
0.318 **
(0.112)
0.200 ***0.682318.748
TFPGRModel 3d0.190
(0.123)
−0.123
(0.174)
−0.197 **
(0.088)
0.290 **
(0.126)
0.506 ***0.504292.201
Model 3e0.267 **
(0.114)
−0.144
(0.187)
−0.197 **
(0.088)
0.214
(0.171)
0.616 ***0.499292.585
Model 3f0.277 **
(0.112)
−0.121
(0.167)
−0.199
(0.087)
0.422 **
(0.145)
0.367 ***0.501289.077
IIPCModel 5d−0.158 **
(0.060)
−0.092
(0.108)
0.889 ***
(0.104)
0.049
(0.105)
0.127 ***0.231201.991
Model 5e−0.162 *
(0.062)
0.092
(0.110)
0.900 ***
(0.106)
−0.058
(0.063)
0.119 ***0.229202.192
Model 5f−0.156 **
(0.059)
−0.097
(0.112)
0.884 ***
(0.101)
0.063
(0.064)
0.137 ***0.231201.966
DRPMTModel 6d−0.312 *
(0.146)
−0.210
(0.208)
0.039
(0.055)
−0.090
(0.105)
0.199 ***0.713323.107
Model 6e−0.308 *
(0.146)
−0.220
(0.204)
0.230
(0.055)
−0.020
(0.055)
0.207 ***0.715323.673
Model 6f−0.311 *
(0.145)
−0.207
(0.206)
0.035
(0.056)
−0.093
(0.072)
0.183 ***0.717323.133
AASEModel 7d−0.184 **
(0.078)
0.279
(0.361)
0.068
(0.042)
0.127
(0.136)
0.650 ***0.274241.875
Model 7e−0.185 **
(0.077)
−0.264
(0.382)
0.070
(0.042)
0.056
(0.185)
0.663 ***0.272242.233
Model 7f−0.184 **
(0.080)
−0.237
(0.335)
0.080
(0.037)
0.496 ***
(0.099)
0.574 ***0.261234.103
Note: ***, **, and * indicate statistical significance at the 1%, 5%, and 10% percent levels, respectively.
Disclaimer/Publisher’s Note: The statements, opinions and data contained in all publications are solely those of the individual author(s) and contributor(s) and not of MDPI and/or the editor(s). MDPI and/or the editor(s) disclaim responsibility for any injury to people or property resulting from any ideas, methods, instructions or products referred to in the content.