Article

Research on the Influence of Heating Power and Filling Ratio on the Heat Transfer Performance of Thermosyphon

1
School of Energy and Power Engineering, Inner Mongolia University of Technology, Hohhot 010080, China
2
Engineering Research Center of Renewable Energy, Universities of Inner Mongolia Autonomous Region, Hohhot 010080, China
3
Key Laboratory of Wind Energy and Solar Energy Technology, Ministry of Education, Hohhot 010080, China
*
Author to whom correspondence should be addressed.
Energies 2026, 19(4), 1079; https://doi.org/10.3390/en19041079
Submission received: 21 November 2025 / Revised: 15 February 2026 / Accepted: 15 February 2026 / Published: 20 February 2026

Abstract

To support the integration of high shares of renewable energy and enhance the operational flexibility of thermal power systems, thermosyphon have been considered as promising high-efficiency heat transfer components for thermal energy storage applications. In this study, a water-based thermosyphon motivated by molten-salt thermal energy storage scenarios is investigated numerically to clarify its internal heat-transfer behavior under different operating conditions. A two-dimensional CFD model is established based on the Volume-of-Fluid (VOF) multiphase approach coupled with the Lee phase-change model. The effects of heating power (3.5–5.0 kW) and liquid filling ratio (25–40%) on wall temperature distribution and thermal resistance characteristics are systematically analyzed. The results indicate that increasing the filling ratio improves the uniformity of the evaporator wall temperature, and a filling ratio of 40% leads to a relatively favorable liquid distribution and the lowest total thermal resistance within the investigated range. The evaporator thermal resistance exhibits a “decrease–increase” trend with heating power and reaches a minimum value of 1.019 × 10⁻⁴ K/W at 4.5 kW, while the condenser thermal resistance decreases monotonically with in-creasing heating power. This study provides comparative numerical insights into the coupled effects of heating power and filling ratio on thermosyphon performance, offering a reference for the component-level design and parameter selection of heat pipe heat exchangers in molten-salt-related thermal energy storage systems.

1. Introduction

To achieve the goals of carbon peaking before 2030 and carbon neutrality before 2060, China is accelerating the development of high-proportion renewable energy, which accounted for more than one-third of the total electricity generation in 2024. However, renewable energy is volatile and random, and its large-scale integration has complicated the structure and operation characteristics of the power system. At the same time, the contradiction between the installed capacity of renewable energy and the limited system absorption capacity has led to a large number of “wind and solar curtailment” phenomena [1,2]. To this end, during the 13th Five-Year Plan to the 14th Five-Year Plan period, the country has continuously strengthened the construction of peak-shaving capacity, promoted the flexible transformation of thermal power plants, the coordinated dispatch of multiple clean energy sources, and actively developed energy storage technology. Molten salt thermal energy storage, as a safe, reliable and inexpensive energy storage technology, has huge market demand in scenarios such as the construction of large-scale renewable energy bases for wind [3], solar [4] and the flexible transformation of thermal power plants [5]. Heat pipe heat exchangers, with their advantages of high-efficiency heat transfer, reliable structure and no mechanical drive, can achieve rapid energy exchange in such thermal energy storage systems, which plays a key role in improving thermal energy storage efficiency and system response speed [6].
In recent years, extensive research has been carried out by scholars worldwide on the heat transfer mechanisms of thermosyphon using numerical simulation methods, leading to significant progress in the optimization of phase-change models and the characterization of interfacial mass transfer processes.
De Schepper et al. [7] employed the Volume-of-Fluid (VOF) method combined with user-defined functions (UDFs) to establish a three-dimensional CFD phase-change model for boiling processes. Subsequently, Alizadehdakhel et al. [8] developed a two-dimensional VOF-based vapor–liquid phase-change model for a thermosyphon with water as the working fluid, demonstrating the feasibility of using the VOF approach to simulate complex multiphase heat and mass transfer inside thermosyphon.
To further improve phase-change modeling accuracy, Ding et al. [9] dynamically adjusted the mass transfer relaxation parameter of the Lee phase-change model based on vapor–liquid mass exchange, enabling the coefficient to converge toward a stable value. Tan et al. [10] further modified the condensation relaxation coefficient (βc) of the Lee model by formulating it as a function that strictly satisfies mass conservation and dynamically varies with local thermodynamic conditions. Kim et al. [11] systematically analyzed the influence of evaporation and condensation coefficients on the heat-transfer performance of thermosyphon using a CFD approach. Their results showed that when both the evaporation and condensation coefficients are set to 0.1, the numerical simulation can accurately reproduce the evaporation–condensation mass-transfer process, with the deviation between the predicted temperature field and experimental data being less than 5%, thereby significantly improving the accuracy of heat-transfer prediction in thermosyphon. To further elucidate the microscopic mechanisms involved in phase-change processes, the Colombo group [12] innovatively coupled a wall–fluid particle interaction model with the conventional transport equations, enabling precise capture of the dynamic evolution of bubbles. This approach improved the accuracy of phase-change interface tracking by approximately 18%.
Regarding the influence of operating parameters, Sadeghi et al. [13] numerically investigated a thermosyphon using special oil as the working fluid and reported that the highest thermal efficiency occurred at a filling ratio of 30%, while the maximum thermal resistance appeared at a filling ratio of 90%. Tecchio [14] and Imura et al. [15], based on definitions of the evaporator-section volume, recommended filling-ratio ranges of 0.25–0.30 and 1/5–1/3, respectively. Abou-Ziyan et al. [16] found that both the filling ratio and the adiabatic-section length significantly affect the steady-state temperature of the adiabatic section. When the filling ratio is 0.5, the heat-transfer efficiency reaches its maximum. Under the condition of equal evaporator and condenser lengths, a longer adiabatic section allows a higher input heat flux. Noie et al. [17] showed that for thermosyphon with aspect ratios of 7.45, 9.8, and 11.8, the optimal filling ratios were 30%, 60%, and 90%, respectively. Based on total internal volume considerations, Feldman [18] and Hussein et al. [19] derived optimal filling ratios of 18–22% and approximately 20%, respectively. Jafari [20] further reported that thermosyphon with filling ratios not exceeding 35% exhibited superior thermal performance under heat inputs ranging from 30 W to 700 W.
In a broader context of engineering thermal analysis, CFD-based numerical methods have also been widely applied to investigate temperature-field characteristics in complex engineering systems subjected to severe and non-uniform thermal loading. For example, Bolina et al. [21] conducted a comprehensive CFD–FEA investigation on reinforced concrete structures exposed to fire, demonstrating that geometric configuration and engineering-equivalent boundary conditions play a critical role in determining temperature-field evolution. Such studies further support the applicability of CFD-based approaches for engineering-scale thermal analysis when appropriate physical assumptions and boundary conditions are adopted.
In addition, thermosyphon have been increasingly integrated with molten salt systems in high-temperature energy applications. Chen et al. [22] constructed an integrated experimental system combining molten salt, thermosyphon, and thermoelectric generators for micro molten salt reactors (micro-MSRs), while Gibbs et al. [23] introduced high-temperature waste heat recovery systems employing molten salt and thermosyphon heat exchangers for industrial applications such as aluminum furnaces, ceramic kilns, cement kilns, and flat-glass furnaces.
In summary, most existing studies have focused on the heat transfer characteristics of thermosyphons under conventional operating conditions, whereas investigations explicitly oriented toward molten-salt thermal energy storage applications remain relatively limited, particularly at the component and parameter-analysis level. Motivated by molten-salt thermal energy storage and flexible peak-shaving scenarios, the present work investigates a water-based thermosyphon as a representative heat-transfer component. A two-dimensional CFD model based on the VOF multiphase approach coupled with the Lee phase-change model is employed to analyze the evaporation and condensation processes inside the thermosyphon. By systematically varying the heating power and liquid filling ratio, the coupled effects of these parameters on wall temperature distribution and thermal resistance are examined. It should be emphasized that the objective of this study is to provide comparative, trend-based numerical insights at the component level, rather than system-level performance prediction of molten-salt thermal energy storage systems. The results are intended to support component design and parameter selection for future integration studies.

2. Physical Model

Based on a high-temperature steam molten salt thermal energy storage demonstration project, this study considers the application background of a heat pipe heat exchanger in molten salt thermal storage systems for deep peak-shaving units in thermal power plants. During high-load operation, the stored thermal energy can be released to heat condensate water, thereby reducing steam extraction from low-pressure heaters and improving the peak-shaving capability of thermal power units.
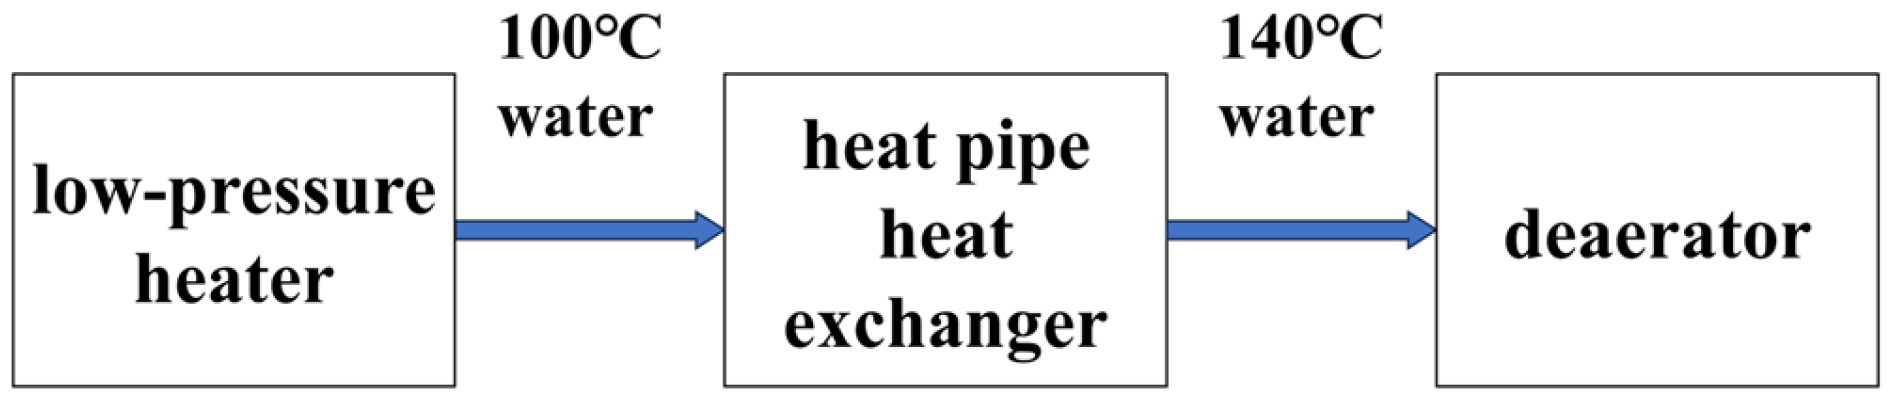
In this context, hot water at approximately 100 °C is supplied to a heat-release heat exchanger and heated to about 140 °C before being returned to the deaerator. This system-level description is provided to clarify the engineering motivation and operating range of the heat pipe heat exchanger, while the present numerical study focuses on the component-level heat transfer behavior of the thermosyphon under representative thermal conditions, with the molten salt thermal storage system introduced only as an engineering background rather than being directly modeled. The actual operating conditions are listed in Table 1, and the exothermic process involved is shown in Figure 1.
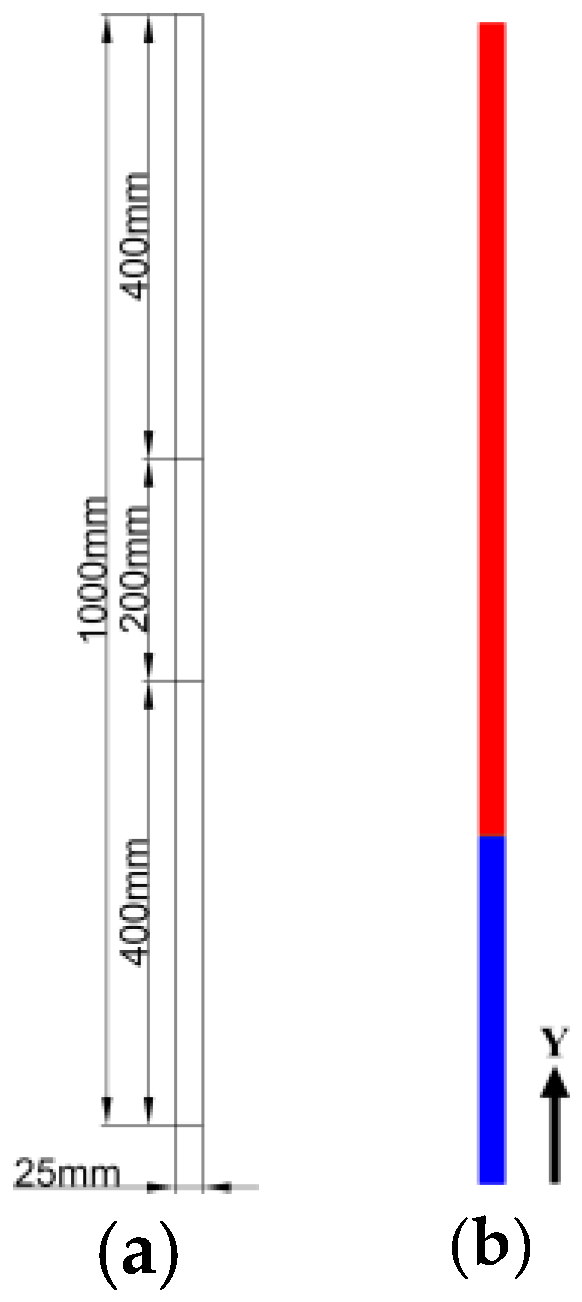
The structural parameters of a single thermosyphon in the calculated heat exchanger are shown in Table 2 and Figure 2.
For clarity, the liquid filling ratio ( L ) is defined as the ratio of the initial liquid charge to the total internal length of the thermosyphon, which can be expressed as:
L = l p l
where l p is the initial liquid column height inside the thermosyphon, m ; l the total internal length of the thermosyphon, m . For a straight thermosyphon with uniform inner diameter, this definition is geometrically equivalent to the volume-based filling ratio definition.

3. Numerical Model

3.1. Mesh Generation

The subject of this study is a standard thermosyphon, whose regular geometric structure is well suited for structured mesh discretization. Structured grids provide high boundary-fitting accuracy and superior mesh quality, while effectively enhancing computational efficiency and promoting numerical convergence. They are particularly suitable for simulating multiphase flow problems, in which quadrilateral or hexahedral meshes often yield more accurate numerical solutions. To simplify the modeling process, a multi-region surface mesh partitioning method is adopted to generate a two-dimensional structured quadrilateral grid.
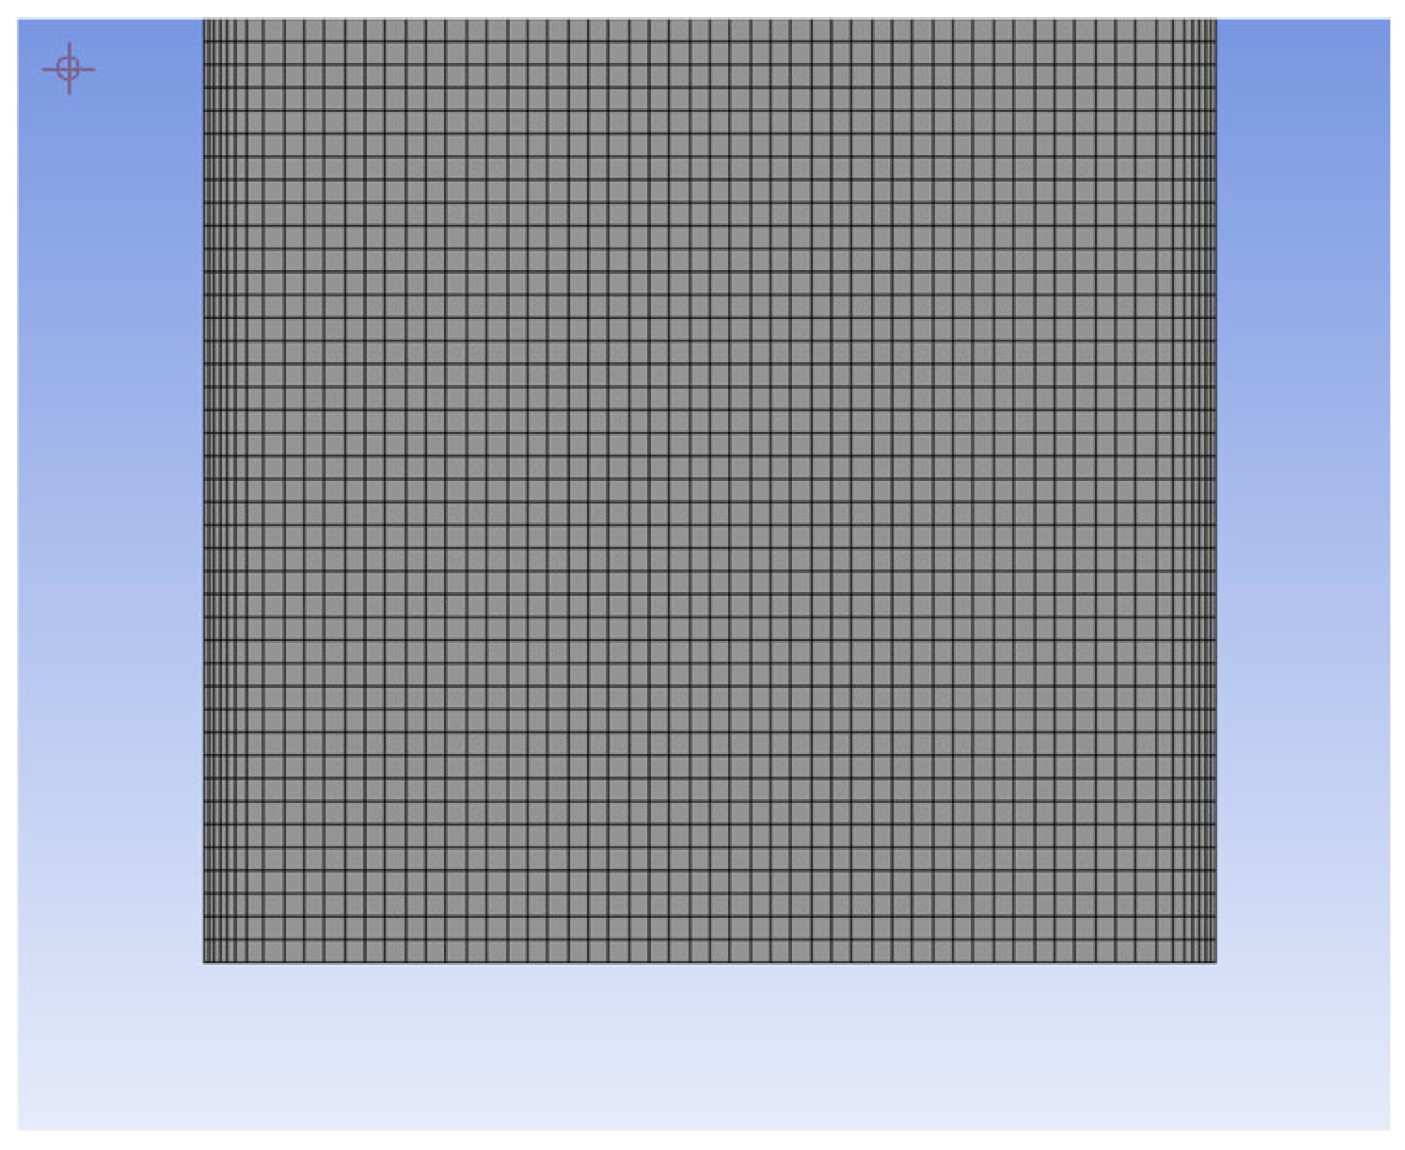
Furthermore, considering the high thermal conductivity of the copper wall in a standard two-phase closed thermosyphon, the temperature gradient across the wall thickness is negligible. In addition, the simple wall structure has a minimal influence on the internal flow field and heat and mass transfer processes. Therefore, the wall thickness is neglected in the geometric model. To accurately capture the phase-change and heat transfer behavior of the working fluid near the wall, the mesh in this region is locally refined, as illustrated in Figure 3.
To verify grid independence and ensure the reliability of the numerical results, five different grid sizes were employed for the simulations at a filling ratio of 0.3. The average temperatures of the evaporation and condenser sections of the thermosyphon were monitored for each grid size. As shown in Table 3, the thermosyphon temperatures obtained using these meshes are nearly identical. Specifically, the average temperature of the evaporator section is 510.86 ± 0.34 (RSD = 0.067%), while that of the condenser section is 380.28 ± 0.69 (RSD = 0.18%), indicating minimal variation with mesh refinement. Therefore, to reduce computational cost while maintaining sufficient accuracy, the mesh containing 116,058 elements was selected for the subsequent calculations.

3.2. VOF Model

The Volume-of-Fluid (VOF) model is a surface-tracking technique used to simulate immiscible multiphase flows by capturing the interface between fluids. It solves a single set of momentum equations while tracking the volume fraction of each phase within computational cells. The interface is reconstructed based on these volume fractions, allowing accurate prediction of surface evolution, deformation, and breakup. Owing to its robustness and low computational cost, the VOF model is widely applied to problems involving free surfaces, phase change, bubble dynamics, and liquid film motion, making it suitable for analyzing complex gas–liquid behaviors in heat-transfer systems such as thermosyphon.
Continuity Equation in the VOF Model:
1 ρ L t ( α L ρ L ) + ( α L ρ L ν ) = ( J V L J L V )
where α L is the volume fraction of the liquid working fluid; ν is the velocity vector; J V L is the transfer rate from the vapor phase to the liquid phase, kg / m 2 · s ; J L V is the transfer rate from the liquid phase to the vapor phase, kg / m 2 · s .
The proportion of the vapor and liquid phases must satisfy:
α L + α V = 1
where α V is the volume fraction of the vapor working fluid.
Momentum Equation
t ( ρ v ) + ( ρ ν ν ) = p + μ ( ν + ν T ) + ρ g + F
where p is the pressure, Pa ; g is the gravity, N ; F is the continuous surface force, N / m 3 .
Energy Equation
t ( ρ E ) + [ ν ( ρ E + p ) ] = ( k T ) + S E
where E is the internal energy, J / kg , k is the thermal conductivity, W / m · K ; S E is the energy source term, J / m 3 · s .
ρ = α L ρ L + ( 1 α L ) ρ V
k = α L k L + ( 1 α L ) k V
μ = α L μ L + ( 1 α L ) μ V
E = α L ρ L E L + α V ρ V E V α L ρ L + α V ρ V
where ρ is the density, kg / m 3 ; μ is the dynamic viscosity, Pa · s .
To more accurately capture and simulate vapor–liquid interfacial phenomena, the Continuous Surface Force (CSF) model is incorporated into the VOF model to enhance the accuracy of interfacial force representation. The core concept of the CSF model is to introduce a source term into the momentum equation, thereby transforming the surface tension effect from an interfacial force into an equivalent volumetric force. This treatment effectively avoids numerical discontinuities at the phase interface.
The formula is as follows [24]:
F C S F = 2 σ α L ρ L c V α V + α V ρ V c L α L ρ L + ρ V
where σ is the surface tension, N / m ; c V is the surface curvature of the vapor phase, c L is the surface curvature of the liquid phase, in this paper c V = c L .

3.3. Phase Transition Model

Thermosyphon, as key devices for achieving efficient heat transfer through the evaporation and condensation of the working fluid, require reliable phase-change models to enable a thorough investigation of their internal heat transfer mechanisms and phase-change processes. Among the existing approaches, the Lee model is a widely used vapor-liquid phase-change model, whose theoretical basis is derived from the Hertz-Knudsen equation and can be expressed as follows (Table 4):

3.4. Boundary Conditions and Computational Method Setup

3.4.1. Boundary Conditions and Physical Assumptions

Owing to the complexity of two-phase flow and phase-change heat and mass transfer processes inside a two-phase closed thermosyphon, several simplifying assumptions are introduced to ensure numerical stability and computational feasibility. These assumptions are commonly adopted in first-order CFD investigations of thermosyphon and are summarized as follows:
(1)
The key thermophysical properties of the working fluid, including density, viscosity, specific heat capacity, and thermal conductivity, are assumed to be constant. The effects of non-condensable gases and external environmental disturbances are neglected. This assumption primarily influences the absolute magnitude of heat transfer, while the comparative trends with respect to heating power and filling ratio are expected to remain valid within the investigated range.
(2)
The vapor–liquid interface temperature is assumed to be equal to the saturation temperature corresponding to the operating pressure. Phase change is driven by the local temperature deviation from this saturation temperature within the Lee phase-change framework.
(3)
Condensation is assumed to occur predominantly in the near-wall region of the condenser section. The liquid film formed on the condenser wall is treated as continuous, and its temperature distribution is approximated as linear across the film thickness. This treatment represents an idealized film-condensation process and is adopted to simplify the modeling of condensation heat transfer.
(4)
Both vapor and liquid phases are treated as continuous media. A liquid pool is assumed to exist in the evaporator section, and phase-change behavior is described using a phenomenological boiling representation within the VOF-Lee model, rather than a detailed microscale boiling model. As a result, boiling regimes are discussed qualitatively based on macroscopic flow and temperature characteristics.
These assumptions introduce inherent limitations, which are explicitly acknowledged in the interpretation of the numerical results. Accordingly, the conclusions of this study focus on comparative performance trends rather than exact quantitative prediction. The boundary and initial conditions associated with these assumptions are summarized in Table 5.
It should be emphasized that the imposed heat flux density in the evaporator section, the convective heat transfer coefficient applied to the condenser section, and the saturation temperature used in the phase-change model are not arbitrarily prescribed values. Instead, these parameters are derived from the actual operating conditions of the reference thermal power and molten-salt thermal energy storage system, based on energy balance relationships and thermodynamic state calculations. Specifically, the heat flux density is determined according to the designed heat input corresponding to the practical operating load and is calculated using Equation (11). The convective heat transfer coefficient represents an equivalent value associated with cooling water at constant temperature and constant flow rate under engineering conditions, and the saturation temperature is selected consistently with the operating pressure of the sealed thermosyphon. It should be noted that the saturation temperature of the thermosyphon corresponds to its operating temperature, which is typically determined through conventional engineering design procedures for heat pipe heat exchangers. In such procedures, the types and operating conditions of the hot- and cold-side fluids are first specified based on practical application requirements, and the corresponding thermosyphon operating temperature (468.15 K) and internal pressure (1.40 MPa) are then obtained. The saturation temperature and associated thermophysical properties used in the present model are therefore calculated on the basis of these engineering considerations. These boundary conditions collectively represent engineering-equivalent operating conditions, allowing the numerical model to reflect realistic thermal loading while maintaining computational stability.
q = Q A = Q π d L e

3.4.2. Calculation Method

This study employs a transient pressure-based solver for numerical simulations, with the gravitational acceleration in the Y direction set to −9.81 m/s2. The Volume-of-Fluid (VOF) multiphase model is adopted, and an explicit formulation is used for the volume fraction time discretization. Implicit body force and interface anti-diffusion are enabled to enhance numerical stability and interface sharpness. The surface tension model is activated under phase interaction, and wall adhesion effects are considered. The energy equation is enabled, and the flow is assumed to be laminar throughout the simulations. This assumption is adopted to maintain numerical stability and to enable a clear investigation of the coupled effects of heating power and liquid filling ratio within a two-dimensional modeling framework. Under the investigated operating conditions, the overall heat transfer behavior is primarily governed by gravity-driven liquid return and phase-change processes, while large-scale forced convection is absent. It is acknowledged that, at elevated heat fluxes, localized flow instabilities and transitional or turbulent features may arise in practical thermosyphon operation, particularly in the vapor core or near the vapor–liquid interface. However, resolving such phenomena would require three-dimensional modeling and turbulence closure, which are beyond the scope of the present parametric study. Accordingly, the laminar flow assumption is employed as a first-order approximation, and the numerical results are interpreted in terms of comparative trends and relative performance differences, rather than detailed prediction of turbulence-resolved flow structures. Water and water vapor are selected as the working fluids inside the thermosyphon, with water defined as the primary phase and water vapor as the secondary phase, while copper is specified as the solid material of the thermosyphon wall. Mass source terms describing evaporation and condensation are added to the continuity equations, and the corresponding energy source terms are incorporated into the energy conservation equation; these source terms are implemented using user-defined functions (UDFs). The SIMPLE algorithm is employed for pressure–velocity coupling, and the PRESTO! scheme is used for pressure discretization. Spatial gradients are evaluated using the Least Squares Cell-Based method, the volume fraction equation is discretized using the Geo-Reconstruct scheme, and both the momentum and energy equations are discretized using the first-order upwind scheme. To verify time-step independence, several time-step sizes (0.0001 s, 0.0005 s, 0.001 s, 0.005 s, and 0.01 s) were tested (Table 6). The time-averaged wall temperature and total thermal resistance obtained using a time step of 0.001 s differed by less than 0.50% compared with those obtained using smaller time steps (0.0001 s and 0.0005 s). In addition, for a time step of 0.001 s, the residuals of the continuity, momentum, and volume fraction equations decreased by at least three orders of magnitude within each time step, while the energy equation residual decreased by approximately eight orders of magnitude and remained stable during the quasi-steady stage. The stricter convergence of the energy equation supports accurate evaluation of heat transfer and contributes to satisfactory energy balance closure, with the overall imbalance remaining below 1% for all cases. Considering both numerical accuracy and computational efficiency, a time step of 0.001 s was therefore adopted for all subsequent simulations.

4. Simulation and Results Analysis

4.1. Model Validation

As there is no information regarding the application of thermosyphon at a moderate temperature that can be used in steam power plants (100–250 °C), the output results of Fadhl et al.’s [25] research, is used to test and validate the accuracy of the current numerical simulation.
Liquid water is regarded as the primary phase (liquid), and water vapor as the secondary phase (vapor). As the relative vacuum is considered in thermosyphon at the initial state, for calculations of energy and mass transfer during the phase change, the boiling temperature of 348 K is applied. The length of the evaporator, adiabatic, and condenser parts is set to be 0.2, 0.1, and 0.2 m, respectively. Five different grid sizes are generated and evaluated to check the grid independency of the system. As a thin liquid film is formed near the wall, 10 mesh layers are used as the boundary layer to capture all changes near the inner wall. The static temperature distribution in the evaporator and condenser section of the thermosyphon are shown in Table 7, when the input power is set to be 376.14 W. A slight difference can be seen in the prediction of the wall temperature of the thermosyphon between the 86,250 and 307,500 computational cells. Therefore, to reduce the calculation costs, the grid size with 143,448 cells is selected in the simulation.
As reported in Ref. [25], the wall temperature of the thermosyphon has been measured at eight points. In the evaporator, adiabatic and condensers, one, two, and five places are considered for temperature measurement, respectively. Table 8 shows the position of the thermocouples, the experimental temperature values and the temperature value obtained from the current simulation. The relative error varies between 1.63 and 5.73%. Considering the error values, it found that the present numerical simulation is valid and can be used for other temperature ranges of thermosyphon.

4.2. Performance Evaluation Metrics and Monitoring Strategy

The acquisition of wall surface temperatures provides the basis for evaluating the thermal resistance and heat transfer efficiency of the thermosyphon under different operating conditions. In the present study, the thermal resistance is determined from the wall surface temperatures, while the overall heat transfer performance is analyzed through the corresponding temperature distribution characteristics along the thermosyphon wall.
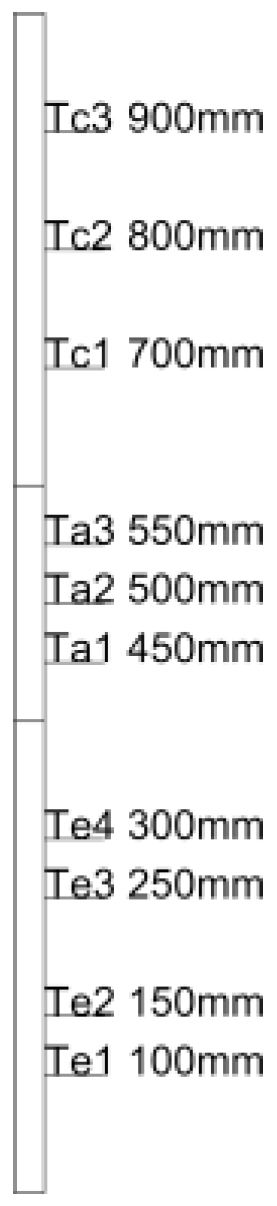
Accordingly, the selection of appropriate temperature monitoring locations is essential to ensure the accuracy and reliability of the numerical results. As illustrated in Figure 4, multiple monitoring points are arranged along the evaporator, adiabatic, and condenser sections to capture the axial temperature variation of the thermosyphon wall. These monitoring data are subsequently used for the calculation of thermal resistance and for comparative analysis of the effects of key influencing factors.
To facilitate a quantitative analysis of thermosyphon performance under different operating conditions, thermal resistance is used as the primary performance indicator to describe heat transfer efficiency. The parametric study considers filling ratios ranging from 25% to 40% and input heating powers between 3.5 and 5.0 kW. Under these conditions, the thermal resistance is defined as follows:
R e = T ¯ e T s / Q
R c = T s T ¯ c / Q
R = T ¯ e T ¯ c / Q
where R e is the thermal resistance of the evaporator section, K / W ; R c is the thermal resistance of the condenser section, K / W ; R is the total thermal resistance of the thermosyphon, K / W .

4.3. Effect of Liquid Filling Ratio on Thermosyphon Thermal Performance

4.3.1. Effect of Liquid Filling Ratio on Thermosyphon Wall Temperature

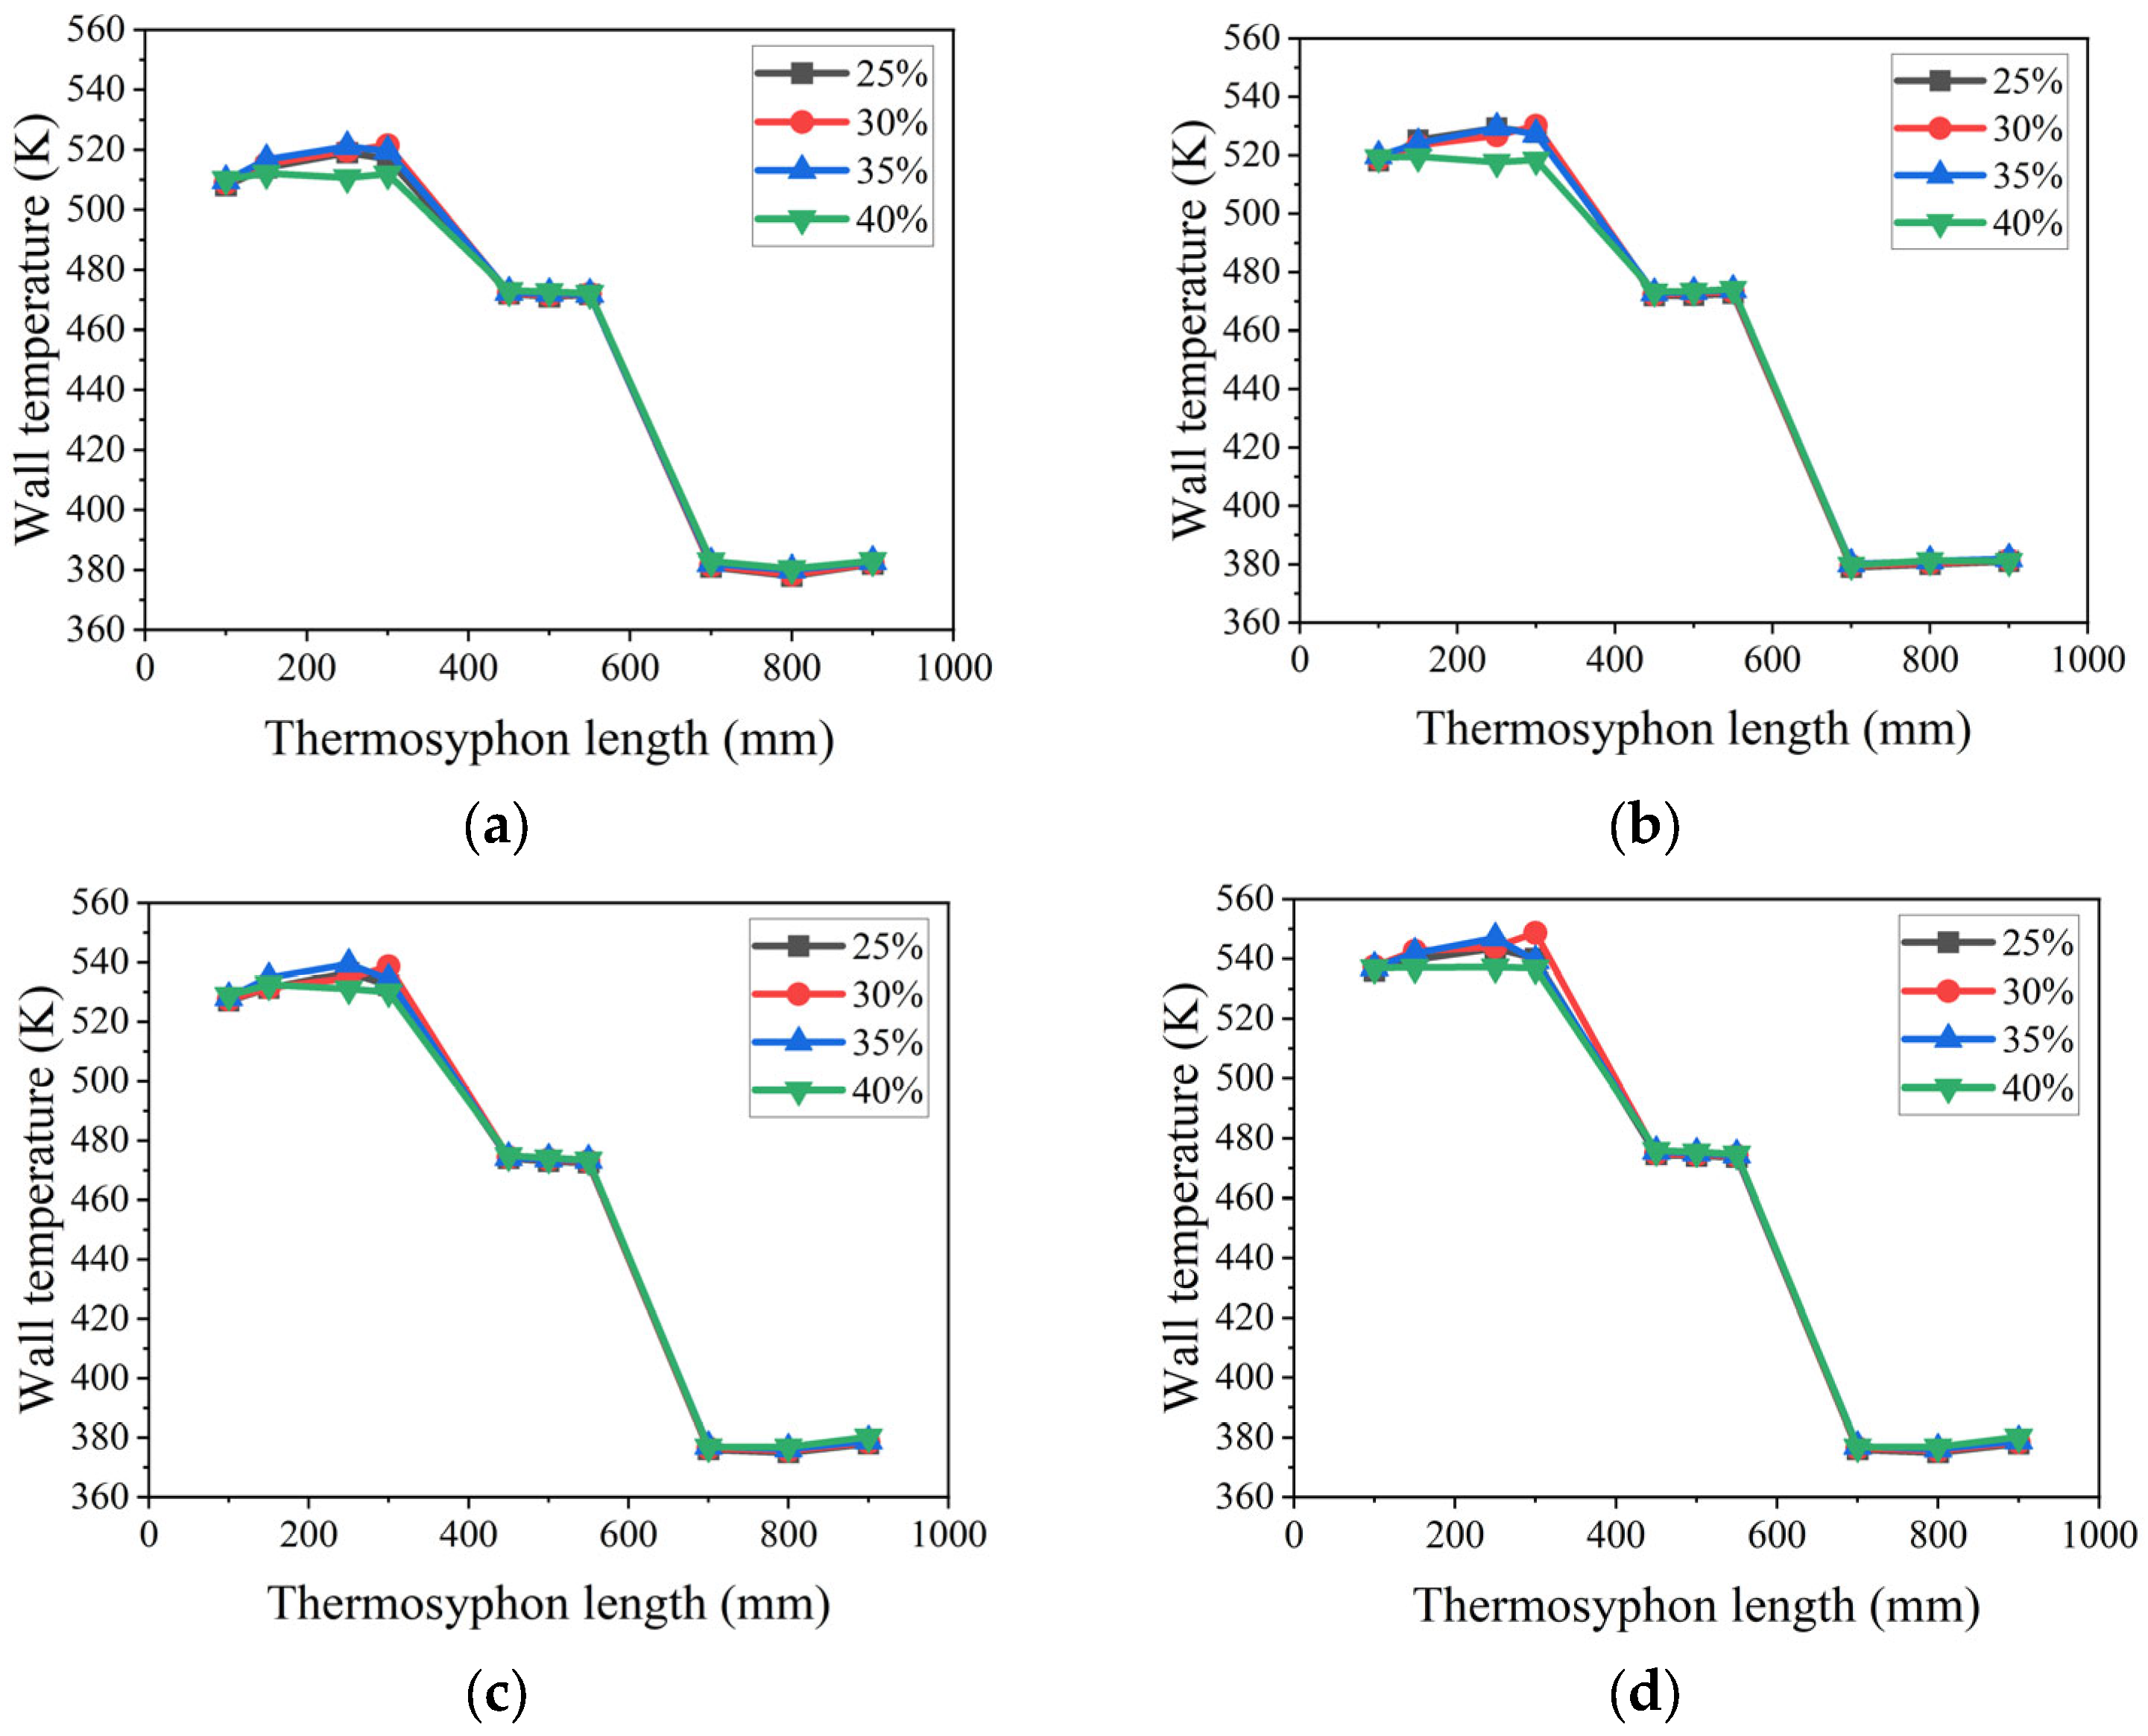
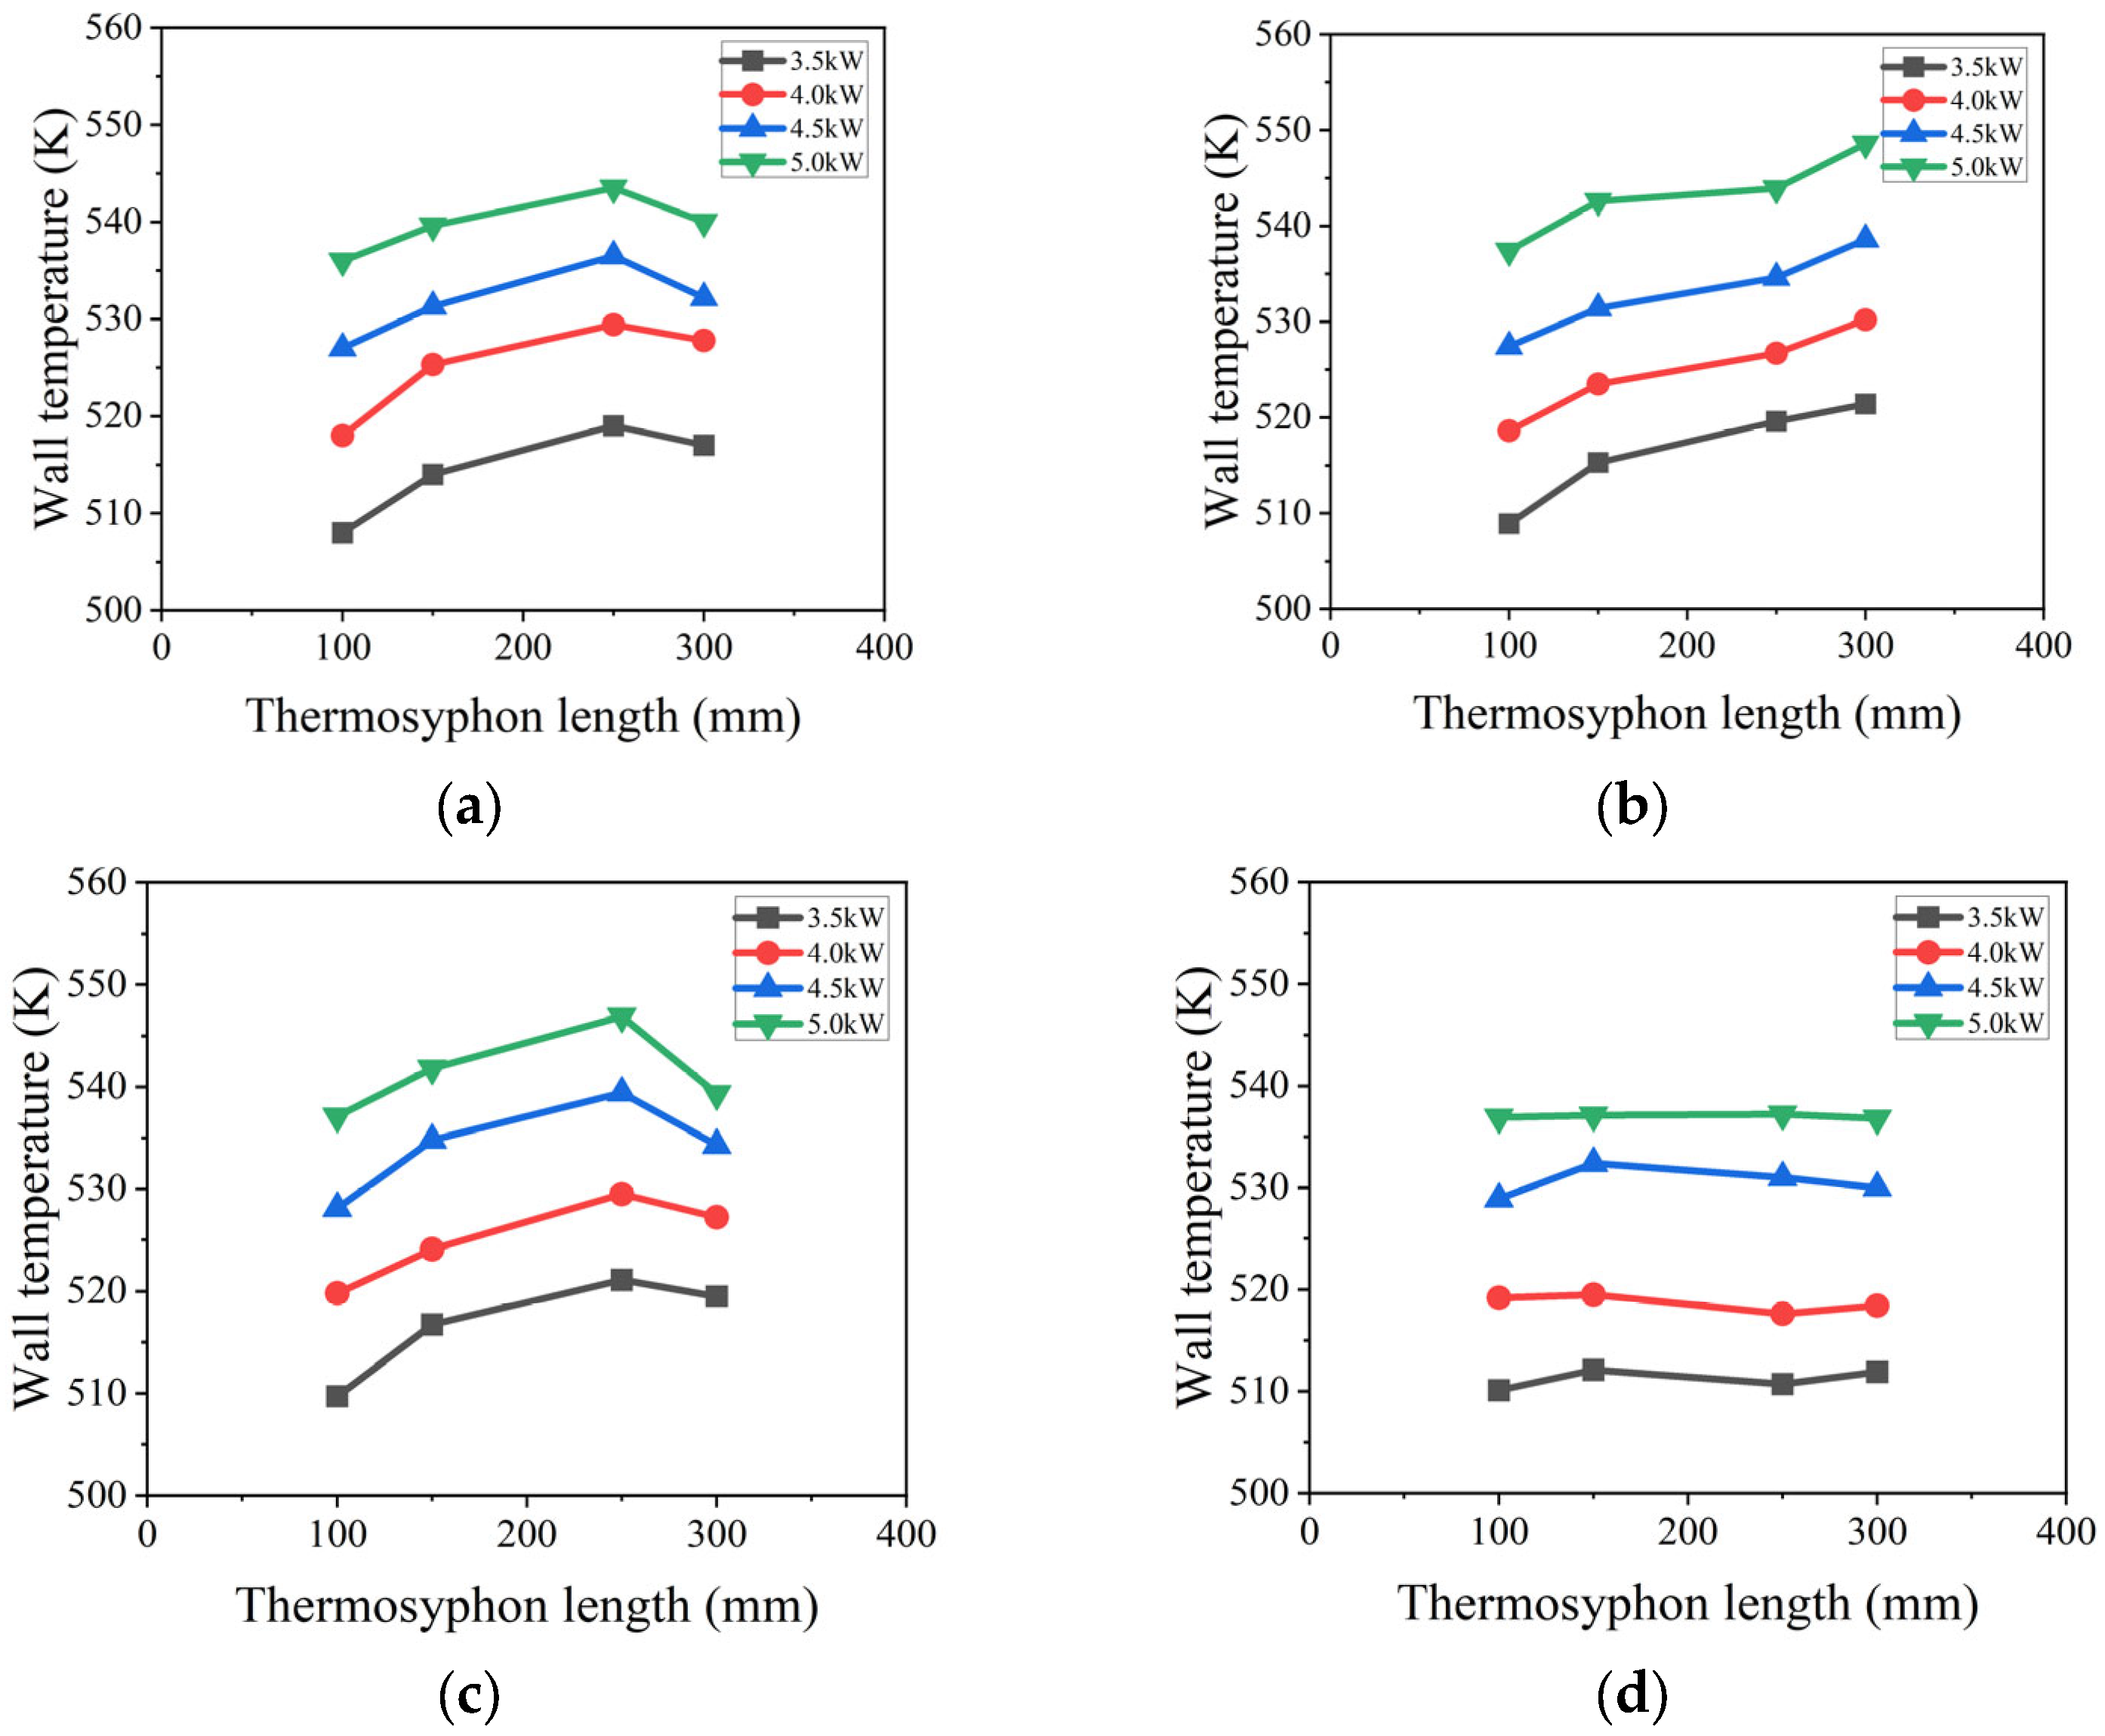
Figure 5 presents the wall temperature distributions of the thermosyphon at liquid filling ratios of 25%, 30%, 35%, and 40% under different heating powers (3.5 kW, 4 kW, 4.5 kW and 5 kW). The results indicate that the filling ratio has a pronounced influence on the temperature distribution in the evaporator section, whereas its effect on the adiabatic and condenser sections is relatively limited.
Based on the obtained results, it is found that the filling ratio has a significant influence on the wall temperature distribution in the evaporator section, while its effect on the adiabatic and condenser sections is relatively small. When the filling ratio is 40%, the liquid working fluid completely submerges the evaporator section, and the temperatures at the four measurement points (Te1–Te4) are nearly identical, exhibiting a highly uniform distribution. Under different heating powers, the average wall temperatures are 511.2 °C, 518.68 °C, 530.58 °C, and 537 °C, respectively. This behavior indicates that the wall surface is fully covered by a liquid film, enabling efficient heat transfer through stable liquid-film evaporation and nucleate boiling, while effectively preventing localized dry-out.
When the filling ratio decreases to 25%, 30%, or 35%, pronounced non-uniformity appears in the evaporation-section temperature distribution, and the location of the temperature peak varies systematically with the filling ratio. At filling ratios of 25% and 35%, the maximum temperature occurs at position Te3. For the 25% filling ratio, the peak wall temperatures at different heating powers are 519 °C, 529.4 °C, 536.5 °C, and 543.5 °C, respectively. In contrast, at a filling ratio of 30%, the temperature peak shifts to position Te4, with corresponding peak wall temperatures of 521.4 °C, 530.2 °C, 538.6 °C, and 548.6 °C. These results suggest that the spatial location of the temperature peak directly reflects variations in the vapor–liquid interface position within the evaporator section.
The underlying reason for this phenomenon is that the region near Te3 corresponds to the dynamic vapor–liquid interface. This region represents the most thermally active zone in the evaporator section. On the one hand, heat from the heated wall converges in this region through conduction; on the other hand, the working fluid undergoes intense boiling, accompanied by vigorous phase change and latent heat absorption. Meanwhile, frequent bubble generation, growth, detachment, and coalescence at the vapor–liquid interface induce strong local disturbances. Although these effects enhance heat transfer, they can also lead to localized heat accumulation, resulting in a temperature peak. Because the temperature measurement points are fixed, variations in the liquid level associated with different filling ratios are directly reflected by shifts in the peak temperature location.
By contrast, the filling ratio has little effect on the overall temperature levels in the adiabatic and condenser sections. In the adiabatic section, owing to the ideal adiabatic boundary condition, no heat input or output occurs, and the temperature differences between adjacent measurement points are negligible, with an average difference of approximately 0.54 °C under various heating powers and filling ratios. In the condenser section, although the filling ratio varies, the saturated vapor temperature from the evaporator section is mainly governed by the operating pressure and heating load, resulting in relatively similar temperatures. Moreover, the temperature and flow rate of the external cooling water are maintained at constant values, leading to only minor variations in the average wall temperature of the condenser section under different filling ratios.
Although the overall temperature variation in the condenser section is small, a characteristic distribution pattern of “high at both ends and low in the middle” is observed. On average, the temperature at Tc2 is 1.22 °C and 1.61 °C lower than those at Tc1 and Tc3, respectively. Measurement point Tc1 is located near the adiabatic section and is directly exposed to high-temperature vapor from the evaporator section, resulting in a relatively high local heat flux and temperature. Measurement point Tc3 is located at the top of the thermosyphon, where the wall is typically treated as adiabatic in simulations. As a result, rising vapor and heat tend to accumulate, forming a local high-temperature region. In contrast, Tc2 is situated in the primary condensation zone, where heat dissipation is most effective, leading to the lowest temperature among the three points.

4.3.2. Effect of Liquid Filling Ratio on Thermal Resistance of Thermosyphon Evaporator Section

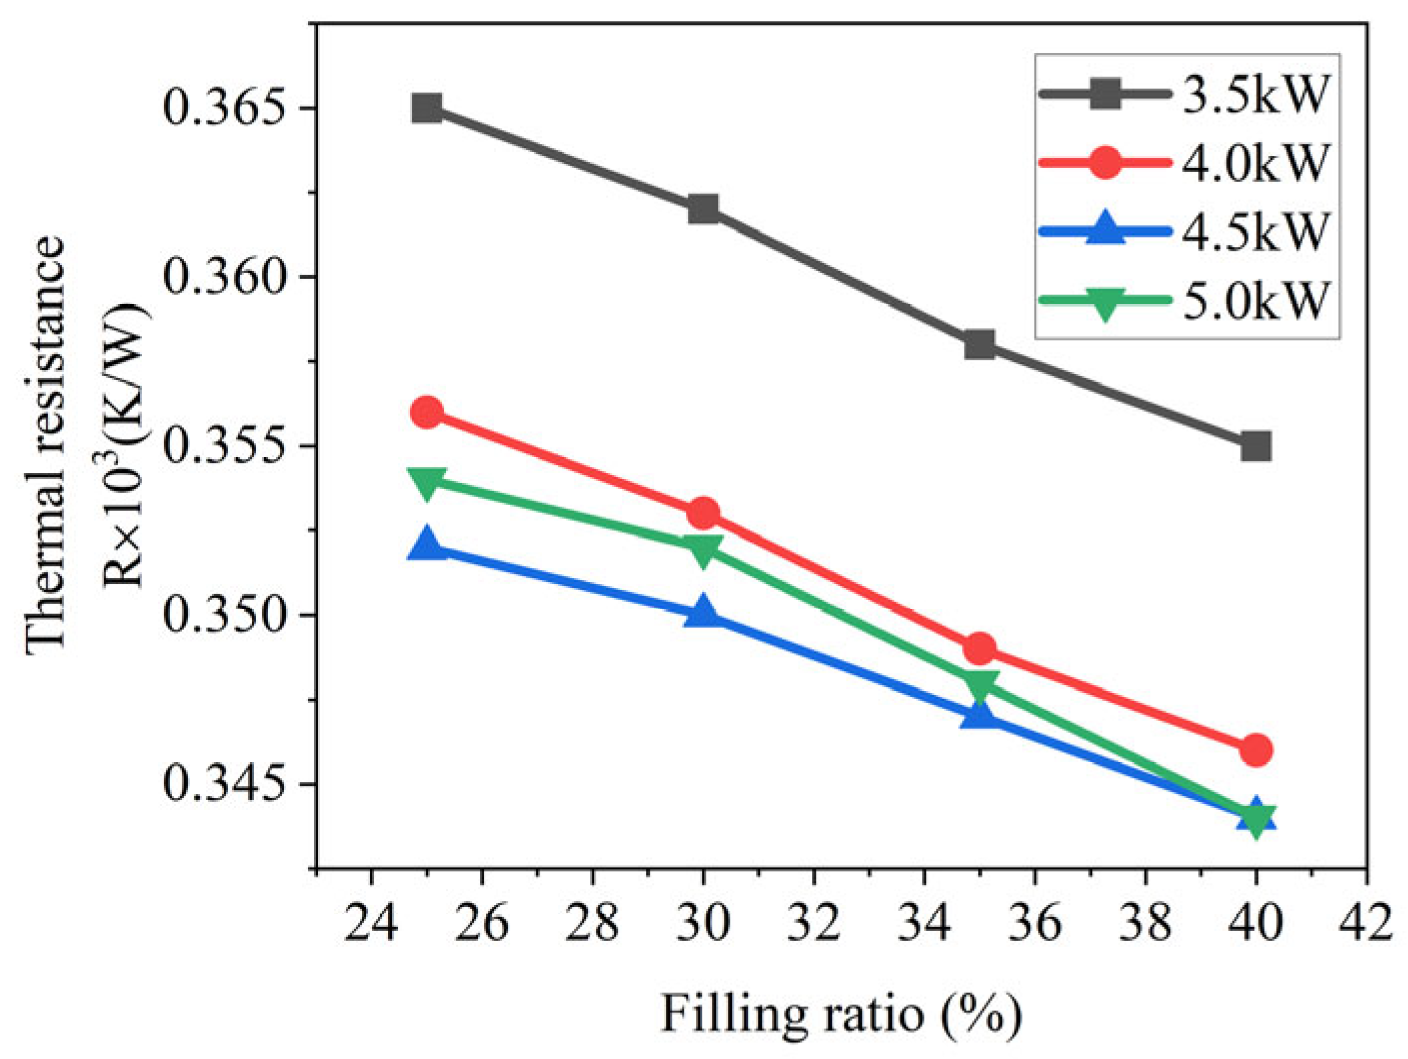
As the primary region for heat absorption and phase-change initiation, the thermal resistance of the evaporator section directly governs the overall heat transfer performance of the thermosyphon. Figure 6 illustrates the variation of evaporator thermal resistance with filling ratio under different heating powers. It is observed that the evaporator thermal resistance exhibits a clear “decrease–increase” trend as the filling ratio increases, reaching its maximum and minimum values at 25% and 40%, respectively. This trend remains consistent over the heating power range of 3.5–5.0 kW, indicating that the phase-change heat transfer behavior in the evaporator section shows a certain degree of universality under different operating conditions.
At low filling ratios (≤25%), insufficient liquid coverage in the evaporator section promotes the formation of localized dry patches. As a result, liquid-film heat transfer is weakened and the effective evaporation area is reduced, leading to relatively high thermal resistance. For example, at a filling ratio of 25%, the evaporator thermal resistance reaches 3.696 × 10⁻⁴ K/W under a heating power of 4.5 kW. When the filling ratio increases to 40%, the liquid working fluid fully covers the heating surface, stabilizing the evaporation interface. This increases the effective heat transfer area, helps maintain a relatively stable liquid film, and promotes more effective utilization of latent heat during evaporation. Consequently, the evaporator thermal resistance decreases to a minimum value of 3.317 × 10⁻⁴ K/W. However, when the filling ratio further increases (>40%), excessive liquid accumulation occurs in the evaporator section. The thickened liquid film and the flattened vapor–liquid interface suppress interfacial turbulence, inhibit bubble nucleation and interface renewal, and weaken the temperature gradient near the evaporation interface. These effects reduce the evaporation intensity, causing the evaporator thermal resistance to increase again to approximately 3.28 × 10⁻⁴ K/W. Overall, within the investigated range, a filling ratio of 40% exhibits relatively favorable evaporator performance, which is qualitatively consistent with trends reported in previous studies. In addition, as the heating power increases from 3.5 kW to 5.0 kW, the evaporator thermal resistance generally decreases. A higher heat flux enhances interfacial disturbances and bubble detachment frequency, thereby accelerating surface renewal and intensifying evaporation heat transfer. Nevertheless, the influence pattern of the filling ratio remains unchanged across different heating powers. This indicates that the filling ratio plays a dominant role in determining evaporator thermal resistance, whereas the heating power mainly affects its magnitude rather than the overall variation trend.

4.3.3. Effect of Liquid Filling Ratio on Thermal Resistance of Thermosyphon Condenser Section

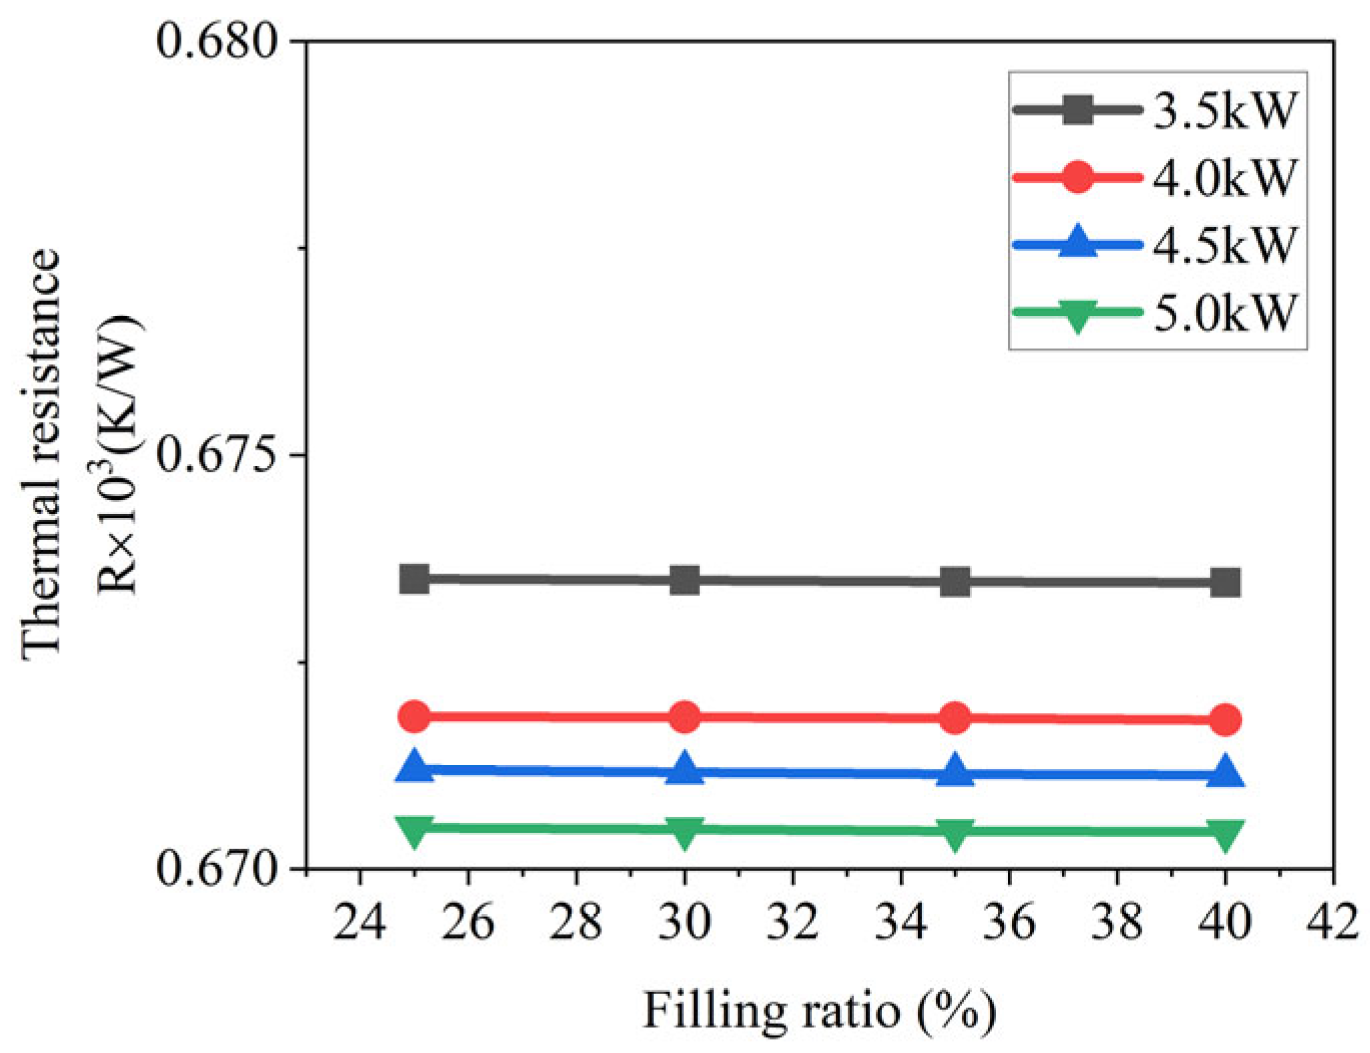
Compared with the pronounced variations observed in the condenser section, the condenser section exhibits a much lower sensitivity to the filling ratio. Figure 7 presents the variation in condenser thermal resistance under different filling ratios. It can be seen that within the filling ratio range of 25–40%, the thermal resistance of the condenser section changes only slightly and remains generally stable. This trend is consistent across different heating power levels. This behavior can be attributed to the fact that the condenser section is primarily governed by externally controlled conditions, including the vapor temperature, cooling water temperature, and cooling water flow rate. In the simulations, these parameters are maintained at constant values, thereby ensuring stable condensate drainage and vapor flow within the condenser section. As a result, a stable liquid film is formed on the condenser wall, and its thickness is far less sensitive to changes in the filling ratio than that of the liquid film in the evaporator section. Consequently, variations in the filling ratio do not induce significant changes in the thermal resistance of the condenser section.

4.3.4. Effect of Liquid Filling Ratio on Total Thermal Resistance of Thermosyphon

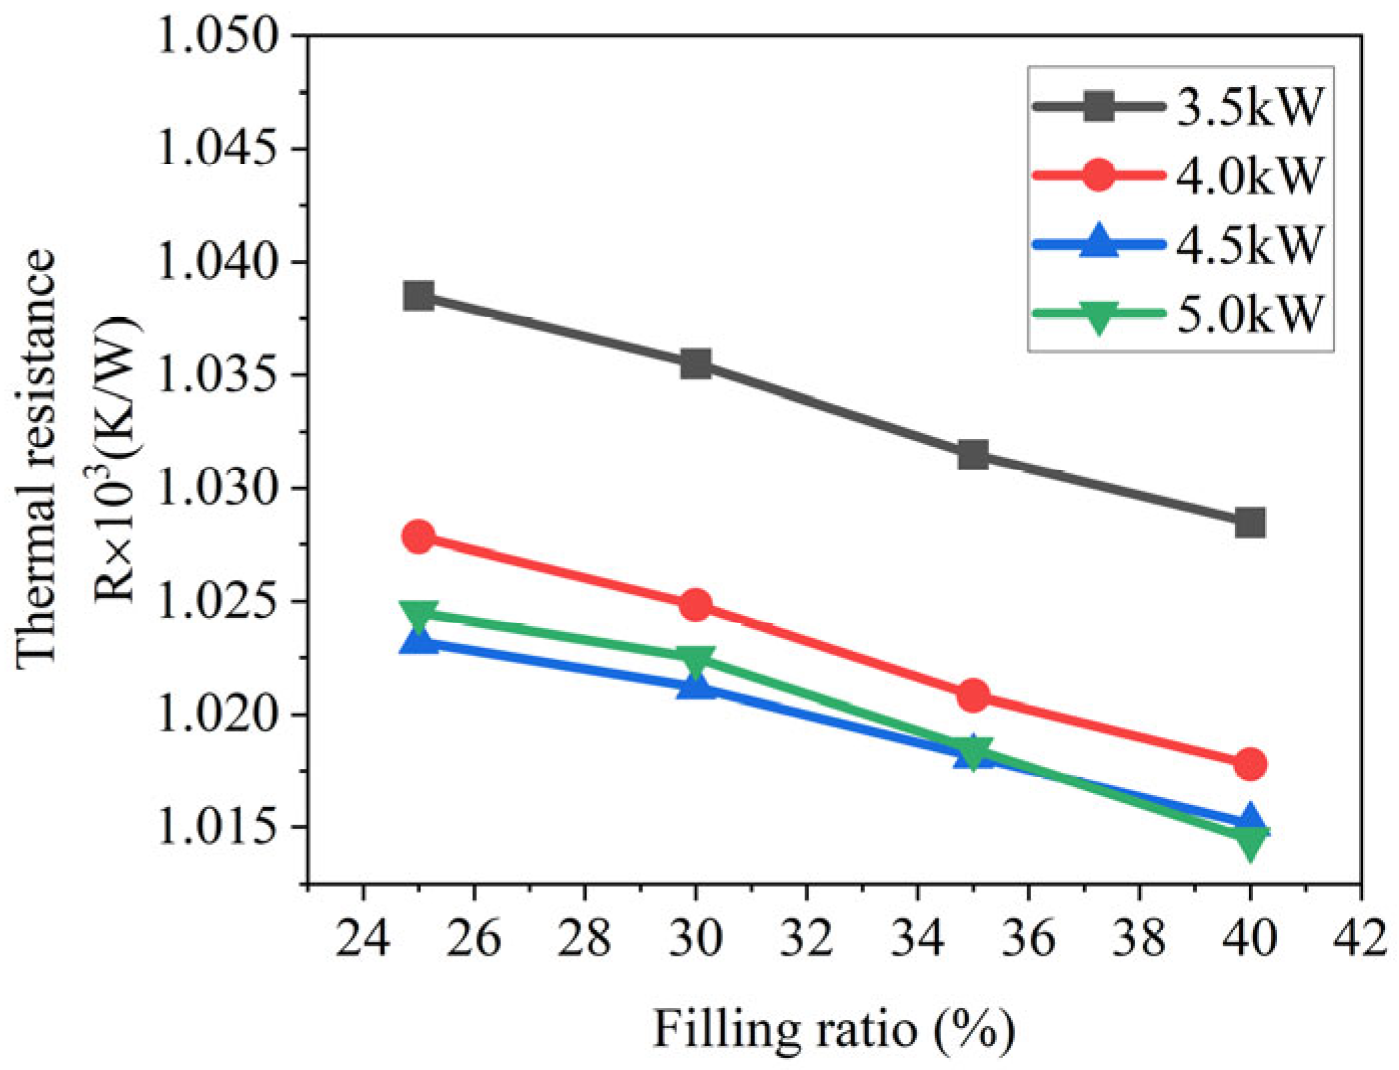
The total thermal resistance of a thermosyphon consists of the thermal resistances of the evaporator section, the condenser section, and the relatively minor resistance of the adiabatic section, among which the evaporator section is dominant. Consequently, the variation trend of the total thermal resistance with filling ratio closely follows that of the evaporator section. As shown in Figure 8, the total thermal resistance initially decreases and then increases with increasing filling ratio, reaching a minimum at 40%.
When the filling ratio increases from 25% to 40%, the total thermal resistance decreases markedly. For example, at a heating power of 4.5 kW, the total thermal resistance at a filling ratio of 40% is 1.350 × 10⁻⁴ K/W, representing a reduction of approximately 1.50% compared with that at a filling ratio of 25%. This behavior may be associated with a more favorable liquid distribution in the evaporator section, accompanied by enhanced interfacial activity observed in the VOF field, which supports more effective latent heat transfer within the investigated range. With increasing heating power, the overall total thermal resistance continues to decrease while maintaining a consistent variation trend.
However, when the filling ratio increases beyond 40%, the total thermal resistance shows an increasing tendency. At excessive filling ratios, the liquid film in the evaporator section becomes overly thick, which reduces the interfacial temperature gradient and slows the renewal of the evaporation interface, thereby weakening evaporation heat transfer. In addition, excessive liquid accumulation in the evaporator section restricts local vapor flow, reduces vapor transport capacity, and ultimately deteriorates the overall heat transfer performance of the thermosyphon.
Overall, although the variation in total thermal resistance within the investigated range is relatively small (approximately 1.31–1.50%), it reflects a consistent response of the thermosyphon to changes in liquid filling ratio under high heat-flux conditions. Such variations, while modest in magnitude, may still influence the operational stability and thermal performance of the thermosyphon when operating near its heat transfer limit. Accordingly, appropriate control of the filling ratio plays an important role in achieving stable and reliable heat transfer performance. Based on the combined analysis of evaporator, condenser, and total thermal resistance trends, a filling ratio of 40% exhibits a relatively favorable performance within the present numerical framework. At this condition, the liquid film distribution in the evaporator section appears more stable, providing a balanced phase-change process. It should be emphasized that this result represents a trend-based observation rather than a sharp or universal optimum, and the conclusions are drawn in a comparative sense within the investigated parameter range.

4.3.5. Sensitivity to Lee Phase-Change Coefficient

To assess whether the observed performance trends are influenced by the selection of Lee phase-change coefficients, a sensitivity analysis was conducted for a representative operating condition (4.5 kW heating power). Three sets of evaporation and condensation coefficients (βe = βc = 0.05, 0.1, and 0.2 s−1) were tested. The results showed in Table 9 indicate that variations in Lee coefficients lead to only minor changes in the absolute values of evaporator and total thermal resistance, with differences within approximately 2%. However, the relative ranking among filling ratios remains unchanged. In all tested cases, the 40% filling ratio exhibits lower thermal resistance than the 25% case. These findings demonstrate that the performance trends observed in this study are robust with respect to reasonable variations in Lee model parameters and are not artifacts of a specific coefficient selection. The sensitivity analysis focuses on filling ratio ranking because it represents a design parameter. Heating power in this study is treated as an operating condition; therefore, robustness at a representative heating power is sufficient to confirm model reliability.

4.4. Effect of Heating Power on Thermosyphon Thermal Performance

4.4.1. Effect of Heating Power on Thermosyphon Wall Temperature

As the heating power increases, the temperatures at all measurement points in the evaporator section rise markedly, accompanied by an upward shift of the peak temperature. Compared with a heating power of 3.5 kW, the peak wall temperatures at liquid filling ratios of 25%, 30%, and 35% increase by 4.72%, 5.22%, and 5.21%, respectively, when the heating power reaches 5.0 kW. Meanwhile, the average wall temperature at a filling ratio of 40% increases by 5.05%, as shown in Figure 9. These results indicate that a higher heat input intensifies vaporization in the evaporator, enhances vapor–liquid interfacial activity, and significantly increases the thermal load in the evaporator section.
Overall, the wall temperature distribution in the evaporator section is jointly governed by the liquid film thickness, the position of the vapor–liquid interface, and the boiling intensity. At a high filling ratio of 40%, the evaporator section is dominated by stable liquid-film evaporation. In contrast, at moderate to low filling ratios (25–35%), dynamic variations of the vapor–liquid interface play a dominant role in determining the temperature distribution.

4.4.2. Effect of Heating Power on Thermal Resistance of Thermosyphon Evaporator Section

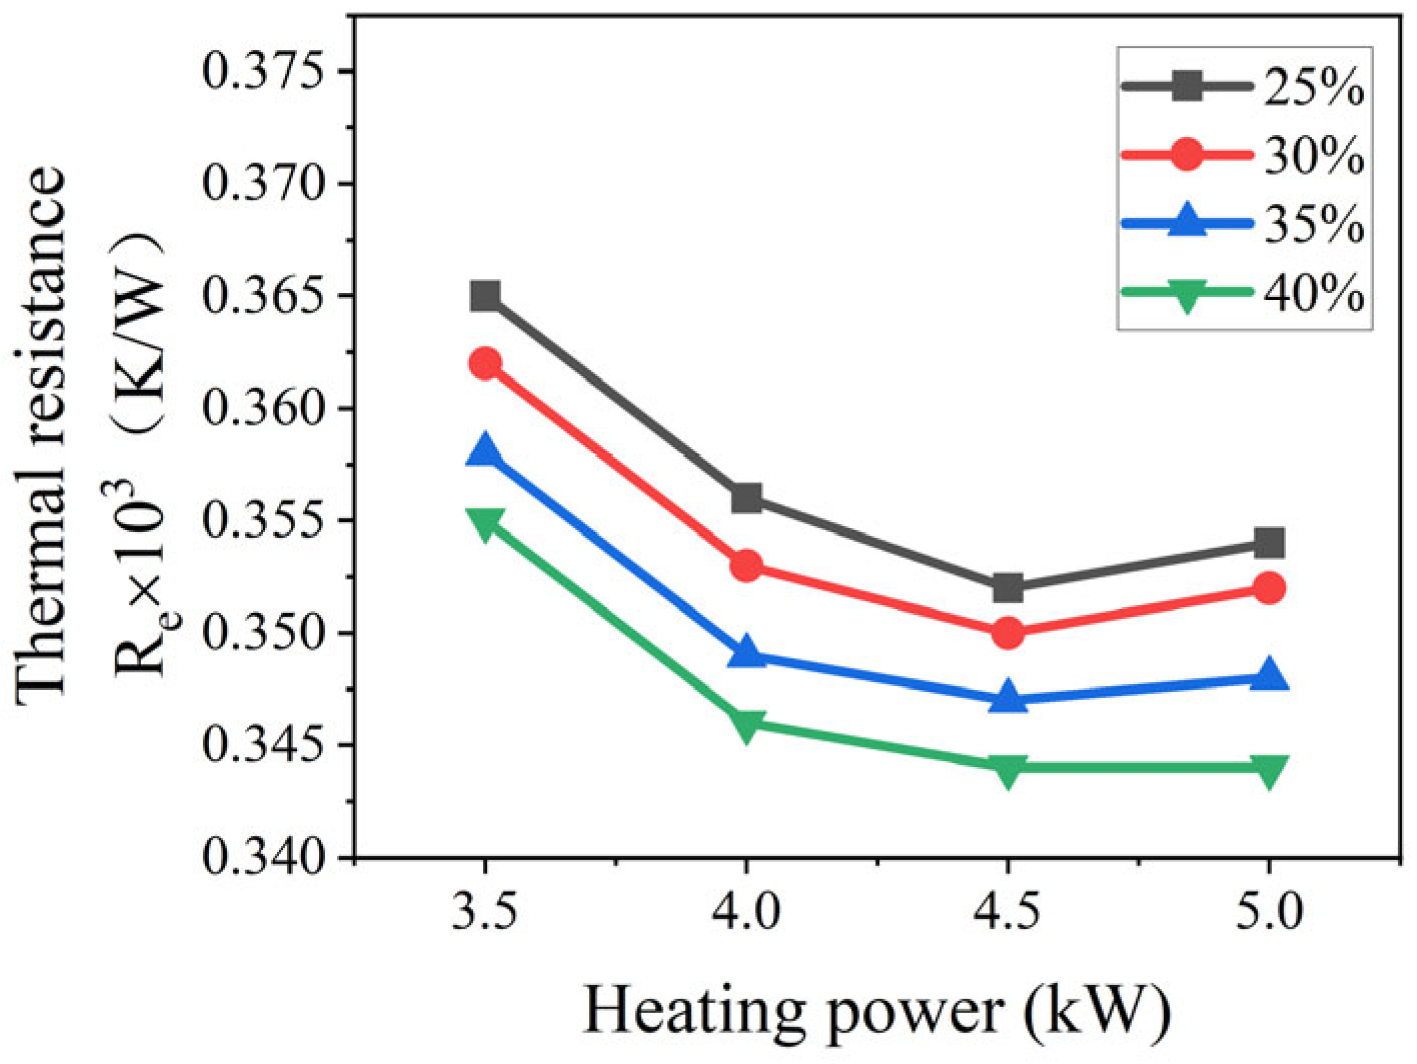
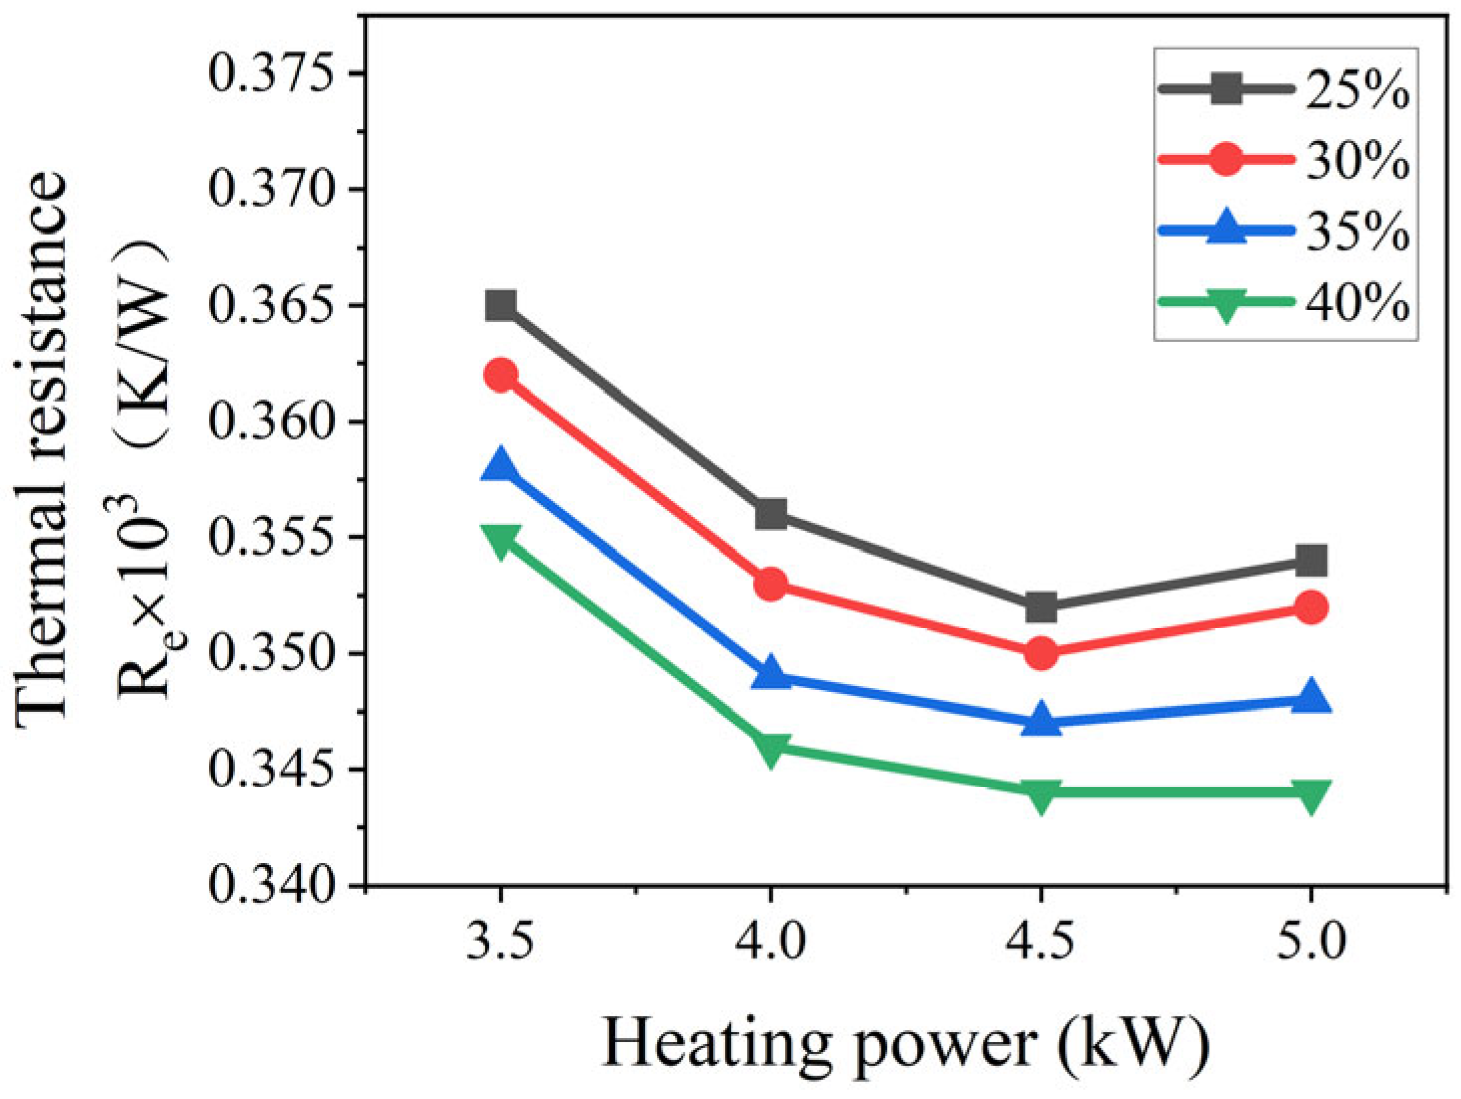
The results demonstrate that the thermal resistance of the evaporator section decreases with increasing heating power. As shown in Figure 10, at a heating power of 4.5 kW, the evaporator thermal resistance reaches its minimum value for all four filling ratios, with corresponding values of 3.52 × 10⁻⁴ K/W, 3.50 × 10⁻⁴ K/W, 3.47 × 10⁻⁴ K/W, and 3.44 × 10⁻⁴ K/W, respectively.
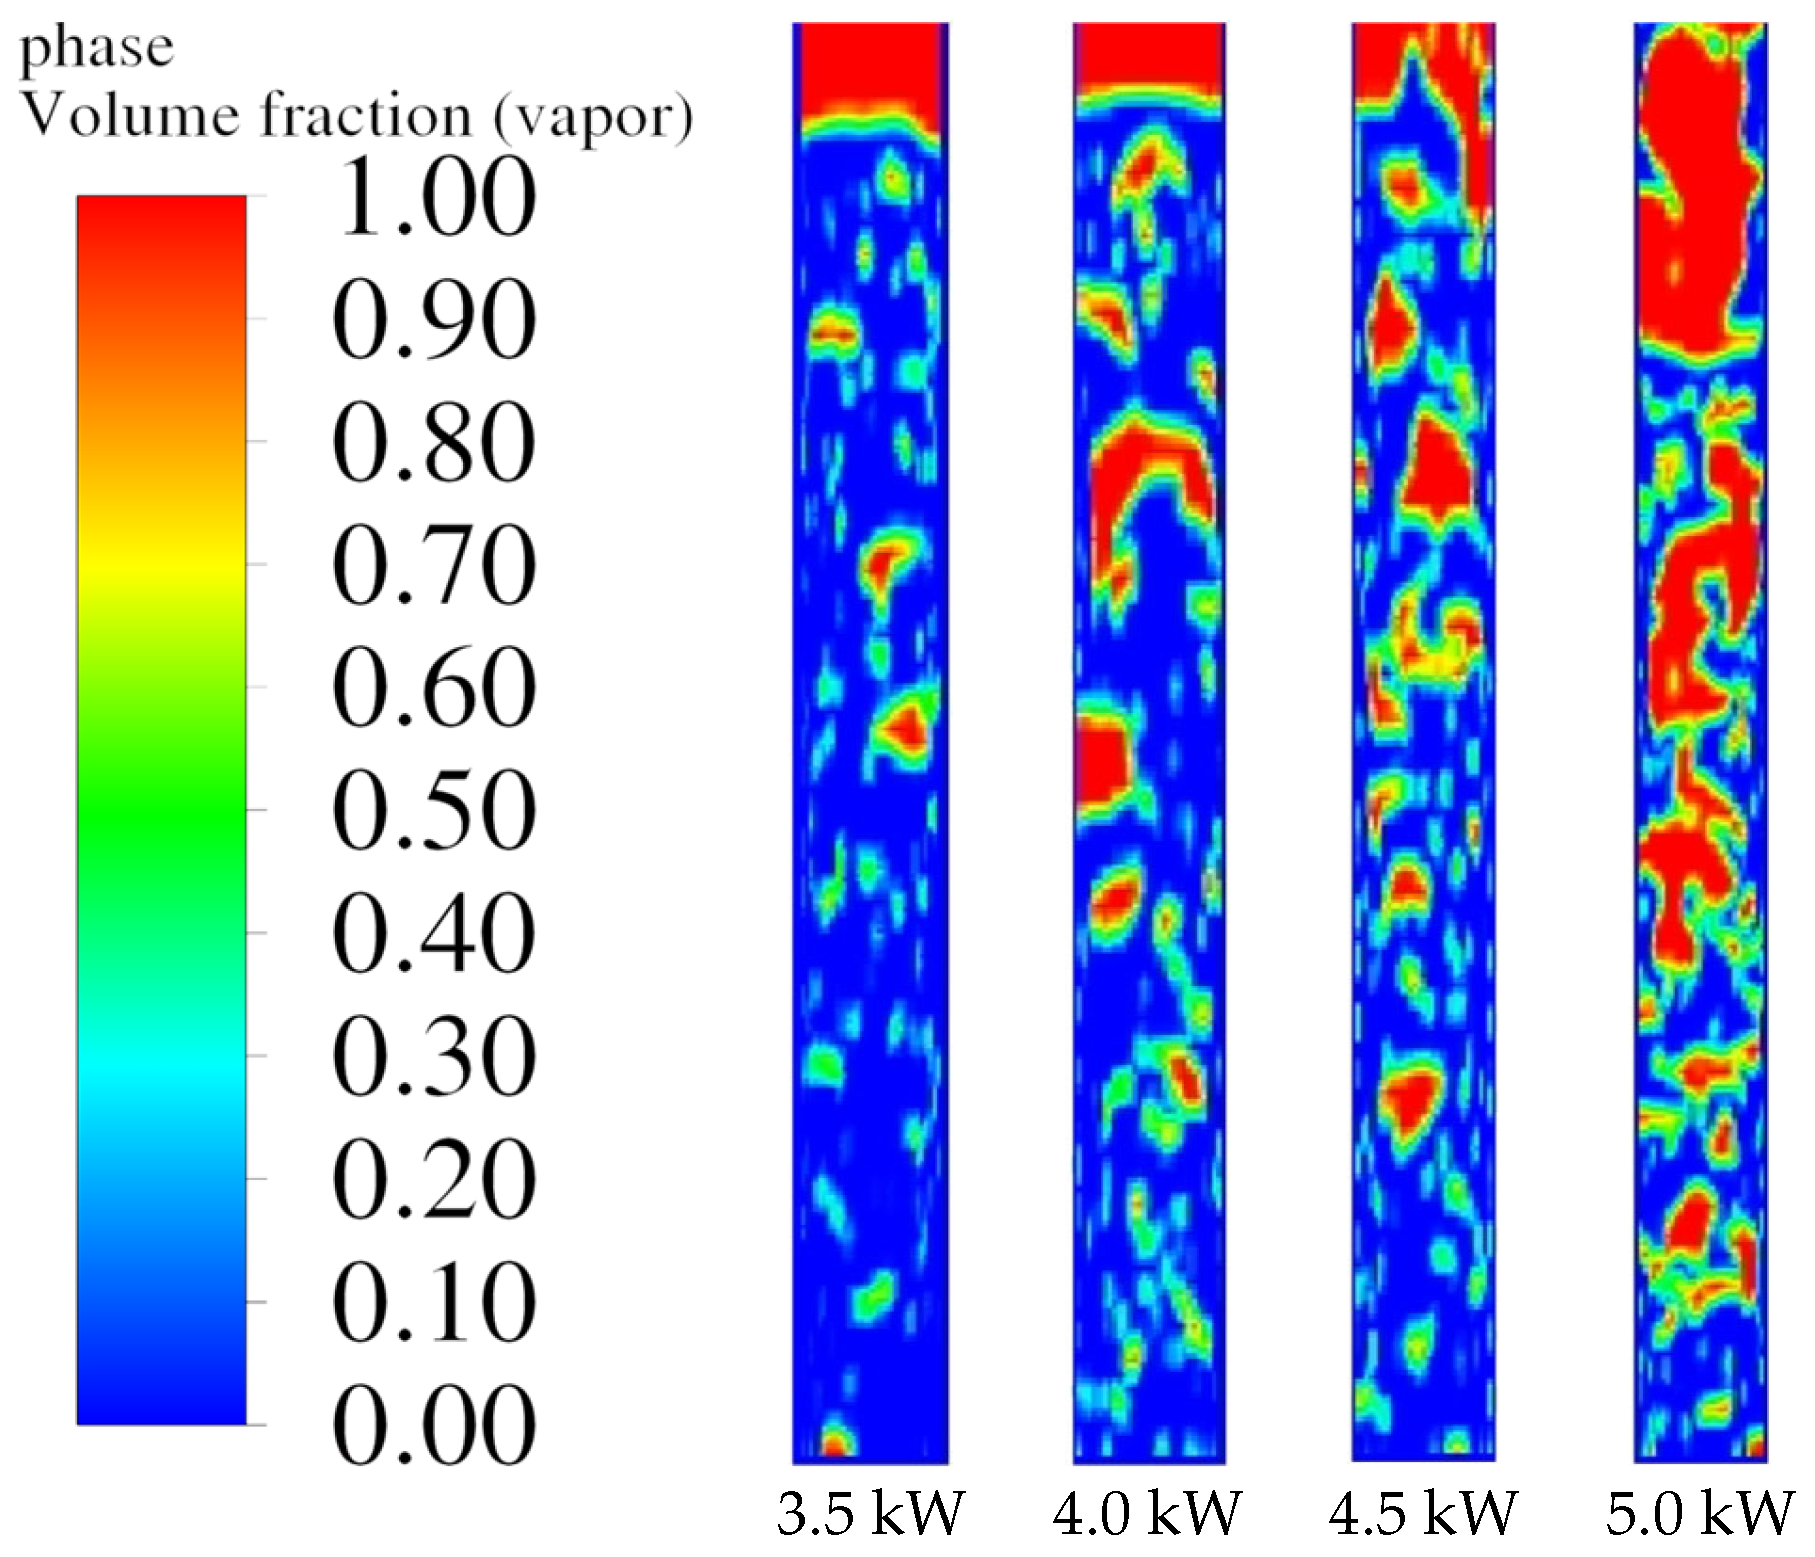
Figure 11 presents the vapor–liquid two-phase flow distribution in the evaporator section under different heating powers, providing qualitative insight into the evolution of interfacial behavior. At relatively low heating power (3.5 kW), the evaporator thermal resistance remains comparatively high. Under this condition, the supplied heat flux is insufficient to induce intensive phase-change activity, and evaporation occurs in a relatively weak manner. As a result, heat transfer in the evaporator section is dominated by wall conduction and limited natural convection, while the contribution of latent heat transfer remains restricted. This leads to inefficient utilization of the evaporation surface and a higher overall thermal resistance.
When the heating power increases from 3.5 kW to 4.5 kW, the evaporator thermal resistance decreases progressively. This behavior suggests a gradual enhancement of evaporation-dominated heat transfer, which can be attributed to increased vapor generation and intensified vapor–liquid interfacial disturbance. The increased frequency of interfacial renewal promotes more effective latent heat absorption and improves the coupling between wall heat input and phase-change processes. Within this heating power range, the thermosyphon operates in a relatively stable and efficient phase-change state, resulting in a continuous reduction in evaporator thermal resistance.
In addition, the sensitivity of the evaporator thermal resistance to heating power is influenced by the liquid filling ratio. At higher filling ratios, sufficient liquid supply ensures continuous wetting of the evaporator wall, which helps maintain stable evaporation even as the heat input increases. At lower filling ratios, the liquid inventory is more limited, and the enhancement of heat transfer with increasing heating power is less pronounced. Nevertheless, the overall variation trend with heating power remains consistent across all filling ratios, indicating that heating power primarily affects the intensity of phase-change processes rather than altering the fundamental heat-transfer mechanism.
When the heating power is further increased to 5.0 kW, a slight increase in evaporator thermal resistance is observed for all filling ratios. This phenomenon indicates that excessive heat input does not lead to proportional enhancement of evaporation heat transfer. Instead, pronounced vapor accumulation near the heated wall may occur, which can partially hinder direct liquid–wall contact and reduce effective heat transfer area. As a consequence, the thermal resistance of the evaporator section increases marginally.
It should be emphasized that the above interpretation is qualitative in nature, inferred from macroscopic thermal resistance trends and vapor-liquid distribution characteristics obtained from the CFD simulations. The present model is not intended to quantitatively resolve boiling regime boundaries or microscale bubble dynamics. Therefore, the observed increase in thermal resistance at high heating power is discussed as a performance-limiting tendency rather than as a definitive identification of a specific boiling regime.

4.4.3. Influence of Heating Power on Thermal Resistance of the Condensing Section of the Thermosyphon

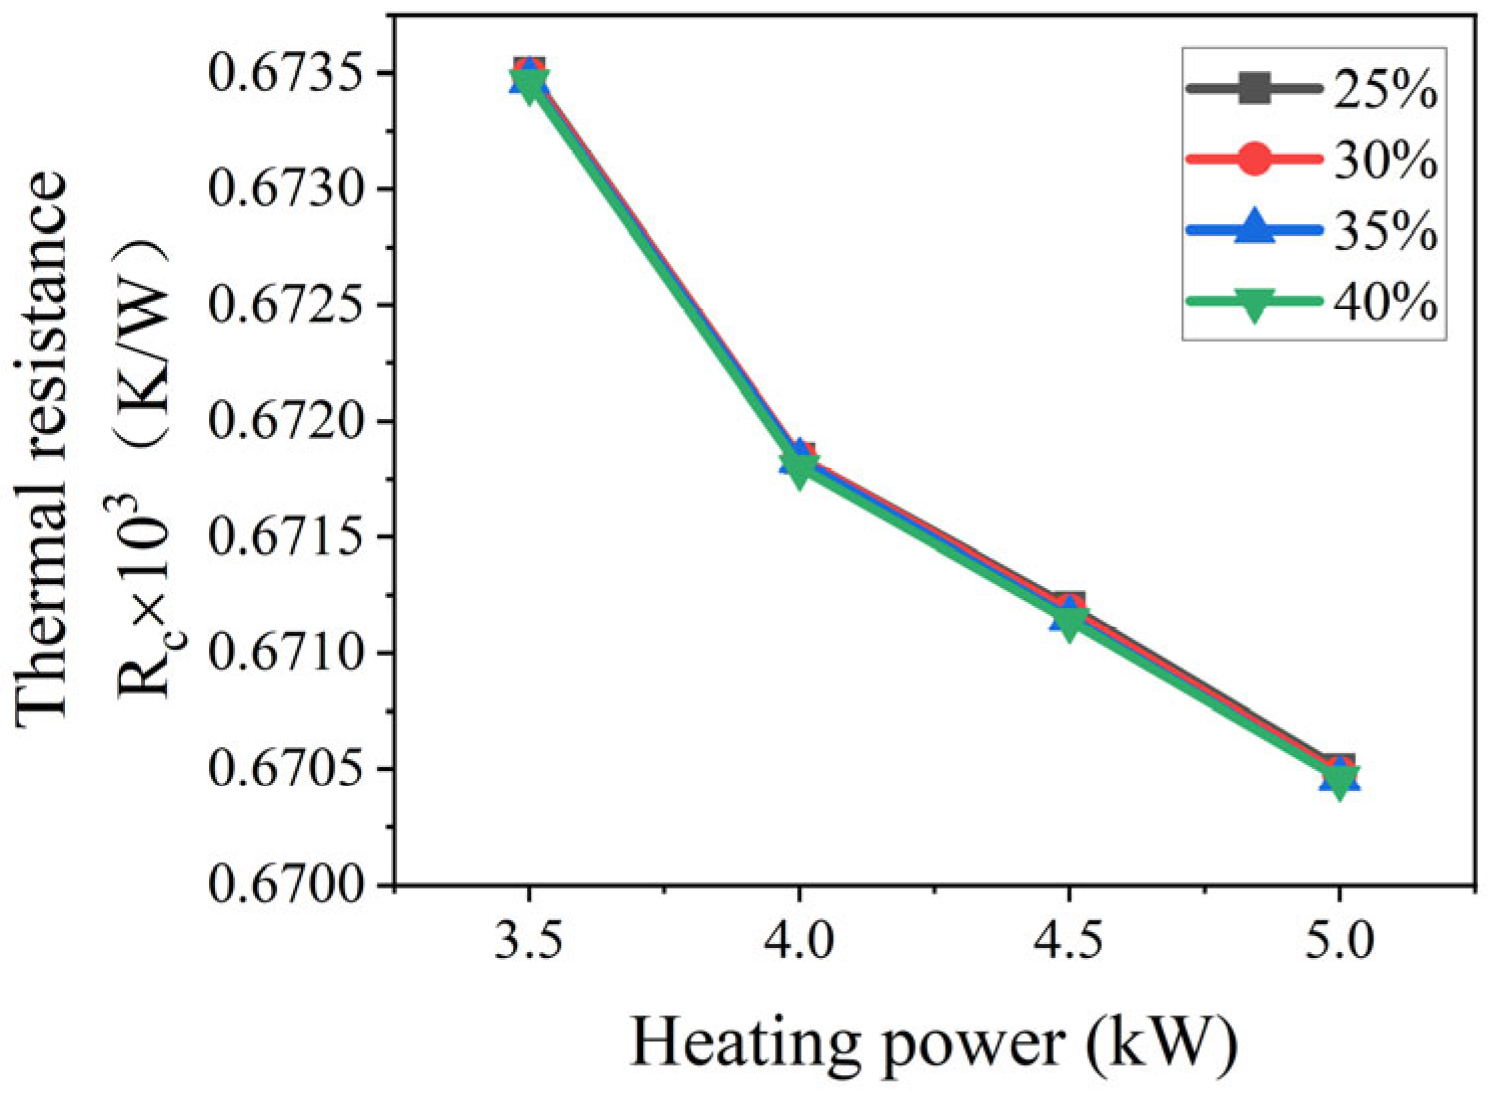
Compared with the evaporator section, the thermal resistance of the condenser section varies more gradually with heating power, although it still exhibits a slight decreasing trend, as shown in Figure 12. When the heating power increases from 3.5 kW to 5.0 kW, the average thermal resistance of the condenser section decreases by approximately 0.45% across the four filling ratios. This indicates that the condenser section shows a certain sensitivity to heating power, but the overall effect remains relatively weak.
An increase in heating power raises the vapor temperature, thereby enlarging the temperature difference between the vapor and the cooling medium at the condenser wall. This enhances the condensation driving force and enables the vapor to release latent heat more rapidly. Meanwhile, stronger vapor impingement promotes disturbance and renewal of the liquid film on the wall, reducing its thickness. The resulting decrease in liquid-film thermal resistance further enhances condensation heat transfer. For different filling ratios, because the condenser section is primarily governed by gravity-driven condensate drainage and exhibits relatively uniform liquid-film coverage, the influence of the filling ratio is limited. Consequently, the thermal resistance curves display similar variation trends.
Overall, the heat transfer process in the condenser section remains relatively stable under the conditions considered in this study. Its thermal resistance is mainly controlled by film condensation. Increasing the heating power indirectly improves condensation performance by enhancing vapor transport capacity and liquid-film renewal. Although this enhancement is less pronounced than that in the evaporator section, it still contributes to reducing the total thermal resistance of the thermosyphon.

4.4.4. Effect of Heating Power on the Total Thermal Resistance of the Thermosyphon

The influence of heating power on the total thermal resistance of the thermosyphon is illustrated in Figure 13. The total thermal resistance decreases continuously with increasing heating power in the range of 3.5−4.5 kW and reaches an optimum at 4.5 kW. At this condition, the total thermal resistance attains its minimum value for all filling ratios. In particular, at a filling ratio of 40%, the total thermal resistance is 1.019 × 10⁻⁴ K/W, representing an average reduction of approximately 1.38% compared with the 3.5 kW condition. When the heating power is further increased to 5.0 kW, the total thermal resistance exhibits an increasing trend, indicating that additional heat input no longer improves the heat transfer performance.
The underlying mechanism responsible for this behavior arises from the combined response of the evaporator and condenser sections. At moderate heating power, nucleate boiling in the evaporator section is enhanced, maintaining a favorable synergy between liquid-film evaporation and bubble detachment, which significantly reduces the evaporator thermal resistance. Meanwhile, improved liquid-film renewal in the condenser section slightly decreases its thermal resistance, further contributing to the reduction in total thermal resistance. However, at excessive heating power, adverse effects such as liquid-film rupture, localized dry-out, and intensified vapor jetting in the evaporator section drive the system into a heat-transfer-limited regime, leading to an increase in the total thermal resistance.
Considering the performance under different filling ratios, a filling ratio of 40% exhibits a more stable liquid-film morphology over the entire range of heating powers, providing a continuous and sufficient liquid supply to the evaporator section. As a result, the lowest total thermal resistance is achieved at 4.5 kW for this filling ratio. These results demonstrate a clear synergistic optimization between heating power and filling ratio: moderate heating power combined with an appropriate liquid-film thickness maximizes phase-change efficiency within the thermosyphon, thereby enhancing its overall thermal performance.

5. Conclusions

Motivated by molten-salt-related thermal energy storage and flexible peak-shaving scenarios, this study numerically investigates the influence of heating power and liquid filling ratio on the heat transfer performance of a water-based thermosyphon using a two-dimensional VOF–Lee CFD framework. Within the investigated parameter ranges, the following conclusions can be drawn:
(1)
The liquid filling ratio has a pronounced influence on the thermal behavior of the evaporator section. Increasing the filling ratio improves the uniformity of the wall temperature distribution and reduces evaporator thermal resistance. Within the scope of the present study, a filling ratio of 40% results in a relatively stable liquid-film distribution in the evaporator section and comparatively favorable heat transfer characteristics.
(2)
Heating power significantly affects phase-change intensity and thermal resistance. As the heating power increases from low to moderate levels, enhanced evaporation leads to a reduction in evaporator thermal resistance. At higher heating power levels, further performance improvement becomes limited, and a tendency toward heat transfer deterioration is observed under the present numerical conditions.
(3)
The total thermal resistance of the thermosyphon is mainly governed by the evaporator section. Among the investigated cases, the combination of a 40% filling ratio and a heating power of approximately 4.5 kW yields the lowest total thermal resistance within the present numerical framework.
It should be noted that the above conclusions are derived from a two-dimensional numerical model with several simplifying assumptions. Accordingly, the results are primarily intended to provide comparative, trend-based insights into the influence of key operating parameters and to support component-level design and parameter selection of thermosyphons, rather than direct system-level performance prediction. Future work will focus on extending the present modeling framework to three-dimensional and turbulence-resolving simulations to more comprehensively capture complex interfacial behavior and coupled heat–mass transfer mechanisms under higher heat-flux conditions.

Author Contributions

Conceptualization, J.M. and Y.D.; methodology, J.M. and Y.D.; software, Y.D.; validation, J.M. and Y.D.; formal analysis, J.M.; writing—original draft preparation, Y.D.; writing—review and editing, J.M.; visualization, Y.D.; supervision, J.M.; project administration, J.M.; funding acquisition, J.M. All authors have read and agreed to the published version of the manuscript.

Funding

This research was funded by Major Science and Technology projects of Inner Mongolia (grant number 2021ZD0036), Inner Mongolia Autonomous Region Science and Technology project (grant number 2023YFHH0070) and Inner Mongolia Autonomous Region “Open Bidding for Selecting the Best Candidates” project (grant number 2023JBGS0012).

Data Availability Statement

The data presented in this study are available on request from the corresponding author. The data are not publicly available as they are part of an ongoing study.

Conflicts of Interest

The authors declare no conflict of interest.

Nomenclature

SymbolDescriptionUnit
csurface curvature
Einternal energyJ/kg
Fcontinuous surface forceN/m3
gGravityN
JVLtransfer rate from the gas phase to the liquid phasekg/(m2·s)
JLVtransfer rate from the liquid phase to the gas phasekg/(m2·s)
kthermal conductivityW/m·K
ppressurePa
Rthermal resistance of the thermosyphonK/W
Ssource termJ/(m3·s)
vvelocity
Greek letters
α volume fraction
β Lee model constants−1
ρ densitykg/m3
σ surface tensionN/m
μ Dynamic viscosityPa·s
Subscripts
aadiabatic
ccondenser
eevaporator
LLiquid phase
VVapor phase
satsaturation

References

  1. Feng, R. China’s energy security and geopolitical imperatives: Implications for formulating national climate policy. Next Energy 2024, 2, 100034. [Google Scholar] [CrossRef] [Scilit]
  2. Lin, B.; Xie, Y. The impact of government subsidies on capacity utilization in the Chinese renewable energy industry: Does technological innovation matter? Appl. Energy 2023, 352, 121959. [Google Scholar] [CrossRef] [Scilit]
  3. Zhou, D.; Hu, C.; Kenjayeva, U.; Dadashzade, G.; Ullah, I. Economic and Technical Analysis of Wind Thermal Energy Systems: Comprehensive Comparison with Battery Storage and Thermal Backup Solutions for Long-Duration Renewable Energy Integration. Case Stud. Therm. Eng. 2025, 75, 107078. [Google Scholar] [CrossRef] [Scilit]
  4. Prieto, C.; Blindu, A.; Cabeza, L.F.; Valverde, J.; García, G. Molten salts tanks thermal energy storage: Aspects to consider during design. Energies 2023, 17, 22. [Google Scholar] [CrossRef] [Scilit]
  5. Wang, C.; Chen, F.; Wang, L.; Cao, H.; Gao, L.; Tian, S.; Wang, W.; Sun, Q. The flexibility of a molten salt thermal energy storage (TES)-integrated coal-fired power plant. Appl. Energy 2025, 402, 126876. [Google Scholar] [CrossRef] [Scilit]
  6. Ding, Y.; Guo, Q.; Guo, W.; Chu, W.; Wang, Q. Review of recent applications of heat pipe heat exchanger use for waste heat recovery. Energies 2024, 17, 2504. [Google Scholar] [CrossRef] [Scilit]
  7. De Schepper, S.C.K.; Heynderickx, G.J.; Marin, G.B. Modeling the evaporation of a hydrocarbon feedstock in the convection section of a steam cracker. Comput. Chem. Eng. 2009, 33, 122–132. [Google Scholar] [CrossRef] [Scilit]
  8. Alizadehdakhel, A.; Rahimi, M.; Alsairafi, A.A. CFD modeling of flow and heat transfer in a thermosyphon. Int. Commun. Heat Mass Transf. 2010, 37, 312–318. [Google Scholar] [CrossRef] [Scilit]
  9. Ding, L.; Wang, W.; Peng, B.; Li, B.; Li, B.; Sunden, B. A modified dynamic Lee model for two-phase closed thermosyphon (TPCT) simulation. Numer. Heat Transf. Part B Fundam. 2024, 85, 1041–1055. [Google Scholar] [CrossRef] [Scilit]
  10. Tan, Z.; Cao, Z.; Chu, W.; Wang, Q. Dynamic correction on condensation time relaxation coefficient of Lee model based on mass conservation mechanism. Int. Commun. Heat Mass Transf. 2023, 142, 106621. [Google Scholar] [CrossRef] [Scilit]
  11. Kim, Y.; Choi, J.; Kim, S.; Zhang, Y. Effects of mass transfer time relaxation parameters on condensation in a thermosyphon. J. Mech. Sci. Technol. 2015, 29, 5497–5505. [Google Scholar] [CrossRef] [Scilit]
  12. Colombo, M.; Fairweather, M. Accuracy of Eulerian–Eulerian, two-fluid CFD boiling models of subcooled boiling flows. Int. J. Heat Mass Transf. 2016, 103, 28–44. [Google Scholar] [CrossRef] [Scilit]
  13. Sadeghi, K.; Kahani, M.; Ahmadi, M.H.; Zamen, M. CFD Modelling and Visual Analysis of Heat Transfer and Flow Pattern in a Vertical Two-Phase Closed Thermosyphon for Moderate-Temperature Application. Energies 2022, 15, 8955. [Google Scholar] [CrossRef] [Scilit]
  14. Tecchio, C.; Oliveira, J.L.G.; Paiva, K.V.; Mantelli, M.B.H.; Galdolfi, R.; Ribeiro, L.G.S. Geyser boiling phenomenon in two-phase closed loop-thermosyphons. Int. J. Heat Mass Transf. 2017, 111, 29–40. [Google Scholar] [CrossRef] [Scilit]
  15. Imura, H.; Sasaguchi, K.; Kozai, H.; Numata, S. Critical heat flux in a closed two-phase thermosyphon. Int. J. Heat Mass Transf. 1983, 26, 1181–1188. [Google Scholar] [CrossRef] [Scilit]
  16. Abou-Ziyan, H.Z.; Helali, A.; Fatouh, M.; El-Nasr, M.M.A. Performance of stationary and vibrated thermosyphon working with water and R134a. Appl. Therm. Eng. 2001, 21, 813–830. [Google Scholar] [CrossRef] [Scilit]
  17. Noie, S.H. Heat transfer characteristics of a two-phase closed thermosyphon. Appl. Therm. Eng. 2005, 25, 495–506. [Google Scholar] [CrossRef] [Scilit]
  18. Feldman, K.T.; Srinivasan, R. Investigation of heat transfer limits in two-phase closed thermosyphon. In Proceedings of the 5th International Heat Pipe Conference, Tsukuba, Japan, 14–18 May 1984. [Google Scholar]
  19. Hussein, H.M.S.; El-Ghetany, H.H.; Nada, S.A. Performance of wickless heat pipe flat plate solar collectors having different pipes cross sections geometries and filling ratios. Energy Convers. Manag. 2006, 47, 1539–1549. [Google Scholar] [CrossRef] [Scilit]
  20. Jafari, D.; Filippeschi, S.; Franco, A.; Di Marco, P. Unsteady experimental and numerical analysis of a two-phase closed thermosyphon at different filling ratios. Exp. Therm. Fluid Sci. 2017, 81, 164–174. [Google Scholar] [CrossRef] [Scilit]
  21. Bolina, F.L.; Fachinelli, E.G.; Pachla, E.C.; Centeno, F.R. A critical analysis of the influence of architecture on the temperature field of RC structures subjected to fire using CFD and FEA models. Appl. Therm. Eng. 2024, 247, 123086. [Google Scholar] [CrossRef] [Scilit]
  22. Chen, X.; Xu, Z.; Ye, D.; Zou, Y. Experimental research on heat transfer in a molten salt-heat pipe-thermoelectric generator system based on micro-MSR. Nucl. Eng. Des. 2025, 434, 113911. [Google Scholar] [CrossRef] [Scilit]
  23. Gibbs, A.; Robinson, B.W.; Rougé, S.; Jouhara, H.; Asaduzzaman, A.K.M.; Chowdhury, M.; Kjellgren, P.; Martí, A.M.; Pardelli, P.T.; Ciuffi, N. Heat recovery at high temperature by molten salts for high temperature processing industries. AIP Conf. Proc. 2019, 2191, 020089. [Google Scholar] [CrossRef] [Scilit]
  24. Brackbill, J.U.; Kothe, D.B.; Zemach, C. A continuum method for modeling surface tension. J. Comput. Phys. 1992, 100, 335–354. [Google Scholar] [CrossRef] [Scilit]
  25. Fadhl, B.; Wrobel, L.C.; Jouhara, H. Numerical modelling of the temperature distribution in a two-phase closed thermosyphon. Appl. Therm. Eng. 2013, 60, 122–131. [Google Scholar] [CrossRef] [Scilit]
Figure 1. Exothermic process.
Energies 19 01079 g001
Figure 2. Thermosyphon model establishment: (a) Dimensions of thermosyphon (ANSYS DesignModeler), (b) Filling ratio setting (ANSYS Fluent).
Energies 19 01079 g002
Figure 3. Grid Division and Refinement Methods (ANSYS Meshing).
Energies 19 01079 g003
Figure 4. Monitoring Point Setup.
Energies 19 01079 g004
Figure 5. Temperature distribution on the thermosyphon wall: (a) 3.5 kW, (b) 4.0 kW, (c) 4.5 kW, (d) 5.0 kW.
Energies 19 01079 g005
Figure 6. Effect of Liquid Filling Ratio on the Thermal Resistance of the Evaporator Section of a Thermosyphon.
Energies 19 01079 g006
Figure 7. The effect of filling ratio on the thermal resistance of the condenser section of a thermosyphon.
Energies 19 01079 g007
Figure 8. Effect of Filling Ratio on the Total Thermal Resistance of Thermosyphon.
Energies 19 01079 g008
Figure 9. Peak wall temperature of the thermosyphon evaporator section: (a) 25%, (b) 30%, (c) 35%, (d) 40%.
Energies 19 01079 g009
Figure 10. Effect of Heating Power on the Thermal Resistance of the Evaporator section of a Thermosyphon.
Energies 19 01079 g010
Figure 11. Vapor−liquid two−phase flow diagram in the evaporator section of the thermosyphon.
Energies 19 01079 g011
Figure 12. Effect of Heating Power on the Thermal Resistance of the Condenser Section of a Thermosyphon.
Energies 19 01079 g012
Figure 13. The effect of heating power on the total thermal resistance of the thermosyphon.
Energies 19 01079 g013
Table 1. Known conditions for the design calculation of the heat pipe heat exchanger.
ProjectUnitNumerical Values
Molten salt inlet temperature (Ts′)°C250
Water inlet temperature (Tw′)°C100
Water outlet temperature (Tw″)°C140
Molten salt mass flow rate (Ms)kg/h100,000
Water mass flow rate (Mw)kg/h10,000
Table 2. Primary parameters of thermosyphon.
StructureUnitNumerical Values
Wall material-Copper
Input power (Q)kW4.0
Outer diameter (d)mm25
Inner diameter (di)mm22
Evaporator section length (Le)m0.4
Adiabatic section length (La)m0.2
Condenser section length (Lc)m0.4
Filling ratio (L′)%30
Table 3. Grid Independence Verification.
Elements65,78085,068116,058172,638293,480
Element quality0.830.8670.900.930.96
Skewness2.38 × 10−51.56 × 10−51.97 × 10−66.98 × 10−51.97 × 10−4
Aspect ratio2.181.901.641.431.28
Average temperature of evaporator section (K)510.38511.05510.95511.28510.65
Average temperature of condenser section (K)379.28380.56380.42381.08380.04
Table 4. Mass and energy transfer source term [7].
Energy/Heat
Transfer
Phase Change
Process
Phase Change
Conditions
PhaseSource Term Expression
MassEvaporation
process
T L > T s a t Liquid phase S M = 0.1 α L ρ L T T s a t T s a t
Vapor phase S M = 0.1 α V ρ V T T s a t T s a t
Condensation
process
T V < T s a t Liquid phase S M = 0.1 α L ρ L T T s a t T s a t
Vapor phase S M = 0.1 α V ρ V T T s a t T s a t
EnergyEvaporation
process
T L > T s a t S E = 0.1 α L ρ L T T s a t T s a t Δ H
Condensation
process
T V < T s a t S E = 0.1 α V ρ V T T s a t T s a t Δ H
Table 5. Boundary Conditions and Initial Conditions.
Heat Transfer SectionSettingsUnitNumerical Values
Evaporator sectionHeat flux density (q)W/m2133,260.69
Adiabatic sectionHeat flux density (q)W/m20
Condenser sectionConvective heat transfer coefficient (hc)W/m2∙K6012.92
Temperature (Tc)K373.15
Vapor phaseSaturation temperature (Tsat)K468.15
Liquid phaseSaturation temperature (Tsat)K468.15
Table 6. Time-step Size Independence Verification.
Time Step Size (s)0.00010.00050.0010.0050.01
Average temperature of evaporator section (K)511.10510.68510.95512.03509.87
Average temperature of condenser section (K)380.85379.98380.42381.24379.57
Table 7. Grid Independence Verification for Ref. [25].
Elements86,250108,680143,448202,000307,500
Element quality0.860.880.890.910.92
Skewness2.33 × 10−61.28 × 10−47.96 × 10−41.38 × 10−61.01 × 10−6
Aspect ratio2.222.031.951.821.71
Average temperature of evaporator section (K)383.97384.54384.02384.28383.76
Average temperature of condenser section (K)336.57337.76336.40337.05336.18
Table 8. Validation check based on temperature changes in the inner side of thermosyphon.
SectionThermocouple
Location
Temperature (K)Relative Error (%)
T e x p T C F D T e x p × 100
ExperimentalCurrent CFD
evaporatorTe1376.75383.562.34
Te2363.65384.485.73
adiabaticTa342.75351.392.52
condenserTc1328.95335.401.96
Tc2325.55332.262.06
Tc3332.45338.201.73
Tc4331.35337.351.84
Tc5333.35338.781.63
Table 9. Sensitivity of thermal resistance to Lee model coefficients.
β (s−1)Filling Ratio (%)Evaporator Resistance (×10−4 K/W)Total Resistance (×10−4 K/W)
0.05253.6651.382
0.05403.3251.361
0.1253.6961.371
0.1403.3171.350
0.2253.7101.366
0.2403.3501.346
Disclaimer/Publisher’s Note: The statements, opinions and data contained in all publications are solely those of the individual author(s) and contributor(s) and not of MDPI and/or the editor(s). MDPI and/or the editor(s) disclaim responsibility for any injury to people or property resulting from any ideas, methods, instructions or products referred to in the content.