Article

A Novel Multi-Needle-to-Cylinder Dielectric Barrier Discharge Reactor with Deflector Rings for Energy-Efficient Removal of Sulfides and Ammonia from Odor Gases


1
College of Electrical Engineering, Zhejiang University, Hangzhou 310027, China
2
College of Engineering, Hangzhou City University, Hangzhou 310015, China
3
College of Environmental and Resource Sciences, Zhejiang University, Hangzhou 310027, China
*
Author to whom correspondence should be addressed.
Energies 2026, 19(4), 1075; https://doi.org/10.3390/en19041075
Submission received: 23 December 2025 / Revised: 22 January 2026 / Accepted: 9 February 2026 / Published: 19 February 2026

Abstract

Non-thermal plasma is a promising technology for odor abatement from agricultural and domestic waste. However, its widespread application is often limited by the inherent trade-off between energy efficiency and processing capacity in conventional reactors. To address this challenge, we propose a novel multi-needle-to-cylinder dielectric barrier discharge reactor integrated with a deflector ring. By synergistically optimizing the electrode topology and modulating the flow field, this reactor achieves enhanced removal of complex ammonia–sulfur odor mixtures. The underlying mechanisms were elucidated through computational fluid dynamics (CFD) simulations coupled with systematic performance evaluation. Experimental results demonstrate that an 8-needle electrode configuration provides the optimal balance between discharge density and energy efficiency. CFD simulations further reveal that the deflector ring effectively suppresses gas bypass and promotes recirculation vortices downstream, thereby extending the residence time significantly. Mechanistic studies indicate that the removal of recalcitrant inorganic sulfides (e.g., CS2 and H2S) follows a synergistic mass-transfer–reaction controlled process, which is markedly improved by flow field optimization. In contrast, organic sulfides are governed primarily by chemical kinetics and show little dependence on flow variations. Under an extremely short residence time of 0.57 s (corresponding to a flow rate of 2.0 m3/h) and an ultra-low specific energy input of 6.26 J/L, the system achieved nearly complete removal of organic sulfides. Even for challenging inorganic sulfides, removal efficiencies reached 80.9% for H2S and 45.3% for CS2, while O3/NOx/SO2 byproducts were quantified. For industrial deployment, these byproducts can be managed by standard downstream polishing. By effectively coordinating discharge characteristics with flow dynamics, this study provides both theoretical insight and technical support for the development of next-generation, energy-efficient, high-throughput industrial odor control systems.

1. Introduction

Odor control in agricultural and domestic waste management has become a pressing environmental issue [1]. Beyond causing severe olfactory discomfort, such emissions intensify public resistance through the “Not In My Backyard” (NIMBY) effect and undercut the prospects for sustainable industry growth [2,3]. The gas streams typically contain a complex mix of ammonia [4], sulfides that cause strong olfactory detectability even at low concentrations [5], volatile organic compounds (VOCs) [6], and terpenes [7]. Among these, ammonia and sulfides are the most frequent pollutants, with concentrations ranging from tens of ppb to hundreds of ppm [8], making their removal a priority. While conventional methods like biofiltration [9] and chemical scrubbing [10] are widely used, they face inherent limitations. Chemical scrubbers typically offer a compact footprint; however, similar to biological systems, their efficiency is heavily constrained by the water solubility of the target pollutants, limiting mass transfer and conversion kinetics for hydrophobic compounds. Consequently, there is an urgent industrial demand for compact, agile, and energy-efficient alternatives.
Non-thermal plasma (NTP) technology stands out for its rapid reaction kinetics and compact design [11], making it ideal for treating high-volume, low-concentration volatile organic compounds (VOCs) [12]. However, a persistent trade-off limits its wider application: the conflict between energy efficiency and gas throughput. Unlike general VOC abatement, effective odor control requires near-total removal efficiency, which invariably demands high energy consumption [13]. For example, while wire-plate pulse corona plasma can remove 93.1% of ethyl mercaptan and 100% of ammonia, it requires a specific input energy (SIE) of 65.1 J/L [14]. For mixed H2S and NH3, planar DBD systems typically require ~202 J/L to achieve ~67% removal [15]. Similarly, double dielectric barrier discharge (DBD) systems may achieve high removal rates for carbon disulfide (86.32–100%) but often operate at an excessive SIE of 960–3222 J/L [16]. Developing plasma technologies that balance high efficiency with low energy consumption remains a pressing goal.
To address this challenge, improving the controllability of barrier discharges has become a focal point of recent research. For instance, discharge homogeneity and parameters can be effectively tuned by tailoring applied voltage waveforms, or by manipulating the dielectric microstructure (e.g., via porous dielectrics) to modify local electric field distributions. Complementing these electrical and material-based approaches, optimizing reactor geometry remains a proven pathway to enhance performance. Specific electrode topologies, such as multi-needle-to-plate [17] or coaxial arrays [18], can stabilize discharges at lower voltages to save energy. Furthermore, modulating the internal flow field—for instance, through flow-field induced surface DBD [19]—can significantly improve treatment efficacy. We propose that synergistically combining electrode topology with flow field modulation is the key to efficient, low-energy pollutant removal. Our design strategy focuses on creating inhomogeneous electric fields using multi-needle arrays to induce dense micro-discharges, while actively reconstructing the gas flow path. This forces pollutants into active discharge zones, minimizing the bypass effect.
Here, we introduce a novel Multi-Needle-to-Cylinder DBD reactor equipped with Flow Deflector Rings (DR-MCDBD). This design integrates a multi-needle array to maximize micro-discharge density and uses diversion rings to mechanically redirect the flow, enhancing gas-plasma interaction. This study aims to: (1) systematically optimize the electrode configuration and discharge characteristics for high-flow conditions; (2) evaluate the system’s removal performance and energy efficiency for complex sulfide-ammonia mixtures; and (3) elucidate how diversion rings enhance the degradation of different pollutants by combining Computational Fluid Dynamics (CFD) simulations with reaction kinetics. Ultimately, this work seeks to provide a theoretical foundation and technical route for the next generation of industrial odor control reactors.

2. Materials and Methods

2.1. Experimental System

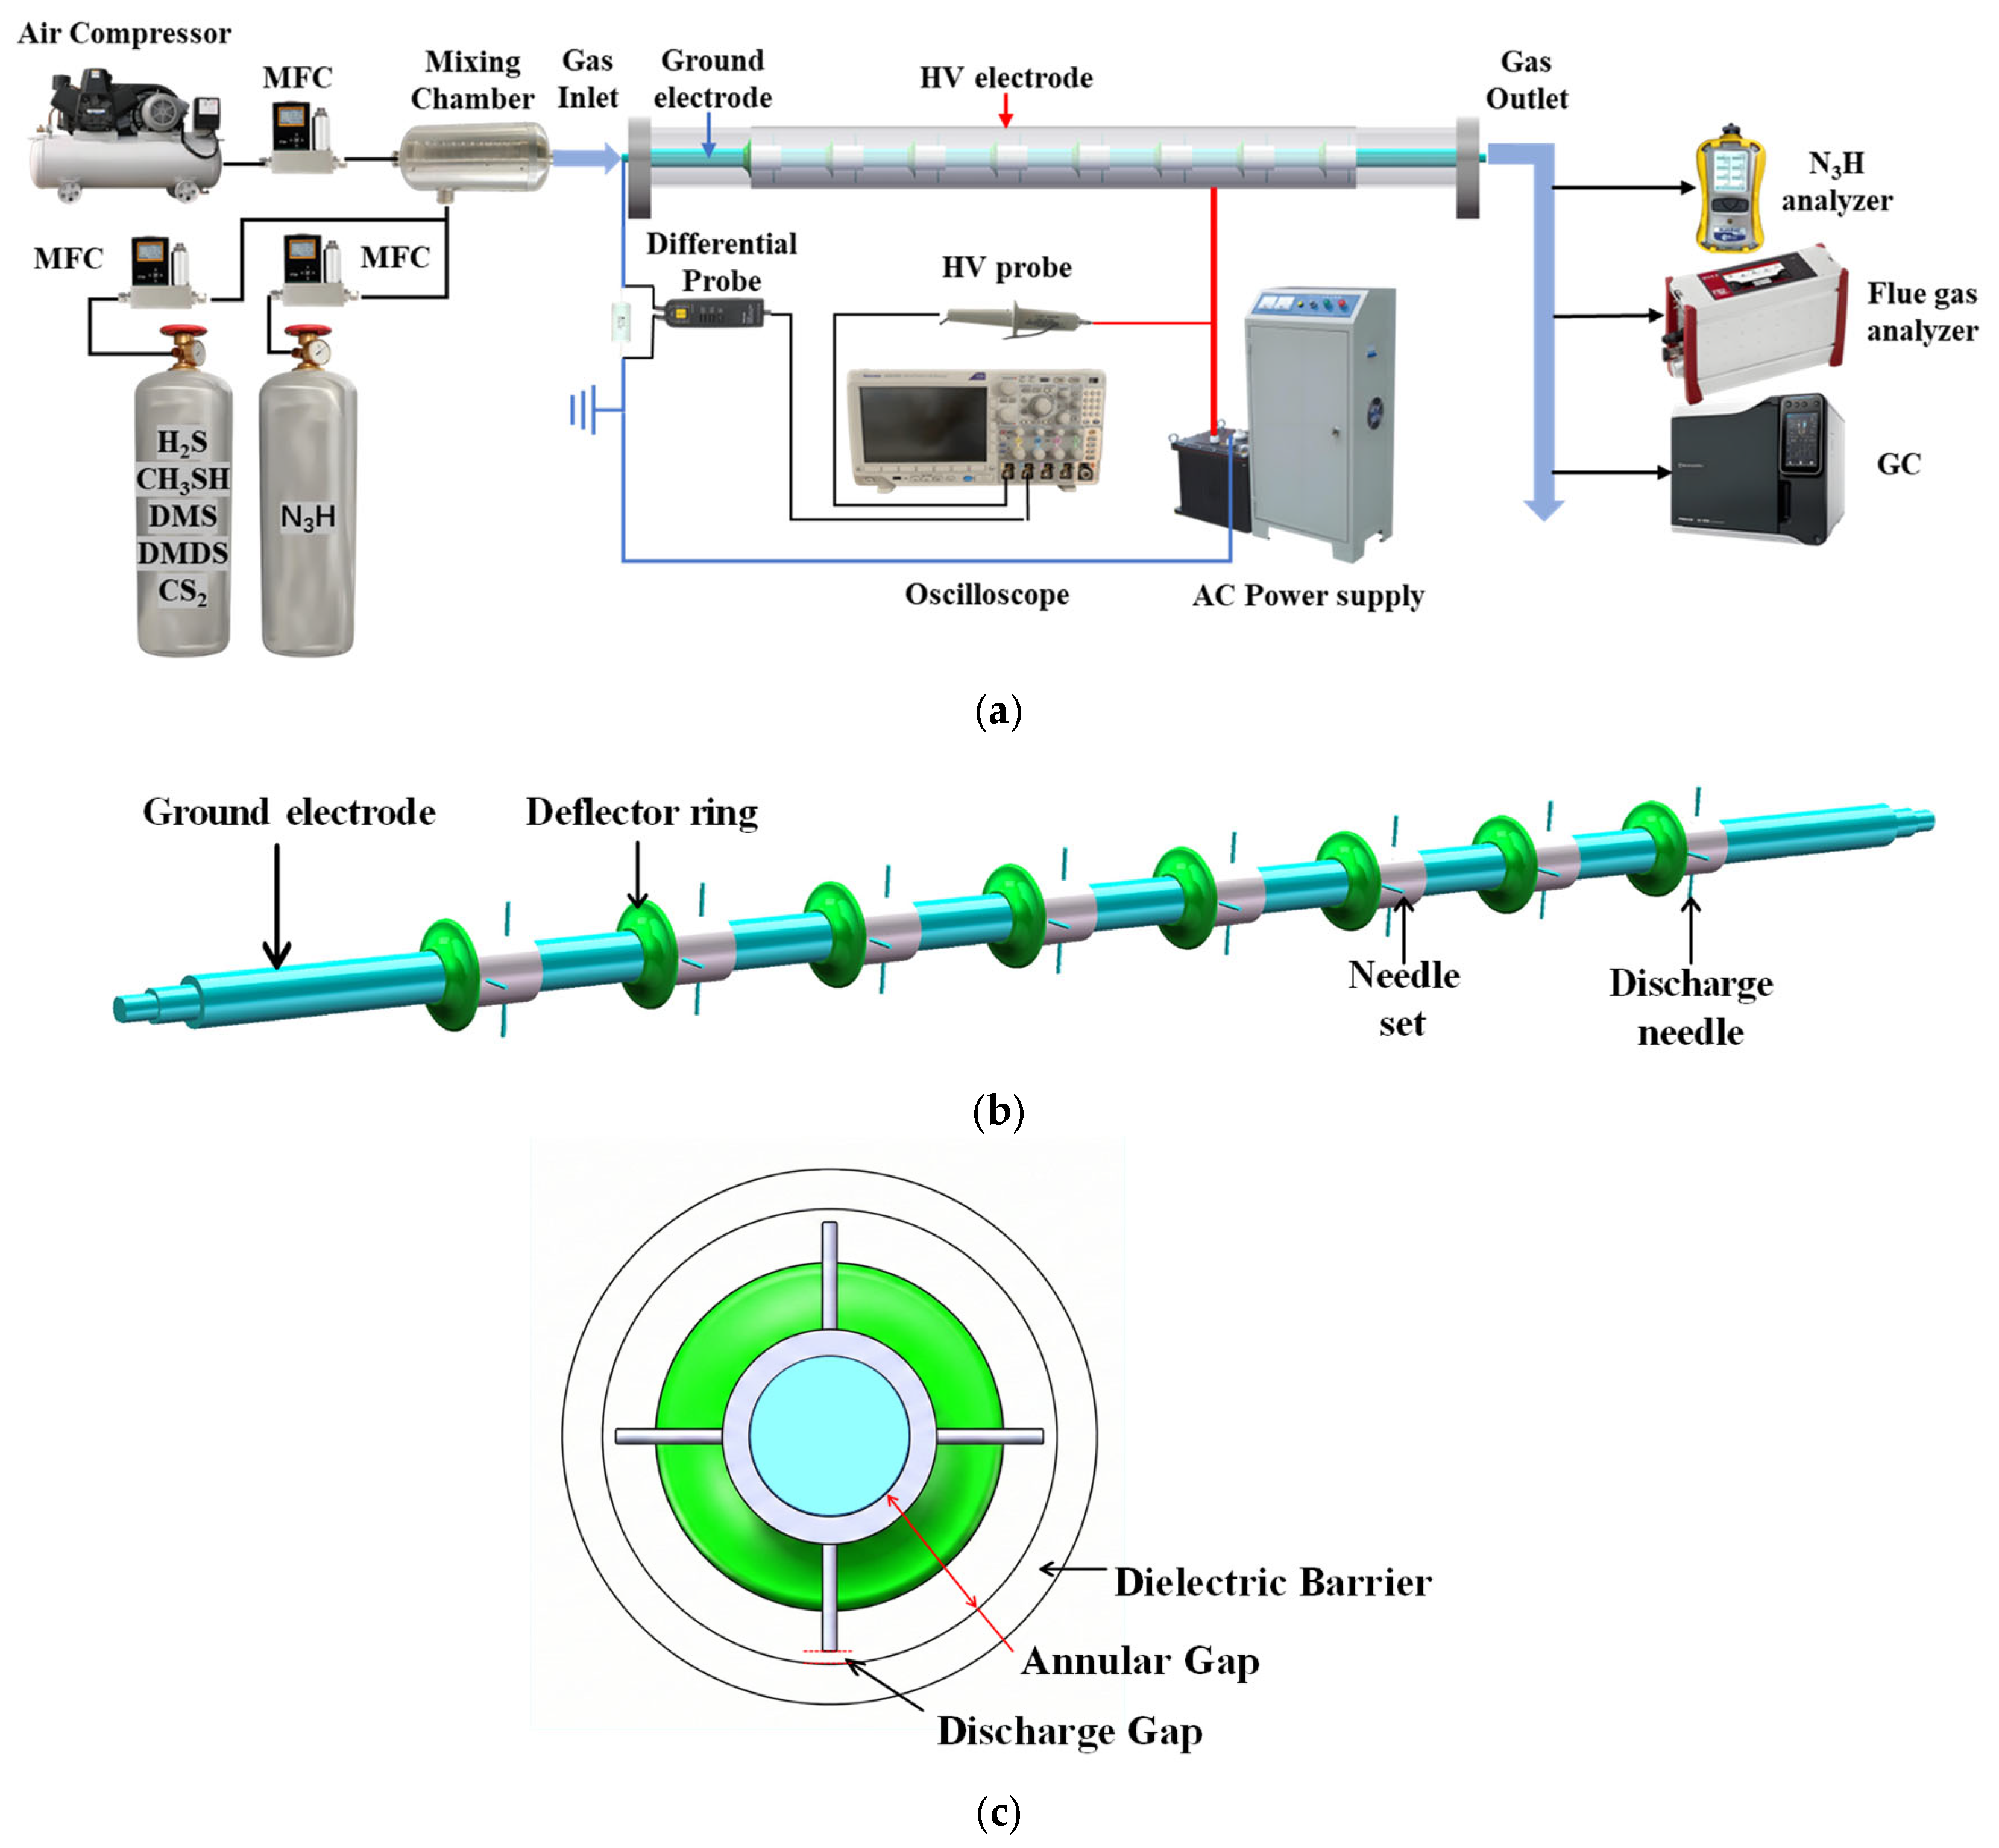
The experimental system primarily consisted of a gas supply unit (air and target gas blending), a custom-made low-temperature plasma reactor, a high-frequency high-voltage AC power supply, and a gas detection and analysis system, as shown in Figure 1a. The total gas flow rate was controlled at 1, 1.5, and 2 m3/h, respectively. Air was used as the carrier gas, and the target pollutants from gas cylinders were diluted to the following concentrations: 5 ppm H2S, 2.5 ppm CH3SH, 10 ppm DMS, 1.25 ppm CS2, 2.5 ppm DMDS, and 30 ppm NH3.
The DR-MCDBD reactor was employed for the removal of these malodorous gases. The peak-to-peak voltage ranged from 7 kV to 9 kV with a discharge frequency of 20 kHz. The voltage was regulated by a single-phase AC voltage regulator (Chint TDGC, Wenzhou, China) and measured using an oscilloscope (Tektronix MDO3024, Shanghai, China). Discharge images were captured using a digital camera (Sony ILCE-7M4, Shanghai, China), and the reactor’s temperature distribution was monitored using a handheld infrared thermal imager (InfiRay M620, Yantai, China).
The average discharge power was determined using the Q-V Lissajous figure method. The SIE and Energy Efficiency (EE) were calculated using Equations (1) and (2) [15,20], where P denotes average discharge power, Q is the gas flow rate, η i is the removal efficiency, C i n l e t , i is the inlet concentration, and M i is the molecular weight of the pollutant. The coefficient 3.6 represents the conversion factor between Joules and kilowatt-hours. For industrial feasibility assessment, the SIE value can be converted to the standard industrial unit using the relationship: 3.6 J/L = 1 kWh/1000 m3.
S I E ( J L ) = 3600 ( s h ) × P ( W ) 1000 ( L / m 3 ) × Q ( m 3 / h )
E E ( g k W h ) = η i × C i n l e t , i ( p p m ) × M i ( g / m o l ) S I E ( J / L ) × 3.6 22.4 ( L / m o l )

2.2. Reactor Configuration

To address the requirements for treating high-flow, low-concentration malodorous gases, this study designed and constructed an innovative DR-MCDBD reactor based on traditional dielectric barrier discharge (DBD) technology. The reactor aims to achieve high removal efficiency with low energy consumption by optimizing the geometric ratio between the discharge gap and the gas channel, as well as by regulating the internal flow field distribution.
The reactor features a single-dielectric coaxial configuration, comprising a quartz glass barrier tube, an external mesh high-voltage electrode, and an internal grounded electrode. A quartz tube (40 mm outer diameter (O.D.), 3 mm wall thickness, 552 mm length) was selected as the dielectric barrier. The high-voltage electrode consists of 500-mesh 304 stainless steel mesh wrapped tightly around the outer wall of the quartz tube, with an effective discharge length of 400 mm. The mesh was mechanically fixed to maintain intimate contact with the quartz surface (i.e., no intentional air gap between the mesh and the dielectric); the minimum clearance from the powered mesh to any grounded metallic supports/frame was ≥60 mm to suppress unintended external discharges. This dense mesh structure helps provide a uniform external potential boundary and facilitates real-time observation of the plasma state.
The internal electrode (grounded electrode) is primarily a 12 mm diameter aluminum rod, along which multiple groups (6, 8, or 10 groups) of discharge pin assemblies are arranged axially. Each assembly comprises a silicone fixing sleeve (12 mm inner diameter (I.D.), 20 mm length, 2 mm thickness) and four 304 stainless steel discharge pins (1 mm diameter, 10 mm length). The discharge pins are distributed in pairs (180° symmetry), with adjacent pin groups staggered orthogonally (90° offset), as shown in Figure 1b and illustrated in the cross-sectional view in Figure 1c. This design creates a wide annular gas channel (11 mm width)
Between the inner electrode and the dielectric barrier, effectively reducing flow resistance; at a flow rate of 2.0 m3/h, the gas residence time is approximately 0.57 s. Simultaneously, a 1 mm micro-discharge gap is formed between the pin tips and the inner wall of the quartz tube (Figure 1c), providing the physical basis for inducing stable fast-pulse micro-discharges at relatively lower voltages. Furthermore, to optimize the flow field distribution within the tube, a polylactic acid (PLA) flow deflector ring (5 mm base thickness, 26 mm diameter) is installed on the upstream side of each pin assembly.

2.3. Analytical System

The inlet and outlet concentrations of sulfides were determined using a gas pre-concentrator (Acrichi APC-9LN, Beijing, China) coupled with a gas chromatograph (Shimadzu Nexis GC-2030, Shanghai, Japan) equipped with a Flame Photometric Detector (FPD). The FPD utilized an SH-1 capillary column (60 m × 0.32 mm × 3 μm) [21]. Ammonia concentrations were measured using a portable multi-gas detector (MultiRAE PGM-82 × 8, Shanghai, China) [22]. Ozone concentration was monitored using a handheld ozone detector (Aeroqual Series 200, Shanghai, China) [23], while nitrogen oxides (NOx) and sulfur dioxide (SO2) were analyzed using a portable infrared flue gas analyzer (MRU MGA6 plus, Shanghai, China). Additionally, to evaluate the thermal characteristics of the reaction system, a high-precision infrared thermal imager (InfiRay M620, Yantai, China) was used to monitor the thermal stability and surface temperature distribution of the reactor in real-time. The removal efficiency ( η i ) for sulfides and ammonia was calculated according to Equation (3), where C i n l e t , i and C o u t l e t , i represent the inlet and outlet concentrations, respectively.
η i = C i n l e t , i ( p p m ) C o u t l e t , i ( p p m ) C i n l e t , i ( p p m ) × 100 %

2.4. Numerical Simulation Setup

To elucidate the influence of the deflector ring (DR) on the reactor cold-flow field (bypass suppression and recirculation enhancement), 3D CFD simulations were performed in ANSYS Fluent (2022 R1). The flow was modeled as steady, incompressible, single-phase air at 25 °C ( ρ = 1.2 kg/m3, μ = 1.835 × 10⁻⁵ Pa·s). Turbulence was closed using the SST k-ω model. Plasma-induced body forces, gas heating, and species transport/reactions were not considered.
A mass-flow inlet corresponding to 2.0 m3/h (equivalent bulk inlet velocity Uin ≈ 0.70 m/s), a pressure outlet (0 Pa gauge), and no-slip walls were applied. Unless otherwise stated, the CFD results reported in this work correspond to 2.0 m3/h, as this operating condition is associated with the target performance. A grid-independence test was conducted at U i n ≈ 0.35 m/s (=1.0 m3/h, within the experimental range), and the mesh with 1,070,886 cells was adopted for the simulations reported in this study. Detailed descriptions of the governing equations, inlet turbulence parameters, and the grid independence test are provided in the Supplementary Materials (Section S1).

3. Results and Discussion

3.1. Discharge Characteristics

3.1.1. Discharge Morphology and Electrical Waveforms

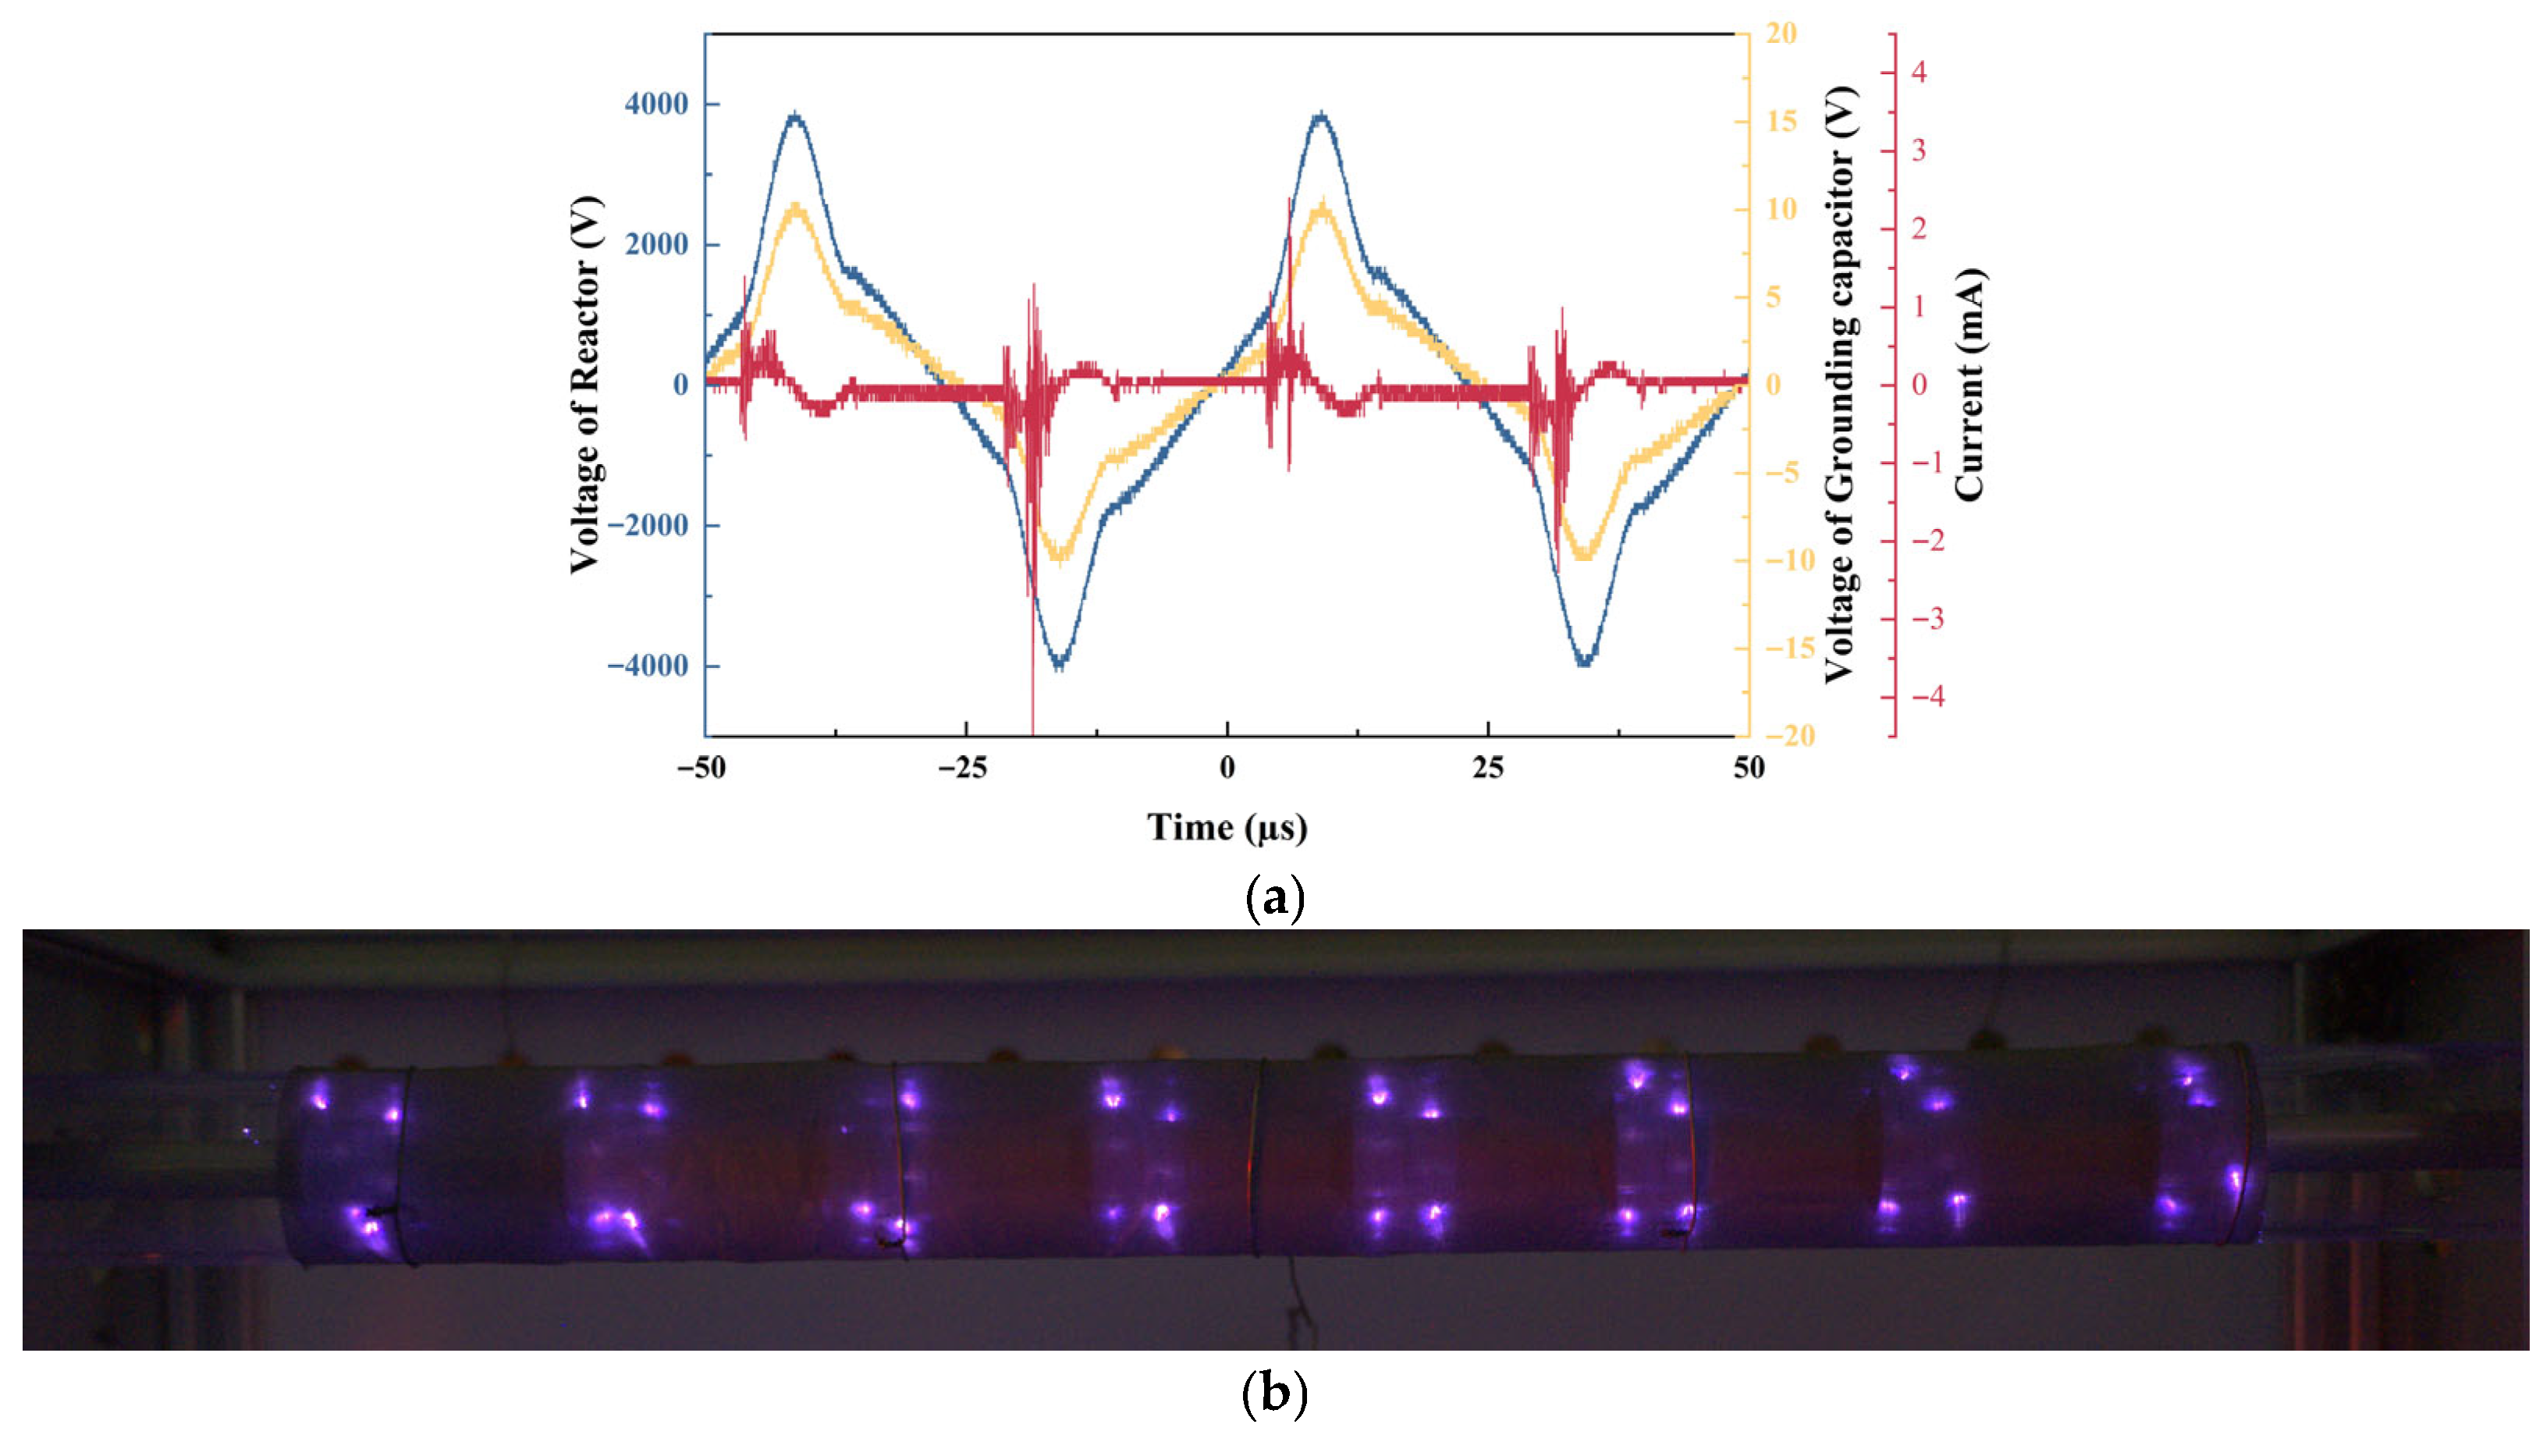
As illustrated in Figure 2a,b, the discharge within the reactor exhibits significant spatial inhomogeneity. As illustrated in Figure 2a,b, the discharge within the reactor exhibits significant spatial inhomogeneity. Owing to the microscopic radius of curvature at the needle tips, the electric field is strongly enhanced and confined to the vicinity of the grounded pin electrodes that are directly exposed to the process gas. In contrast, the high-voltage mesh electrode is located outside the quartz dielectric and is not in contact with the gas. Consequently, the plasma is composed primarily of dense luminous spots anchored at the needle-tip regions, while no macroscopic discharge is observed on the inner electrode surface away from the pin tips. These luminous spots correspond to numerous discrete filamentary micro-discharges (streamer-like events), resulting in a filamentary, spot-like macroscopic emission pattern.
This physical characteristic is further corroborated by the electrical waveforms. Since the power supply operates in Discontinuous Conduction Mode (DCM) with inductive compensation, both the applied voltage and the displacement current deviate from standard sinusoidal forms [24]. Superimposed on the current waveform are dense nanosecond-scale discharge spikes, confirming that the reactor operates in a typical filamentary (streamer-like) DBD mode. Notably, the current exhibits a significant polarity effect: the spikes are higher in amplitude and denser during the negative half-cycle (Figure 2a), which is typical for asymmetric single-dielectric DBD configurations and reflects polarity-dependent discharge development in the pin–dielectric micro-gap.

3.1.2. Power Consumption Characteristics

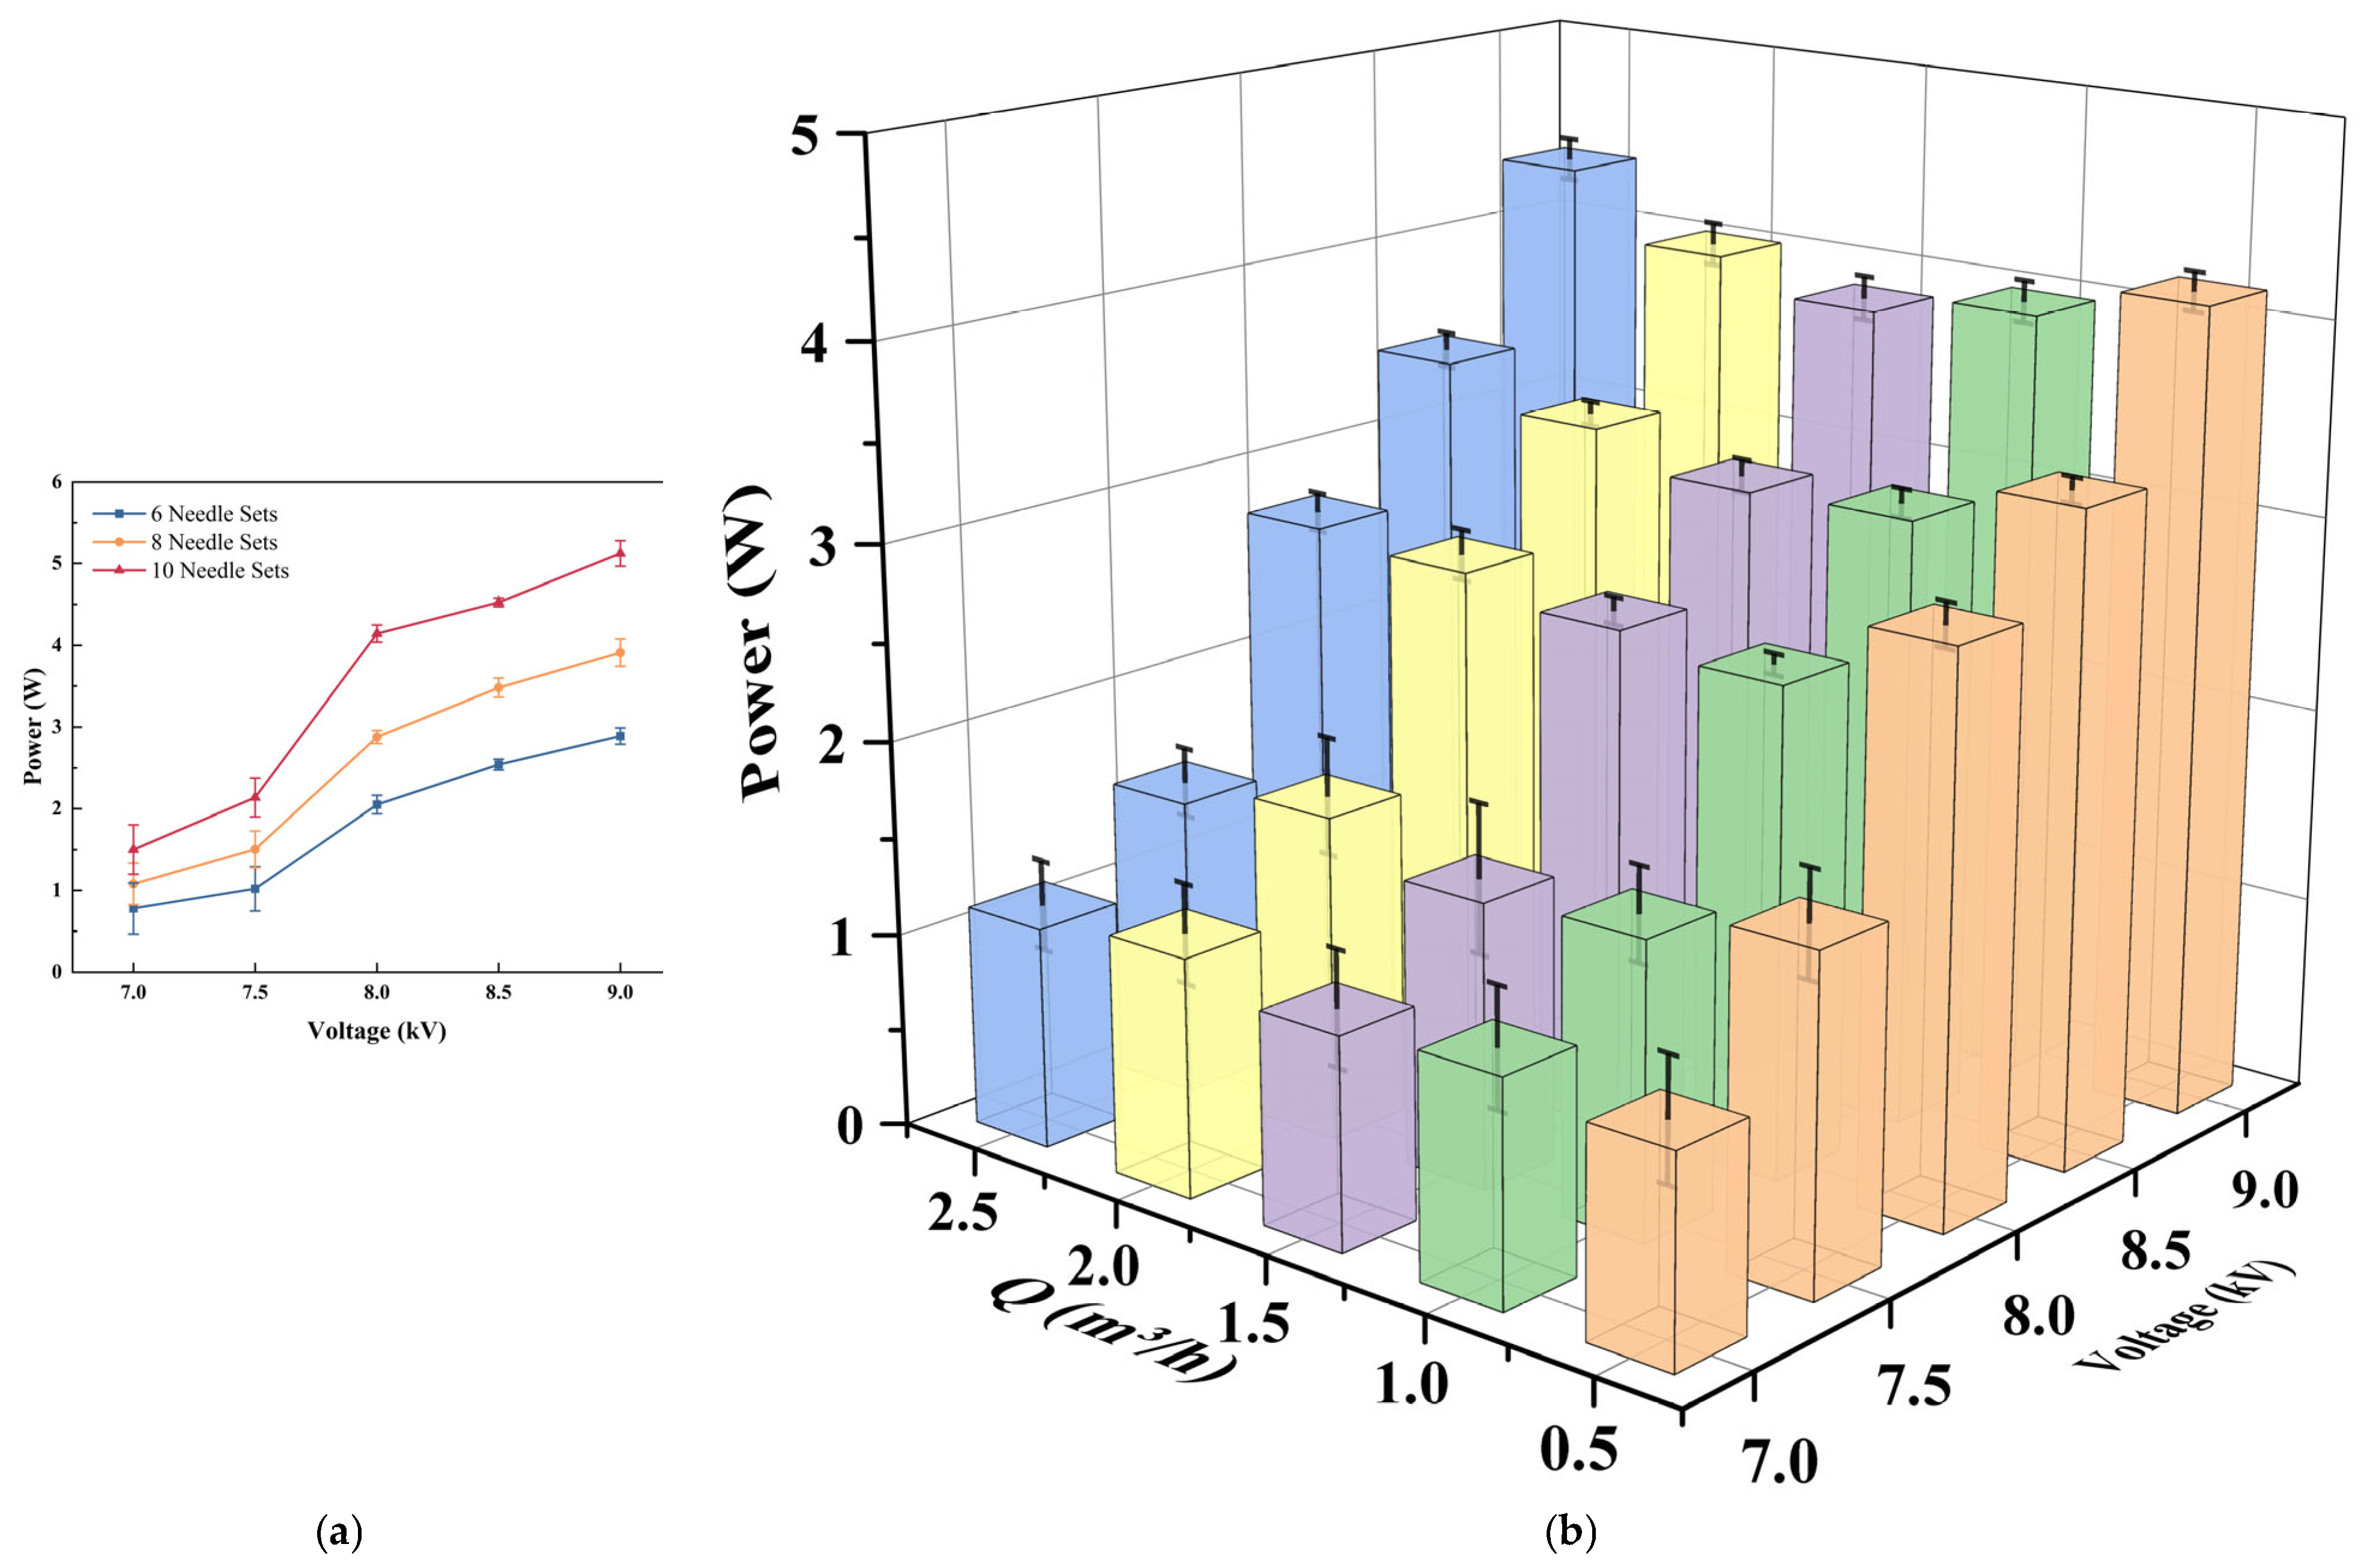
Figure 3a illustrates the interactive effects of the number of needle electrode sets (6, 8, and 10 sets) and the applied voltage on the average discharge power. Generally, the average discharge power exhibits a significant non-linear positive correlation with the applied voltage. As the voltage increases from 7.0 to 9.0 kV, the intensification of the inter-electrode electric field enhances both the frequency and intensity of micro-discharges, thereby improving the energy injection efficiency.
At a fixed voltage level, a distinct step-wise increase in average discharge power is observed with an increasing number of needle sets. Specifically, at the peak voltage of 9.0 kV, the average power consumption for the 6, 8, and 10-needle configurations reaches 2.9 W, 3.9 W, and 5.1 W, respectively. This enhancement is primarily attributed to the increase in effective discharge sites, which induces a greater number of discharge channels, thereby elevating the total transport current and power deposition. Notably, the power curves exhibit a distinct inflection point in the 7.5–8.0 kV range, where the growth slope is maximized. This surge signifies the reactor’s transition from an initial localized corona to a fully developed filamentary discharge regime. As the voltage rises further (8.0–9.0 kV), the average discharge power demonstrates a steady quasi-linear increase. In this region, the gas gap is in a stable breakdown state, the linear dependence of power on voltage observed here aligns well with the classical theory of ozonator discharge proposed by Manley [25]. This indicates that the power enhancement is governed by the theoretical scaling law, driven primarily by the increase in transferred charge per discharge cycle rather than an explosive expansion of the discharge area.
Figure 3b further investigates the influence of gas flow rate (0.5–2.5 m3/h) on the average discharge power of the 8-needle reactor. The results indicate that the applied voltage is the dominant governing factor for power consumption, while the effect of gas flow rate is negligible. Even with a five-fold increase in flow rate, the average discharge power remains relatively constant at a fixed voltage (e.g., 8.0 kV), showing only marginal fluctuations. This is because the development of micro-discharges occurs on the nanosecond (ns) scale, which is orders of magnitude faster than the millisecond (ms) scale residence time of the gas flow. Consequently, aerodynamic disturbances are insufficient to alter the charge accumulation and breakdown mechanisms within the discharge gap. This flow-independent characteristic demonstrates the engineering robustness of the system, providing strong support for subsequent high-flow industrial applications.

3.2. Optimization of Electrode Configuration

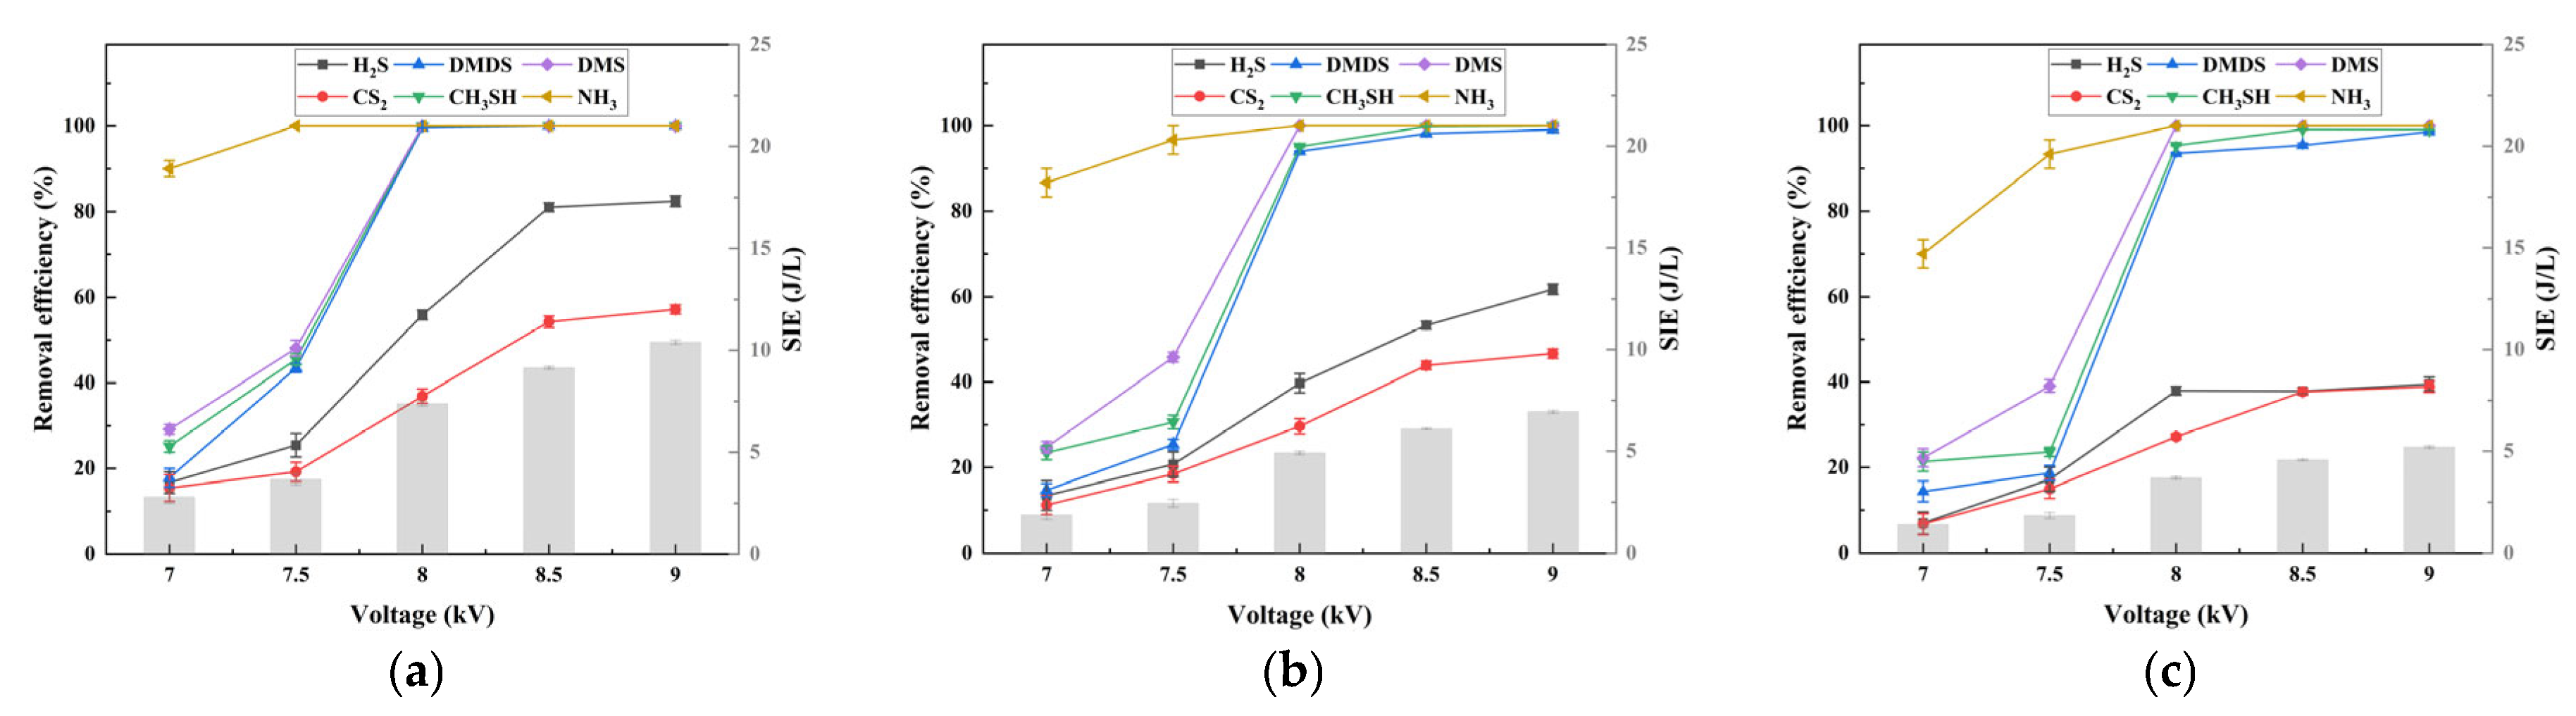
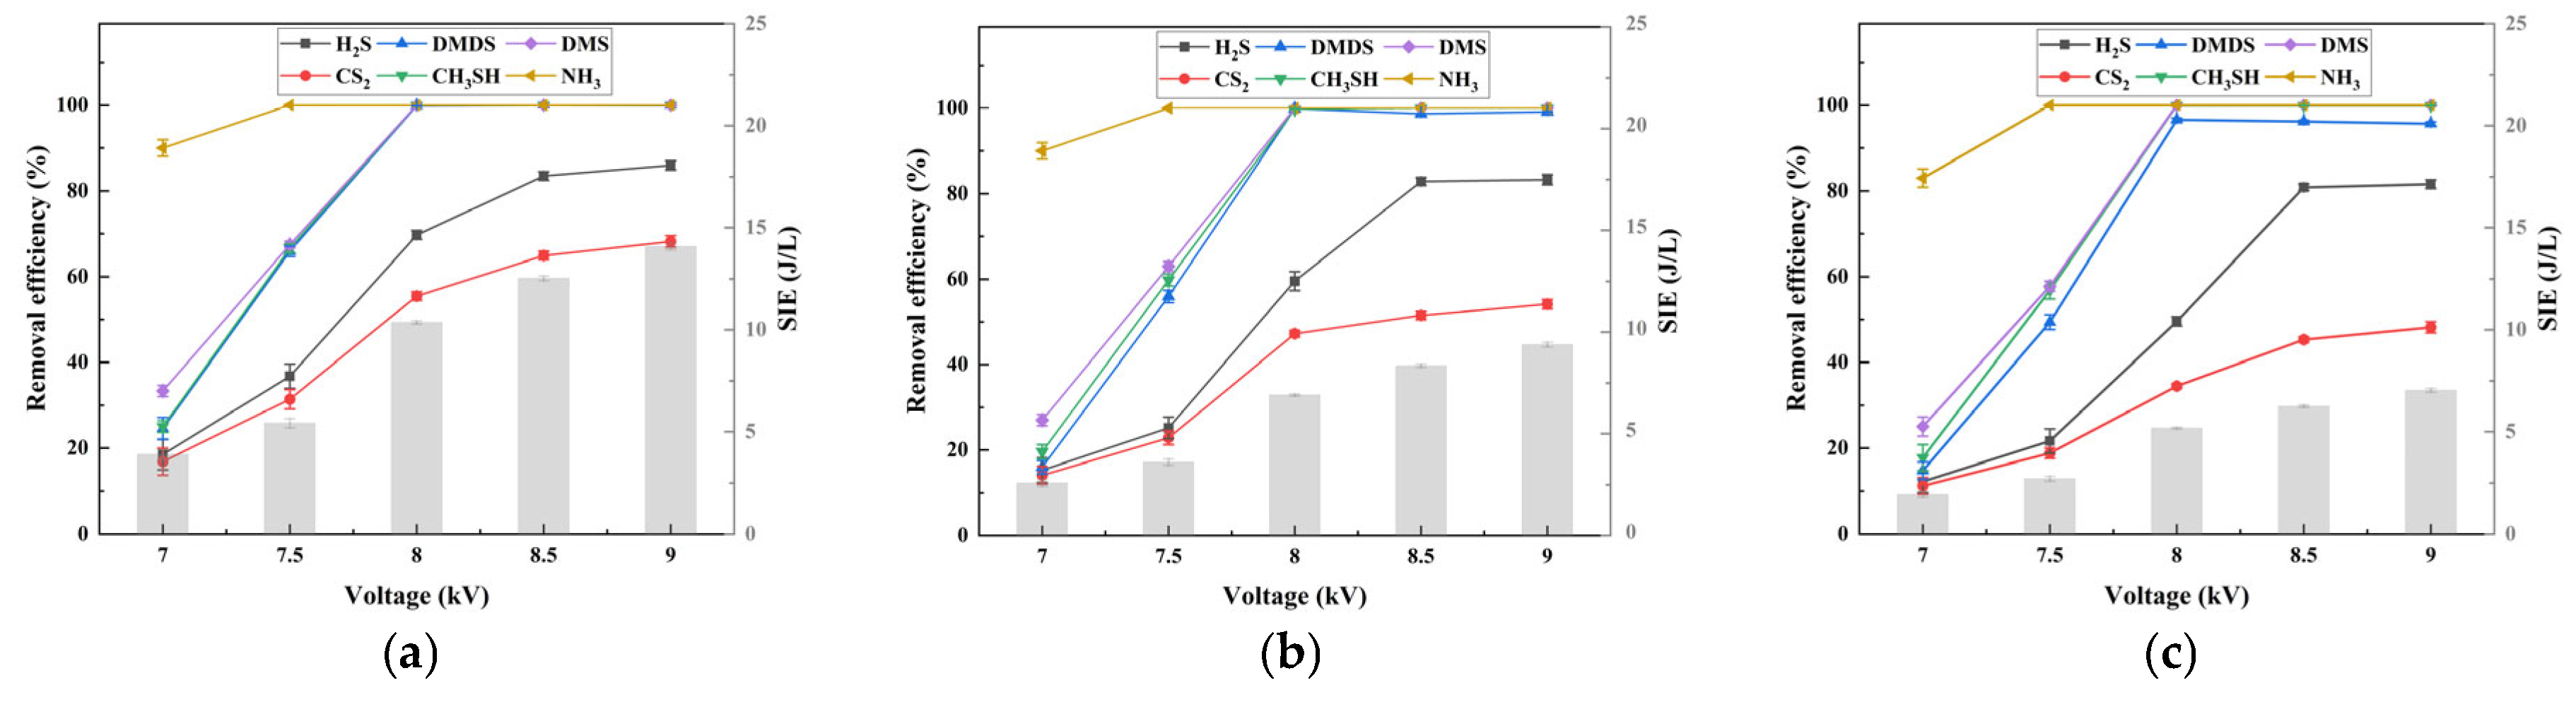
To determine the optimal reactor configuration capable of sustaining high-throughput conditions, the degradation characteristics were systematically evaluated under arrangements of 6, 8, and 10 needle sets. Initially, the flow rate adaptability of the 6- and 8-set arrays was examined within the range of 1.0–2.0 m3/h (Figure 4 and Figure 5). The results indicate that the 6-set configuration exhibits pronounced sensitivity to flow rate variations. As the flow rate increased, the removal efficiency of inorganic sulfides decayed significantly without exhibiting a stable plateau: the removal rates for H2S and CS2 plummeted from peaks of 82.4% and 57.2% to 39.5% and 38.9%, respectively. Conversely, the decline for organic sulfides was minimal (<2%).
This discrepancy is attributed to the differences in degradation kinetics between the pollutants. For inorganic sulfides, the inherently sparse discharge distribution of the 6-set configuration failed to provide sufficient contact time for active species under high gas velocities (shortened residence time). In contrast, organic sulfides exhibit much faster reaction rates due to their rapid oxidation mechanisms, rendering them less sensitive to variations in residence time. Detailed reaction pathways and kinetic mechanisms for these species will be thoroughly discussed in Section 3.7.
Comparatively, the 8-set array demonstrated superior flow rate adaptability (Figure 5). Although the overall removal rate of CS2 decreased (from 68.2% to 48.2%, a drop of approximately 20 percentage points), the efficiency stabilized within the industrially relevant range of 1.5–2.0 m3/h, with the decline controlled within 6%, forming a distinct “performance plateau.” Meanwhile, H2S maintained a high removal level (86.0% to 81.6%). This confirms that the denser discharge network effectively increased the density of the active zone, compensating for the limitations imposed by the shortened residence time at high flow rates.
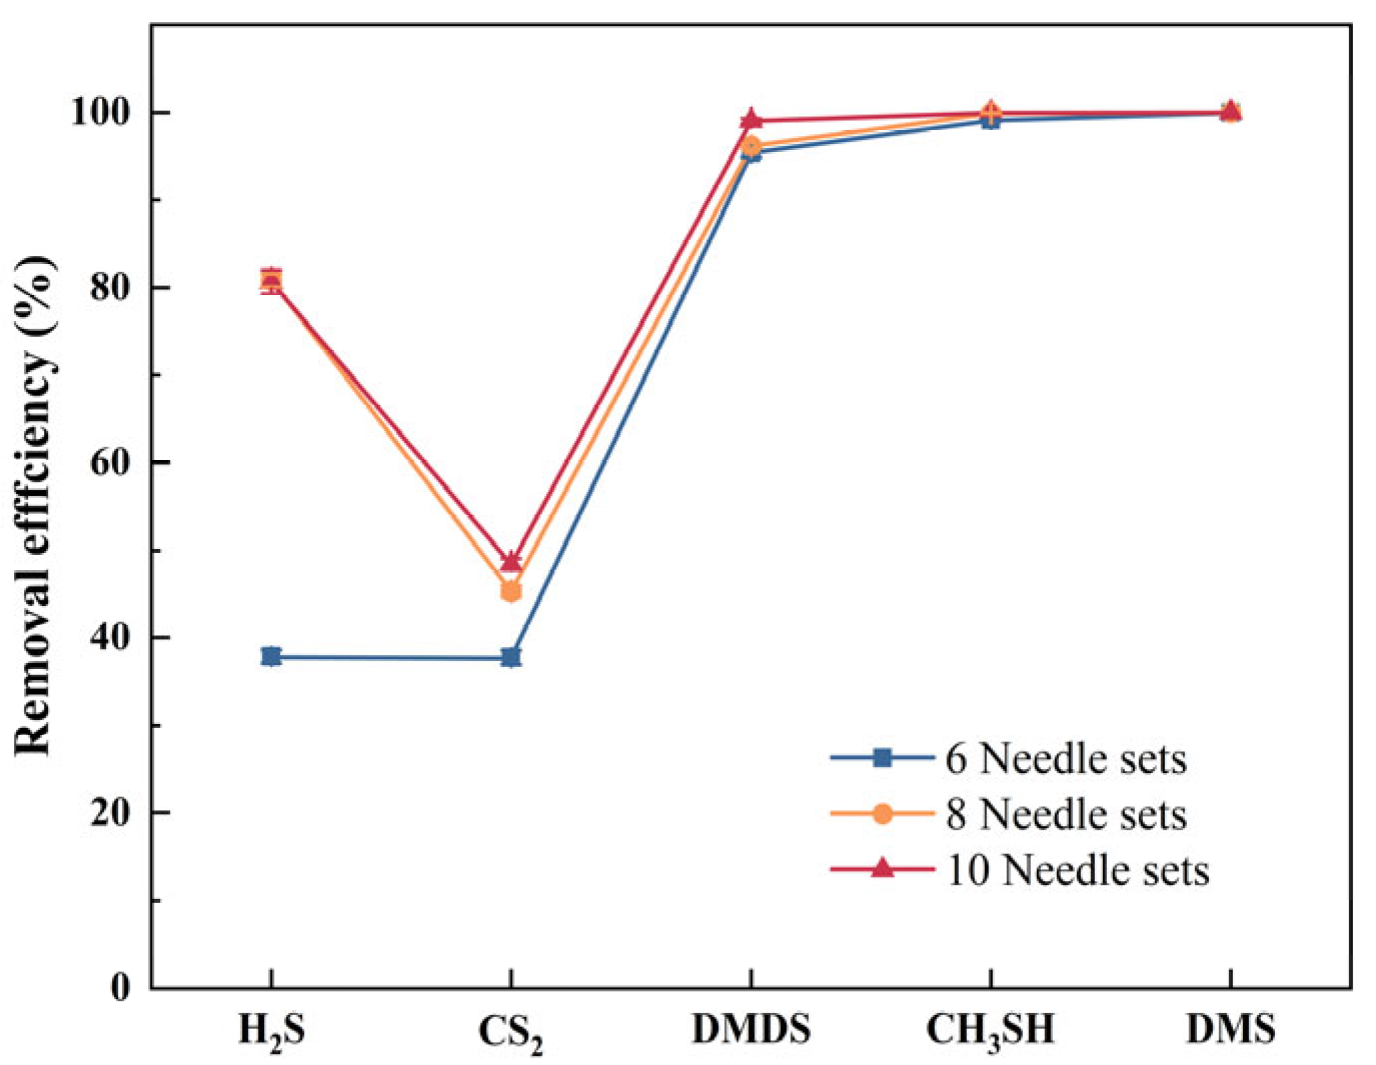
To further optimize the electrode configuration, a lateral comparison was conducted under typical conditions of a 2.0 m3/h gas flow rate and an applied voltage of 8.5 kV (note that 9.0 kV was excluded because it yielded <4% efficiency gain but caused >13% increase in SIE) (Figure 6). Increasing the number of needle sets from 6 to 8 resulted in a substantial improvement in system performance, with H2S removal rising from 37.9% to 80.9%. This improvement is attributed to the expansion of the effective plasma-active region, which increases the probability of interactions between pollutants and energetic electrons/reactive species.
However, a further increase from 8 to 10 sets produced only marginal gains (<3% for all pollutants), indicating diminishing marginal returns despite the higher power input. This saturation is likely governed by a combination of kinetic and transport-related limitations rather than discharge suppression. For readily oxidized pollutants such as H2S, once high removal is achieved in the upstream stages, the residual concentration in the downstream region becomes low; consequently, the additional stages (sets 9–10) contribute only limited incremental removal (reactant-depletion-driven kinetic limitation). For more recalcitrant species such as CS2, adding more discharge stages does not necessarily translate into proportional removal enhancement under high-flow conditions, because the overall performance can become constrained by non-ideal gas–plasma contacting and transport/hydrodynamic effects associated with a denser internal structure (e.g., reduced axial spacing between adjacent internal elements), which may intensify local flow disturbance/wake interaction and reduce the effective residence time in the active discharge zones. The flow-rate-dependent decomposition characteristics of the 10-needle configuration are provided in the Supplementary Materials (Section S2, Figure S3). Notably, spatially resolved measurements of active species (e.g., OH) and axial concentration profiles were not performed in this work; therefore, the above mechanisms are proposed as plausible interpretations based on the observed performance trends.
Consequently, the 8-set configuration, which strikes a balance between high-throughput processing capacity and energy efficiency (SIE maintained at 1.94–7.04 J/L), was selected as the optimal design for this system.

3.3. Energy Efficiency Analysis

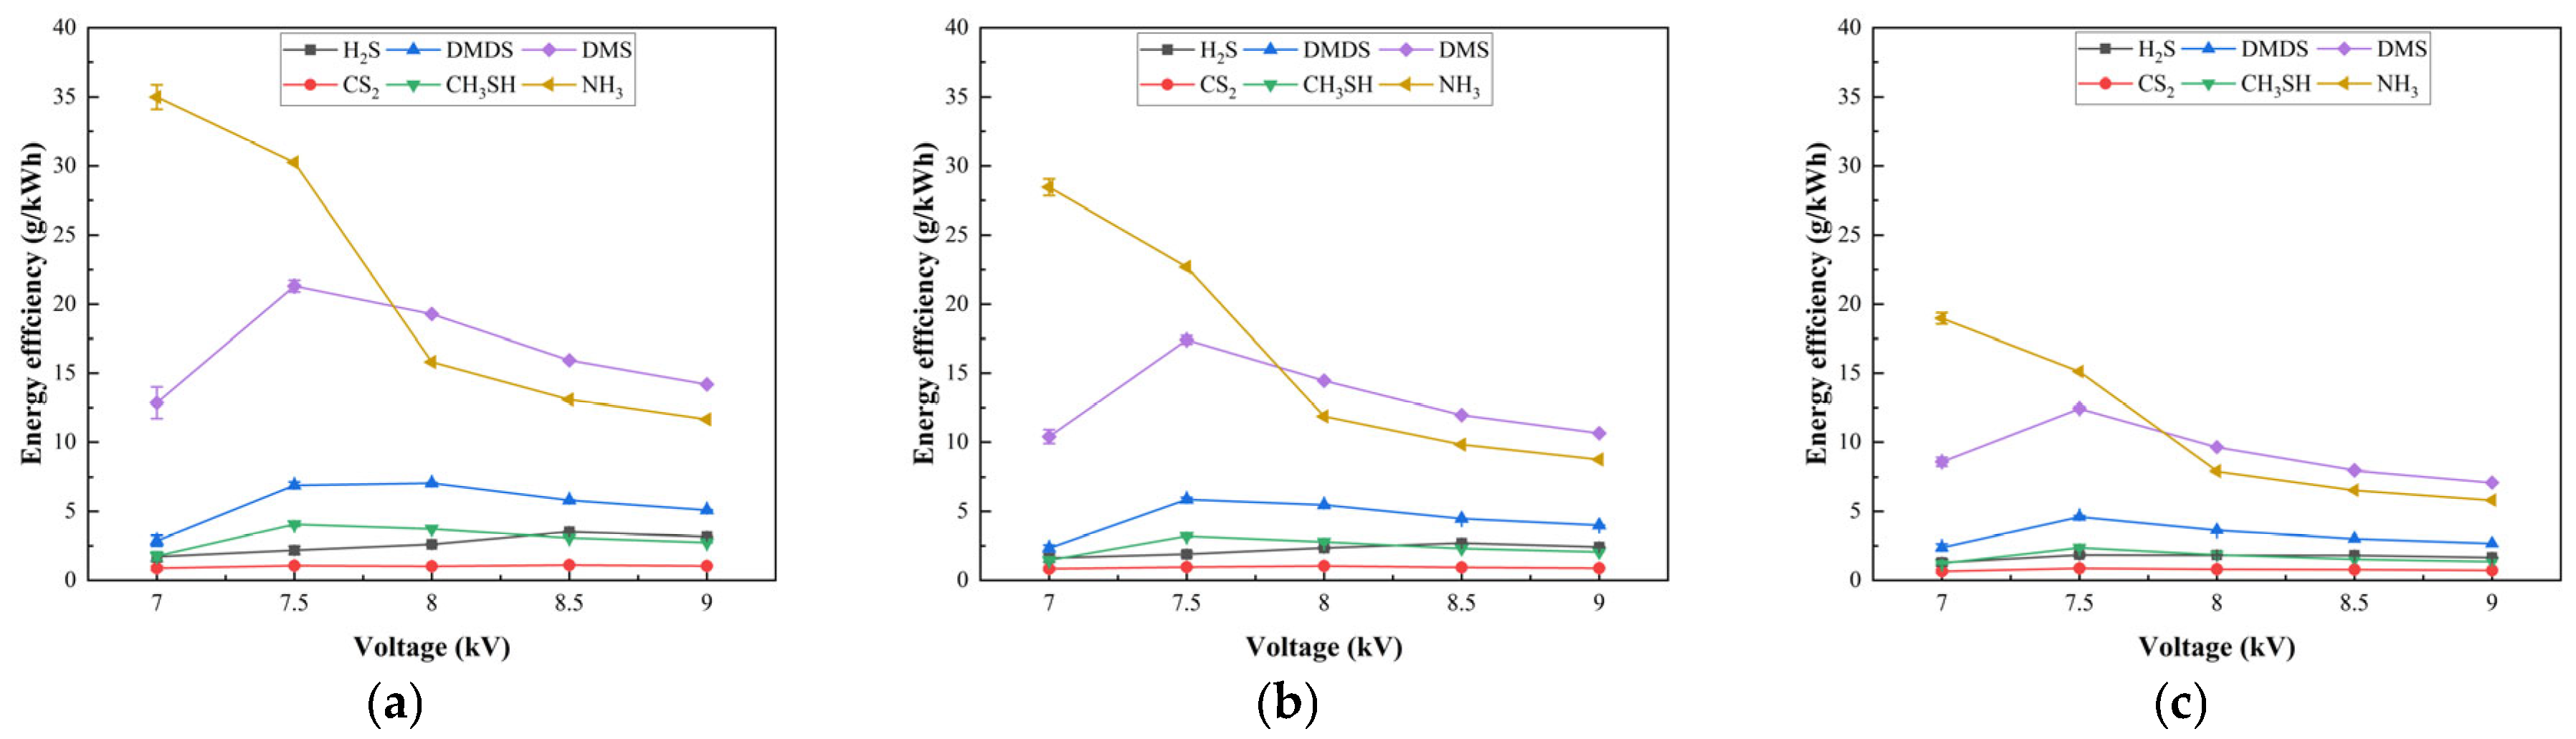
The energy efficiency (EE, g/kWh) of the optimized 8-group needle configuration was characterized under varying voltages and flow rates (Figure 7). Across all flow rates, EE for ammonia and sulfides exhibited a non-monotonic trend, consistently peaking at 7.5 kV. Below this threshold, discharge intensity was insufficient for rapid degradation. Conversely, voltages exceeding 7.5 kV caused a sharp EE decline (e.g., NH3 EE dropped from ~35 to ~12 g/kWh at 9.0 kV). This drop occurs because power consumption rises quadratically while removal rates exhibit diminishing returns, identifying 7.5 kV as the point of maximum energy economy.
Additionally, higher flow rates progressively enhanced EE, with peak NH3 efficiency rising from ~19 to ~35 g/kWh. This is attributed to improved active species utilization; low flow rates result in excessive residence time, leading to non-productive quenching or byproduct over-oxidation. In contrast, higher flows ensure pollutant molecules effectively capture the generated plasma energy.
Regarding pollutant specificity, NH3 and DMS achieved significantly higher EE (>30 and >20 g/kWh) compared to inorganic sulfides (<5 g/kWh). This aligns with the lower bond dissociation energies and faster reaction pathways of amino and methyl groups compared to recalcitrant inorganic structures.
Ultimately, parameter selection requires balancing economy and efficacy. Although 7.5 kV offers peak energy efficiency, removal efficiency continued to rise significantly up to 8.5 kV. Prioritizing regulatory discharge standards, 8.5 kV is recommended as the optimal operating voltage to ensure robust pollutant abatement with acceptable energy consumption.

3.4. Effect of Flow Deflector Ring (DR)

3.4.1. Hydrodynamic Simulation Analysis

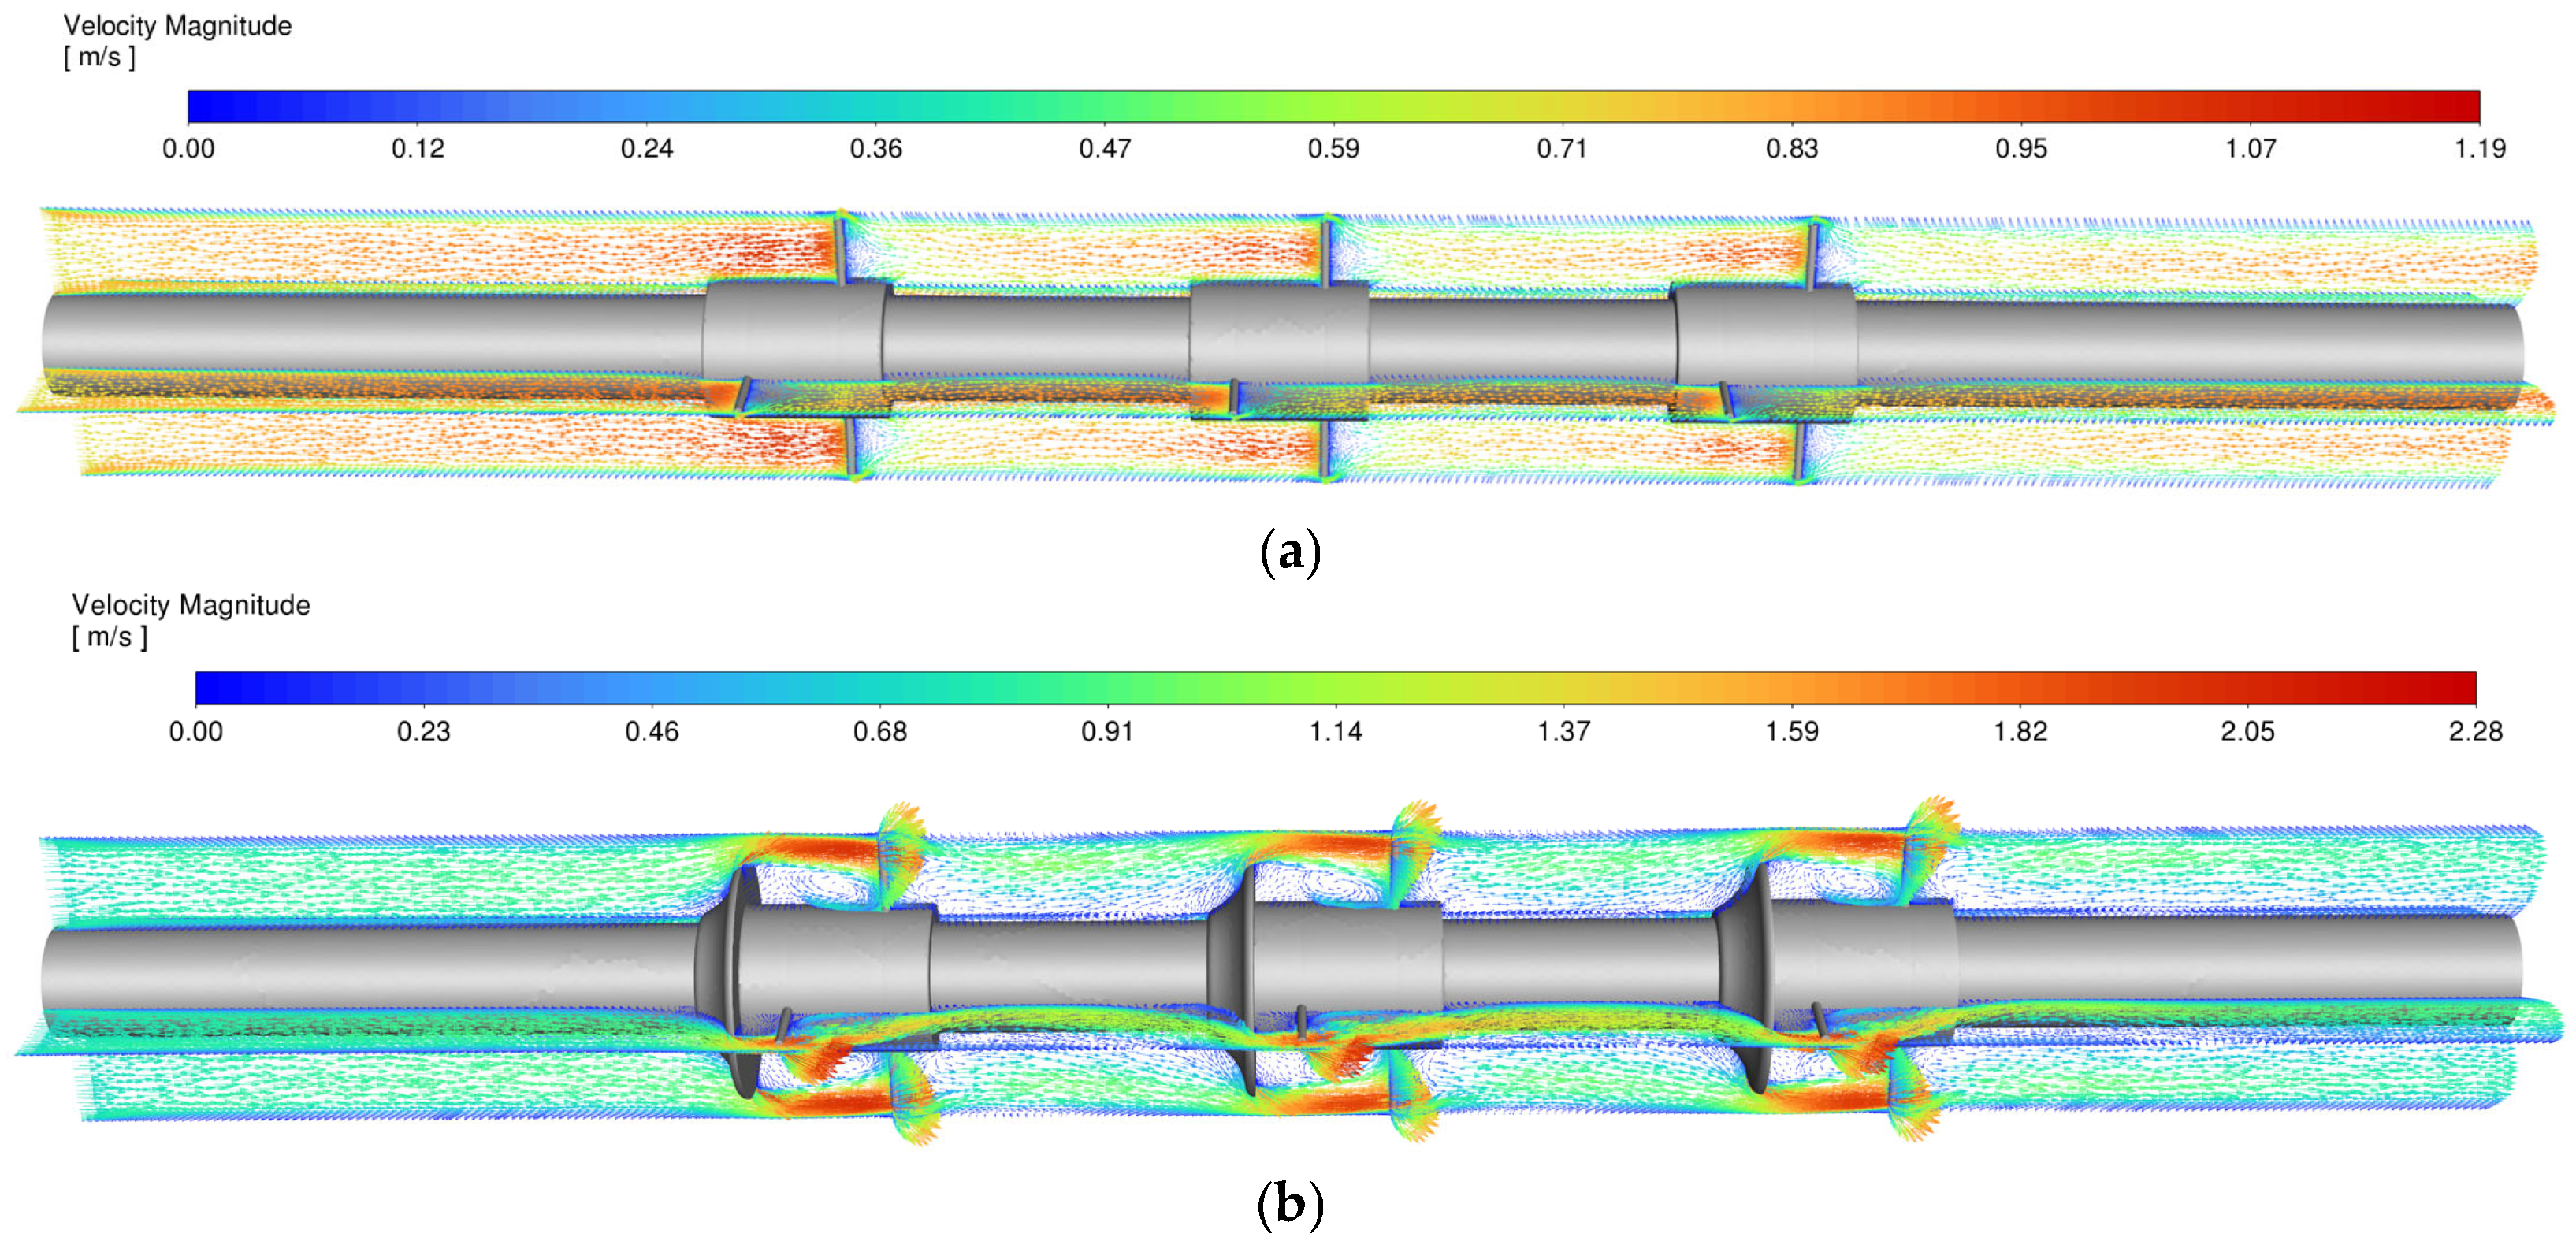
Figure 8a illustrates the axial velocity distribution of the cold flow field without the Deflector Ring (DR) at a flow rate of 2 m3/h. The flow field exhibits a relatively smooth distribution of streamlines. Due to the cross-sectional constriction caused by the 2-mm-thick needle holder, the maximum axial velocity reaches 1.19 m/s near the needle tips, which is approximately 1.7 times the inlet velocity. However, a low-velocity bypass region is observed near the root of the discharge needles and the inner electrode surface. Fluid passing through this region fails to penetrate the core discharge zone, potentially limiting the interaction between the gas and active species.
The flow field with the inclusion of the DR is presented in Figure 8b. The DR significantly accelerates the flow, with the maximum axial velocity peaking at 2.28 m/s at the throat of the guide plate (3.26 times the inlet velocity). The DR modifies the hydrodynamics in two beneficial ways: First, the gas forms a high-speed flow layer downstream of the throat. Given that the intense electric field is primarily concentrated near the tips of the discharge needles, this flow pattern forces the gas to traverse the region enriched with high-energy electrons and active radicals (e.g., ·OH), thereby enhancing the gas-species interaction. Second, a distinct recirculation zone is formed downstream of the DR and the holder, with a maximum negative axial velocity of 0.8 m/s. This vortex structure promotes turbulent mixing and extends the residence time of the gas within the discharge region, further contributing to the degradation efficiency.

3.4.2. Enhancement of Degradation Efficiency

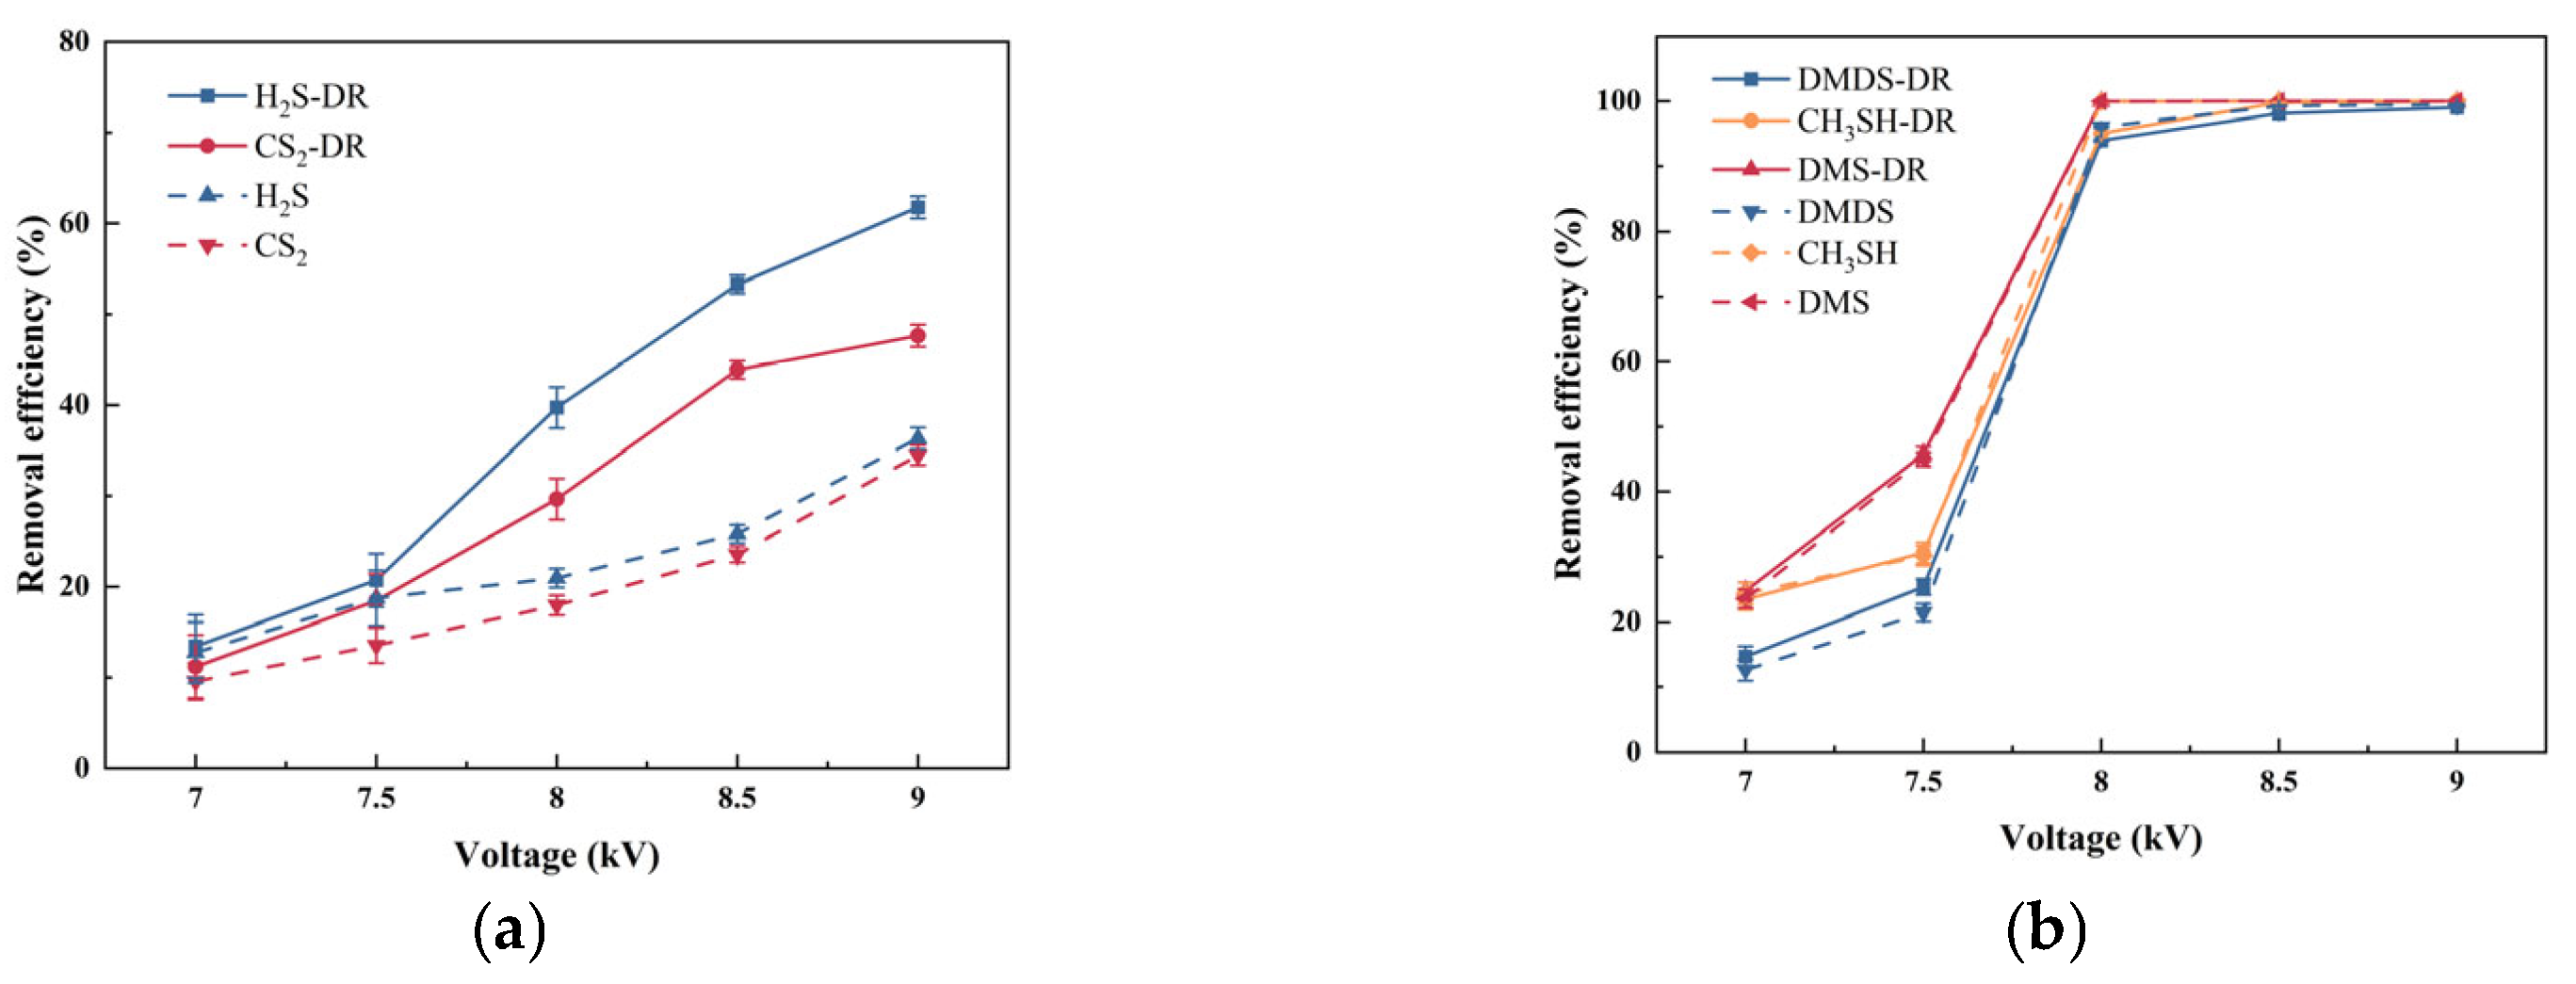
To validate the theoretical benefits of the modified flow field observed in the CFD simulation, comparative experiments were conducted. Figure 9a and b present a comparative analysis of the removal efficiencies for inorganic sulfides (H2S, CS2) and organic sulfides (DMS, DMDS, CH3SH) under a 6-needle electrode configuration at a flow rate of 1.5 m3/h, with and without the implementation of a Deflector Ring (DR).
As shown in Figure 9a, the introduction of the DR resulted in a pronounced enhancement in the degradation of inorganic species. For H2S, the removal efficiency with the DR (H2S-DR) increased linearly with voltage, reaching approximately 62% at 9.0 kV, significantly outperforming the configuration without the DR (~36%). A similar, albeit slightly less dramatic, improvement was observed for CS2, where the DR increased removal efficiency by roughly 10–15 percentage points across the voltage range. This substantial divergence indicates that the degradation of these inorganic species is highly sensitive to hydrodynamic conditions, hinting at a mass-transfer limitation in the absence of the DR.
In stark contrast, Figure 9b reveals a negligible impact of the DR on the removal of organic sulfides. Both the DR-equipped and non-DR configurations exhibited nearly identical performance curves. The removal efficiencies for DMDS, DMS, and CH3SH surged sharply between 7.0 and 8.0 kV, achieving near 100% removal at voltages above 8.0 kV regardless of the presence of the DR.
This overlap suggests that the removal of organic sulfides is primarily governed by energy input (voltage) rather than gas flow patterns, characteristic of a kinetic-controlled regime. Further analysis regarding the underlying reaction mechanisms and bond dissociation energies will be discussed in Section 3.7.

3.5. By-Product Analysis

3.5.1. Byproduct Formation Characteristics

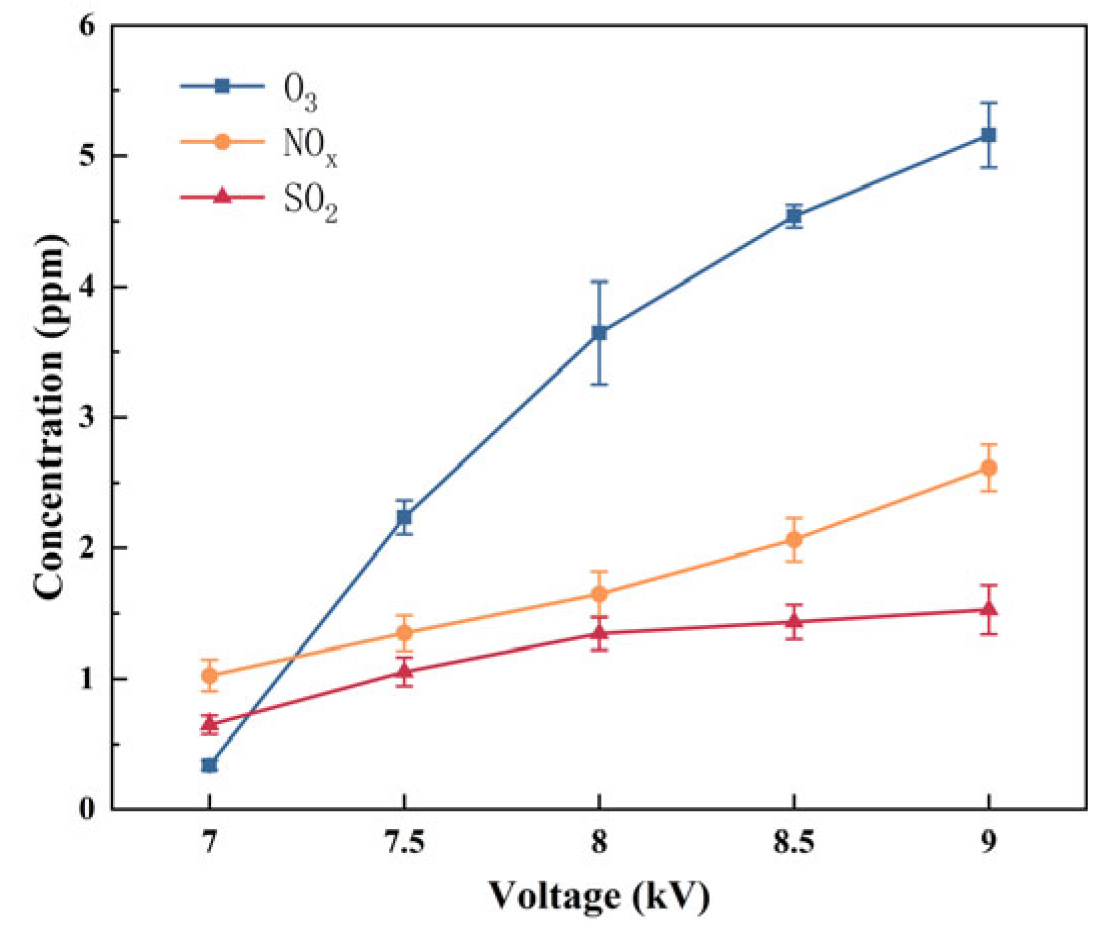
Figure 10 illustrates the variations in the concentrations of secondary pollutants (O3, NOx, and SO2) with applied voltage (7.0–9.0 kV) in the optimized 8-needle reactor at a flow rate of 2 m3/h. The results indicate a monotonic increase in the generation of all three by-products as the discharge voltage rises. Specifically, ozone (O3) concentration exhibited the most significant growth, rising sharply from less than 0.5 ppm at 7.0 kV to approximately 5.2 ppm at 9.0 kV. This is primarily attributed to the enhanced electric field strength at higher voltages, which intensifies the electron-impact dissociation of oxygen molecules in the background gas ( O 2 + e * 2 O * + e ), thereby promoting ozone synthesis. Concurrently, NOx concentration increased linearly, reaching about 2.6 ppm at 9.0 kV. This increase is linked to the enhanced oxidation of nitrogen species, originating from both the background air and the decomposition of ammonia. In contrast, SO2 generation remained at a low level (<1.5 ppm) with a moderate growth trend, likely originating from the oxidation of sulfur-containing intermediates. Notably, at the recommended operating voltage of 8.5 kV, the ozone concentration was maintained below 4.6 ppm. This suggests that while increasing voltage enhances active species density, it also heightens the risk of secondary pollution.

3.5.2. Byproduct Mitigation and Environmental Considerations

Although O3, NOx, and SO2 were detected at the ppm level, continuous operation at high gas flow rates may still lead to non-negligible mass emissions; therefore, end-of-pipe polishing is required to avoid secondary pollution and ensure compliant discharge. The proposed DR-MCDBD reactor can be readily integrated with mature post-treatment units. Specifically, O3 can be efficiently removed using a compact catalytic ozone destruction unit installed downstream of the reactor [26,27]. SO2 can be effectively removed by mature alkaline wet scrubbing (wet flue gas desulfurization (FGD)), most commonly limestone/lime-based systems (and, in specific cases, caustic scrubbing) [28]. NOx control can follow established industrial routes when required by the emission limit (e.g., selective catalytic reduction (SCR)) or site-specific absorption/oxidation strategies depending on the gas composition and operating window [29]. These measures are proposed as practical engineering options; their optimization and verification will be addressed in future work.

3.6. Performance Comparison with Other Studies

Table 1 benchmarks the DR-MCDBD reactor against representative NTP systems reported in the recent literature. Many conventional direct-treatment NTP reactors exhibit a performance–energy trade-off and often require relatively high SIE to achieve high removal. Under optimal conditions (8-needle, 8.5 kV), the DR-MCDBD achieves robust removal of reduced-sulfur odorants at a single-digit SIE (6.26 J/L). Specifically, for a multi-component feed (H2S 5 ppm, CS2 1.25 ppm, DMDS 2.5 ppm, CH3SH 2.5 ppm, DMS 10 ppm, and NH3 30 ppm) at Q = 2 m3/h, the removal efficiencies reach 80.9% (H2S), 45.3% (CS2), 96.2% (DMDS), and 100% for CH3SH/DMS/NH3, with energy efficiency of 1.11–16 g/kWh depending on the species.
We note that advanced DBD variants can also achieve low-SIE/high-removal performance. For example, ref. [11] reports 95% NH3 and 54% H2S removal at 2 J/L with 21.6 ppm residual O3, and ref. [30] reports ~100% removal at 3.37 J/L for single-digit ppm odorants using a wire-mesh DBD, while showing NO2 formation (1.2–16 ppm). These results indicate that inlet concentration, residence time/flow conditions, and by-product formation strongly affect the apparent energy efficiency. In our case, the DR-MCDBD shows low outlet by-products (4.54 ppm O3 and 2.06 ppm NOx, with 1.43 ppm SO2) while treating a more complex, ammonia-rich odor mixture, benefiting from direct micro-gap discharges and a flow-deflector design that enhances residence time and active-species utilization.
Table 1. Comparison of removal performance and energy efficiency between the DR-MCDBD reactor (under optimal conditions) and other NTP systems reported in the literature.
Plasma ParametersConcentrationEnergy SupplyRemoval EfficiencyEEBy-ProductsRef.
DBD75 ppm of NH3113 J/L, 19 kV80%/38 ppm of O3, 32 ppm of NOx[31]
DBD, RH = 20%20 ppm of NH3 and H2S2 J/L, 9 kV95% and 54%/21.6 ppm of O3[11]
Wire and tube plasma reactor, Q = 6 L/min80 ppm of NH3 and H2S235 J/L, 16 kV, 200 Hz73.3% and 84.5%0.75 and 2 g/kWh66.7 ppm of SO2, 266.5 ppm of NO2, 55.4 ppm of O3[32]
Wire-mesh DBD, residence time = 1 s4.5 ppm of H2S, 6.7 ppm of CH3SH and 3 ppm of NH33.37 J/L99.8%, 100%
and 100%
6.7,14.1 and 2.3 g/kWh1.2–16 ppm of NO2[30]
DBD, Q = 140 L/min125 mg/m3 of NH378.9 J/L, 9 kV77.9%4.5 g/kWh0.53 mg/L of N O 2 and 2.79 mg/L of NO3[12]
Wire-plate pulse corona reactor, Q = 13 m3/h105 mg/m3 of CH3CH2SH and 40 mg/m3 of NH365.1 J/L, 200 Hz, 54 kV93.1% and 100%/NOx, O3, SO2, CO2 and CO[14]
200 mg/m3 of CH3CH2SH and H2S65.1–81.4 J/L95.6% and 100%/NOx, O3, SO2, CO2 and CO
DDBD, Q = 1 L/min100 ppm of CS2960–3222 J/L,
6.52–7.04 kV
86.32% and
100%
0.35 and 1.01 g/kWhSO2 and CO2[16]
gliding arc discharge plasma reactor300 mg/m3 of NH3 and 200 mg/m3 of H2S1262 J/L, 11 kV77% and 100%0.13 g/kWh22 mg/L of HCN and 27.8 mg/L of SO2[33]
wire and tube low temperature plasma reactor240 mg/m3 of NH3 and 120 mg/m3 of H2S202.8 J/L, 15 kV, 200 Hz66.1% and 67.3%/O3, SOx and NOx[15]
DBD, Q = 0.25 m3/h22 mg/m3 of DMDS22.5 J/L, 20 kV61%/SO2 selectivity 33.86%[34]
60 mg/m3 of DMDS22.5 J/L, 20 kV22%/SO2 selectivity 7.75%
22 mg/m3 of DMDS10 J/L, 20 kV32.68%/SO2 selectivity 10%
DBD, Q = 3.75 L/min75 mg/m3 of H2S235.2 JL, 20 kV22%0.25 g/kWhO3 and SOx[35]
75 mg/m3 of H2S382.4 JL, 27.5 kV47%0.32 g/kWhO3 and SOx
DR-MCDBD, Q = 2 m3/hH2S (5 ppm), CS2 (1.25 ppm), DMDS (2.5 ppm), CH3SH (2.5 ppm), DMS (10 ppm) and NH3 (30 ppm)6.26 J/L, 8.5 kV80.9%, 45.3%, 96.2%, and 100%1.11–16 g/
kWh
4.54 ppm of O3, 2.06 ppm of NOx, 1.43 ppm of SO2This work

3.7. Mechanism Discussion

The experimental results above highlight a distinct disparity in removal behaviors: organic sulfides remained insensitive to flow field alterations (Figure 9b), while inorganic sulfides showed significant enhancement with the DR (Figure 9a). Based on these observations, we propose a mechanism that couples hydrodynamics with the localized energy field to interpret the degradation pathways, supported by CFD simulations and reaction kinetics analysis.

3.7.1. Molecular Intrinsic Reactivity and Degradation Pathways

The macroscopic degradation performance differs significantly between pollutants (Figure 9). This disparity fundamentally originates from the intrinsic differences in their molecular stability and reaction kinetics. The O H -initiated oxidation of a pollutant P is described by the elementary bimolecular rate law r = k[ O H ][P], which is first-order in [ O H ] and first-order in [P] (second-order overall). Under quasi-steady [ O H ] conditions, the pollutant decay follows pseudo-first-order kinetics with k′ = k[ O H ]eff, where [ O H ]eff denotes the effective exposure-averaged radical level experienced by pollutant molecules in plasma-reactive zones.
Quantitatively, the reaction rate constants (k) of organic sulfides (e.g., DMDS, CH3SH) with hydroxyl radicals ( O H ) are 1–2 orders of magnitude higher than those of inorganic sulfides (e.g., H2S, CS2). According to evaluated kinetic sources [36,37], the rate constants follow the order: DMDS > CH3SH > DMS > H2S > CS2.
Specifically, organic sulfides exhibit rapid kinetics. The rate constant for DMDS is approximately 2.0 × 1 0 10 c m 3 m o l e c u l e 1 s 1 , and for CH3SH it is 3.3 × 1 0 11 c m 3 m o l e c u l e 1 s 1 . Although its reaction with O H is slower ( k 6.5 × 1 0 12 c m 3 m o l e c u l e 1 s 1 ), DMS remains more reactive than H2S and can also undergo rapid oxidation by other species such as oxygen atoms ( k ( O ) 3.7 × 10 11   cm 3 molecule 1 s 1 ). This high reactivity is attributed to their relatively weak C–S or S–H bonds (e.g., C–S ≈ 2.85 eV [38]), which allows for facile H-abstraction or adduct formation. These fast pathways (Equation (4)) render organic sulfides less sensitive to hydrodynamic bypass (Kinetic-Controlled Regime).
C H 3 S H / D M S / D M D S e * [ C H 3 , S , S H ] O H , O S O 2 + C O 2 + H 2 O
To quantitatively connect intrinsic kinetics with reactor-scale performance, we define a residence-time-based Damköhler number, D a = k[ O H ]eff τ res . In the discharge zone, the residence time is τ res 0.57 s at a flow rate of 2 m3h−1. The critical radical level required to reach D a 1 , then [ OH ] = 1 / ( k τ res ) . Calculated thresholds yield O H * ~ 8.8 × 10 9   cm 3 for DMDS, 5.3 × 10 10   cm 3 for CH3SH, 2.7 × 10 11   cm 3 for DMS, 3.7 × 10 11   cm 3 for H2S, and 1.5 × 10 12   cm 3 for CS2. Therefore, DMDS can reach D a 1 at much lower effective radical exposures than CS2, providing a quantitative basis for the observed transition from kinetic-controlled to mass-transfer-limited (transport-/exposure-limited) behavior.
It is important to emphasize that [ O H ]eff represents an exposure-averaged radical level, as OH radicals in atmospheric-pressure discharges are strongly localized in space and time. Absolute diagnostics, such as UV absorption and calibrated LIF/PLIF in air/H2O DBDs and pulsed discharges, report OH densities spanning   ~ 10 13   c m 3 at the reactor scale, while substantially higher transient OH levels occur in microdischarge/filament high-field regions [39,40]. In particular, UV absorption measurements for kHz air DBDs show OH densities on the order of ~ 10 19   m 3 ( ~ 10 13 cm 3 ) and indicate that OH is generated predominantly inside microdischarges [39]. Time-resolved PLIF studies further demonstrate pronounced filament-core-associated OH structures with local peaks significantly exceeding bulk averages [40,41]. Therefore, reaching the higher critical level required for CS2 ( [ OH ] ~ 1.5 × 10 12   cm 3 ) is consistent with the necessity of experiencing sufficiently high local radical densities (on the order of the critical [ OH ] ) found in plasma-active micro-discharge/streamer regions. This physical constraint reinforces why CS2 removal is highly sensitive to the flow-field optimization provided by the Deflector Rings.
In contrast, inorganic sulfides show significantly slower kinetics. The rate constant for H2S with O H is roughly 4.7 × 10 12   cm 3 molecule 1 s 1 (Equation (5)). CS2 is the most recalcitrant, with a rate constant of only 1.2 × 10 12   cm 3 molecule 1 s 1 . This kinetic inertness stems from the combined effect of the strong C=S double bonds (BDE ≈ 4.5 eV [42]) and a slow initial O H -addition mechanism, presenting a high kinetic barrier to radical oxidation. Consequently, CS2 degradation may additionally involve plasma-specific pathways (e.g., electron-impact dissociation) in high-energy regions (Equation (6)). In this work, the term “Mass Transfer-Limited Regime” refers to limitations by transport and effective exposure—specifically, the probability of molecules entering plasma-active streamer cores to experience sufficiently high local radical/electron densities (on the order of the critical [⋅OH])—rather than molecular diffusion alone. This explains why CS2 removal is highly sensitive to flow-field optimization by the Deflector Rings.
H 2 S e * [ H , S , H S ] O H , O S O 2 / S O 3 / S + H 2 O
C S 2 e * [ S , C S , C ] O H , O S O 2 + C O 2 + ( O C S , N O x )

3.7.2. Chemical Synergy and Potential Gas-to-Particle Conversion

Beyond the independent degradation pathways, a distinct synergistic effect exists between NH3 and sulfur-containing compounds, which significantly enhances the overall removal efficiency [12].
Radical Propagation: The co-existence of NH3 and H2S may establish a self-sustaining radical cycle. The reactive hydrogen atoms ( H ) released from H2S dissociation (Equation (5)) may act as cross-initiators. Concurrently, bulk radicals ( O H , O ) accelerate the decomposition of NH3 into amino radicals ( N H 2 ) via hydrogen abstraction, as shown in Equation (7). Note that the reaction with O generates secondary O H radicals, further propagating the chain reaction. The generated NH2 subsequently contributes to De-NOx processes (Equation (8)).
N H 3 + O H / O N H 2 + H 2 O / O H
N H 2 + N O N 2 + H 2 O
Gas-to-Particle Conversion: A plausible terminal pathway is the in situ conversion of gaseous pollutants into solid deposits. As depicted in Equations (9) and (10), the acidic oxidation products (HNO3 and H2SO4) are proposed to react with excess NH3 to form ammonium nitrate and ammonium sulfate.
N O 2 + O H H N O 3 N H 3 N H 4 N O 3 ( s )
S O 2 + O S O 3 H 2 O H 2 S O 4 N H 3 ( N H 4 ) 2 S O 4 ( s )
This hypothesis is supported by the qualitative observation of yellowish-white solid residues accumulating on the inner surface of the dielectric barrier tube. The white precipitates are consistent with ammonium salt formation, whereas the yellowish traces may suggest the co-deposition of sulfur-containing species (e.g., elemental sulfur) derived from H2S-related pathways (Equation (5)). These observations suggest that a fraction of the pollutants may be removed via gas-to-particle conversion (phase transition) rather than solely by gaseous oxidation. However, the deposits were not collected or characterized (mass loading, morphology, or composition) in this study, and the long-term operational impacts (e.g., fouling/pressure-drop increase) were not evaluated; therefore, these issues warrant dedicated future investigations, including deposit characterization (e.g., SEM–EDS/XRD/ion chromatography) and extended durability tests with pressure-drop and discharge-stability monitoring.

3.7.3. Spatial Mismatch and Flow Field Reconstruction

In the baseline MCDBD configuration without the DR, the CFD velocity profiles presented in Figure 8a reveal a critical “Bypass Effect.” A significant fraction of the gas stream flows through the interstitial spaces, effectively bypassing the active high-energy zones at the needle tips. This confirms the spatial mismatch where the bulk gas velocity is decoupled from the discharge energy density.
The introduction of the DR functions as a passive process intensification strategy. As shown in the flow topology in Figure 8b, the DR mechanically blocks the low-field zones and forces the gas stream to converge toward the high-energy electron avalanche zone (indicated by the high-velocity regions). Furthermore, the recirculation vortices observed downstream of the DR structure (refer to Figure 8b) extend the residence time of pollutants. This hydrodynamic reconstruction ensures that intermediates (like carbonyl sulfide (OCS)) and precursors for salt formation remain within the radical-rich environment long enough to undergo complete conversion.

3.7.4. Unified Synergistic Mechanism

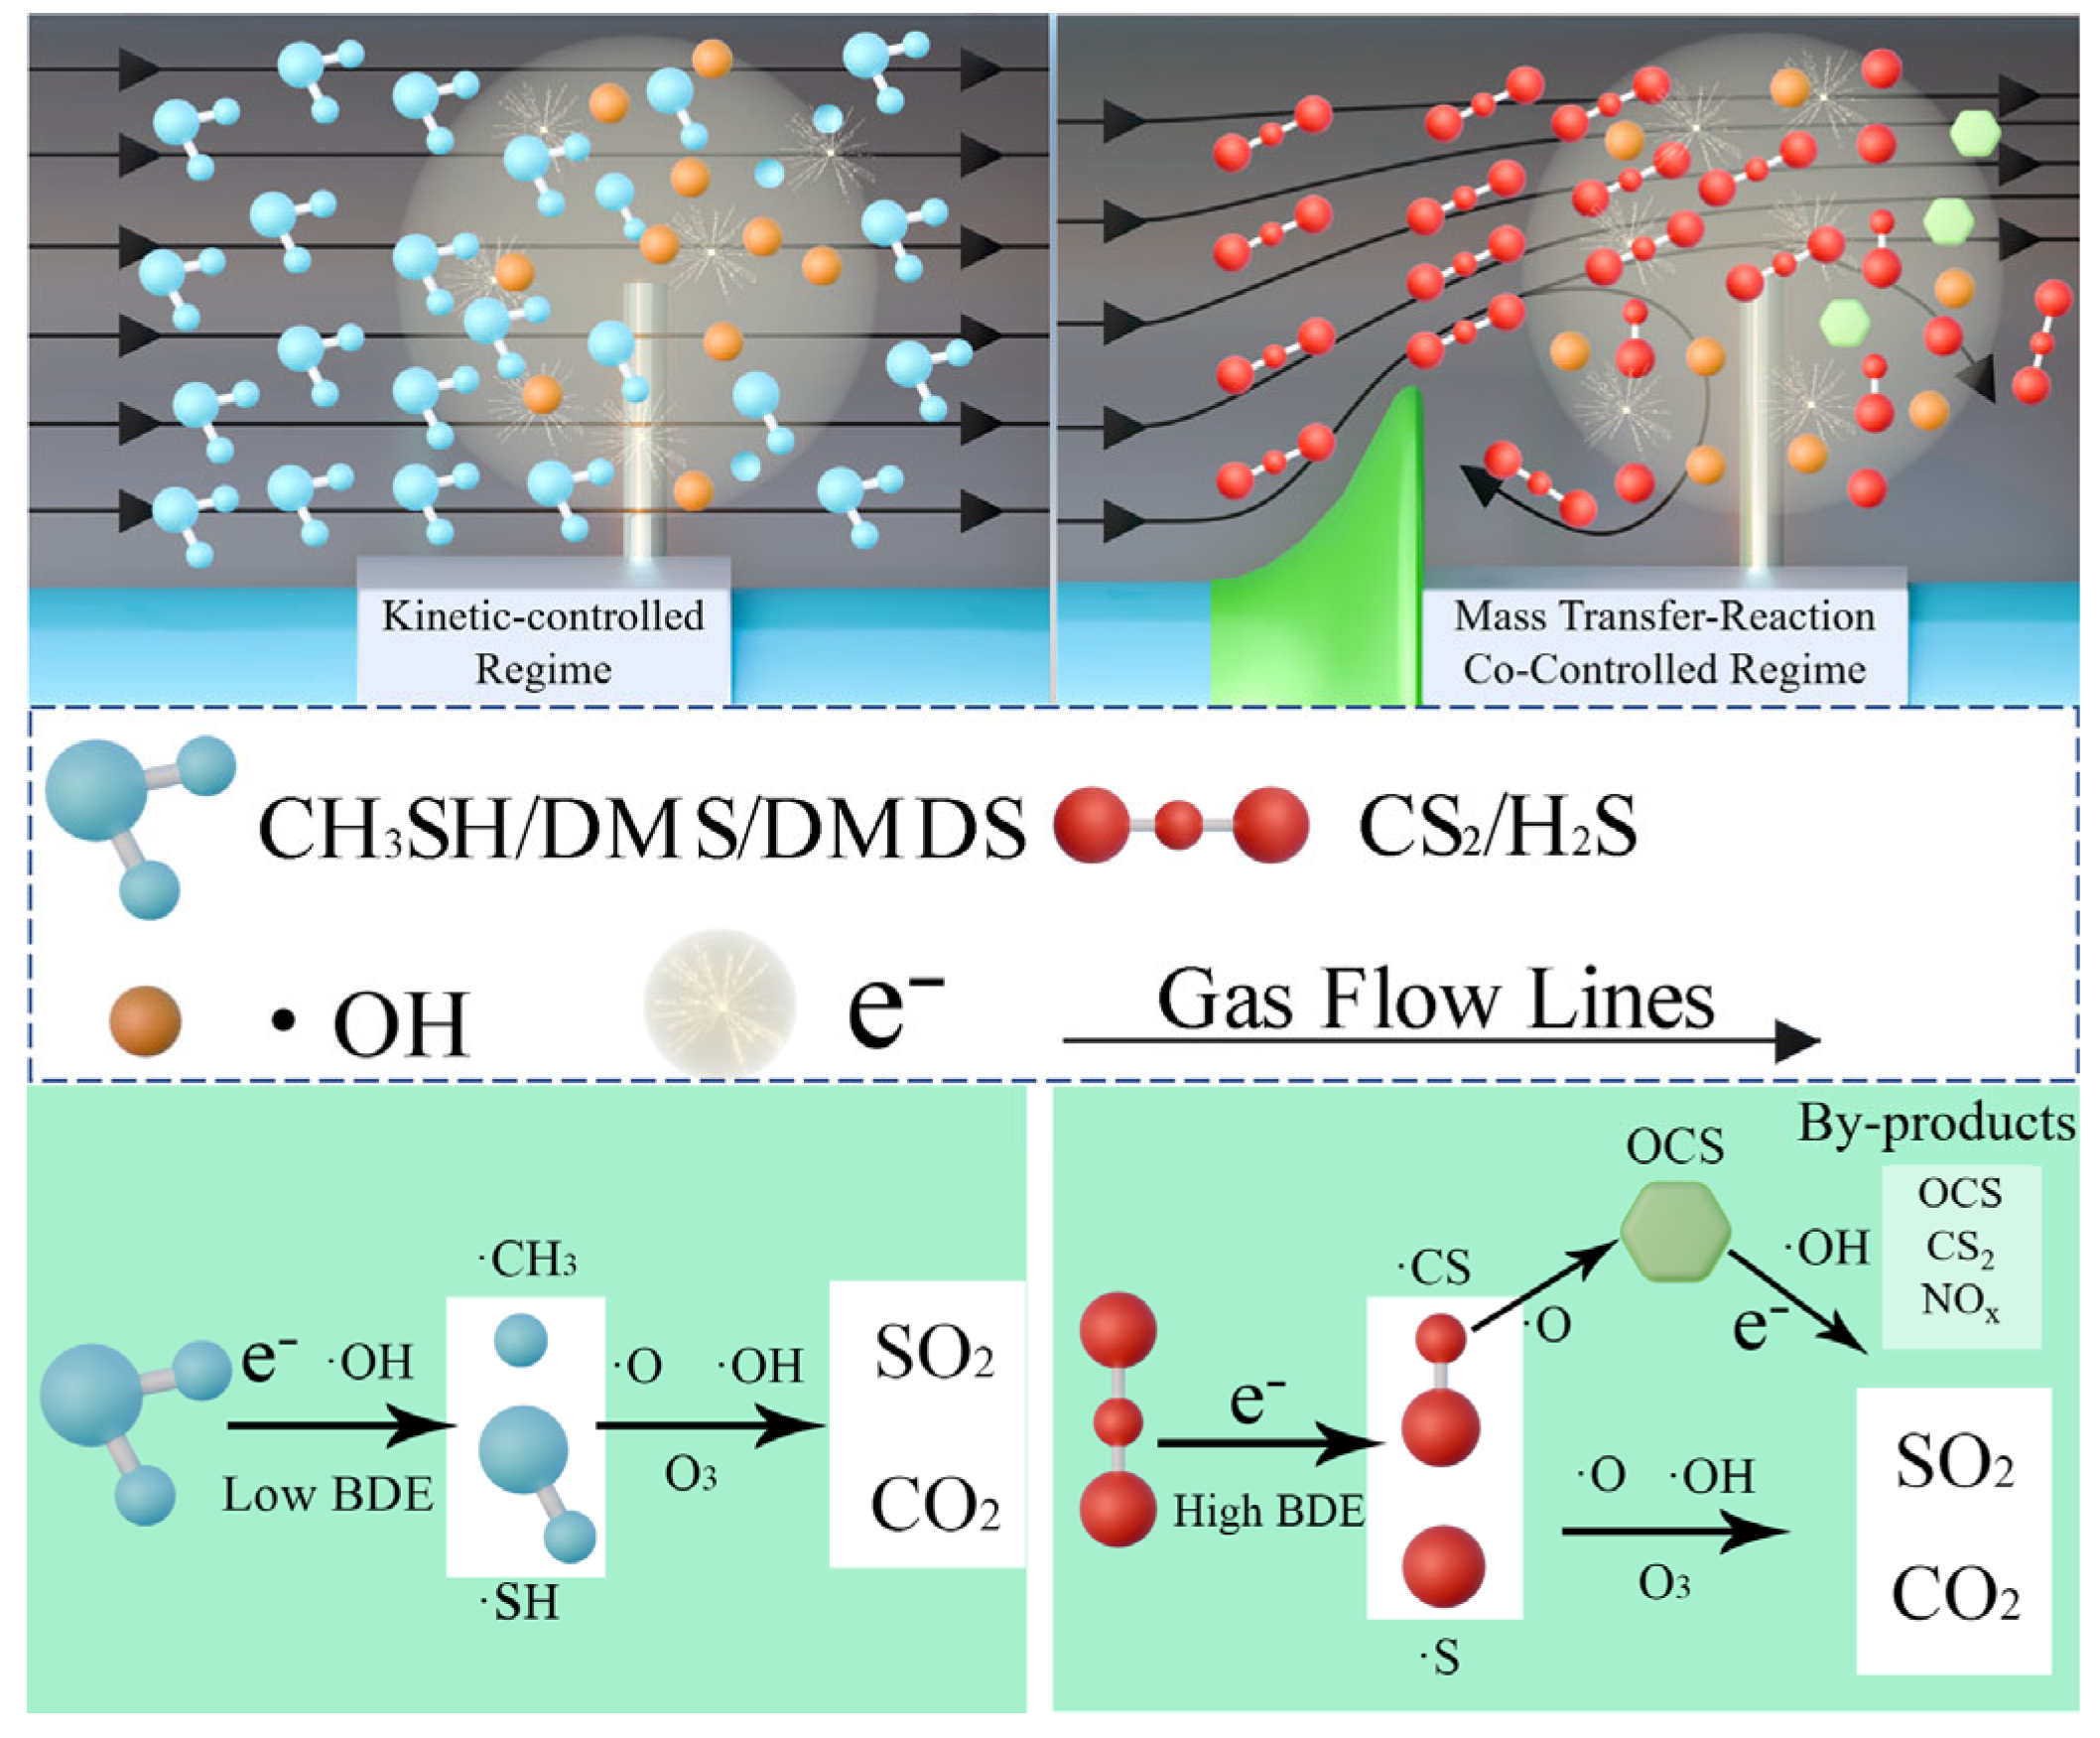
Based on the distinct responses to flow field modulation (refer to Figure 8), the degradation process can be categorized into two distinct regimes, as visualized in the upper panel of Figure 11:
  • Kinetic-Controlled Regime (Organic Sulfides);
For organic sulfides possessing low BDE, the overall reaction rate is primarily governed by intrinsic chemical kinetics rather than physical transport. As shown in the left panel of Figure 11, these highly reactive molecules can be effectively degraded by radicals dispersed in the bulk flow. This explains the negligible enhancement provided by the DR as observed in Figure 9b.
2.
Mass Transfer-Reaction Co-Controlled Regime (Inorganic Sulfides).
For refractory molecules like CS2 (High BDE), degradation is strictly confined to the high-energy streamer channels. The DR establishes a co-controlled regime (right panel of Figure 11): it enhances mass transfer by directing pollutants into the discharge zone and promotes reaction completeness by extending residence time. This mechanism perfectly elucidates the experimental results in Figure 9a, where inorganic sulfide removal rose sharply with flow optimization.

4. Conclusions

This study developed a novel Dielectric Barrier Discharge reactor (DR-MCDBD) to resolve the conflict between gas throughput and energy efficiency. The reactor features a Multi-Needle to Cylinder configuration integrated with Flow Deflector Rings. Optimization tests identified the 8-needle topology as the ideal geometry, as it effectively balances discharge density with electric field shielding. Furthermore, the Flow Deflector Rings successfully reconstructed the hydrodynamic field. By mitigating the “bypass effect” and inducing local turbulence, this modification extended gas residence time and enhanced collision probabilities.
Crucially, the study elucidated distinct degradation behaviors. Organic sulfide removal was primarily kinetically controlled. In contrast, refractory inorganic sulfides (e.g., CS2) followed a mass transfer-reaction co-controlled mechanism. This distinction highlights the necessity of hydrodynamic modulation to overcome mass-transfer limitations. Under optimal conditions, the system removed over 80% of H2S and nearly 100% of organic sulfides. Notably, these results were achieved at a remarkably low SIE of 6.26 J/L, with O3/NOx/SO2 observed at the ppm level. Overall, the synergistic regulation of discharge and flow fields establishes the DR-MCDBD reactor as a scalable and readily integrable concept for industrial odor control, when coupled with appropriate downstream abatement for O3/NOx/SO2.

Supplementary Materials

The following supporting information can be downloaded at: https://www.mdpi.com/article/10.3390/en19041075/s1, Figure S1: Grid-independence test at U_{in} = 0.35 m/s (≈1.0 m3/h); Table S1: Summary of CFD settings (governing equations, boundary conditions, numerics, and mesh); Figure S2: Computational mesh of the reactor domain used in ANSYS Fluent (polyhedral mesh); Figure S3: Decomposition characteristics (removal efficiency and SIE as a function of applied voltage) of ammonia and various sulfides in the 10-needle DR-MCDBD reactor under different gas flow rates.

Author Contributions

Q.Q., Z.Z. and Y.Z. developed the idea of this study; Q.Q., Z.Z. and Q.X. conducted the calculations and experiments; data analysis was performed by Q.Q. and Y.Z.; W.L. and X.H. revised the manuscript. All authors have read and agreed to the published version of the manuscript.

Funding

This work was supported by Zhejiang University Funding Project (DZL202517).

Data Availability Statement

The original contributions presented in this study are included in the article/Supplementary Material. Further inquiries can be directed to the corresponding author.

Conflicts of Interest

The authors declare no conflicts of interest.

References

  1. Wang, Y.; Han, M.; Jia, T.; Hu, X.; Zhu, H.; Tong, Z.; Lin, Y.; Wang, C.; Liu, D.; Peng, Y.; et al. Emissions; measurement, and control of odor in livestock farms: A review. Sci. Total Environ. 2021, 776, 145735. [Google Scholar] [CrossRef]
  2. Tong, R.; Zhang, L.; Yang, X.; Liu, J.; Zhou, P.; Li, J. Emission characteristics and probabilistic health risk of volatile organic compounds from solvents in wooden furniture manufacturing. J. Clean. Prod. 2019, 208, 1096–1108. [Google Scholar] [CrossRef]
  3. Nguyen, M.K.; Lin, C.; Hoang, H.G.; Bui, X.T.; Ngo, H.H.; Le, V.G.; Tran, H. Investigation of biochar amendments on odor reduction and their characteristics during food waste co-composting. Sci. Total Environ. 2023, 865, 161128. [Google Scholar] [CrossRef]
  4. Wang, X.; Selvam, A.; Lau, S.S.S.; Wong, J.W.C. Inffuence of lime and struvite on microbial community succession and odour emission during food waste composting. Bioresour. Technol. 2018, 247, 652–659. [Google Scholar] [CrossRef]
  5. Schiavon, M.; Martini, L.M.; Corra, C.; Scapinello, M.; Coller, G.; Tosi, P.; Ragazzi, M. Characterisation of volatile organic compounds (VOCs) released by the composting of different waste matrices. Environ. Pollut. 2017, 231, 845–853. [Google Scholar] [CrossRef]
  6. Dobslaw, D.; Ortlinghaus, O.; Dobslaw, C. A combined process of non-thermal plasma and a low-cost mineral adsorber for VOC removal and odor abatement in emissions of organic waste treatment plants. J. Environ. Chem. Eng. 2018, 6, 2281–2289. [Google Scholar] [CrossRef]
  7. Scaglia, B.; Orzi, V.; Artola, A.; Font, X.; Davoli, E.; Sanchez, A.; Adani, F. Odours and volatile organic compounds emitted from municipal solid waste at different stage of decomposition and relationship with biological stability. Bioresour. Technol. 2011, 102, 4638–4645. [Google Scholar] [CrossRef]
  8. Rinco, C.A.; De Guardia, A.; Couvert, A.; Wolbert, D.; Le Roux, S.; Soutrel, I.; Nunes, G. Odor concentration (OC) prediction based on odor activity values (OAVs) during composting of solid wastes and digestates. Atmos. Environ. 2019, 201, 1–12. [Google Scholar] [CrossRef]
  9. Wu, H.; Yan, H.; Quan, Y.; Zhao, H.; Jiang, N.; Yin, C. Recent progress and perspectives in biotrickling fflters for VOCs and odorous gases treatment. J. Environ. Manag. 2018, 222, 409–419. [Google Scholar] [CrossRef]
  10. Jafari, M.J.; Matin, A.H.; Rahmati, A.; Azari, M.R.; Omidi, L.; HosSIEni, S.S.; Panahi, D. Experimental optimization of a spray tower for ammonia removal. Atmos. Pollut. Res. 2018, 9, 783–790. [Google Scholar] [CrossRef]
  11. Park, C.W.; Byeon, J.H.; Yoon, K.Y.; Park, J.H.; Hwang, J. Simultaneous removal of odors, airborne particles, and bioaerosols in a municipal composting facility by dielectric barrier discharge. Sep. Purif. Technol. 2011, 77, 87–93. [Google Scholar] [CrossRef]
  12. Zheng, Z.; Zhang, X.; Li, K.; Pi, H.; Du, B.; Li, C.; Shi, X.; Hu, Y.; Jin, Y.; Zhu, Z.; et al. Simultaneous treatment of various malodorous substances in gas by non-thermal plasma. IEEE Trans. Plasma Sci. 2023, 51, 414–420. [Google Scholar] [CrossRef]
  13. Kim, H.; Abdelaziz, A.A.; Teramoto, Y.; Nozaki, T.; Hensel, K.; Mok, Y.; Saud, S.; Nguyen, D.B.; Lee, D.H.; Kang, W.S. Interim report of plasma catalysis: Footprints in the past and blueprints for the future. Int. J. Plasma Environ. Sci. Technol. 2021, 15, e01004. [Google Scholar]
  14. Shi, Y.; Ruan, J.; Wang, X.; Li, W.; Tan, T. Decomposition of mixed malodorants in a wire-plate pulse corona reactor. Environ. Sci. Technol. 2005, 39, 6786–6791. [Google Scholar] [CrossRef]
  15. Wei, X.; Zhu, T.; Jin, X.; Xu, H. Degradation of mixed typical odour gases via non-thermal plasma catalysis. J. Hazard. Mater. 2022, 440, 129751. [Google Scholar] [CrossRef]
  16. Mustafa, M.F.; Fu, X.; Liu, Y.; Abbas, Y.; Wang, H.; Lu, W. Volatile organic compounds (VOCs) removal in non-thermal plasma double dielectric barrier discharge reactor. J. Hazard. Mater. 2018, 347, 317–324. [Google Scholar] [CrossRef]
  17. Jiang, S.; Guo, K.; Wang, Y.; Li, Z.; Rao, J. Research on discharge characteristics of three-electrode load under the pulsed power supply. IEEE Trans. Plasma Sci. 2022, 50, 1255–1261. [Google Scholar] [CrossRef]
  18. Wang, X.; Yang, Q.; Yao, C.; Zhang, X.; Sun, C. Dielectric barrier discharge characteristics of multineedle-to-cylinder conffguration. Energies 2011, 4, 2133–2150. [Google Scholar] [CrossRef]
  19. Böddecker, A.; Passmann, M.; Segura, A.N.T.; Bodnar, A.; Awakowicz, F.; Oppotsch, T.; Muhler, M.; Awakowicz, P.; Gibson, A.R.; Korolov, I.; et al. The role of flow field dynamics in enhancing volatile organic compound conversion in a surface dielectric barrier discharge system. J. Phys. D Appl. Phys. 2024, 58, 025208. [Google Scholar] [CrossRef]
  20. Zeng, X.; Li, B.; Liu, R.; Li, X.; Zhu, T. Investigation of promotion effect of Cu doped MnO2 catalysts on ketone-type VOCs degradation in a one-stage plasma-catalysis system. Chem. Eng. J. 2020, 384, 123362. [Google Scholar] [CrossRef]
  21. Inomata, Y.; Matsunaga, K.; Murai, Y.; Osada, K.; Iwasaka, Y. Simultaneous measurement of volatile sulfur compounds using ascorbic acid for oxidant removal and gas chromatography–ffame photometric detection. J. Chromatogr. A 1999, 864, 111–119. [Google Scholar] [CrossRef] [PubMed]
  22. Wi, M.; Kulig, A.; Lelicin, K. The impact of technological processes on odorant emissions at municipal waste biogas plants. Sustainability 2020, 12, 5457. [Google Scholar] [CrossRef]
  23. Masey, N.; Gillespie, J.; Ezani, E.; Lin, C.; Wu, H.; Ferguson, N.S.; Hamilton, S.; Heal, M.R.; Beverland, I.J. Temporal changes in ffeld calibration relationships for Aeroqual S500 O3 and NO2 sensor-based monitors. Sens. Actuators B Chem. 2018, 273, 1800–1806. [Google Scholar] [CrossRef]
  24. Deng, Z.; Qiu, Q.; Jia, H.; Zhu, W.; Deng, Y.; He, X. Load Characteristic Analysis of Dielectric Barrier Discharge With Multineedle to Coaxial Cylindrical Configuration. IEEE Trans. Plasma Sci. 2025, 53, 661–668. [Google Scholar] [CrossRef]
  25. Durme, V.J.; Dewulf, J.; Leys, H. Combining non-thermal plasma with heterogeneous catalysis in waste gas treatment: A review. Appl. Catal. B Environ. 2008, 78, 324–333. [Google Scholar] [CrossRef]
  26. Li, X.; Wang, Z.; Chu, B.; Ma, J.; He, H. Challenges and opportunities of catalytic decomposition of ozone at room temperature. Fundam. Res. 2025; in press. [Google Scholar] [CrossRef]
  27. Poullikkas, A. Review of design, operating, and financial considerations in flue gas desulfurization systems. Energy Technol. Policy 2015, 2, 92–103. [Google Scholar] [CrossRef]
  28. Shan, Y.; Du, J.; Zhang, Y.; Shan, W.; Shi, X.; Yu, Y.; Zhang, R.; Meng, X.; Xiao, F.-S.; He, H. Selective catalytic reduction of NOx with NH3: Opportunities and challenges of Cu-based small-pore zeolites. Natl. Sci. Rev. 2021, 8, nwab010. [Google Scholar] [CrossRef]
  29. Manley, T.C. The electric characteristics of the ozonator discharge. Trans. Electrochem. Soc. 1943, 84, 83–96. [Google Scholar] [CrossRef]
  30. Liang, W.; Ma, L.; Li, J.; Li, J.; Zheng, F. Control of hydrogen sulfide by a wire-tube dielectric barrier discharge AC plasma reactor. Clean.-Soil Air Water 2012, 40, 586–591. [Google Scholar] [CrossRef]
  31. Yang, G.W.; Chun, S.M.; Kim, K.I.; Lee, H.J.; Hong, Y. Simulated experiments for removal of odorous gases by wire-mesh electrode dielectric barrier discharge. Phys. Plasmas 2022, 29, 093502. [Google Scholar] [CrossRef]
  32. Xia, L.; Huang, L.; Shu, X.; Zhang, R.; Dong, W.; Hou, H. Removal of ammonia from gas streams with dielectric barrier discharge plasmas. J. Hazard. Mater. 2008, 152, 113–119. [Google Scholar] [CrossRef] [PubMed]
  33. Lu, S.; Chen, L.; Huang, Q.; Yang, L.; Du, C.; Li, X.; Yan, J. Decomposition of ammonia and hydrogen sulfide in simulated sludge drying waste gas by a novel non-thermal plasma. Chemosphere 2014, 117, 781–785. [Google Scholar] [CrossRef]
  34. Belkessa, N.; Assadi, A.A.; Tri, P.N.; Bouzaza, A. Non-thermal plasma/photocatalysis processes for dimethyl disulfide removal: Study and reduction of the catalyst poisoning. Catal. Today 2025, 458, 115380. [Google Scholar] [CrossRef]
  35. Atkinson, R.; Baulch, D.L.; Cox, R.A.; Crowley, J.N.; Hampson, R.F.; Hynes, R.G.; Jenkin, M.E.; Rossi, M.J.; Troe, J. Evaluated Kinetic and Photochemical Data for Atmospheric Chemistry: Volume II—Gas Phase Reactions of Organic Species. Atmos. Chem. Phys. 2006, 6, 3625–4055. [Google Scholar] [CrossRef]
  36. Manion, J.A.; Huie, R.E.; Levin, R.D.; Burgess, D.R., Jr.; Orkin, V.L.; Tsang, W.; McGivern, W.S.; Hudgens, J.W.; Knyazev, V.D.; Drake, R.B.; et al. NIST Chemical Kinetics Database, NIST Standard Reference Database 17, Version 7.1 (Web Version), Release 1.6.8, Data Version 2026; National Institute of Standards and Technology: Gaithersburg, MD, USA, 2026. Available online: https://kinetics.nist.gov/ (accessed on 18 January 2026).
  37. Chen, J.; Xie, Z. Removal of H2S in a novel dielectric barrier discharge reactor with photocatalytic electrode and activated carbon fiber. J. Hazard. Mater. 2013, 261, 38–43. [Google Scholar] [CrossRef]
  38. Huang, C.-L.; Liao, T.-Y.; He, Y.-T.; Lin, G.-J.; Lai, W.-H.; Chen, Y.-C.; Lin, K.-M. Characterization of OH species in kHz air/H2O atmospheric pressure dielectric barrier discharges. Plasma Sources Sci. Technol. 2024, 33, 065005. [Google Scholar] [CrossRef]
  39. Verreycken, T.; Bruggeman, P.J. OH density measurements in nanosecond pulsed discharges in atmospheric pressure N2-H2O mixtures. Plasma Sources Sci. Technol. 2014, 23, 015009. [Google Scholar] [CrossRef]
  40. Ouaras, K.; Magne, L.; Pasquiers, S.; Jeanney, P.; Bourgeois, N. OH density measured by PLIF in a nanosecond atmospheric pressure diffuse discharge in humid air under steep high voltage pulses. Plasma Sources Sci. Technol. 2018, 27, 045002. [Google Scholar] [CrossRef]
  41. Li, L.; Nikiforov, A.; Xiong, Q.; Britun, N.; Snyders, R.; Leys, C.; Lu, X. OH radical production in an atmospheric pressure surface micro-discharge array. J. Phys. D Appl. Phys. 2016, 49, 455202. [Google Scholar] [CrossRef]
  42. Tsai, C.; Lee, W.; Chen, C.; Liao, W. Decomposition of CH3SH in a RF plasma reactor: Reaction products and mechanisms. Ind. Eng. Chem. Res. 2001, 40, 2384–2395. [Google Scholar] [CrossRef]
Figure 1. (a) Schematic diagram of the experimental setup, (b) DR-MC Ground electrode, (c) Cross-sectional view of the needle electrode configuration, illustrating the radial arrangement of the needle sets and the discharge gap.
Energies 19 01075 g001
Figure 2. Discharge characteristics of the DR-MCDBD reactor at an applied voltage of 8.0 kV. (a) Electrical waveforms of the applied voltage and current(blue: voltage of reactor, red: current, yellow: voltage of grounding capacitor), (b) Macroscopic discharge image showing filamentary glow.
Energies 19 01075 g002
Figure 3. Average discharge power characteristics of the DR-MCDBD reactor. (a) Influence of applied voltage and the number of needle electrode sets on average discharge power (1 m3/h), (b) Combined effect of gas flow rate and applied voltage on power consumption (8-needle set configuration).
Energies 19 01075 g003
Figure 4. Decomposition characteristics of ammonia and various sulfides in the 6-needle DR-MCDBD reactor under different gas flow rates: (a) 1.0 m3/h; (b) 1.5 m3/h; and (c) 2.0 m3/h.
Energies 19 01075 g004
Figure 5. Decomposition characteristics of ammonia and various sulfides in the 8-needle DR-MCDBD reactor under different gas flow rates: (a) 1.0 m3/h; (b) 1.5 m3/h; and (c) 2.0 m3/h.
Energies 19 01075 g005
Figure 6. Comparison of pollutant removal efficiencies among different electrode configurations (6, 8, and 10 needle sets) under typical operating conditions (gas flow rate: 2.0 m3/h; applied voltage: 8.5 kV).
Energies 19 01075 g006
Figure 7. Energy efficiency of five typical odorous gases (NH3 and sulfides) as a function of applied voltage under the 8-group needle configuration. (a) 1.0 m3/h; (b) 1.5 m3/h; and (c) 2.0 m3/h.
Energies 19 01075 g007
Figure 8. CFD simulation of gas velocity vector distributions at 2 m3/h: (a) Without DR, showing bypass flow; (b) With DR, highlighting flow convergence and downstream recirculation vortices.
Energies 19 01075 g008
Figure 9. Comparison of removal efficiencies with and without the Deflector Ring (DR) under a 6-needle electrode configuration at a flow rate of 1.5 m3/h: (a) Inorganic sulfides; (b) Organic sulfides.
Energies 19 01075 g009
Figure 10. Effect of applied voltage on by-product generation in the 8-needle reactor at 2 m3/h.
Energies 19 01075 g010
Figure 11. Schematic of the synergistic degradation mechanism in the DR-MCDBD reactor. (Top) Conceptual flow regimes: kinetic-controlled (left) and mass transfer-reaction co-controlled (right, enabled by the deflector ring). (Bottom) Proposed reaction pathways for organic sulfides (left) and inorganic sulfides (right).
Energies 19 01075 g011
Disclaimer/Publisher’s Note: The statements, opinions and data contained in all publications are solely those of the individual author(s) and contributor(s) and not of MDPI and/or the editor(s). MDPI and/or the editor(s) disclaim responsibility for any injury to people or property resulting from any ideas, methods, instructions or products referred to in the content.