1. Introduction
Buildings remain central to both energy decarbonization and climate adaptation. The global buildings and construction sector consumes approximately 32% of energy and contributes 34% of energy- and process-related carbon dioxide emissions [
1]. Within buildings, space heating, cooling, and water heating are persistent thermal demands whose magnitude and timing vary by climate, building type, occupancy, and service expectations. Their decarbonization therefore requires not only efficient equipment but also low-carbon heat sources that can be integrated with thermal storage, auxiliary systems, and variable building loads.
Solar thermal technologies offer a direct route from incident radiation to useful heat. Conventional flat plate and evacuated tube collectors dominate low-temperature building applications, whereas optical concentration can raise the achievable temperature and reduce absorber area relative to aperture area. These characteristics may be valuable when a building service requires higher-grade heat, as in absorption or adsorption cooling, or when a compact collector field must be coupled to storage and backup equipment. Concentration is not a universal substitute for non-concentrating collectors: its suitability depends on direct normal irradiance, optical alignment or tracking, thermal losses, available area, load matching, controls, maintenance, and the required delivery temperature. A recent European technology status assessment similarly emphasizes that solar heating and cooling has low market penetration and usually functions as an integrated rather than a stand-alone solution [
2].
The building-scale CST literature spans several optical configurations. Compound parabolic concentrators (CPCs) and related non-imaging devices can operate with stationary or low-tracking arrangements; parabolic trough collectors (PTCs) and linear Fresnel reflectors (LFRs) provide line-focus heat; and dish or Scheffler-type systems provide point-focus heat at higher concentration ratios. These collectors are coupled to markedly different services, including domestic hot water preparation, space or radiant heating, desiccant regeneration, and single- or multi-effect thermally driven chillers. The resulting evidence is technically heterogeneous: studies report collector efficiency, coefficient of performance, solar fraction, useful heat, cooling or heating capacity, primary energy savings, cost, emissions, or combinations of these outcomes under different boundary conditions. Given this heterogeneity, evidence mapping provides an appropriate approach for structuring broad bodies of evidence and identifying distributions and gaps [
3].
Existing reviews provide important but only partially overlapping perspectives. A broad synthesis addresses solar collectors and thermal storage across solar thermal applications [
4], while focused reviews examine building-integrated concentrating systems [
5], compound parabolic collector design [
6], concentrating collectors in absorption and adsorption cooling [
7], and cooling systems coupled to parabolic dishes or linear Fresnel reflectors [
8]. More recent reviews move closer to deployment questions: Herez et al. compare thermal- and PV-driven solar cooling in terms of maturity and deployment challenges [
9], while Rinchi et al. systematically review off-grid solar cooling and heating across thermal and photovoltaic pathways [
10]. These studies broaden the deployment discussion, but they remain cooling-focused or cross-technology in scope and do not consolidate companion CST reports into unique study families or map family-level validation proximity across heating, cooling, dehumidification, and domestic hot water using a common framework.
Four related evidence gaps remain after this recent literature review. First, no CST-only cross-service map consistently compares heating, cooling, dehumidification, and domestic hot water at the level of unique study families. Second, companion publications from the same prototype or building model can inflate apparent evidence volume when reports are counted as independent systems. Third, deployment maturity is often discussed narratively or at the technology-class level rather than assigned to unique study families using explicit, reproducible evidence rules. Fourth, source-reported service-relevant temperature is rarely interpreted together with building service and deployment validation. These omissions limit the ability to distinguish technical variety from evidence that is directly informative for building deployment.
This distinction matters because technical performance and validation maturity are not interchangeable. A detailed simulation can reveal sensitivities and optimize design, yet it does not by itself demonstrate installation feasibility, control stability, seasonal performance, maintenance requirements, or service delivery under building operation. Conversely, a small integrated demonstration may be more deployment-proximate while remaining context-specific. The analytical framework therefore follows a progression from model-only evidence, through validated models and controlled prototypes, to integrated real-weather demonstrations and routine building operation, without treating those stages as a conventional quality rank.
The review is restricted to original quantitative journal articles in which optical concentration supplies thermal energy to an explicit building service. Utility-scale electricity generation, industrial process heat, district energy, concentrating photovoltaic and photovoltaic thermal systems, and collector-only studies without a defined building service link are outside the analytical scope. This boundary preserves comparability among systems whose primary outcome is heating, cooling, dehumidification, or domestic hot water delivery at building scale.
Table 1 summarizes this boundary relative to representative prior reviews.
Aim and Research Questions
The study addresses these gaps through four contributions: (i) consolidation of 160 eligible reports into 145 unique study families to prevent repeated evidence from inflating the synthesis; (ii) separate coding of deployment-proximate validation maturity and reporting transparency; (iii) a two-layer ATVM that first maps the provenance and availability of source-reported service-relevant temperatures and then applies a stricter service driving/service delivery comparability rule; and (iv) identification of service-specific pathways from modeling and prototypes toward building operation. Its aim is to determine where building-scale CST knowledge is supported by deployment-relevant evidence and where it remains dependent on analytical or simulation-based claims. Four research questions guide the review;
Table 2 provides an explicit crosswalk from each question to its methodological basis, primary results, and subsequent interpretation and conclusion.
2. Materials and Methods
2.1. Review Design and Protocol
This study used a systematic evidence map design with descriptive, cross-classified synthesis. Systematic evidence maps are suited to structuring broad, heterogeneous bodies of evidence and identifying distributions and gaps rather than estimating a pooled intervention effect [
3]. The study selection flow used PRISMA 2020 conventions [
11], and database search reporting was informed by PRISMA-S [
12]. Selected mapping-oriented reporting elements were additionally informed by PRISMA-ScR [
13]; this use of PRISMA-ScR was limited to reporting guidance and does not define the review design as a scoping review. Throughout this manuscript, the methodological design is therefore termed a systematic evidence map. Eligibility boundaries, study family linkage rules, the core VM level definitions, and RT indicators were finalized before full-text synthesis and applied across the corpus. Temperature candidates were charted using the explicit-value rule and, before ATVM synthesis, assessed using the source-level comparability procedure described in
Section 2.5. No review protocol was prospectively registered. The VM4/VM5 distinction between research demonstration and routine building operation was operationalized through four source-level decision checks described below.
The unit of inclusion was an eligible journal report, whereas the unit of synthesis was a unique study family. Reports were linked only when they described the same physical prototype or the same building model case and shared overlapping data, configuration, or results. Author or topic similarity alone was insufficient. Eleven multi-report families were identified. For linked reports, the family-level VM represented the highest maturity directly demonstrated by any companion report; this did not imply that every outcome in that family had been validated at that level. The robustness of this best evidence aggregation rule was examined through two alternative family-level VM assignments described in
Section 2.8. Family-level reporting transparency values represented the best documentation available across linked reports. Every included report is individually citation-addressable in the main references list [
14,
15,
16,
17,
18,
19,
20,
21,
22,
23,
24,
25,
26,
27,
28,
29,
30,
31,
32,
33,
34,
35,
36,
37,
38,
39,
40,
41,
42,
43,
44,
45,
46,
47,
48,
49,
50,
51,
52,
53,
54,
55,
56,
57,
58,
59,
60,
61,
62,
63,
64,
65,
66,
67,
68,
69,
70,
71,
72,
73,
74,
75,
76,
77,
78,
79,
80,
81,
82,
83,
84,
85,
86,
87,
88,
89,
90,
91,
92,
93,
94,
95,
96,
97,
98,
99,
100,
101,
102,
103,
104,
105,
106,
107,
108,
109,
110,
111,
112,
113,
114,
115,
116,
117,
118,
119,
120,
121,
122,
123,
124,
125,
126,
127,
128,
129,
130,
131,
132,
133,
134,
135,
136,
137,
138,
139,
140,
141,
142,
143,
144,
145,
146,
147,
148,
149,
150,
151,
152,
153,
154,
155,
156,
157,
158,
159,
160,
161,
162,
163,
164,
165,
166,
167,
168,
169,
170,
171,
172,
173], and
Supplementary File S1 cross-maps those reference numbers to report identifiers and study family membership.
2.2. Information Sources and Search Strategy
Scopus and Web of Science Core Collection were last searched on 3 September 2026 to provide multidisciplinary coverage of energy engineering, building science, architecture, and thermal systems while retaining reproducible bibliographic records. No lower date limit was imposed. Results were limited to English-language journal articles reporting original quantitative evidence. Scopus returned 476 records, and Web of Science returned 455 records. The complete database-specific search expressions, field restrictions, and applied limits are reproduced in
Table 3 exactly as executed;
Appendix A retains the same search strings as a verbatim audit copy.
The search strategy was constructed as the intersection of two Boolean concept blocks: (i) optical concentrating solar thermal technologies and collector configurations and (ii) explicit building thermal services. Synonymous terms within each block were combined with OR, and the two blocks were connected with AND. The same conceptual vocabulary was used in both databases, with database-specific field syntax: TITLE-ABS-KEY in Scopus and Topic (TS) in Web of Science Core Collection. The service block covered domestic hot water, space or building heating, radiant or underfloor heating, solar or building cooling, thermally driven cooling, absorption and adsorption systems, desiccant air conditioning, and building–HVAC combinations. No lower publication date limit was imposed. The database-specific language, source/document-type limits, exact search expressions, and numbers of exported records are reported in
Table 3. Collector-only and adjacent non-building applications were evaluated against the full eligibility criteria rather than removed through additional undocumented search restrictions.
2.3. Eligibility Criteria and Scope Boundary
Eligibility was determined by publication characteristics, energy conversion pathway, application context, and evidence content. A study was required to include optical concentration that supplied useful thermal energy to an identifiable building service. A conventional flat plate or evacuated tube collector could serve as a comparator, but the intervention under analysis had to include a concentrating solar thermal collector. For hybrid or multi-product systems, inclusion required the CST thermal pathway to an eligible building service to be separately identifiable from co-produced electricity, fuel, or other energy products. Co-produced electricity or another non-thermal product did not itself establish eligibility and was not used as evidence of building service delivery. Systems were excluded when electricity generation was the central output or when the CST thermal contribution to an eligible building service could not be isolated.
Three additional boundary rules were applied. First, CPC and other non-imaging configurations were treated as concentrating technologies when the source explicitly identified an optical concentrating collector supplying the eligible thermal pathway; no numerical concentration ratio threshold was prespecified or applied. Second, “building scale” was defined by the analytical service/load boundary rather than by collector capacity, site ownership, or the mere presence of buildings within a larger energy system. A multi-building or community configuration was eligible only when a building-specific CST-to-service thermal pathway was separately reported and attributable; district, campus, or community systems reported only at the aggregate network scale were excluded. Third, a solar chimney configuration was eligible only when an explicit optical reflector or concentrator increased incident solar input and that concentrated input was linked to an otherwise eligible quantitative building service pathway. Ordinary passive solar chimneys or stack ventilation studies without optical concentration were outside the review scope. The inclusion and exclusion criteria are summarized in
Table 4.
2.4. Record Management and Study Selection
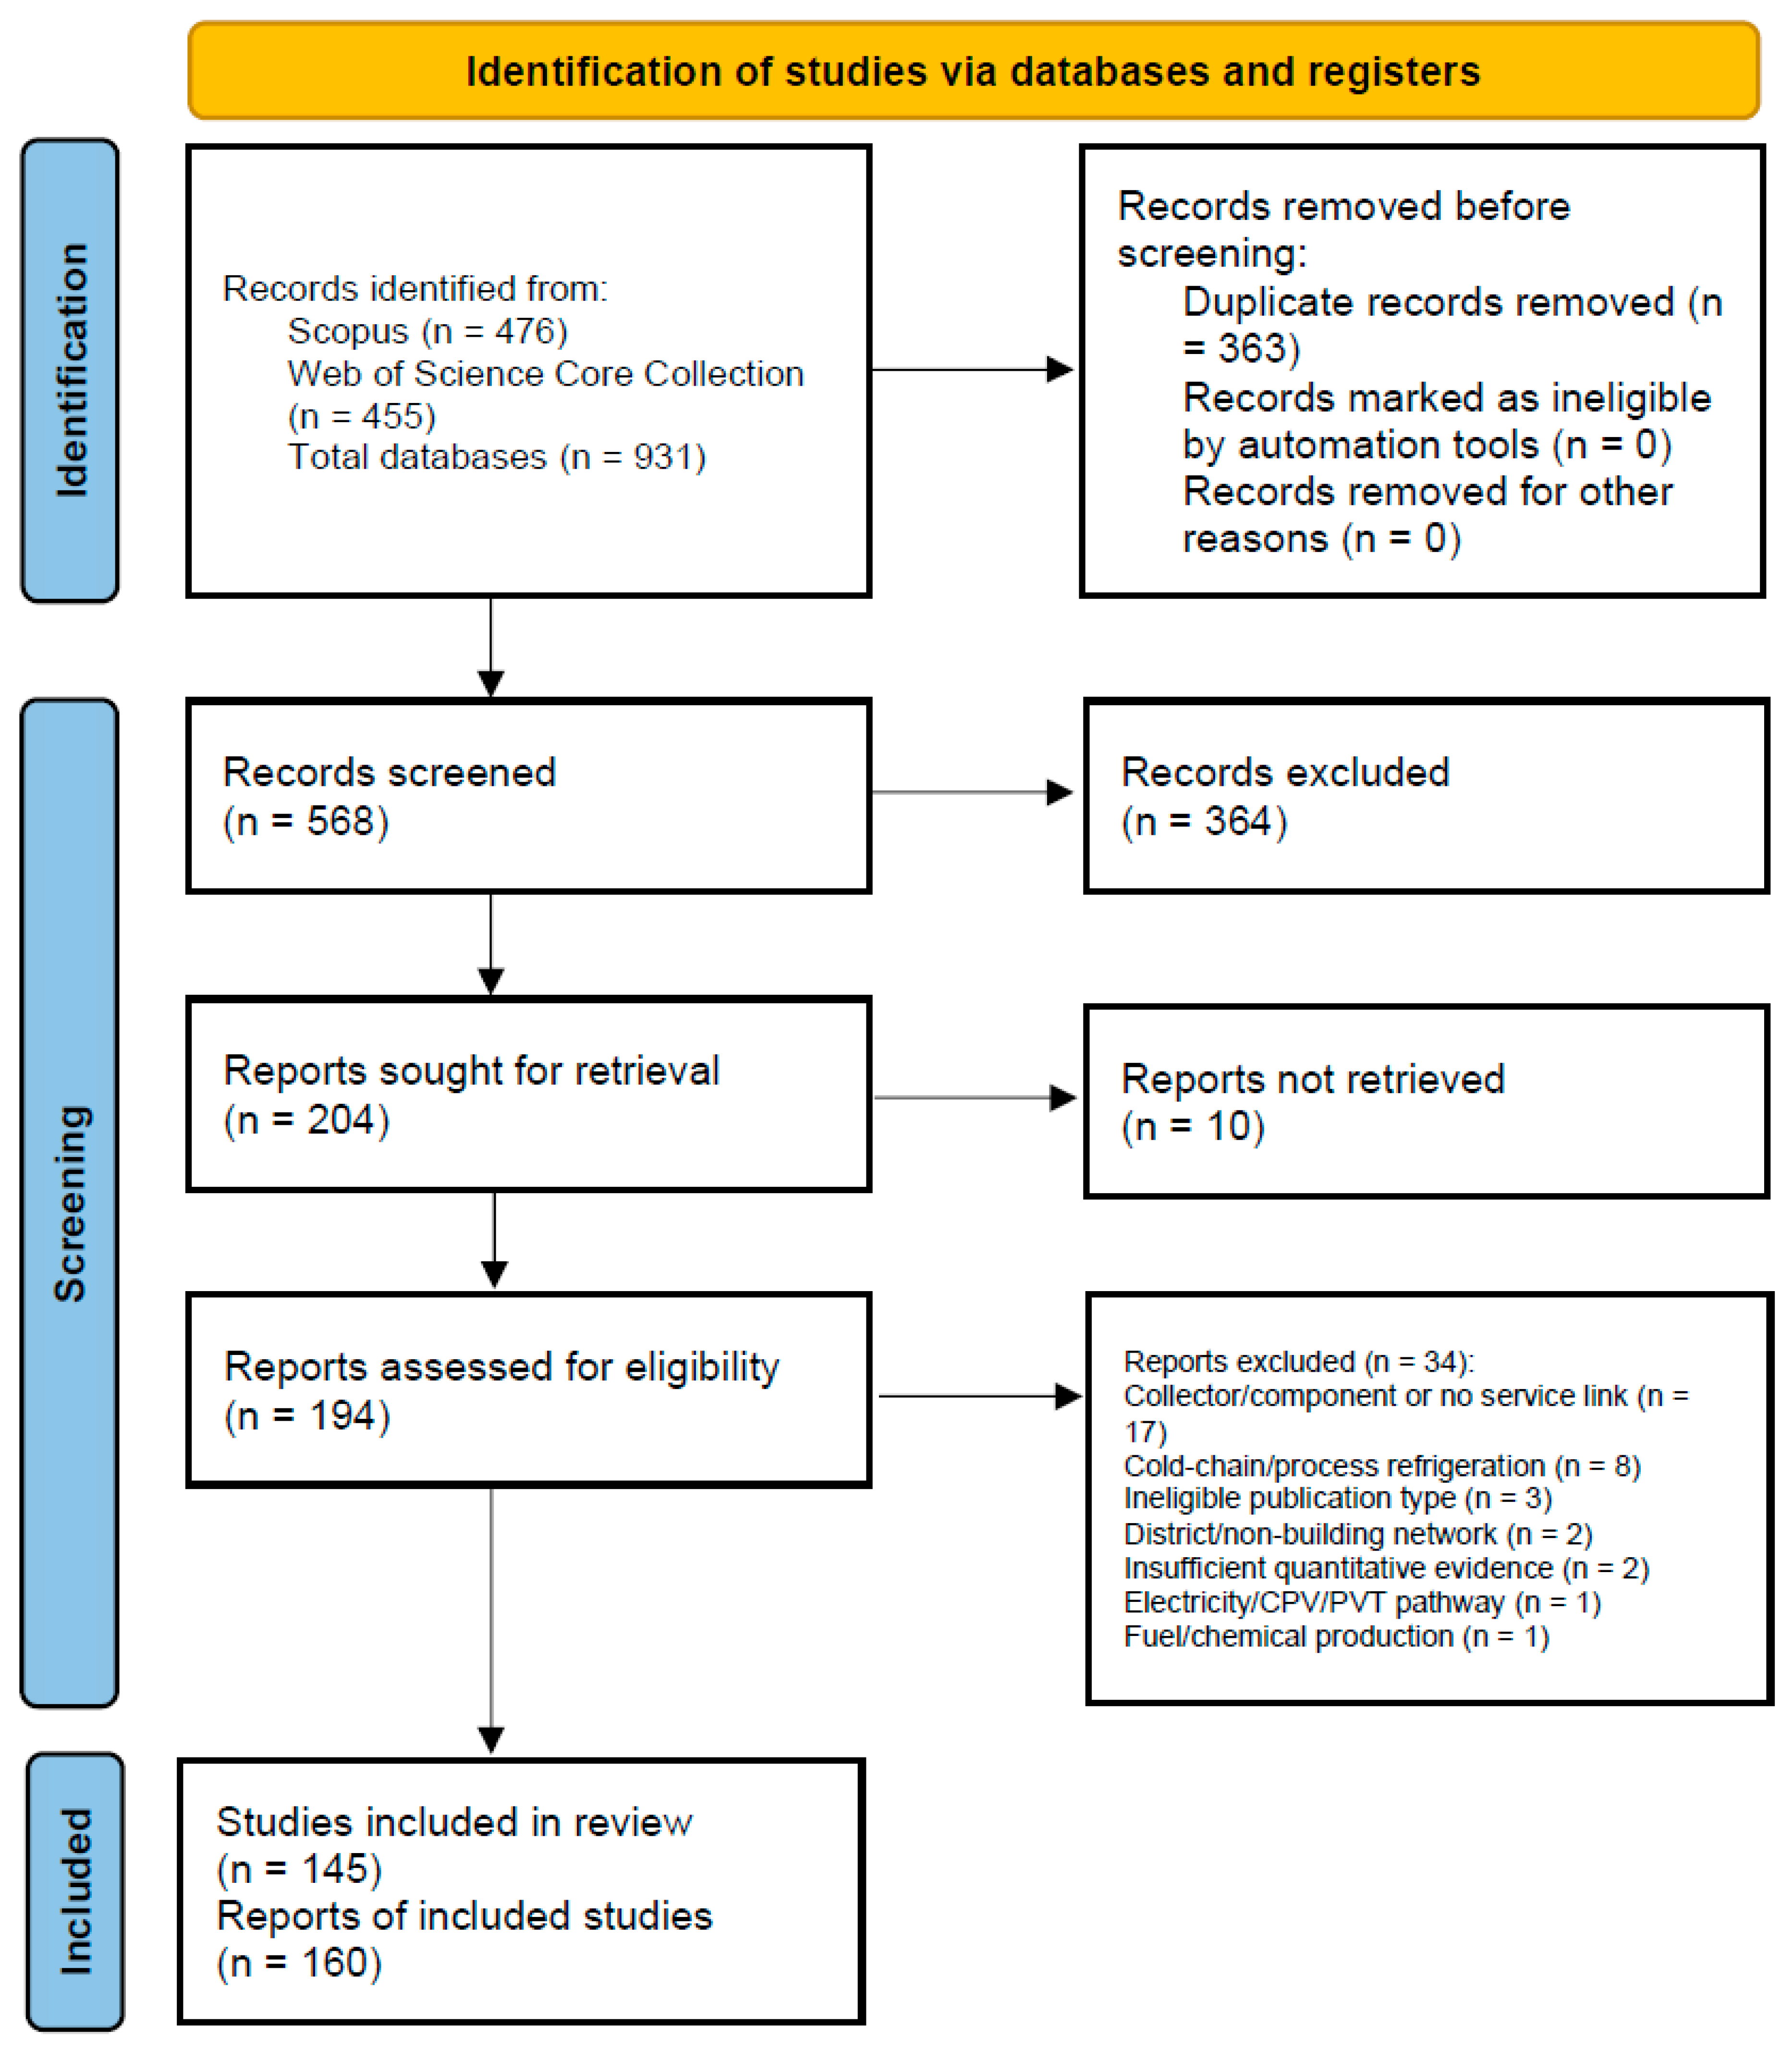
Records from both databases were merged in a structured workbook. Record management, data coding, and descriptive tabulations were conducted using Microsoft Excel (Microsoft Corporation, Redmond, WA, USA). DOI strings were normalized to lowercase canonical form and stripped of URL prefixes and terminal punctuation. Titles were normalized for case, punctuation, spacing, and common typographic variants. Deduplication used exact DOI matching first, followed by normalized title matching and bibliographic inspection where identifiers were incomplete. The 931 database records were reduced to 568 unique records; the deduplication log was retained separately from eligibility decisions.
Study selection proceeded in two stages. Title and abstract screening removed records that clearly failed the publication, energy pathway, context, building service, system linkage, or quantitative evidence criteria. Records with incomplete abstracts or unresolved service linkage were retained for full-text assessment. Full-text decisions were recorded as Include or Exclude with one principal reason. Reports that could not be obtained were logged as not retrieved and were not converted into scientific exclusions. Initial publication type verification was performed before the retrieval set was established, at which stage one conference paper was excluded under the predefined publication type criterion; additional publication type ineligibility identified during full-text assessment was recorded among the full-text exclusion reasons.
Title and abstract screening was performed independently by two reviewers for all 568 unique records. Each reviewer assigned Include, Exclude, or Unclear without access to the other reviewer’s decision. Before adjudication, the reviewers agreed on 535 of 568 records (94.2%; Cohen’s κ = 0.85); the 33 disagreements were adjudicated by a third reviewer before the screening set was established. Records retained or unresolved at this stage proceeded to retrieval. Publication type verification was treated as a bibliographic classification step; the reported pre-adjudication agreement statistic is based on the independent screening decisions recorded before adjudication.
Full-text eligibility assessment was completed independently by two reviewers for all 194 reports retrieved before synthesis closure. Each reviewer recorded an Include or Exclude decision and, for excluded reports, one principal exclusion reason without access to the other reviewer’s assessment. Before adjudication, the reviewers agreed on 185 of 194 eligibility decisions (95.4%); the nine disagreements were adjudicated by a third reviewer before the final eligibility set was established. Final record-level decisions remained traceable through standardized reasons, rationales, evidence locators, family linkage notes, and the supplementary coding matrix.
2.5. Data Extraction and Coding
Extraction was limited to fields required by the four research questions. Exact values were retained when they were explicit; categorical harmonization was used only to compare otherwise heterogeneous studies. The fields covered bibliographic context, building/service linkage, concentrator type, location or climate, storage, auxiliary or hybrid equipment, study method, VM, five reporting transparency indicators, and key quantitative evidence. Candidate temperature values were retained only when explicitly reported and linked to the eligible building service thermal pathway. Before ATVM synthesis, candidate values were checked at the source level for physical locus and value type. The broad ATVM retained explicit service-relevant useful fluid, service side storage, collector/receiver outlet, regeneration, generator, or heat source temperatures, while collector inlet test conditions, auxiliary control settings, stagnation-only values, and values lacking unambiguous service linkage were coded NR. Physical locus and value type were recorded separately so that representative/design operating points and setpoints could be distinguished from maxima, range endpoints, and thresholds. Ambient, room, chilled water, condenser, and error/deviation values were not used for the ATVM. The broad layer is therefore a source provenance/availability map, not a cross-study comparison of thermodynamically equivalent temperature states.
For descriptive synthesis, source-coded building contexts were harmonized at study family level into six broad categories: residential/domestic; office/commercial/workplace; institutional/education/healthcare; hospitality/recreation/public service; mixed/multiple building types; and generic/unspecified or test-only context. Climate grouping was deliberately conservative: only source-explicit broad descriptors were assigned to hot arid/arid/semi arid, tropical/hot humid/subtropical, Mediterranean, cold/cold winter/high altitude, or temperate/mixed season categories; families reporting multiple distinct climates were retained as multiple/contrasting cases, and no climate zone was inferred from geographic location alone. For VM3–VM4 families, the longest source-explicit direct empirical test or monitoring span was grouped as ≤1 day, 2–7 days, 8–30 days, >30 days/seasonal, or not explicit; simulation horizons were not substituted for empirical monitoring duration.
Bibliographic and basic descriptive fields were charted by a primary extractor. For all 160 included reports, a second reviewer independently assessed the synthesis-critical fields, including building service, concentrator family, study family status, validation maturity (VM), RT1-RT5, temperature candidate status, physical locus, and value type. The primary assignments for these synthesis-critical fields were withheld during the second assessment, and paired classifications were compared against the predefined coding rules and source evidence before the report-level dataset was finalized for synthesis. All 11 multi-report study families were independently assessed using the predefined linkage rules and candidate report groups, with the final family assignment withheld during the second assessment; the two linkage assessments were compared before the family structure was finalized. The two independent linkage assessments agreed for all 11 candidate multi-report groups (11/11; 100.0% exact agreement). The study-level extraction framework is summarized in
Table 5.
2.6. Validation Maturity Classification
Validation maturity described the most deployment-proximate evidence directly supporting the building service claim in each study family. It was not treated as a methodological quality score, certainty-of-evidence grade, technology readiness level, or commercial readiness level. Its narrower purpose is evidentiary: to classify how directly the reported evidence supports integrated CST delivery of a building service. For multi-report families, the highest directly demonstrated level was assigned while the supporting report and rationale remained traceable. Presence in an actual building is necessary but not sufficient for VM5. The source must explicitly establish four conditions: (1) an actual, normally used building rather than a test cell or dedicated test facility; (2) service to the building’s usual load or users; (3) monitoring of the integrated CST-to-service pathway rather than only a component or model validation point; and (4) operation as part of normal building service rather than only a dedicated research test, demonstration campaign, or commissioning-style experiment. If normal operation status or usual load/user status is not source-explicit, the family remains VM4. Monitoring duration is coded separately and is not itself a VM4/VM5 threshold.
VM was independently coded for all 145 study families by a second reviewer without access to the primary VM assignment. Before disagreement resolution, the independent classifications agreed for 138 of 145 study families (95.2% exact agreement). Disagreements were resolved by comparison with the predefined VM rubric and supporting source evidence before the final family-level VM profile was retained. For the nine families classified as VM4, the explicit VM4/VM5 decision criteria were applied at the source level; each lacked or did not explicitly document at least one VM5 condition and was therefore classified as VM4. The five-level VM rubric is summarized in
Table 6.
2.7. Reporting Transparency Indicators
Five reporting transparency indicators captured whether information needed to interpret each study was explicit. Because engineering studies vary in design, the indicators allowed Yes, Partial, or No rather than forcing a binary score. They were reported separately and were not summed into an evidence strength index. For study families, companion reports could complete documentation, but the aggregation rule did not upgrade the VM unless a higher level of direct service evidence was demonstrated.
RT1–RT5 were independently coded for all 145 study families by a second reviewer without access to the primary RT assignments. Before disagreement resolution, exact agreement was 144/145 (99.3%) for RT1, 139/145 (95.9%) for RT2, 145/145 (100.0%) for RT3, 133/145 (91.7%) for RT4, and 141/145 (97.2%) for RT5. Disagreements were resolved against the predefined indicator definitions and source evidence before the final family-level reporting transparency indicators were retained. The reporting transparency indicators are defined in
Table 7.
2.8. Synthesis and Development of the ATVM
The synthesis combined frequencies, percentages, cross-tabulations, and structured narrative interpretation. Publication year was assigned to the first eligible report in each study family. Technology-specific classification was based on the source-reported optical concentrating geometry at the study family level. Single-technology families were assigned to mutually exclusive categories comprising PTC, CPC/non-imaging, LFR, dish/paraboloid, Scheffler, heliostat field/central receiver, or unspecified optical concentrator. Families explicitly comparing more than one eligible CST geometry were retained as mixed technology categories—PTC + CPC/non-imaging, PTC + LFR, CPC/non-imaging + LFR, or CPC/non-imaging + Fresnel lens—rather than being assigned to one component technology. Tracking arrangement, heat transfer fluid, storage, and downstream chiller or terminal equipment were retained as separate system descriptors and did not override the primary optical technology classification. Service categories remained mutually exclusive at the study family level. Countries were counted from explicit study location statements at the study family level, with multi-country studies contributing once to each applicable country. Country frequencies were therefore treated as multi-response rather than mutually exclusive counts. For geographical comparison, country distributions were cross-tabulated with validation maturity and building service category, with particular attention to the most frequently represented countries. No country was inferred from a city name alone, and broad climate categories were assigned only when a source-explicit climate descriptor was available, as described in
Section 2.5. Storage was classified as represented, absent, or insufficiently specified. VM and reporting indicators were cross-tabulated by service and concentrator family. Full-corpus VM distributions by service and concentrator family were used to characterize integrated real-weather evidence independently of temperature availability. The ATVM was treated as a conditional subset analysis: failure to contribute a retained temperature was not interpreted as the absence of the corresponding service, concentrator, or validation maturity combination from the full corpus.
To provide a compact quantitative summary across evidence dimensions, cross-cutting indicators were calculated as simple proportions with explicit denominators. The indicator set comprised companion report redundancy among included reports; the proportions of study families at VM1–VM2, VM3–VM5, VM4–VM5, and VM5; storage representation; complete RT4 reporting; explicit country localization; broad ATVM temperature availability; strict service interface temperature coverage; and, among VM3–VM4 families, the proportion with a source-explicit empirical test or monitoring span exceeding 30 days or covering a seasonal period. These indicators are descriptive and were not combined into a composite score.
No statistical meta-analysis was conducted because system boundaries, climates, collector areas, loads, working pairs, storage designs, baselines, time horizons, and outcome definitions were not sufficiently exchangeable. Quantitative results were therefore used to characterize the range and structure of evidence within each maturity level, not to calculate pooled performance. Because the review neither estimates a common intervention effect nor ranks comparative effectiveness, no formal risk-of-bias instrument was applied; the RT indicators describe reporting transparency and do not constitute a risk-of-bias or evidence-certainty score.
To test whether best evidence aggregation inflated family-level validation maturity, sensitivity analysis was conducted for all 11 multi-report study families using two alternative rules. Under the lowest-VM rule, each multi-report family was assigned the lowest report-level VM among its linked reports. Under the direct-service-support rule, a companion report could contribute to the family-level VM only when that report itself directly supported the eligible building service claim at that maturity level; companion reports limited to optimization, economic analysis, control development, or other secondary extensions could not increase the family VM. The resulting family-level VM distributions were compared with the primary highest-directly-demonstrated rule. Report-level assignments and family-specific sensitivity outcomes are provided in
Supplementary File S1.
Each study family contributed once to the mutually exclusive service and concentrator summaries. Multi-location country counts were multi-response and therefore could exceed 145. Temperature bands were <80 °C, 80–149 °C, and ≥150 °C. These were pragmatic descriptive bins intended to separate lower-temperature service conditions, an intermediate range common in CPC and thermally driven cooling applications, and higher-temperature concentrating operation [
6,
7]; they are not universal collector, chiller, readiness, or performance thresholds. In the final corpus, 49 families yielded at least one explicit candidate temperature without inference. Source-level verification retained 41 for the broad provenance/availability layer; 104 were NR in that layer. A stricter service driving/service delivery sensitivity subset retained 17 families. A family entered this subset only when the source explicitly reported a representative, design, setpoint, or study-identified optimum temperature at the service driving or service delivery interface. When that explicit comparable value differed from the broad-layer candidate, the source-reported comparable value was used for sensitivity analysis; no temperature was derived, averaged, or inferred. Peaks/maxima without representative service meaning, range endpoints, collector inlet conditions, auxiliary-control values, stagnation-only values, and other non-comparable proxies were otherwise excluded. Temperature availability was summarized descriptively by service, VM, and concentrator category to assess subset composition; no inferential missingness test was applied because the evidence map describes a defined review corpus and several cells were sparse. Missing, not reported, not retained under the temperature rule, and not applicable were kept distinct throughout the evidence matrix.
The 49 explicit temperature candidates in the final corpus were independently assessed at the source level by a second reviewer using the predefined temperature rules. The second reviewer did not have access to the primary retain/NR decision, physical locus classification, value-type classification, or temperature band assignment. Before disagreement resolution, retain/NR status agreed for 45 of 49 candidates (91.8%), physical locus classification for 47 of 49 (95.9%), and value-type classification for 47 of 49 (95.9%). Disagreements were resolved through source-level review against the predefined rules. The final broad ATVM retained 41 families, and the stricter service driving/service delivery sensitivity layer retained 17.
2.9. Systematic Descriptive Bibliometric Analysis
A systematic descriptive bibliometric analysis was conducted across the complete set of included journal reports (
n = 160), separately from the study family unit used for substantive evidence synthesis (
n = 145). The analysis characterized publication structure through annual publication output, journal/source productivity and concentration, and authorship size. All indicators were calculated from the complete included report corpus rather than from a sample of publications. The bibliometric layer was designed as a performance-oriented descriptive analysis rather than network-based science mapping; citation, co-citation, bibliographic-coupling, keyword co-occurrence, and co-authorship network analyses were therefore not undertaken. This distinction preserves the purpose of the evidence map: bibliometric indicators describe how the retrieved literature is published, whereas validation maturity, Reporting Transparency, and ATVM analyses evaluate the structure and deployment proximity of the substantive evidence. Report-level bibliographic records and the resulting distributions are provided in
Supplementary File S1.
3. Results
3.1. Search and Study Selection Outcome
The searches identified 931 records: 476 from Scopus and 455 from Web of Science. Deduplication removed 363 records, leaving 568 unique records. Screening and publication type verification excluded 364 records, leaving 204 reports for retrieval; 194 were retrieved, and 10 remained unavailable (nine paywalled and one for another access reason). Thirty-four retrieved reports were excluded, and 160 were included in the evidence map (
Figure 1). One conference paper was excluded under the predefined publication type criterion and is counted among screening exclusions rather than access losses or full-text exclusions.
Pre-adjudication agreement was high at title/abstract screening (535/568; 94.2%; Cohen’s κ = 0.85) and full-text eligibility assessment (185/194; 95.4%). The 33 title/abstract and nine full-text disagreements were adjudicated by a third reviewer. Agreement statistics are based on the independent reviewer decisions recorded before adjudication; the synthesis uses the adjudicated bibliographic and eligibility decisions.
The 160 eligible reports [
14,
15,
16,
17,
18,
19,
20,
21,
22,
23,
24,
25,
26,
27,
28,
29,
30,
31,
32,
33,
34,
35,
36,
37,
38,
39,
40,
41,
42,
43,
44,
45,
46,
47,
48,
49,
50,
51,
52,
53,
54,
55,
56,
57,
58,
59,
60,
61,
62,
63,
64,
65,
66,
67,
68,
69,
70,
71,
72,
73,
74,
75,
76,
77,
78,
79,
80,
81,
82,
83,
84,
85,
86,
87,
88,
89,
90,
91,
92,
93,
94,
95,
96,
97,
98,
99,
100,
101,
102,
103,
104,
105,
106,
107,
108,
109,
110,
111,
112,
113,
114,
115,
116,
117,
118,
119,
120,
121,
122,
123,
124,
125,
126,
127,
128,
129,
130,
131,
132,
133,
134,
135,
136,
137,
138,
139,
140,
141,
142,
143,
144,
145,
146,
147,
148,
149,
150,
151,
152,
153,
154,
155,
156,
157,
158,
159,
160,
161,
162,
163,
164,
165,
166,
167,
168,
169,
170,
171,
172,
173] were consolidated into 145 unique study families. Technology-specific classification was applied only after eligibility assessment and study family consolidation. The 568 unique records constituted the screening set rather than 568 eligible CST studies and therefore were not used as the denominator for technology-specific synthesis. Eleven multi-report families accounted for 15 companion reports; the remaining 134 were single-report families. Family linkage prevented repeated publications from inflating service, technology, validation, and reporting counts. Full-text exclusions were dominated by collector/component studies lacking an explicit building service link (17/34) and cold chain or process refrigeration applications (8/34) (
Table 8).
Supplementary File S1 cross-maps each study family to its contributing report reference number(s), Record_ID, and Family_ID, making the service, concentrator, VM, RT, and ATVM syntheses traceable to citations.
3.2. Bibliometric, Geographical, and Building Service Distribution
At the report level, the 160 included journal articles spanned 1992–2026, with 133 reports (83.1%) published from 2016 onward. Annual output peaked in 2025 with 16 included reports; the 2026 count is incomplete because the final database search was conducted on 3 September 2026. The reports were distributed across 60 journals, indicating a dispersed publication base. Energies and Applied Thermal Engineering contributed 14 reports each, followed by Solar Energy (12), Renewable Energy (10), and Energy Conversion and Management (9); together, these five sources accounted for 59/160 reports (36.9%). Thirty-four of the 60 journals were represented by only one included report. Authorship also varied across the corpus, with a mean of 4.09 authors per report, a median of four, and a range of one to 11 authors.
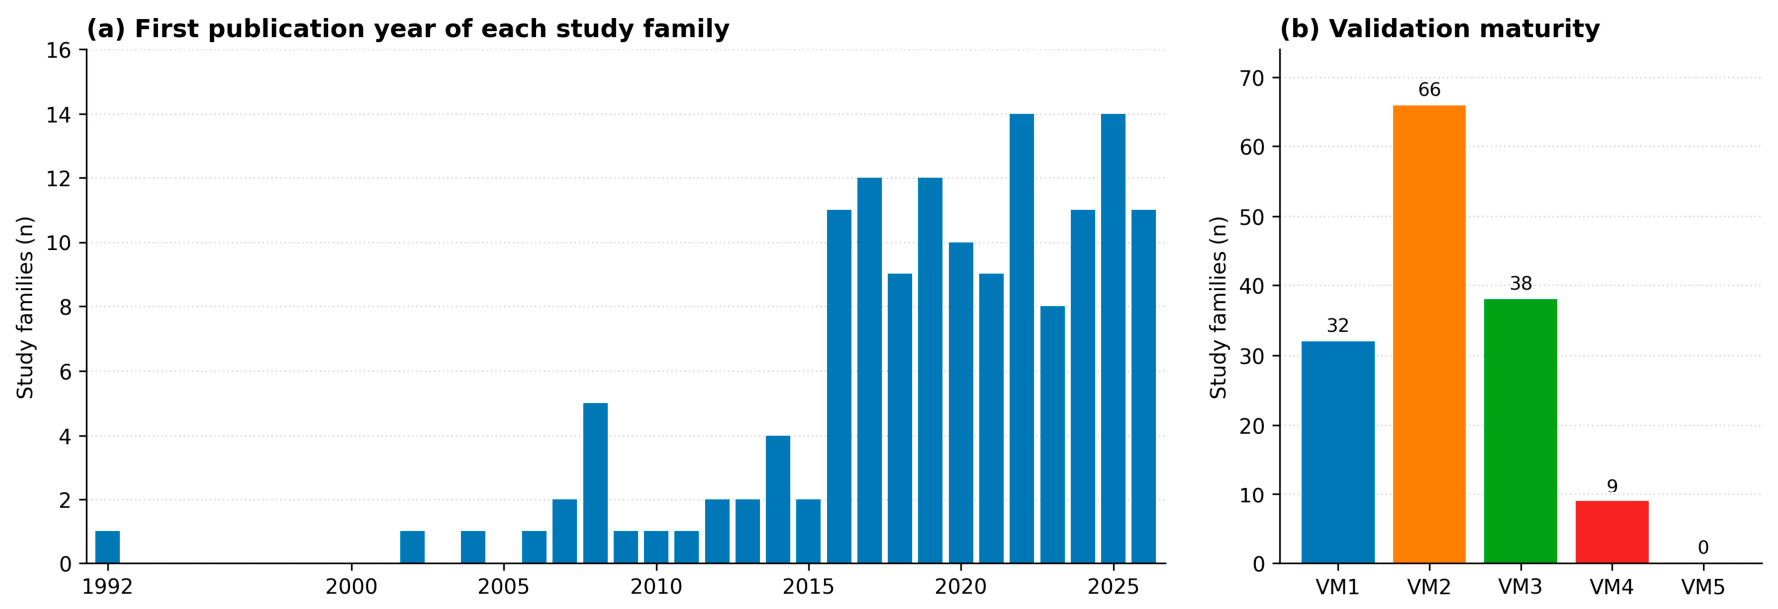
The first eligible reports in the study families ranged from 1992 to 2026. Publication activity remained sparse until the mid-2010s and then increased sharply: 121 of 145 families (83.4%) first appeared from 2016 onward. The largest annual counts occurred in 2022 and 2025 (14 families each); 11 families had appeared in 2026 at the search cutoff, so the final year is incomplete (
Figure 2a).
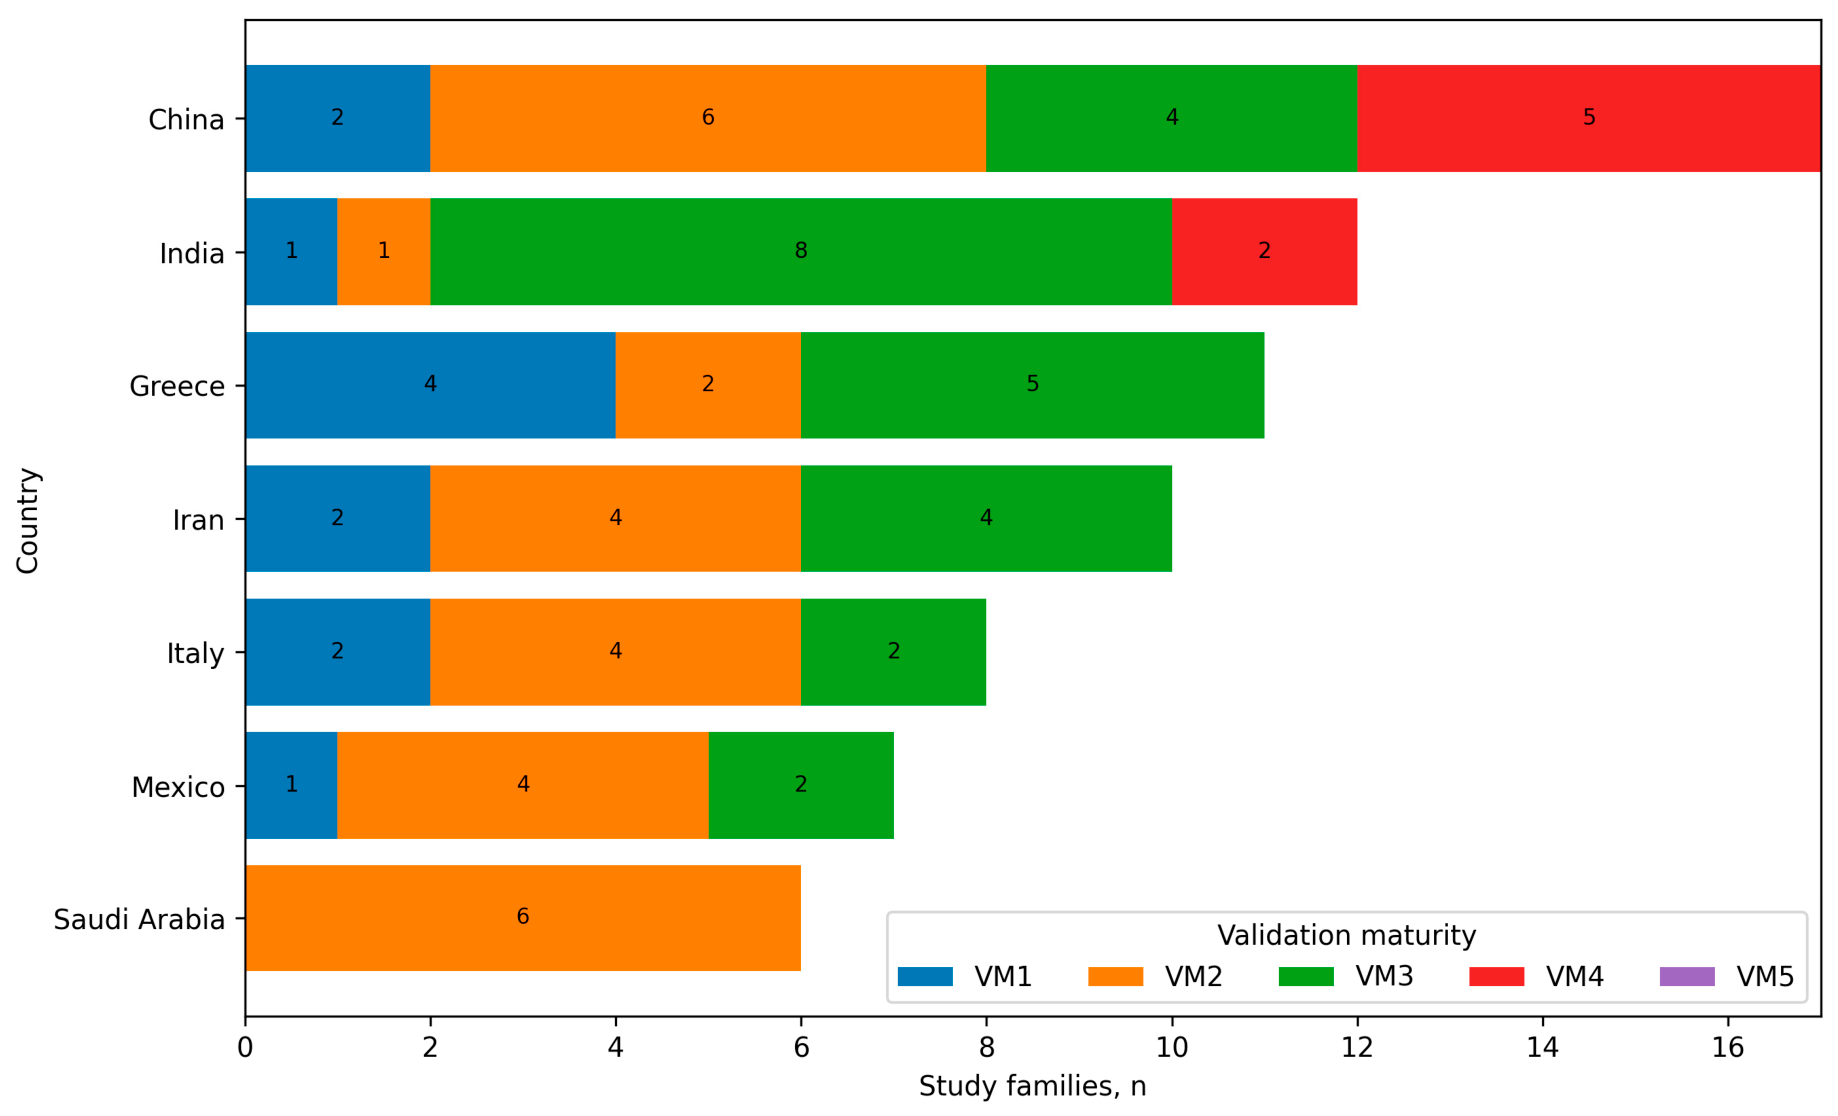
An explicit country could be identified for 128 families (88.3%), representing at least 34 countries. The most frequently represented countries were China (17 families), India (12), Greece (11), Iran (10), Italy (8), Mexico (7), and Saudi Arabia (6). These are multi-response counts for studies spanning more than one country. The corpus covered hot arid, Mediterranean, tropical/hot humid, temperate, and cold winter settings, but 17 families used generic, laboratory, multi-city, or insufficiently localized climate descriptions that could not be assigned to a single country without inference.
Geographical evidence maturity was uneven across the most frequently represented countries. Among the 17 China-linked families, five reached VM4, four VM3, six VM2, and two VM1; cooling-only applications were the largest service group (10/17). India showed a more prototype-oriented profile: eight of 12 families were VM3, and two reached VM4, while DHW-only applications were the largest service group (5/12). Greece included five VM3, two VM2, and four VM1 families, with DHW-only applications again the most frequent (5/11). Iran comprised four VM3, four VM2, and two VM1 families, while Italy comprised two VM3, four VM2, and two VM1 families. Mexico contained two VM3, four VM2, and one VM1 family, whereas all six Saudi Arabia-linked families were classified at VM2. China and India together accounted for seven of the nine VM4 families in the corpus. These patterns are descriptive and should not be interpreted as national deployment rates, because country counts are multi-response and several country-specific cells remain small. The validation maturity profiles of the seven most represented countries are summarized graphically in
Figure 3.
Residential/domestic contexts were the most frequently represented building group (67/145; 46.2%), followed by office/commercial/workplace contexts (26/145; 17.9%), institutional/education/healthcare contexts (9/145; 6.2%), mixed or multiple building types (5/145; 3.4%), and hospitality/recreation/public service contexts (4/145; 2.8%); 34 families (23.4%) remained generic, unspecified, or test-only building contexts. A single source-explicit broad climate descriptor could be assigned without geographic inference to 41 families (28.3%): 18 were hot arid/arid/semi arid, 11 tropical/hot humid/subtropical, seven cold/cold winter/high-altitude, four Mediterranean, and one temperate/mixed-season. Fifteen families (10.3%) explicitly compared multiple or contrasting climate cases. The remaining 89 families (61.4%) reported location, weather, solar resource, or laboratory/test conditions but did not support assignment to a single broad climate zone without inference.
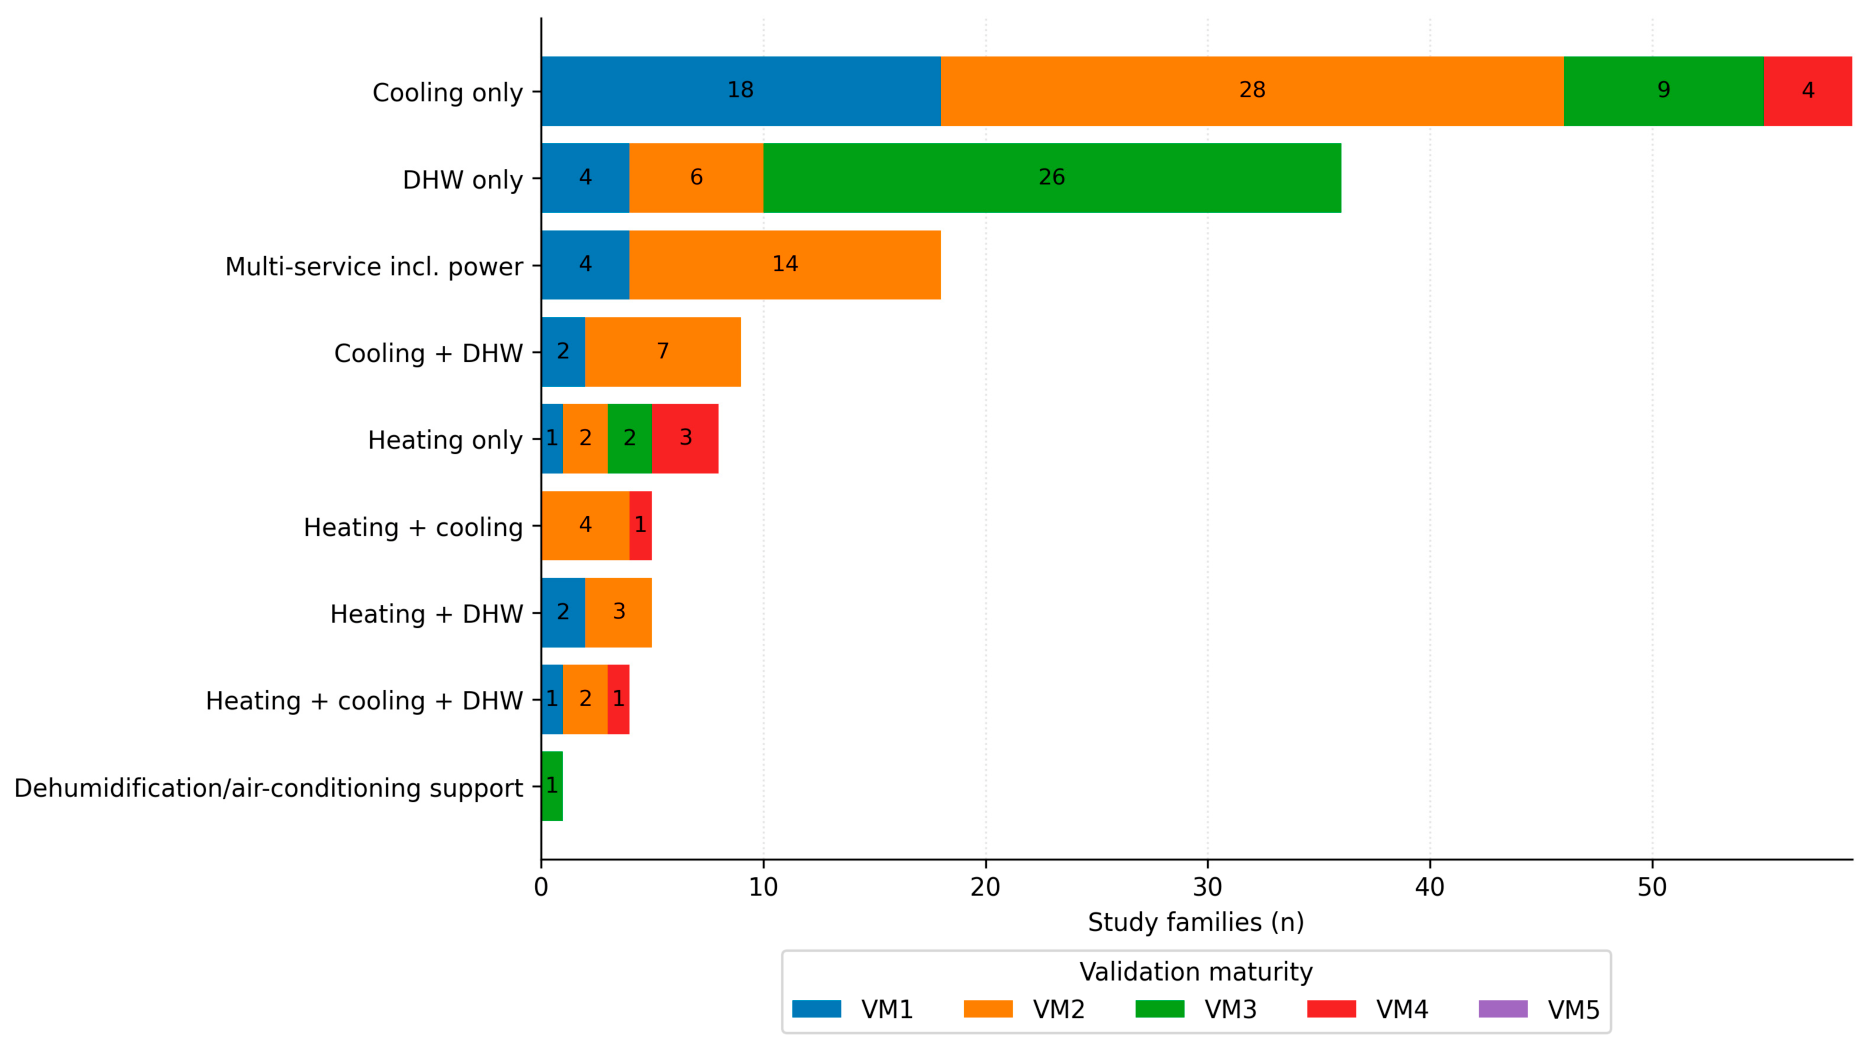
Cooling-only applications formed the largest service category (59/145; 40.7%), followed by DHW-only systems (36/145; 24.8%) and multi-service systems that also produced electricity or another power product (18/145; 12.4%). The remaining families addressed cooling plus DHW (9), heating only (8), heating plus DHW (5), heating plus cooling (5), heating plus cooling plus DHW (4), or dehumidification/air-conditioning support (1). Thus, the evidence base was not evenly distributed across building services: cooling dominated numerical system studies, whereas DHW accounted for most small-scale water heater prototypes.
3.3. Concentrator, Temperature, Storage, and Auxiliary-System Configurations
Parabolic trough collectors were the dominant concentrating technology (71/145; 49.0%), followed by CPC/non-imaging collectors (46/145; 31.7%). LFR and dish/paraboloid systems accounted for seven and six families, respectively. Twelve families compared more than one CST type, including PTC-CPC (7), PTC-LFR (3), CPC-LFR (1), and CPC-Fresnel-lens (1) combinations. One Scheffler, one unspecified optical concentrator family, and one heliostat field/central receiver family completed the corpus.
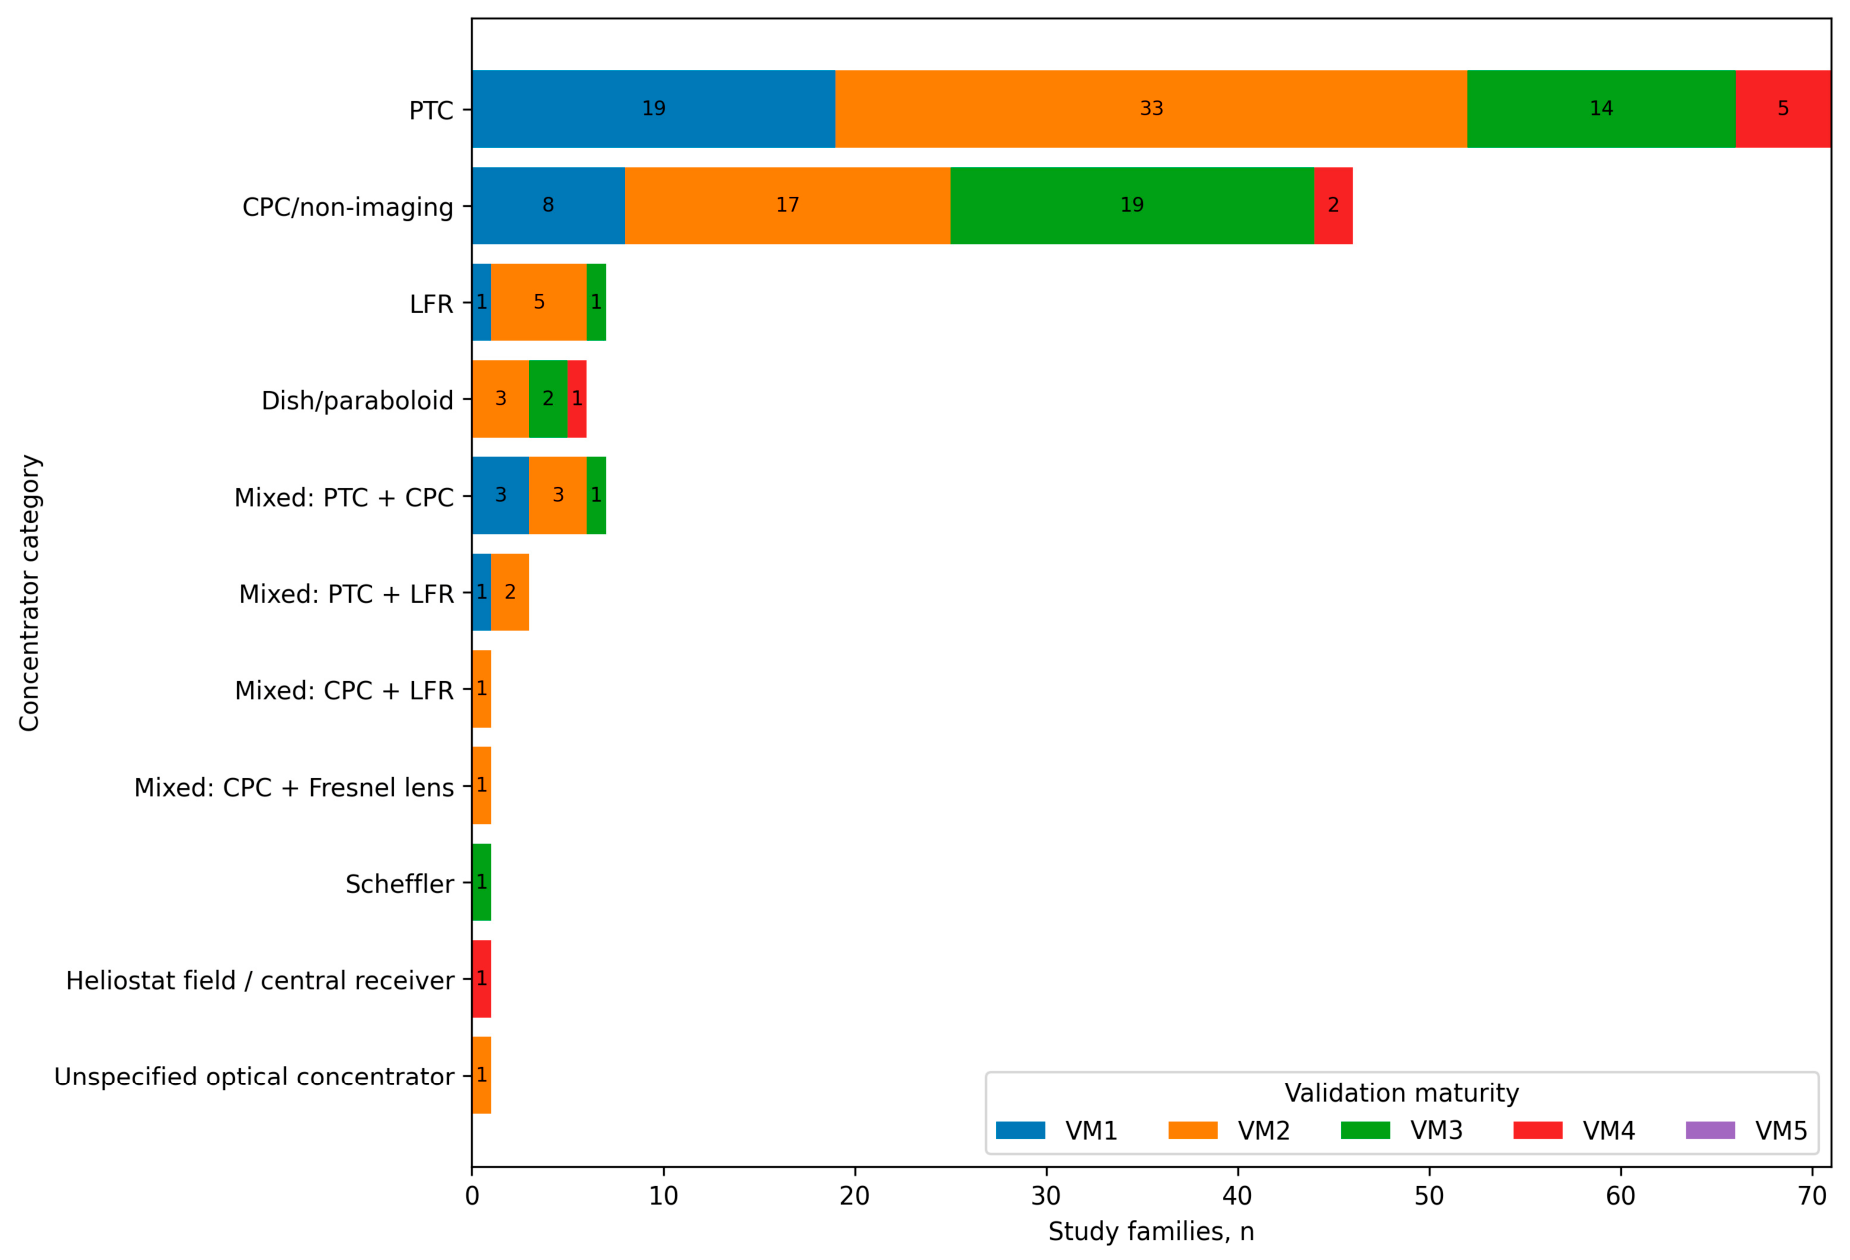
Technology-specific evidence profiles were also distinct. Among the 71 PTC families, cooling-only applications were the largest service group (34/71; 47.9%), and 52/71 (73.2%) remained at VM1–VM2; 14 reached VM3, and 5 reached VM4. CPC/non-imaging systems showed a different profile: 24/46 families (52.2%) addressed DHW only, 25/46 (54.3%) were VM1–VM2, 19 reached VM3, and 2 reached VM4. Of the seven LFR families, three addressed cooling only and three multi-service systems including power, while six remained at VM1–VM2. The six dish/paraboloid families were distributed across multi-service including power (2), DHW (2), heating (1), and cooling (1), with three at VM2, two at VM3, and one at VM4. The 12 explicitly comparative mixed-CST families comprised four VM1, seven VM2, and one VM3 family, with none reaching VM4 or VM5. The single Scheffler family reached VM3, the heliostat field/central receiver family reached VM4, and the unspecified optical concentrator family remained at VM2.
Technology-specific comparison was limited to variables that could be interpreted consistently at the study family level. Although collector/aperture scale and performance outcomes were extracted when source-explicit, technology-wide minimum–maximum ranges for collector area or efficiency were not calculated because collector area definitions, system boundaries, climates, loads, and performance measures were not sufficiently exchangeable across studies. Reported outcomes included collector or system thermal efficiency, coefficient of performance, solar fraction, useful heat, capacity, and other non-equivalent measures. Accordingly, the comparative synthesis emphasizes family frequency, dominant building service, validation maturity, and the source-verified temperature layer rather than pooled performance or collector area extrema.
Some form of thermal storage, integral storage, or explicitly described thermal buffer was represented in 123 families (84.8%). Storage was absent in 15 and insufficiently specified in 7. Sensible hot water tanks were the most recurrent configuration, while latent PCM stores, chilled water storage, thermal oil or molten salt tanks, rock bed or underground seasonal storage, and ice storage appeared in narrower application groups. Auxiliary arrangements included natural gas or other fuel-fired heat, electric heaters, biomass boilers, heat pumps, and hybrid compression cooling. Many prototype studies intentionally operated without auxiliary heat, whereas building simulations often used backup to maintain service continuity.
The configurations therefore differed not only by concentrator geometry but also by the thermal architecture downstream of the collector. Cooling studies commonly coupled a hot-side store to absorption, adsorption, ejector, or desiccant subsystems, sometimes with chilled water storage. DHW prototypes more often integrated the storage vessel directly with the concentrator. Heating studies used hot water tanks, PCM, thermal mass, or heat pump coupling. These distinctions were retained in the study-level matrix rather than reduced to a single storage efficiency comparison.
3.4. Research Methods and Validation Maturity
At the study family level, the existing evidence-type coding yielded five broad study-method profiles: 32 families were classified as integrated simulation/model only, 62 as component-validated simulation, four as validated component/model, 38 as prototype/laboratory/outdoor validation, and nine as integrated real-weather demonstration in which routine normal operation was not source-explicit. The two validation-supported modeling categories jointly comprised 66 families. Because these broad study method/evidence type categories are operationally coupled to the VM rubric, they are reported here as the descriptive method profile for RQ1 rather than treated as an independent methodological quality classification.
The evidence base remained predominantly model-led. VM1 included 32 families (22.1%), and VM2 included 66 (45.5%), giving 98 families (67.6%) in which the building service claim was generated mainly by modeling. Thirty-eight families (26.2%) reached VM3 prototype or laboratory/outdoor testing. Nine (6.2%) reached VM4 integrated real-weather demonstration, and none among the retrieved and eligible families met the predefined VM5 requirement for monitored routine operation in an occupied or normally used building (
Figure 2b).
Among the 47 VM3–VM4 families with direct empirical evidence, the source-explicit test or monitoring span was ≤1 day in 11 families (23.4%), 2–7 days in 8 (17.0%), 8–30 days in 7 (14.9%), and >30 days or seasonal in 10 (21.3%); duration was not explicit enough to assign to a bin in 11 families (23.4%). Within the nine VM4 families, three had 8–30-day campaigns, three had >30-day or seasonal evidence, one had a 2–7-day span, and two did not report a sufficiently explicit duration for binning. These duration categories refer only to direct empirical test or monitoring spans and do not include simulation horizons.
Maturity differed sharply by service (
Figure 4). Forty-six of 59 cooling-only families (78.0%) were VM1 or VM2; 9 reached VM3, and 4 reached VM4. By contrast, 26 of 36 DHW-only families (72.2%) reached VM3, but none reached VM4 or VM5 because the evidence usually came from standalone outdoor water heater prototypes rather than integrated building operation. Five of eight heating-only families reached VM3 or VM4. All 18 multi-service families that also produced power remained at VM1 or VM2.
The nine VM4 families were heterogeneous but shared direct service integration under real weather. They comprised five PTC systems—Tianjin office heating/cooling [
14], Handan laboratory/test space heat pump service [
16], a Beijing winter-heating test room [
18], Tunisia laboratory/office cooling [
19], and Kunming meeting room cooling [
20]—two CPC systems in Jammu [
17] and California [
21], one dish-driven Jaipur factory cooling system [
15], and one heliostat field/central receiver seasonal storage heating demonstration in Zhangjiakou [
22]. Under the explicit VM4/VM5 classification criteria, real-building location alone was insufficient: none of these reports source explicitly demonstrated all four conditions for routine normal building operation. All nine were therefore classified as VM4, and none of the retrieved and eligible families met the VM5 threshold (
Table 9).
Table 9.
Technology-specific classification and validation maturity at study family level (n = 145).
Table 9.
Technology-specific classification and validation maturity at study family level (n = 145).
| Concentrator Category | VM1 | VM2 | VM3 | VM4 | VM5 | Total |
|---|
| PTC | 19 | 33 | 14 | 5 | 0 | 71 |
| CPC/non-imaging | 8 | 17 | 19 | 2 | 0 | 46 |
| LFR | 1 | 5 | 1 | 0 | 0 | 7 |
| Dish/paraboloid | 0 | 3 | 2 | 1 | 0 | 6 |
| Mixed PTC + CPC | 3 | 3 | 1 | 0 | 0 | 7 |
| Mixed PTC + LFR | 1 | 2 | 0 | 0 | 0 | 3 |
| Mixed CPC + Fresnel lens | 0 | 1 | 0 | 0 | 0 | 1 |
| Mixed CPC + LFR | 0 | 1 | 0 | 0 | 0 | 1 |
| Scheffler | 0 | 0 | 1 | 0 | 0 | 1 |
| Unspecified optical concentrator | 0 | 1 | 0 | 0 | 0 | 1 |
| Heliostat field/central receiver | 0 | 0 | 0 | 1 | 0 | 1 |
| Total | 32 | 66 | 38 | 9 | 0 | 145 |
Figure 5.
Validation maturity by concentrator category at study family level. Explicit comparative families are retained as mixed CST categories; numbers inside bars are study family counts. Abbreviations: PTC, parabolic trough collector; CPC, compound parabolic concentrator; LFR, linear Fresnel reflector; CST, concentrating solar thermal; VM, validation maturity.
Figure 5.
Validation maturity by concentrator category at study family level. Explicit comparative families are retained as mixed CST categories; numbers inside bars are study family counts. Abbreviations: PTC, parabolic trough collector; CPC, compound parabolic concentrator; LFR, linear Fresnel reflector; CST, concentrating solar thermal; VM, validation maturity.
The family-level VM profile was robust to both sensitivity checks. Under the deliberately conservative lowest-VM rule, 3 of the 11 multi-report families moved down by one level: SF-G06 from VM3 to VM2, and SF-G08 and SF-G05 from VM2 to VM1. The full-corpus distribution therefore changed from 32 VM1, 66 VM2, 38 VM3, 9 VM4, and 0 VM5 families to 34 VM1, 65 VM2, 37 VM3, nine VM4, and zero VM5 families. The model-led share increased only from 98/145 (67.6%) to 99/145 (68.3%), while the numbers of VM4 and VM5 families were unchanged. Under the direct-service-support rule, none of the 11 multi-report families changed VM, and the original full-corpus distribution was retained. Thus, no family-level VM was increased solely by a companion report limited to optimization, economics, control, or another secondary analytical extension.
3.5. Performance Metrics and Reporting Transparency
At the study family level, all 145 families reported performance metrics with units and an identifiable calculation or measurement basis (RT3). System boundaries and operating, climatic, or simulation conditions were fully reported in 143 families and partially reported in 2 (RT1). A comparator, baseline, or explicit statement that no comparator was used was fully reported in 138, partially reported in 4, and absent in 3 (RT2). The temporal basis was fully specified in 131, partially in 8, and absent in 6 (RT5). RT4 was the weakest domain: 78 families fully reported method-appropriate validation, calibration, measurement uncertainty, or sensitivity/uncertainty evidence; 41 partially reported it, and 26 reported none (
Table 10).
The outcome vocabulary was highly heterogeneous. Common measures included collector or system thermal efficiency, chiller COP, solar fraction, useful heat, cooling or heating capacity, storage temperature, annual auxiliary energy, cost and payback, primary energy change, and emissions. The VM4 studies illustrate why these outputs were not pooled. Reported outcomes ranged from room temperature maintenance and daily operating hours to annual gas or primary energy savings, while system boundaries ranged from test rooms to factory halls and office buildings [
14,
15,
16,
17,
18,
19,
20,
21]. Numerical differences therefore represent study-specific designs and baselines rather than an exchangeable effect size.
Even among VM4 studies, validation and performance framing varied. The Tianjin office study reported close field–model agreement and annual gas, primary energy, and CO2 reductions [
14]. The Jaipur factory system reported 3 kW of cooling, a COP of 0.52–0.67, approximately 13 h of operation, and a 2.2-year simple payback [
15]. The Handan heat pump system reported a winter COP of 2.3–4.0 and approximately 40.7% annual electricity savings [
16]. The Jammu and Beijing heating demonstrations reported maintained room temperatures or indoor-ambient temperature differences rather than a common energy savings baseline [
17,
18]. The Tunisia, Kunming, and California cooling studies likewise used different COP, solar fraction, unmet load, and life cycle boundaries [
19,
20,
21]. The Zhangjiakou seasonal storage study reported measured heating season receiver operation, including a 99.5 °C maximum outlet temperature in the case that charged a buffer tank supplying heat and water to residents [
22].
3.6. Application–Temperature–Validation Matrix
The final broad ATVM provenance layer retained a source-verified service-relevant temperature for 41 of 145 study families (28.3%); 104 were NR under the final temperature rule. Fourteen retained families were below 80 °C, 16 were in the 80–149 °C band, and 11 were at or above 150 °C (
Table 11). This broad layer preserves temperature provenance and availability but does not assume that maxima, range endpoints, storage temperatures, collector outlets, and service driving temperatures are thermodynamically identical. A stricter sensitivity subset therefore retained 17 families with a directly comparable service driving or service delivery representative, design, setpoint, or study-identified optimum temperature. For the 49 explicit temperature candidates in the final corpus, independent retain/NR classification agreed for 45 (91.8%) before adjudication; four disagreements were resolved through source-level adjudication.
Temperature availability was uneven across the corpus. Broad-layer availability was 12.5% for VM1 (4/32), 30.3% for VM2 (20/66), 42.1% for VM3 (16/38), and 11.1% for VM4 (1/9). The VM4 observation was Li et al. (2021), which reported a measured 99.5 °C receiver outlet maximum during a heating season buffer tank charging case [
22]; no VM4 family met the stricter service driving/service delivery sensitivity definition. Broad-layer availability was 33.9% for cooling-only (20/59), 36.1% for DHW-only (13/36), 11.1% for cooling-plus-DHW (1/9), and 37.5% for heating-only families (3/8); no multi-service-including-power family contributed a broad value. Across concentrator categories, broad-layer availability was 26.8% for PTC, 30.4% for CPC/non-imaging, 28.6% for LFR, 33.3% for dish/paraboloid systems, and 26.7% for mixed/other CST families. These differences show that the temperature-coded subset is compositionally selective rather than a miniature representation of the full corpus.
In the verified broad provenance layer, cooling-only families comprised 20 cases: one below 80 °C, 11 at 80–149 °C, and eight at ≥150 °C. DHW-only families comprised 13 cases: 10 below 80 °C, 2 at 80–149 °C, and 1 at ≥150 °C. The remaining retained families comprised heating only (
n = 3: two at 80–149 °C and one at ≥150 °C), heating plus DHW (
n = 2: both <80 °C), heating plus cooling (
n = 2: one < 80 °C and one at 80–149 °C), and cooling plus DHW (
n = 1: ≥150 °C). Technology-specific banding was also uneven. PTC contributed 19 retained families (five < 80 °C, 8 at 80–149 °C, and 6 at ≥150 °C), CPC/non-imaging contributed 14 (8, 4, and 2, respectively), LFR contributed 2 (1 < 80 °C and 1 ≥ 150 °C), dish/paraboloid contributed 2 (1 at 80–149 °C and 1 ≥ 150 °C), mixed PTC–CPC configurations contributed 3 (2 at 80–149 °C and 1 ≥ 150 °C), and the heliostat field/central receiver category contributed 1 family at 80–149 °C. The ≥150 °C band remained strongly model-led: 10 of 11 families were VM1–VM2 and 1 was VM3. The broad <80 °C band contained nine VM3 and five VM2 families, but this low-temperature prototype concentration was not preserved in the strict sensitivity subset, in which only two of five <80 °C families were VM3. All four sensitivity-eligible ≥150 °C families were VM1–VM2. The only VM4 observation in the broad layer was the 80–149 °C Zhangjiakou heating family [
22], and no VM4 family entered the stricter sensitivity subset; VM5 was absent among retrieved and eligible families. These counts describe the source-verified broad temperature subset and should not be interpreted as technology-wide operating temperature limits. RQ3 is therefore answered conditionally: the broad provenance layer can locate one VM4 heating/central receiver observation, while the stricter service interface comparison remains confined to VM1–VM3.
3.7. Cross-Cutting Quantitative Indicators
A compact set of cross-cutting indicators was used to summarize the structure, deployment proximity, reporting completeness, and contextual coverage of the evidence map (
Table 12). Of the 160 included reports, 15 (9.4%) were additional companion reports consolidated into already represented study families rather than counted as independent systems. At family level, 67.6% remained model-led, 32.4% reached prototype-level evidence or higher, and 6.2% reached integrated real-weather demonstration or higher; no family met all source-explicit VM5 criteria. Storage was represented in 84.8% of families, while RT4 was fully reported in 53.8%. An explicit study country was identifiable for 88.3% of families. Source-verified temperature coverage was substantially narrower: 28.3% of families contributed to the broad ATVM layer and 11.7% to the strict service interface subset. Among the 47 VM3–VM4 families with direct empirical evidence, 21.3% had a source-explicit test or monitoring span exceeding 30 days or covering a seasonal period.
4. Discussion
The discussion follows the question-to-evidence crosswalk established in
Table 2.
Section 4.1 interprets the validation maturity evidence central to RQ2;
Section 4.2 integrates the bibliometric, geographical, technology, and service distributions of RQ1 with the temperature-conditioned patterns of RQ3; and
Section 4.3,
Section 4.4 and
Section 4.5 develop the reporting and implementation constraints addressed by RQ4.
Section 4.6 defines the interpretive limits that apply across all four questions.
4.1. From Technical Feasibility to Building Service Evidence
Within the retrieved peer-reviewed journal corpus, the central finding is a mismatch between the breadth of proposed CST building applications and the depth of deployment-proximate evidence. Recent reviews have already brought technology maturity and deployment barriers into the solar cooling and off-grid discussion [
9,
10], while building integration reviews document a wide technical repertoire [
5]. The present study adds a different level of resolution: after companion report consolidation, 98 of 145 unique study families remain at VM1 or VM2, and none meet the source-explicit VM5 definition. This does not diminish modeling: validated component and annual system models are essential for sizing, control design, and climate transfer. The unresolved transition in this journal evidence base is from model refinement and research demonstration to documented normal building service operation under the coupled weather, storage, auxiliary, control, and load conditions that govern use in practice.
Study family consolidation materially changes how that evidence accumulation is read. Fifteen companion reports were linked to their underlying prototype or building model case rather than counted as independent systems. Later reports often added optimization, economics, or control while retaining the same empirical base. The contribution is therefore not another count of publications, but a non-duplicative benchmark that separates growth in reporting from growth in deployment evidence.
4.2. Distributional, Service-, and Temperature-Specific Deployment Patterns
Despite recent growth in publication volume, validation maturity remains unevenly distributed across technologies and locations in the retrieved corpus. Although 133 of 160 included reports (83.1%) were published from 2016 onward, and the corpus spanned 60 journals, deployment-proximate evidence remained geographically concentrated: China and India together accounted for seven of the nine VM4 families. This concentration reflects the location of evidence retrieved in the journal corpus and should not be interpreted as national CST deployment prevalence. Technology profiles were likewise differentiated: PTC families were concentrated in cooling and remained predominantly model-led (52/71 at VM1–VM2), whereas CPC/non-imaging families were more strongly associated with DHW and contained a larger prototype-level component (19 VM3 and two VM4 families among 46).
These distributions refine the technology-centered picture reported in previous reviews. Building integration reviews have emphasized the architectural and technical integration of concentrating systems [
5], CPC-focused work has documented the adaptability of non-imaging concentration [
6], and reviews of thermally driven cooling have compared concentrating collector options primarily through thermodynamic configuration and performance [
7,
8]. The present study adds a different comparative dimension. PTC was the most frequent family-level technology and was concentrated in cooling applications, whereas CPC/non-imaging systems were more strongly associated with DHW and contained a larger prototype-level component; LFR represented a substantially smaller evidence base, and six of its seven families remained at VM1–VM2. The source-verified temperature layer likewise showed technology- and service-specific distributions, but the heterogeneity of temperature locus, collector area, system boundary, and performance metrics precludes a defensible technology ranking based on efficiency or operating temperature extrema. Thus, the present comparison distinguishes the distribution and deployment proximity of the evidence from the nominal performance capability of the technologies.
Service-specific pathways were not equivalent. Cooling generated the largest literature but remained model-dominant, consistent with reviews that emphasize the thermodynamic and integration complexity of concentrator-driven absorption and adsorption systems [
7,
8]. Four cooling-only families reached VM4, demonstrating integrated service under real weather, but the sources characterized the evidence as research tests or demonstrations rather than source-explicit routine normal operation. DHW followed a different pathway: standalone outdoor prototypes were common, especially for CPC/non-imaging systems, yet they rarely demonstrated delivery under real draw schedules, occupancy, hygiene constraints, or building operation. Heating had a smaller evidence base but a comparatively higher share of VM3–VM4 studies, including a pilot-scale seasonal storage/central receiver demonstration [
22].
The temperature analysis qualifies rather than simply reinforces the service-level contrast. CPC design research has established the adaptability of non-imaging collectors for low- and medium-temperature applications [
6], while cooling reviews emphasize the importance of driving temperature and coupled subsystem performance [
7,
8]. In the broad provenance layer, lower-temperature cases were concentrated in DHW and higher-temperature cases in cooling, but those values occupy different physical loci and are not treated as thermodynamically exchangeable. The stricter service interface sensitivity analysis did not reproduce a general low-temperature/prototype association. The pattern retained across both layers was on the high-temperature side: ≥150 °C evidence remained predominantly model-led. Because temperature availability was uneven across service and maturity categories, these findings characterize source-verified subsets rather than the complete CST evidence base. The practical bottleneck is therefore not target temperature alone, but continued service under variable irradiance, storage state, load, heat rejection, controls, and auxiliary operation. Temperature capability and deployment maturity must be read as complementary rather than interchangeable evidence dimensions.
4.3. Integration, Control, Storage, and Auxiliary Heat
Storage was represented in 84.8% of study families, supporting its established role in matching solar supply to thermal demand [
4]. Yet ‘storage’ encompassed short buffering, day–night load shifting, latent high-temperature storage, seasonal heating storage, chilled water buffering, and integral DHW containment. These functions are not comparable through a single storage label or capacity metric. Auxiliary systems likewise ranged from resilience measures to dominant energy sources. This system-level dependence is consistent with the wider observation that solar heating and cooling is usually deployed as an integrated rather than stand-alone solution [
2].
The VM4 cases indicate that deployment-proximate evidence depends on explicit downstream integration: terminal units or conditioned spaces, measured weather, storage or thermal buffering where required, and coordinated auxiliary and control operation. This extends building integration discussions beyond collector placement or envelope coupling [
5]. The load-side boundary and control logic are part of the CST intervention; omitting them makes a service claim difficult to reproduce, compare, or transfer.
4.4. Economic, Maintenance, and Monitoring Gaps
Reporting transparency was strongest for system definitions and performance metrics but materially weaker for validation and uncertainty. Only 53.8% of families fully met RT4. This family-level evidence audit adds a validation-proximity dimension to recent deployment-oriented reviews [
9,
10]: apparently precise annual savings or optimized design points may remain sensitive to collector curves, weather data, chiller maps, storage losses, and control assumptions. Component-level agreement should not be presented as validation of the complete building system unless coupled behavior and load delivery are also tested.
Economic evidence was similarly boundary dependent. Studies variously included collector fields, storage, auxiliary equipment, replacement energy, maintenance, and discounting, so short-prototype payback values and life-cycle analyses of annual building systems are not directly exchangeable. Routine maintenance, tracking reliability, fouling, pump and control failures, occupant interaction, and long-duration degradation were also rarely visible in the highest-maturity families. The absence of VM5 within the retrieved journal corpus therefore marks a gap in documented operational knowledge; it should not be read as evidence that no operational CST installations exist outside the indexed evidence base.
4.5. Research and Design Implications
The highest-value research priority is to advance well-characterized study families through the evidence progression rather than add isolated design-point models. For cooling, this requires seasonal monitoring of the complete solar loop, storage, chiller, heat rejection, backup, controls, and conditioned zones. For DHW, prototypes should be connected to representative draw schedules and real buildings, with water quality, stagnation, heat loss, and auxiliary energy reported. For heating and multi-service systems, service-specific thermal delivery should be distinguished from co-produced electricity or fuel so that building benefits remain attributable.
Four reporting elements would substantially improve transferability: an explicit system and load boundary; the definition, physical locus, and value type of the reported service-relevant temperature; method-appropriate uncertainty, calibration, and whole-system validation; and a time basis capable of capturing storage cycling, auxiliary operation, and seasonal load variation. For VM5, these reporting elements must additionally establish an actual, normally used building, delivery to the usual load/users, monitoring of the integrated CST-to-service pathway, and source-explicit normal operation rather than only a dedicated research demonstration. Monitoring duration remains a separate descriptor rather than a maturity threshold.
4.6. Strengths and Limitations
A principal strength of this review is the combined use of study family consolidation, a deployment-proximity framework, separate reporting transparency indicators, and a source-audited temperature layer. Interpretation is nevertheless bounded by two multidisciplinary databases, English-language peer-reviewed journal articles, and 10 reports (4.9% of the 204 reports in the retrieval set) that remained unavailable at synthesis closure. Gray literature, technical project reports, and conference proceedings were outside the predefined scope; operational installations may be documented more readily in those sources than in indexed journal articles. Accordingly, the zero VM5 result is explicitly bounded to the retrieved and eligible journal families and must not be generalized to the complete real-world deployment landscape. No protocol was prospectively registered; this is a transparency limitation, although the eligibility, study family linkage, core VM level definitions, and RT rules were defined before full-text synthesis. The explicit database strings, eligibility rules, access-loss accounting, bibliographic classification record, and decision matrix make the defined coverage boundary auditable.
Family linkage and best evidence aggregation require judgment; the
supplementary file therefore retains report-to-family links and supporting rationales. Sensitivity testing also indicates that the central maturity pattern does not depend on best evidence aggregation: the direct-service-support rule left all 11 multi-report family VMs unchanged, while the conservative lowest-VM rule downgraded only 3 families by one level and did not alter the number of VM4 or VM5 families. The final broad ATVM provenance layer covers 41 families (28.3%) with source-verified service-relevant temperatures; availability was uneven across service and validation maturity, and a stricter service driving/service delivery sensitivity subset contained 17 families. The temperature analysis should therefore be read as structured subset evidence rather than as a complete temperature distribution or a comparison of thermodynamically identical states. One VM4 family contributed a broad-layer measured receiver outlet temperature, but no VM4 family met the stricter service interface sensitivity definition; this difference reflects temperature locus and comparability rather than the absence of integrated demonstrations. The sensitivity check preserved the high-temperature/model-led direction but not a general low-temperature/prototype pattern; because it contained only 17 families, it is used as a diagnostic robustness check rather than a confirmatory analysis. Finally, the synthesis maps evidence structure rather than pooled effectiveness because the underlying outcomes and system boundaries were not exchangeable.
5. Conclusions
For RQ1, this systematic evidence map identified 160 eligible reports and consolidated them into 145 unique study families of CST systems for building heating, cooling, dehumidification, and domestic hot water. Cooling-only was the largest service category (59/145; 40.7%), followed by DHW-only (36/145; 24.8%). Among the mutually exclusive technology categories, PTC (71/145; 49.0%) and CPC/non-imaging (46/145; 31.7%) were dominant, while LFR accounted for 7/145 families (4.8%). PTC therefore exceeded CPC/non-imaging by 25 study families and LFR by 64, while CPC/non-imaging exceeded LFR by 39. The technology profiles were also service-specific: cooling-only was the largest application among PTC families (34/71; 47.9%), whereas DHW-only predominated among CPC/non-imaging families (24/46; 52.2%). The descriptive evidence base is therefore broad but uneven, with its largest concentrations in PTC-based cooling and CPC/non-imaging DHW applications.
For RQ2, the maturity analysis provides the sharper result within the retrieved peer-reviewed journal corpus: 67.6% of families remained model-led, 38 reached controlled prototype testing, nine reached integrated real-weather demonstration, and none met all four source-explicit VM5 criteria for monitored routine building operation. For RQ4, reporting of validation, uncertainty, calibration, or sensitivity was the most persistent transparency weakness. This zero-VM5 classification identifies an evidentiary and reporting gap within the retrieved journal corpus rather than the absence of operational deployment: a family remained below VM5 whenever one or more required conditions, including service to usual load/users or source-explicit normal operation, were absent or not explicitly documented. Application of the explicit VM4/VM5 classification criteria further shows that an installation’s presence in a real building is not sufficient evidence of routine operation when the usual load/user service and normal operating status are not source-explicit. These findings separate reported performance from the strength and deployment proximity of the evidence supporting it.
For RQ3, the ATVM provides a deliberately conditional result. Its 41-family broad layer maps source-reported temperature provenance and availability, whereas the 17-family sensitivity layer restricts comparison to explicit service driving or service delivery values. Higher-temperature evidence was predominantly model-led in both layers, while the broad low-temperature prototype concentration was not robust to the stricter comparability rule. The study’s main contribution is therefore a non-duplicative, cross-service benchmark that links study family identity, validation proximity, reporting transparency, and temperature provenance without treating heterogeneous performance outcomes as a pooled technology ranking. Within the defined journal evidence base, progress toward practice is most clearly documented by seasonal whole-system monitoring that captures the building load, storage, auxiliary equipment, controls, service continuity, uncertainty, maintenance, and economic boundaries.



 ,
,