Article

Failure Mode, Effects, and Criticality Analysis (FMECA)-Based Fault Diagnosis of a High-Voltage Disconnect Switch


Centre de Recherche et D’innovation en Intelligence Énergétique (CR2ie), Sept-Îles, QC G4R 5B7, Canada
*
Author to whom correspondence should be addressed.
Energies 2026, 19(17), 4212; https://doi.org/10.3390/en19174212
Submission received: 12 May 2026 / Revised: 24 July 2026 / Accepted: 31 August 2026 / Published: 6 September 2026
(This article belongs to the Section F1: Electrical Power System)

Abstract

High-voltage disconnect switches (HVDSs) are crucial for ensuring visible electrical isolation but often operate under challenging environmental conditions. While current monitoring methods can detect faults, simply identifying them is not enough for effective maintenance planning or efficient resource management. Electric utilities need tools or platforms that enable them to identify various failure modes and their impact on the safety and reliability of the system. This paper presents a failure mode and effects analysis of a HVDS and an assessment of its criticality (FMECA). For each failure mode identified by the FMECA, a cause-and-effect analysis is used to further investigate their root causes. Next, the criticality of each failure mode is evaluated using the Risk Priority Number (RPN). Finally, each failure mode is subjected to an analysis to prioritize the sensor used to measure the physical quantity associated with the failure. This sensor prioritization is performed by considering not only the RPN but also the sensor’s utility in terms of failure detection efficiency and ease of installation. The results provide a robust foundation for the development of predictive maintenance strategies customized for HVDS equipment, thereby contributing to enhanced reliability and resilience of electrical power systems.

1. Introduction

The reliability of electrical infrastructure is defined as the probability that an electrical component or system performs its intended function over a given period and is of critical importance for ensuring secure energy supply and grid stability [1]. Recent research has increasingly focused on reliability, safety, and energy management, whether for evaluating energy potential [2], optimizing operational models [3], or managing battery life cycles [4]. Ensuring the dependable performance of power system components is now central to enabling efficient integration of renewable resources, extending the lifespan of electrical assets, and supporting predictive maintenance strategies [1]. This growing emphasis on reliability reflects the need to address both technical and operational challenges associated with modern, decentralized power systems. Within power systems, high-voltage disconnect switches (HVDS) play a crucial role by providing visible electrical isolation, thereby reducing risks to personnel and equipment. Despite the apparent simplicity of their function, HVDSs are required to operate reliably under harsh conditions, including extreme temperatures, high humidity, mechanical stress, and environmental exposure. Ensuring their long-term effectiveness therefore requires addressing a range of technical and environmental challenges. Several critical failure modes have been identified in the literature [5]. Mechanical failures may result from the wear of components such as seals, pivots, and springs, leading to incomplete operations and abnormal vibrations [6]. Electrical contacts can degrade due to oxidation, contamination, or arcing, causing increased contact resistance and localized overheating [5,7]. Control system malfunctions may arise from failures in motors, brakes, or electronic devices, often due to moisture ingress, component aging, or insufficient environmental protection [8]. Under short-circuit conditions, electrodynamic forces can induce significant mechanical stress on the switchgear structure [9], while switching operations generate electromagnetic disturbances that may affect nearby equipment [10]. These failures create substantial operational challenges, including reduced substation safety, unintended circuit energization, accelerated equipment degradation, and increased maintenance costs [5]. A single observable symptom may originate from multiple fault mechanisms. For instance, abnormal contact heating may be caused by misalignment, insufficient contact pressure, contamination, or material degradation [5,7]. Similarly, incomplete switching operations can result from motor failure, mechanical linkage jamming, ice accumulation, electronic control board malfunctions, or defective limit switches. To mitigate these risks, utilities have implemented various condition monitoring strategies based on operational data [8]. Traditional approaches rely on monitoring motor current, vibration, and position signals during switching operations to assess equipment health. Deviations in motor current profiles can indicate increased mechanical resistance or faults in moving parts and contact interfaces [11]. Vibration analysis provides valuable information on dynamic behavior, impacts, and resonance phenomena associated with mechanical degradation [12], while torque measurements are effective for detecting structural defects in components such as porcelain columns [6]. More recent developments include wireless monitoring systems combined with support vector machines for fault diagnosis [13], multi-domain vibration signal analysis to improve fault discrimination [12], and deep learning-based models for disconnector fault classification [14,15]. Although significant progress has been made in fault detection and classification, the translation of diagnostic results into actionable maintenance decisions remains a major challenge [16]. Fault identification alone does not enable maintenance teams to determine the urgency of intervention or to optimize resource allocation. Utilities require clear guidance on which failure modes pose the greatest risks to system safety and reliability, which preventive actions should be prioritized under budgetary constraints, and, within a predictive maintenance framework, which sensors should be deployed, where they should be installed, and how the collected data should be interpreted in relation to actual equipment degradation. This gap between fault diagnosis and maintenance decision-making is particularly critical given the large number of disconnectors operated by utilities and the persistent limitations on maintenance budgets.
Failure Mode, Effects, and Criticality Analysis (FMECA) provides a structured methodology to address these challenges by systematically identifying potential failure modes, analyzing their causes and consequences, and assessing their criticality [17]. FMECA evaluates failures based on three key criteria: severity of consequences, frequency of occurrence, and detectability. Originally developed by the U.S. Department of Defense in 1949, the methodology gained widespread recognition following its successful application by NASA during the Apollo program in the 1960s. Today, it is extensively applied in sectors such as nuclear power, aerospace, automotive engineering, and electrical energy systems [18]. FMECA is particularly well suited to HVDS due to the strong interdependencies between mechanical, electrical, thermal, and environmental factors.

1.1. Literature Review

Recent research has mainly relied on data-driven approaches using measurements acquired from installed monitoring systems. Zhang et al. (2025) [19] proposed mechanical fault diagnosis framework based on vibration signal analysis using Variational Mode Decomposition (VMD), a black-winged kite optimization algorithm, and a dual-channel deep learning architecture. Their method successfully identifies faults such as mechanism jamming, mechanism looseness, and three-phase asynchrony. Similarly, Zhu et al. (2025) [12] developed a vibration-based diagnosis method capable of distinguishing six operating conditions, including opening and closing jams as well as incomplete operations. These studies demonstrate the effectiveness of advanced signal processing and machine learning techniques for fault classification. However, they focus primarily on predefined mechanical faults and assume that appropriate sensors have already been selected and installed. Other studies have investigated the condition assessment of disconnect switches. Obarcanin et al. (2023) [20] proposed a health-index-based methodology for evaluating the operational condition of disconnectors using operational and environmental data. Likewise, Westerlund et al. (2016) [21] focused on contact deterioration through temperature-current regression models based on infrared temperature measurements. While these approaches provide valuable information regarding equipment condition, they do not quantify the relative criticality of failure modes and therefore do not establish priorities for maintenance actions or monitoring investments. Several authors have proposed sensor-rich monitoring platforms for intelligent substations. For example, Chen et al. (2022) [22] integrated torque sensors, angle encoders, microswitches, temperature sensors, humidity sensors, and altitude sensors to achieve real-time monitoring of disconnect switch operation conditions. Although such systems considerably improve observability, sensor deployment is generally predefined based on engineering experience rather than being derived from a systematic risk analysis. Only a limited number of studies have applied structured reliability-analysis methods. Suwanasri et al. (2021) [23] combined FMECA with Analytical Hierarchy Process (AHP) to assess risks associated with transmission network assets. Their work demonstrated the effectiveness of FMECA for maintenance prioritization. However, the analysis was conducted at the transmission-line level and did not address disconnect switches or the selection of monitoring technologies. Similarly, Qiu et al. (2015) [11] investigated mechanical faults such as loose screws and transmission mechanism jamming using vibration and current measurement, but their work focused on fault recognition rather than systematic failure-mode identification and ranking.
The review reveals a significant research gap. Existing studies predominantly focus on fault diagnosis, condition monitoring, or fault classification after monitoring data become available. Very few investigations address the upstream problem of identifying all relevant failure modes, quantifying their criticality, and determining which sensors should be prioritized to maximize predictive maintenance effectiveness. Furthermore, no comprehensive framework specifically dedicated to high-voltage disconnect switches has been found that explicitly links failure-mode criticality assessment to sensor selection. A comparative summary of the main contributions reported in the literature is presented in Table 1. This comparison highlights the lack of methodologies integrating failure-mode criticality analysis and sensor prioritization for predictive maintenance.

1.2. Research Gap and Contributions

Although significant progress has been achieved in fault diagnosis and condition monitoring of HVDS, existing studies mainly focus on fault detection after sensor deployment. A systematic methodology linking failure-mode identification, criticality assessment, and sensor prioritization remains largely unexplored. The present study addresses this gap by developing an FMECA-based framework that integrates failure analysis, criticality ranking, predictive maintenance requirement, and sensor selection into a unified decision-making process. To structure the identification of root causes and support systematic analysis, this study employs Ishikawa diagrams [24], which categorize potential causes into machinery, methods, materials, measurements, environment, and human factors, enabling comprehensive multidisciplinary evaluations [17,24].
Beyond failure classification, FMECA provides practical guidance for the selection of predictive maintenance sensors by linking each failure mode to appropriate monitoring measures [17]. By associating the Risk Priority Number (RPN) of each fault with two additional parameters: the usefulness of the sensor in terms of detection efficiency and the feasibility of its implementation considering cost, installation complexity, and environmental suitability, maintenance managers can make informed decisions regarding monitoring investments [25,26]. This structured approach is essential, as modern substations increasingly rely on diverse sensor technologies, and while additional sensors can improve diagnostic accuracy, they also increase costs, data-management complexity, and system vulnerability. In response to these needs, this study presents a comprehensive FMECA of a HVDS, systematically identifying and characterizing fifteen distinct failure modes. The criticality of each failure is assessed using the RPN framework, and root causes are analyzed through Ishikawa diagrams to support detailed cause–effect evaluation. For each failure mode, associated malfunctions, potential triggering factors, and numerical ratings for severity, occurrence probability, and detectability are defined in accordance with established FMECA guidelines [17,18,25]. This systematic analysis enables the development of a hierarchical sensor classification strategy for predictive maintenance, combining failure criticality with practical implementation considerations. The proposed multidimensional methodology provides a broader and more detailed assessment of the disconnector’s condition by accounting for parameters such as moisture, ice accumulation, and variations in contact pressure, which are frequently neglected despite their significant influence on failure development. The results provide a robust foundation for the development of predictive maintenance strategies tailored to high-voltage switching equipment, thereby contributing to enhanced reliability and resilience of electrical power systems.

2. Methodology

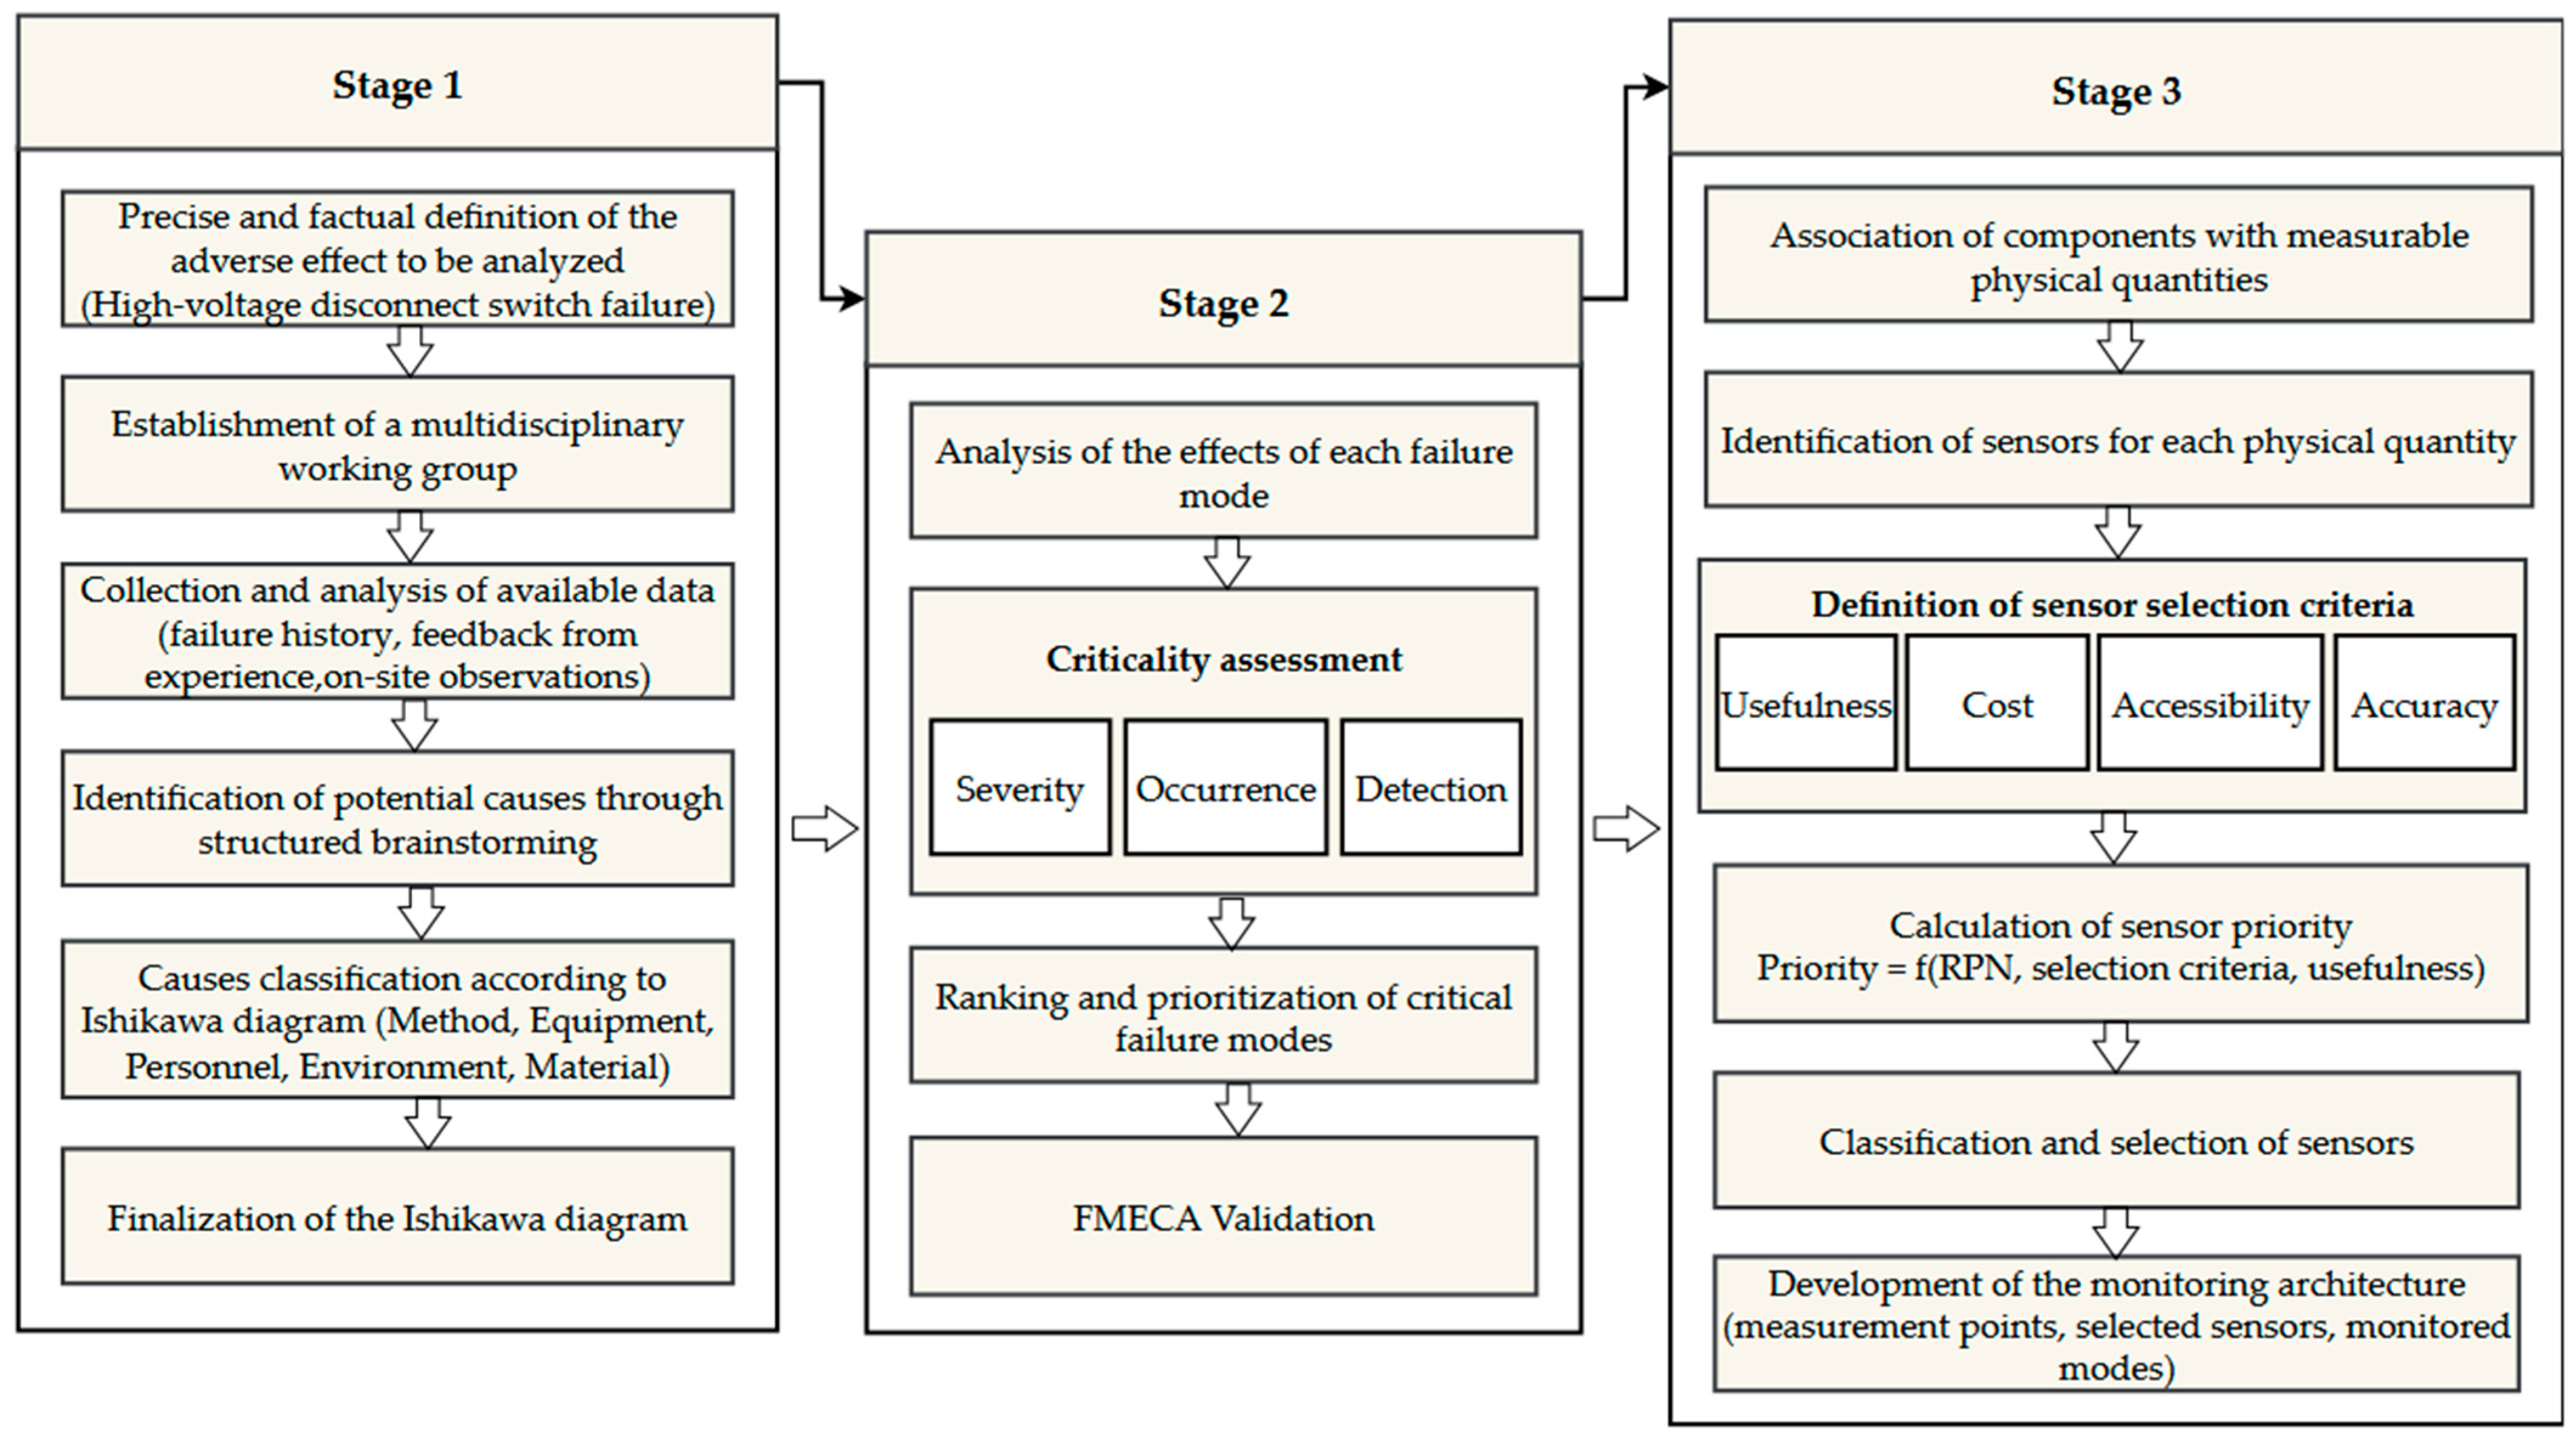
The methodology adopted in this study is structured into three main stages, as illustrated in the flowchart presented in Figure 1. The first stage involves the construction of the Ishikawa diagram [24,27,28,29,30], during which the problem under investigation is precisely defined and the potential causes of disconnector failures are identified and structured. The results of this analysis are subsequently utilized in the second stage, which is dedicated to the FMECA, to assess and prioritize the associated risks. Finally, the third stage aims to associate each prioritized failure mode with the corresponding measurable physical quantities, thereby enabling the selection and prioritization of sensors within a predictive maintenance framework for the disconnector. The different stages of this methodology are detailed in the following sections.

2.1. Construction of the Ishikawa Diagram

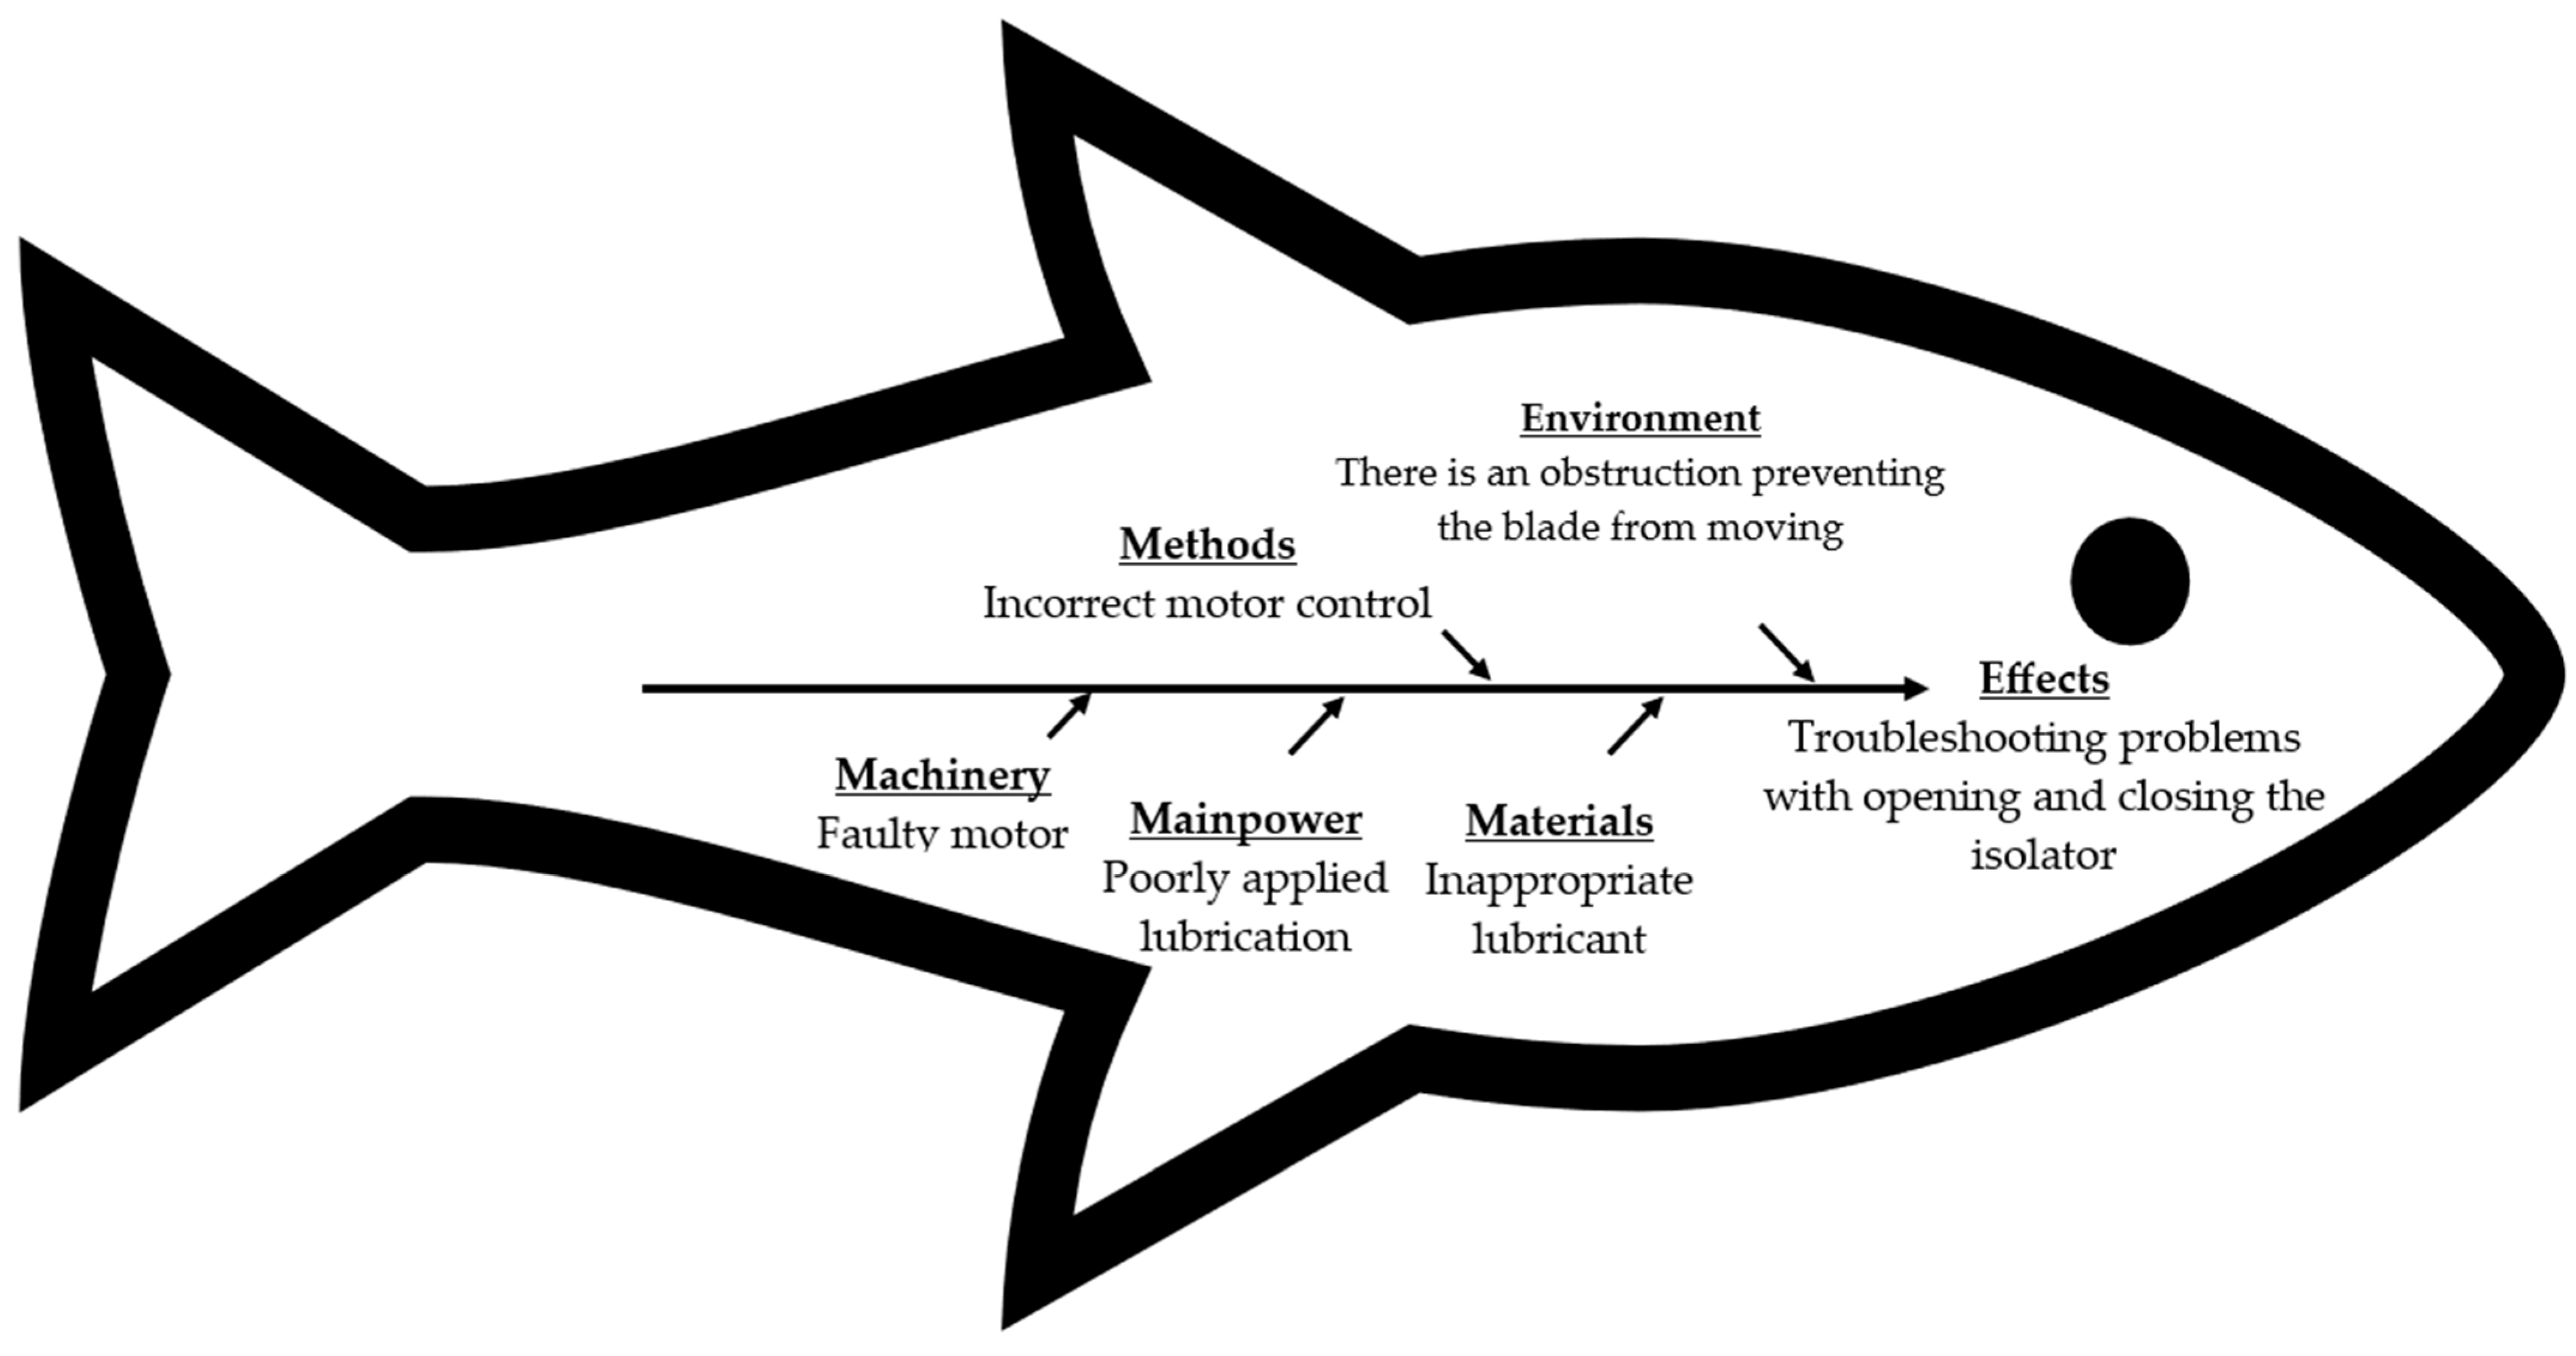
The construction of the Ishikawa diagram (Figure 2), also known as the cause-and-effect diagram [24,27,28,29,30], aims to exhaustively identify all potential causes that may lead to the failure modes observed in HVDS. This step constitutes the foundation of the FMECA and enables a structured examination of the technical, organizational, and environmental factors influencing the reliability of the disconnector. The first phase consisted of the precise definition of the undesired effect under investigation, which, in the context of this study, corresponds to a disconnector operating failure, whether of mechanical or electrical origin, or related to an insulation defect. A multidisciplinary expert panel was established to ensure a comprehensive understanding of disconnector operation and its potential failure mechanisms. The panel consisted of two engineers, two maintenance specialists with experience in the operation, inspection, and maintenance of high-voltage disconnectors and three researchers. The FMECA was developed using multiple sources of information, including historical intervention and maintenance records provided by an industrial partner involved in the project, documented failure cases, operational feedback from field personnel, and direct on-site observations. These records, accumulated since the company’s establishment in 2008, include several disconnector failure events and degradation cases that were analyzed to support the identification and assessment of failure modes. The occurrence ratings were assigned through expert consensus based on the frequency and recurrence of failure modes observed in these historical records, combined with operational experience accumulated over years of service. Because a complete statistical reliability database covering all disconnectors was not available, the occurrence scores should be interpreted as semi-quantitative estimates derived from expert judgment informed by historical operational evidence rather than as purely statistical probabilities. For each identified failure, the potential causes were classified according to the classical Ishikawa diagram categories: failure indicator, material, equipment, manpower, environment, and method. This classification improves the readability of the analysis and ensures coverage of all dimensions likely to affect disconnector reliability. The final Ishikawa diagram is developed following several brainstorming sessions, particularly aimed at identifying causes that are rarely documented but well known by field operators, thereby enhancing the relevance and completeness of the analysis. This step enabled a systematic structuring and comprehensive identification of the potential causes of disconnector failures.

2.2. Quantification, Prioritization, and Treatment of Causes Using FMECA for Predictive Maintenance

The FMECA represents the core stage of the proposed methodology. It transforms the causes identified through the Ishikawa diagram into structured failure modes that are evaluated and prioritized according to their impact on disconnector reliability. The primary objective is to obtain a quantitative and prioritized risk assessment, which is essential for effectively guiding the predictive maintenance strategy and sensor selection. Initially, the HVDS is decomposed into subsystems, each associated with an expected function. This functional decomposition allows for the precise definition of potential failure modes. Each failure mode is then linked to the causes identified in the previous step. According to the IEC 60812:2006-01 standard [31], the criticality of a failure mode is evaluated using the Risk Priority Number (RPN), defined as:
RPN   =   S   ×   O   ×   D
Parameter S (Severity) represents the seriousness of the failure effects on the system or the user. It is a dimensionless indicator that evaluates the intensity of the failure impact. The severity criteria defined in IEC 60812, widely applied in industries such as the automotive sector, are adopted in this study (Table 2). In cases where failure modes have identical RPN values, those with the highest S value are treated as a priority [32].
Parameter O (Occurrence) corresponds to the probability of a failure mode occurring over a specified period. It is expressed as a ranking value rather than an actual probability. Table 3 presents the occurrence levels according to the estimated failure frequency.
Parameter D (Detection) represents the ability to detect a failure before it affects the system or the user. It is generally ranked inversely to severity and occurrence: the higher the D value, the lower the likelihood of detection, resulting in a higher RPN. Table 4 presents the detection ranking scale used in accordance with IEC 60812. The final phase of this step consists of ranking the failure modes in descending order of criticality to identify the priority failures to be addressed.

2.3. Selection and Prioritization of Sensors for Predictive Maintenance

Following the objective prioritization of the most critical failure modes, the next step consists of selecting and prioritizing the sensors required for predictive maintenance. For each prioritized failure mode, the corresponding components are first mapped to the measurable physical quantities that reflect their degradation mechanisms, such as temperature, vibration, current, or mechanical position. Once these physical indicators are identified, suitable sensors capable of monitoring them are selected. The prioritization of sensor installation within the predictive maintenance framework is then determined by evaluating some criteria, including the RPN value of the associated failure mode, sensor selection constraints, and the expected usefulness of each sensor in supporting accurate and timely fault prediction. This ensures that sensing resources are allocated to the most influential parameters and that monitoring efforts are aligned with the system’s reliability needs. The relevance of such a structured prioritization approach is supported by numerous studies in the reliability and maintenance literature, which highlight the benefits of using composite priority indices that combine normalized RPN values with weighting or decision-based coefficients. For example, Braglia’s multi-attribute failure mode analysis demonstrated that normalizing risk indicators and applying weighting factors yields a more representative priority score, thereby improving the limitations of traditional RPN-based ranking [33]. Similarly, Huang et al. 2025 [34] proposed an enhanced FMEA risk-assessment method that integrates TOPSIS, multi-perspective weighting, while Anes et al. (2024) [35] showed that combining ROC-based weighting of FMEA criteria with the CoCoSo multi-criteria ranking method significantly improves the identification of critical risks. Their results confirm that utility-based and decision-based coefficients strengthen the discrimination of failure modes compared to conventional FMEA. These contributions collectively justify the use of a combined prioritization formula of the form:
Priority = R P N i R P M m e a n × α × β
where α and β are the utility and choice coefficients, respectively. For the utility criterion, weighting coefficients of 1, 1.5, and 1.75 are chosen arbitrarily in this scenario, depending on whether the sensors are associated with one, two, or three components, respectively. For the choice criteria, a weighting coefficient of 1 is assigned when the sensor is affordable, easily accessible, and capable of providing accurate measurements. If one of these conditions is not met, the weighting is reduced to 0.75; if two conditions are not satisfied, a coefficient of 0.5 is applied. Finally, when none of the conditions are fulfilled, a minimum weight of 0.25 is used. These coefficients can be calibrated according to individual needs. The criteria for selecting the values of these coefficients are defined in Table 5.
Based on the methodology presented above, the results related to the construction of the Ishikawa diagram, the identification of failure modes and their criticality, as well as the selection and prioritization of sensors were obtained and are presented in the following section.

3. Results and Discussion

In this section, fifteen failure modes of a HVDS have been identified and characterized, with a detailed description of the observed effects and the associated potential causes for each. To assess their relative impact on equipment reliability, a classification was established based on the Risk Priority Number (RPN). This approach enables the ranking of failures according to their criticality level and, consequently, the prioritization of maintenance actions to be undertaken. Specifically, failure modes with an RPN greater than or equal to 80 are considered to present a high risk. Conversely, an RPN between 50 and 79 corresponds to a moderate risk, while an RPN below 50 indicates a low risk. This categorization represents a key step in guiding maintenance strategies and optimizing resource management. The failure modes belonging to each criticality class are analyzed in detail in the following sections, to highlight their occurrence mechanisms, functional consequences, and potential impacts on system performance. Furthermore, an analysis of the sensors deemed relevant for implementing a predictive maintenance strategy is also presented. This approach aims to enhance the monitoring of critical components, anticipate potential failures, and ultimately improve the overall availability and reliability of the high-voltage disconnector.

3.1. Detailed Analysis of Failure Modes by Criticality Level

The FMECA conducted on a HVDS enabled the identification of several failure modes exhibiting varying levels of criticality. Each mode was evaluated in terms of severity, occurrence frequency, and detectability, thereby allowing the calculation of the RPN. The results presented below highlight the most critical failures while emphasizing the relevant monitoring means for the implementation of a predictive maintenance strategy.

3.1.1. High-Critical Failure Modes

The most critical failure modes are not limited to mechanical causes; they may also result from electrical failures or exposure to harsh environmental conditions. The details of these different failure modes are presented below with their causes and effects summarized in Table 6.
  • Silver-plated copper contacts
Silver-plated copper contacts ensure current conduction during the closing of the disconnect switch and maintain its electrical insulation when open. The silver coating provides low contact resistance and high resistance to aging, heat, and oxidation. However, several cases of contact burning have been reported, generally caused by poor contact between the switch jaws. This anomaly, which can render the device inoperative, may result from various factors such as improper leveling during installation, excessive spring stiffness, incomplete operating maneuvers, or contact misalignment. Although its occurrence is moderate (5/10), the high severity (9/10) and medium detectability (5/10) lead to a maximum RPN of 225, indicating a very high level of criticality.
  • Sensor Failure
Sensors play a key role in monitoring the operation of the disconnect switch by measuring essential physical quantities. Incorrect reading can lead to inappropriate control actions, compromising the operational safety of the installation. Such failure may arise from poor sensor quality, installation errors, or adverse environmental conditions. With an RPN of 135, it is classified among high-criticality failures and highlights the need for regular verification and systematic calibration of sensors used in predictive maintenance.
  • Pivot seizure
The pivot is a key mechanical component ensuring the rotational linkage between the fixed and movable parts of the disconnect switch. Its seizure may result from water or contaminant ingress, ice formation, oxidation phenomena, or seal failure. Although this failure is infrequent (2/10), its high severity (9/10) and medium detectability yield an RPN of 90, representing a major mechanical risk likely to impair the device’s maneuverability. Adequate lubrication, combined with enhanced protection against moisture ingress, is recommended to reduce the likelihood of this failure mode.
  • Motorized enclosed and heating element
The motorized enclosure houses the control and actuation components of the disconnect switch. Despite being designed to withstand harsh environmental conditions, it remains vulnerable to water ingress, seal degradation, or improper closure. This failure, characterized by moderate severity (6/10), low occurrence (3/10), and limited detectability (6/10), results in an RPN of 108. To mitigate its effects, the enclosure is equipped with a heating element and thermostat to maintain stable internal temperature and humidity. However, in the event of heating element failure, condensation may occur, leading to premature corrosion of internal electronic components. The analyses conducted highlight the diversity of failure modes that may affect a HVDS, as well as the complexity of the interactions between their causes and effects. To structure these results and facilitate their interpretation, two summary tables are presented below. Table 7 presents the quantitative assessment of the risk associated with each failure mode according to the FMECA method. For each failure, it compiles the values assigned to occurrence frequency, detectability, and severity, along with the calculation of the RPN. This table serves as a decision-support tool, enabling the prioritization of risks, the identification of the most critical failures, and the ranking of corrective or preventive actions to be implemented.
In this synthesis, only failure modes with a high RPN (≥ 80) have been retained, due to their potential impact on the reliability and safety of the disconnect switch. These failures, considered as priority cases, will be subject to enhanced monitoring as part of a predictive maintenance strategy.

3.1.2. Moderate Critical Failures

Following the analysis of moderate risk failure modes, several additional failures were identified as exhibiting moderate criticality. Although their impact is lower compared to priority failures, their occurrence frequency and potential for disruption justify particular attention within the framework of a preventive and predictive maintenance strategy.
  • Compensation spring, linkage and printed circuit board (PCB)
The compensation spring is designed to reduce the effort required to operate the disconnect switch. Its weakening caused by condensation, corrosion, or excessive stiffness can lead to breakage. Such a failure prevents proper blade compensation, rendering the switch inoperative. A forced operating attempt may additionally cause damage to the gearbox. Although less frequent than high RPN failures, this situation represents a significant risk to the overall mechanical integrity of the device. The mechanical and electronic control system is also at moderate risk of failure. A faulty printed circuit board (PCB) design, water ingress into the housing, an inadequate power supply or unauthorized external interference can disrupt the operation of the disconnect switch. The electronic boards may overheat or short-circuit. The presence of mechanical obstructions or ice on the pivots may damage the linkage and restrict the movement of the blades.
  • Male and female arc horns
Poor contact between the arc horns, or the complete deterioration of one of them, leads to the formation of cavities on the copper contacts under the effect of the electric arc. This degradation gradually reduces the service life of the contacts. Ultimately, this can lead to more serious failures associated with high RPN values. Regular monitoring and maintenance of these components are therefore essential to limit serious faults. Attention is also paid to failure modes with an RPN between 50 and 79, as these can compromise the reliability of the disconnector if not properly anticipated. Table 8 compiles the information derived from the Ishikawa diagram, linking each relevant component to its main function, the identified failure mode, the observed effects, and the probable causes.
Table 9 presents the quantitative assessment of risk for each moderate criticality failure, based on the FMECA criteria. It includes the values assigned to occurrence frequency, detectability, and severity, as well as the calculated RPN.

3.1.3. Low Critical Failures (RPN < 50)

In addition to the high and moderate criticality failures, several failure modes have been identified as presenting a low risk, characterized by a RPN below 50. Although their impact on the overall reliability of the disconnect switch is limited, their monitoring remains necessary to prevent progressive degradation or cumulative effects that could eventually lead to more severe failures.
  • Electric Motor and Associated Control System
The motor actuator may experience malfunctions due to power supply loss, excessive inrush current, or short-circuiting between positive and negative terminals. These anomalies can cause the melting of protective fuses, thereby compromising the operation of the drive system.
  • Brakes
The motor’s rotation is stopped by a braking system that may seize in case of insufficient clearance between pads or corrosion of mechanical components. Such blockage can prevent the motor from stopping properly, affecting the accuracy of the disconnect switch operations.
  • Limit Switches
Limit switches play a crucial role in motor control by signaling to the control board the end of the operating stroke. A fault in these switches may cause incorrect stopping or even overtravel. This malfunction, combined with improper adjustment of the thermal relay, can lead to mechanical overload and damage to the gearbox.
  • Ground Leakage
Insulation faults in the system can result in current leakage to ground, potentially causing unintentional tripping of adjacent circuit breakers. Although this type of failure is generally detectable and infrequent, it can disrupt the overall operation of the installation. To structure the results associated with this category and facilitate their interpretation, two summary tables are presented below. Table 10 compiles information derived from the Ishikawa diagram, linking each relevant component to its main function, the identified failure mode, the observed effects, and the probable causes. This approach provides a systemic perspective of failure mechanisms, even for low-criticality cases.
Table 11 presents the quantitative risk assessment for each low failure according to the FMECA criteria. It includes the values assigned to occurrence frequency, detectability, and severity, as well as the calculated RPN. This table complements the overall risk hierarchy and identifies key areas of concern to be addressed in maintenance planning.
Following the identification and assessment of the failure modes of a HVDS using the Ishikawa diagram and FMECA, it is essential to examine the monitoring means that could enable early detection of such failures. In this context, the following section focuses on the analysis of sensors that could be integrated into the system as part of a predictive maintenance strategy.

3.2. Sensor-Based Monitoring for Predictive Maintenance of the High-Voltage Disconnect Switch

The failure modes of a HVDS together with their causes and effects have been identified and analyzed in the previous section; this part focuses on the selection and prioritization of sensors to be installed for the purpose of predictive maintenance. In accordance with the adopted methodology, the installation priority of each sensor is determined based on the RPN, weighted by the utility coefficient which reflects the sensor’s relevance for fault detection and the selection coefficient, which accounts for technical and economic constraints. The analysis of these parameters made it possible to classify the sensors according to their priority index. The results indicate that the current sensors exhibit a major level of criticality, with a priority approximately four times higher than the average. Its installation is therefore strongly recommended. For example, current sensors can be installed to measure leakage current, line current, or the current of the DC motor powering the HVDS. In Table 12, measuring the current of the DC motor powering the HVDS takes priority over measuring leakage current. Indeed, monitoring the motor current provides valuable insights into the overall system condition, particularly regarding the behavior of the motor, the copper contacts, and the pivot mechanism. An abnormally high current may, for instance, reveal a pivot blockage or a poor contact at the jaws. Moreover, the measurement of temperature and humidity, both inside and outside the motorized enclosure, is of particular importance. These sensors make it possible to verify the proper operation of the heating element inside the enclosure and to ensure that the electronic components operate under their optimal temperature and humidity conditions. A deviation in these parameters could indicate a malfunction of the heating system or premature aging of internal components. In addition, the installation of infrared temperature sensors directed toward the disconnector jaws provides an effective means of detecting abnormal temperature rises. Such increases are often associated with excessive contact pressure or progressive degradation of contact surfaces, which are early indicators of overheating and material aging in the conductive parts.
In cold or northern regions, where winter conditions are particularly severe, the presence of a frost sensor becomes essential. This sensor, whose priority index is approximately twice the average, enables the detection of ice formation on the jaws. This phenomenon can explain current peaks observed during the opening of the disconnector, caused by the increased mechanical resistance due to frost accumulation. The frost sensor thus complements the current sensor, contributing to a more accurate interpretation of electrical anomalies. Vibration and acoustic analysis also represent relevant approaches. Monitoring the vibration or acoustic signals during the opening and closing operations of the disconnector allows the assessment of the condition of the compensation spring and other mechanical components. Variations in the vibration or sound spectrum can indicate misalignment, spring relaxation, or mechanical wear. Finally, other sensors complete the supervision of the disconnector. The voltage sensor provides information on the presence and stability of the supply voltage, thereby helping to detect control anomalies. The position sensor, on the other hand, confirms the exact state of the disconnector (open, closed, or intermediate), ensuring both operational safety and reliability of control signals. Table 12 shows the different sensors with their priority level.

3.3. Robustness and Sensitivity Analysis of Sensor Prioritization Coefficients

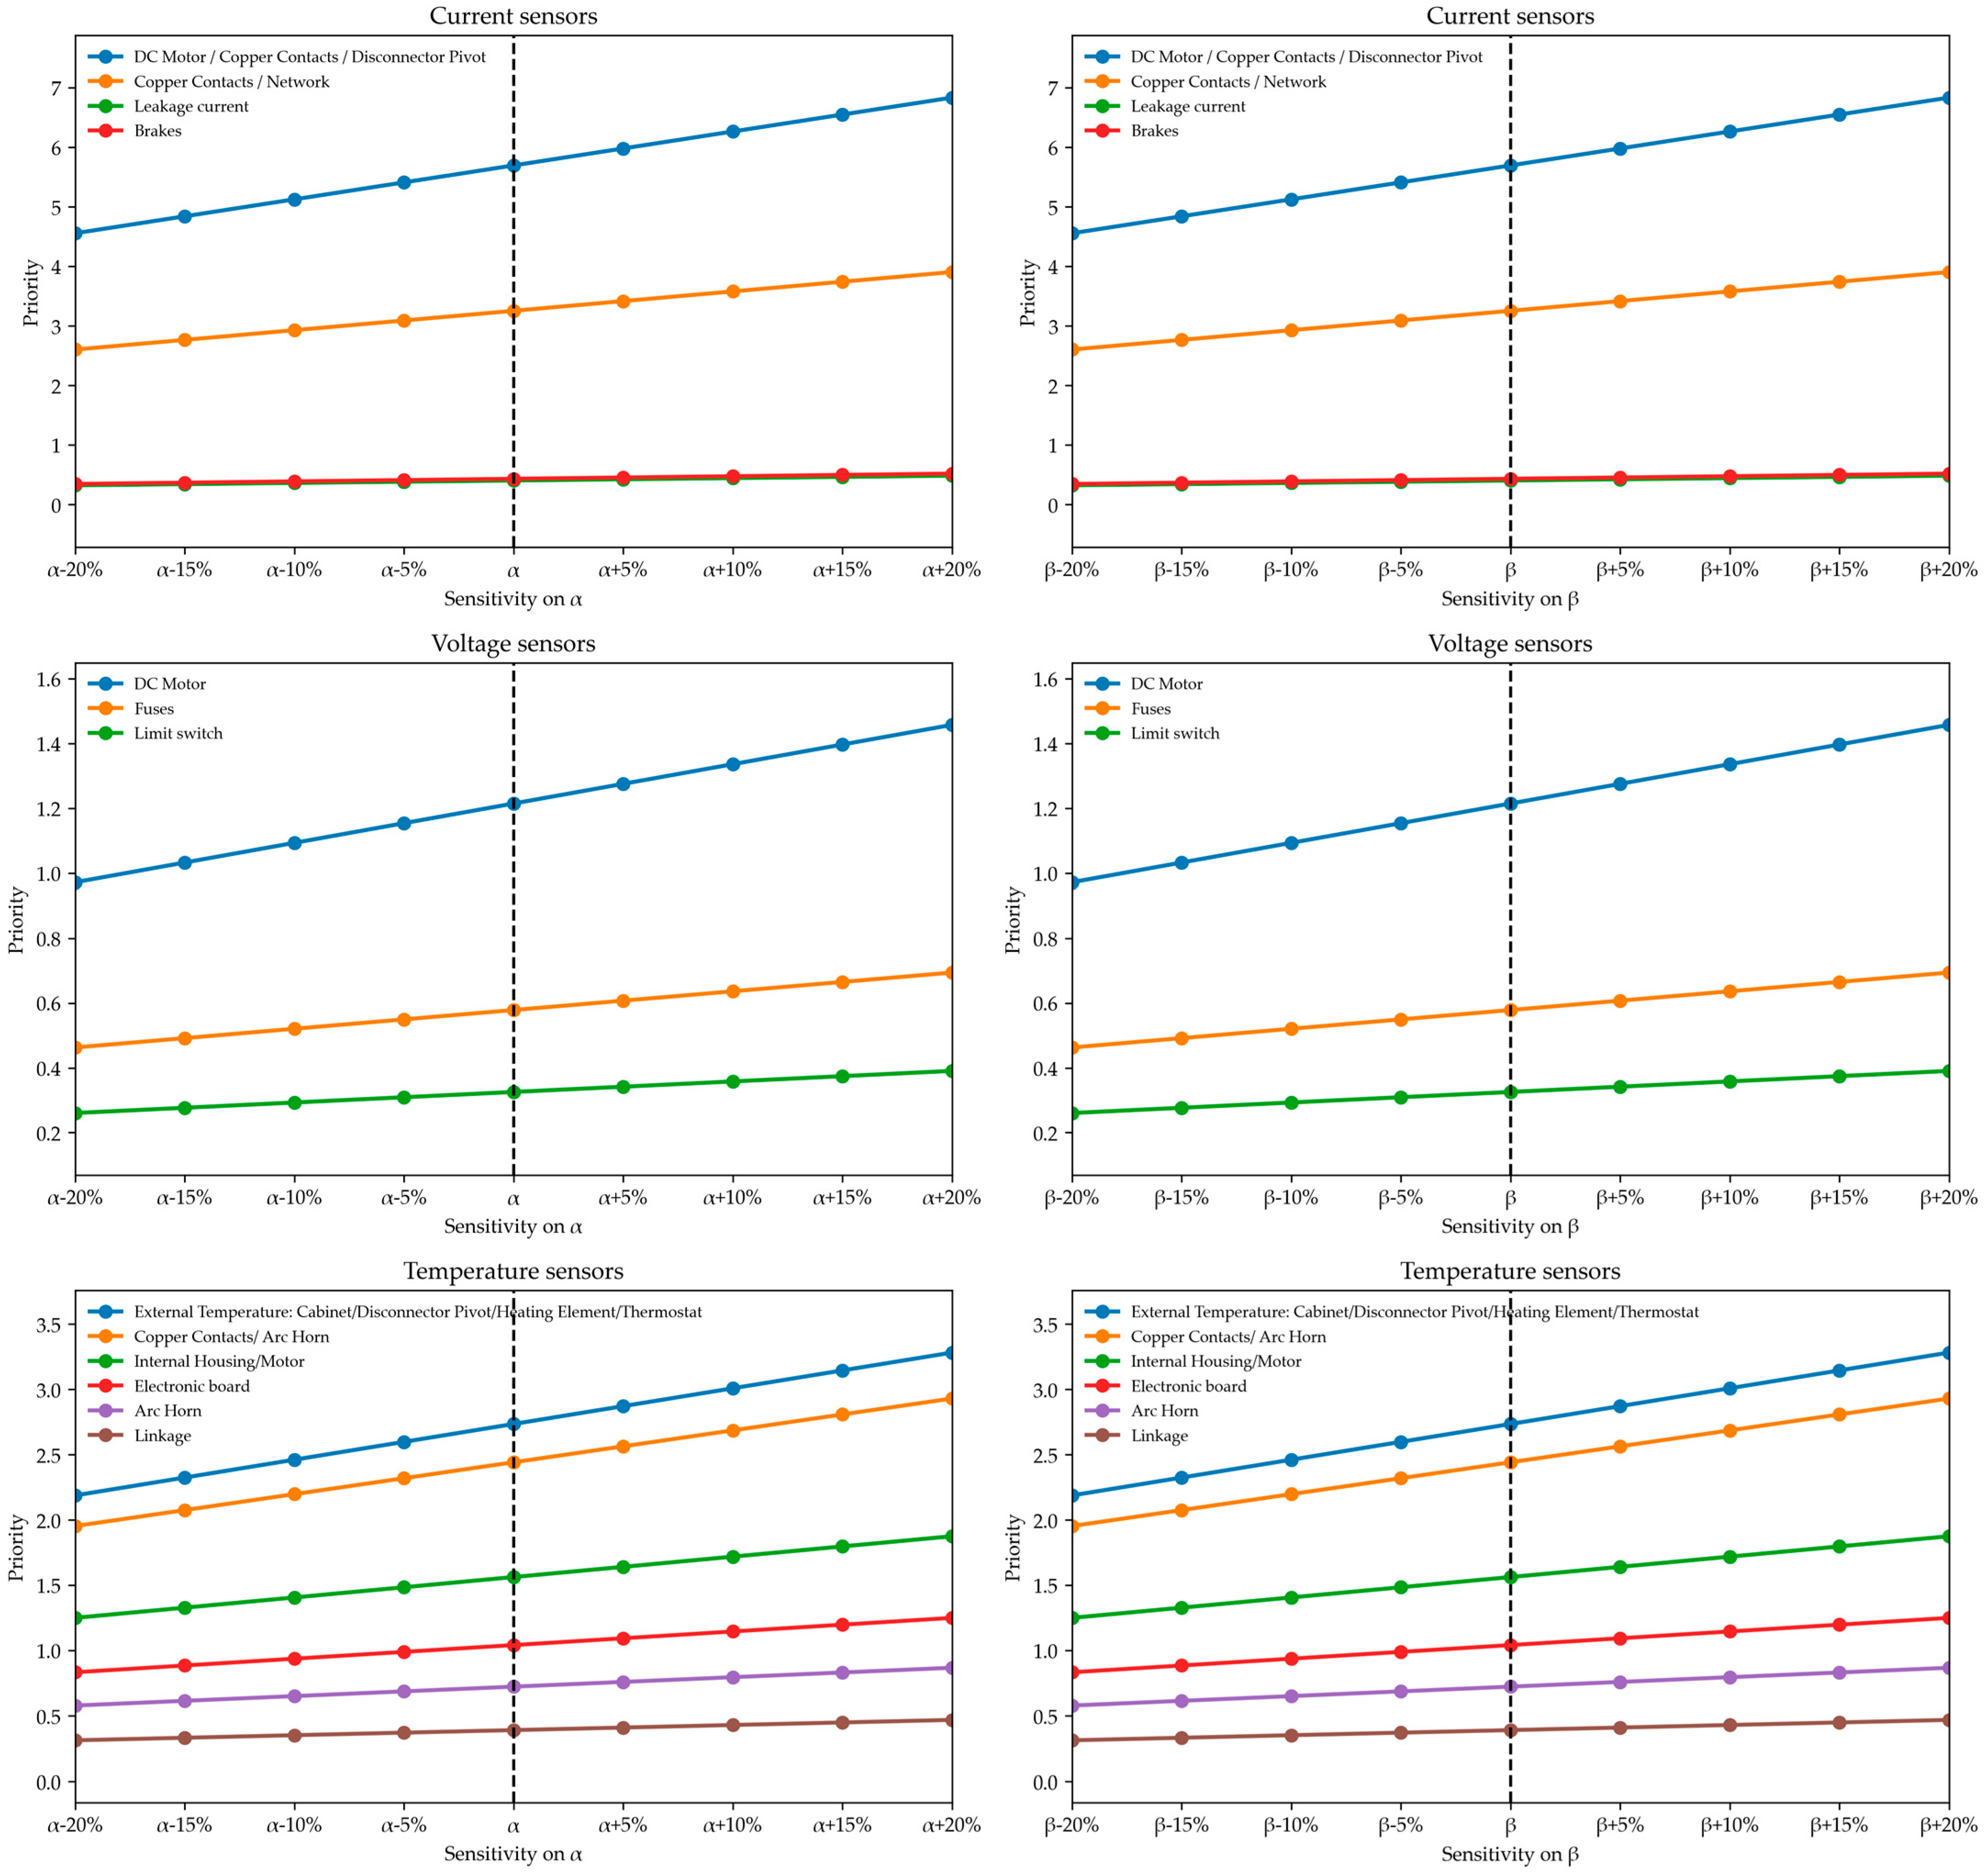
A sensitivity analysis was conducted on the sensor prioritization coefficients α and β to assess the robustness of the proposed model. Each parameter varied within the range −20% to +20% around its nominal value. The obtained results show that the output curves remain well separated and do not intersect, indicating a stable and monotonic influence of α on the model output. Similar behavior was observed for β , confirming that the proposed formulation is not sensitive to small variations in these coefficients. Therefore, the selected value of α and β are justified as they ensure consistent system behavior without affecting the ranking structure of sensor prioritization. Figure 3 illustrates this phenomenon for current, voltage, and temperature sensors. For conciseness, only these three representative sensors are shown in the figure. However, the same sensitivity analysis was performed on all other sensors, and consistent trends were observed across all cases.

4. Conclusions

The analysis of FMECA reveals that contact-related failures exhibit the highest RPN values, confirming that both electrical conduction and mechanical stability are critical aspects of the high-voltage disconnector’s reliability. These results highlight that deterioration of contact surfaces, loss of alignment, or excessive mechanical stress at the jaws are among the most significant factors contributing to functional degradation. Consequently, improving contact integrity and monitoring parameters related to electrical and mechanical performance appear essential for preventing major failures. Building upon these findings, the ranking of sensors demonstrates a clear consistency with the identified dominant failure modes. In particular, the current sensor emerges as the most critical device, reflecting variations associated with contact resistance, mechanical blockage, or motor overload. This coherence between the FMECA outcomes and the sensor prioritization confirms the relevance of the adopted methodology, where the combination of the RPN, utility, and selection coefficients provides a robust basis for guiding sensor implementation strategies. Furthermore, this alignment supports the notion that monitoring the motor current can serve as a reliable proxy for assessing both electrical and mechanical health conditions within the disconnector. The integration of the identified sensors therefore represents a significant step toward the deployment of a monitoring strategy. By enabling continuous monitoring of key parameters such as current, temperature, humidity, and vibration, the system can detect early signs of degradation and schedule interventions only when necessary. This predictive approach minimizes unnecessary maintenance actions, reduces downtime, and ultimately enhances the availability and operational reliability of the high-voltage disconnector. In addition, the correlation between multi-domain signals (electrical, thermal, and mechanical) opens new possibilities for multi-sensor data fusion and advanced diagnostics. It is also noteworthy that, while previous HVDS fault detection has focused on electrical signatures, our FMECA-based sensor prioritization explicitly weights mechanical and environmental failure modes, which are underrepresented in existing monitoring strategies. This multidimensional framework offers a more comprehensive understanding of the disconnector’s condition by considering factors such as humidity, frost formation, or contact pressure variations, which are often overlooked but play a crucial role in failure propagation. Such integration extends the scope of predictive maintenance beyond conventional electrical monitoring and aligns with the current trends in smart grid asset management and industrial Internet of Things (IIoT)-based diagnostics.

5. Study Limits and Future Work

Although this study has successfully identified failures and prioritized critical sensors for the predictive maintenance of HVDS, the weighting of sensors using utility and selection coefficients remains partially subjective. Since it relies on expert judgment and literature data, these coefficients may need to be adapted to specific industrial environment. This limitation, however, provide a clear pathway for future work. A first step involves experimental validation of sensor priorities and their effectiveness in early fault detection, both on prototypes and in service. Furthermore, integrating multi-sensor data into a predictive maintenance framework using artificial intelligence represents a crucial advancement. By combining electrical, mechanical, and environmental signals through data-fusion techniques and machine learning algorithms, the predictive models can improve fault diagnosis accuracy and anticipate failures more reliably. Finally, future studies could expand the range of monitored parameters, adapt predictive models to different types of disconnectors and operational conditions, and develop optimized condition-based maintenance strategies, ultimately reducing unnecessary interventions, enhancing equipment availability, and improving the safety of high-voltage operations.

Author Contributions

Conceptualization, A.A.; Methodology, A.F. and A.A.; Validation, A.A. and K.Z.; Formal analysis, A.A. and K.Z.; Investigation, A.A.; Resources, M.A. and K.Z.; Data curation, A.A. and K.Z.; Writing—original draft, A.F. and M.A.; Writing—review & editing, A.F. and M.A.; Visualization, A.F. and M.A.; Supervision, A.A. and K.Z.; Project administration, K.Z. All authors have read and agreed to the published version of the manuscript.

Funding

This research was funded by the Natural Sciences and Engineering Research Council of Canada (NSERC, N°: CARD3 571168-21), and InnovÉÉ (N°: PRIA4-2102). The APC was funded by NSERC and InnovÉÉ.

Data Availability Statement

The data presented in this study are available on request from the corresponding author due to privacy restrictions.

Acknowledgments

The authors would like to sincerely acknowledge the valuable support, collaboration, and technical contributions and insightful discussions throughout the project of Patrick Lalongé (Vice-President, MindCore Technologies), Lahcen Mejjad (Smart-Grid R&D Manager), Samuel Asselin and Hicham Gouabi (Electrical R&D Designer). The authors also wish to thank Renaud Grenier-Poulin and Patrick Brouillette for their participation and support in various phases of the project. Their involvement is greatly appreciated.

Conflicts of Interest

The authors declare no conflicts of interest. The funders had no role in the design of the study; in the collection, analyses, or interpretation of data; in the writing of the manuscript; or in the decision to publish the results.

Abbreviations

The following abbreviations are used in this manuscript:
AHPAnalytical Hierarchy Process
BKABlack-Winged Kite Algorithm
CoCoSoCombined Compromise Solution
FMECAFailure Modes, Effects, and Criticality Analysis
FMEAFailure Modes and Effects Analysis
GRUGated Recurrent Unit
PSOParticle Swarm Optimization
ROCRank Order Centroid
RPNRisk Priority Number
TOPSISTechnique for Order Performance by Similarity to Ideal Solution
VMDVariational Mode Decomposition

References

  1. Ebeling, C.E. An Introduction to Reliability and Maintainability Engineering, 3rd ed.; Waveland Press: Long Grove, IL, USA, 2019; Available online: https://books.google.ca/books?id=rh2WDwAAQBAJ (accessed on 7 May 2026).
  2. Fousseni, A.; Kodjo, M.K.; Adjanoh, A.A. Static and Dynamic Evaluation of Wind Potential in the Kara Region of Togo Using Artificial Neural Networks. In TH Wildau Engineering and Natural Sciences Proceedings; University of Kara: Kara, Togo, 2021; Volume 1. [Google Scholar] [CrossRef] [Scilit]
  3. Tchakpedeou, A.-B.; Lare, Y.; Napo, K.; Fousseni, A. An Improved Levenberg–Marquardt Approach with a New Reduced Form for the Identification of Parameters of the One-Diode Photovoltaic Model. J. Sol. Energy Eng. 2022, 144, 041005. [Google Scholar] [CrossRef] [Scilit]
  4. Fousseni, A.; Ziane, K.; Otis, M.J.-D. Battery internal resistance and state of health estimation based on modified Van Genuchten-Gupta model compared to a feedforward neural network. In Proceedings of the 2024 IEEE Vehicle Power and Propulsion Conference (VPPC), Washington, DC, USA, 7–10 October 2024. [Google Scholar] [CrossRef] [Scilit]
  5. Zhang, N.; Yang, G.F.; Long, L.Q.; Liu, J.Q.; Yan, Y.; Liu, B.Y.; Shi, C.L.; Quan, K.X. A review of fault diagnosis techniques for high-voltage disconnect switches. IET Conf. Proc. 2023, 2023, 250–256. [Google Scholar] [CrossRef] [Scilit]
  6. Zhou, T.; Ruan, J.; Yang, Z.; Liu, Y. Mechanical defect detection of porcelain column high-voltage disconnector based on operating torque. Int. J. Adv. Robot. Syst. 2020, 17, 1729881419900845. [Google Scholar] [CrossRef] [Scilit]
  7. Song, Y.; Liu, B.; Wang, Q.; Yuan, P. GW46 high voltage isolation switch solid-heat coupling simulation analysis and experimental study. E3S Web Conf. 2020, 179, 01004. [Google Scholar] [CrossRef] [Scilit]
  8. Shi, J.; Xu, T.; Yang, S.; Li, B. Design and realization of high voltage disconnector condition monitoring system. J. Phys. Conf. Ser. 2017, 887, 012011. [Google Scholar] [CrossRef] [Scilit]
  9. Szulborski, M.; Łapczyński, S.; Kolimas, Ł.; Kozarek, Ł.; Cichecki, H.; Sul, P.; Owsiński, M.; Berowski, P.; Baczyński, D.; Wesołowski, M. Examination of Electrodynamic Forces in High Voltage Disconnector Related to the Short-Circuit Current Using the Digital Twin Technology. IEEE Access 2024, 12, 75701–75717. [Google Scholar] [CrossRef] [Scilit]
  10. Cheng, L.; He, Z.; Liu, J.; Yang, Z.; Chen, X.; Zhang, Y.; Wang, S.; Si, J. Research on Radiated Disturbance to Secondary Cable Caused by Disconnector Switching Operation. Energies 2022, 15, 1849. [Google Scholar] [CrossRef] [Scilit]
  11. Qiu, Z.; Ruan, J.; Huang, D.; Yao, W.; Zhang, E.; Wei, X. Mechanical fault diagnosis of high voltage disconnector based on motor current detection. Proc. Chin. Soc. Electr. Eng. 2015, 35, 3459–3466. [Google Scholar] [CrossRef]
  12. Zhu, S.; Chen, P.; Li, X.; Deng, Q.; Yan, F. Mechanical Fault Diagnosis of High-Voltage Disconnectors via Multi-Domain Energy Features of Vibration Signals in Power Systems. Processes 2025, 13, 3254. [Google Scholar] [CrossRef] [Scilit]
  13. Zhou, T.; Ruan, J.; Liu, Y.; Peng, S.; Wang, B. Defect Diagnosis of Disconnector Based on Wireless Communication and Support Vector Machine. IEEE Access 2020, 8, 30198–30209. [Google Scholar] [CrossRef] [Scilit]
  14. Xie, Q.; Tang, H.; Liu, B.; Li, H.; Wang, Z.; Dang, J. Disconnector Fault Diagnosis Based on Multi-Granularity Contrast Learning. Processes 2023, 11, 2981. [Google Scholar] [CrossRef] [Scilit]
  15. Zhu, S.; Chen, P.; Li, X.; Deng, Q.; Liao, Y.; Ruan, J. MSRDSN: A Novel Deep Learning Model for Fault Diagnosis of High-Voltage Disconnectors. Electronics 2025, 14, 4151. [Google Scholar] [CrossRef] [Scilit]
  16. McCalley, J.D. Automated Integration of Condition Monitoring with an Optimized Maintenance Scheduler for Circuit Breakers and Power Transformers; Iowa State University: Ames, IA, USA, 2006. [Google Scholar]
  17. Stamatis, D.H. Failure Mode Effects Analysis: FMEA from Theory to Execution, 2nd ed.; American Society for Quality: Milwaukee, WI, USA, 2003. [Google Scholar]
  18. Singh, J.; Singh, S.; Singh, A. Distribution transformer failure modes, effects and criticality analysis (FMECA). Eng. Fail. Anal. 2019, 99, 180–191. [Google Scholar] [CrossRef] [Scilit]
  19. Zhang, C.; Ma, H.; Hu, T. Mechanical Fault Diagnosis Method of Disconnector Based on Parallel Dual-Channel Model of Feature Fusion. Sensors 2025, 25, 6933. [Google Scholar] [CrossRef] [Scilit]
  20. Obarcanin, K.; Ramovic, F. A Method for Condition Assessment of the High Voltage Disconnector Switch Electric Motor Drive. In Proceedings of the 2023 International Conference on Modeling, Simulation & Intelligent Computing (MoSICom), Dubai, United Arab Emirates, 7–9 December 2023; pp. 302–306. [Google Scholar] [CrossRef] [Scilit]
  21. Westerlund, P.; Hilber, P.; Lindquist, T. Condition monitoring of disconnectors in the electric power transmission grid with temperature sensors. Int. J. Ind. Syst. Eng. 2016, 23, 90. [Google Scholar] [CrossRef] [Scilit]
  22. Chen, J.; Wu, G.; Jian, X.; Cai, L.; Chen, S.; Chen, R. Research on State Monitoring System of Intelligent Disconnecting Switch Based on Sensing Technology. Front. Energy Res. 2022, 10, 895301. [Google Scholar] [CrossRef] [Scilit]
  23. Suwanasri, C.; Saribut, S.; Suwanasri, T.; Phadungthin, R. Risk analysis using failure modes, effects, and criticality analysis for transmission network assets. Energies 2021, 14, 977. [Google Scholar] [CrossRef] [Scilit]
  24. Ishikawa, K. What Is Total Quality Control? The Japanese Way; Prentice-Hall: Englewood Cliffs, NJ, USA, 1985; Available online: https://search.library.wisc.edu/catalog/999557208002121 (accessed on 7 May 2026).
  25. Lo, H.-W.; Liou, J.J. A novel multiple-criteria decision-making-based FMEA model for risk assessment. Appl. Soft Comput. 2018, 73, 684–696. [Google Scholar] [CrossRef] [Scilit]
  26. Aleksić, A.; Tadić, D.; Komatina, N.; Nestić, S. Failure Mode and Effects Analysis Integrated with Multi-Attribute Decision-Making Methods Under Uncertainty: A Systematic Literature Review. Mathematics 2025, 13, 2216. [Google Scholar] [CrossRef] [Scilit]
  27. Hisprastin, Y.; Musfiroh, I. Ishikawa Diagram dan Failure Mode Effect Analysis (FMEA) sebagai Metode yang Sering Digunakan dalam Manajemen Risiko Mutu di Industri. Maj. Farmasetika 2021, 6, 1–9. [Google Scholar] [CrossRef] [Scilit]
  28. Glevitzky, M.; Glevitzky, I.; Mucea-Ștef, P.; Popa, M.; Dumitrel, G.-A.; Vică, M.L. Integrated Risk Framework (IRF)—Interconnection of the Ishikawa Diagram with the Enhanced HACCP System in Risk Assessment for the Sustainable Food Industry. Sustainability 2025, 17, 536. [Google Scholar] [CrossRef] [Scilit]
  29. Patidar, A.; Sharma, M.; Agrawal, R.; Sangwan, K.S.; Sarkar, P. Building supply chain resilience in developing economies: A weighted Ishikawa diagram approach. Oper. Manag. Res. 2024, 17, 363–386. [Google Scholar] [CrossRef] [Scilit]
  30. Kováč, J.; Kuvik, T.; Mancel, V.; Krilek, J. Analysis of Failure States of Transportation Vehicles Using the Ishikawa Diagram: A Case Study. Appl. Sci. 2025, 15, 10221. [Google Scholar] [CrossRef] [Scilit]
  31. IEC 60812-2006; Analysis Techniques for System Reliability—Procedure for Failure Mode and Effects Analysis (FMEA). IEC: Geneva, Switzerland, 2006.
  32. Shrestha, S.M.; Mallineni, J.K.; Yedidi, K.R.; Knisely, B.; Tatapudi, S.; Kuitche, J.; TamizhMani, G. Determination of dominant failure modes using FMECA on the field deployed c-Si modules under hot-dry desert climate. IEEE J. Photovolt. 2015, 5, 174–182. [Google Scholar] [CrossRef] [Scilit]
  33. Braglia, M. MAFMA: Multi-attribute failure mode analysis. Int. J. Qual. Reliab. Manag. 2000, 17, 1017–1033. [Google Scholar] [CrossRef] [Scilit]
  34. Huang, A.; Yang, Y. FMEA Risk Assessment Method: Integration of Multi-Perspective Weights and Interval Cloud Model with TOPSIS Approach. Expert Syst. Appl. 2025, 289, 128377. [Google Scholar] [CrossRef] [Scilit]
  35. Anes, V.; Abreu, A. A Hybrid FMEA-ROC-CoCoSo Approach for Improved Risk Assessment and Reduced Complexity in Failure Mode Prioritization. Algorithms 2024, 17, 585. [Google Scholar] [CrossRef] [Scilit]
Figure 1. Overall methodology flowchart.
Energies 19 04212 g001
Figure 2. Ishikawa diagram.
Energies 19 04212 g002
Figure 3. Sensitivity analysis.
Energies 19 04212 g003
Table 1. Summary of recent studies on monitoring and fault diagnosis.
ArticlesFailure Mode
Analyzed
MethodsSensors UsedComments
Zhang et al. (2025) [19]Mechanism jam, mechanism looseness, three-phase asynchronyVariational Mode Decomposition (VMD), black-winged kite algorithm (BKA), gated recurrent unit (GRU).Vibration sensorsData-driven fault diagnosis approach focused on mechanical failure. Sensor is assumed and not derived from risk analysis.
Zhu et al. (2025) [12]Jamming and incomplete opening and closingFusion of time-frequency domain energy features of vibration signal; particle swarm optimization (PSO) algorithm; SVMVibration sensorClassification of six disconnector states. The article analyses only a few mechanical failure scenarios.
Obarcanin et al. (2023) [20]Contact degradation, aging, mechanical deteriorationCondition assessment based on health indicators Temperature, position and operational monitoringThe work focuses on a comprehensive assessment of the condition of the disconnectors. However, there is no quantitative prioritization of failure modes.
Chen et al. (2022) [22]Incorrect positioning, mechanism failure, abnormal operating torque, environmental degradationOnline condition-monitoring platformTorque sensors, angle encoders, micro-switches, attitude sensors, and temperature and humidity sensorSensor-rich monitoring architecture. However, sensor deployment is predefined and not justified through a systematic criticality analysis.
Suwanasri et al. (2021) [23]Failure modes affecting transmission assets including conductors, insulators, and accessories.FMECA combined with Analytical Hierarchy Process (AHP) and weighted-scoring methods. Criticality matrices are used to prioritize risksNo specific monitoring sensors consideredFMECA is used in the study. However, it focuses on transmission lies rather than disconnect switches and does not address sensor selection.
Westerlund et al. (2016) [21]Contact deterioration, increased contact resistance, contact overheatingTemperature-current regression analysis for condition rankingInfrared temperature sensors and current measurementsFocuses only on thermal degradation of contacts.
Qiu et al. (2015) [11]Screw loose, transmission mechanism jammedVariational Mode Decomposition, AdaBoost-SVMVibration, current sensorsThe study develops a system for diagnosing mechanical faults. There is no criticality classification; the sensors are specified from the outset.
Table 2. Determination of severity parameter value (IEC 60812. STANDARD).
SeverityCriteriaRanking
Very minorNo discernible effect.1
Very minorFit and finish/squeak and rattle item do not conform. Defect noticed by discriminating customers (less than 25%).2
MinorFit and finish/squeak and rattle item do not conform. Defect noticed by discriminating customers (less than 50%).3
Very lowFit and finish/squeak and rattle item do not conform. Defect noticed by discriminating customers (less than 75%).4
LowItem operable but comfort/convenience item(s) operable at a reduced level of performance. Customer somewhat dissatisfied.5
ModerateItem operable but comfort/convenience item(s) inoperable. Customer dissatisfied.6
HighItem operable but at a reduced level of performance. Customer very dissatisfied.7
Very HighItem inoperable (loss of primary function).8
Hazardous
With
warning
Very high severity ranking when a potential failure mode affects safe operation and/or involves noncompliance with government regulation with warning.9
Hazardous
without
warning
Very high severity ranking when a potential failure mode affects safe operation and/or involves noncompliance with government regulation without warning.10
Table 3. Determination of occurrence parameter value (IEC 60812 STD).
OccurrenceFrequencyRanking
Remote: Failure is unlikely<=0.01 per thousand items1
Low: Relatively few failures0.1 per thousand items2
0.5 per thousand items3
Moderate: Occasional failures1 per thousand items4
2 per thousand items5
5 per thousand items6
High: Repeated failures10 per thousand items7
20 per thousand items8
Very high: Failure is almost inevitable50 per thousand items9
>=100 per thousand items10
Table 4. Failure mode detection evaluation criteria (IEC 60812 STD).
DetectionCriteria: Likelihood of Detection by Design ControlRanking
Almost certainDesign Control will almost certainly detect a potential cause/mechanism and subsequent failure mode1
Very highVery high chance the Design Control will detect a potential cause/mechanism and subsequent failure mode2
HighHigh chance the Design Control will detect a potential cause/mechanism and subsequent failure mode3
Moderately highModerately high chance the Design Control will detect a potential cause/mechanism and subsequent failure mode4
ModerateModerate chance the Design Control will detect a potential cause/mechanism and subsequent failure mode5
LowLow chance the Design Control will detect a potential cause/mechanism and subsequent failure mode6
Very lowVery low chance the Design Control will detect a potential cause/mechanism and subsequent failure mode7
RemoteRemote chance the Design Control will detect a potential cause/mechanism and subsequent failure mode8
Very remoteVery remote chance the Design Control will detect a potential cause/mechanism and subsequent failure mode9
Absolutely
uncertain
Design Control will not and/or cannot detect a potential cause/mechanism and subsequent failure mode; or there is no Design Control10
Table 5. Weighting of the selection criteria.
Utility
ChoiceWeightingSelection Criteria
11Sensor for a single component
21.5Sensor for two components
31.75Sensor for three components
Choice
ChoiceWeightingSelection criteria
(1) Affordable; (2) easily accessible and (3) accurate measurements.
11All three criteria are satisfied
20.75Two of three criteria are satisfied
30.5One of three criteria is satisfied
40.25None of the criteria are satisfied
Table 6. High-critical failures root cause analysis.
ComponentFunctionFailure ModePotential Failure
Effect(s)
Potential Causes
Copper contacts with silver coatingTransmission of the electric current through two mechanically separable elementsContact burning due to inadequate jaw–blade contactDisconnector becomes inoperablePoor field fit during commissioning, contact spring stiffness, incomplete open/close, non-aligned contact
SensorsMonitoring of the different physical quantitiesWrong indicationErroneous data, aberrant data, lack of data, false control, communication problemPoor sensor quality, improper installation, unfavorable environment, presence of external contamination (dust, etc.), presence of electromagnetic noise, connection and wiring issues between the sensor and the box, cyberattack
CabinetProtect the components of the motorized cabinet from external hazards and vice versaWater infiltration, damaged structure/enclosureDamage to electronic components, rusting of metal componentsGasket not designed for extreme environments, enclosure paint non-compliant/poorly applied, enclosure not properly closed, enclosure rusting
Disconnector pivotTransfer the movement from the linkage to the rotary isolatorBlocked pivotThe disconnector is rendered inoperative due to a blocked bladeWater infiltration and other potential contaminants, presence of ice on the pivot, oxidized linkage, oxidized bearing, faulty seal
Heating element and thermostatMaintain a good level of temperature and humidity for electrical componentsThe heating element has stopped workingCondensation formation inside the motorized cabinetPremature rust on some components
Table 7. High-critical failures RPN.
Failure ModeSeverityOccurrenceDetectionRPN
Contact burning due to inadequate jaw–blade contact955225
Wrong indication953135
Water infiltration, damaged structure/enclosure636108
Blocked pivot92590
The heating element has stopped working54480
Table 8. Moderate critical failures root cause analysis.
ComponentFunctionFailure ModePotential Failure Effect(s)Potential Causes
Compensation springsReduce the effort required to operate the disconnectorThe inner spring is brokenThere will no longer be compensation on the blade and the disconnector becomes inoperable. If you force it, the gearbox can be damagedCondensation and rust that weaken the spring over time, spring stiffness inside
Electronic boardProvide command and control of the entire disconnectorThe electronic board is burnt or saturatedOperation of the disconnector disrupted, triggering of false alarmsPoor PCB design, cabinet infiltration (humidity, contaminants), blocked air vent, insufficient power supply, careless handling
LinkageTransfer operator movement to all three phasesDamaged linkageThe disconnector becomes inoperable, asynchronization of the position of the three phases, blade blockedPresence of an obstacle that prevents the blade from moving, presence of ice at the pivot, oxidized linkage
Arc HornProtect disconnector materialThe male and female arc horns do not touch when in the closed position, or either one is completely burned; blade stuckCreates cavities on copper contacts due to electric arcing and reduces their lifespan, prolonged arc durationHigh residual current at the disconnector location in the substation that will cause arcing or misalignment in the field during installation, presence of an obstacle that prevents the blade from moving
Table 9. Moderate critical failures RPN.
Failure ModeSeverityOccurrenceDetectionRPN
The inner spring is broken94272
The electronic board is burnt or saturated94272
Damaged linkage93254
The male and female arc horns do not touch when in the closed position, or either one is completely burned; blade stuck55250
Table 10. Low critical failures root cause analysis.
ComponentFunctionFailure ModePotential Failure Effect(s)Potential Causes
Electric motorTransfer electrical energy in rotary motionDefective engine and not workingDisconnector becomes inoperative in electric mode, inconvenient opening/closing speed, blade blockedFailure of the motor protection mechanism
Motor ControlBringing power to the engineDefective actuator and not functioning properlyDisconnector becomes inoperative in electric modeHigh humidity, loss of power supply, presence of contaminants (dust, iron filings)
FusesProtect the motor’s electrical systemBlown fuseDisconnector becomes inoperative in electric modeShort-circuit to ground in the system, high starting current, presence of an obstacle preventing the blade from moving
BrakesStop the motor rotationBlocked brakePremature use of brake components, longer operating time or disconnect switch rendered inoperative in electric modeInsufficient brake pad clearance, corrosion of brake components
Limit switchesIndicate to the control panel the moment when the motor should be stoppedLimit switch faultThe disconnector does not stop at the end of the opening or closing operation. Incomplete opening/closingFault in the limit switch and tripping of the thermal relay; the gearbox may break if the overload is not set correctly
Rotating Mounts & IsolatorsIsolate the energized portion of the disconnector from the ground and support the energized portion of the disconnectorFlashover (ground fault)Tripping of adjacent circuit breakersHigh pollution area, accumulation of dust on the insulator sheds which, over time, can promote flashover, presence of ice on the sheds
Table 11. Low critical failures RPN.
Failure ModeSeverityOccurrenceDetectionRPN
Defective engine and not working64248
Defective actuator and not functioning properly54240
Blown fuse54240
Blocked brake53230
Limit switch fault53230
Flashover (ground fault)72228
Wrong indication4114
Table 12. Sensors prioritization.
SensorsComponentsPriorityUsefulnessChoiceRPN
Current sensorsDC Motor/Copper Contacts/Disconnector Pivot5.731225
Copper Contacts/Network3.311225
Leakage current0.41128
Brakes0.41130
Voltage sensorsDC Motor1.23148
Fuses0.61140
Limit switch0.31230
Temperature sensorsExternal Temperature: Cabinet/Disconnector Pivot/Heating Element/Thermostat2.731108
Copper Contacts/Arc Horn2.412225
Internal Housing/Motor1.611108
Electronic board1.01172
Arc Horn0.71150
Linkage0.41354
Humidity sensorsCabinet1.611108
Disconnector Pivot1.01290
Frost sensorCopper Contacts/Linkage/Compensation Spring2.221100
Vibration sensorsCompensation Spring1.01172
Linkage0.81154
Sound sensorsCopper Contacts1.613225
Compensation Spring/Arc Horn1.22272
Wind sensorLinkage/blades1.411100
Position sensorsLinkage0.81154
Motor0.71148
Torque sensorDC motor: at the output of the motorized control0.71148
Disclaimer/Publisher’s Note: The statements, opinions and data contained in all publications are solely those of the individual author(s) and contributor(s) and not of MDPI and/or the editor(s). MDPI and/or the editor(s) disclaim responsibility for any injury to people or property resulting from any ideas, methods, instructions or products referred to in the content.