1. Introduction
The displacement of synchronous generation by variable renewables has sharply increased the demand for fast frequency regulation, a service for which battery energy storage systems (BESSs) are technically well suited [
1,
2]. Frequency Containment Reserve (FCR)—the fastest and most continuously active balancing product in the European interconnected grid—is among the most commercially attractive BESS applications and imposes a near-continuous partial-state-of-charge (PSoC) duty whose long-term effect on battery health is the subject of this work [
1].
A further structural limitation of the existing evidence base is the predominance of simulation-based studies: most investigations of BESS degradation under FCR rely on synthetic power profiles derived from simplified frequency models rather than continuous high-resolution field measurements, limiting the transferability of their degradation predictions to deployed systems [
2,
3,
4]. Although lead–acid batteries historically dominated stationary energy storage and continue to retain a meaningful share of the installed global storage base, particularly in markets characterized by stringent capital cost constraints, established maintenance infrastructures, or intrinsic safety requirements that disfavor lithium-based alternatives [
5,
6], they remain substantially underrepresented in the FCR degradation literature. The available field evidence primarily concerns valve-regulated (VRLA) batteries operated under float or uninterruptible-power-supply duty, including large-scale reliability surveys of stationary installations [
7] and laboratory duty-cycle evaluations spanning frequency-regulation profiles [
8]. The few field studies addressing lead–acid storage in FCR applications focus mainly on aggregate system-level availability and capacity metrics rather than applying a multi-metric, physics-grounded indicator framework capable of disentangling concurrent degradation processes [
3,
9]. Consequently, multi-year, one-second-resolution field studies of BESS under real grid-frequency excitation remain rare across all battery chemistries and are virtually absent for flooded lead–acid technologies.
The value of an eight-year, second-resolution field record extends beyond quantifying how flooded lead–acid ages: it also offers a vantage point from which to ask a strategic question that field data, rather than laboratory cells, are uniquely positioned to inform. Grid storage today rests overwhelmingly on a lithium-ion supply chain concentrated in Asia, with the majority of global lithium refining located in China [
10]. Flooded lead–acid sits at the opposite pole, supported by a largely closed, domestic European value chain with collection and recycling rates near 99% [
11]. Whether such a supply-chain-sovereign technology can credibly serve modern grid applications hinges on its operational longevity under real service, and it is precisely this question that the present dataset is positioned to examine.
What remains insufficiently characterized by field evidence is how a lead–acid battery actually behaves under the specific FCR operating regime over its extended field operation, and which degradation indicators are practically extractable from a continuous operational data stream. Laboratory studies identify several plausible degradation pathways under PSoC conditions: lead sulfate crystal growth on the negative electrode through incomplete charge cycling [
12], electrolyte stratification under low-agitation standby [
13], and progressive grid corrosion as a function of cycling and calendar time [
14]. Whether these mechanisms produce proportionally measurable field-data signatures under actual FCR service conditions—and which, if any, dominates—is an open empirical question that laboratory cycling protocols and system-level simulations cannot resolve. An equally important but less-studied question is how degradation behaviour shifts when a battery transitions from active FCR cycling to low-utilization standby operation—a transition increasingly common as hybrid BESS installations redistribute load across chemistry types.
The M5BAT (“Modular Multi-Megawatt Medium Voltage Battery Storage”) facility at RWTH Aachen University provides a well-suited dataset to address these questions. The hybrid BESS integrates five distinct battery technologies—including a flooded OCSM lead–acid unit manufactured by Exide Technologies—and the facility has been providing FCR service continuously since April 2017 [
3,
9,
15,
16]. The M5BAT monitoring infrastructure captures one-second-resolution data from both the battery management system (BMS, Exide LT series) and the power conversion system controller (BSC) (SMA Solar Technology AG, Niestetal, Germany) for every battery unit simultaneously, yielding an archive that spans DC current, voltage, state of charge, grid frequency, AC energy counters, operating-mode flags, and 55 BMS alarm channels. Critically, the observation period encompasses not only five years of active FCR-primary service but also a subsequent transition in 2022 to low-utilization reserve operation—creating an observational before/after comparison of two fundamentally different operating regimes within the same hardware system.
Building on this dataset, the present paper makes the following contributions:
- (i)
It presents a longitudinal, multi-metric degradation analysis of a flooded OCSM lead–acid BESS spanning an eight-year observation window, covering both a FCR-primary phase (2017–2021) and a reserve-operation phase (2022–2025).
- (ii)
It characterizes the degradation trajectory across the two operating regimes through four complementary health indicators, i.e., DC internal resistance (DCIR), DC and AC round-trip efficiency, coulombic efficiency, and inverter efficiency, each extracted from distinct measurement pathways to mitigate sensor-specific biases. The analysis reveals that FCR-phase degradation rates were statistically indistinguishable from zero over five years of active service, while the transition to low-utilization reserve operation correlated with a substantial acceleration in internal resistance growth. This finding suggests that FCR-specific PSoC cycling may not be the dominant driver of degradation under the investigated operating conditions.
- (iii)
It evaluates which degradation mechanisms are consistent with the multi-indicator observations, explicitly distinguishes what can be inferred from system-level field data from that which would require cell-level postmortem confirmation and identifies the minimum additional measurements that would narrow the mechanistic uncertainty.
Together, these contributions provide the most detailed publicly documented field characterization of a flooded lead–acid BESS under FCR conditions and offer a transferable analytical framework readily adaptable to other BESS chemistries.
The remainder of this paper is organized as follows.
Section 2 describes the M5BAT system architecture, the OCSM lead–acid unit, the measurement infrastructure, and the dataset.
Section 3 presents the methodology, including data preprocessing, degradation metric definitions, operational mode classification, and the statistical framework.
Section 4 presents the results: operational characterization, degradation indicators, and detailed efficiency analysis.
Section 5 discusses the findings, evaluates candidate degradation mechanisms, addresses methodological limitations, and derives implications for battery management.
Section 6 presents conclusions and recommendations for practice.
3. Methodology
The methodological framework is structured around five complementary degradation metrics derived from a shared eight-year operational dataset. The following sections describe the system, data pipeline, metric definitions, and analysis procedures.
3.1. Operational Context and Degradation Mechanisms
The Exide1 unit has been commercially contracted for FCR service in accordance with the ENTSO-E Network Code, which mandates a linear power response proportional to frequency deviation (±200 mHz around 50.0 Hz) with full activation within 30 s [
1,
9]. This operational regime structurally constrains the battery to continuous partial-state-of-charge (PSoC) operation near 50% SoC to preserve symmetric regulation headroom.
Under PSoC conditions, flooded lead–acid cells accumulate insoluble lead sulfate (PbSO
4) crystals on the active electrode surfaces during repeated incomplete cycling, progressively reducing both electrochemically active area and electrolyte ionic conductivity [
12,
14]. The practical consequence is a coupled degradation observable across multiple electrical parameters: rising DC internal resistance (DCIR), declining round-trip efficiency, and shrinking charge-acceptance capacity [
18]. This multi-metric manifestation motivates the analytical framework developed in
Section 3.3, the design of which presupposes no dominant degradation mechanism but instead evaluates empirically which mechanisms are consistent with the observed trajectories.
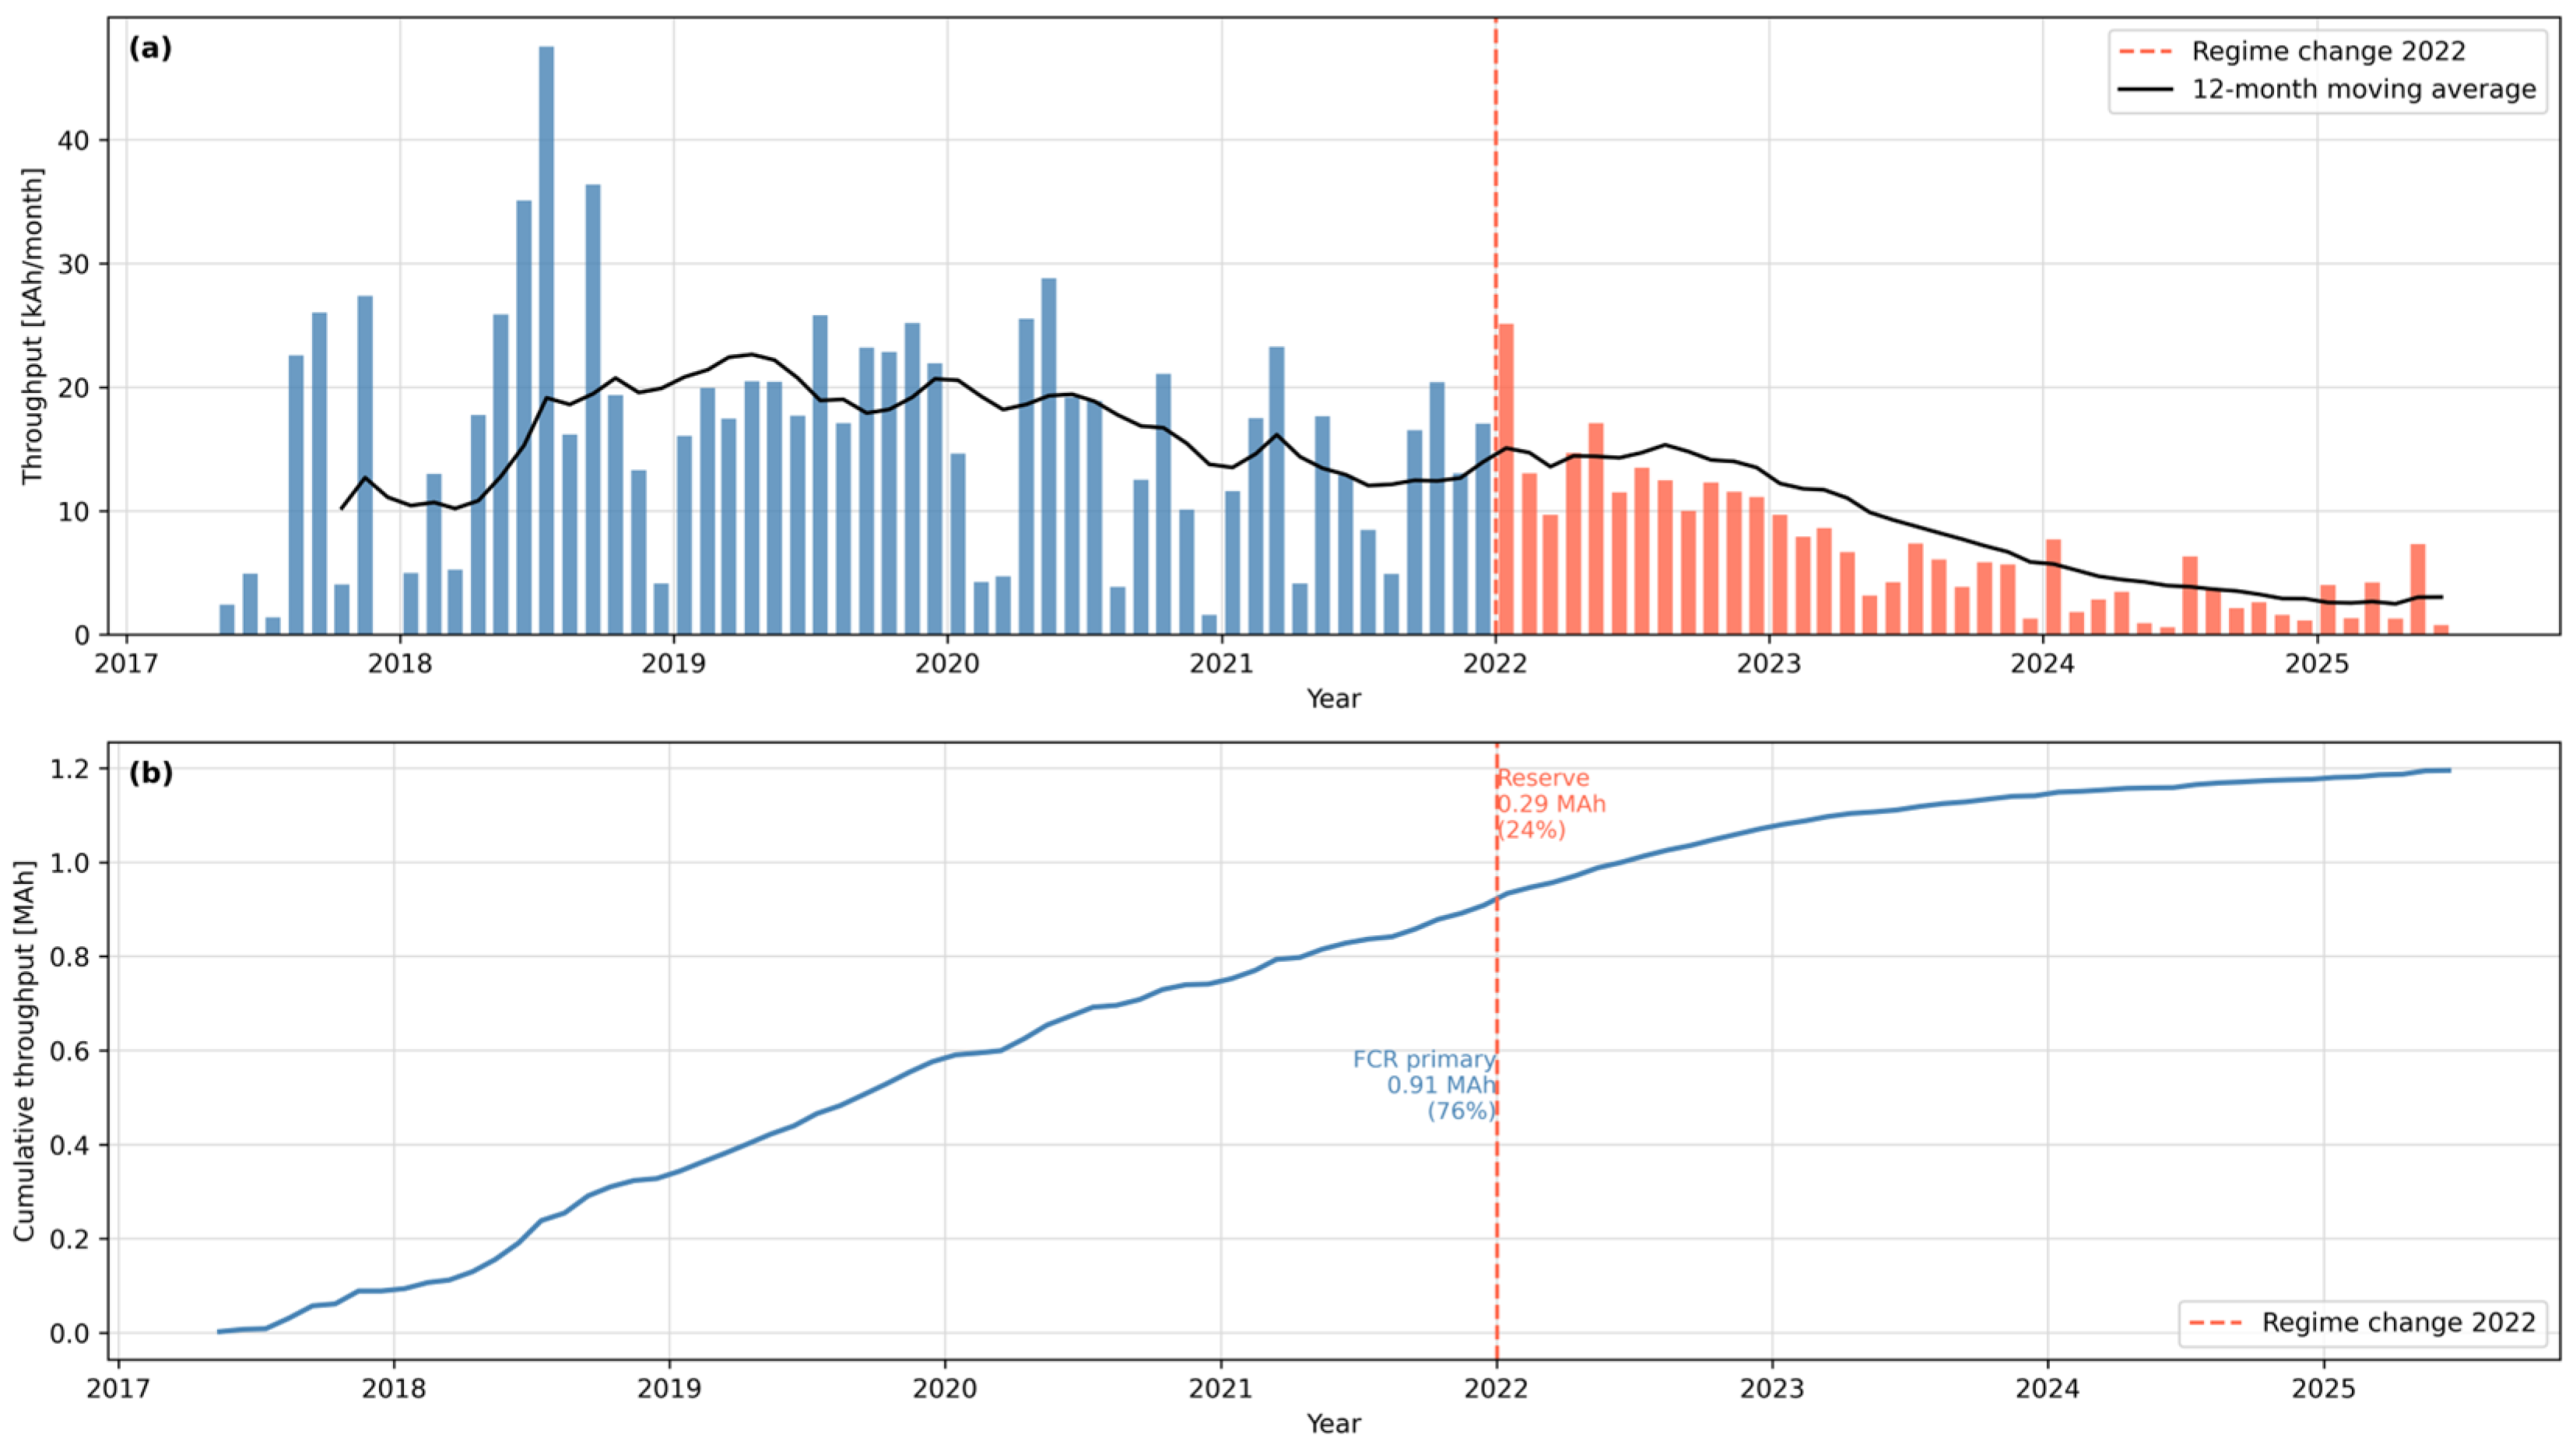
A significant operational regime change occurred in 2022, when the system transitioned from primary FCR delivery to reserve operation following the commissioning of a co-located lithium-ion BESS. Annual charge throughput declined from ~250,000 Ah a
−1 (2018–2019) to below 20,000 Ah a
−1 (2025)—a reduction exceeding 90%. This regime shift constitutes a significant confounding factor in long-term trend analysis and is explicitly accounted for in all metric interpretations (
Section 3.4).
3.2. Dataset Overview
This section summarizes the operational dataset used throughout the analysis: the raw data sources and their preprocessing, followed by the selection of the signals employed.
3.2.1. Raw Data and Preprocessing
Operational data were recorded at 1-s resolution by two subsystems: the Battery Management System (BMS, Exide LT series) and the power conversion system controller (BSC) (Exide Technologies, Büdingen, Germany (battery) and SMA Solar Technology AG, Niestetal, Germany). Raw exports were quality-filtered, UTC-unified, and deduplicated prior to analysis. Gaps shorter than 5 s were forward-filled; longer gaps were preserved as discontinuities. The resulting archive spans the full commercial operation period from commissioning (2017) through May 2025. The processed dataset is available in a public repository (see Data Availability Statement).
BMS channels are stored in physical units; BSC channels are scaled to physical units during preprocessing. Current sign convention follows the electrical engineering standard: positive current denotes discharge, negative current denotes charging. All signal definitions and scaling factors are documented in the dataset codebook.
3.2.2. Signal Selection
A minimal set of 16 BMS and BSC channels, sampled at 1 s resolution, was sufficient to compute all degradation metrics, the FCR stress profile, and the SoC distribution (
Table 1); the full register mapping is provided in the published dataset (see the Data Availability Statement).
3.3. Degradation Metric Framework
Four complementary metrics are derived from the operational dataset. They differ in the physical phenomenon they capture, the measurement pathway (AC-side energy meters vs. DC-side current/voltage), and the period for which they are computable. Their joint use mitigates sensor-specific biases that would affect any single indicator, consistent with the multi-parameter approach recommended for field-deployed lead–acid degradation analysis [
18]. A fifth metric, apparent capacity from full-cycle Coulomb counting, is implemented in the analysis module but not reported as a primary result because fewer than 50 deep discharge events (SoC < 20%) were identified over the eight-year observation period, rendering per-year capacity estimates statistically unstable. All data processing and analysis were performed in Python 3.12 (Python Software Foundation, Wilmington, DE, USA).
3.3.1. DC Internal Resistance—Method A
The DC internal resistance (DCIR) R
int serves as the primary electrochemical proxy for sulfation-induced active surface loss. It is computed from voltage and current transients at polarity transitions (discharge-to-charge and charge-to-discharge) identified in the 1 s data stream using the current-pulse (step) method, i.e., Ohm’s law applied to the coincident voltage and current steps (R = ΔU/ΔI), in line with hybrid pulse power characterization (HPPC) and IEC-type pulse procedures:
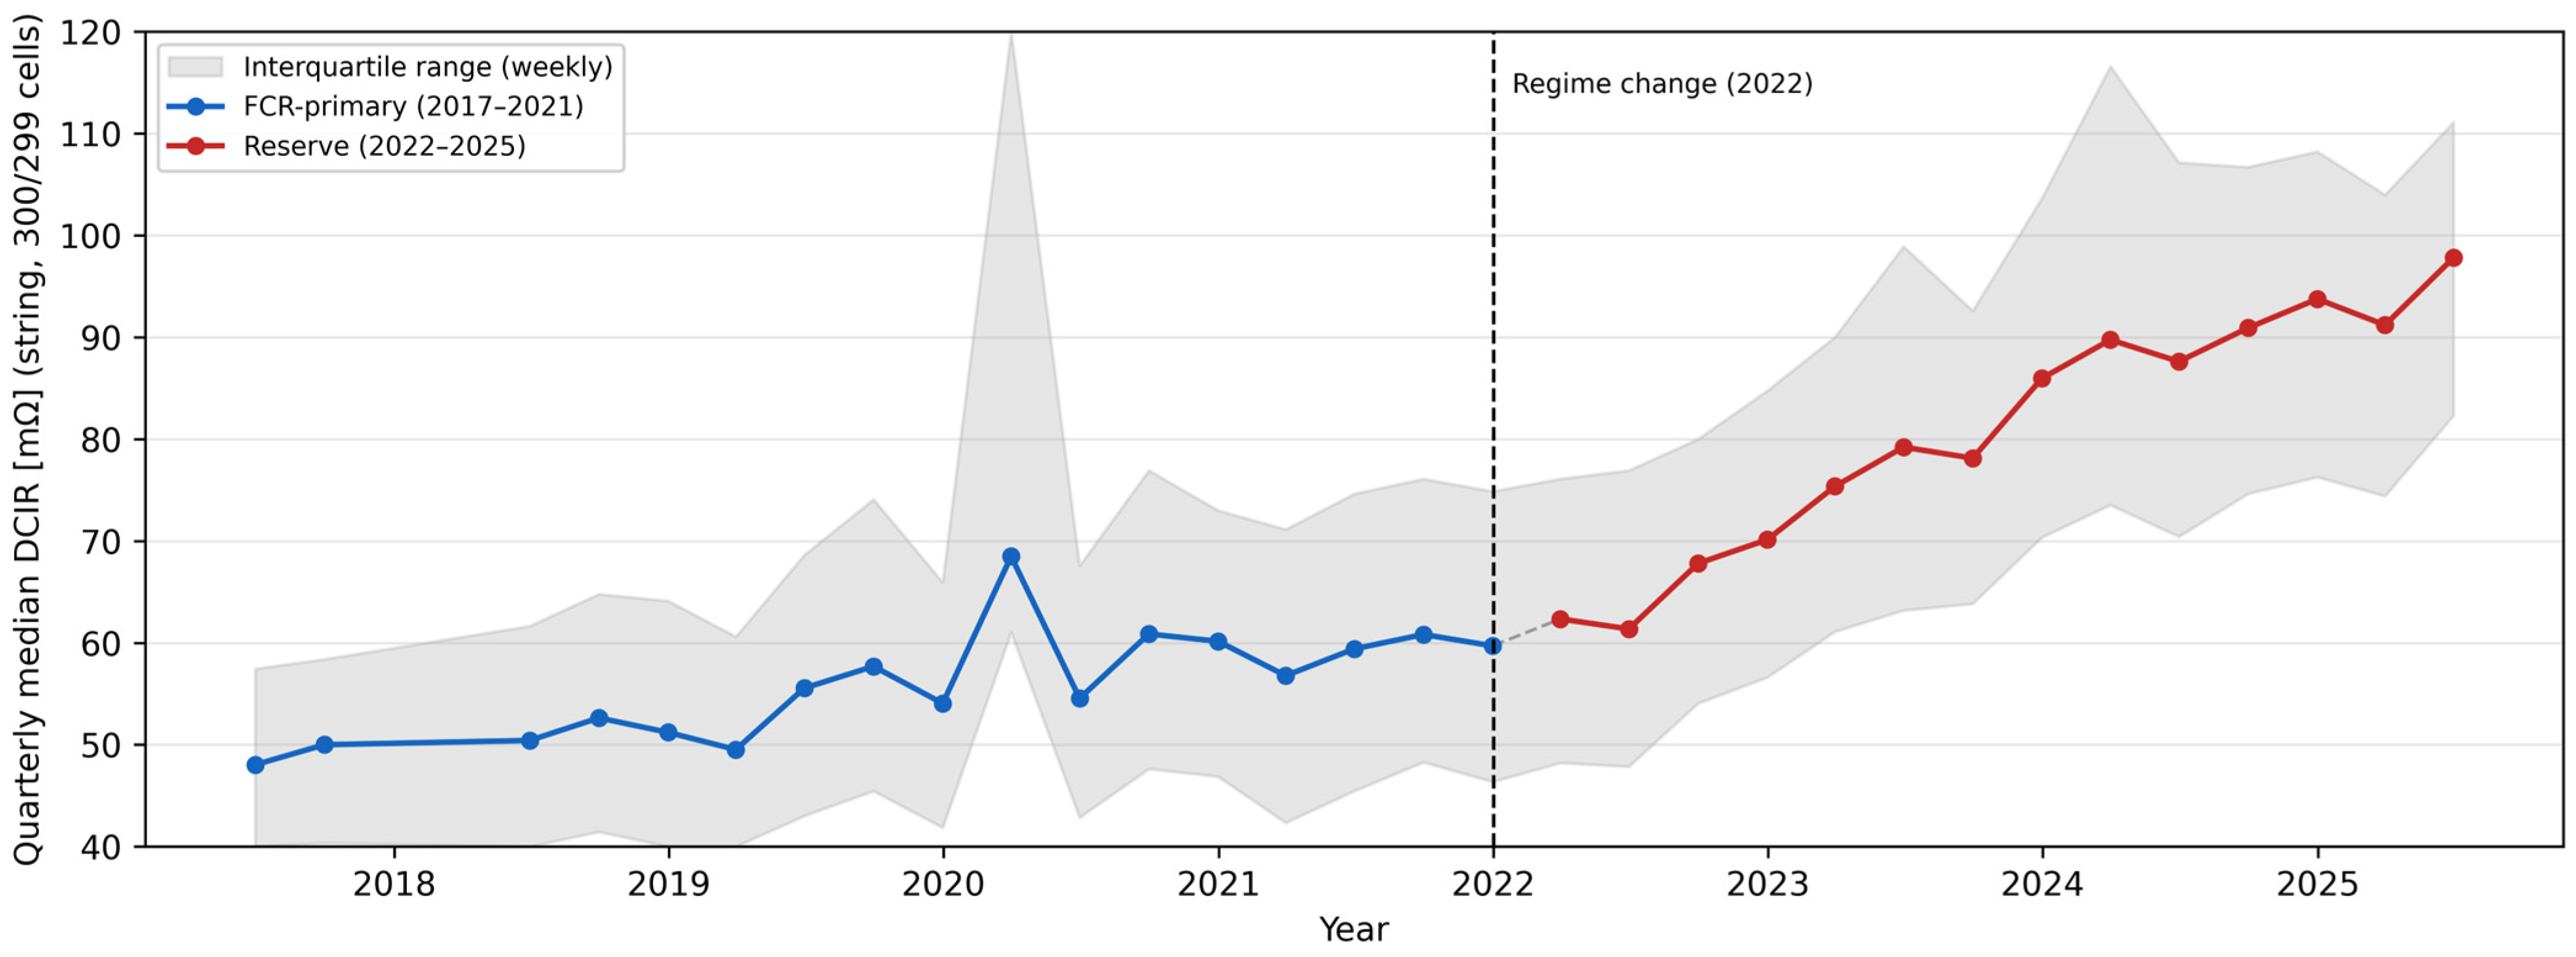
where U and I are the BSC battery terminal voltage and current, averaged over a 5 s window immediately before and after the polarity change. Pulses with |ΔI| < 10 A are excluded to avoid noise-dominated estimates. All values are reported at string level (300 cells in series); per-cell DCIR is obtained by dividing by the number of series cells (300; 299 after the 10 August 2023 bypass). Transition events are binned into 0.5 h SoC intervals; annual medians and interquartile ranges are computed across all valid pulses in each calendar year. Importantly, this approach exploits naturally occurring polarity transitions detected in the 1 s operational data stream; it does not rely on dedicated laboratory-style current-pulse injections (typically <10 ms at controlled SoC setpoints). The resulting estimates therefore capture in situ string-level resistance under real operating conditions, but carry higher scatter than standardized single-pulse measurements and are not directly comparable to per-cell values obtained from controlled hardware-pulse protocols. The BMS voltage channels, logged at a cadence of roughly 60 s and only for each 3-cell group, cannot resolve this transient: the sampling interval is far longer than the sub-second ohmic response to a current step, and the 3-cell aggregation is neither time-aligned with the current samples nor resolved to the string level. All dynamic DCIR estimation therefore relies on the 1 s, string-level BSC current and voltage channels.
Temperature correction: no explicit normalization was applied. The battery hall is actively climate-controlled with a high air-exchange rate. The mean battery temperature measured from the operational record differs by only about 1 °C between the two regimes, and the reserve phase (mean 22.2 °C) is in fact marginally warmer than the FCR phase (mean 21.1 °C). With a typical lead–acid DCIR coefficient of 0.5–1.0%/°C [
13,
14], this ΔT ≈ −1.1 °C maps to at most 0.8–1.6% of the observed 35.9 mΩ DCIR increase, and its sign is opposite to that required to explain the rise. Temperature differences between operating regimes therefore cannot account for the observed change.
3.3.2. AC Round-Trip Efficiency—Method B
The AC round-trip efficiency is η
rt,AC = W
AC,out/W
AC,in, the ratio of cumulative AC energy discharged to charged at the grid connection point. Because the on-board AC energy counters were unpopulated before 2022, AC energy is integrated uniformly across the full record from the one-second AC active-power signal i_P_AC (charge = integral of negative power, discharge = integral of positive power); this reproduces the on-board counters to within 1% over their 2022–2025 overlap. Monthly estimates are computed only when Ah throughput exceeds 500 Ah, to avoid SoC-drift artifacts at period boundaries (
Section 3.3.3).
3.3.3. DC Round-Trip Efficiency and Coulombic Efficiency—Method C
The DC round-trip efficiency ηrt,DC = WhDC,out/WhDC,in is computed from the BMS cumulative energy counters (Eges_entlad, Eges_lad) at monthly granularity. The coulombic efficiency ηcoul = Ahout/Ahin is derived from the BMS current integral. These metrics are likewise available for the full observation period. The same 500 Ah monthly throughput threshold applies.
Note on BMS-reported energy efficiency fields: the BMS data archive contains a pre-computed efficiency field (eta_rt_BMS) which shows values near 100% for 2017–2021. This field reflects a binary BMS flag unrelated to the Faradaic round-trip computation and must not be confused with the η
rt,DC values reported in
Section 4, which are computed independently from the counter integrals using the pipeline described above.
3.3.4. Inverter Efficiency—Method D
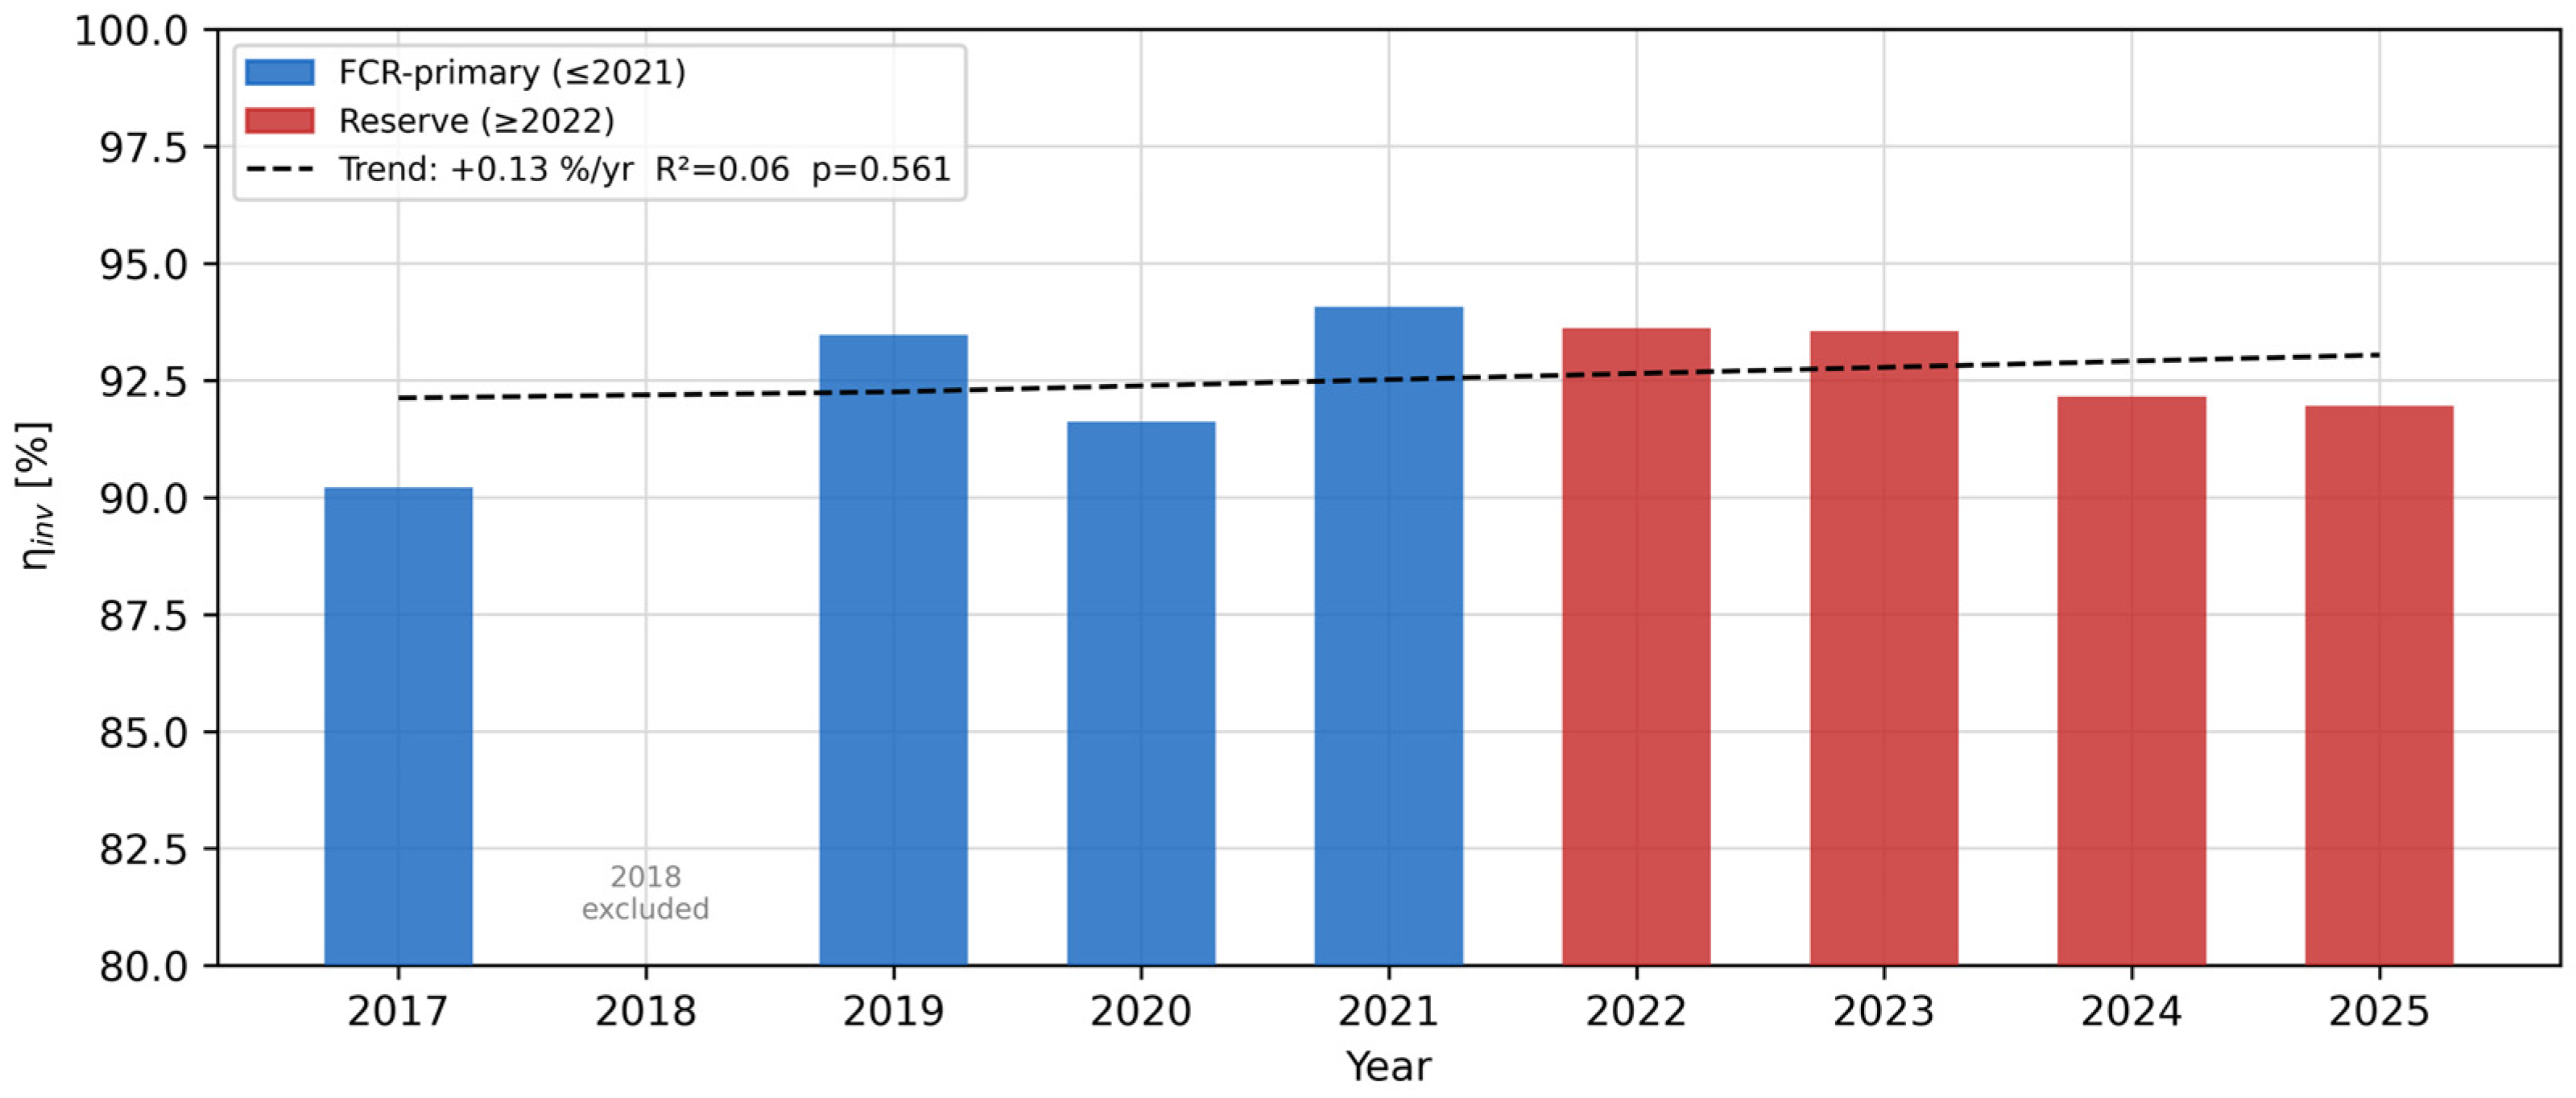
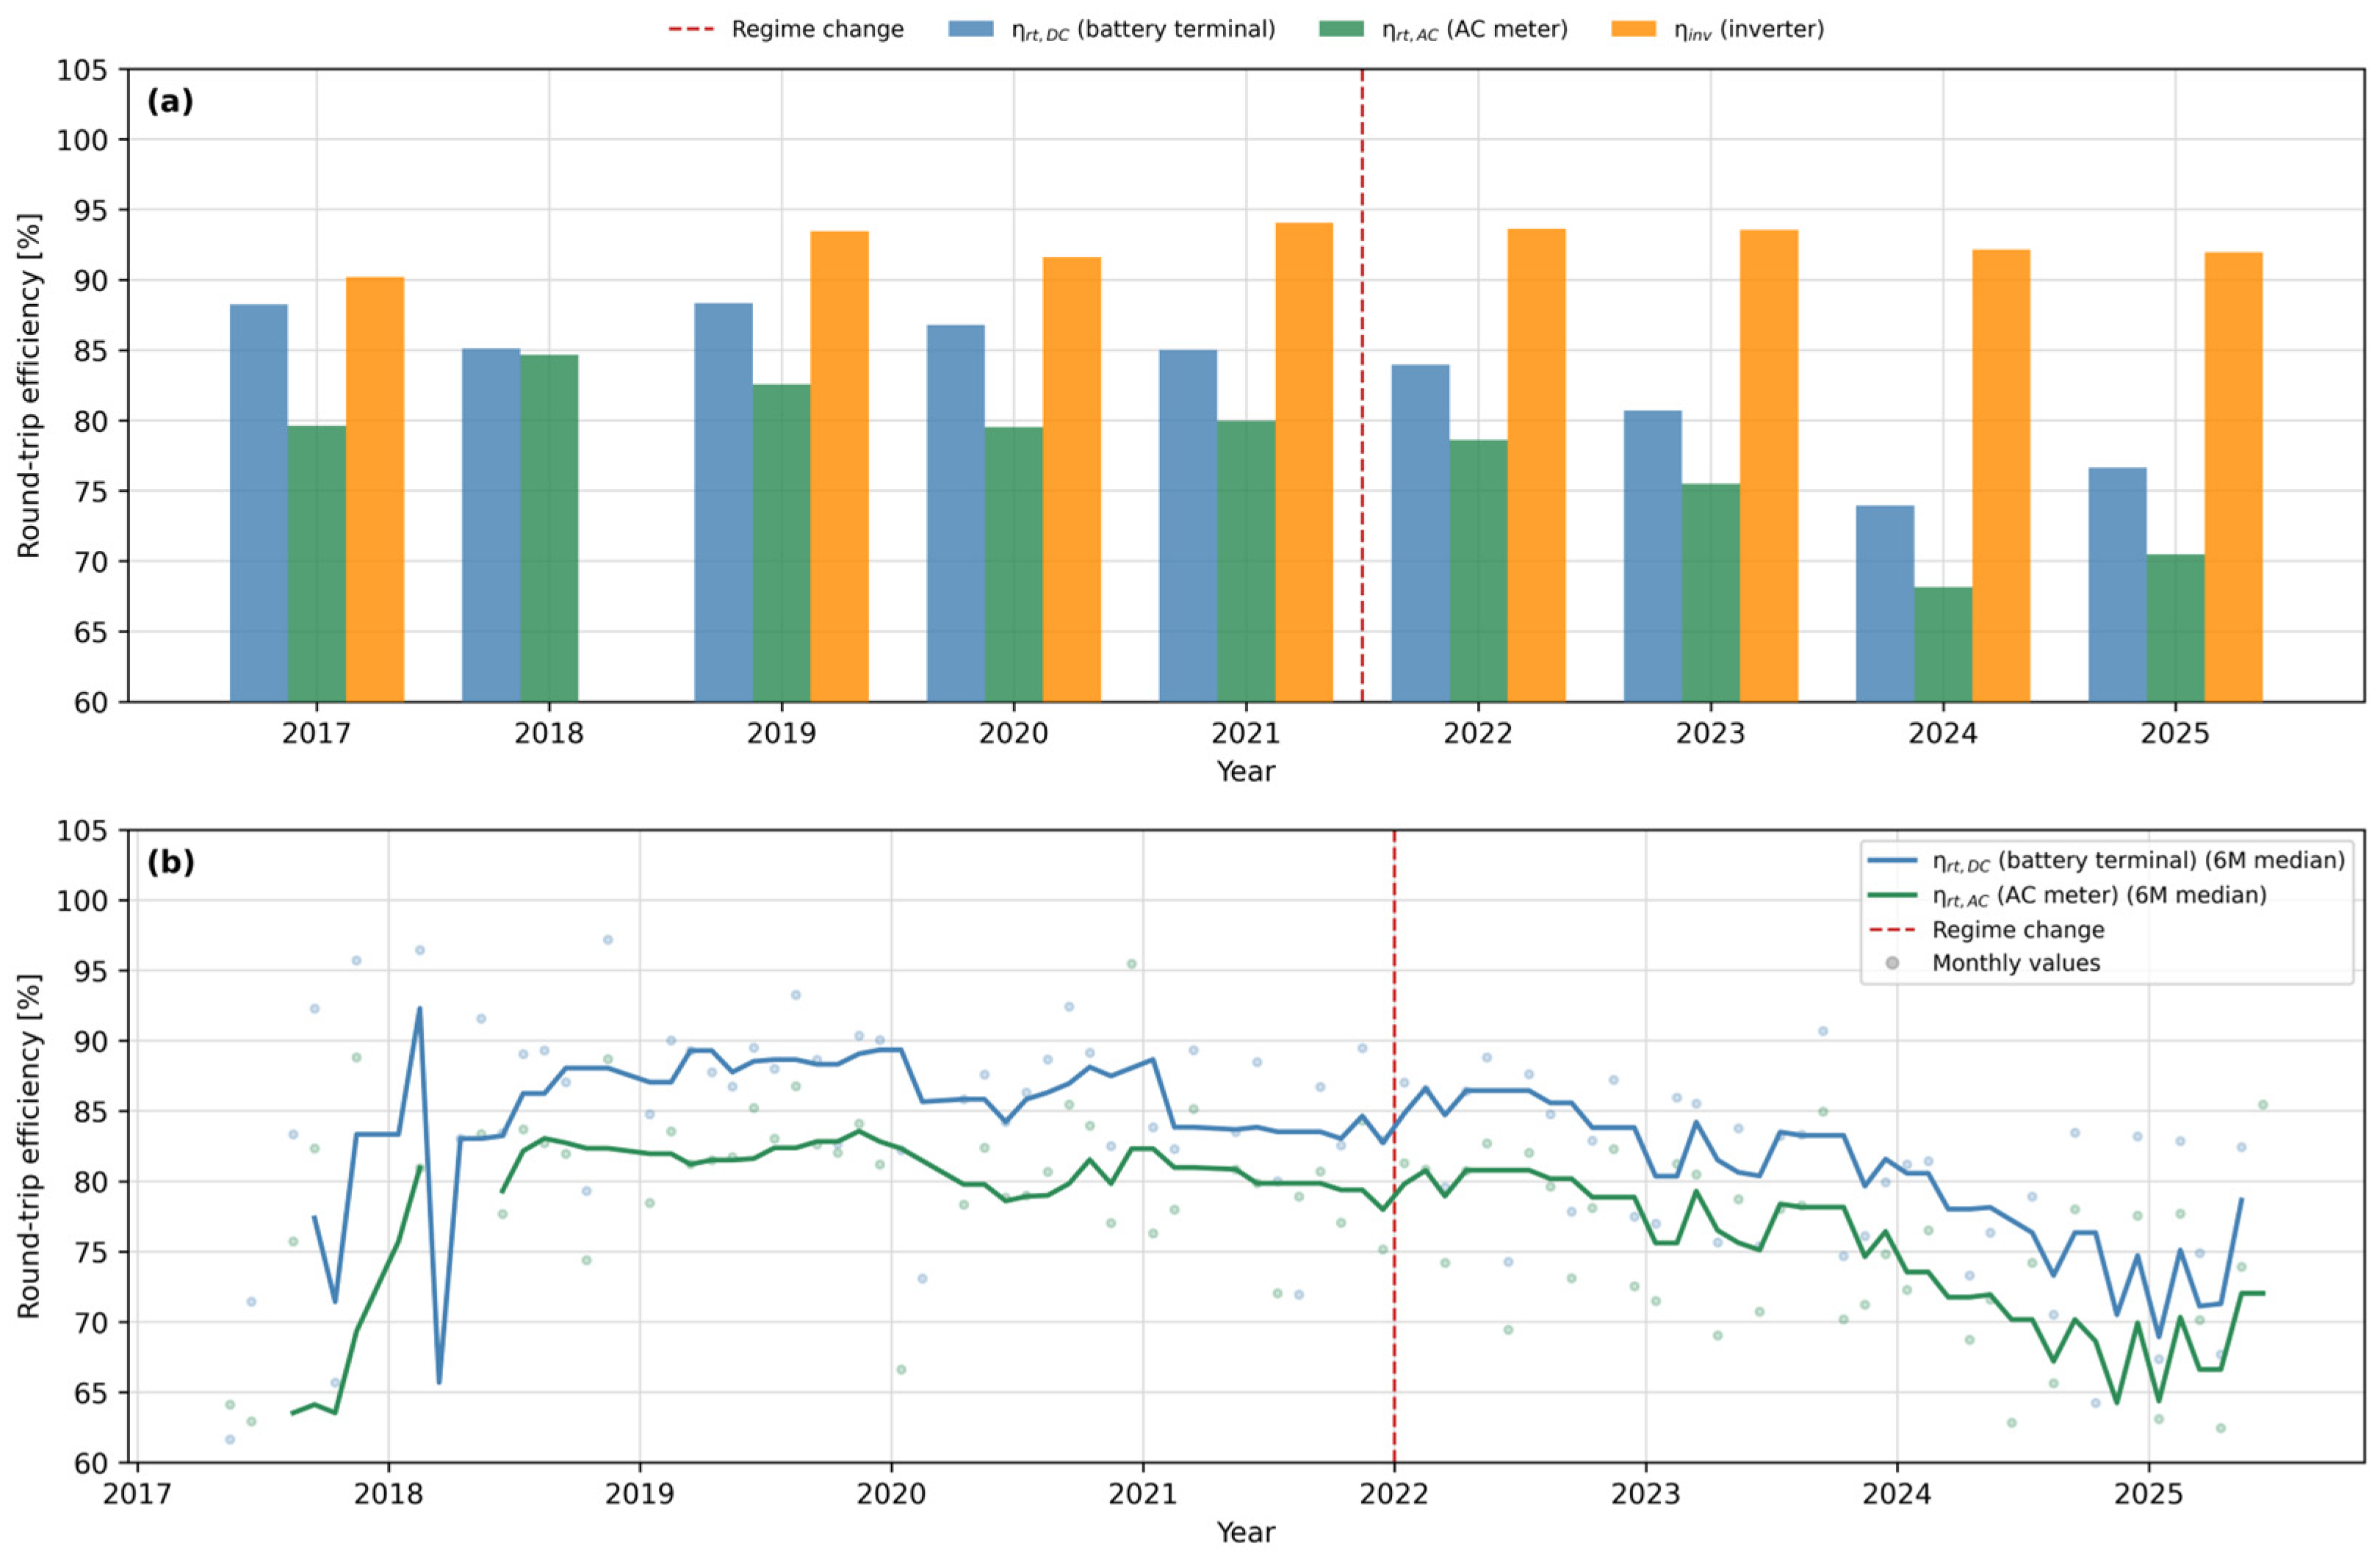
The inverter efficiency is defined as ηinv = ηrt,AC/ηrt,DC and isolates power-electronic losses from battery chemistry losses. It is computable across the full observation period, since both ηrt,AC and ηrt,DC are now available throughout. A value below the theoretical maximum (~95–97% for modern bidirectional inverters) would indicate inverter aging; stability of ηinv over the reserve phase is used as a consistency check on the ηrt,DC trend.
3.3.5. Cable Resistance
DC cable resistance (Rcable) is estimated as the ratio of the voltage difference between the battery and the inverter terminal to the string current at operating points with |I| > 10 A. The inverter-side voltage signal required for this calculation was unavailable after 2021; Rcable is therefore an auxiliary cross-check for the FCR phase only and is not part of the longitudinal degradation indicator set.
3.3.6. Open-Circuit Voltage
Median cell OCV is estimated from string voltage during rest periods (|I| < 2 A, minimum preceding rest of 30 min). As discussed in
Section 5.9, the OCV increase in the reserve phase is primarily attributable to the shift in mean SoC rather than constituting an independent degradation indicator; the metric is therefore not part of the core indicator set but is reported for completeness.
3.4. Operational Mode Classification
Each second is assigned to one of six mutually exclusive operational modes by a priority-ranked evaluation of the BSC opmode flags (
Table 2), then resampled to 1-min resolution by majority vote to suppress sub-minute flag jitter and run-length-encoded into a compact event table.
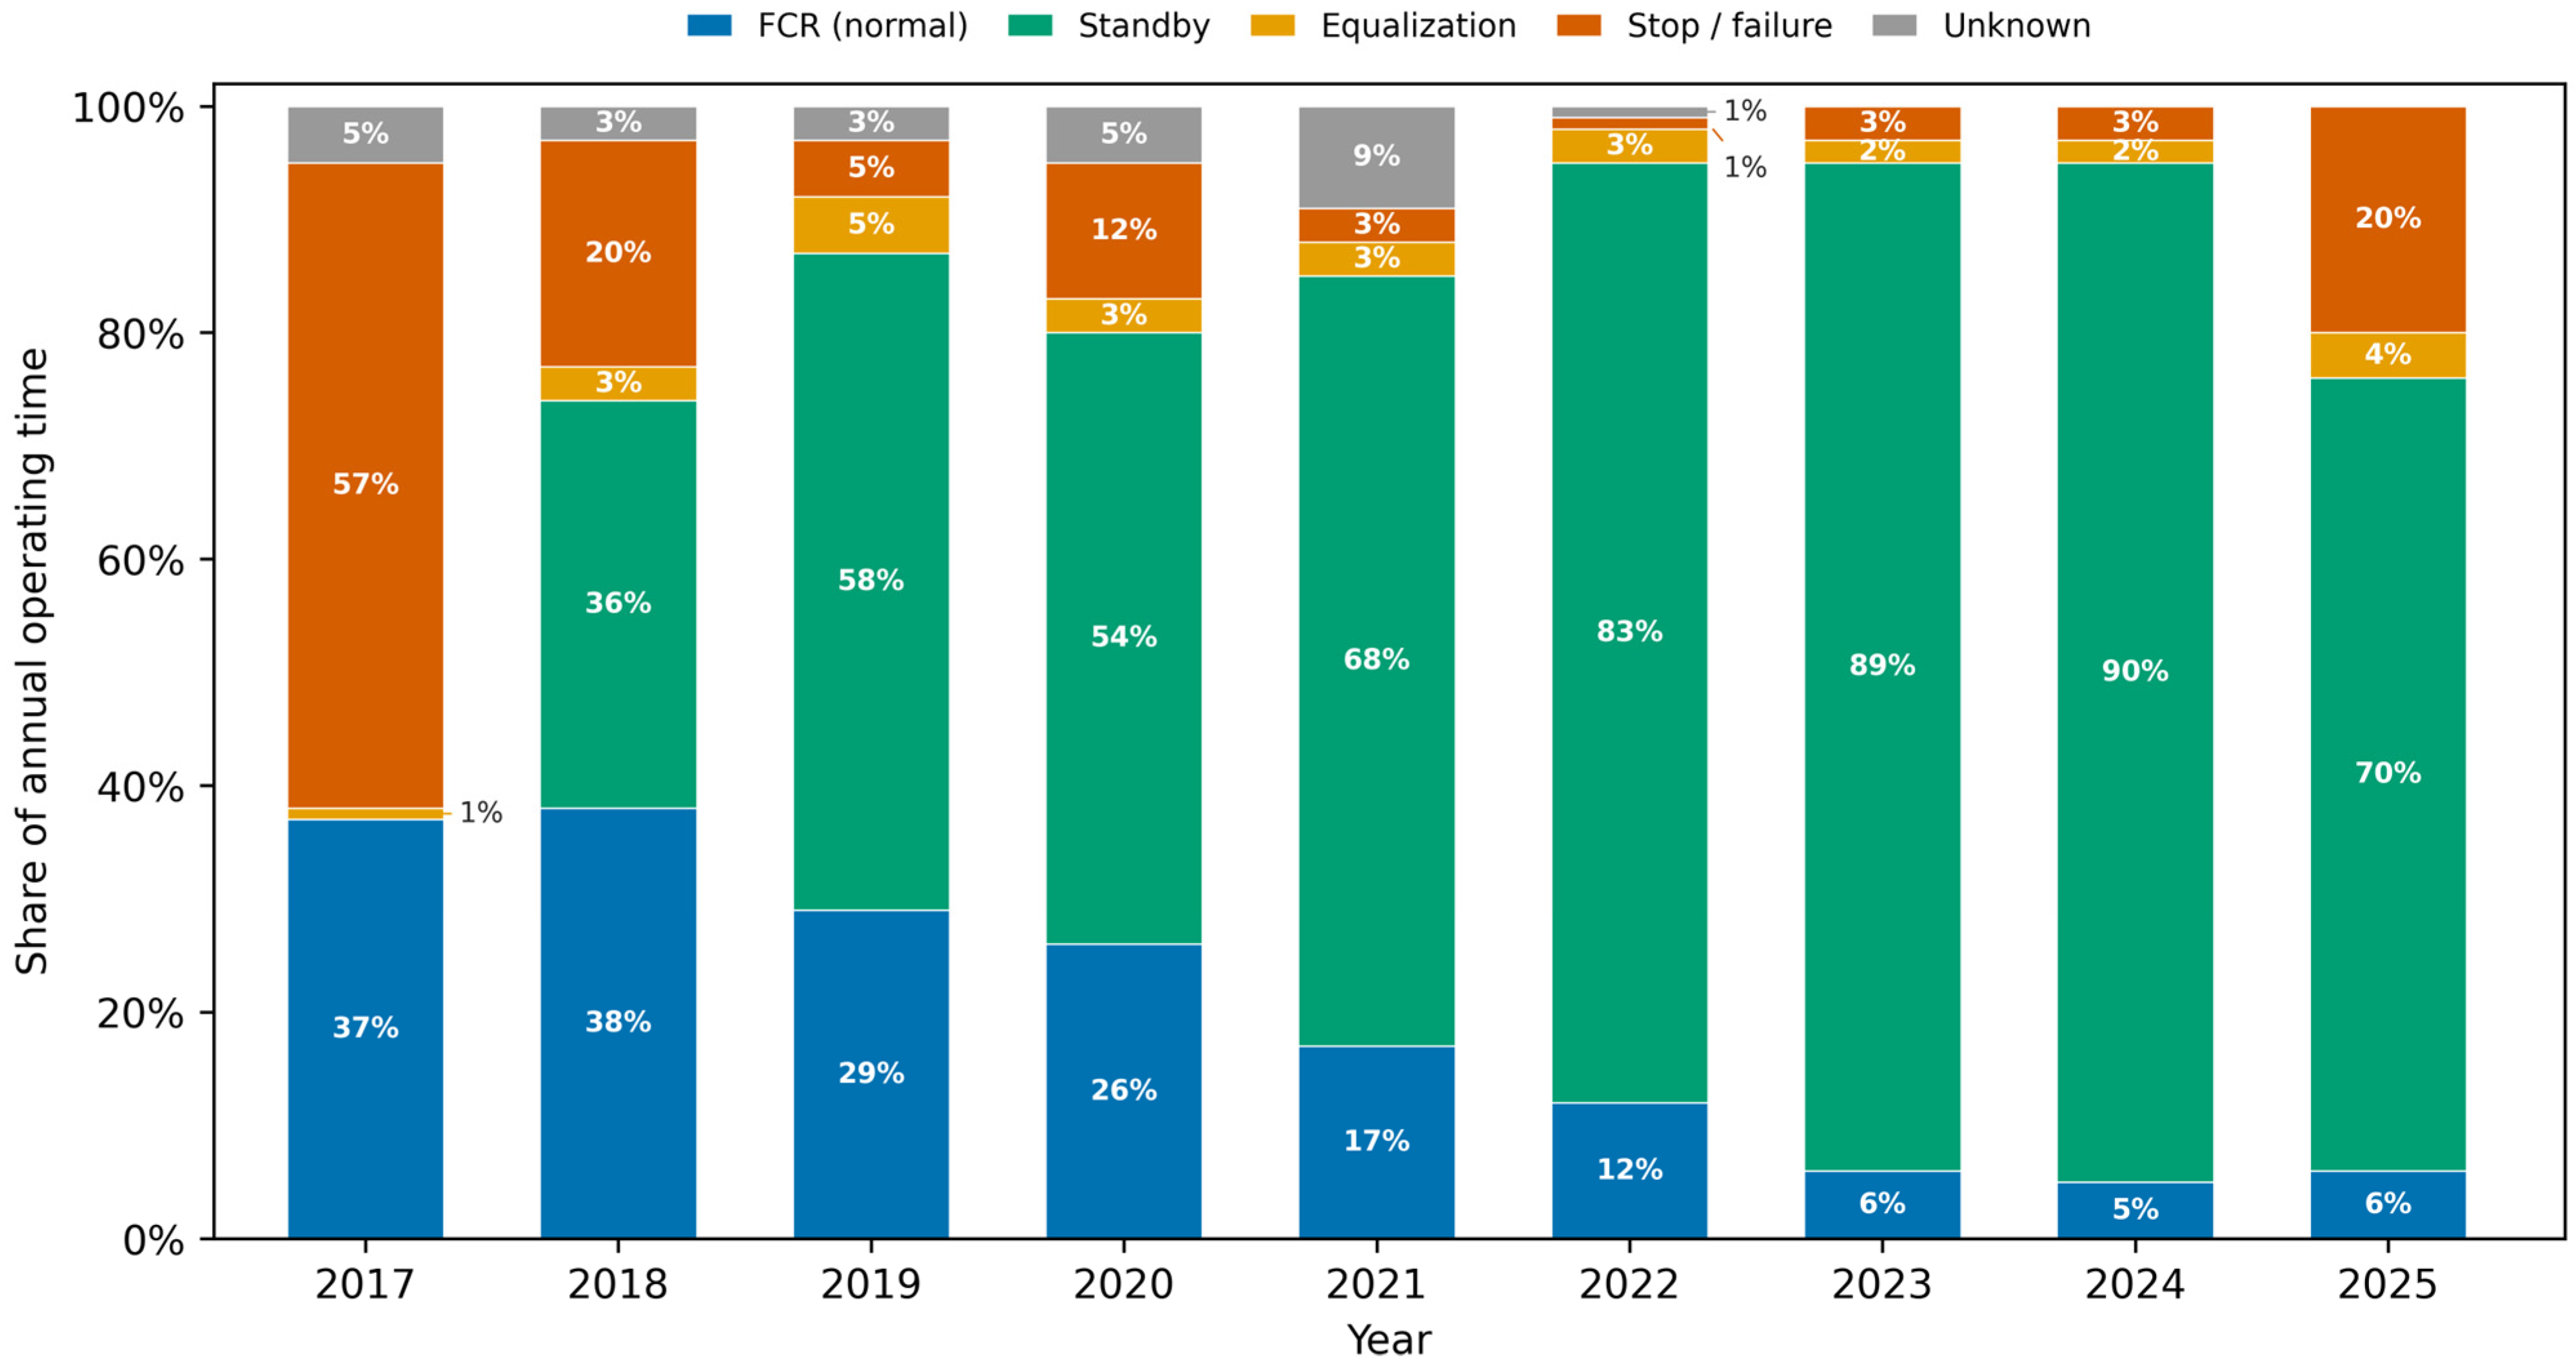
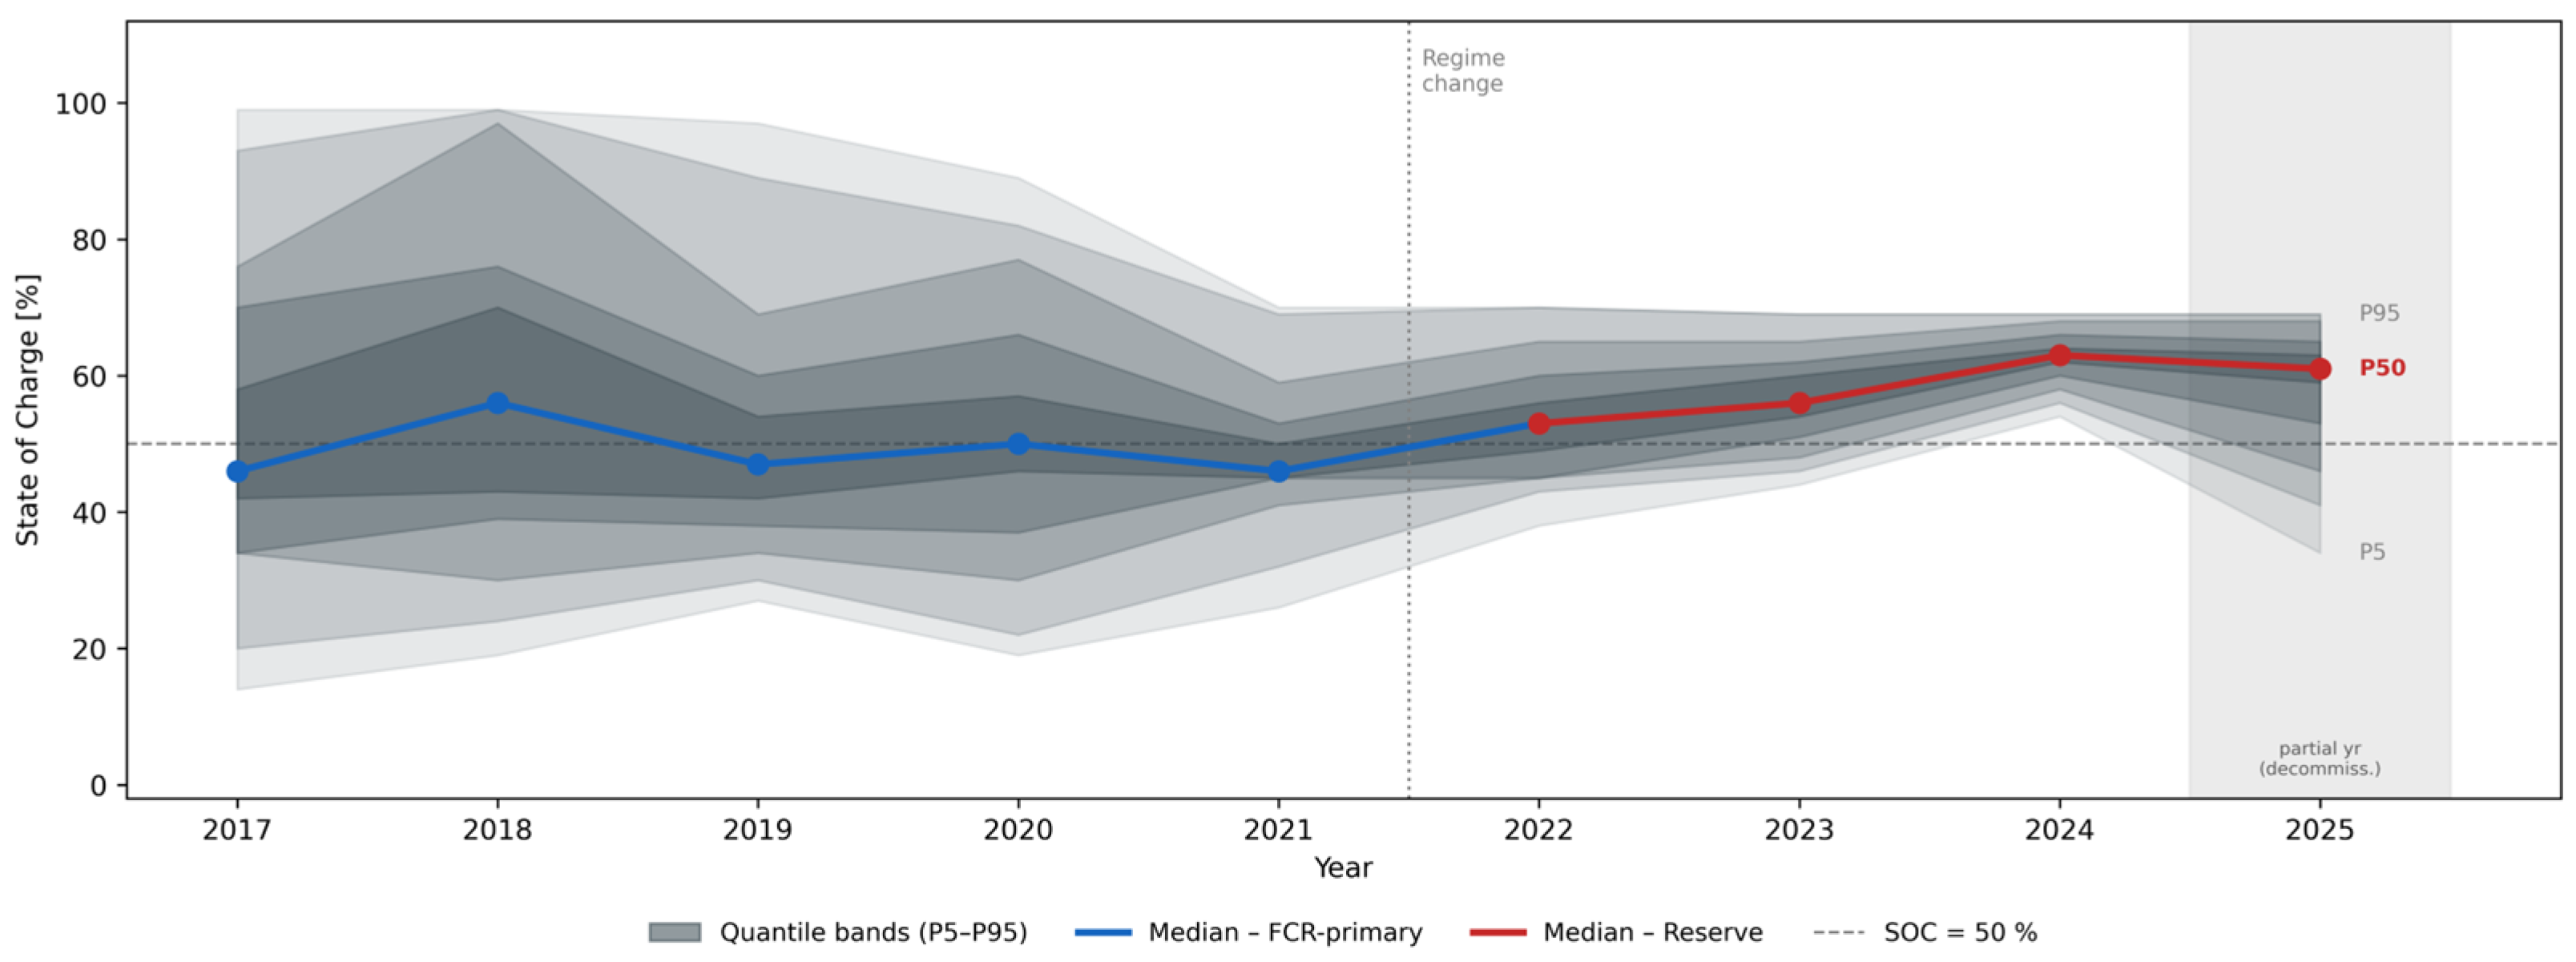
The regime change in 2022 is reflected in a structural shift of the mode distribution: the FCR-normal mode fraction collapsed from 17–38% (2017–2021) to below 12% (2022–2025), while standby became the dominant mode. This shift has direct implications for (i) the SoC distribution experienced by the battery (
Section 3.3.6), (ii) the availability of current pulses for DCIR estimation (
Section 3.3.1), and (iii) the opportunity for equalization charging (see
Section 4.1).
3.5. FCR Stress Characterization
FCR performance is characterized by the FCR-active fraction (fraction of time in PQ mode), tracking RMSE (root mean square deviation between measured power and ideal FCR response), and grid-frequency statistics. Annual FCR energy throughput (charge and discharge separately) is derived from the AC energy counters during FCR-active periods. These metrics serve as proxies for electrochemical stress and are used to contextualize the degradation trajectory.
3.6. Statistical Framework—Aggregation and Trend Analysis
All primary metrics are aggregated at monthly granularity; partial months at the observation boundaries are included in annual summaries but excluded from trend regressions. Linear trends are estimated by ordinary least squares (OLS) regression over annual data. To formally characterize the two-phase aging trajectory, piecewise regressions are fitted separately to the FCR phase (2017–2021, n = 5) and the reserve phase (2022–2024, n = 3, excluding the partial year 2025). Confidence intervals on slopes are computed as ±t_{α/2, n − 2} × SE(b) at the 95% level. The reader is cautioned that the reserve-phase segment contains only three annual data points (df = 1), resulting in necessarily wide confidence intervals; the width of these intervals reflects the limited statistical power rather than uncertainty about the direction of the trend, which is confirmed by R2 = 0.998.
3.7. Data Availability
The processed one-second-resolution dataset underlying all results in this paper are available in a public repository (see Data Availability Statement). The dataset comprises the signal channels listed in
Table 1 with human-readable column designations; the mapping between these designations and the original manufacturer register names is provided in the accompanying dataset codebook. The decision to publish the processed dataset rather than the raw manufacturer exports reflects both data-volume considerations and the aim of maximizing usability for independent replication.
5. Discussion
This chapter interprets the empirical results reported in
Section 4 against the paper’s central question: what can an eight-year operational field dataset reveal about the degradation of a lead–acid BESS, and how far can system-level indicators attribute the observed changes to specific mechanisms? The discussion is structured to first present the two primary empirical findings (the primary and secondary findings below), then evaluate the mechanistic possibilities without overstating what the data can prove (
Section 5.1,
Section 5.2,
Section 5.3 and
Section 5.4), and finally address validity, statistics, operational implications, and limitations (
Section 5.5,
Section 5.6,
Section 5.7,
Section 5.8,
Section 5.9,
Section 5.10,
Section 5.11 and
Section 5.12).
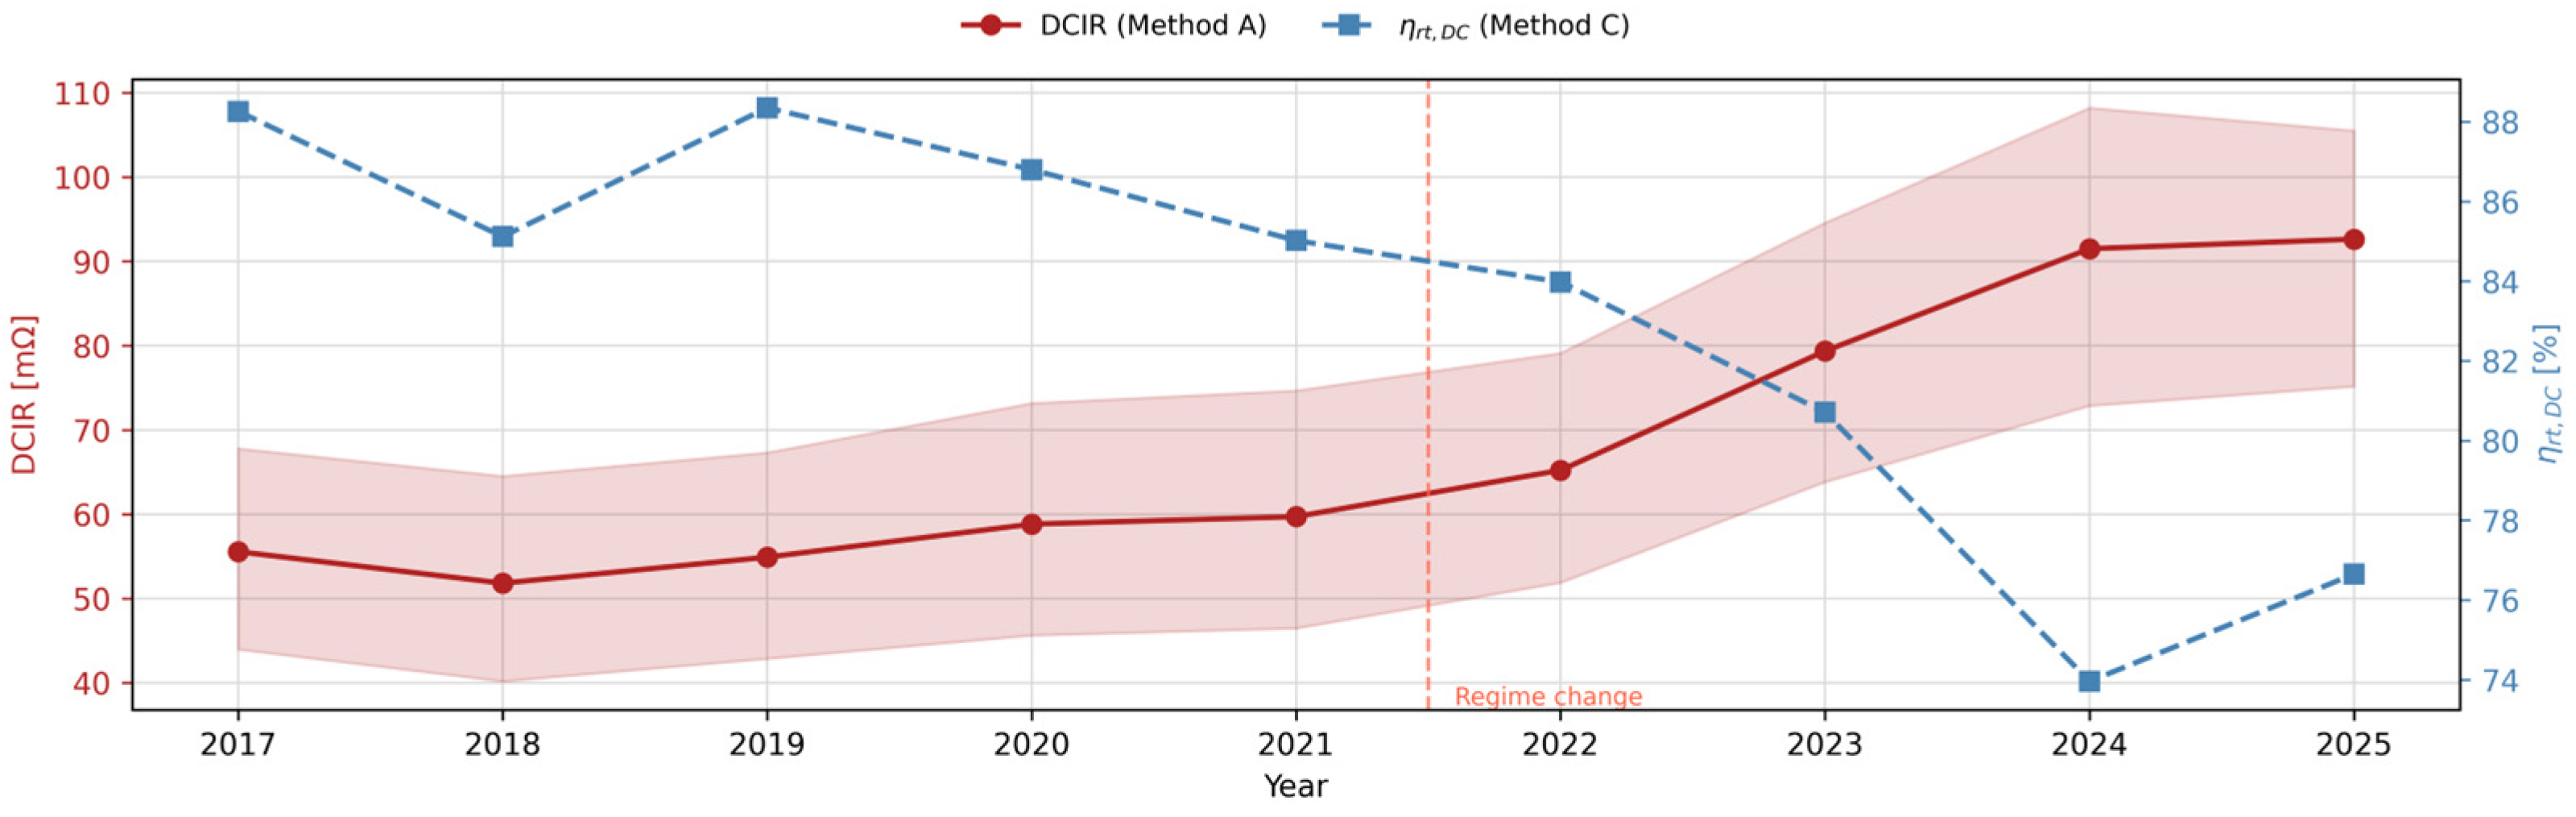
Primary finding: no statistically detectable degradation during FCR operation. The most important and probably most counterintuitive result of this study is the relatively negligible effect of the FCR operating modes on degradation. Over five years of continuous FCR-primary service (2017–2021), neither the DCIR growth rate nor the η
rt,DC trend (
Section 4.2,
Table 4) is statistically distinguishable from zero at any conventional significance level.
This non-result is substantively meaningful, not merely a power problem. The dataset covers approximately 145 million one-second measurements across the five-year FCR phase (2017–2021). The FCR-phase degradation rates are small not because the data are noisy but because the system genuinely did not degrade measurably during active FCR service. This finding provides field evidence that questions the widespread assumption that FCR-specific PSoC cycling is a primary accelerant of lead–acid degradation. Under the specific operating conditions of M5BAT’s OCSM unit, which benefited from comparatively lower FCR dispatch priority due to the hybrid EMS strategy [
15], periodic equalization charging (maintained throughout the observation period), and a mean SoC of approximately 52%, five years of FCR service left no statistically discernible mark on the two primary health indicators. Accordingly, the negligible degradation observed during the FCR phase is conditional on the continued use of this automated periodic equalization regime. The equalization cycles regularly counteract incipient PSoC sulfation. The finding should therefore not be generalized to FCR operation without a comparable equalization protocol.
This contrast is also evident quantitatively. A throughput-based aging model, calibrated to the reserve-phase resistance growth of 13.14 mΩ/year at a mean annual throughput of 71.6 kAh, would predict an FCR-phase resistance growth of approximately 37.6 mΩ/year, obtained by applying the reserve-phase specific rate of about 0.18 mΩ/kAh to the higher mean FCR throughput of 204.9 kAh/year. The predicted rate is approximately 25 times higher than the observed increase of 1.53 mΩ/year, which was not statistically significant.
The two operating regimes therefore show a clear mismatch between throughput and observed aging. The FCR phase had approximately 2.9 times the annual throughput of the reserve phase, while resistance growth was approximately 8.6 times lower. A throughput-only aging model would consequently misrepresent not only the magnitude of the degradation difference but also its direction. For field-oriented lead–acid aging models, throughput should therefore be complemented by explicit terms for calendar aging and high-SoC standby operation. An equalization state could provide a further relevant model variable. This does not mean FCR operation is harmless to lead–acid cells in general; it means that under the specific dispatch and management conditions of this installation, its effect over this time scale was below the detection threshold of string-level monitoring. Systems with higher FCR dispatch fractions, less equalization, or different SoC management strategies may exhibit different behavior. The result is better framed as a data point about operating regime sensitivity than as a universal exoneration of FCR cycling.
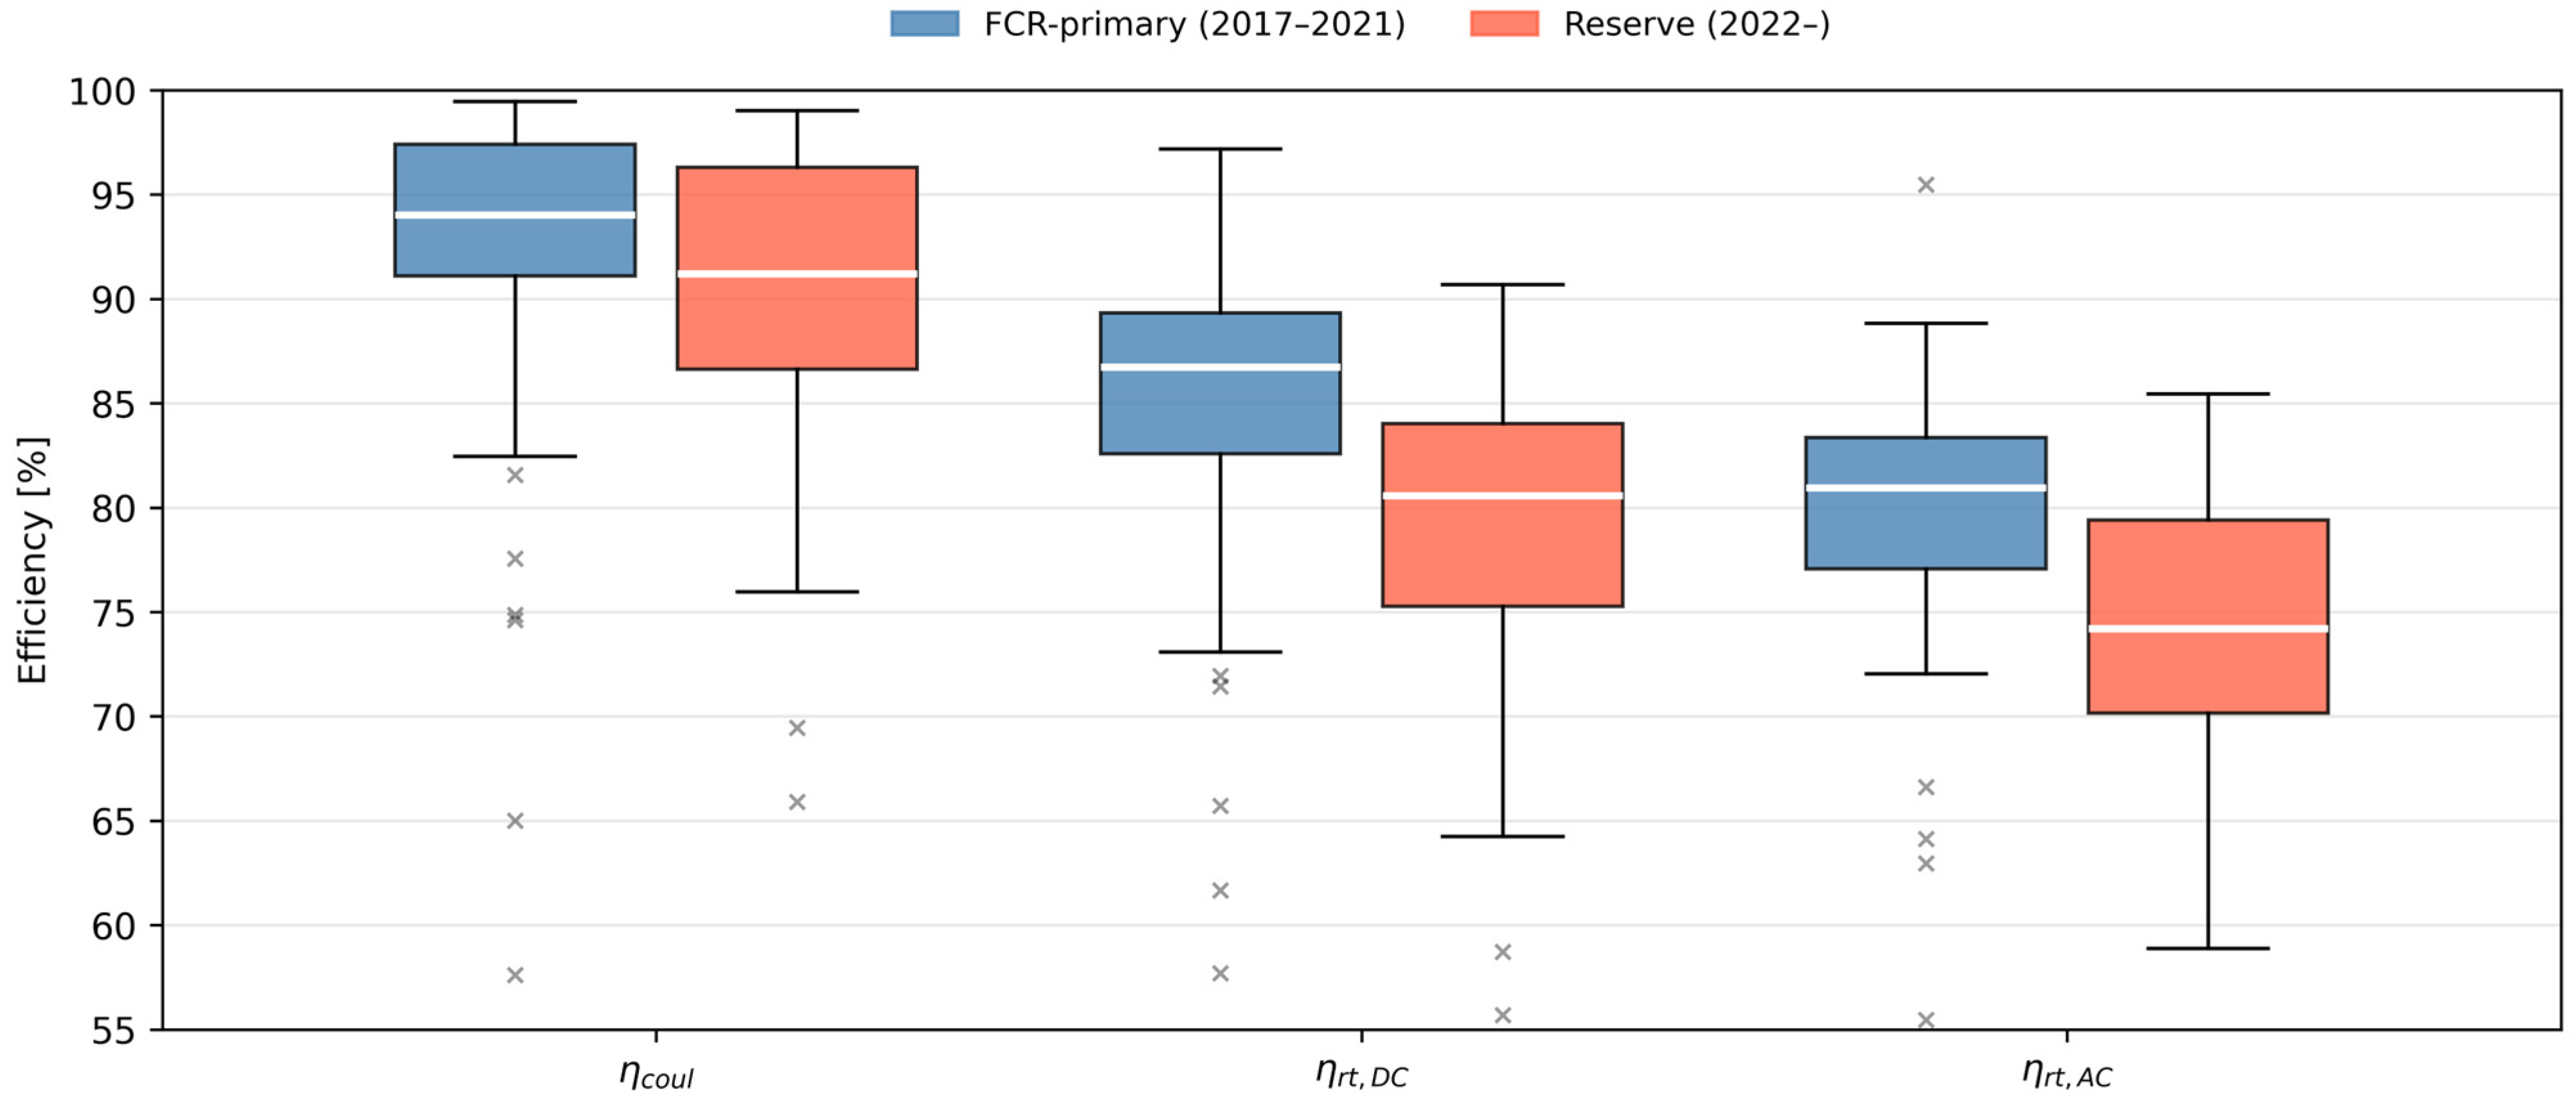
Secondary finding: regime transition correlated with strongly accelerated degradation. Following the 2022 transition to low-utilization reserve operation, all indicators shifted simultaneously and substantially: DCIR growth accelerated sharply while η
rt,DC and η
coul both declined steeply (
Section 4.5,
Table 3). The reserve-phase DCIR slope is much higher than the FCR-phase slope and represents the dominant degradation event in the system’s lifetime to date.
Several factors changed simultaneously at the 2022 boundary: annual Ah throughput fell by more than 50% from the preceding year and continued declining; the fraction of time spent below 50% SoC collapsed from 42% to below 2% by 2024; mean SoC rose into the upper half of its range; the FCR-active fraction dropped from 17% to 12% and continued falling; and the measurement environment changed (the inverter-terminal voltage signal, named voltage_inv_V_bsc, became unavailable). The result is a clean empirical observation—degradation accelerated sharply after 2022—but a multi-factor confound that prevents attribution of the acceleration to any single cause. The discussion of candidate mechanisms that follows (
Section 5.1,
Section 5.2,
Section 5.3 and
Section 5.4) is therefore presented explicitly as hypothesis generation, not mechanistic confirmation.
The multi-indicator signature observed from 2022 onward—rising DCIR, falling ηcoul, falling ηrt,DC—is consistent with several degradation mechanisms, which are discussed in order of their evidential support from the available data.
5.1. High-SoC, Low-Throughput Standby
The combination most strongly supported by the data is low-throughput, high-SoC standby. First, pSoC <50% fell from 42–59% in the FCR years to 1.4% in 2024: the cell almost never discharged into the lower half of its SoC range and spent most of its time at elevated SoC, where positive-grid corrosion and calendar aging dominate and lead sulfate formed during partial discharge is incompletely reconverted. Second, annual throughput collapsed by roughly 92%, removing the regular deeper cycling that promotes electrode reconditioning. Equalization charging, by contrast, continued at a comparable cadence throughout both regimes (≈2–3% of operating time;
Figure 1), so the acceleration occurred despite this countermeasure; whether an adjusted equalization protocol contributed cannot be resolved from the data. These observations are consistent with progressive sulfation and calendar-dominated aging (Pavlov [
14], Ruetschi [
12]; calendar-aging dominance is also reported for M5BAT by Jacqué et al. [
16]) but cannot be confirmed without cell-level evidence such as EIS, acid-density readings, or postmortem plate analysis.
5.2. Calendar Aging and Corrosion
The positive grid of lead–acid cells undergoes progressive oxidation regardless of cycling history, at a rate determined primarily by temperature and electrolyte concentration [
12]. Over eight years, calendar-aging-driven grid corrosion is expected to contribute to rising DCIR independently of operating regime. The near-zero FCR-phase DCIR trend does not exclude this mechanism but suggests either that the corrosion rate was below the string-level measurement resolution during active cycling, or that cycling-induced effects (plate flexion, active material mixing) partially mitigated the corrosion signature. Calendar aging becomes a proportionally larger contributor as cycling declines [
19], which is consistent with the post-2022 acceleration, but cannot be separated from the sulfation contribution without a controlled experiment.
5.3. Electrolyte Stratification
Flooded lead–acid cells are susceptible to electrolyte stratification under low-utilization conditions, where concentration gradients develop between the upper and lower portions of the cell. Stratification increases local corrosion near the electrolyte surface, reduces effective SoC estimation accuracy, and can accelerate sulfation in the upper plate regions. Although equalization gassing, which mechanically mixes the electrolyte, did continue, the sharply reduced cycling and prolonged high-SoC dwell provide extended resting periods in which stratification can develop [
13]. The widening of the annual DCIR interquartile range from 24 mΩ (FCR years) to 35 mΩ (reserve years) is consistent with increasing intra-string heterogeneity, which stratification would promote. However, this is also consistent with accelerating cell-to-cell divergence from any of the above mechanisms.
5.4. What the Data Cannot Distinguish
The three mechanisms described above are not mutually exclusive and likely co-occur. Under prolonged high-SoC standby they are mutually reinforcing: positive-grid corrosion raises local resistance and consumes water, promoting acid stratification, while stratification concentrates acid in the lower plate region and locally accelerates both corrosion and the sulfation of incompletely reconverted lead sulfate, whose stable crystals in turn reduce active surface area and raise polarization. A field-measured DCIR rise is therefore the aggregate signature of a coupled degradation cascade rather than of any single isolated mechanism [
12,
14]. System-level field data alone, providing DCIR, efficiency, and OCV, cannot distinguish between them because they produce overlapping multi-indicator signatures. The measurements that would narrow the mechanistic uncertainty are: (a) electrochemical impedance spectroscopy (EIS) to separate capacitive, charge-transfer, and diffusion-limited resistance components; (b) electrolyte acid density measurements to directly detect stratification and loss of active material; (c) capacity measurements from controlled full-discharge cycles, including incremental capacity analysis (ICA) and differential voltage analysis (DVA), to quantify capacity fade and resolve electrode-level aging modes independently of DCIR; and (d) postmortem plate analysis to identify sulfate crystal morphology. None of these were available in the operational dataset.
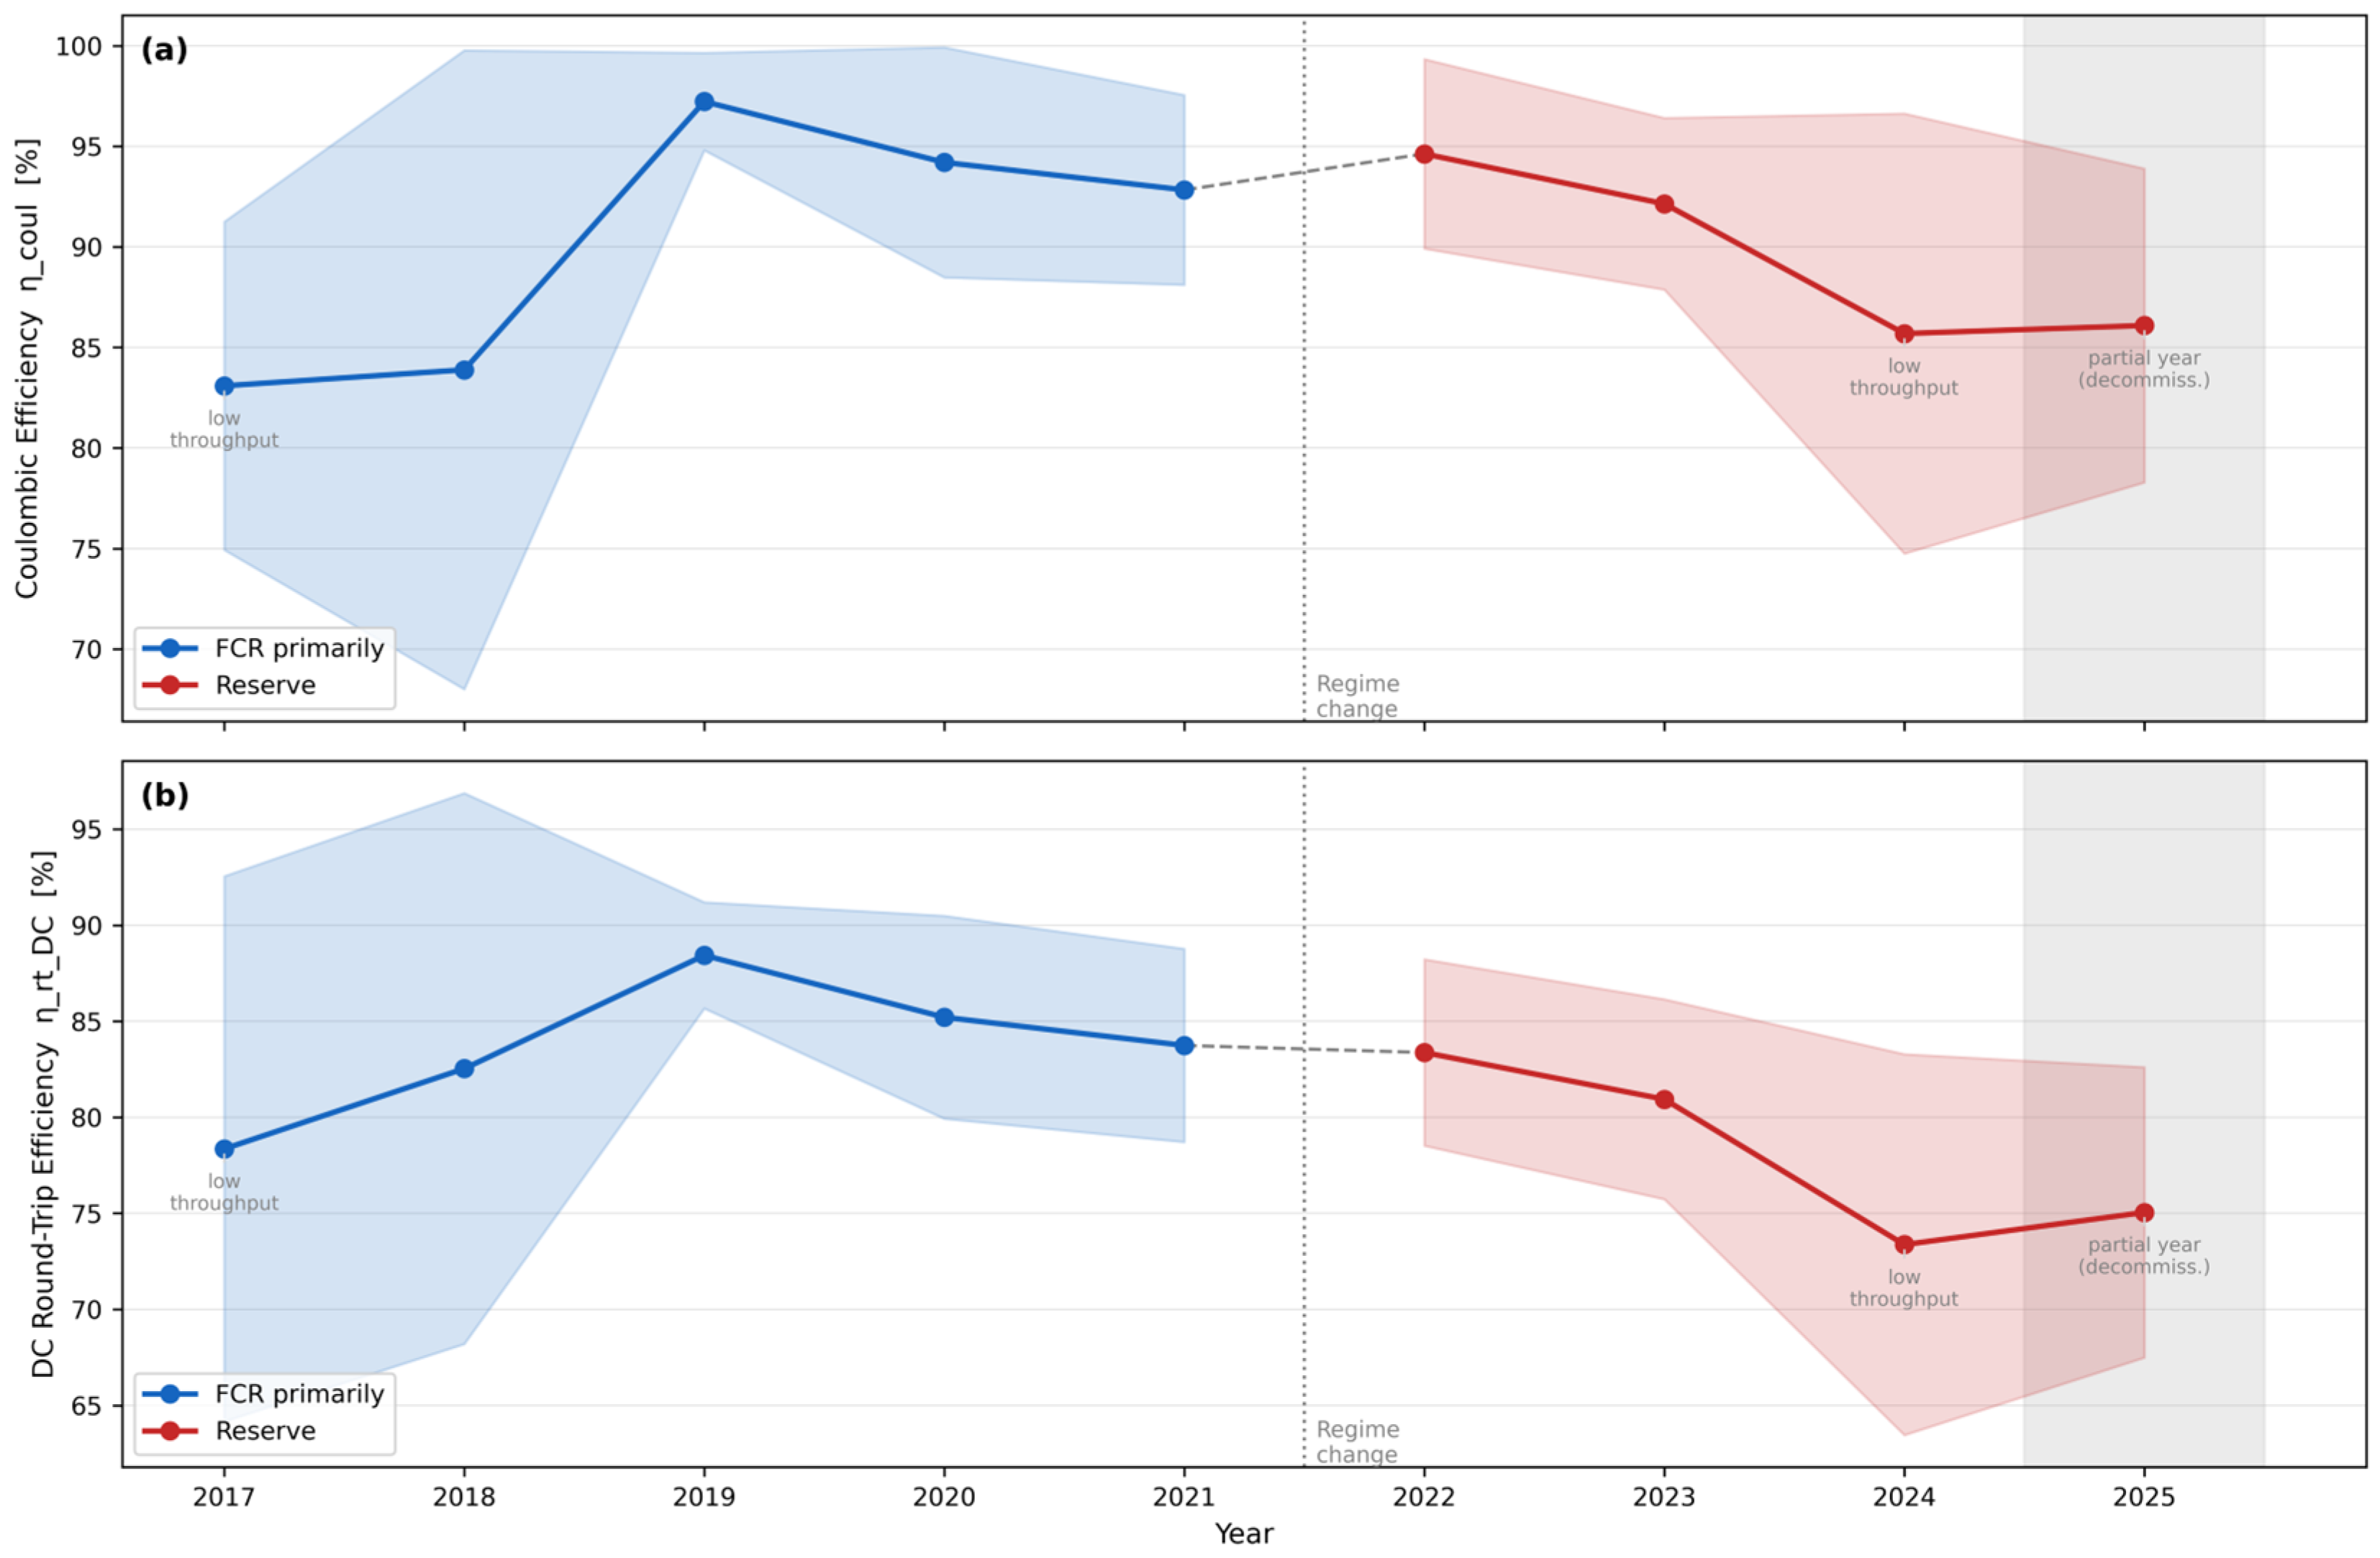
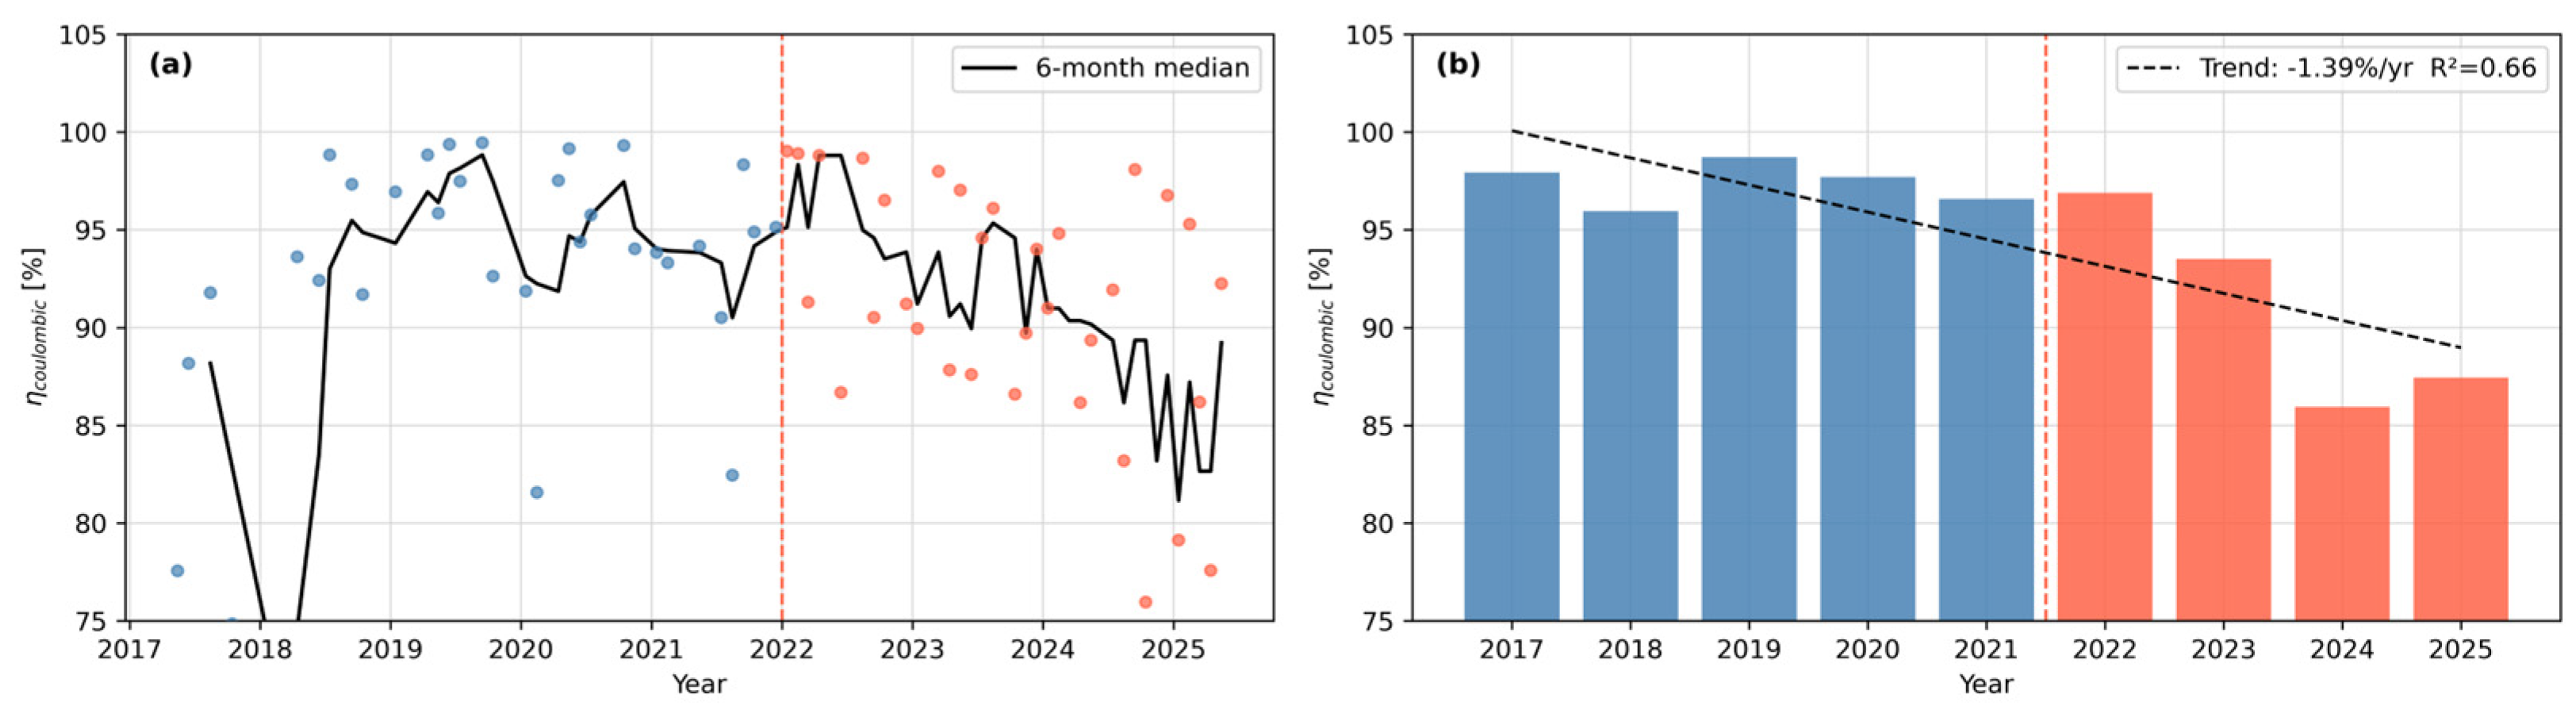
5.5. Coulombic Efficiency: Causal Direction
η
coul fell from 98.7% (2019) to 86.0% (2024). The causal pathway connecting electrode degradation to coulombic efficiency loss in lead–acid cells works as follows: rising electrode resistance or reduced active surface area increases polarization during charging → elevated electrode potential promotes parasitic hydrogen and oxygen evolution → a larger fraction of charge current is consumed by gas evolution rather than the Faradaic reaction, reducing η
coul [
12]. In this sequence, electrode degradation (from whichever mechanism) is upstream of the η
coul decline. The decline of 12.7 pp in η
coul over five years is therefore consistent with progressive electrode deterioration and does not by itself distinguish sulfation from corrosion or stratification.
5.6. Inverter Efficiency as an Independent Indicator
ηinv (93–94% in 2022–2023, declining to 91% by 2025) remained substantially more stable than ηrt,DC (which declined by >10 pp over the same period). This comparison provides a useful methodological validation: the ηinv cross-check confirms that the ηrt,DC decline is attributable to the battery, not to inverter aging, and bounds the inverter-attributable bias on system-level efficiency metrics to below 3 pp.
5.7. Temperature Effects on DCIR
No temperature correction was applied to the DCIR data. As quantified in
Section 3.3.1, the mean battery temperature measured from the operational record differs by only about 1 °C between regimes, with the reserve phase marginally warmer than the FCR phase; the resulting temperature contribution is at most 0.8–1.6% of the observed DCIR increase and is of the opposite sign to the rise. A slightly lower standby temperature can therefore be excluded as the cause of the post-2022 increase, and the regime comparison is unaffected.
5.8. Statistical Robustness and Model Choice
Table 4 summarizes the statistically significant full-dataset OLS trends. All chemistry-specific degradation trends (DCIR, BMS efficiency, pSoC distribution) are significant at
p < 0.001–0.028. The FCR-activity trends (R
2 = 0.926–0.957) are the strongest predictors in the dataset but reflect operational decisions, not battery chemistry.
The full-dataset OLS model conflates the two phases and yields a single slope of +5.01 mΩ/year that underestimates the reserve-phase rate and overestimates the FCR-phase rate. A piecewise model with a structural break at 2022 better represents the physics of the two-regime trajectory. To formally validate this choice, a Chow test [
20] was applied to each of the three primary indicators at the hypothesized breakpoint of 2022. The test rejects the null hypothesis of parameter stability for all three: DCIR (F = 83.3,
p < 0.001), η
rt,DC (F = 7.2,
p = 0.047) and η
coul (F = 12.8,
p = 0.018). The structural break at 2022 is therefore statistically established across all core degradation metrics. Bootstrapped 95% confidence intervals (B = 10,000 resamples) on the piecewise OLS slopes confirm the key findings. In the FCR phase, the efficiency trends are statistically indistinguishable from zero: η
rt,DC slope CI [−1.7, +0.8] pp/a and η
coul CI [−1.1, +1.1] pp/a both span zero. In the reserve phase, the slopes are bounded clearly away from zero: η
rt,DC [−6.8, −3.3] pp/a, η
coul [−7.6, −3.4] pp/a, and DCIR [+8.0, +12.1] mΩ/a. The reserve-phase DCIR slope thus has a bootstrap CI that excludes zero despite resting on only three annual data points (df = 1), indicating that the directional evidence is robust to the limited sample size even if the precise magnitude remains uncertain.
As a further robustness check that does not rely on the three annual aggregates, the distributions of higher-resolution indicator values were compared between regimes using the non-parametric Mann-Whitney U test, which makes no distributional assumption and is insensitive to the seasonality that would confound a monthly trend regression. Weekly per-cell DCIR (n = 238 vs. 181) and monthly DC round-trip efficiency (n = 49 vs. 28) both differ highly significantly between the FCR and reserve phases (DCIR median 0.19 → 0.27 mΩ per cell, U = 8270, p < 0.001; ηrt,DC median 86.8% → 81.8%, U = 395, p = 0.002), confirming that the post-2022 shift is detectable well below annual resolution. Monthly coulombic efficiency, the noisiest indicator, shows a smaller distributional shift that does not reach significance (94.1% → 91.2%, p = 0.22), consistent with its lower signal-to-noise ratio. These distribution-level results confirm the Chow test and bootstrap confidence intervals without depending on the limited number of annual data points.
5.9. OCV Interpretation
Median cell OCV rose from 2.045–2.088 V/cell (FCR phase) to 2.080–2.103 V/cell (reserve phase). Two interpretations apply: First, the rising mean SoC in reserve operation (52% → 63%) thermodynamically implies a higher OCV at rest. This is an artifact of the changed operating point, not a degradation signal. Second, electrolyte stratification can produce apparent OCV elevation due to acid concentration gradients [
14]. The first interpretation is more frugal and is the primary explanation; the second cannot be excluded but requires acid-density evidence to support. The OCV trend therefore does not add independent mechanistic information beyond what is already conveyed by the SoC distribution data.
5.10. Implications for Battery Management
These field results are consistent with findings from previous studies on lead–acid batteries. Shamim et al. [
8] reported from controlled VRLA tests under peak-shaving and frequency-regulation duty cycles that degradation was influenced more strongly by the state-of-charge operating window than by cycling intensity. This is consistent with the present observation that resistance growth coincided with high-SoC standby operation rather than with the higher throughput during FCR operation. Ruetschi [
12] and experience from valve-regulated batteries in float service [
21] identify positive-grid corrosion at sustained high SoC as an important calendar-driven life-limiting mechanism. This provides a plausible explanation for the behavior observed during the reserve phase. The contribution of the present work lies primarily in the duration and operating context of the field record. It covers eight years at one-second resolution for a full-scale battery string operated under real grid conditions, rather than accelerated laboratory testing of individual cells. Two practical implications follow from these findings. First, operating guidelines and prequalification frameworks for stationary lead–acid batteries in reserve and standby applications should specify active SoC management and periodic cycling in addition to an equalization schedule. Second, DC round-trip efficiency can serve as a low-cost indicator for continuous health monitoring. It can be calculated from standard BMS counters and showed a strong relationship with internal-resistance growth in the investigated system (r ≈ −0.98).
Avoid prolonged high-SoC, low-throughput standby; use periodic cycling and active SoC management even in reserve service. The transition into this regime in 2022 is the operational change most strongly associated with the onset of accelerated degradation. Equalization charging should be maintained as good practice, but on this evidence did not by itself prevent the standby-phase degradation.
Monitor η
rt,DC as a rolling monthly health indicator. It is computable from existing BMS counter signals and tracks internal resistance closely (
Section 4.2), providing an actionable degradation metric without additional instrumentation.
Treat regime transitions from active cycling to extended standby as degradation risk events, not purely as operational decisions. For lead–acid chemistry, low-throughput high-SoC standby appears to be a more damaging regime than high-throughput partial-SoC FCR cycling. This is contrary to the common intuition that reserve service is inherently less stressful.
The data further suggest that the choice of maintenance charging protocol is a more decisive determinant of lead–acid longevity than the operating regime per se. A battery held in prolonged standby at elevated SoC is exposed to a more adverse, calendar-dominated electrochemical environment than one actively dispatched for FCR. This is contrary to the common intuition that reserve operation is inherently the less stressful mode. This has a practical corollary: reserve and emergency-power applications, which rarely generate sufficient cycling throughput to drive autonomous electrode reconditioning, may be structurally more susceptible to sulfation than FCR-operated systems with comparable chemistry. Mixed-mode operation, combining periodic market-coupled dispatch with scheduled equalization cycles, may therefore represent a viable strategy for extending service life in low-utilization applications.
More broadly, the results provide implications for technology portfolio decisions in hybrid multi-technology BESS. The OCSM lead–acid unit at M5BAT showed no measurable FCR-induced degradation over several years of operation, indicating that lead–acid technology need not be excluded from such configurations a priori. This result was obtained under an operating strategy in which the lead–acid unit had lower FCR dispatch priority than the co-located lithium-ion units and was subject to active SoC management.
The finding is nevertheless conditional. The battery was still in an early stage of its operational life during the FCR-primary period from 2017 to 2021. The rapid deterioration after 2022 also shows that a stable FCR-phase health record does not imply long-term durability under changing operating conditions. The suitability of lead–acid technology in hybrid BESS therefore depends on maintaining operating and maintenance conditions that avoid prolonged high-SoC standby.
These findings can be considered alongside the established recycling infrastructure for lead–acid batteries and the potential for further cost reductions through improvements in recycling processes [
22]. In this context, lead–acid technology may retain a role in hybrid configurations where dispatch and maintenance strategies can be adapted to its specific operating requirements. This consideration becomes more relevant as alternative battery chemistries, including sodium-ion, advance as potential low-cost technologies based on more abundant materials [
23]. At the same time, the continued cost reduction of lithium-ion technology [
24] limits the relevance of lead–acid technology based on performance or cost alone. Its potential role therefore depends increasingly on factors such as established recycling infrastructure and demonstrated long-term operating behavior. Long-term field datasets such as the one analyzed here are essential for characterizing aging over timescales that cannot be reproduced by laboratory testing alone.
5.11. Strategic and Economic Context
The eight-year observation window above invites a what-if economic question, posed deliberately without assuming any lead–acid system price. For a given storage service, the annualized capital cost per unit of usable energy is (C/D)·CRF(r,T), where C is the installed cost per nominal kWh, D the usable depth of discharge, T the service life, and CRF the capital recovery factor. Equating this across technologies yields a break-even lead–acid cost C
Pb* = C
Li·(D
Pb/D
Li)·[CRF(r,T
Li)/CRF(r,T
Pb)]. With the illustrative TPb = 8 a against a representative lithium-ion service life of 12 a, usable depths of 0.5 and 0.9, and a 6% discount rate, lead–acid reaches capital-cost parity at roughly 40% of the lithium-ion installed cost; for a representative installed lithium-ion cost of 250 €/kWh, this implies a break-even near 100 €/kWh (about 30–55% across the plausible-assumption range;
Table 5). Two factors not captured here, namely lead–acid’s lower round-trip efficiency and larger footprint, would lower this threshold and are noted as caveats rather than quantified. This is a scenario, not a cost forecast: the present data establish an eight-year observation window, not an aging-defined service life or the cost outcome.
Taken together with the break-even scenario discussed above, the eight-year observation period indicates that aging alone does not preclude the use of flooded lead–acid batteries for grid services. If installed costs were to fall below approximately 40% of those of lithium-ion systems, the established supply chain and recycling infrastructure could become relevant advantages, provided that no additional aging penalty emerges under comparable operating conditions. This represents a hypothesis for further techno-economic investigation rather than a firm conclusion of the present study.
5.12. Limitations and Future Work
- (1)
Temperature correction. Because the battery room is actively climate-controlled (
Section 3.3.1), the measured inter-regime battery-temperature difference is only about 1 °C (the reserve phase marginally warmer), which bounds the temperature-attributable DCIR bias below 2% of the observed increase and of opposite sign; a temperature-corrected analysis using the logged signal is identified as future work and does not affect the qualitative findings or regime-comparison conclusions.
- (2)
Capacity measurement. The multi-indicator framework of this study is deliberately confined to continuous one-second operational data; dedicated capacity or reference-performance tests are not part of it. Sparse periodic reference capacity tests do exist in the dataset (the final one, on 14 April 2025, indicating about 21% residual capacity) and are used here only as an independent external cross-check: they corroborate the direction and severity of the degradation already captured by the operational indicators and therefore do not alter the conclusions. Because deep-discharge events were infrequent (fewer than 50 over eight years) and were performed under heterogeneous conditions, these tests cannot form a continuous capacity trajectory and are not used as a quantitative indicator; incorporating such reference measurements would extend this study beyond its operational-data scope. Planned future work on charge acceptance (CA) as an early-stage indicator [
25] would complement the current DCIR-based framework.
- (2b)
C-rate and efficiency comparability. The reserve phase operated at a markedly lower average C-rate than the FCR phase; by the Peukert effect this should improve coulombic and round-trip efficiency independently of aging [
14]. Efficiency nonetheless declined (
Section 4.2), so the underlying electrochemical degradation is more severe than the raw metrics suggest. No standardized capacity tests are available for a direct C-rate-normalized comparison between regimes.
- (3)
Piecewise regression formalization. A Chow test for a structural break at 2022 was implemented and confirms significant parameter instability across all three primary indicators (DCIR:
p < 0.001; η
rt,DC:
p = 0.047; η
coul:
p = 0.018). Bootstrapped 95% CIs (B = 10,000) are reported in
Section 5.8; results are discussed there.
- (4)
Multi-chemistry comparison. Co-located LFP and NMC strings under the same grid excitation offer a natural control group. A comparative analysis is out of scope here but would isolate chemistry-specific from system-level effects.
- (5)
Threshold sensitivity. The annual efficiency metrics are computed from annual energy integrals and are therefore insensitive to the monthly throughput validity threshold: varying it between 300 Ah and 1000 Ah (0.17–0.56 EFC; baseline 0.5 EFC, about 888 Ah) leaves the annual round-trip and coulombic efficiency values unchanged (0.0 percentage-point difference across the reserve years) and alters only the number of monthly points flagged as low-confidence in
Figure 7.
- (6)
Secondary market utilization at end of first design lifecycle. The finding that FCR operation produced no statistically detectable degradation over five years raises the question of whether a lead–acid BESS that has completed its primary lifecycle in reserve or standby service could subsequently be transitioned to market-coupled FCR operation without disproportionate acceleration of residual degradation—provided that equalization charging is reinstated prior to and throughout the transition. Such a secondary utilization model could, in principle, extend the commercially viable lifetime of an installation beyond its initial design lifetime. The present results constitute a necessary, though not sufficient, condition for this to be feasible; the health state at the point of transition, the minimum acceptable equalization protocol, and the implications for residual capacity would each require quantification. A prospective field study, or a comparative analysis of datasets spanning analogous lifecycle transitions across multiple installations, would be required to evaluate the technical and economic feasibility of this approach.
- (7)
Sufficiency of system-level data for degradation monitoring. Individual cell-voltage data at approximately one-minute resolution were available for the full observation period (2017–2022) but were not included in the published dataset, as the analysis demonstrated that they provide no additional quantitative value for the degradation-indicator trends studied here. A statistical analysis of intra-string voltage heterogeneity, quantified as the standard deviation and interquartile range of voltages across the 100 three-cell measurement groups, showed no systematic growth during the FCR phase (2018–2021, σ ≈ 6 mV, stable). This is consistent with the near-zero string-level DCIR trend over the same period. The time resolution of the cell-voltage data (~60 s) was structurally insufficient to resolve the ohmic transient at polarity transitions (characteristic timescale <1 s), thus providing no additional value to the analyses. Cell-voltage surveillance nonetheless retained qualitative diagnostic value: a defective cell exhibiting markedly elevated resistance was identified through this monitoring and bypassed on 10 August 2023, so the limitation established here concerns quantitative per-cell DCIR trending rather than fault detection. These observations carry a positive methodological implication: the multi-indicator framework presented here is derivable exclusively from string-level BMS signals that are standard in commercially deployed BESS installations, without requiring individual cell-level monitoring infrastructure. This makes the approach transferable to any system with one-second BMS logging, independent of the granularity of the cell-voltage instrumentation. Cell-voltage data at one-second resolution would be required for a quantitative per-group DCIR analysis and are identified as a priority for future instrumentation upgrades in comparable field studies.
- (8)
Single-system scope and generalizability. All results derive from one battery string, one manufacturer, one cell chemistry, and one site-specific energy-management strategy. This is an in-depth N-of-1 field study: the absolute degradation rates reported here are specific to the Exide OCSM chemistry and the M5BAT dispatch strategy and should not be read as representative values for flooded lead–acid in general. What is structurally transferable is the methodological framework, a reproducible multi-indicator approach derived from operational data, and the qualitative observation that prolonged low-throughput, high-SoC standby can be more detrimental than active partial-SoC cycling. This direction is consistent with VRLA float-service experience, where calendar-driven positive-grid corrosion at sustained high state of charge is the dominant life-limiting mechanism [
21], although the absolute rates and the flooded-specific contribution of stratification are not directly transferable. Confirming the generality of these operational thresholds will require replication across multiple strings, chemistries, manufacturers, and management strategies. In particular, cells of nominally identical construction from different manufacturers can exhibit materially different degradation rates, so the quantitative values reported here should be transferred to other products only qualitatively.
6. Conclusions
This study presents an empirical characterization of lead–acid BESS degradation across eight years and two fundamentally different operating regimes, without presupposing a dominant mechanism. The two primary findings are as follows: (1) five years of active FCR service produced no statistically detectable degradation in the primary health indicators—a result that provides field evidence questioning the prevailing assumption that PSoC cycling is the principal aging driver for lead–acid cells in FCR applications; and (2) the subsequent transition to low-utilization reserve operation correlated with a strongly accelerated deterioration across all indicators simultaneously.
Multiple degradation mechanisms, i.e., sulfate crystal growth, calendar aging, grid corrosion, and electrolyte stratification, are consistent with the reserve-phase acceleration and likely co-occur. The available system-level data do not permit definitive attribution to a single mechanism; the measurements that would resolve this ambiguity (EIS, acid density, postmortem analysis) are identified as the primary priorities for follow-on work.
The methodological contribution is a reproducible multi-indicator framework combining DCIR, round-trip efficiency, coulombic efficiency, and inverter efficiency from a shared operational data stream. This approach is transferable to other BESS field datasets and provides a template for system-level degradation monitoring that does not depend on laboratory test infrastructure.
For practitioners, three operational recommendations follow directly from these findings. First, extended high-SoC, low-throughput standby should be avoided or mitigated through periodic cycling and active SoC management; equalization charging should be maintained as good practice but, having continued throughout, did not by itself prevent the post-2022 degradation. Second, DC round-trip efficiency is recommended as a rolling monthly health indicator: it is computable from existing BMS counter signals, correlates tightly with internal resistance (r ≈ −0.98), and requires no additional instrumentation. Third, transitions from active cycling to extended high-SoC standby should be regarded as degradation-risk events rather than purely operational decisions because, contrary to the conventional expectation, low-throughput, high-SoC standby proved more damaging to this flooded lead–acid string than high-throughput partial-SoC FCR cycling.
At the system-design level, these results support a deliberate role for lead–acid chemistry within hybrid multi-technology BESS, provided that dispatch priority, SoC management, and a sustained equalization protocol are tailored to its requirements. This recommendation is explicitly conditional on such management and does not imply comparable durability under arbitrary operating conditions. Methodologically, the multi-indicator framework that combines DC internal resistance, round-trip and coulombic efficiency, and inverter efficiency, all derived from a single one-second operational data stream, is transferable to other BESS field datasets without laboratory test infrastructure. The principal questions for following work are the mechanistic disambiguation that only cell-level diagnostics (electrochemical impedance spectroscopy, acid-density measurement, and postmortem plate analysis) can provide, a temperature-corrected DCIR analysis using the logged battery-temperature signal, and a comparative study across the co-located lithium-ion strings under identical grid excitation to separate chemistry-specific from system-level effects.