Article

Global Optimization Research on Parametric Design of Printed Circuit Heat Exchanger Airfoil Plates Based on Integrated Machine Learning and Simulated Annealing


1
AECC Hunan Aviation Powerplant Research Institute, Zhuzhou 412002, China
2
School of Energy and Power Engineering, Dalian University of Technology, Dalian 116024, China
*
Author to whom correspondence should be addressed.
Energies 2026, 19(17), 4055; https://doi.org/10.3390/en19174055
Submission received: 5 June 2026 / Revised: 27 July 2026 / Accepted: 17 August 2026 / Published: 28 August 2026

Abstract

The airfoil channel printed circuit heat exchanger (PCHE) demonstrates significant potential in the field of supercritical carbon dioxide Brayton cycles due to its exceptional heat transfer capability. The channel structure determines the thermal-hydraulic performance of the printed circuit heat exchanger (PCHE). This study proposes an S-shaped airfoil channel. A surrogate model combining random forest (RF) and Gaussian Process Regression (GPR) was proposed, and a machine learning method using the simulated annealing (SA) algorithm was employed to optimize the structural parameters of the S-shaped airfoil channel. The results show that, compared to the baseline straight channel with the NACA0020 airfoil, the optimized channel achieves an 8.4% enhancement in thermal-hydraulic performance. At an inlet flow velocity of 1–2 m/s, the optimized airfoil flow channel exhibits superior heat transfer performance. Flow separation on the airfoil surface can induce local vortices. These vortices effectively reduce the thickness of the boundary layer, making the cross-sectional temperature distribution more uniform and significantly enhancing heat transfer efficiency. This study ultimately lays a solid methodological foundation for the rapid customized design of a new generation of the printed circuit heat exchanger.

1. Introduction

The supercritical carbon dioxide (sCO2) Brayton cycle has garnered significant academic and industrial attention owing to its distinct advantages, including high thermodynamic efficiency, excellent system compactness, operational flexibility, and environmental friendliness [1,2]. Within the architecture of this advanced power cycle, printed circuit heat exchangers (PCHEs) serve as key components [3]. Fabricated through a highly specialized diffusion bonding process, PCHEs are inherently endowed with an exceptionally high surface-to-volume ratio. This sophisticated manufacturing technique not only guarantees reliable structural integrity under extreme conditions of elevated temperatures and immense pressures but also facilitates excellent heat transfer performance [3]. To further enhance the thermal-hydraulic performance of PCHEs, various studies have focused on developing topologically innovative flow channel geometries [4].
To establish a baseline understanding of internal flow dynamics within PCHEs, Liu et al. [5] experimentally evaluated the thermal-hydraulic characteristics of sCO2 within a conventional straight-channel PCHE. Their findings indicated that while convective heat transfer is moderately enhanced as sCO2 cools from the gas-like to the pseudocritical region, the straight architecture relies on unidirectional, single-phase forced convection. Devoid of any geometric mechanisms for inducing fluid perturbation or secondary transverse flows, this configuration suffers from severe thermal boundary layer thickening. Consequently, it exhibits low utilization efficiency of the wetted heat transfer area, limiting the overall thermal performance and rendering it inadequate for high-intensity heat dissipation applications. To overcome the inherent hydrodynamic limitations of straight passages, researchers have extensively explored wall-bounded tortuous flow paths. Chen et al. [6] conducted both computational fluid dynamic (CFD) simulations and experimental validations on zigzag-channel PCHEs. They revealed that the sharp geometric articulations enforce periodic bulk flow disruption, continuously resetting the thermal boundary layer and enhancing internal fluid mixing. Similarly, Xie et al. [7] numerically demonstrated a 65% enhancement in heat transfer efficiency for the zigzag configuration. Mechanistically, localized flow separation at the bends induces Dean vortices, significantly augmenting convective heat transfer; however, this brute-force disruption inevitably incurs severe hydraulic penalties and excessive form drag. To transcend this empirical trade-off, recent studies pivoted towards streamlined aerodynamic structures and continuous curvature profiles. Liu et al. [8] demonstrated that optimized airfoil arrays can improve the non-linear flow field, successfully coupling robust heat exchange with highly streamlined flow guidance. Furthermore, Cheng et al. [9] and Ngo et al. [10] showed that the continuous, periodic curvature variations intrinsic to the sinusoidal wavy channel effectively maintain robust, uninterrupted thermo-fluid performance under dynamic perturbations.
This study proposes an S-shaped airfoil channel. The structure of the S-shaped airfoil flow channel is determined by three characteristic parameters, specifically the period (Lp), height (A), and span (Sp). However, it is difficult to find the optimal solution for complex multidimensional geometric structures through traditional CFD methods. To overcome these limitations, this study adopts a robust data-driven intelligent optimization approach. This method combines random forest (RF) with Gaussian Process Regression (GPR) to predict thermal-hydraulic performance (PEC). By employing the simulated annealing (SA) algorithm, this method can efficiently determine the globally optimal geometric parameters. Subsequently, the impact of the S-shaped structure on flow and heat transfer is analyzed. This research provides a theoretical foundation and design reference for the efficient design of and performance enhancement in advanced PCHEs.

2. Physical Models and Boundary Conditions

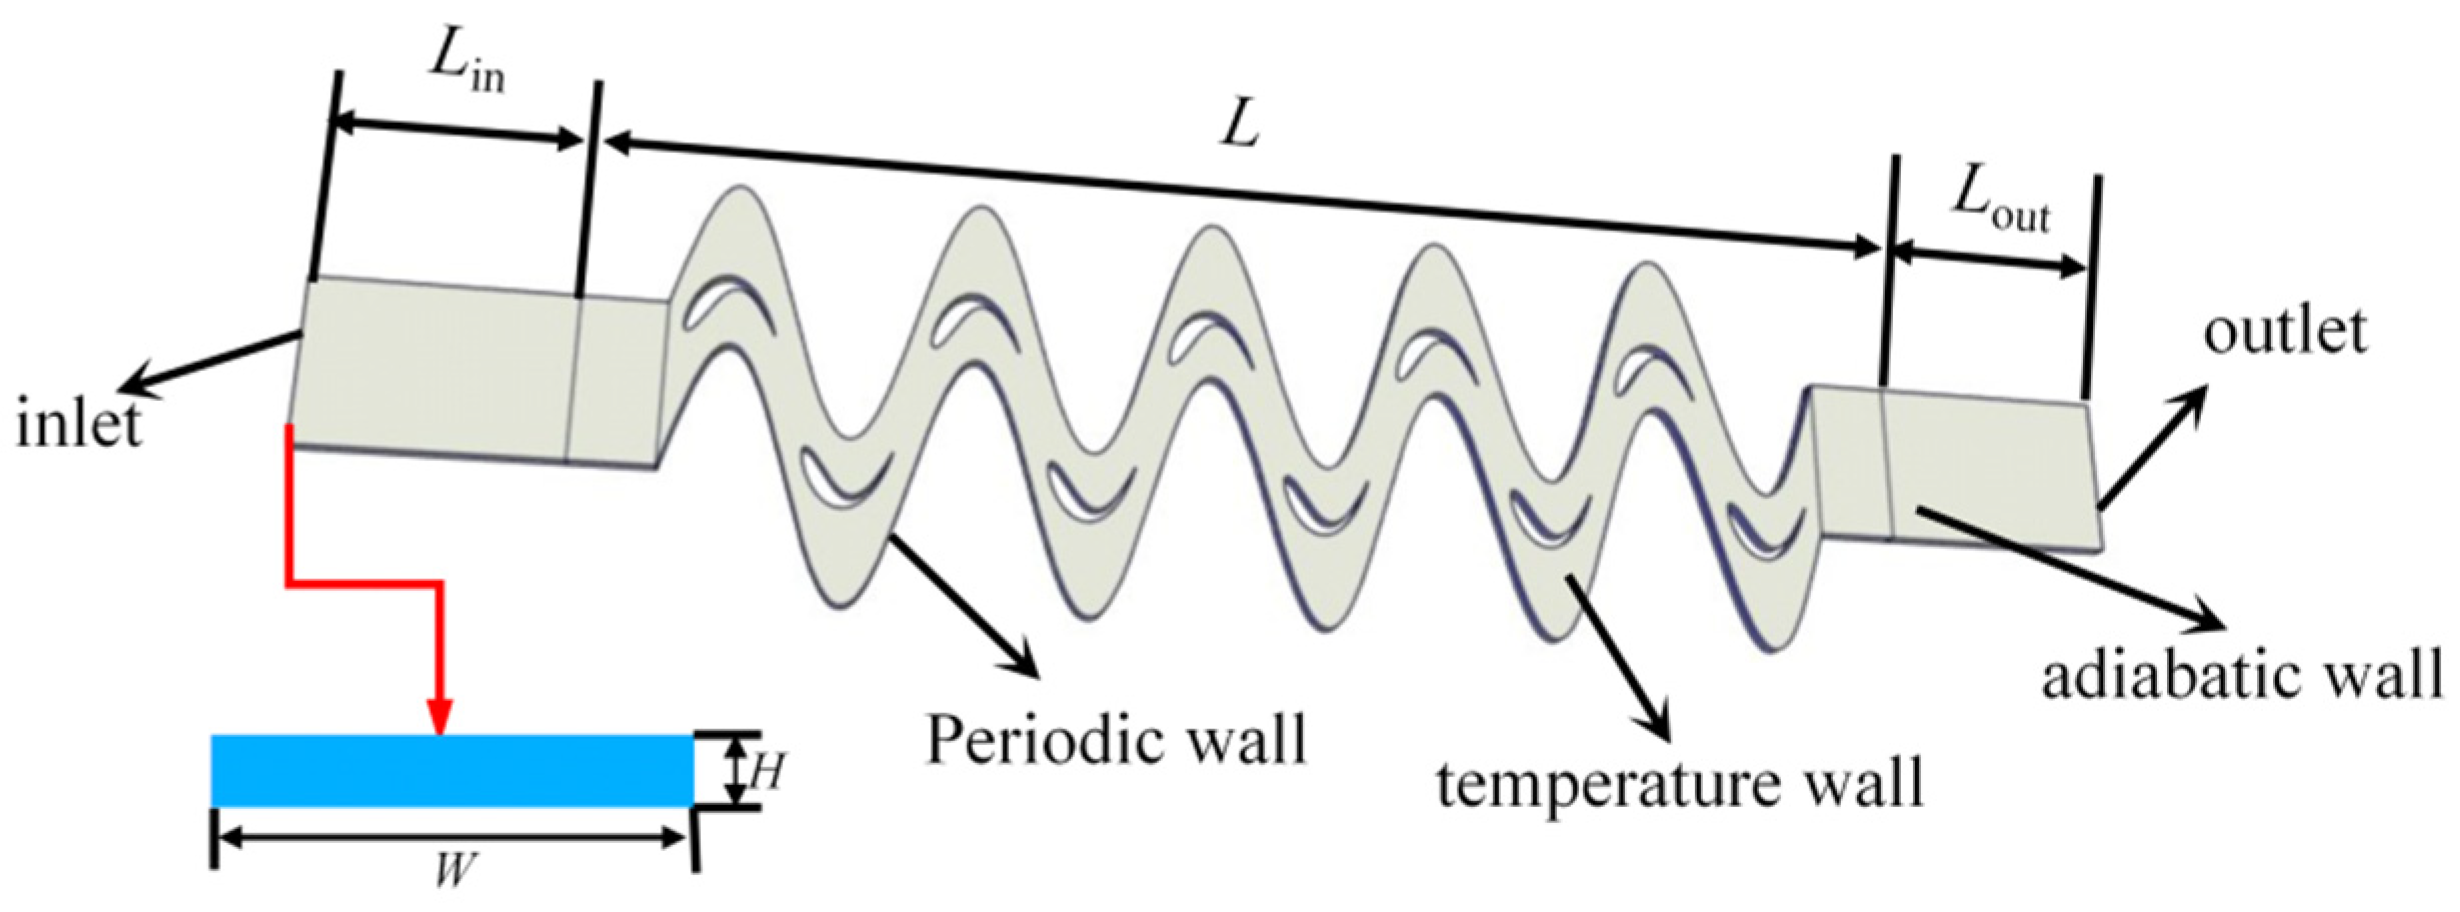
The printed circuit heat exchanger (PCHE) features a large number of fluid channels, making the full-scale numerical simulation computationally prohibitive. Due to the lateral geometric periodicity of the channel, a simplified heat exchange unit is used to significantly reduce the computational burden. As illustrated in Figure 1, the computational domain is formed by bending a straight airfoil channel along a sinusoidal curve, and the computational domain comprises an inlet adiabatic section, a central active heat transfer region, and an outlet adiabatic section. Both the inlet and outlet extensions are configured as horizontal straight channels with a length of 20 mm, which ensures a fully developed velocity profile at the inlet and prevents backflow at the outlet. The central main heat transfer region possesses a total length of L. The dimensions of this rectangular fluid domain are defined by a characteristic width (W) and a channel inner depth (Dc) fixed at 1 mm. Within this main region, the S airfoil has a total of five periodic cycles. This study employs three core geometric design variables, spatial period (Lp), trajectory height (A, defined as the maximum lateral amplitude), and spanwise parameter (Sp), to parameterize the S-shaped airfoil flow channel.
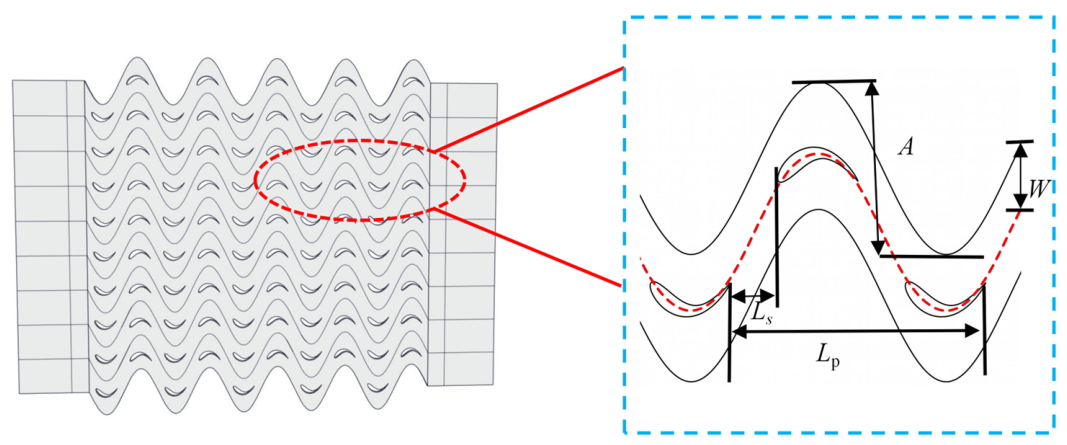
Figure 2 illustrates the geometric structure of the S-shaped airfoil passage structure. The structural configuration is mathematically characterized by four design variables: the spatial period (Lp), the height (A), the spanwise airfoil parameter (Sp), and the unit width (W). Specifically, the period Lp determines the spatial periodicity of the airfoil arrangement along the streamwise direction. Height A defines the maximum longitudinal displacement of the periodic trajectory. Furthermore, the domain width W represents the lateral pitch of the unit, a parameter that affects the spatial arrangement density and compactness of the PCHE array, which is fixed at 5 mm in this study. The parameter Sp is used to define the transverse separation distance (Ls) between consecutive airfoils.
S p = L p - 2 L s L p
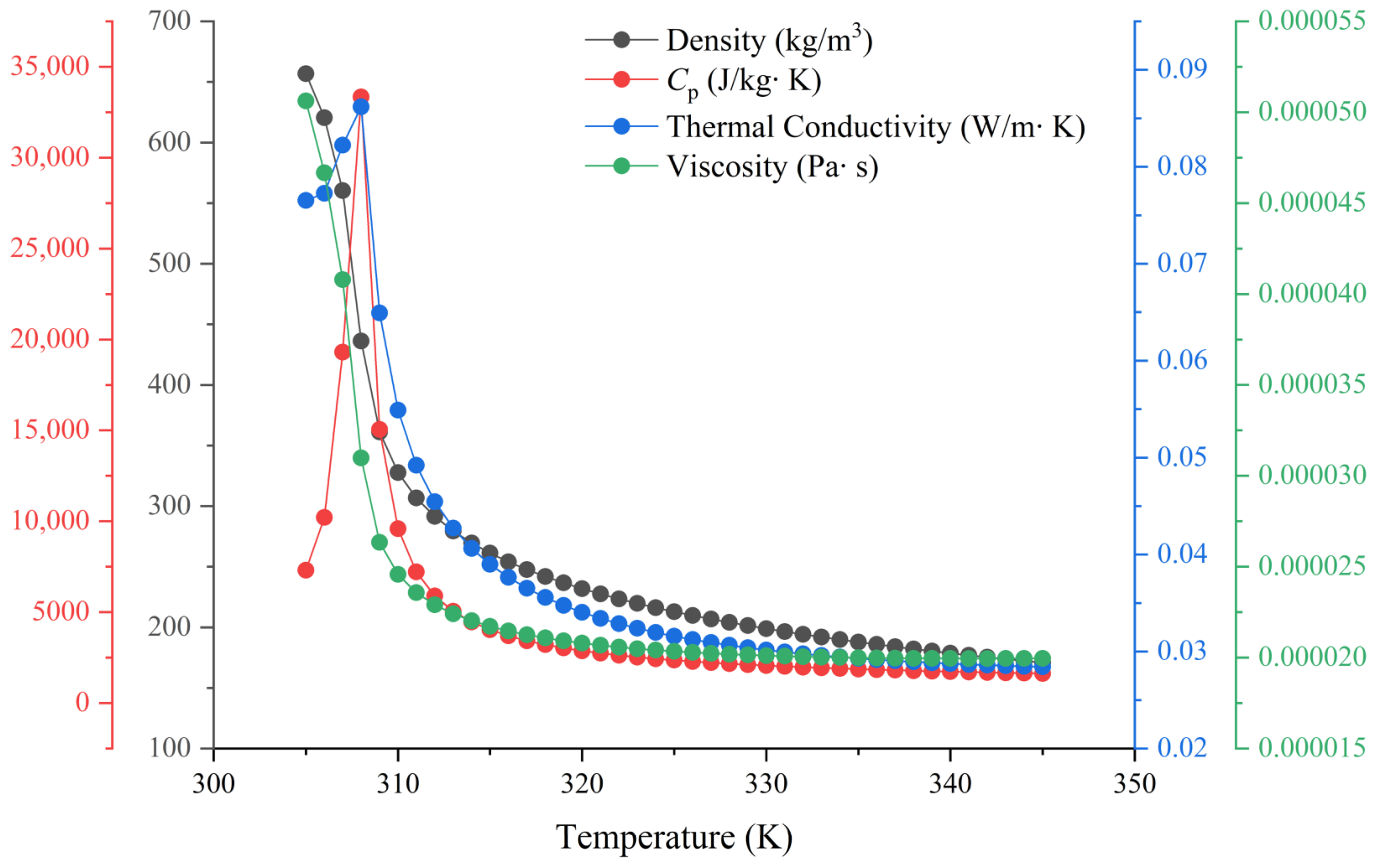
Translational periodic boundary conditions were applied to the lateral surfaces, to simulate the adjacent parallel channels. A constant wall temperature of 340 K was set for all fluid–solid interfaces in the primary heat exchange section. The surfaces of the extended inlet and outlet sections were set as adiabatic boundaries to prevent premature thermal development. At the domain inlet, a uniform velocity profile of 1 m/s was set alongside an initial fluid temperature of 315 K. Furthermore, the exit was designated as a pressure outlet boundary, with the static operating pressure maintained at 8 MPa to align with the high-pressure characteristics of supercritical fluid systems. To ensure the accuracy of the input physical properties, we evaluated the temperature-dependent thermophysical properties of sCO2 (including density, specific heat capacity, thermal conductivity, and dynamic viscosity) at a constant operating pressure of 8.0 MPa based on the NIST reference property database, as detailed in Figure 3.

3. Numerical Methods and Mesh Independence

Due to the geometric configuration of the airfoil-finned channel, both the cross-sectional flow area and the wetted perimeter vary periodically along the streamwise direction. Consequently, this geometric non-uniformity causes changes in the local hydraulic diameter. To calculate dimensionless thermo-hydraulic characteristics (such as the Reynolds and Nusselt numbers), a spatially averaged hydraulic diameter (d) is defined for the representative heat exchange unit. This effective parameter is defined as follows:
d = 4 V S
In this equation, V represents the volume of the main heat transfer region in m3, and S denotes the heat exchange area in m2.
The calculation formula for the heat transfer coefficient h is as follows:
h = ( i out i in ) m S ( T w T f )
In this equation, iout and iin represent the enthalpy values at the outlet and inlet, respectively, in J/kg; m is the mass flow rate, in kg/s; Tw is the wall temperature, in K; and Tf is the fluid temperature, in K.
Nusselt number:
Nu = hd λ
In this equation, λ is thermal conductivity, W/(m·K).
The calculation formula for the Fanning friction factor is as follows [11]:
f = ( P in P out ) d 2 u 2 ρ L
In this equation, Pin and Pout represent the pressure at the inlet and outlet, respectively, in Pa; u is the average flow velocity, in m/s; ρ is fluid density, in kg/m3; and L is the horizontal length of the flow channel, in m.
To comprehensively evaluate the trade-off between heat transfer enhancement and the associated flow friction penalty, the Performance Evaluation Criterion (PEC), a general metric in thermal engineering widely applied in recent studies [12,13], is adopted as the primary indicator. It is defined as follows:
PEC   = Nu Nu standard × f standard f 1 3
This study conducts numerical simulations based on Ansys Fluent 2022R2. The SST k-ω turbulence model is used [14], while the second-order upwind scheme is applied to couple the velocity and pressure fields. Previous studies [15] have validated its accuracy and reliability for sCO2 simulations.
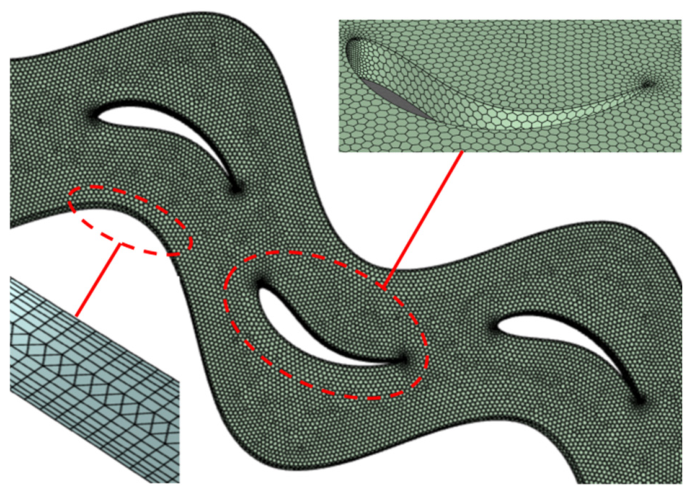
To ensure the structural integrity of the mesh and the numerical fidelity of the turbulence model, particularly in capturing the steep gradients within the near-wall region, boundary layers were applied. A total of six prism-shaped inflation layers were generated along the solid boundaries. The height of the initial grid cell was set to 0.0028 mm, ensuring that the dimensionless wall distance (y+) remained consistently below unity (y+ < 1) across the entire computational domain. The mesh division is shown in Figure 4.
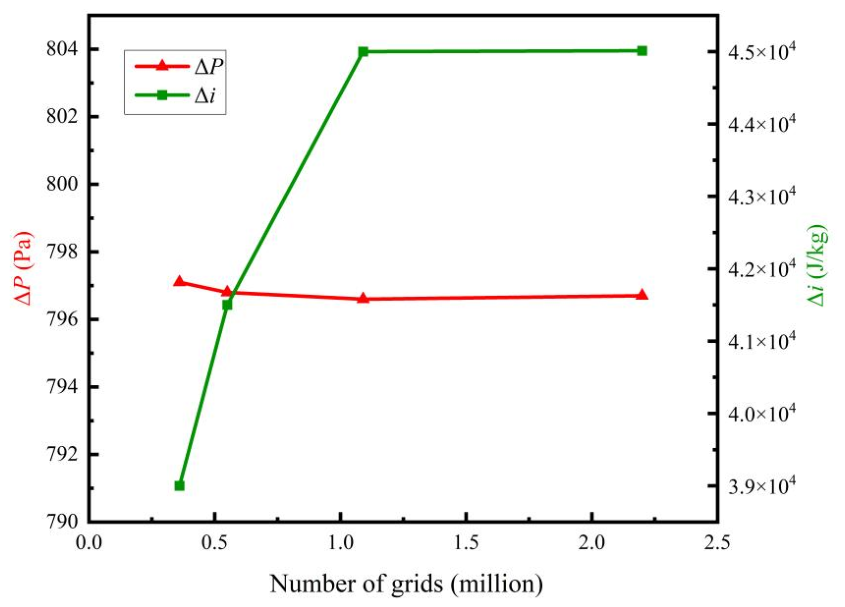
A grid independence test was performed to eliminate spatial discretization errors. Four mesh configurations with 0.36, 0.55, 1.09, and 2.2 million cells were tested. Figure 5 shows the variations in pressure drop (ΔP) and specific enthalpy difference (Δi) with grid density. As illustrated, ΔP remained stable across all tested meshes. For Δi, the relative difference between the 1.09 million and 2.2 million meshes was only 0.2%, and the curves leveled off after the 1.09 million threshold. Therefore, the mesh with 1.09 million cells was chosen for all subsequent simulations to balance computational cost and accuracy.
The experimental data for the zigzag-channel PCHE reported by Ishizuka et al. [16] was used to validate the numerical calculation method. A baseline zigzag-channel computational domain was constructed, and the boundary conditions were set identical to the experimental operating conditions in Reference [16]. The predicted pressure drops (ΔP) and temperature differences (ΔT) were compared with the experimental measurements. As shown in Table 1, the maximum relative error between the present numerical predictions and the experimental data is 1.5%, which confirms the reliability of the present numerical model.

4. Optimization Methods

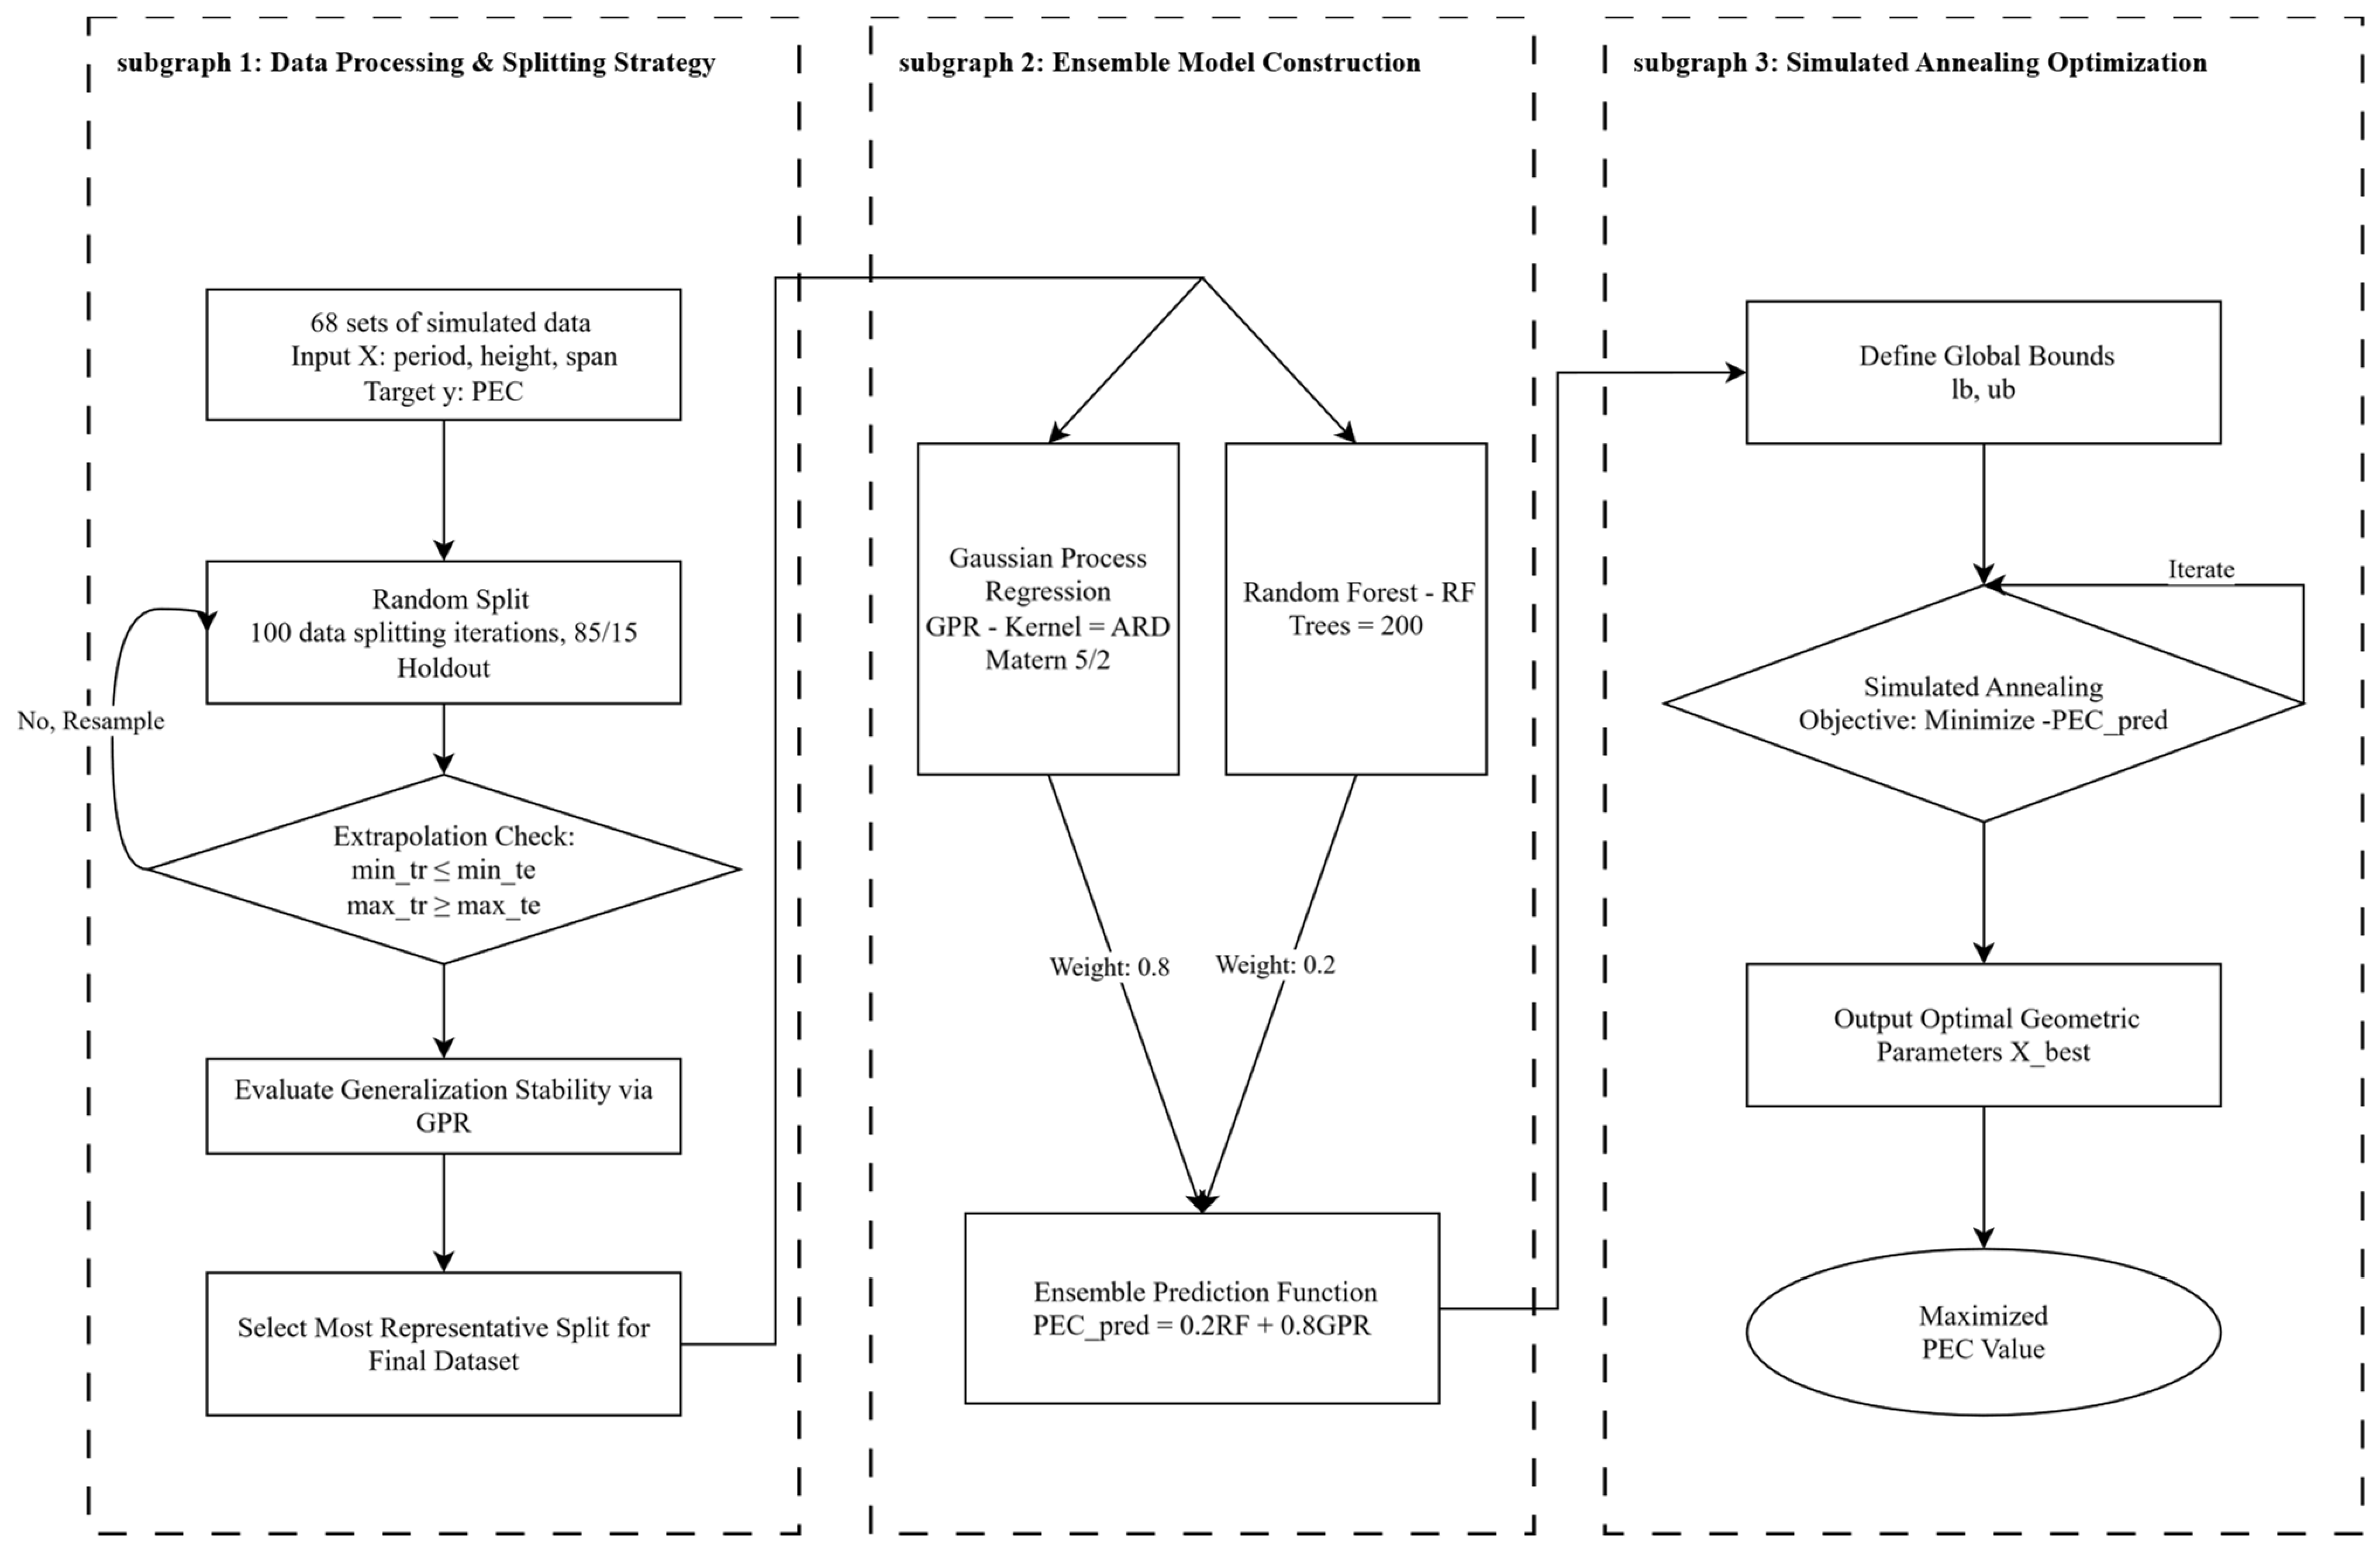
We employed random forest (RF) regression and Gaussian Process Regression (GPR) to construct surrogate models [17] for predicting the PEC values of airfoil panels and utilized the simulated annealing (SA) [18,19] algorithm to search for the optimal parameter combination within the given design space.

4.1. Data Sources and Preprocessing

The dataset for this study is derived from CFD simulations, containing the PEC values under 68 different geometric parameter combinations. The design variables X and the target variable y (PEC values) were used for surrogate model training. The ranges of the four variables are listed in Table 2.

4.1.1. Surrogate Model Construction

The random forest (RF) algorithm is an ensemble learning method composed of multiple independent decision trees. By averaging the outcomes of these base estimators for regression tasks, the RF framework improves predictive accuracy. This mechanism can effectively capture the non-linear correlations between the multidimensional design parameters and the Performance Evaluation Criterion (PEC). Furthermore, through its bagging (bootstrap aggregating) strategy, the RF model shows good generalization capability and prevents overfitting, making it suitable for thermal-hydraulic optimization.
Gaussian Process Regression (GPR) [20] is a non-parametric, Bayesian-based probabilistic framework that conceptualizes target functions as realizations derived from a Gaussian process. Distinct from deterministic regression approaches, GPR not only offers point estimations for target variables but also quantifies the predictive uncertainty through its posterior distribution. This characteristic renders GPR uniquely advantageous for applications characterized by data scarcity or where statistical confidence in predictive outcomes is required.
Surrogate-assisted optimization has been used to reduce the temporal and computational costs associated with high-fidelity numerical simulations. By establishing a proxy model with fast response times, these models facilitate integration with advanced optimization heuristics. Currently, mainstream surrogate models primarily include Kriging models [21], artificial neural networks [22], radial basis functions [23], support vector regression [24], and polynomial regression models [25]. Single-algorithm surrogate models often exhibit inherent algorithmic bottlenecks when navigating highly non-linear design landscapes. To address these limitations, recent advancements have highlighted hybrid surrogate frameworks, particularly those integrating random forests and Gaussian Process Regression via a weighted ensemble strategy. This sophisticated hybridization leverages the complementary theoretical strengths of both paradigms. Specifically, the RF algorithm captures high-dimensional non-linear interactions while mitigating overfitting risks. Concurrently, the GPR model provides precise local interpolations and offers probabilistic bounds for predictive uncertainty quantification. Consequently, this integration improves generalization capability and predictive accuracy across design spaces.

4.1.2. Ensemble Learning Strategy

The final PEC prediction was calculated by taking a weighted average of the predictions from the random forest and Gaussian process models. Using optimally tuned weights (wrf = 0.2; wgpr = 0.8), the ensemble model is expressed as follows:
PEC x = w rf · PEC rf ( x ) + w gpr · PEC gpr ( x )
Here, PEC rf (x) and PECgpr(x) represent the predicted values of the random forest and Gaussian process models, respectively, and wrf and wgpr are the corresponding weights. This integration method aims to leverage the complementary strengths of different models to achieve more accurate and stable prediction results.

4.2. Global Optimization Algorithm

Simulated Annealing Algorithm

The simulated annealing (SA) algorithm is utilized in this study to find the global optimum of the objective function. By incorporating a probabilistic acceptance mechanism, SA effectively escapes local optima, enabling it to robustly navigate highly complex and non-convex optimization landscapes.
The relationship between the structural parameters of the S-shaped channel and the Performance Evaluation Criterion (PEC) is highly non-linear with local variations. Population-based algorithms (such as GA and PSO) are prone to premature convergence in such complex spaces, while the Metropolis criterion adopted by the SA algorithm effectively avoids local optima. Furthermore, although the SA algorithm traditionally is computationally expensive due to the need for extensive sequential calculations, this bottleneck is addressed when combined with the RF-GPR surrogate model. This combination enables a global search with almost no increase in computational cost. The overall optimization process is shown in Figure 6.

5. Results and Analysis

5.1. Proxy Model Performance Evaluation

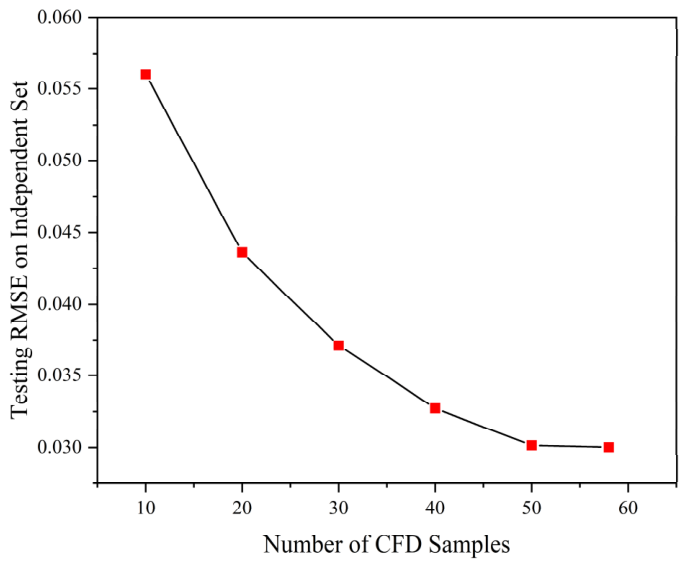
As illustrated in Figure 7, the predictive error enters a plateau beyond N = 40, with minimal reduction in RMSE up to N = 58. Therefore, the final dataset comprising 58 samples is selected, as further CFD evaluations would yield little accuracy gains. At this size, the integrated surrogate model shows good accuracy, yielding a final RMSE of 0.0272 and an MAE of 0.0235.
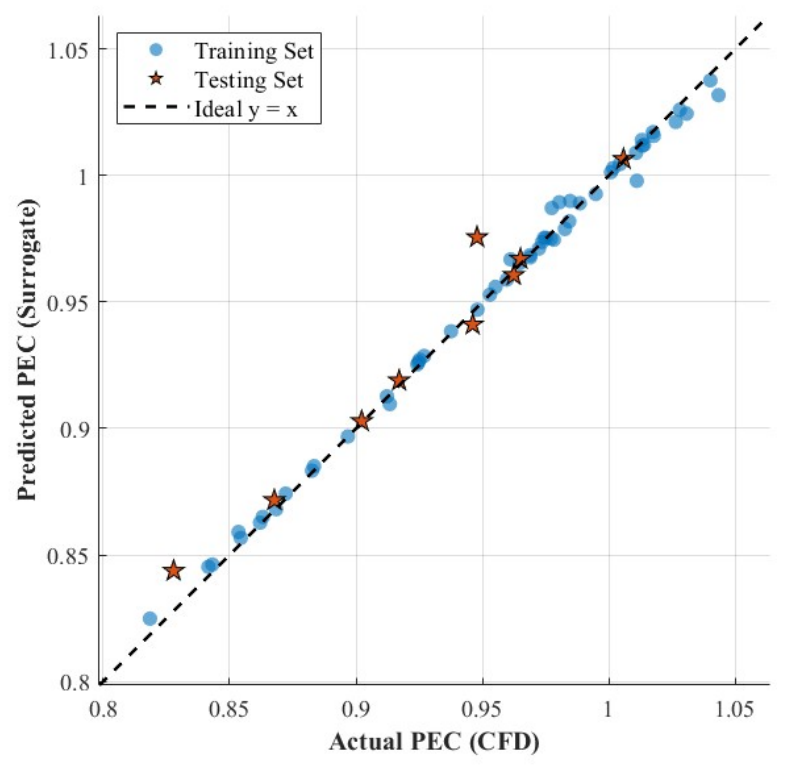
To evaluate the accuracy of the finalized RF-GPR surrogate model, a total of 68 CFD datasets were utilized, with 85% (58 samples) allocated for model training and the remaining 15% (10 samples) reserved as an independent testing set for validation. As shown in Figure 8, there is a good agreement between the predicted PEC values and the actual CFD validation results, with both the training and independent testing datasets closely aligning along the ideal y = x reference line. Quantitatively, the model yields a coefficient of determination (R2) of 0.9072 and a root mean square error (RMSE) of 0.0272. Furthermore, the accuracy of the predictions on the randomly distributed, independent testing set (denoted by the red stars) indicates that the integrated model captures the non-linear mapping between the geometric parameters (period, height, and span) and the comprehensive thermo-fluid performance.
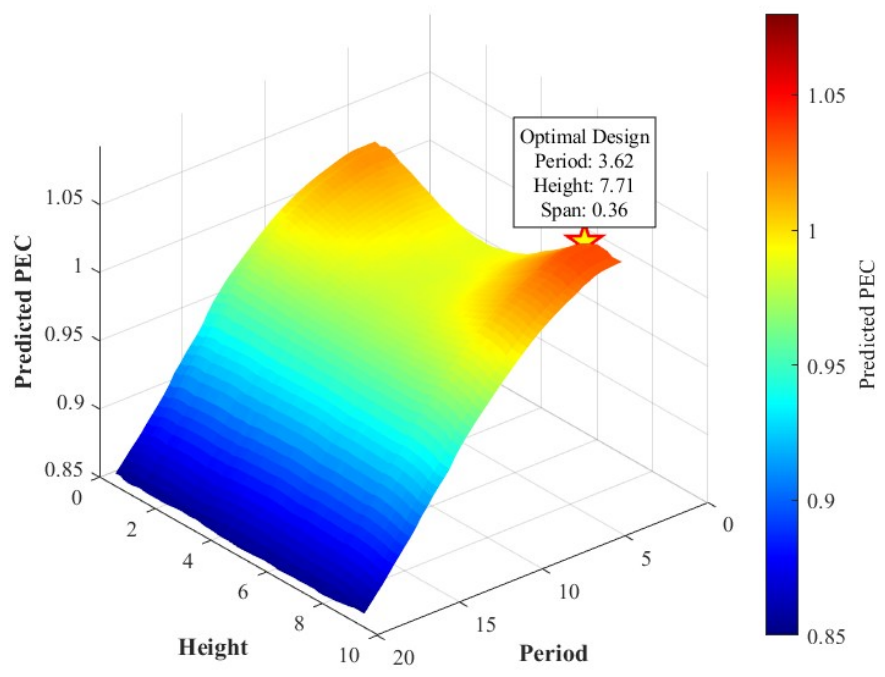
As depicted in the 3D response surface (Figure 9), the surrogate model illustrates the non-linear interactions among the geometric parameters. Rather than a simple monotonic trend, the surface reveals a complex multi-modal topology. Evaluating the topographical gradients across this response surface reveals the relative parameter sensitivity. The analysis confirms that height (amplitude) exerts the strongest dominant influence on the overall PEC, followed by the span and finally the period. The simulated annealing (SA) algorithm found the ultimate global optimum (period = 3.62; height = 7.71; span = 0.36), designated by the star symbol in Figure 9. A CFD validation using these parameters yielded an actual PEC of 1.0842. This demonstrates strong consistency between the model’s topological assessment and the direct physical validation.
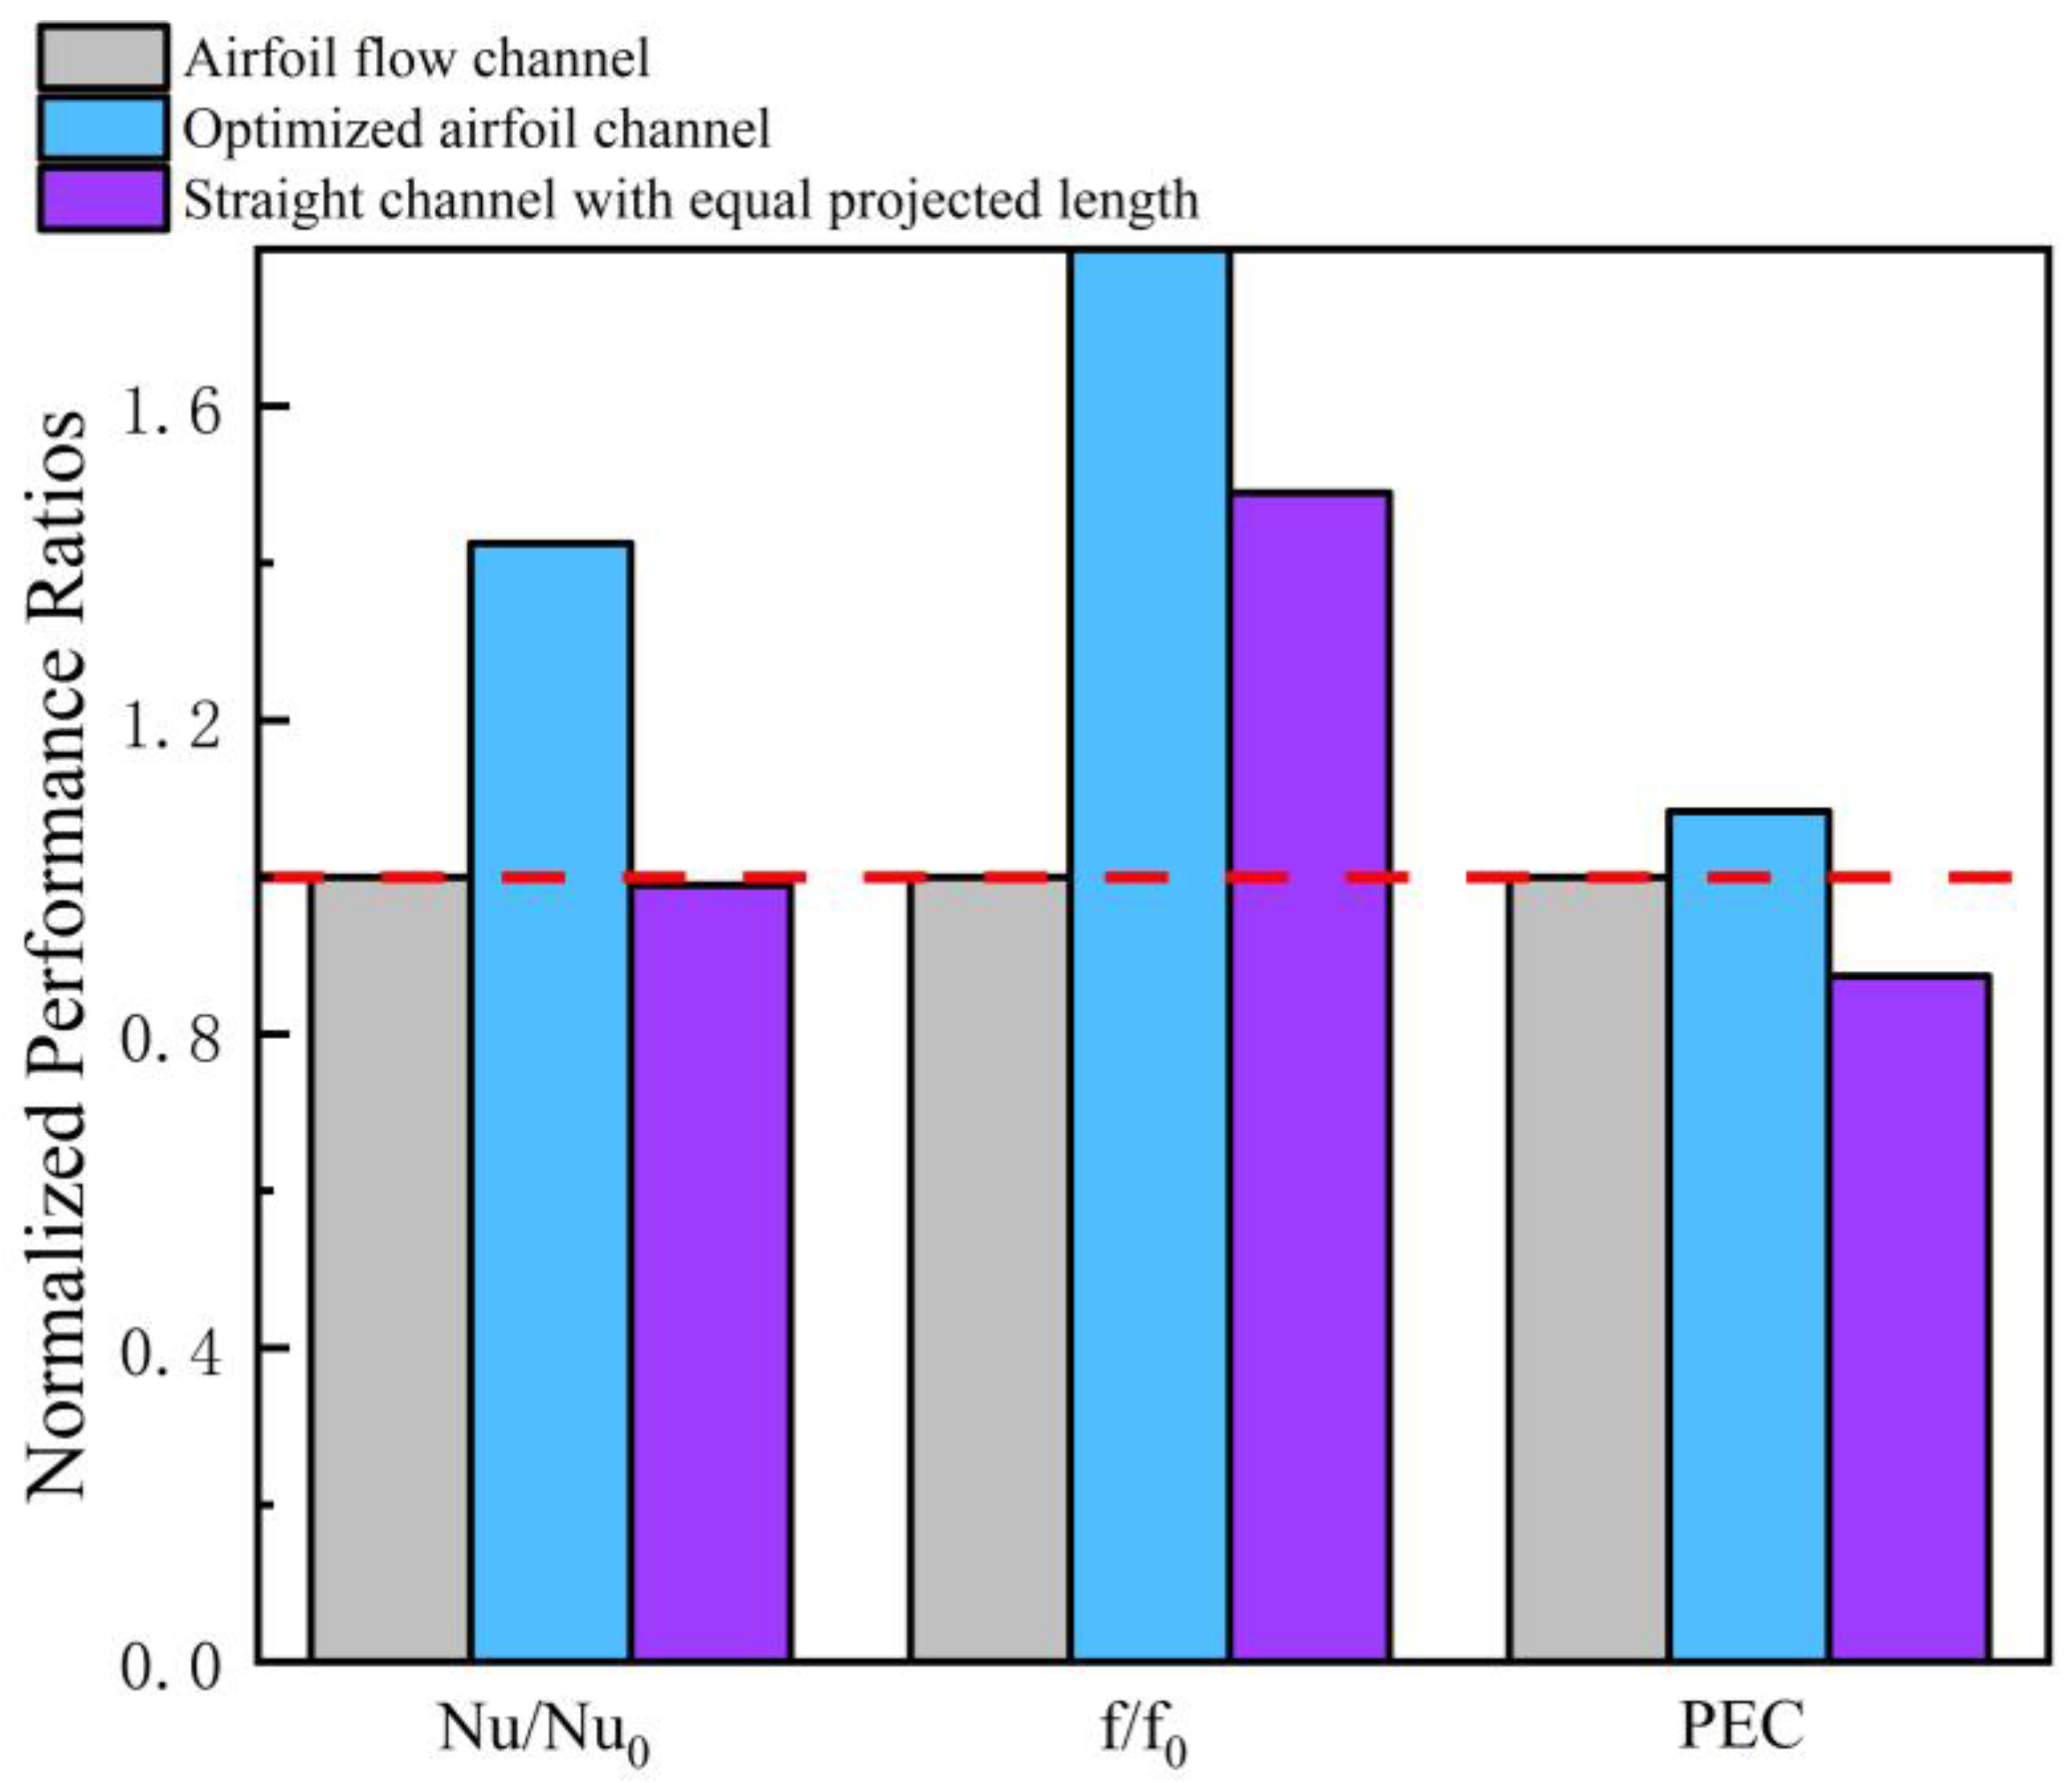
To analyze the specific advantages brought by the S-shaped airfoil design, two comparison flow channels are included in the text: one is a baseline structure flow channel (with both airfoil length and spacing set to 6 mm) and the other is a straight flow channel sharing the exact same channel length and airfoil arrangement as the optimal S-shaped airfoil flow channel. Figure 10 shows the performance comparison of these three channels.

5.2. Flow and Heat Transfer Analysis

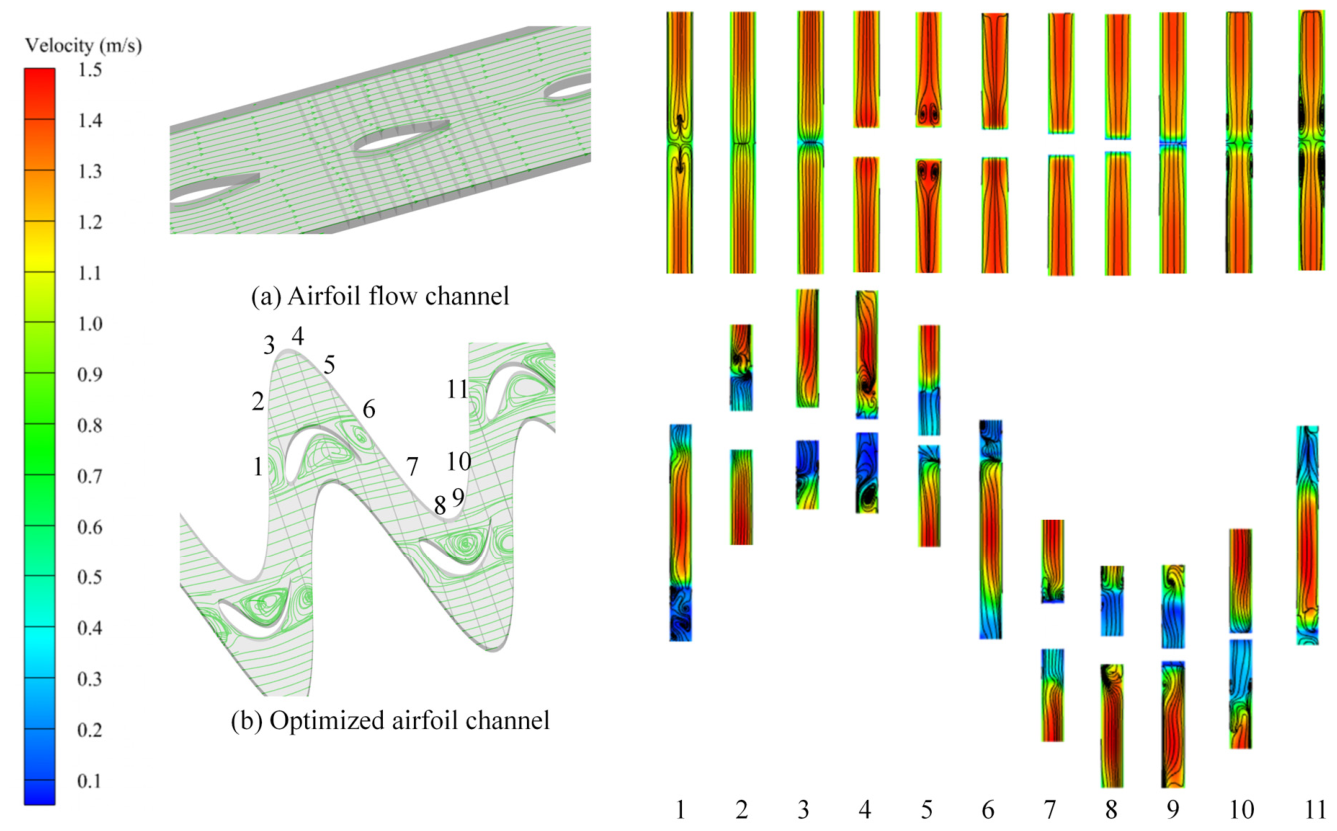
The streamlines and cross-sectional velocity distributions within the channel are shown in Figure 11. As observed in Figure 11b, the alternating flow deflection dynamics generated by the periodic airfoil array excite strong longitudinal vortices, which manifest as intense secondary flows perpendicular to the main flow. These local vortices interact with the main flow, promoting fluid mixing, effectively disrupting and reducing the thickness of the thermal boundary layer, and significantly enhancing overall heat transfer performance.
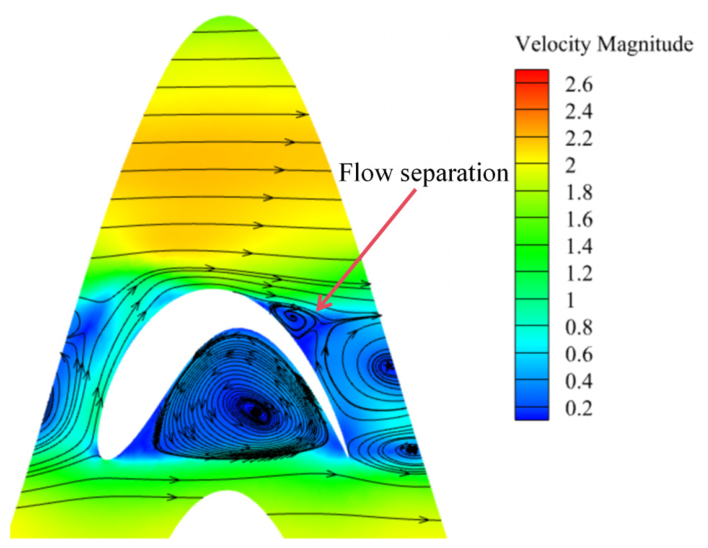
Figure 12 shows the velocity distribution around the S-shaped airfoil. When fluid flows over the pressure side of the airfoil, the adverse pressure gradient near the trailing edge triggers flow separation, resulting in the formation of distinct recirculation vortices in the wake region. These vortices generate significant disturbances, promoting fluid mixing. Simultaneously, they impinge on the pressure side of the next row of airfoils, thereby enhancing the heat transfer capability of the airfoil wall.
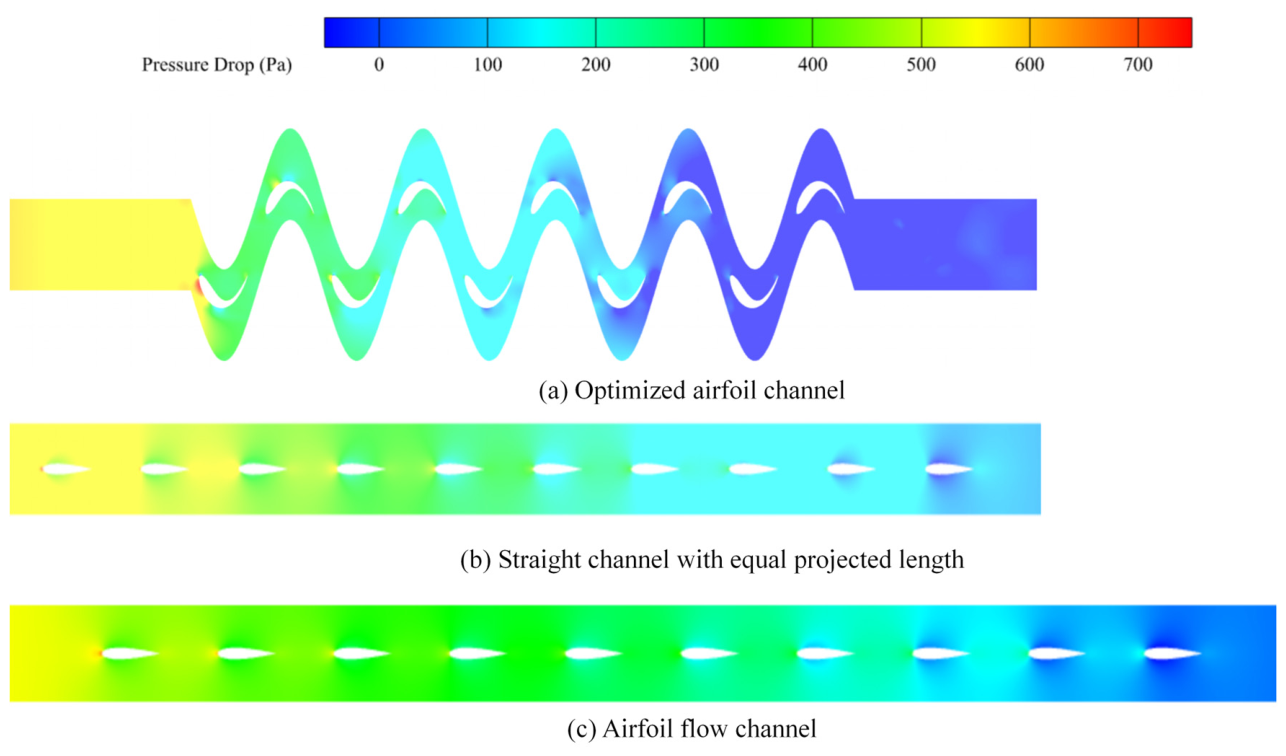
From the pressure contour plot in Figure 13, it can be observed that the pressure distribution in both the airfoil flow channel and the straight channel with an equal projected length is very uniform, showing smooth, layer-by-layer gradients without noticeable discontinuities. This indicates that the pressure is steadily and linearly decreasing. In contrast, in the optimized airfoil channel, the smooth pressure transition is disrupted. Whenever the fluid impacts the leading edge of the airfoils, distinct localized areas of high pressure concentration appear, while the backside of the airfoils rapidly becomes a low-pressure region. This sharp pressure gradient indicates that the local pressure variations within the flow channel are larger than in the straight channel. Compared to straight channels, the f-factor of the airfoil-shaped flow channels with the same projected length reaches approximately 149%, while that of the optimized airfoil-shaped channels reaches about 225%, indicating that the optimization measures inevitably increase pressure drop losses.
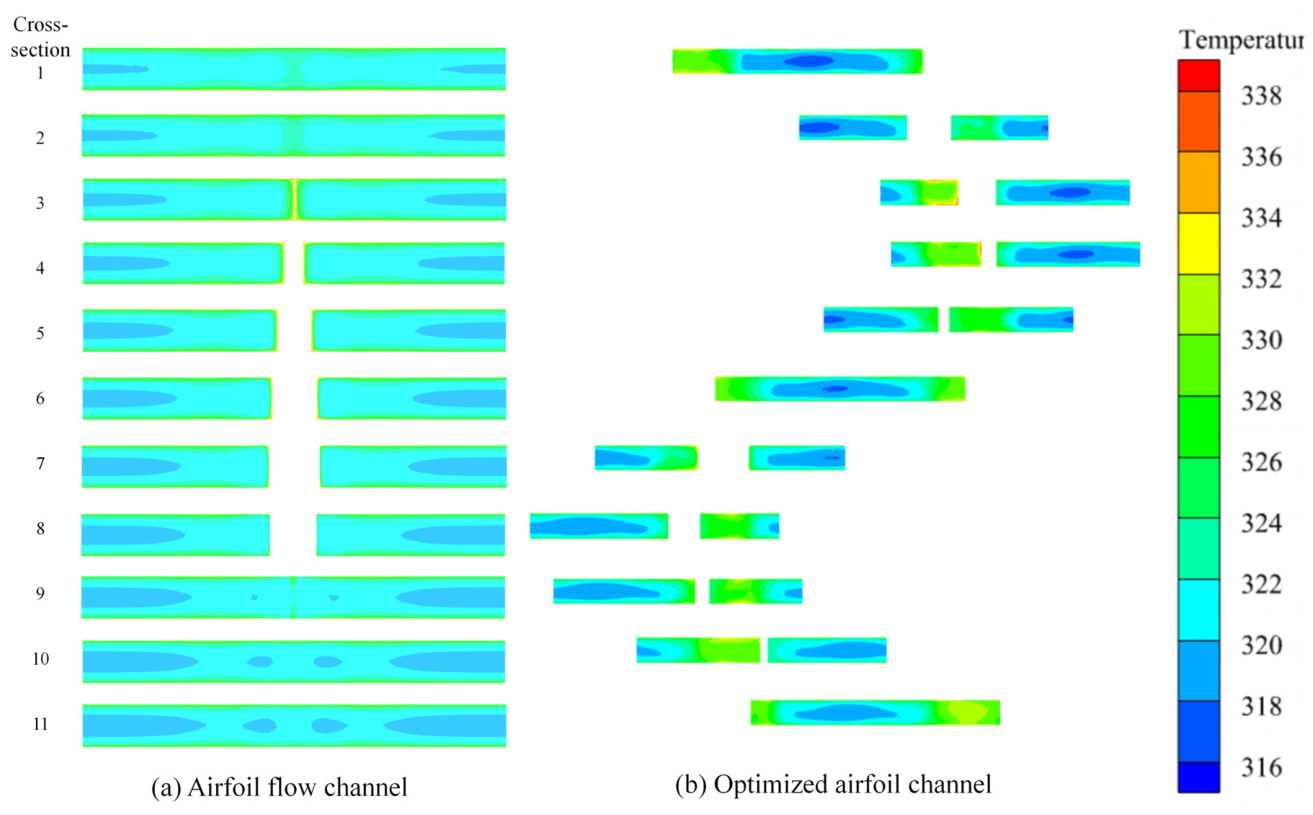
Based on the comparative analysis of the cross-sectional temperature field evolution (Figure 14), a distinct unheated central core is present within the airfoil flow channel (Figure 14a). The transfer of thermal energy in this geometry is largely confined to the thermal boundary layers adjacent to the heat transfer surfaces. Consequently, the mainstream core maintains a relatively lower temperature along the entire axial span. This indicates that the airfoil flow channel lacks transverse mixing, which hinders the penetration of the thermal fluid flux into the central fluid.
The optimized channel (Figure 14b) demonstrates significantly enhanced thermal mixing capability. Driven by the secondary flows and localized flow deflection identified in the velocity field, the traditional parallel flow regime is effectively disrupted. High-temperature near-wall fluid is actively and continuously swept toward the geometric center of the passage. Visualized through the contours (slices 1–11), as the fluid propagates downstream, the higher-temperature zones experience rapid transverse expansion, which efficiently eliminates the unheated central core and substantially improves the cross-sectional temperature uniformity.
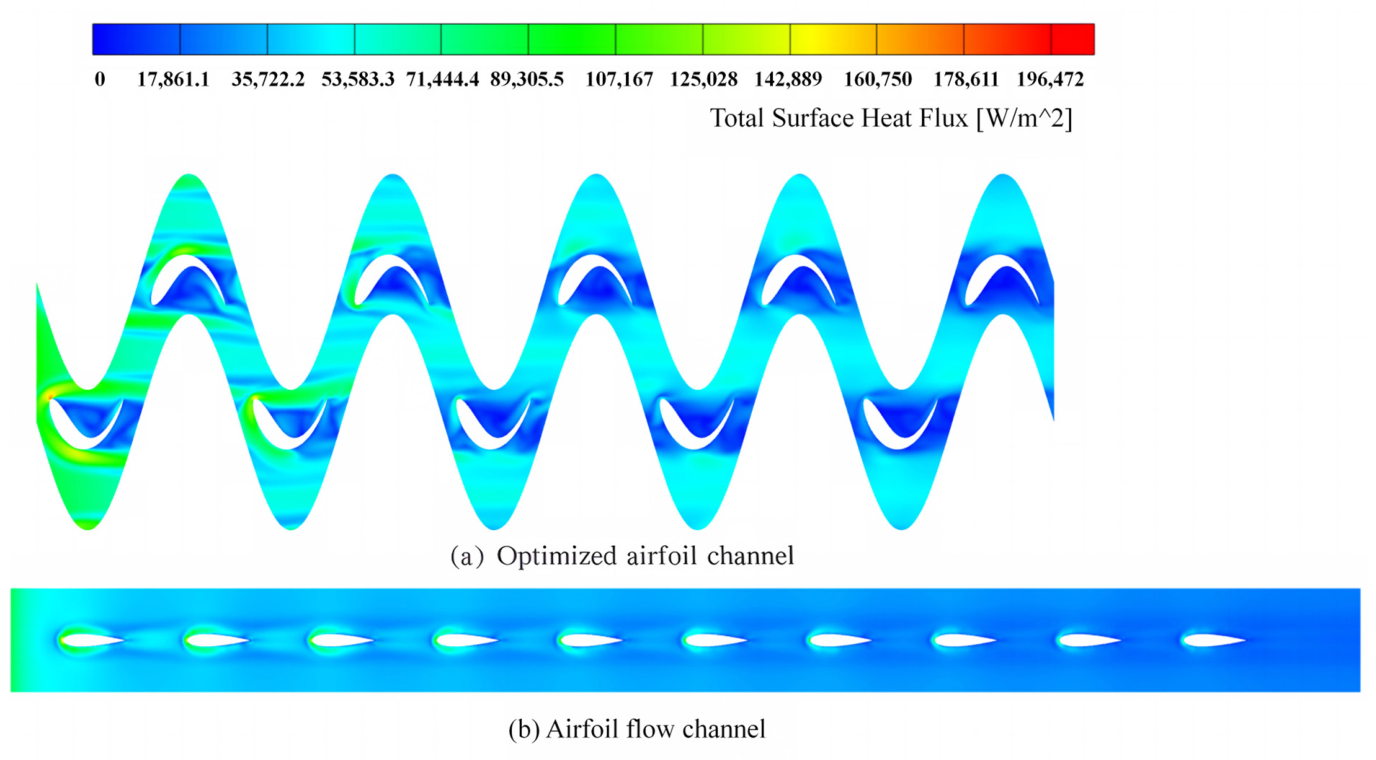
Figure 15 illustrates the spatial contours of total surface heat flux. As observed in the airfoil flow channel (Figure 15b), the heat flux experiences a rapid downstream degradation, largely characterized by extensive domains of depressed heat flux after the initial inlet section. In contrast, the optimized configuration (Figure 15a) consistently maintains localized high-intensity thermal zones along the entire streamwise direction.
In the airfoil flow channel, the linear alignment of the airfoils permits a relatively unhindered straight flow trajectory, which inevitably allows for the continuous downstream thickening of the thermal boundary layers, leading to severe heat flux degradation in the wake regions. Conversely, the optimized airfoil channel employs a sinusoidal arrangement of airfoil matrices (as shown in Figure 15a). This structure forces local fluids to generate vortices, restricting the growth of the boundary layer.
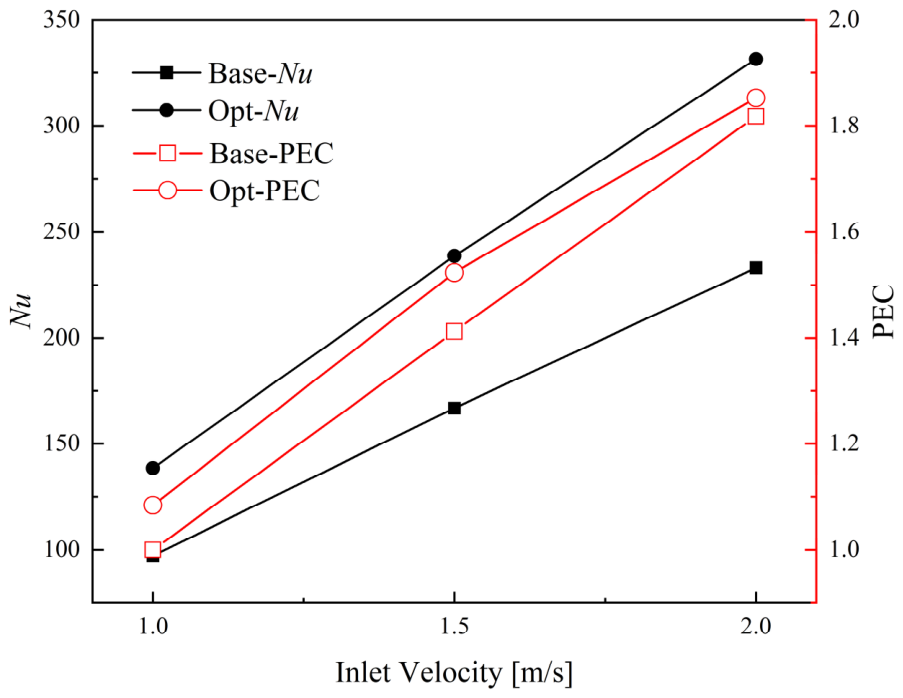
The thermal-hydraulic performance under different flow velocities is shown in Figure 16. The Nusselt numbers (Nu) for both structures increase with rising inlet velocity. Across the entire flow velocity range, the optimal structure consistently exhibits significant thermal performance advantages over the baseline model. Additionally, the PEC values for both structures increase proportionally with inlet velocity. Under all tested flow velocities, the optimized structure consistently yields higher PEC values than the baseline design. This indicates that the optimal structure possesses high heat transfer performance and comprehensive thermal-hydraulic performance across a wide range of flow velocities.
This paper also compares the model with those reported in the existing literature. As pointed out by Shi et al. [26], traditional zigzag channels typically incur a pressure drop loss three to four times higher when achieving similar heat transfer rates. The actual operating parameters of the optimized channel in this study are Re ≈ 25,025 and Pr ≈ 1.74. As shown in Table 3, substituting these parameters into empirical formulas for similar operating ranges and the same supercritical CO2 medium (summarized by Chai and Tassou [27]) yields friction factor (f) and Nusselt number (Nu) values of 0.07655 and 118.10, respectively. Using the baseline channel in this study as a reference, the Performance Evaluation Criterion (PEC) of the traditional zigzag channel is only 0.58. In contrast, the optimized channel proposed in this study achieves a PEC of 1.084. This comparison demonstrates that the optimized channel offers significant advantages in overcoming pressure drop losses and enhancing overall heat transfer performance.

6. Conclusions

This study proposes a novel S-shaped airfoil flow channel and optimizes this configuration using an integrated machine learning framework (RF-GPR) combined with the simulated annealing (SA) algorithm. The main research conclusions are as follows:
(1)
Targeting the geometric optimization, an RF-GPR surrogate model (R2 = 0.9072) was successfully constructed and coupled with the SA algorithm. The optimal geometric parameters of the S-shaped airfoil flow channel were determined: spatial period Lp = 3.62 mm, height A = 7.71 mm, and spanwise parameter Sp = 0.36 mm.
(2)
At an inlet velocity of 1 m/s, compared to the airfoil flow channel, the optimized airfoil channel significantly enhances heat transfer efficiency, with the Nusselt number (Nu) increasing to 142.5% of the baseline value. However, this design also increases friction loss, raising the fan friction factor (f) to 225% of its original baseline. Despite the increase in pressure drop, the significant heat gain far outweighs the friction loss, resulting in an 8.4% increase in the Performance Evaluation Criterion (PEC). Moreover, the optimized airfoil channel demonstrates performance advantages across flow velocities ranging from 1.0 to 2.0 m/s.
(3)
The deflection of the fluid and its impact on the wall surface, which was generated by the S-shaped airfoil, disrupt the velocity boundary layer and enhance the convective heat transfer coefficient. Simultaneously, the strong secondary vortices promote fluid mixing, leading to a more uniform temperature distribution across the cross-section. These factors collectively contribute to the high heat transfer capability of the S-shaped airfoil channel.

Author Contributions

Conceptualization, L.G.; Methodology, S.L., S.Z. and L.G.; Software, S.L., X.G. and N.L.; Validation, S.L. and X.G.; Formal analysis, Q.Q.; Investigation, N.L.; Resources, Q.Q.; Writing—original draft, S.L.; Writing—review & editing, L.G. and S.S.; Visualization, S.Z.; Supervision, L.G. All authors have read and agreed to the published version of the manuscript.

Funding

This research received no external funding.

Data Availability Statement

The original contributions presented in this study are included in the article. Further inquiries can be directed to the corresponding author.

Acknowledgments

During the preparation of this manuscript, the authors used Gemini 3.1 Pro for the purposes of language polishing and text refinement. The authors have reviewed and edited the output and take full responsibility for the content of this publication.

Conflicts of Interest

Authors Shanlin Liu, Xin Gong, and Naibing Liao were employed by AECC Hunan Aviation Powerplant Research Institute. The remaining authors declare that the research was conducted in the absence of any commercial or financial relationships that could be construed as a potential conflict of interest.

Abbreviations

Abbreviations
CFDComputational Fluid Dynamics
GPRGaussian Process Regression
PECPerformance Evaluation Criterion
PCHEPrinted Circuit Heat Exchanger
RFRandom Forest
SASimulated Annealing
sCO2Supercritical Carbon Dioxide
Roman Symbols
AGeometric trajectory height mm
DcChannel inner depthmm
dSpatially averaged hydraulic diameterm
fFanning friction factor
hHeat transfer coefficientW/(m2·K)
iSpecific enthalpyJ/kg
LTotal length of the main heat transfer regionmm
LpSpatial period of the airfoil trajectorymm
LsTransverse separation distance between consecutive airfoilsmm
mMass flow ratekg/s
NuNusselt number
PPressurePa
SHeat transfer aream2
SpSpanwise structural parameter
TTemperatureK
uAverage velocitym/s
VVolume of the main heat transfer regionm3
WCharacteristic width of the fluid domainmm
Greek Symbols
ΔiSpecific enthalpy differenceJ/kg
ΔPPressure dropPa
λThermal conductivityW/(m·K)
ρDensitykg/m3
Subscripts
fFluid
inInlet
outOutlet
wWall

References

  1. Ahn, Y.; Bae, S.J.; Kim, M.; Cho, S.K.; Baik, S.; Lee, J.I.; Cha, J.E. Review of supercritical CO2 power cycle technology and current status of research and development. Nucl. Eng. Technol. 2015, 47, 647–661. [Google Scholar] [CrossRef] [Scilit]
  2. Alzuwayer, B.; Alhashem, A.; Albannaq, M.; Alawadhi, K. Advancements in supercritical carbon dioxide Brayton cycle for marine propulsion and waste heat recovery. Processes 2024, 12, 1956. [Google Scholar] [CrossRef] [Scilit]
  3. Zhang, D.; Zhao, M.; Liang, P.; Li, W. Experimental study on prototype of printed circuit heat exchanger. Front. Energy Res. 2022, 10, 835224. [Google Scholar] [CrossRef] [Scilit]
  4. Searle, M.; Ramesh, S.; Straub, D. Optimization-inspired pin-fin array for supercritical carbon dioxide recuperator. Appl. Therm. Eng. 2024, 241, 122335. [Google Scholar] [CrossRef] [Scilit]
  5. Liu, S.H.; Huang, Y.P.; Wang, J.F.; Liu, R.L.; Zang, J.G. Experimental study of thermalhydraulic performance of a printed circuit heat exchanger with straight channels. Int. J. Heat Mass Transf. 2020, 160, 120109. [Google Scholar] [CrossRef] [Scilit]
  6. Chen, M.H.; Sun, X.D.; Christensen, R.N. Thermal-hydraulic performance of printed circuit heat exchangers with zigzag flow channels. Int. J. Heat Mass Transf. 2019, 130, 356–367. [Google Scholar] [CrossRef] [Scilit]
  7. Xie, J.Y.; Chueh, C.C.; Chen, W.H.; Chen, K. Heat transfer performance comparison of printed circuit heat exchangers with straight, zigzag and serpentine flow channels for waste heat recovery. Int. J. Energy Res. 2022, 46, 1722–1735. [Google Scholar] [CrossRef] [Scilit]
  8. Liu, R.; Zhang, C.; Zhao, B.; Chen, J.; Wang, Z. Multi-objective optimization of comprehensive performance in airfoil channel PCHEs using Bézier curves. Appl. Therm. Eng. 2025, 261, 125045. [Google Scholar] [CrossRef] [Scilit]
  9. Cheng, J.Q.; Wang, S.S.; Li, Q.; Dai, L.; Wang, S.; Wen, Z.-X. Flow and heat transfer behavior of supercritical CO2 in different PCHE channels under rolling motions. J. Supercrit. Fluids 2025, 227, 106754. [Google Scholar] [CrossRef] [Scilit]
  10. Ngo, T.L.; Kato, Y.; Nikitin, K.; Ishizuka, T. Heat transfer and pressure drop correlations of microchannel heat exchangers with S-shaped and zigzag fins for carbon dioxide cycles. Exp. Therm. Fluid Sci. 2007, 32, 560–570. [Google Scholar] [CrossRef] [Scilit]
  11. Menter, F.R. Two-equation eddy-viscosity turbulence models for engineering applications. AIAA J. 1994, 32, 1598–1605. [Google Scholar] [CrossRef] [Scilit] [PubMed]
  12. Cheng, Z.D.; He, Y.L.; Cui, F.Q. Numerical study of heat transfer enhancement by unilateral longitudinal vortex generators inside parabolic trough solar receivers. Int. J. Heat Mass Transf. 2012, 55, 5631–5641. [Google Scholar] [CrossRef] [Scilit]
  13. Shi, H.Y.; Li, M.J.; Wang, W.Q.; Qiu, Y.; Tao, W.Q. Heat transfer and friction of molten salt and supercritical CO2 flowing in an airfoil channel of a printed circuit heat exchanger. Int. J. Heat Mass Transf. 2020, 150, 119006. [Google Scholar] [CrossRef] [Scilit]
  14. Lemmon, E.; Huber, M.; McLinden, M.J. NIST Standard Reference Database 23: Reference Fluid Thermodynamic and Transport Properties-REFPROP, Version 9.1; National Standard Reference Data Series (NIST NSRDS); National Institute of Standards and Technology: Gaithersburg, MD, USA, 2013. [Google Scholar]
  15. Liu, S.; Huang, Y.; Wang, J. Theoretical and numerical investigation on the fin effectiveness and the fin efficiency of printed circuit heat exchanger with straight channels. Int. J. Therm. Sci. 2018, 132, 558–566. [Google Scholar] [CrossRef] [Scilit]
  16. Ishizuka, T.; Kato, Y.; Muto, Y.; Nikitin, K.; Lam, N.; Hashimoto, H. Thermal-hydraulic characteristics of a printed circuit heat exchanger in a supercritical CO2 loop. In Proceedings of the 11th International Topical Meeting on Nuclear Reactor Thermal-Hydraulics (NURETH-11), Avignon, France, 2–6 October 2005. [Google Scholar]
  17. Wen, Z.-X.; Wu, J.-L.; Wang, S.-S.; Cheng, J.-Q.; Li, Q. Numerical study and machine learning on local flow and heat transfer characteristics of supercritical carbon dioxide mixtures in a sinusoidal wavy channel PCHE. Int. J. Heat Mass Transf. 2024, 223, 125278. [Google Scholar] [CrossRef] [Scilit]
  18. Yang, R.; Wu, C. Accelerated simulated annealing algorithm for large-scale global optimization. In Proceedings of the Second International Conference on Systems Science and Systems Engineering (ICSSSE’93); International Academic Publishers: Beijing, China, 1993; pp. 55–60. [Google Scholar]
  19. Kirkpatrick, S.; Gelatt, C.D.; Vecchi, M.P. Optimization by simulated annealing. Science 1983, 220, 671–680. [Google Scholar] [CrossRef] [Scilit] [PubMed]
  20. Lin, H.; Zhao, Z.; Wen, C.; Li, W.; Liu, Z.; Zhao, P. A three-dimensional reduced-order analysis method for flow and heat transfer performance of PCHE based on Bayesian optimization GPR model. Ann. Nucl. Energy 2026, 227, 111958. [Google Scholar] [CrossRef] [Scilit]
  21. Sun, L.; Wang, C.; Zhang, D. Multi-objective optimization on supercritical CO2 recompression brayton cycle using Kriging surrogate model. Therm. Sci. 2017, 21, 309–316. [Google Scholar] [CrossRef] [Scilit]
  22. Peng, H.; Ling, X. Optimal design approach for the plate-fin heat exchangers using neural networks cooperated with genetic algorithms. Appl. Therm. Eng. 2008, 28, 642–650. [Google Scholar] [CrossRef] [Scilit]
  23. Afzal, A.; Chung, H.; Muralidhar, K.; Cho, H.H. Neural-network-assisted optimization of rectangular channels with intersecting ribs for enhanced thermal performance. Heat Transf. Eng. 2020, 41, 1609–1625. [Google Scholar] [CrossRef] [Scilit]
  24. Baghban, A.; Sasanipour, J.; Pourfayaz, F.; Ahmadi, M.H.; Kasaeian, A.; Chamkha, A.J. Towards experimental and modeling study of heat transfer performance of water- SiO2 nanofluid in quadrangular cross-section channels. Eng. Appl. Comput. Fluid Mech. 2019, 13, 453–469. [Google Scholar] [CrossRef] [Scilit]
  25. Saeed, M.; Kim, M.-H. Thermal-hydraulic analysis of sinusoidal fin-based printed circuit heat exchangers for supercritical CO2 Brayton cycle. Energy Convers. Manag. 2019, 193, 124–139. [Google Scholar] [CrossRef] [Scilit]
  26. Shi, H.; Zhu, B.; Zhang, Q. Multi-objective optimization of a novel non-uniform variable cross-section zigzag printed circuit heat exchanger for supercritical CO2 Brayton Cycle. J. Supercrit. Fluids 2026, 232, 106904. [Google Scholar] [CrossRef] [Scilit]
  27. Chai, L.; Tassou, S.A. A review of printed circuit heat exchangers for helium and supercritical CO2 Brayton cycles. Therm. Sci. Eng. Prog. 2020, 18, 100543. [Google Scholar] [CrossRef] [Scilit]
Figure 1. PCHE flow channel physical model.
Energies 19 04055 g001
Figure 2. Geometric parameters of airfoil arrangement.
Energies 19 04055 g002
Figure 3. The thermophysical properties of supercritical CO2 as a function of temperature at a constant operating pressure of 8.0 MPa.
Energies 19 04055 g003
Figure 4. Grid division.
Energies 19 04055 g004
Figure 5. Grid independence experiment.
Energies 19 04055 g005
Figure 6. Optimization process.
Energies 19 04055 g006
Figure 7. Sample size convergence analysis showing the testing of the RMSE of the surrogate model as a function of the number of training samples.
Energies 19 04055 g007
Figure 8. Accuracy assessment of integrated surrogate model against CFD validation data.
Energies 19 04055 g008
Figure 9. The 3D response surface of the predicted PEC. The star symbol indicates the global optimum.
Energies 19 04055 g009
Figure 10. Performance comparison. The red dashed line represents the baseline reference value of 1.0.
Energies 19 04055 g010
Figure 11. Velocity streamlines and cross-sectional profiles in the (a) baseline and (b) optimized configurations.
Energies 19 04055 g011
Figure 12. Local velocity contours and streamlines around a single airfoil.
Energies 19 04055 g012
Figure 13. Static pressure contours for the different channel configurations.
Energies 19 04055 g013
Figure 14. Comparison of local thermal field evolution: cross-sectional temperature contours demonstrating fluid homogenization in (a) baseline and (b) optimized configurations.
Energies 19 04055 g014
Figure 15. A comparison of local total surface heat flux distributions between (a) the optimized wavy airfoil architecture and (b) the baseline conventional airfoil flow channel.
Energies 19 04055 g015
Figure 16. Variations in the Nusselt number (Nu) and Performance Evaluation Criterion (PEC) with inlet velocity for the baseline and optimized channels.
Energies 19 04055 g016
Table 1. The operating conditions of the zigzag-channel PCHE used for model validation.
ParametersExperimental DataPresent CFD ResultsRelative Error (%)
Cold channel ΔP (Pa)73,22073,0960.17
Hot channel ΔP (Pa) 24,18024,2230.18
Cold channel ΔT (K)140.4138.31.50
Hot channel ΔT (K)169.6170.10.29
Table 2. Range of parameter changes.
VariableMinimum Value (mm)Maximum Value (mm)
Height A0.19
Cycle length Lp320
Span Sp0.150.475
Table 3. Comparison of thermo-hydraulic performance among different channel configurations.
ParametersZigzag PCHEOptimized Airfoil Channel
Nu118.10138.52
f0.076550.01871
PEC0.581.084
Disclaimer/Publisher’s Note: The statements, opinions and data contained in all publications are solely those of the individual author(s) and contributor(s) and not of MDPI and/or the editor(s). MDPI and/or the editor(s) disclaim responsibility for any injury to people or property resulting from any ideas, methods, instructions or products referred to in the content.