Article

Foreign Direct Investment and Energy Infrastructure in Sub-Saharan Africa: Does Energy Infrastructure Condition the Sustainable Development Effects of FDI?


by
Patricia Lindelwa Makoni
and
Jude Igyo Ali
*
Department of Finance, Risk Management and Banking, College of Economics and Management Sciences, University of South Africa, Pretoria 0003, South Africa
*
Author to whom correspondence should be addressed.
Energies 2026, 19(16), 3924; https://doi.org/10.3390/en19163924
Submission received: 14 July 2026 / Revised: 10 August 2026 / Accepted: 15 August 2026 / Published: 20 August 2026

Abstract

Despite rising foreign direct investment (FDI), Sub-Saharan Africa continues to experience inadequate energy infrastructure and weak sustainable development outcomes, suggesting that investment alone is insufficient to generate long-term development gains. This study investigates whether energy infrastructure conditions the relationship between FDI and sustainable development in 35 Sub-Saharan African countries over the period 2000–2024. Sustainable development is measured using adjusted net savings, while energy infrastructure is proxied by the Energy Infrastructure Composite Index. The analysis employs complementary second-generation panel estimators, including fixed effects with Driscoll–Kraay standard errors, common correlated effects mean group, Augmented Mean Group, System Generalized Method of Moments, and panel quantile regression to address cross-sectional dependence, slope heterogeneity, endogeneity, dynamic persistence, and distributional heterogeneity. The results demonstrate that FDI exerts adverse effects on sustainable development where energy infrastructure is weak but generates significant positive outcomes as infrastructure improves. Institutional quality consistently emerges as the most robust determinant across all estimators and quantiles, while the positive interaction between FDI and energy infrastructure confirms that stronger energy systems enhance countries’ absorptive capacity. The findings underscore the need for coordinated investments in energy infrastructure and institutional reforms to maximize the sustainable development benefits of foreign investment in Sub-Saharan Africa.

1. Introduction

The relationship between foreign direct investment (FDI) and sustainable development has long been at the forefront of debates in development economics and finance; nonetheless, it remains empirically unsettled, particularly in Sub-Saharan Africa (SSA). The region has continued to experience an increase in FDI inflows over the past two decades, and SSA still has a long way to catch up with the rest of the world on most indicators of sustainable development.
A recurring structural explanation is that inadequate energy infrastructure limits the productive use of foreign capital: almost 600 million people in SSA lack access to electricity, and over 900 million people cook using traditional biomass fuels [1,2]. This energy gap is both a welfare gap and a structural constraint that affects the productive capability of labor, technological spillovers from multinational enterprises, and the institutions that support FDI-related labor absorption [3]. Empirical studies on FDI and sustainable development in SSA have generally treated energy infrastructure as a residual control variable rather than as a conditioning factor that moderates FDI’s productivity.
To this end, the omission of a formal conditioning role for energy infrastructure in the FDI–sustainable development relationship needs to be examined, given the finding in [4] that the relationship between FDI and sustainable development was strong and unidirectional in low-income African economies between 1990 and 2020. Similarly, [5] revealed that at the disaggregate level, FDI positively affects the economic and social sustainability of 41 SSA countries while having net negative effects on environmental sustainability, making the aggregate sustainable development benefit uncertain. These findings are consistent with the broader literature, which indicates that the impact of FDI in SSA is not necessarily positive but hinges on the host country’s absorptive capacity, particularly on infrastructure development, institutional quality, and human capital endowments [3,5,6].
The study reconceptualizes energy poverty as the inverse of energy infrastructure adequacy rather than as a separately measured construct: in the empirical model, the Energy Infrastructure Composite Index (EICI) is the single underlying measure, and its interaction with FDI captures how the sustainable development returns to foreign capital vary with the state of a country’s energy infrastructure. Empirical results reported in Section 4 confirm that the sustainable development effect of FDI is conditional on energy infrastructure, such that the marginal effect of FDI is negative where infrastructure is weak and positive where it is well developed, which is the key finding of the present paper.
This paper makes three main contributions to the literature by directly testing whether the level of energy infrastructure conditions the FDI–sustainable development relationship through an FDI × EICI interaction term, reporting the interaction coefficient, its standard error, and the conditional marginal effect of FDI at low, average and high levels of energy infrastructure, together with 95% confidence intervals. Second, the methodological framework combines second-generation panel estimators (FE-DK, CCEMG, AMG) that are robust to cross-sectional dependence and slope heterogeneity with a dynamic System GMM specification and panel quantile regression, all estimated on a common set of controls (FDI, energy infrastructure, institutional quality, income level and trade openness) with country and year fixed effects, and each accompanied by full diagnostic reporting (instrument counts, Hansen and Arellano–Bond tests for GMM; properly computed CIPS panel unit-root statistics). Third, the paper is explicit about a data limitation that is often glossed over in the literature: composite indices built by rescaling a single underlying indicator (as EPI was rescaled from EICI) can be exactly collinear with that indicator. We show both how this was diagnosed and how the model was respecified to resolve it, which we hope will be of methodological use beyond this specific application. The dependent variable is Adjusted Net Savings (ANS), a measure developed by the World Bank that accounts for environmental damage, particulate emissions damage, human capital investment, resource depletion, and wealth accumulation, which is theoretically a better indicator of sustainability trends than traditional GDP-based measures [7].
The remainder of the paper is organized as follows: Section 2 reviews the existing literature, both theoretical and empirical. The data, model and estimation methods are described in Section 3. The empirical results are presented in Section 4. Section 5 discusses the results and their policy implications, and Section 6 discusses the study’s limitations.

2. Literature Review

The relationship between foreign direct investment (FDI) and sustainable development in Sub-Saharan Africa (SSA) has attracted considerable scholarly attention. However, despite extensive empirical investigation, the findings remain mixed and inconclusive, indicating that the debate is far from settled. There are several interrelated mechanisms underlying the theoretical arguments for FDI as an engine of sustainable development, such as technology transfer, human capital upgrading, institutional spillovers, and the mobilization of domestic complementary investment [8]. In the neoclassical tradition, capital inflows from the rest of the world also remove the constraint on domestic saving and raise the marginal product of labor, resulting in welfare gains that build up over time. According to endogenous growth theory, clean technologies and knowledge spillovers are generated by FDI, thereby contributing to sustainable development [9]. These theoretical predictions, however, assume competitive markets, adequate absorptive capacity, and adequate institutions in SSA, which is not necessarily the case.
The latter is more complex, as there is no clear consensus on FDI’s effectiveness in SSA due to structural problems. One of the direct tests conducted in [4], in the African context, used adjusted net savings as the dependent variable and a Sustainable Economic Growth index as the independent variable. The GMM-PVAR results indicated that FDI has a negative causal effect on sustainable development for African economies, an effect that [4] found was strongest among the lowest-income economies in their sample compared to a weaker effect among the highest-income economies. In this sense, the absorptive capacity of the host economy is identified as a key intermediary in the welfare effects of FDI in SSA, with [3] establishing that the positive effect of FDI becomes apparent only once a threshold in institutional quality and infrastructure is reached.
The findings from studies on SSA regarding the negative effect of FDI are consistent with the results of the pollution hypothesis and the resource curse literature. Ref. [10] found that FDI had a significant impact on environmental degradation in African countries over a 24-year period, and that the effect was less pronounced in institutional settings characterized by poor governance. This conclusion was echoed by [5], whose environmental sustainability findings imply that the economic and social components of FDI’s overall effect are beneficial when the aggregate sustainable development effect is broken down by dimension.
Other studies suggest more positive conditional effects. For example, Ref. [11] found that, in the sample of 29 SSA countries they studied from 1990 to 2017, trade openness was associated with lower poverty even where FDI itself showed no significant poverty-reducing effect. Goal coherence in FDI policy frameworks is separately identified in the literature as a sufficient condition for translating FDI into sustainable development outcomes in SSA. Ref. [12], studying a broader panel of Belt and Road Initiative (BRI) countries rather than SSA specifically, found that FDI does not have a significant overall effect on socioeconomic development, but exerts a positive effect in the South Asia and Central/Western Asia sub-regions.

Energy Infrastructure as a Structural Constraint on Development

The concept of inadequate energy infrastructure as a constraint on development is well established in the literature, though it has not been studied as extensively in the FDI–development relationship literature. Low income and low energy consumption go hand in hand with low access to modern energy services, creating a vicious circle of energy poverty [13]. In the case of electricity access and economic growth, Ref. [14] directly showed the statistical significance of the positive correlation between electricity access and economic growth across a panel of 14 countries from 1990 to 2016, and indirectly through health, education, and income generation, which are interlinked over time.
These findings have been subsequently confirmed and clarified by subsequent studies. Several estimates across 36 SSA countries in [15] indicate that energy development indicators have positive and significant impacts on food security, labor productivity and household welfare. Using a multidimensional index and principal component analysis, Ref. [16] explained that energy poverty significantly and positively influences agricultural productivity gaps across 35 countries in SSA, and that the impacts vary across sub-regional groups. Ref. [17] found that energy poverty had a significant impact on increased new business creation density in SSA, indirectly, via internet access and health outcomes, both of which are preconditions to FDI absorption.
Another strand of the literature examines the bidirectional relationship between FDI and energy infrastructure development in SSA. Energy infrastructure constitutes a precondition for attracting FDI, while FDI can finance and accelerate energy infrastructure development, particularly where investment capacity is constrained. FDI in renewable energy may generate more sustainable development outcomes than investment in fossil fuel energy. Evidence in Ref. [18] confirms that FDI has a positive and statistically significant effect on electricity access in African countries, based on System GMM estimates for 2000–2017. Conversely, foreign aid exerts a negative and statistically significant effect, consistent with aid fungibility and institutional displacement arguments in the development literature.
Also, new evidence in the literature has begun to recognize that energy poverty serves as a mediator or moderator of the relationship between external capital flows and internal development outcomes, which is a key focus of the present study. In this regard, Ref. [19] demonstrated that energy poverty negatively affects structural economic informality in Africa, and that the two are mutually determined, with bidirectional causality. From an institutional point of view, Ref. [20] argued that the private sector has been slow to invest in the electricity sector of SSA, identifying some governance, financial, political and technological issues that all reduce the returns on the private sector’s investments in electricity infrastructure. Ref. [21] conducted a study on SSA using the CS-ARDL method from 2004 to 2022 and found a positive relationship between clean energy infrastructure and technological advancement in the short and long term with FDI in SSA. Ref. [22] also concluded, based on Driscoll–Kraay fixed effects and a panel structural vector autoregression in a sample of 77 high-income countries, that green energy policies have a positive impact on FDI flows, with macroeconomic performance as the mediator. Ref. [23] used a Spatial Durbin Model and tested it on 80 Belt and Road countries during 2006–2018. They found that outward FDI from China reduces energy poverty in host countries by increasing energy availability and improving their infrastructure. Ref. [24] examined the determinants of renewable energy consumption in 31 Sub-Saharan African countries, focusing on human capital, foreign direct investment, financial development, and institutional quality. The study found that the relationship remains evident across lower-income country sub-samples, suggesting that the expansion of renewable energy consumption is conditioned by the levels of financial development and institutional quality.
The review of the literature in this study suggests a theoretical triangle in which energy infrastructure conditions the productive returns to FDI, indicating that FDI can, in turn, support energy infrastructure development, with institutional quality acting as an intermediary in both directions. Several strands of this literature have been studied individually, including the FDI–sustainable development link, the energy infrastructure–development link, and the role of institutional quality as a conditioning factor. Nonetheless, to our knowledge, they have not previously been combined within a single empirical framework and compared across several second-generation and dynamic panel estimators for the full 35-country SSA panel over 2000–2024. The contribution of the present study lies in this combination and comparison rather than in the discovery of an entirely unexplored relationship, and it is offered as an extension of, rather than a departure from, the existing evidence.

3. Materials and Methods

3.1. Research Design

This study features an unbalanced panel design with observations from countries throughout Sub-Saharan Africa and across up to 875 country-year observations. The attributes are available for 605 of 875 observations (69.1%) for adjusted net savings (ANS), 873 (99.8%) for FDI, 770 each for the Energy Infrastructure Composite Index (EICI) and Energy Poverty Index (EPI), and 784 (89.6%) for institutional quality (INQ). The panel is not balanced because of substantial missingness in each variable, which we disclose and do not interpolate away. Following listwise deletion of observations with missing values across all variables in the full model, the final estimation sample comprised 513 country-year observations from 31 countries, with each country contributing between 9 and 19 annual observations. The full panel was constructed from all 35 SSA countries for which any AfDB/WDI coverage exists over 2000–2024 (35 countries × 25 years = 875) country-year observations) [see Appendix A]. The four excluded countries were Burundi, Central African Republic, Liberia, and Malawi. Of the 31 countries, 30 had at least 10 complete annual observations and were retained for AMG (only Eswatini, with 9 years, falls short), and 20 had at least 17 complete annual observations and were retained for CCEMG. Instead of interpolating missing values to get a balanced panel, we simply let the estimator deal with the unbalanced data (entity-demeaning for FE-DK; listwise deletion for CCEMG/AMG; system moment conditions for GMM does not require a balanced panel) and report coefficients for the data that was actually observed.

3.2. Data Sources, Variable Definitions, and Construction of EICI

Adjusted net savings (ANS), measured as a percentage of Gross National Income and obtained from the World Bank’s World Development Indicators (WDI), serve as the dependent variable. ANS captures sustainable development by accounting for physical capital depreciation, human capital investment, natural resource depletion, particulate emission damage, and environmental degradation, thereby providing a comprehensive measure of an economy’s long-term wealth accumulation [7]. Foreign direct investment (FDI), measured as net inflows (% of GDP), is sourced from the WDI. Following established empirical practice, GDP per capita (constant 2015 US$) from the WDI series is transformed into its natural logarithm (logGDPpc) to control for income effects, while trade openness, measured as the ratio of exports plus imports of goods and services to GDP (WDI), controls for external market integration. The Energy Infrastructure Composite Index (EICI) is constructed from African Development Bank (AfDB) indicators by aggregating electricity access, generation capacity, electricity consumption, transmission losses, and rural electrification into a standardized index ranging from 0 to 100, where higher values denote stronger energy infrastructure. Institutional quality (INQ) is measured as the simple average of the six World Governance Indicators: Government Effectiveness, Control of Corruption, Regulatory Quality, Rule of Law, Voice and Accountability, and Political Stability. To avoid the severe multicollinearity associated with the original Energy Poverty Index (EPI), which was merely a linear rescaling of EICI and generated excessive variance inflation factors exceeding the conventional threshold of 5 [25], this study instead employed the mean-centered EICI (EICI = EICI − EICI ¯ ). The interaction term FDI × EICI preserves the hierarchical specification, substantially reduces multicollinearity, and enables the coefficient on FDI to be interpreted as its marginal effect at the sample’s average level of energy infrastructure.

3.3. Model Specification

The study’s baseline static panel model is presented below:
ANSit = α0 + α1FDIit + α2EICIᵩit + α3(FDIit × EICIᵩit) + α4INQit + α5 log(GDPpc)it + α6 TradeOpenit + μi + τt + εit
where μi represents the country fixed effects (or their common correlated effects analog in CCEMG/AMG); τt represents the year fixed effects, added to Equation (1) to absorb common shocks such as commodity price cycles, the 2008-09 global financial crisis, and the COVID-19 period, which affected all SSA economies simultaneously and were not separately controlled for in the original submission; and εit is the error term, with i indexing country and t indexing time.
The conditional marginal effect of FDI is:
∂ANS/∂FDI = α1 + α3·EICI
A dynamic panel model estimated using System GMM [26] was used to capture some dynamics not captured by the static specification in Equation (1):
ANSit = ρ·ANSi,t−1 + α1FDIit + α2EICIᵩit + α3(FDIit × EICIᵩit) + α4INQit + α5 log(GDPpc)it + α6 TradeOpenit + μi + τt + εit
The interaction term (FDI × EICI) was explicitly incorporated into both the System GMM model and the panel quantile regressions to capture the moderating effect of energy infrastructure on the FDI adjusted net savings nexus. The lagged dependent variable (ANSi,t−1) and the endogenous regressors (FDI, EICI, and FDI × EICI) were specified as GMM-style variables and instrumented using their lagged levels and differences within the Blundell–Bond system estimator [26,27], whereas institutional quality, log(GDPpc), and trade openness were treated as exogenous instruments. Instrument construction employed lags 2–4 for ANS and lags 2–3 for FDI, EICI, and FDI × EICI, with collapsed instruments and Windmeijer-corrected two-step standard errors to mitigate instrument proliferation and finite-sample bias. Distributional effects were subsequently examined through two-step fixed-effects panel quantile regression across the 10th–90th percentiles using country-block bootstrap standard errors (300 replications) [28,29,30].

3.4. Empirical Estimation and Pre-Diagnostics Technique

3.4.1. Pre-Estimation Diagnostics

Before estimation, the model underwent a comprehensive set of diagnostic tests to assess its validity and inform estimator selection. Cross-sectional dependence was examined using the [31] CD test, while panel stationarity was assessed with the Cross-Sectionally Augmented IPS (CIPS) test [31,32]. Slope heterogeneity was evaluated using the test from [33], and long-term equilibrium relationships were examined through the [34] error-correction panel cointegration test. The findings of the CIPS panel statistic were derived as the cross-sectional average of individual CADF t-statistics on lagged levels, together with the interpolated based on the relevant N and minimum available Ti. Stationarity decisions are presented for both levels and first differences, while acknowledging the limited power of the CIPS test for Ti of 20–25 years; consequently, failure to reject the unit-root null is interpreted cautiously. Multicollinearity was evaluated using variance inflation factors for the reformulated model. EICI was centered before interaction, reducing all VIFs to below 1.5. Finally, System GMM [35] and panel quantile regression captured dynamic persistence and distributional heterogeneity, respectively.

3.4.2. Estimation Methods

To ensure consistent and reliable estimation methods, the current research employed several panel estimators to address heterogeneity, cross-sectional dependence, endogeneity, and distributional concerns. The use of fixed effects with Driscoll–Kraay standard errors (FE-DK) deliver baseline estimates that are robust against heteroskedasticity, serial correlation, and cross-section dependence [36]. Furthermore, CCEMG and AMG estimators allow accounting for unobserved common factors and heterogeneous slope coefficients across countries [37,38]. Because the six-regressor specification was more heavily parameterized, CCEMG mean-group regressions were estimated only for countries with at least 17 annual observations (leaving sufficient degrees of freedom per country-specific regression), which yielded 20 countries for CCEMG. AMG used a less restrictive threshold of at least 10 annual observations, reflecting its fewer augmenting regressors, which yielded 30 countries for AMG (whose specification uses fewer augmenting regressors). Despite an attempt to use the CS-ARDL approach, it appeared inappropriate due to insufficient degrees of freedom and failure of convergence in the models with interaction effects due to the shortness of the time dimension of the panel. For this reason, two-step system GMM with Windmeijer-corrected standard errors and collapsed instruments was used to estimate the dynamic model and control for endogeneity [26]. The [29] panel quantile estimation technique with country level block bootstrapping was used to address the issue of heterogeneous effects.

4. Results

4.1. Descriptive Statistics and Preliminary Observations

Before considering the regression estimates for formal inference, the complete descriptive statistics of the observations examined are shown in Table 1.
Based on the descriptive statistics, there is high heterogeneity across sustainable development, investments, energy infrastructure, and institutional quality in the sampled Sub-Saharan African countries. The adjusted net savings (ANS) are between −58.5% and 38.2% of GNI, with a mean of 0.859%. This means that although some countries had high depletion of natural and produced capital more than gross savings, the overall average is close to zero, which is characteristic of resource-dependent economies. The ANS indicator is characterized by the highest number of missing values, with data available in 605 out of 875 country-year observations (69.1%). The FDI stands at 3.76% of GDP but with a maximum value of 103.3% due to enclave-style investments linked with large-scale extractive industries [11,12]. The mean EICI value is low at 7.25, indicating underutilization of electricity infrastructure capacity in the region, consistent with the paper’s central finding that energy infrastructure conditions the returns to FDI. Institutional quality (INQ) has a mean of −0.577 and ranges from −1.854 to 0.870. Its coefficient of variation is high, but ANS, FDI and EICI all show larger absolute ranges and, in the case of ANS and FDI, larger coefficients of variation than INQ.

Sub-Regional Descriptive Statistics and Preliminary Observations

Table 2 provides the regional breakdown of the relevant variables.
Southern Africa has the highest energy infrastructure (EICI = 20.04), the lowest institutional quality deficit (INQ = −0.162), the highest income and trade openness, and the highest ANS (6.41), consistent with sustainable accumulation of resources in the region. Central Africa has the lowest institutional quality (−1.144) and the lowest ANS (−9.44), indicating continuous capital destruction. West Africa has the highest FDI (4.33% of GDP), despite low energy infrastructure and low institutional quality, illustrating that investment inflows alone do not guarantee sustainable development outcomes.

4.2. Pre-Estimation Diagnostic Results

4.2.1. Cross-Sectional Dependence Test

The appropriateness of the second-generation panel data estimator depends on the presence of cross-sectional dependence and heterogeneous slopes. Table 3 displays the Pesaran CD test results.
All variables show strong cross-sectional dependence, consistent with the fact that SSA economies face common commodity price cycles, shared trading relationships, continent-wide climate commitments, and correlated external financing conditions [39]. This motivates the use of second-generation panel estimators (FE-DK, CCEMG, AMG) that explicitly accommodate unobserved common factors. The slope heterogeneity test from Ref. [33] (not tabulated) also indicates significant parameter heterogeneity across countries, supporting the use of mean-group estimators (CCEMG, AMG) alongside the pooled FE-DK estimator.

4.2.2. Panel Unit-Root Test

Table 4 reports the corrected CIPS panel unit-root test interpolating critical values and the resulting decisions.
The CIPS results indicate that FDI rejects the unit-root null in levels (CIPS = −3.229), as the statistic exceeds the 1% critical value (−2.298), and is therefore classified as I(0). This corrects the count-based classification, which understated panel-level evidence for stationarity. Conversely, ANS, EICI, INQ, GDPpc, and TradeOpen remained non-stationary in levels but became stationary after first differencing, confirming their I(1) status. Consequently, the data exhibits a mixed order of integration, comprising both I(0) and I(1) regressors alongside an I(1) dependent variable. This integration supports the application of FE-DK, CCEMG, AMG, and System GMM estimators while acknowledging that short panels (T = 7–24) limit the power of unit-root tests, rendering these classifications informative rather than conclusive.

4.2.3. Multicollinearity, Dynamic Specification and Distribution Diagnostics

Table 5 reports variance inflation factors for the reformulated model.
Table 5 reports variance in inflation factor (VIF) diagnostics, showing no evidence of multicollinearity. All explanatory variables have VIF values between 1.17 and 1.44, well below the conventional threshold of 5 [27,40]. The low VIFs for FDI, EICI (centered), the FDI × EICI interaction, INQ, log(GDPpc), and TradeOpen indicate minimal linear dependence among regressors. Consequently, the estimated coefficients are statistically reliable, with little risk of inflated standard errors due to multicollinearity.

4.3. Regression Analysis Results

4.3.1. Static Panel Regression Results

Table 6 shows the static panel estimation of Equation (1) with country and year fixed effects, the FDI × EICI(centered) interaction explicitly reported, and the expanded control set for FE-DK, CCEMG and AMG.
The baseline estimates from the FE-DK, CCEMG, and AMG estimators in Table 6, provide a comprehensive assessment of the relationships among foreign direct investment (FDI), the Energy Infrastructure Capacity Index (EICI), and sustainable development. The FE-DK results reveal that FDI exerts a positive and statistically significant effect on sustainable development (β = 0.3866, p < 0.01), implying that increased foreign investment enhances sustainable development outcomes. However, the coefficient on EICI is negative and highly significant (β = −0.9373, p < 0.01), suggesting that improvements in energy infrastructure capacity alone do not automatically translate into gains in sustainable development. This finding may reflect the dominance of carbon-intensive energy systems, institutional inefficiencies, or unequal access to energy infrastructure across African economies. Importantly, the interaction between FDI and EICI is positive and highly significant (β = 0.2078, p < 0.01), indicating that energy infrastructure strengthens FDI’s development-enhancing effects. This complementary relationship implies that countries with stronger energy infrastructure are better positioned to absorb foreign investment, facilitate technology diffusion, enhance productive efficiency, and promote inclusive sustainable development.
Institutional quality (INQ) also exerts a strong positive influence under FE-DK (β = 16.538, p < 0.01), highlighting the critical role of effective governance in translating investment and infrastructure into broader development outcomes. Conversely, trade openness exhibits a negative and significant coefficient (β = −0.1084, p < 0.05), suggesting that greater trade integration, in the absence of adequate productive capacity and value addition, may undermine sustainable development by increasing import dependence or creating unequal trade structures. The coefficient of economic development, measured by log(GDPpc), is statistically insignificant under FE-DK but becomes positive and significant in the AMG specification (β = 20.767, p < 0.05) and marginally significant under CCEMG (β = 26.069, p < 0.10), indicating that income improvements contribute to sustainable development once cross-sectional heterogeneity is explicitly accommodated.
The CCEMG and AMG estimators generally yield statistically insignificant coefficients for FDI, EICI, the interaction term, institutional quality, and trade openness, although the estimated signs remain largely consistent with the FE-DK results. These differences likely reflect the more conservative nature of heterogeneous estimators, the smaller effective sample sizes, and their explicit treatment of unobserved common factors. Nevertheless, the consistent positive interaction between FDI and energy infrastructure across all estimators reinforces the conclusion that strengthening energy infrastructure enhances the developmental benefits of foreign investment, even where individual coefficients lose statistical precision.

4.3.2. Conditional Marginal Effect Result

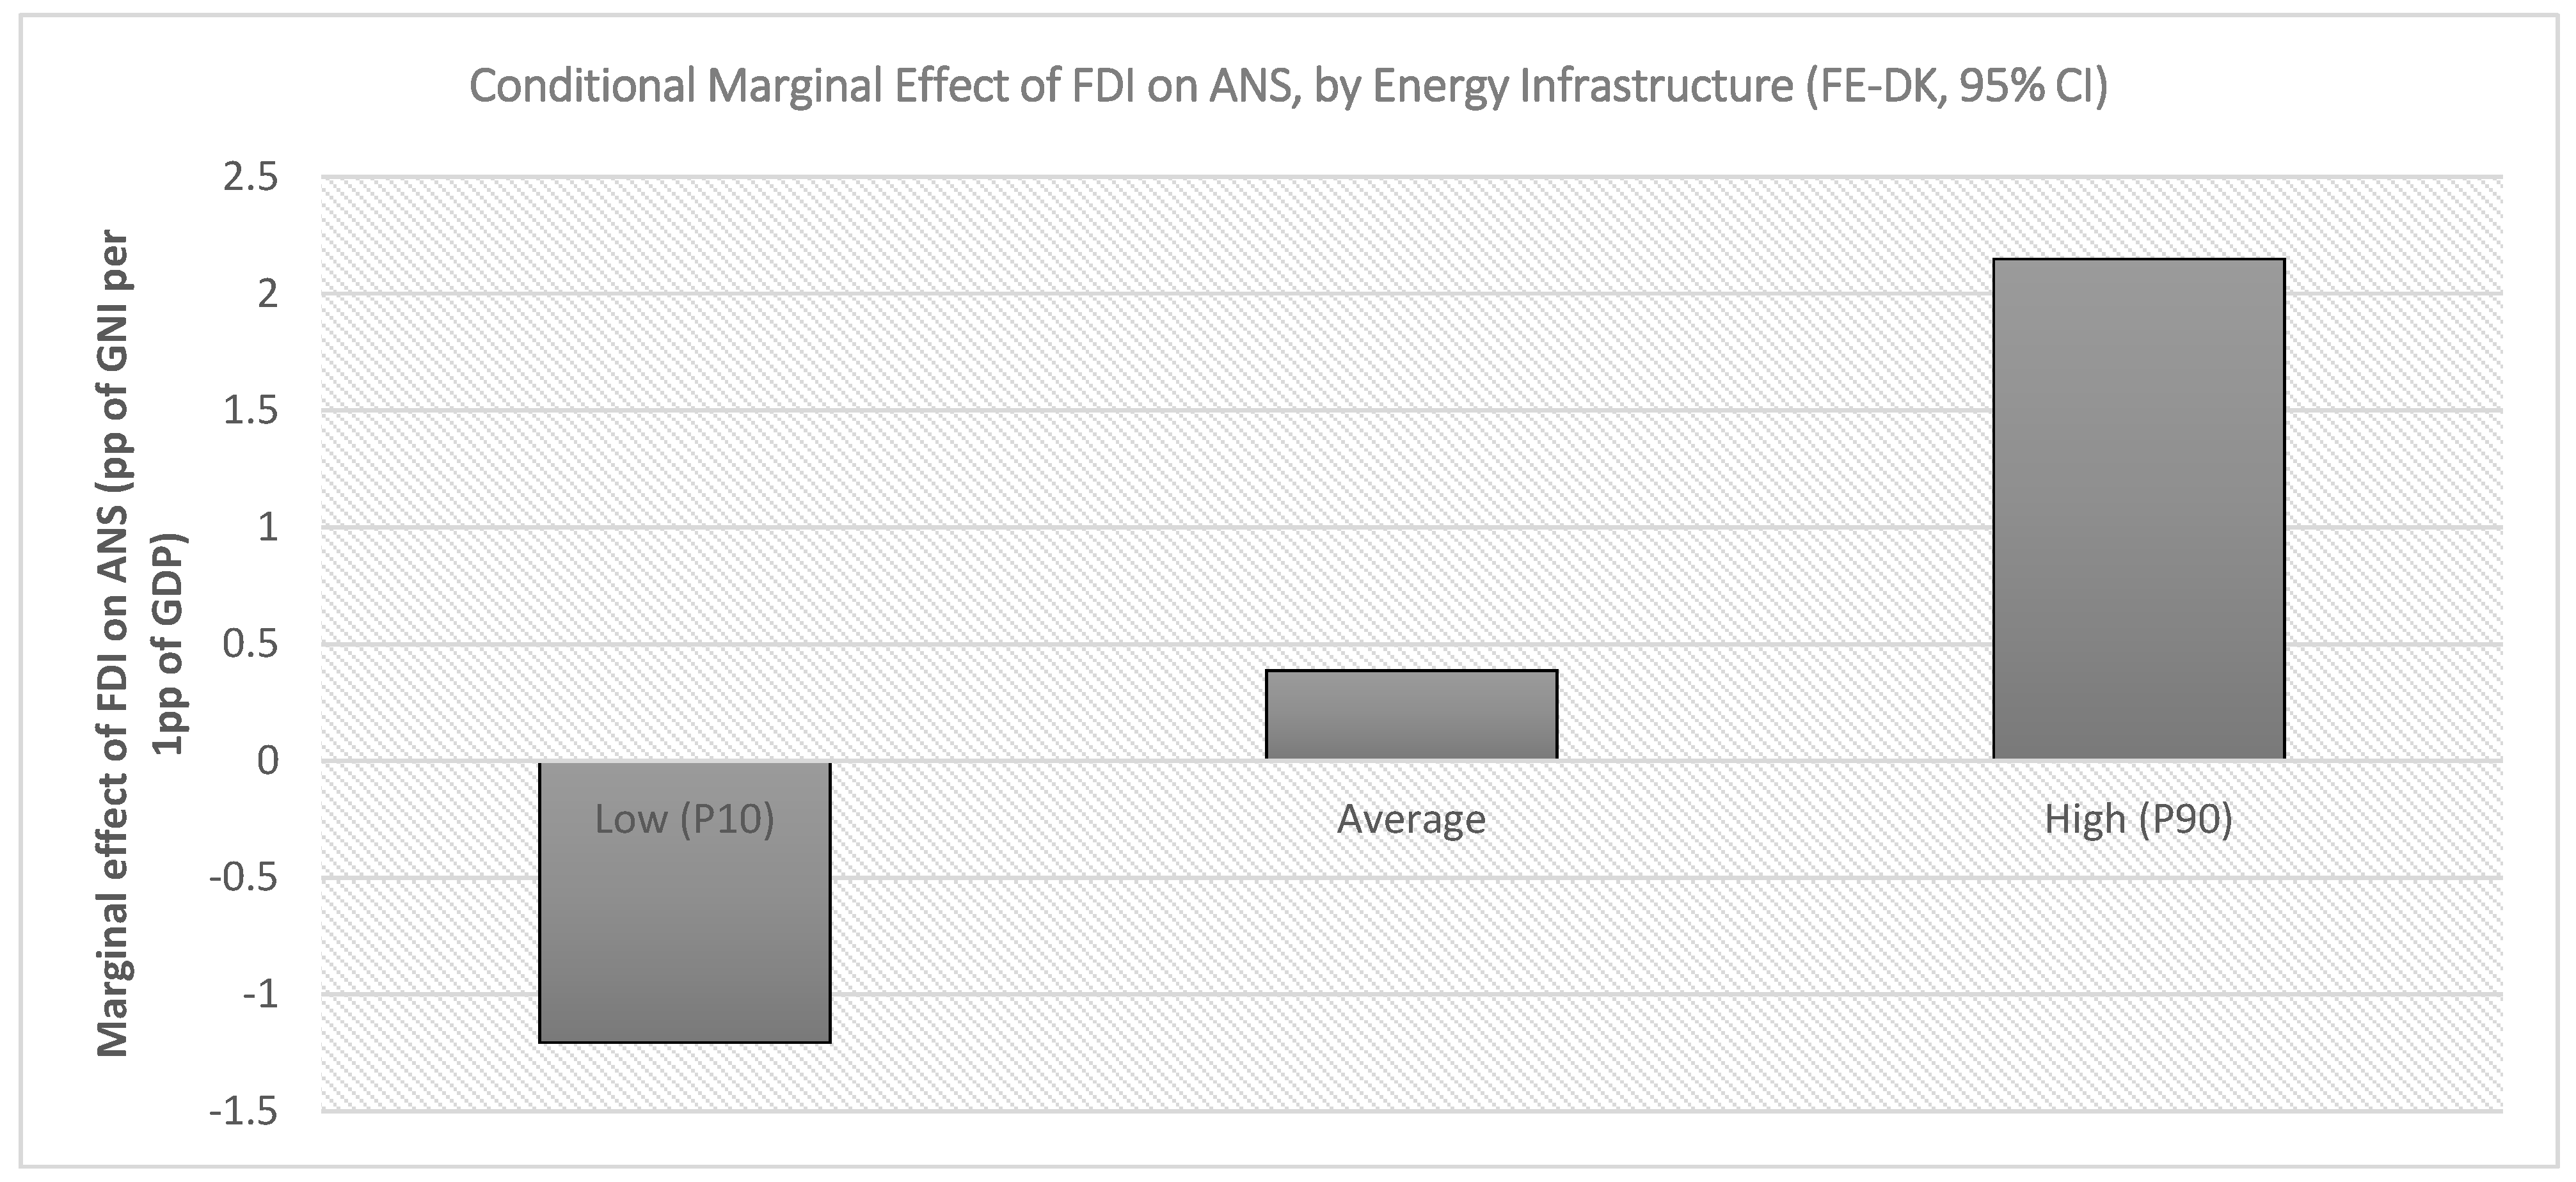
Table 7 reveals that the sustainable development effect of FDI is strongly contingent on the level of energy infrastructure. At low energy infrastructure (EICI = 0.41), FDI exerts a significant negative effect on adjusted net savings (ANS) (β = −1.205, p < 0.001), implying that inadequate infrastructure constrains productive investment and weakens sustainability outcomes. At the sample mean (EICI = 8.07), the marginal effect becomes positive and significant (β = 0.387, p = 0.006), while at high infrastructure levels (EICI = 16.54), the positive impact strengthens substantially (β = 2.148, p < 0.001). These findings demonstrate that robust energy infrastructure transforms FDI into a catalyst for sustainable development.
Figure 1 illustrates the conditional marginal effect of FDI on adjusted net savings (ANS) across low, average, and high levels of energy infrastructure (EICI), together with 95% confidence intervals. The marginal effects are computed as ∂ A N S / ∂ F D I = α ^ 1 + α ^ 3 × E I C I (Equation (2)), using the FE-DK coefficient estimates and covariance matrix reported in Table 6. Standard errors and confidence intervals are derived using the delta method, enabling statistical inference on the conditional effect of FDI across different levels of energy infrastructure.

4.3.3. Dynamic System GMM Results

Table 8 reports the dynamic System GMM results (Equation (3)), now including the FDI × EICI (centered) interaction and full model-validity diagnostics (instrument count, number of countries and observations, and AR(1)/AR(2)/Hansen tests).
Two-step System GMM estimation following Blundell–Bond [26], with Windmeijer-corrected standard errors [27] and collapsed instruments [28], was employed to address endogeneity and dynamic persistence. ANS, FDI, EICI (centered), and the FDI × EICI (centered) interaction was specified as endogenous/predetermined variables using GMM-style instruments, whereas INQ, log(GDPpc), and TradeOpen were treated as exogenous with standard instruments. The diagnostic tests confirmed model validity. Specifically, the Hansen test failed to reject the null of valid instruments (p = 0.749), the AR(2) test indicated no evidence of second-order serial correlation (p = 0.512), and the significant AR(1) statistic (p = 0.015) was consistent with the expected first-differenced specification. Moreover, the instrument count (17) remained well below the number of countries (31), avoiding instrument proliferation through the collapsed-instrument strategy [28]. The estimated autoregressive coefficient revealed substantial persistence in adjusted net savings (ρ = 0.796, p < 0.001), indicating that current sustainability performance is strongly influenced by past outcomes. FDI exerted a negative and statistically significant effect (−0.662, p < 0.05) at the sample-average level of energy infrastructure, consistent with the FE-DK marginal effect reported for low-to-average EICI. Although the FDI × EICI (centered) interaction remained positive, it is statistically insignificant (p = 0.267), reflecting limited within-country temporal variation in EICI. Likewise, EICI (centered), INQ, log(GDPpc), and TradeOpen remained statistically insignificant after controlling dynamic persistence.

4.3.4. Joint Significance of FDI and FDI × EPI

Table 9 reports Wald and F-tests of the joint significance of FDI and the interaction term for each mean-group/pooled estimator, updated for the corrected specification.
FE-DK Wald tests employed the Driscoll–Kraay covariance matrix, whereas CCEMG/AMG Wald and F-tests used the cross-country covariance of country-specific coefficients, consistent with the mean-group approach of [41]. The joint null was decisively rejected under FE-DK (χ2 = 49.40, p < 0.001), but not under CCEMG or AMG (p > 0.35), reflecting degrees-of-freedom constraints.

4.4. Distributional Heterogeneity: Panel Quantile Results

Table 10 reports the panel quantile results [29] using the two-step estimator including the FDI × EICI (centered) interaction and the expanded control set at five quantiles of the conditional distribution of ANS.
The quantile regression results reveal that the interaction term, FDI × EICI (centered), is positive across all five quantiles and statistically significant at the 10th, 25th, 50th, and 75th quantiles, demonstrating that the moderating role of energy infrastructure extends beyond the conditional mean to most segments of the conditional distribution of adjusted net savings (ANS). This distributional heterogeneity underscores the value of explicitly modeling interaction effects within quantile specifications, as relationships and conditional effects may vary systematically across the outcome distribution [42]. Furthermore, FDI exerts a positive influence across all quantiles and is statistically significant at the 25th, 50th, and 75th quantiles, indicating stronger effects in the central distribution. Institutional quality (INQ) remains positive, substantial, and highly significant throughout all quantiles, confirming its position as the most distributionally robust driver of sustainable development within the sample. By contrast, trade openness exhibits a negative and statistically significant effect across the lower and middle quantiles.

4.5. Relating Evidence to Real Development Challenges

The empirical findings provide compelling evidence that sustainable development in Sub-Saharan Africa (SSA) depends not merely on attracting foreign direct investment (FDI) but on the institutional and infrastructural conditions that enable foreign capital to generate long-term productive gains. Across alternative estimation techniques, institutional quality is the only determinant that consistently shows a positive and statistically significant relationship with adjusted net savings (ANS), whereas the effects of FDI and energy infrastructure vary across estimators and with the conditional distribution of sustainable development. The robustness of institutional quality estimates across FE-DK, System GMM, and panel quantile approaches suggests that governance is the principal transmission mechanism through which investment, infrastructure, and economic resources translate into sustainable development outcomes. This finding is consistent with previous studies emphasizing that strong institutions enhance regulatory effectiveness, reduce transaction costs, improve resource allocation, strengthen investor confidence, and facilitate the diffusion of productivity-enhancing technologies throughout host economies [3,6,9,10,43,44].
The distributional evidence further reinforces this conclusion. Institutional quality remains highly significant across every quantile of the ANS distribution, implying that its developmental contribution is not confined to relatively high-performing economies but extends equally to countries with weak sustainability performance. In contrast, the interaction between FDI and energy infrastructure is positive across all quantiles but statistically significant primarily within the lower and middle segments of the distribution, indicating that improvements in energy infrastructure strengthen the developmental contribution of FDI in most, although not all, institutional settings. Similarly, FDI exhibits significant positive effects primarily around the central distribution of ANS, indicating that foreign investment alone cannot guarantee sustainable development when domestic absorptive capacity remains inadequate. These findings lend empirical support to the absorptive-capacity hypothesis, which argues that the developmental benefits of FDI depend critically on complementary domestic conditions rather than the volume of capital inflows alone [3,6,8].
The results closely mirror contemporary development realities across SSA, with Nigeria vividly illustrating this paradox. Despite being one of the continent’s largest recipients of FDI, the country continues to experience relatively weak adjusted net savings alongside persistent electricity shortages, institutional weaknesses, regulatory uncertainty, and governance challenges. Under such conditions, foreign investment frequently remains concentrated in capital-intensive extractive industries with limited domestic linkages, modest technology spillovers, and weak contributions to long-term wealth accumulation, thereby constraining sustainable development despite substantial investment inflows [4,5]. Conversely, countries such as Mauritius, Rwanda, and, to a lesser extent, South Africa exhibit comparatively stronger institutional environments and more reliable energy systems, enabling them to capture greater developmental benefits from investment through improved productivity, policy credibility, and enhanced private-sector participation. These regional experiences reinforce the empirical finding that governance and complementary infrastructure jointly determine whether foreign capital contributes to sustainable development rather than merely increasing investment statistics.

5. Conclusions and Policy Recommendations

This study investigates whether energy infrastructure conditions the effects of foreign direct investment (FDI) on sustainable development in Sub-Saharan Africa (SSA), using an unbalanced panel of 31 countries covering 2000–2024. Unlike previous studies that treat energy infrastructure as a control variable, this study explicitly models it as a moderator of the FDI–sustainable development relationship through an interaction term. Sustainable development is measured using adjusted net savings (ANS), providing a comprehensive indicator of long-term wealth accumulation that incorporates produced, human, and natural capital. To ensure robust inference, the analysis employs complementary second-generation panel estimators, including fixed effects with Driscoll–Kraay standard errors (FE-DK), Common Correlated Effects Mean Group (CCEMG), Augmented Mean Group (AMG), System Generalized Method of Moments (System GMM), and panel quantile regression, thereby accounting for cross-sectional dependence, slope heterogeneity, endogeneity, dynamic persistence, and distributional heterogeneity.
The results demonstrate that the developmental contribution of FDI depends critically on the quality of domestic energy infrastructure. Although the effects of FDI vary across estimators, the conditional marginal effect analysis reveals a clear nonlinear relationship such that FDI negatively affects sustainable development where energy infrastructure is weak, becomes positive at average infrastructure levels, and yields substantially stronger sustainability gains where energy infrastructure is well developed. The positive interaction between FDI and energy infrastructure across most quantiles further confirms that stronger energy systems enhance countries’ capacity to transform foreign investment into sustainable long-term development. These findings support the absorptive-capacity hypothesis, suggesting that the developmental benefits of FDI depend not merely on the volume of investment but on complementary infrastructure that facilitates technology transfer, productivity improvements, and structural transformation.
Institutional quality emerges as the most robust determinant of sustainable development. It remains positive and statistically significant across all static estimators and throughout the conditional distribution of ANS, underscoring the importance of governance in improving regulatory quality, resource allocation, investor confidence, and the efficient utilization of both public investment and foreign capital. Consequently, governance reforms represent the most effective policy instrument for strengthening sustainable development outcomes.
The findings suggest that policies aimed solely at attracting larger FDI inflows are unlikely to deliver sustainable development without simultaneous investments in reliable energy infrastructure and stronger institutions, hence the need for governments to prioritize high-quality FDI that promotes technology transfer, renewable energy, local value addition and stronger domestic linkages while expanding electricity generation, transmission and distribution systems. Also, regional cooperation through institutions such as the African Union and AfCFTA should support coordinated energy infrastructure development and investment governance to sustain the region’s development.

6. Limitations and Future Research

Future research should utilize firm-level or sectoral data, investigate nonlinear infrastructure thresholds, distinguish renewable from non-renewable energy infrastructure, and incorporate additional structural factors, including digital infrastructure, innovation, financial development and human capital, to further explain how FDI contributes to sustainable development in Sub-Saharan Africa, considering the limitations of this study.

Author Contributions

Both P.L.M. and J.I.A. performed Conceptualization, Data Curation, Formal Analysis, Methodology, Software, Writing—Original Draft, and Writing—Review and Editing. All authors have read and agreed to the published version of the manuscript.

Funding

This research received no external funding.

Informed Consent Statement

This study relies exclusively on secondary, publicly available macro-level panel data (World Bank World Development Indicators and African Development Bank indicators) and did not involve human participants, human data, or animal subjects. Ethical approval was therefore not required.

Data Availability Statement

The datasets analyzed during the current study were compiled from publicly available sources; the World Bank’s World Development Indicators (WDI) database and African Development Bank (AfDB) indicators. The compiled panel dataset and the estimation results are available from the corresponding author upon reasonable request.

Conflicts of Interest

The authors declare no conflicts of interest.

Appendix A. List of Countries in the Estimation Sample

Table A1 lists all 35 SSA countries with AfDB/WDI coverage over 2000–2024, together with the estimation sample(s) each is retained in, computed directly from the analysis dataset.
Table A1. Country-level data completeness and sample eligibility for AMG and CCEMG estimations.
CountryRegionYrs (All 6 vars Complete)Full Sample (N = 31)AMG, ≥10 yrs (N = 30)CCEMG, ≥17 yrs (N = 20)
AngolaSouthern Africa19YesYesYes
BeninWest Africa18YesYesYes
BotswanaSouthern Africa19YesYesYes
Burkina FasoWest Africa15YesYesNo
BurundiEast Africa0NoNoNo
CameroonCentral Africa19YesYesYes
Central African RepublicCentral Africa0NoNoNo
Côte d’IvoireWest Africa16YesYesNo
Democratic Republic of the CongoCentral Africa17YesYesYes
EswatiniSouthern Africa9YesNoNo
EthiopiaEast Africa11YesYesNo
GabonCentral Africa12YesYesNo
GambiaWest Africa19YesYesYes
GhanaWest Africa19YesYesYes
KenyaEast Africa19YesYesYes
LesothoSouthern Africa14YesYesNo
LiberiaWest Africa0NoNoNo
MadagascarEast Africa19YesYesYes
MalawiEast Africa0NoNoNo
MaliWest Africa18YesYesYes
MauritiusSouthern Africa19YesYesYes
MozambiqueEast Africa17YesYesYes
NamibiaSouthern Africa19YesYesYes
NigerWest Africa18YesYesYes
NigeriaWest Africa19YesYesYes
Republic of the CongoCentral Africa16YesYesNo
RwandaEast Africa12YesYesNo
SenegalWest Africa16YesYesNo
Sierra LeoneWest Africa18YesYesYes
South AfricaSouthern Africa18YesYesYes
TanzaniaEast Africa18YesYesYes
TogoWest Africa18YesYesYes
UgandaEast Africa19YesYesYes
ZambiaEast Africa11YesYesNo
ZimbabweSouthern Africa12YesYesNo
Source: Authors’ compilation, 2026.

References

  1. Agoundedemba, M.; Kim, C.K.; Kim, H.-G. Energy status in Africa: Challenges, progress and sustainable pathways. Energies 2023, 16, 7708. [Google Scholar] [CrossRef] [Scilit]
  2. Chirambo, D. Towards the achievement of SDG 7 in sub-Saharan Africa: Creating synergies between Power Africa, Sustainable Energy for All and climate finance. Renew. Sustain. Energy Rev. 2018, 94, 600–608. [Google Scholar] [CrossRef] [Scilit]
  3. Yeboah, S. Navigating Global Markets: The Impact of FDI on Startups’ Access to Insights, Networks, and Brand Visibility; MPRA Paper No. 118434; Munich Personal RePEc Archive (MPRA): Munich, Germany, 2023; Available online: https://mpra.ub.uni-muenchen.de/118434/ (accessed on 14 May 2026).
  4. Arthur, B.; Saha, M.; Sarpong, F.A.; Dutta, K.D. Unlocking Africa’s potential: The transformative power of foreign direct investment for sustainable development. Heliyon 2024, 10, e26507. [Google Scholar] [CrossRef] [Scilit] [PubMed]
  5. Slimani, S.; Omri, A.; Abbassi, A. Financing sustainable development goals in Sub-Saharan Africa: Does international capital flows matter? Sustain. Dev. 2024, 32, 6656–6685. [Google Scholar] [CrossRef] [Scilit]
  6. Arogundade, S.; Biyase, M.; Eita, H. Foreign direct investment and poverty in sub-Saharan African countries: The role of host absorptive capacity. Cogent Econ. Financ. 2022, 10, 2078459. [Google Scholar] [CrossRef] [Scilit]
  7. Hamilton, K.; Clemens, M. Genuine savings rates in developing countries. World Bank. Econ. Rev. 1999, 13, 333–356. [Google Scholar] [CrossRef] [Scilit]
  8. Lopes, J.; Somanje, A.N.; Velez, E.; Lam, R.D.; Saito, O. Determinants of foreign investment and international aid for meeting the Sustainable Development Goals in Africa. In Sustainability Challenges in Sub-Saharan Africa I; Gasparatos, A., Ahmed, A., Naidoo, M., Karanja, A., Fukushi, K., Saito, O., Takeuchi, K., Eds.; Springer: Singapore, 2020. [Google Scholar] [CrossRef] [Scilit]
  9. Sarkodie, S.A.; Adams, S.; Leirvik, T. Foreign direct investment and renewable energy in climate change mitigation: Does governance matter? J. Clean. Prod. 2020, 263, 121262. [Google Scholar] [CrossRef] [Scilit]
  10. Bokpin, G.A. Foreign direct investment and environmental sustainability in Africa: The role of institutions and governance. Res. Int. Bus. Financ. 2017, 39, 239–247. [Google Scholar] [CrossRef] [Scilit]
  11. Anetor, F.O.; Esho, E.; Verhoef, G.; Nsiah, C. The impact of foreign direct investment, foreign aid and trade on poverty reduction: Evidence from Sub-Saharan African countries. Cogent Econ. Financ. 2020, 8, 1737347. [Google Scholar] [CrossRef] [Scilit]
  12. Sattar, A.; Hassan, A.; Hussain, M.N.; Sakhi, U.; Elahi, A.R. Impact of foreign direct investment on socio-economic development in belt and road countries. Cogent Econ. Financ. 2022, 10, 2143772. [Google Scholar] [CrossRef] [Scilit]
  13. Chevalier, J.M.; Ouédraogo, N.S. Energy poverty and economic development. In The New Energy Crisis; Chevalier, J.M., Geoffron, P., Eds.; Palgrave Macmillan: London, UK, 2013; pp. 73–103. [Google Scholar] [CrossRef] [Scilit] [PubMed]
  14. Singh, K.; Inglesi-Lotz, R. The role of energy poverty on economic growth in sub-Saharan African countries. Econ. Energy Environ. Policy 2021, 10, 105–122. [Google Scholar] [CrossRef] [Scilit]
  15. Pondie, T.M.; Engwali, F.D.; Nkoa, B.E.O.; Domguia, E.N. Does energy poverty increase starvation? Evidence from sub-Saharan Africa. Environ. Sci. Pollut. Res. 2023, 30, 48721–48738. [Google Scholar] [CrossRef] [Scilit] [PubMed]
  16. Dimnwobi, S.K.; Okere, K.I.; Onuoha, F.C.; Ekesiobi, C. Energy poverty, environmental degradation and agricultural productivity in Sub-Saharan Africa. Int. J. Sustain. Dev. World Ecol. 2023, 30, 428–444. [Google Scholar] [CrossRef] [Scilit]
  17. Ondoua Beyene, B.; Ngnouwal Eloundou, G.; Mokompea Nyamou, J.C.; Gallouj, C. Energy poverty and entrepreneurship: Evidence from sub-Saharan Africa. Bottom Line 2025, 38, 233–252. [Google Scholar] [CrossRef] [Scilit]
  18. Nguea, S.M.; Kaguendo, U.V.E.; Noumba, I. Are growth effects of foreign capital significant for increasing access to electricity in Africa? Energy Policy 2022, 168, 113129. [Google Scholar] [CrossRef] [Scilit]
  19. Ajide, F.M.; Dada, J.T. Energy poverty and shadow economy: Evidence from Africa. Int. J. Energy Sect. Manag. 2024, 18, 1982–2009. [Google Scholar] [CrossRef] [Scilit]
  20. Gregory, J.; Sovacool, B.K. Rethinking the governance of energy poverty in sub-Saharan Africa: Reviewing three academic perspectives on electricity infrastructure investment. Renew. Sustain. Energy Rev. 2019, 111, 344–354. [Google Scholar] [CrossRef] [Scilit]
  21. Qamruzzaman, M.; Monika, M.; Hossain Avantika, R.R.; Gupta, A.; Kler, R.; Bhuiyan, R.A.T. Investing in the future: Clean energy, technological advancement, and environmental quality as catalysts for foreign direct investment: Evidence from SSA. Int. J. Energy Econ. Policy 2025, 15, 685–699. [Google Scholar] [CrossRef] [Scilit]
  22. Gakuru, E.; Yang, S.; Yang, L.; Adegboyo, O.S. Mediating macroeconomic performance in green energy policies and foreign direct investment nexus. Energy Environ. 2025. [Google Scholar] [CrossRef] [Scilit]
  23. Zhou, K.; Wang, Y.; Wang, H.; Tan, J. Does China’s outward foreign direct investment alleviate energy poverty in host countries? Evidence from countries along the Belt and Road Initiative. Renew. Energy 2024, 223, 120034. [Google Scholar] [CrossRef] [Scilit]
  24. Nawaz, A.; Rahman, M.M. Renewable energy consumption in Sub-Saharan Africa: The role of human capital, foreign direct investment, financial development, and institutional quality. Energy Rep. 2023, 10, 3383–3393. [Google Scholar] [CrossRef] [Scilit]
  25. Hair, J.F.; Black, W.C.; Babin, B.J.; Anderson, R.E. Multivariate Data Analysis, 8th ed.; Cengage Learning: Boston, MA, USA, 2019; Available online: https://www.cengage.com/c/ebook-multivariate-data-analysis-8e-hair-babin-anderson/9781473756557/ (accessed on 21 May 2026).
  26. Blundell, R.; Bond, S. Initial conditions and moment restrictions in dynamic panel data models. J. Econom. 1998, 87, 115–143. [Google Scholar] [CrossRef] [Scilit]
  27. Windmeijer, F. A finite sample correction for the variance of linear efficient two-step GMM estimators. J. Econom. 2005, 126, 25–51. [Google Scholar] [CrossRef] [Scilit]
  28. Roodman, D. How to do xtabond2: An introduction to difference and system GMM in Stata. Stata J. 2009, 9, 86–136. [Google Scholar] [CrossRef] [Scilit]
  29. Canay, I.A. A simple approach to quantile regression for panel data. Econom. J. 2011, 14, 368–386. [Google Scholar] [CrossRef] [Scilit]
  30. Koenker, R.; Bassett, G. Regression quantiles. Econometrica 1978, 46, 33–50. [Google Scholar] [CrossRef] [Scilit]
  31. Pesaran, M.H. General Diagnostic Tests for Cross-Section Dependence in Panels; Cambridge Working Papers in Economics No. 0435; Faculty of Economics: Cambridge, UK, 2004. [Google Scholar] [CrossRef] [Scilit]
  32. Pesaran, M.H. A simple panel unit root test in the presence of cross-section dependence. J. Appl. Econom. 2007, 22, 265–312. [Google Scholar] [CrossRef] [Scilit]
  33. Pesaran, M.H.; Yamagata, T. Testing slope homogeneity in large panels. J. Econom. 2008, 142, 50–93. [Google Scholar] [CrossRef] [Scilit]
  34. Westerlund, J. Testing for error correction in panel data. Oxf. Bull. Econ. Stat. 2007, 69, 709–748. [Google Scholar] [CrossRef] [Scilit]
  35. Bond, S. Dynamic panel data models: A guide to micro data methods and practice. Port. Econ. J. 2002, 1, 141–162. [Google Scholar] [CrossRef] [Scilit]
  36. Driscoll, J.C.; Kraay, A.C. Consistent covariance matrix estimation with spatially dependent panel data. Rev. Econ. Stat. 1998, 80, 549–560. [Google Scholar] [CrossRef] [Scilit]
  37. Pesaran, M.H. Estimation and inference in large heterogeneous panels with a multifactor error structure. Econometrica 2006, 74, 967–1012. [Google Scholar] [CrossRef] [Scilit]
  38. Bond, S.; Eberhardt, M. Cross-section dependence in nonstationary panel models: A novel estimator. In Proceedings of the Nordic Econometrics Conference, Lund, Sweden, 29–31 October 2009; Available online: https://mpra.ub.uni-muenchen.de/17692/ (accessed on 15 May 2026).
  39. Pesaran, M.H. General diagnostic tests for cross-sectional dependence in panels. Empir. Econ. 2021, 60, 13–50. [Google Scholar] [CrossRef] [Scilit]
  40. Aiken, L.S.; West, S.G. Multiple Regression: Testing and Interpreting Interactions; Sage Publications: Newbury Park, CA, USA, 1991; Available online: https://us.sagepub.com/en-us/nam/multiple-regression/book3045 (accessed on 15 May 2026).
  41. Pesaran, M.H.; Smith, R. Estimating long-run relationships from dynamic heterogeneous panels. J. Econom. 1995, 68, 79–113. [Google Scholar] [CrossRef] [Scilit]
  42. Liu, Y.; Xia, L.; Hu, F. Testing heterogeneous treatment effect with quantile regression under covariate-adaptive randomization. J. Econom. 2025, 249, 105808. [Google Scholar] [CrossRef] [Scilit]
  43. Haldar, A.; Sethi, N.; Jena, P.K.; Padhan, P.C. Towards achieving Sustainable Development Goal 7 in sub-Saharan Africa: Role of governance and renewable energy. Sustain. Dev. 2023, 31, 2446–2463. [Google Scholar] [CrossRef] [Scilit]
  44. Ali, J.I. Institutional quality, Islamic finance and economic growth of selected Global South economies. I-Financ. A Res. J. Islam. Financ. 2025, 11, 352–367. [Google Scholar] [CrossRef] [Scilit]
Figure 1. Conditional marginal effects of FDI on adjusted net savings. Source: Authors’ computation, 2026.
Energies 19 03924 g001
Table 1. Descriptive statistics.
VariableNMeanStd DevMinMaxCoverage (2000–2024)
ANS (adjusted net savings, % GNI)6050.85913.739−58.53738.225605/875 (69.1%)
FDI net inflows (% GDP)8733.7567.427−17.292103.337873/875 (99.8%)
EICI (Energy Infrastructure Composite Index)7707.24913.8290.00082.376770/875 (88.0%)
INQ (institutional quality, avg. of 6 WGI dims)784−0.5770.550−1.8540.870784/875 (89.6%)
GDPpc (GDP per capita, constant 2015 US$)8751820.4312053.700243.07711,918.805875/875 (100.0%)
TradeOpen (trade openness, % of GDP)77463.78928.74116.762165.049774/875 (88.5%)
Source: Authors’ computation, 2026.
Table 2. Sub-regional structural descriptive statistics.
RegionMean ANSMean FDI (%)Mean EICIMean INQMean GDPpcMean TradeOpen
West Africa1.6284.3292.316−0.6331052.551.25
East Africa−0.9684.0193.468−0.591706.953.01
Central Africa−9.4434.0086.178−1.1442225.869.71
Southern Africa6.4092.41520.044−0.1624110.890.86
SSA Average0.8593.7567.249−0.5771820.463.79
Source: Authors’ computation, 2026.
Table 3. Cross-sectional dependence test.
VariableCD Statisticp-ValueInference
ANS5.965<0.001Strong cross-sectional dependence
FDI6.865<0.001Strong cross-sectional dependence
EICI34.845<0.001Very strong cross-sectional dependence
INQ3.632<0.001Significant cross-sectional dependence
GDPpc54.091<0.001Very strong cross-sectional dependence
Source: Authors’ computation, 2026.
Table 4. Unit-root test.
VariableCIPS (Level)5% Crit. ValueDecision (Level)CIPS (1st Diff.)5% Crit. ValueDecision (1st Diff.)Order of Integration
ANS−2.046−2.244Non-stationary−4.725−2.244StationaryI(1)
FDI−3.229−2.140Stationary−6.672−2.140StationaryI(0)
EICI−2.028−2.140Non-stationary−4.936−2.140StationaryI(1)
INQ−1.940−2.140Non-stationary−4.775−2.140StationaryI(1)
GDPpc−1.211−2.140Non-stationary−3.659−2.140StationaryI(1)
TradeOpen−1.538−2.241Non-stationary−4.759−2.241StationaryI(1)
Source: Authors’ computation, 2026.
Table 5. Variance inflation factors.
VariableVIF (FDI, EICI-Centered, FDI × EICI-Centered, INQ, logGDPpc, TradeOpen)
FDI1.17
EICI (centered)1.41
FDI × EICI (centered)1.44
INQ1.24
Source: Authors’ computation, 2026.
Table 6. Static panel regression results.
VariableFE-DK Coef. (SE)t-Stap-ValCCEMG Coef. (SE)t-Valp-ValAMG Coef. (SE)t-Valp-Val
FDI0.3866 (0.1411)2.7390.006 ***0.035 (0.418)0.0850.933−0.144 (0.279)−0.5160.610
EICI (centered)−0.9373 (0.1354)−6.9200.000 ***−2.738 (9.451)−0.2900.775−3.815 (3.293)−1.1580.256
FDI × EICI (centered)0.2078 (0.0305)6.8110.000 ***1.505 (2.300)0.6540.5211.168 (1.208)0.9660.342
INQ16.538 (3.233)5.1150.000 ***−12.542 (15.114)−0.8300.4179.684 (6.825)1.4190.167
log(GDPpc)−1.003 (9.234)−0.1090.91426.069 (14.002)1.8620.078 *20.767 (9.666)2.1480.040 **
TradeOpen−0.1084 (0.0446)−2.4320.015 **−0.127 (0.107)−1.1920.248−0.042 (0.046)−0.9020.375
Country & Year FEYes CS-averages AMG factor
Observations513 369 483
Countries31 20 30
Source: Authors’ computation, 2026. *** p < 0.01, ** p < 0.05, * p < 0.10.
Table 7. Conditional marginal effect of FDI on ANS at low, average and high energy infrastructure (FE-DK).
Energy Infrastructure LevelEICI ValueMarginal Effect of FDISEZp-Val95% CI
Low (10th percentile)0.41−1.2050.254−4.741<0.001[−1.704, −0.707]
Average (sample mean)8.070.3870.1412.7390.006[0.110, 0.663]
High (90th percentile)16.542.1480.3136.870<0.001[1.535, 2.761]
Source: Authors’ computation, 2026.
Table 8. Dynamic System GMM results.
Variable/DiagnosticCoefficient/ValueCorrected SEz-Statisticp-Value
Dependent variable: ANS
L1.ANS0.79620.08729.1320.000 ***
FDI−0.66170.2771−2.3880.017 **
EICI (centered)−0.49090.3690−1.3300.183
FDI × EICI (centered)0.09730.08761.1110.267
INQ1.39381.16601.1950.232
log(GDPpc)−0.80050.7889−1.0150.310
TradeOpen0.01120.02410.4650.642
Constant8.86105.55321.5960.111
Model diagnostics
Number of observations447
Number of countries (groups)31
Number of instruments17
Instrument-to-group ratio0.55
GMM-style instruments (ANS)Lags 2–4 (collapsed)
GMM-style instruments (FDI, EICI(c), FDI × EICI(c))Lags 2–3 (collapsed)
Standard (IV-style) instrumentsINQ, log(GDPpc), TradeOpen
Hansen testχ2(9) = 5.907 0.749
Arellano–Bond AR(1)z = −2.437 0.015 **
Arellano–Bond AR(2)z = 0.655 0.512
Source: Authors’ computation, 2026. Note: **, *** indicate significance 5% and 1% respectively.
Table 9. Wald and F-test.
EstimatorWald χ2(2)p (χ2)F(2, N-2)p (F)
FE-DK49.398<0.001 ***--
CCEMG0.4960.7800.2350.793
AMG1.9030.3860.9190.411
Source: Authors’ computation, 2026. Note *** p < 0.01 indicates significance at 1%.
Table 10. Panel quantile results.
Variableq = 0.10q = 0.25q = 0.50 (Median)q = 0.75q = 0.90
FDI0.209 (p = 0.200)0.355 (p = 0.013 **)0.387 (p < 0.001 ***)0.372 (p = 0.024 **)0.290 (p = 0.332)
EICI (centered)−0.525 (p = 0.276)−0.437 (p = 0.435)−0.472 (p = 0.321)−0.806 (p = 0.079 *)−0.563 (p = 0.315)
FDI × EICI (centered)0.275 (p = 0.039 **)0.232 (p = 0.100 *)0.187 (p = 0.075 *)0.224 (p = 0.021 **)0.211 (p = 0.210)
INQ19.237 (p < 0.001 ***)16.306 (p < 0.001 ***)15.142 (p < 0.001 ***)15.682 (p < 0.001 ***)12.614 (p < 0.001 ***)
log(GDPpc)−0.914 (p = 0.323)−0.059 (p = 0.948)−0.879 (p = 0.150)−1.284 (p = 0.228)0.542 (p = 0.808)
TradeOpen−0.146 (p < 0.001 ***)−0.132 (p < 0.001 ***)−0.111 (p < 0.001 ***)−0.093 (p < 0.001 ***)−0.056 (p = 0.377)
Source: Authors’ computation, 2026. *** p < 0.01, ** p < 0.05, * p < 0.10. respectively.
Disclaimer/Publisher’s Note: The statements, opinions and data contained in all publications are solely those of the individual author(s) and contributor(s) and not of MDPI and/or the editor(s). MDPI and/or the editor(s) disclaim responsibility for any injury to people or property resulting from any ideas, methods, instructions or products referred to in the content.