Article

Process-Dependent Carbonization Pathways of Mushroom Waste Medium: Mechanistic Insights into Chemical and Structural Evolution

1
School of Architectural, Civil, and Environmental Engineering, Mokpo National University, 1666 Yeongsan-ro, Cheonggye-Myeon, Muan-gun 58554, Jeollanam-do, Republic of Korea
2
Institute of Climate Change and Marine Environment, Mokpo National University, 1666 Yeongsan-ro, Cheonggye-Myeon, Muan-gun 58554, Jeollanam-do, Republic of Korea
*
Author to whom correspondence should be addressed.
Energies 2026, 19(16), 3872; https://doi.org/10.3390/en19163872
Submission received: 15 July 2026 / Revised: 10 August 2026 / Accepted: 13 August 2026 / Published: 18 August 2026

Abstract

Considering carbon neutrality and fossil fuel depletion, biomass is becoming increasingly important as a renewable and sustainable energy source. However, understanding of process-dependent characteristics relevant to char production remains limited. This study investigated the carbonization of mushroom waste medium (MWM) via conventional carbonization (CC; i.e., pyrolysis), hydrothermal carbonization (HTC), and microwave-assisted carbonization (MAC), and evaluated their suitability for desired char properties and target applications. For all methods, increasing reaction temperature led to carbon densification, with decreased oxygen and hydrogen contents and increased carbon and fixed carbon fractions. However, the extent of these transformations depended on the reaction environment. HTC achieved carbon enrichment and the highest higher heating value (HHV) at relatively low temperatures. In contrast, CC required higher temperatures to achieve comparable carbonization levels but showed a marked increase in BET surface area at higher temperatures. MAC exhibited intermediate characteristics under moderate conditions. HTC also facilitated potassium and chlorine removal, which may reduce operational issues during thermal utilization. These results indicate trade-offs among carbon densification, char yield, surface structure, and inorganic matter content. Rather than identifying a universally superior process, this study demonstrates that the suitability of each method depends on the desired properties and applications of MWM-derived char, providing a practical basis for appropriate process selection.

1. Introduction

Biomass, as a renewable and sustainable energy resource, has attracted considerable attention owing to the depletion of fossil fuels and the urgent need to achieve carbon neutrality. Compared with fossil fuels, biomass is generally widely available, carbon-neutral over its life cycle, and can contribute to both energy production and carbon mitigation strategies [1]. In this context, various approaches have been explored to utilize biomass and organic waste as alternative energy sources.
In South Korea, national energy policies aim to increase the share of renewable energy to 25.8% by 2034, as part of the broader carbon neutrality target for 2050 [2]. In addition to global initiatives, such as RE100, in which companies commit to sourcing 100% of their electricity from renewable sources [3], there is increasing pressure to develop sustainable and scalable energy systems based on renewable resources [4]; however, the limited and uneven availability of conventional biomass resources hinders their large-scale deployment. Consequently, attention has shifted toward the underutilization of biomass residues, particularly agricultural byproducts. Among these, mushroom waste medium (MWM) has emerged as a promising yet underutilized resource. MWM is primarily composed of lignocellulosic materials such as sawdust, rice husks, and corncobs and is generated in large quantities during mushroom cultivation. Currently, mushroom production in Korea is approximately 15,000 tons, and the amount of MWM generated is reported to be approximately five times the total mushroom production [5,6]. Although MWM is currently used mainly as compost, the increasing demand for mushrooms and the resulting growth in mushroom production have led to a continuous increase in MWM generation, thereby creating a need for more efficient utilization strategies. Notably, MWM typically has a high moisture content (>60%), which limits its direct application as a solid fuel owing to its low energy density and the associated challenges of transportation and storage [7,8].
Carbonization is a thermochemical process that converts biomass into char through thermal decomposition under oxygen-limited conditions, thereby improving fuel properties, such as heating value and fixed carbon content [9]. Among various carbonization technologies, hydrothermal carbonization (HTC) has received particular attention because this approach can process high-moisture biomass without prior drying [10]. As an alternative, microwave-assisted carbonization (MAC) offers rapid and energy-efficient heating [11], whereas conventional carbonization (CC), involving torrefaction/pyrolysis, remains widely used because of its simplicity and scalability.
Despite extensive studies on individual carbonization methods, comparative investigations have mainly focused on comparisons between two methods, such as HTC and CC or CC and MAC [12,13,14], and have generally considered a limited number of performance indicators. However, direct comparisons of CC, HTC and MAC remain limited. In particular, there is a lack of a systematic understanding of how different carbonization environments influence key process-dependent changes, including carbon densification, inorganic matter redistribution, and structural evolution, especially for high-moisture agricultural residues such as MWM. Consequently, it remains unclear which carbonization method is more suitable for the effective conversion and utilization of MWM when multiple char properties are considered simultaneously.
This study was conducted to comprehensively compare three carbonization pathways—CC, HTC and MAC—using MWM as a representative high-moisture biomass feedstock. This study focused on physicochemical characterization and the evaluation of process-dependent transformation characteristics, as well as their implications for fuel-oriented char production. Rather than identifying a universally superior carbonization method, the relative suitability, advantages, and limitations of each approach were evaluated according to the properties of the resulting char. By integrating analyses of chemical composition, combustion behavior, inorganic matter distribution, and surface structure, we sought to identify process-dependent trade-offs and inform the selection of an appropriate carbonization strategy for the sustainable utilization of MWM.

2. Materials and Methods

2.1. Material

We used MWM generated from king oyster mushrooms cultivated at a farm located in Hadong-gun, Gyeongsangnam-do, Republic of Korea. The raw MWM had a high moisture content (64.41%), carbon content of 44.45%, and fixed carbon content of 20.77% (Table 1). The oxygen, nitrogen, and sulfur contents were 46.68%, 2.88%, and 0.22%, respectively. The volatile matter content was relatively high, at 71.6%, whereas the ash content was low at 7.63%.

2.2. Methods

2.2.1. Carbonization Methods

Three carbonization approaches were employed to produce char from MWM: CC, HTC, and MAC. In each approach, carbonization was conducted across a range of reaction temperatures, with a constant residence time of 30 min applied after the target temperature had been reached. The char samples were collected at each temperature condition for subsequent analyses. The temperature ranges for each method were selected based on the intrinsic operational characteristics and technical limitations of each reactor system. Therefore, comparisons among the three methods were primarily conducted within their respective practical operating windows. In addition, comparisons at overlapping temperatures (e.g., 250 °C) were performed to provide a consistent basis for cross-process evaluation.
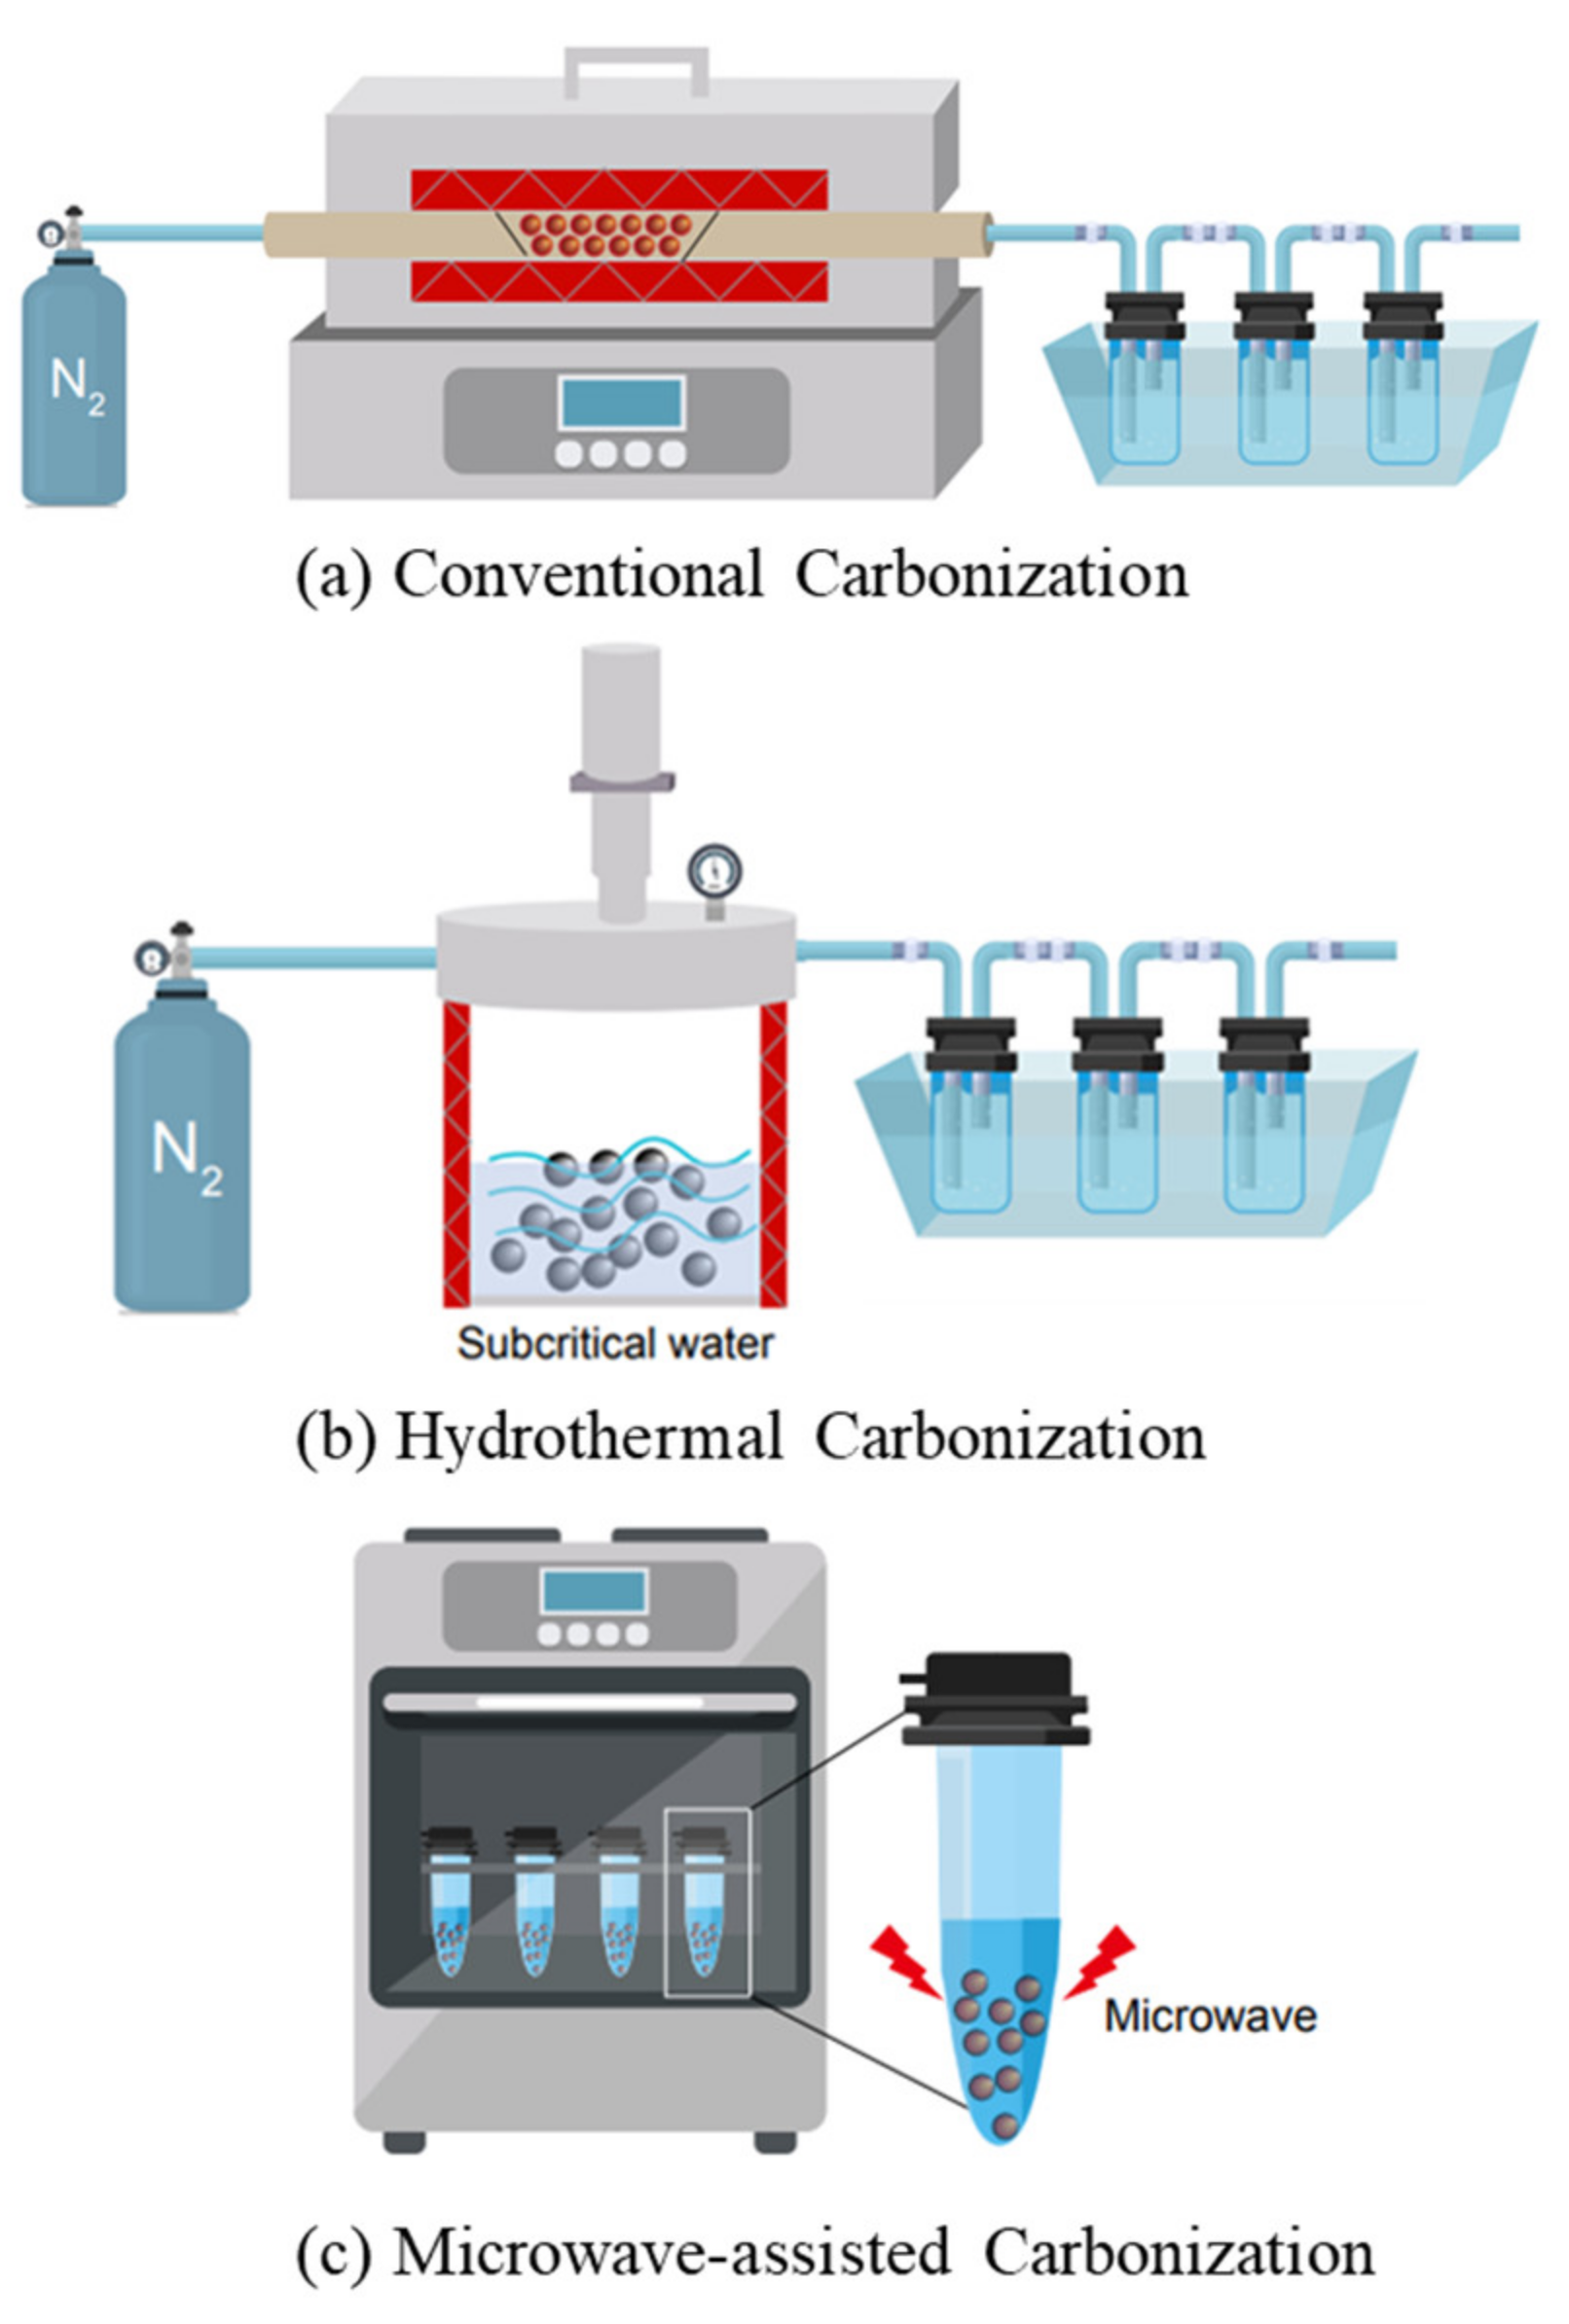
Figure 1a illustrates the configuration of the CC reactor, using a tube furnace (DTF-803, Lab House, Yongin, Gyeonggi-do, Republic of Korea) capable of operating at up to 1200 °C with a rated power of 1.9 kW. CC experiments were conducted at temperatures ranging from 250 to 450 °C. Before the reaction, the reactor was purged with nitrogen gas at a flow rate of 200 mL/min to establish non-oxidant conditions, followed by a continuous flow of 100 mL/min during the reaction.
HTC experiments were conducted using an R-201 reactor (ChemRe Systems, Anyang, Gyeonggi-do, Republic of Korea) with a capacity of 2 L, designed for a maximum operating temperature of 350 °C and pressure of 35 MPa. The reaction temperature ranged from 180 to 300 °C, with a residence time of 30 min. A mixture of MWM and distilled water (1:1) was then added to the reactor. Nitrogen gas was introduced before the reaction to establish non-oxidant conditions. After completion of the reaction and cooling to room temperature, the solid hydrochar was separated from the liquid phase by qualitative filter paper (185 mm, Hyundai Micro, Seoul, Republic of Korea) and subsequently dried.
For the MAC approach, a Multiwave 5000 microwave reactor (Anton Paar, Graz, Austria) was used, as shown in Figure 1c. The system can operate at temperatures of up to 280 °C and pressures of up to 7.5 MPa. MAC experiments were conducted over a temperature range of 180–250 °C under subcritical water conditions using an internal pressure vessel, with MWM and distilled water mixed at a mass ratio 1:1, and a reaction time of 30 min. Following the reaction, the solid hydrochar was separated from the aqueous phase using the same procedure as for the HTC process and dried before analysis.
In this study, “char” is used as a general term for all solid carbonized products. The CC-derived product is referred to as biochar, whereas the HTC- and MAC-derived products produced under subcritical water conditions are referred to as hydrochars.
To minimize bias in the comparison, key performance indicators were evaluated both within each process and across processes at representative temperatures.
All carbonization experiments were independently performed in triplicate under identical operating conditions.

2.2.2. Char Analysis

Several analyses were conducted to identify the characteristics of the char generated by each carbonization reaction. The C, H, N, and S compositions were analyzed using ultimate analysis (FLASH 2000 CHNS/O Analyzer, Thermo Fisher Scientific, Waltham, MA, USA) to identify the basic characteristics of the char, and the oxygen content was calculated by difference on a dry basis. Proximate analysis was used to determine the char volatile matter and ash contents, and the fixed carbon content was calculated by difference. Char higher heating value (HHV) was analyzed using a calorimeter (1341 Plain Jacket Bomb Calorimeter, Parr Instrument Company, Moline, IL, USA).
Based on the experimental results obtained for each reactor, product yield, energy density, and energy yield were calculated using Equations (1)–(3), and the results were compared [15].
Product   yield = M a s s c h a r M a s s r a w × 100
Energy   density = H H V c h a r , d b H H V r a w , d b
Energy   yield = Product   yield × Energy   density
To characterize the chemical and physical properties of the char, Fourier-transform infrared spectroscopy (FT-IR), X-ray fluorescence (XRF), Brunauer–Emmett–Teller (BET), and scanning electron microscopy (SEM) analyses were performed. FT-IR analysis (Nicolet 380 FT-IR Spectrometer, Thermo Fisher Scientific, Waltham, MA, USA) was conducted to identify changes in the chemical structure of the char, while XRF analysis (ZSX Primus IV, X-ray Fluorescence Spectrometer, Rigaku Corporation, Tokyo, Japan) was conducted to determine the composition of inorganic matter. BET (3Flex Surface Characterization Analyzer, Micromeritics Instrument Corporation, Norcross, GA, USA) and SEM (S-4300 Field-Emission Scanning Electron Microscope (FE-SEM), Hitachi High-Technologies Corporation, Tokyo, Japan) analyses were conducted to examine changes in the physical structure of the char.
To analyze the char combustion characteristics, thermogravimetric analysis (TGA) was conducted under combustion (air) conditions using a TGA-Auto device (Q500 Thermogravimetric Analyzer, TA Instruments, New Castle, DE, USA). Following analysis at heating rates of 5, 10, and 20 °C/min, the results were used to calculate combustion characteristics [16]. As for TGA/DTG parameters, ignition, maximum and burnout temperatures were calculated; the ignition temperature was calculated using the intersection of the tangent to the TG curve with a vertical line drawn from the peak. The maximum temperature was defined as the temperature corresponding to the maximum mass-loss rate in the DTG curve. The burnout temperature was calculated using Equation (5) to calculate the conversion rate, and the point at which the conversion reached 99% was determined as the burnout point [16].

2.2.3. Kinetic Analysis

A thermogravimetric analyzer (Q500 Thermogravimetric Analyzer, TA Instruments, New Castle, DE, USA) was used for kinetic analysis. The samples were heated in a nitrogen atmosphere up to 900 °C at heating rates of 5, 10, and 20 °C/min. The results of this analysis were used to calculate the pyrolysis activation energies. The kinetics of pyrolysis under non-isothermal conditions are expressed by Equation (4) [17]:
d α d t = k ( T ) f ( α ) = A e x p ( E R T ) f ( α )
where α is the degree of conversion and t , A, E, R, and T are the reaction time, pre-exponential factor, activation energy, gas constant, and absolute temperature (K), respectively. The degree of conversion, α, was calculated using the weight loss data through TGA (Equation (5)):
α = m 0 m m 0 m f
where m 0 is the original mass of the sample, and m and m f are the mass at a specific time point and the mass of the final and remaining solids, respectively.
The Kissinger and Ozawa methods were used to estimate the activation energy. The Kissinger method uses the changes in the peak point temperatures of the DTG curves with varying heating rates. Equation (6) represents the first step in calculating the activation energy.
β T m 2 = ( A R E ) f ( α m ) e x p ( E R T )
Taking the natural logarithm on both sides of the equation to obtain Equation (7), the activation energy can be derived from the slope obtained by plotting l n ( β / T 2 ) versus 1/T.
ln ( β T m 2 ) = ( E R ) 1 T m + [ ln ( A R E ) l n ( α m ) ]
In the Ozawa method, the values of A, α, n, and E were assumed to be temperature-independent. From the initial pyrolysis kinetics equation, a linear approximation of the logarithmic temperature integral was used to derive Equation (8). Using the slope obtained by plotting logβ versus 1/T with various heating rates, the activation energy for the same conversion rate was derived.
l o g β = 0.4567 E R T + log ( A E R ) log ( α ) 2.315

3. Results and Discussion

3.1. Char Basic Characteristics

As determined by ultimate analysis, the carbon content increased with increasing carbonization temperature in all three reactors (Table 2). This trend is primarily attributed to progressive dehydration and deoxygenation reactions, during which oxygen- and hydrogen-rich functional groups (e.g., hydroxyl, carboxyl, and carbonyl groups) are thermally decomposed, resulting in an increased relative carbon concentration in the solid phase [18,19].
For HTC, the carbon content reached its highest value of 68.29% at 300 °C. This pronounced carbon enrichment at comparatively low temperatures can be explained by the unique physicochemical properties of subcritical water. Under hydrothermal conditions, the increased ionic product and reduced dielectric constant of water enhance the acid/base-catalyzed reactions, thereby promoting dehydration, decarboxylation, and polymerization pathways [20]. In addition, the confined reaction environment facilitates the recombination of reactive intermediates, further contributing to carbon densification. These dissolved organic intermediates may also undergo polymerization and recondensation to form secondary char, which is commonly reported as micrometer-sized spherical carbon particles under hydrothermal conditions [21]. These water-mediated processes enable efficient removal of oxygen-containing functional groups even below 300 °C, leading to accelerated carbon densification compared with dry carbonization processes. In contrast, CC required substantially higher reaction temperatures to achieve comparable carbon contents, with the maximum value (71.62%) at 450 °C. This suggests that overly severe thermal conditions may reduce carbon retention in CC-derived biochar owing to enhanced fragmentation of carbon structures [22].
MAC hydrochar exhibited the lowest maximum carbon content among the three methods, reaching 50.47% at 250 °C. This relatively limited carbon enrichment can be attributed to the restricted temperature range and nature of microwave heating. Although microwave irradiation facilitates rapid volumetric heating, the relatively low temperatures achievable under subcritical conditions limit extensive deoxygenation and structural rearrangement, resulting in moderate carbon accumulation [23].
At an overlapping temperature of 250 °C, HTC hydrochar exhibited a substantially higher carbon content (60.15%) than CC (51.03%) and MAC (50.47%). This indicates that carbon enrichment is governed by temperature and by process-specific reaction pathways.
In particular, the presence of liquid water during HTC may promote hydrolysis, dehydration, and recondensation reactions, contributing to the enhanced carbon enrichment of high-moisture biomass.
For all three carbonization methods, the fixed carbon content increased with temperature, reflecting the progressive removal of volatile matter. At the same temperature (250 °C), HTC hydrochar exhibited approximately 10% higher fixed carbon content than CC and MAC, further supporting its enhanced carbonization efficiency under hydrothermal conditions.
Carbonization significantly increased the HHV of all chars relative to raw MWM, primarily because of the increased carbon and fixed carbon content. At 250 °C, HTC hydrochar exhibited the highest HHV (20.93 MJ/kg), followed by MAC and CC chars; however, at higher temperatures, the CC biochar showed comparable or higher HHVs, indicating that the relative performance depends on the applied temperature range and thermal severity.
The char yield decreased with increasing temperature in all reactors, reflecting enhanced devolatilization (Figure S1). At 250 °C, CC produced the highest biochar yield, whereas HTC yielded the lowest, confirming a clear trade-off between mass yield and fuel quality. This trade-off suggests that process performance should be evaluated using integrated metrics rather than single indicators such as carbon content or HHV. These observations indicate that carbonization is governed by competing devolatilization, condensation, and structural rearrangement pathways, the relative contributions of which depend on the reaction environment.
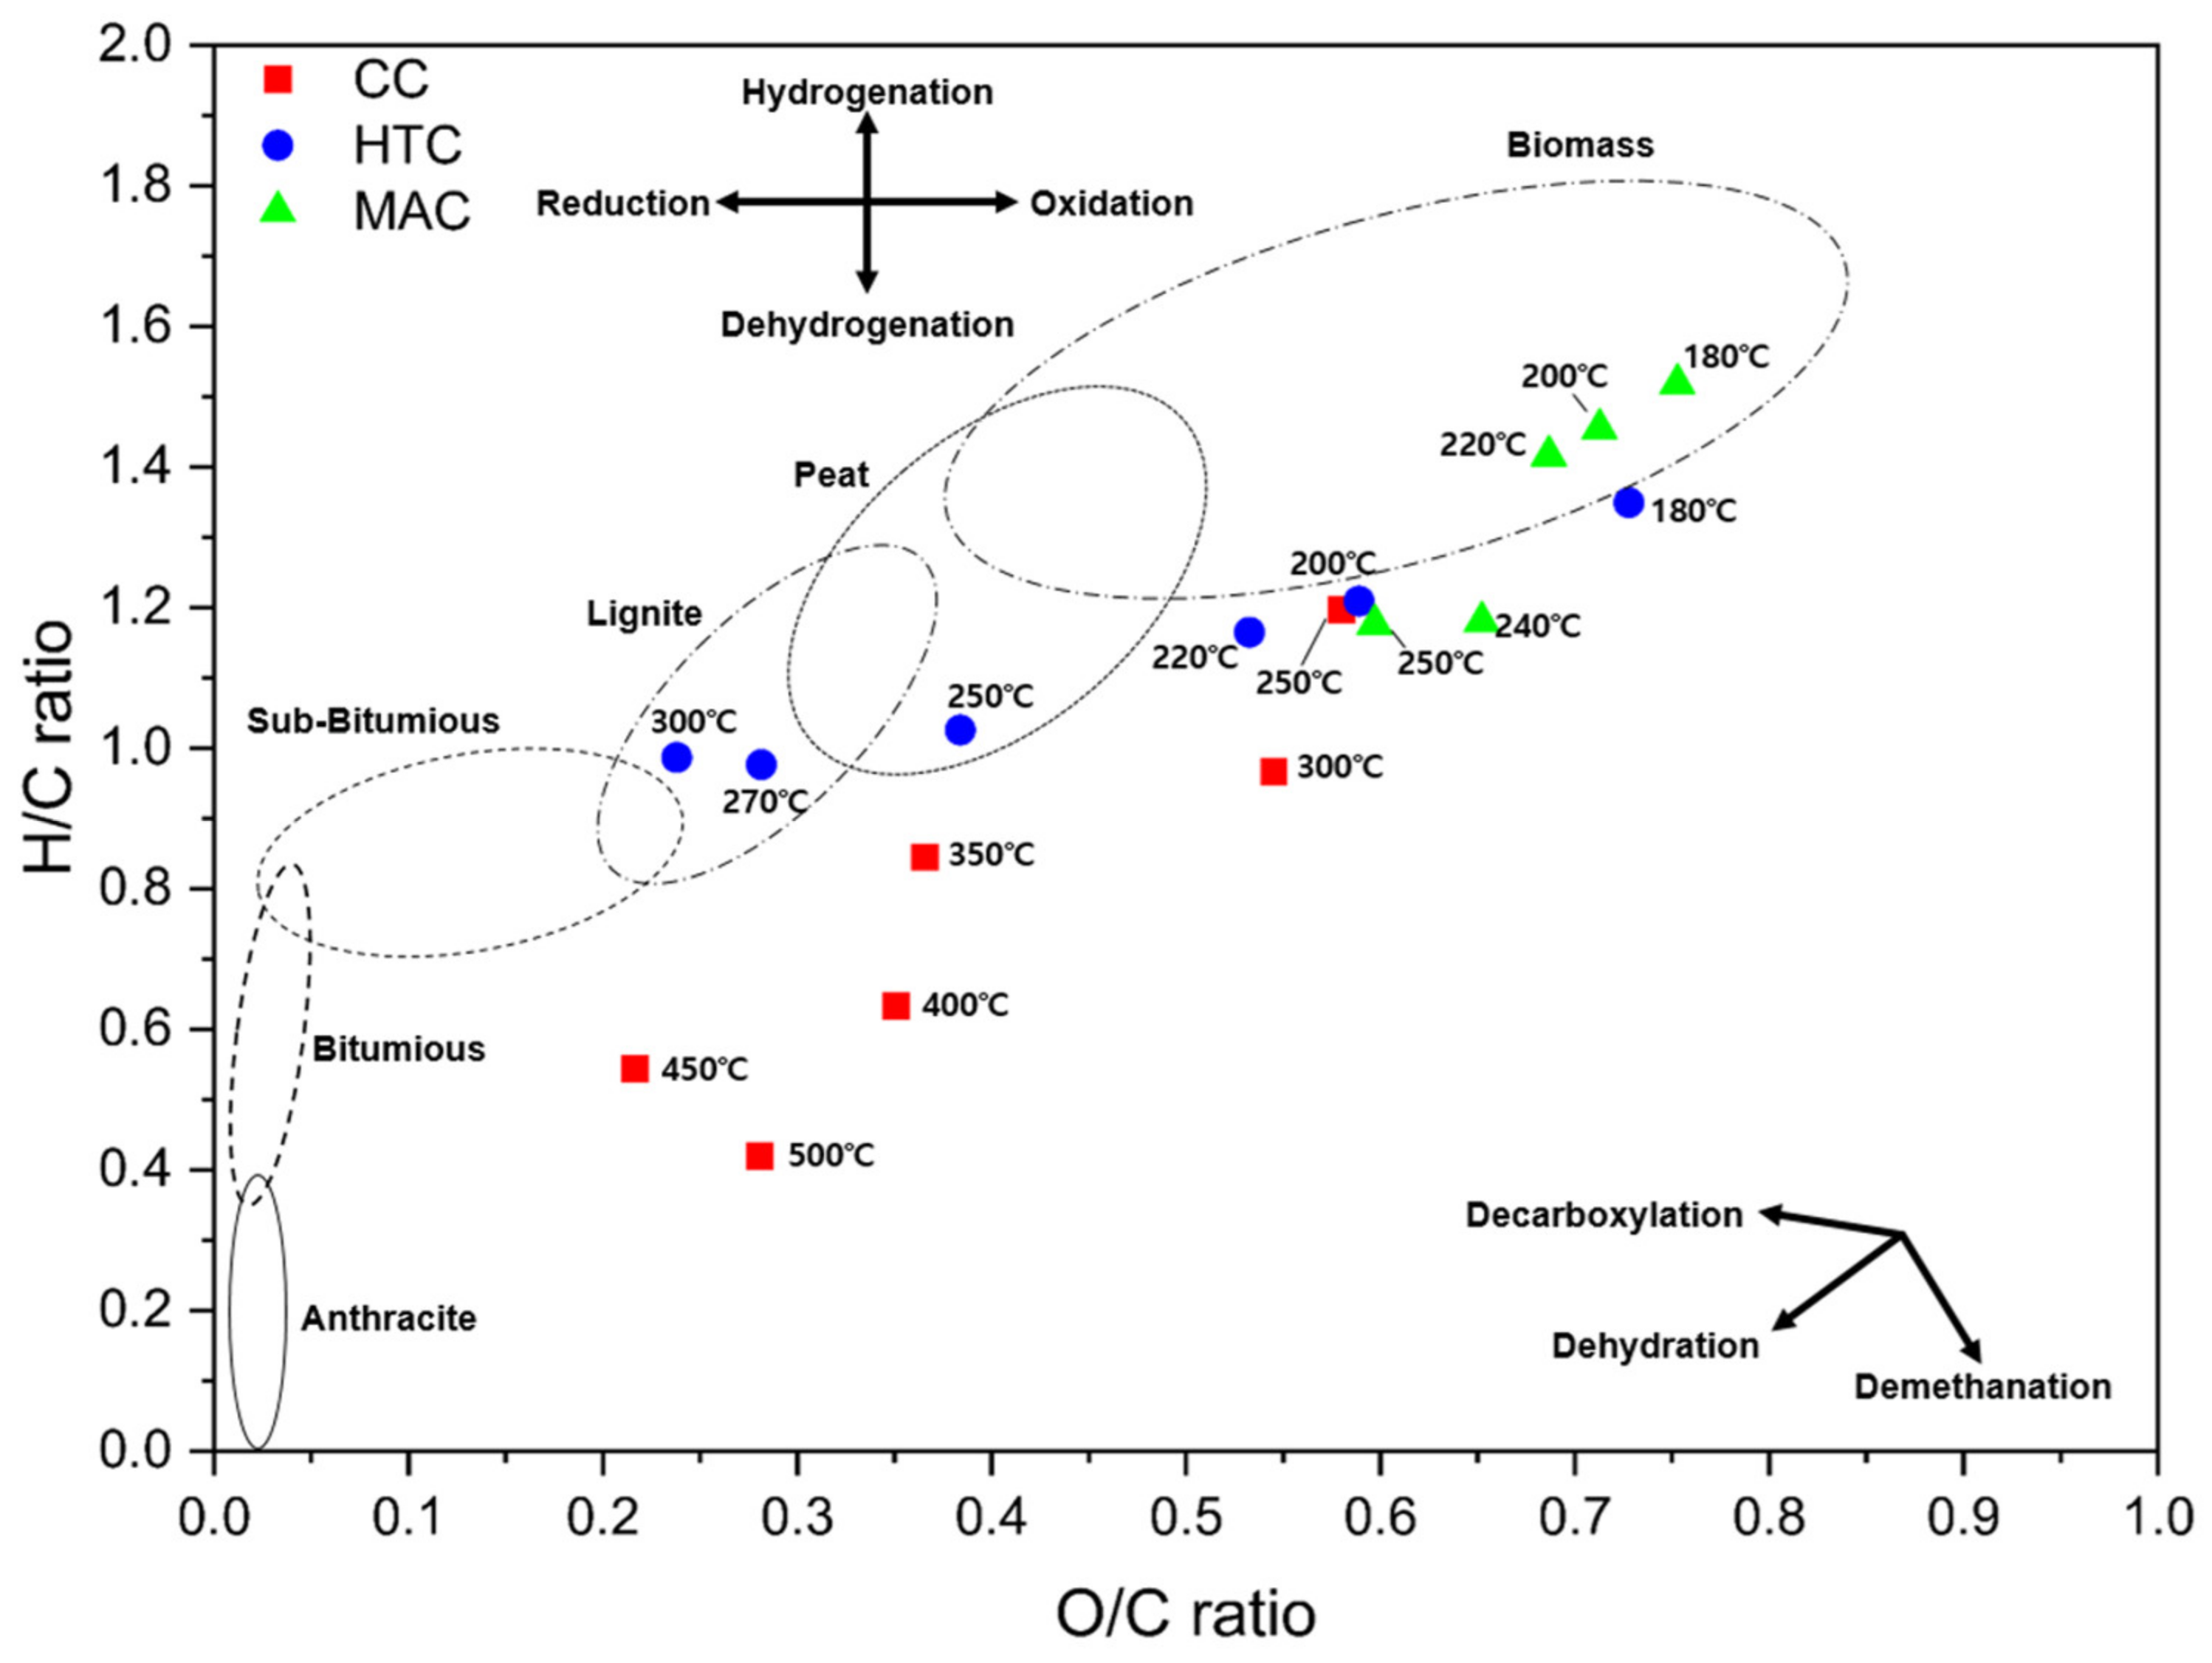
A Van Krevelen diagram was produced (Figure 2), which illustrates the distinct upgrading pathways of each method. CC biochars tended to exceed the typical coalification range at high temperatures, whereas MAC hydrochars remained closer to the biomass domain. In contrast, the HTC hydrochars progressively approached coal-like characteristics with increasing temperature, transitioning from peat-like to lignite-like regions. These results indicate that HTC is particularly effective in enhancing fuel properties under mild conditions, whereas CC may be more suitable for applications in which high-temperature processing and extensive structural transformations are feasible. Therefore, no single carbonization pathway can be considered universally optimal, and the process selection should be based on the targeted application and feedstock characteristics.

3.2. Char Chemical Structure Changes

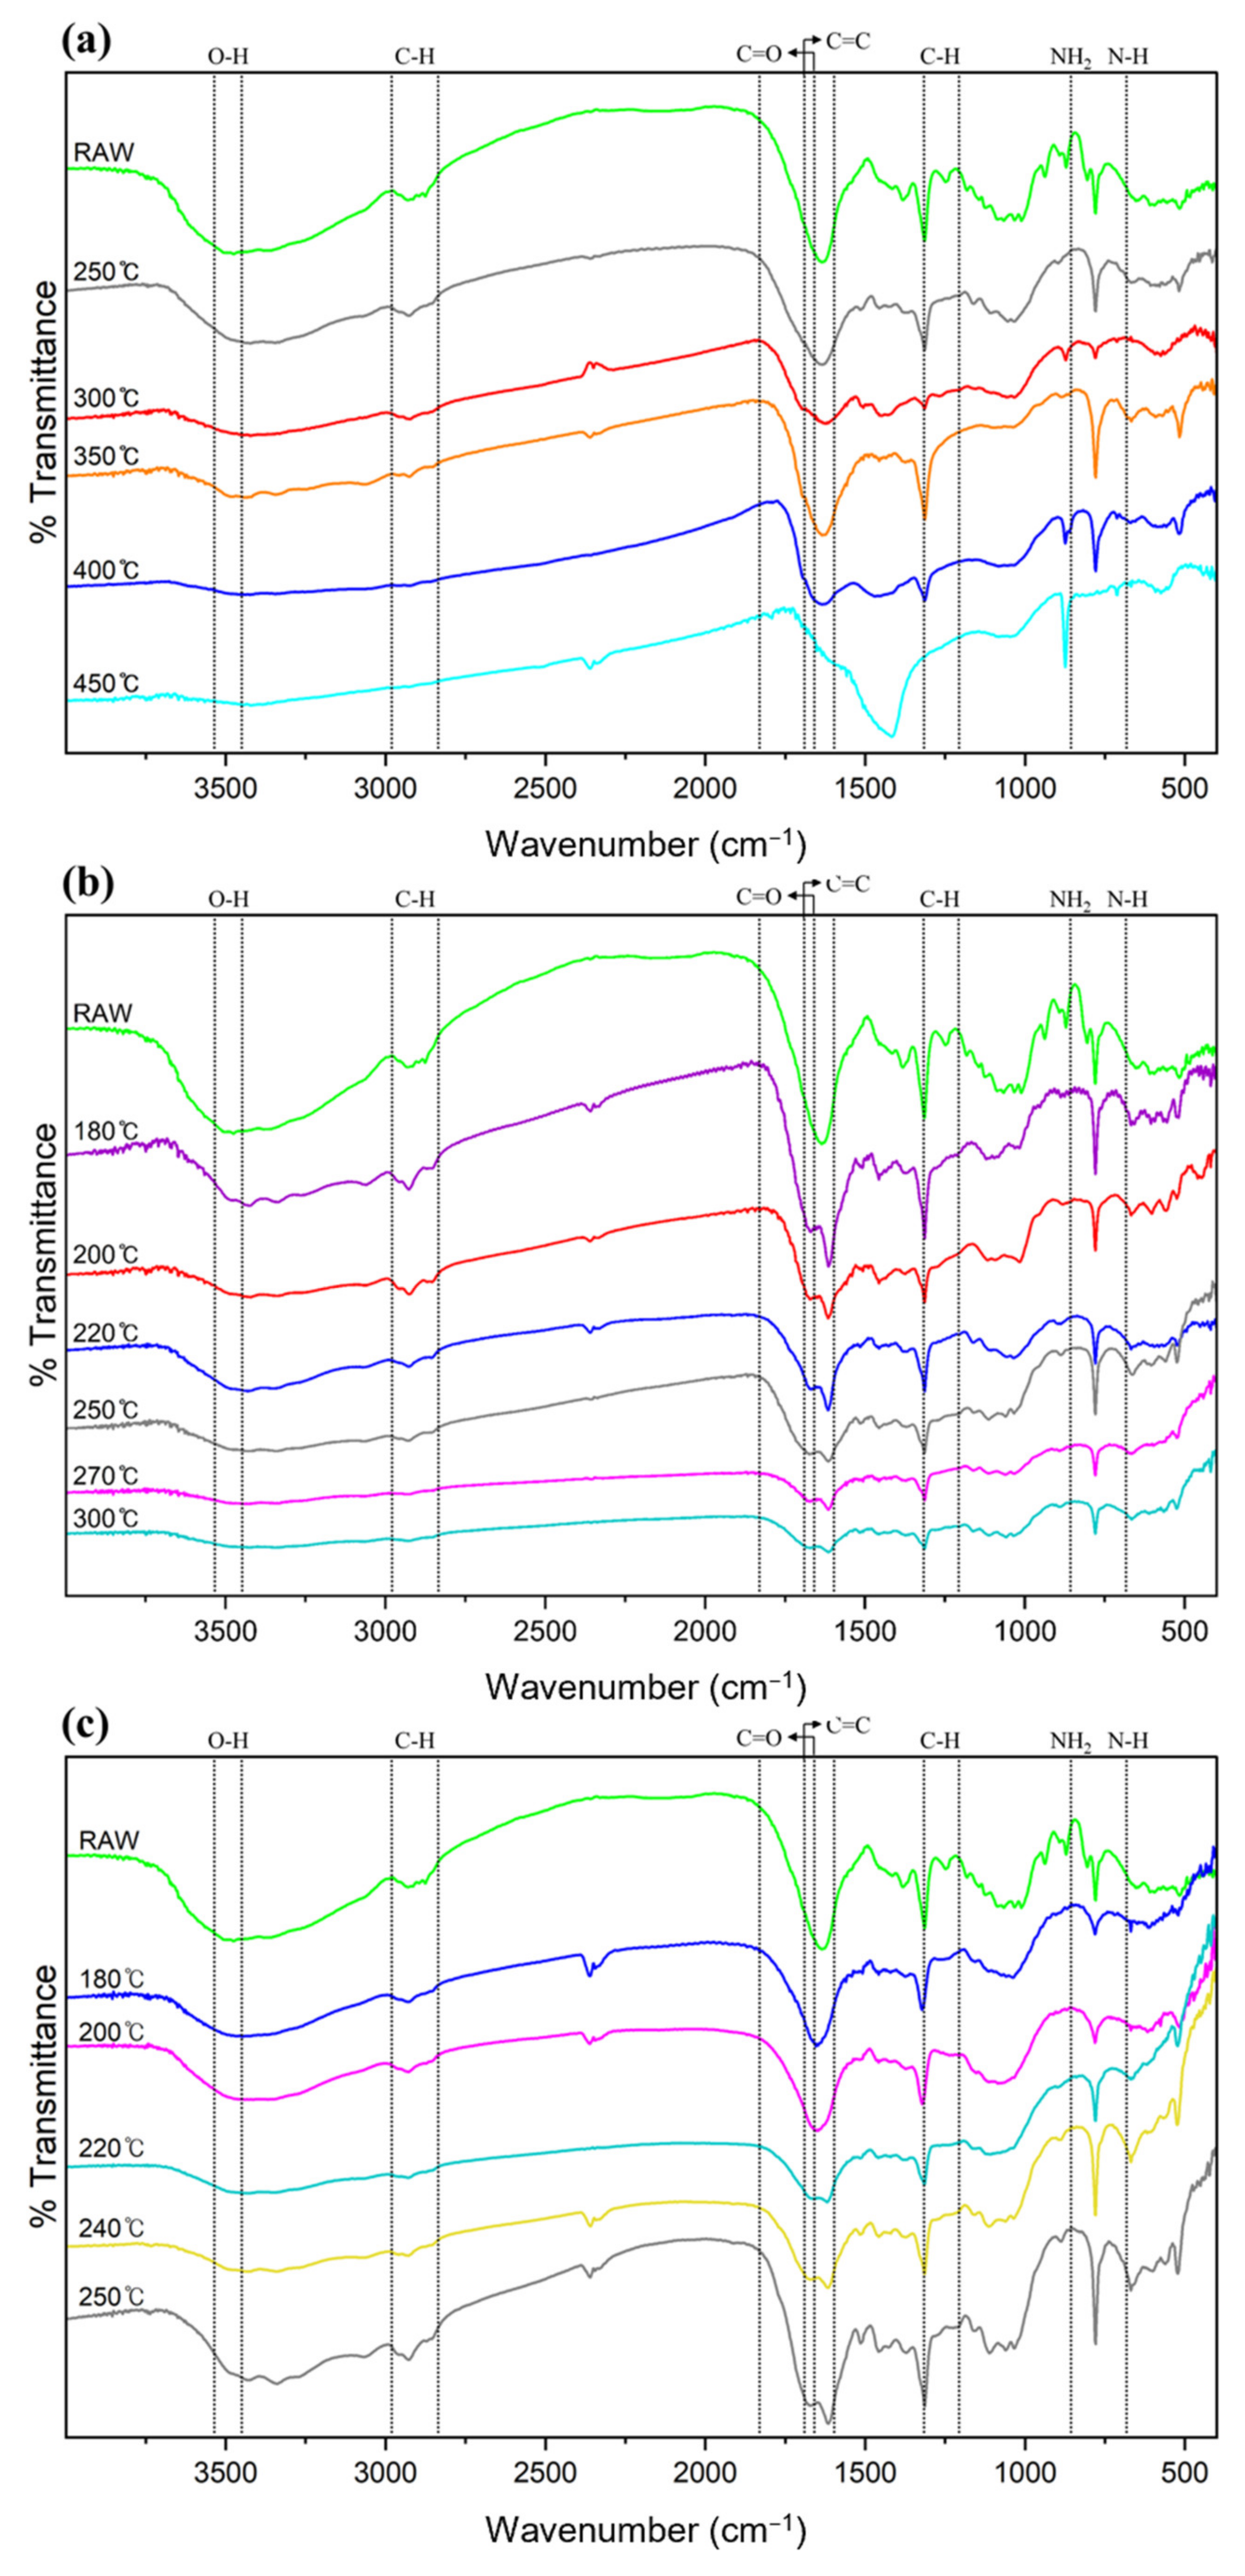
The intensity of the broad absorption band in the 3400–3200 cm−1 region gradually decreased with increasing carbonization temperature for all carbonization methods (Figure 3). This band is commonly attributed to O–H stretching vibrations, and its progressive attenuation reflects the elimination of hydroxyl groups through dehydration reactions. The reduction in hydroxyl functionality is a key indicator of biomass deoxygenation and contributes to the transformation of hydrophilic feedstock into a more hydrophobic and carbon-rich solid.
The absorption peak observed near 2800 cm−1 corresponded to the stretching vibration of methylene (–CH2–) groups [24]. The gradual weakening of this band with increasing temperature indicated the thermal cleavage of aliphatic side chains, suggesting a transition from aliphatic-rich biomass structures to more condensed and aromatic carbon frameworks. This structural evolution is consistent with the increase in carbon content and fixed carbon described in Section 3.1.
Furthermore, the progressive decline of peaks in the ranges of 1800–1650, 1680–1600, and 1035–1020 cm−1 can be assigned to the decomposition of carbonyl (C=O), alkenyl (C=C), and ether (C–O) functional groups, respectively [25,26]. The simultaneous reduction in absorption bands in the 1300–1200 cm−1 region further indicates extensive cleavage of C–O bonds [27]. These results collectively suggest that carbonization was associated with deoxygenation and structural condensation, which may have contributed to increased aromaticity and carbon density in the char matrix.
Distinct differences among carbonization methods were observed in the nitrogen-related functional group region (700–800 cm−1). In CC and HTC chars, the peaks associated with NH2 and N–H vibrations decreased with increasing temperature, indicating thermal decomposition or transformation of nitrogen-containing functional groups. In contrast, the MAC hydrochars showed an increase in peak intensity in this region. This difference can be attributed to the lower reaction temperature and shorter effective residence time in MAC, which may limit the extent of nitrogen decomposition and favor the retention of nitrogen functionalities [28,29]. In CC and HTC chars, the decrease in nitrogen-related peak intensity with increasing temperature may reflect greater thermal alteration of nitrogen-containing functional groups under more severe reaction conditions.
Overall, the FT-IR results demonstrated that carbonization induced progressive dehydration, deoxygenation, and structural condensation of MWM, regardless of reactor type; however, the extent and pathways of these transformations varied depending on the reaction environment. In particular, HTC facilitated the effective removal of oxygen-containing functional groups at relatively low temperatures, likely owing to water-mediated reactions under subcritical conditions. These transformations reduced the number of hydrophilic functional groups and contributed to improved fuel properties, although the degree of structural evolution differed among carbonization methods.

3.3. Combustion Characteristics of Char

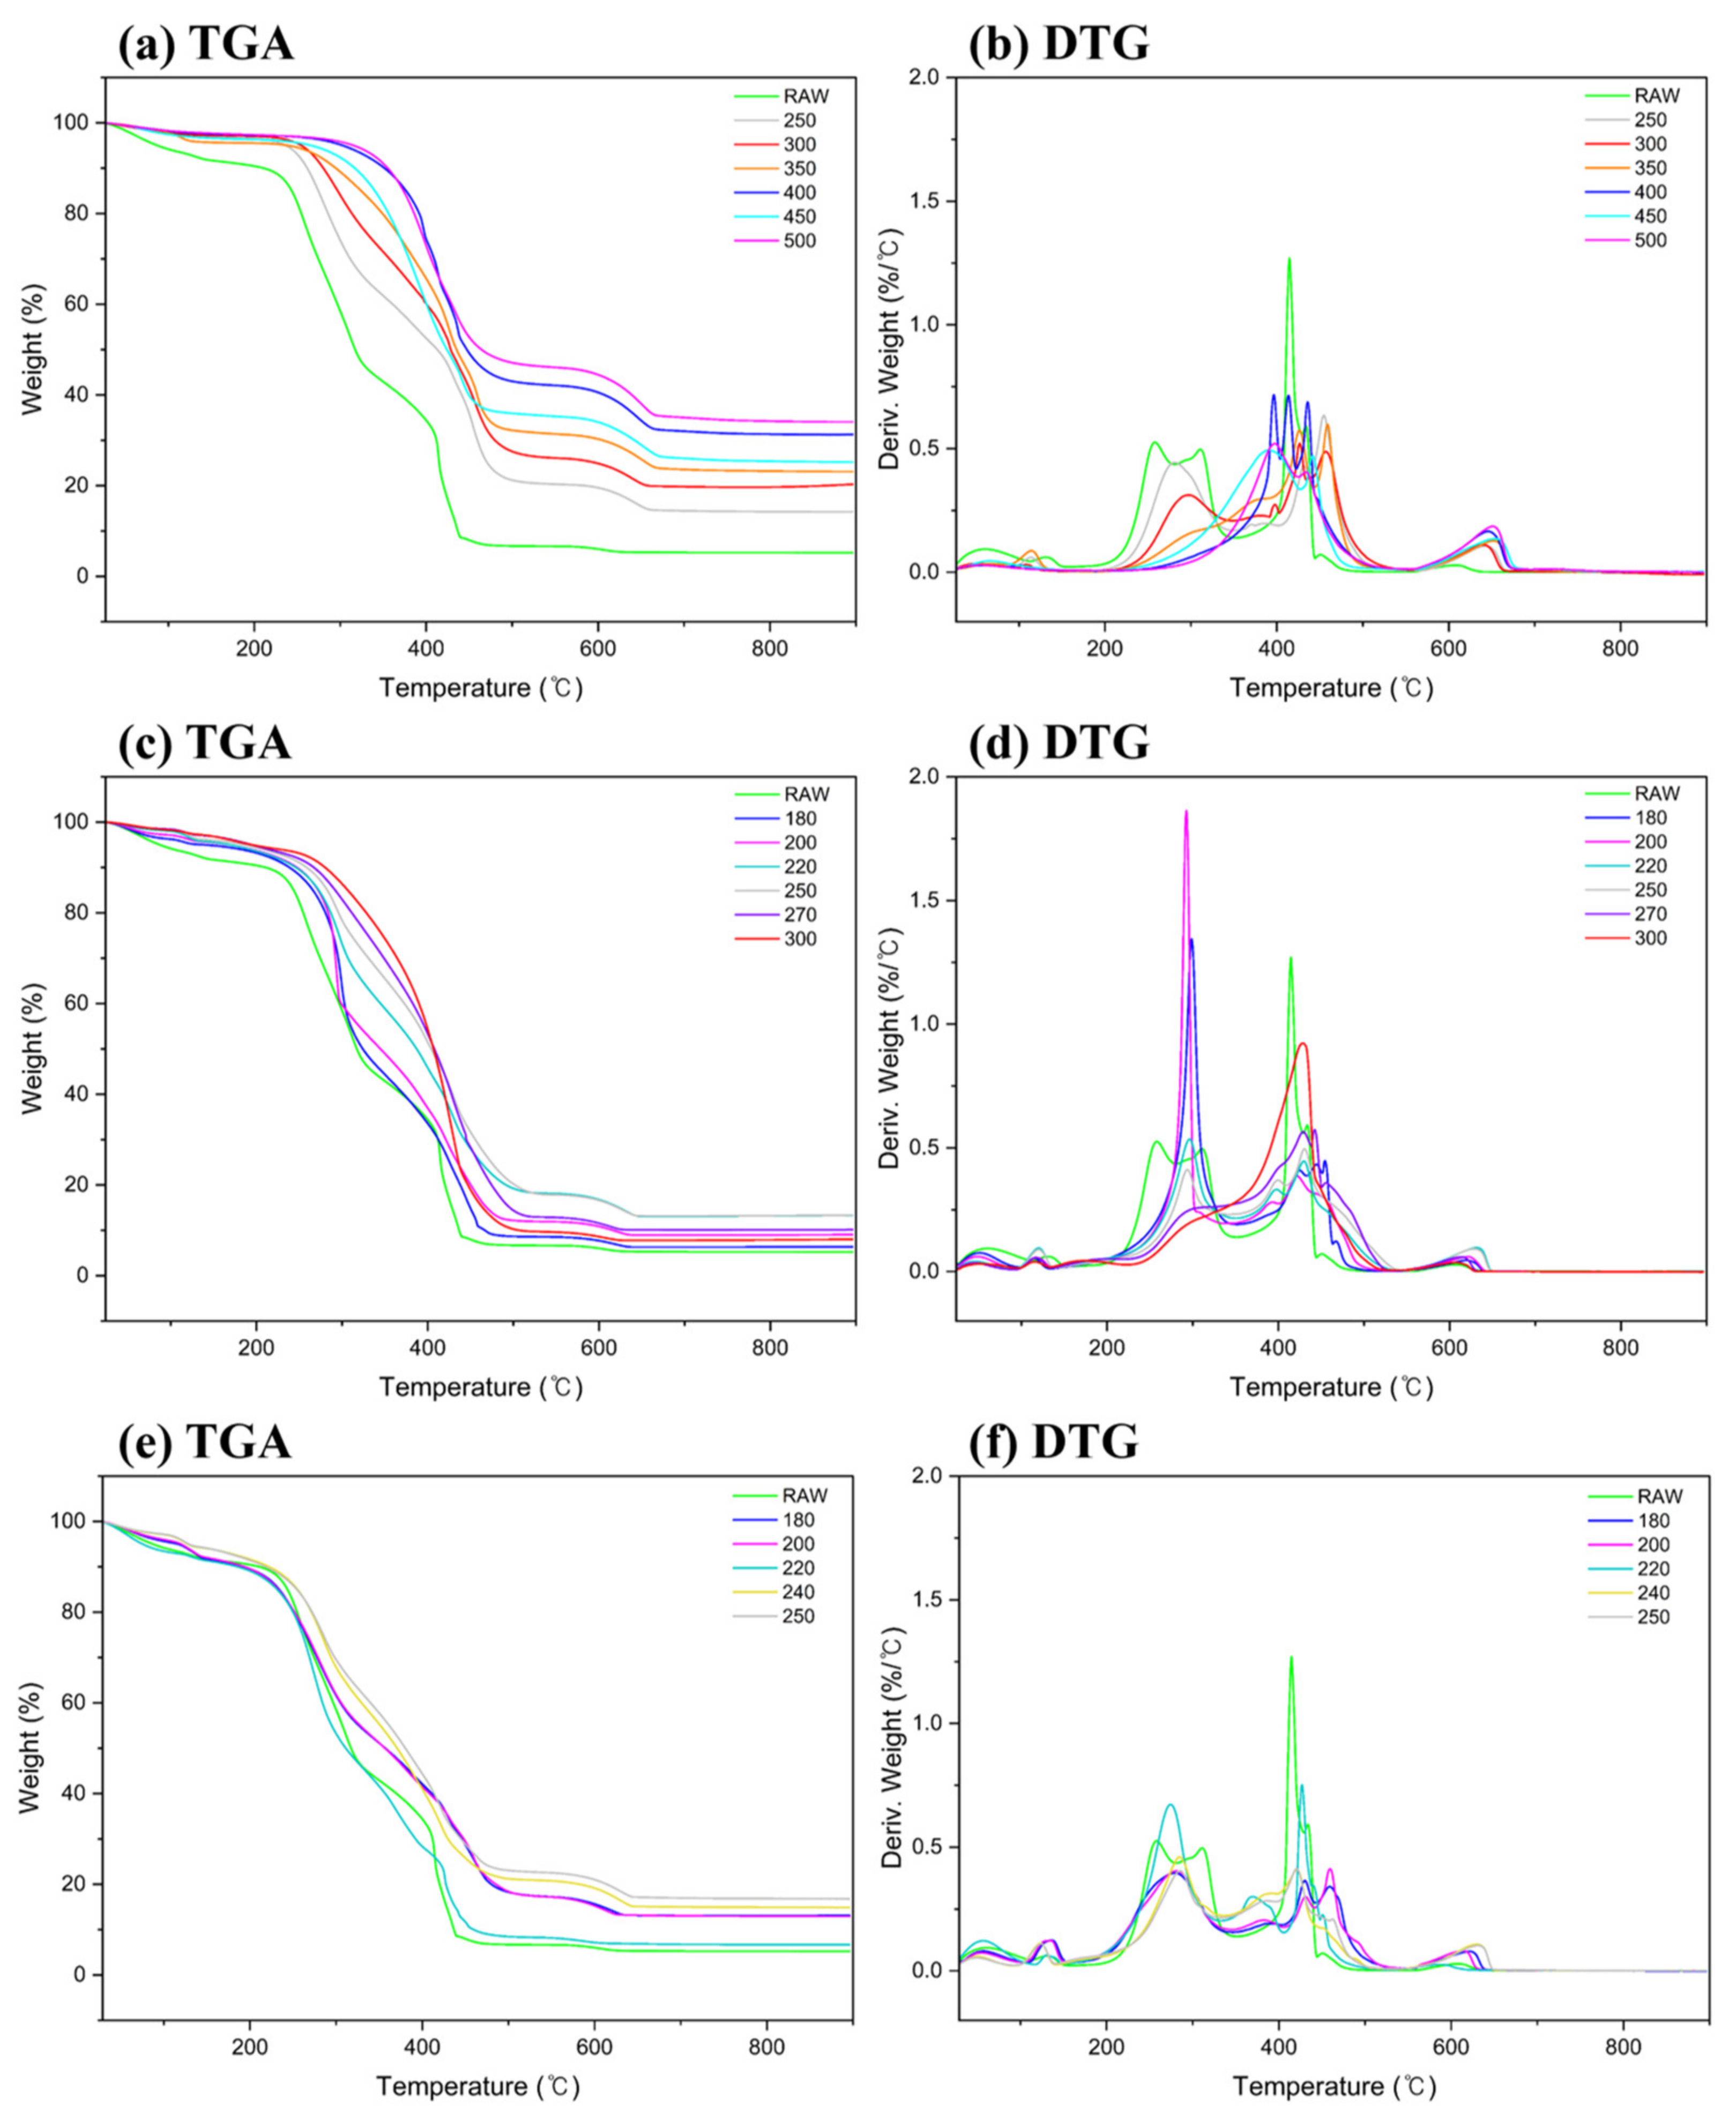
TGA revealed distinct combustion behaviors among the chars produced via different carbonization pathways (Figure 4). In the initial stage up to approximately 100 °C, mass loss was primarily associated with moisture evaporation [30]. The extent of this region decreased markedly with increasing carbonization temperature for all chars, indicating the progressive removal of physically bound and chemically associated water. In particular, HTC and MAC hydrochars exhibited a more pronounced reduction in this low-temperature region than CC biochar, reflecting enhanced dehydration efficiency under hydrothermal and microwave-assisted conditions. This observation is consistent with the FT-IR results discussed in Section 3.2, which suggested a reduction in hydroxyl-related functional groups. The second stage of mass loss, corresponding primarily to the release and combustion of volatile matter, also diminished as carbonization temperature increased. This trend indicated the progressive depletion of volatile components during carbonization, leading to the formation of a more carbon-dense solid residue. Consequently, the reduction in volatile matter was accompanied by an increase in fixed carbon content in the subsequent combustion stage. The highest fixed carbon fraction was observed in CC biochar produced at 450 °C, consistent with the results of the proximate analysis. Among the three carbonization methods, MAC hydrochars exhibited the least variation in the TGA curves, likely because of their relatively narrow operating temperature range and limited thermal severity, which constrained extensive structural transformation.
Characteristic combustion parameters, including the maximum combustion, ignition, and burnout temperatures, were derived from the TGA profiles (Table 3). The maximum combustion temperatures for HTC, CC, and MAC chars peaked at reaction temperatures of 270, 350, and 220 °C, respectively. Under identical carbonization conditions (250 °C), CC biochar exhibited the highest maximum combustion temperature, suggesting enhanced thermal stability and a more condensed carbon structure. Ignition temperatures showed clear reactor-dependent trends: CC biochars generally ignited at higher temperatures, reflecting their lower volatile content and more stable carbon matrix, whereas MAC hydrochars exhibited the lowest ignition temperatures (224.28 °C), observed at 250 °C, indicative of higher volatile retention and easier ignition. HTC hydrochars displayed intermediate ignition behavior, balancing fuel reactivity and stability. The burnout temperatures further highlight the differences in combustion completeness and char stability. The highest burnout temperature (707.84 °C) was observed for CC biochar at 450 °C, indicating strong resistance to complete oxidation due to extensive carbon condensation. In contrast, under the same carbonization temperature (250 °C), HTC hydrochar exhibited the lowest burnout temperature (630.52 °C), suggesting more efficient combustion and lower residual char stability. This behavior can be attributed to the combined effects of reduced inorganic matter content and optimized carbon structure in HTC hydrochars, which facilitate more uniform oxidation during combustion [20].
The activation energy analysis further elucidated the combustion kinetics of the chars. Owing to the multistep nature of biomass-derived char combustion, the activation energy values exhibited irregular trends across the reaction conditions. Using the Kissinger method, the highest activation energies were observed at the lowest carbonization temperatures for all reactors—250 °C for CC and 180 °C for both HTC and MAC. Notably, MAC180 exhibited the highest activation energy (158.28 kJ/mol), indicating a kinetically hindered combustion process likely associated with the preservation of volatile components and nitrogen-containing functional groups. Similar trends were observed using the Ozawa method, with MAC180 showing exceptionally high activation energy (243.33 kJ/mol), whereas HTC and CC exhibited comparatively lower activation energies. When activation energies were compared under identical carbonization temperatures, CC biochars consistently exhibited higher activation energies than HTC hydrochars, while HTC hydrochars showed the lowest values (29.91 kJ/mol by Kissinger and 41.81 kJ/mol by Ozawa at 250 °C). These results suggest that HTC produces hydrochars with more reactive combustion behavior, likely owing to effective deoxygenation, reduced inorganic inhibition, and a favorable carbon structure.
Collectively, the TGA-derived parameters indicate that HTC hydrochars exhibited relatively favorable ignition and combustion characteristics, supporting their potential application as solid fuels derived from high-moisture agricultural residues.

3.4. Inorganic Matter Composition of Char

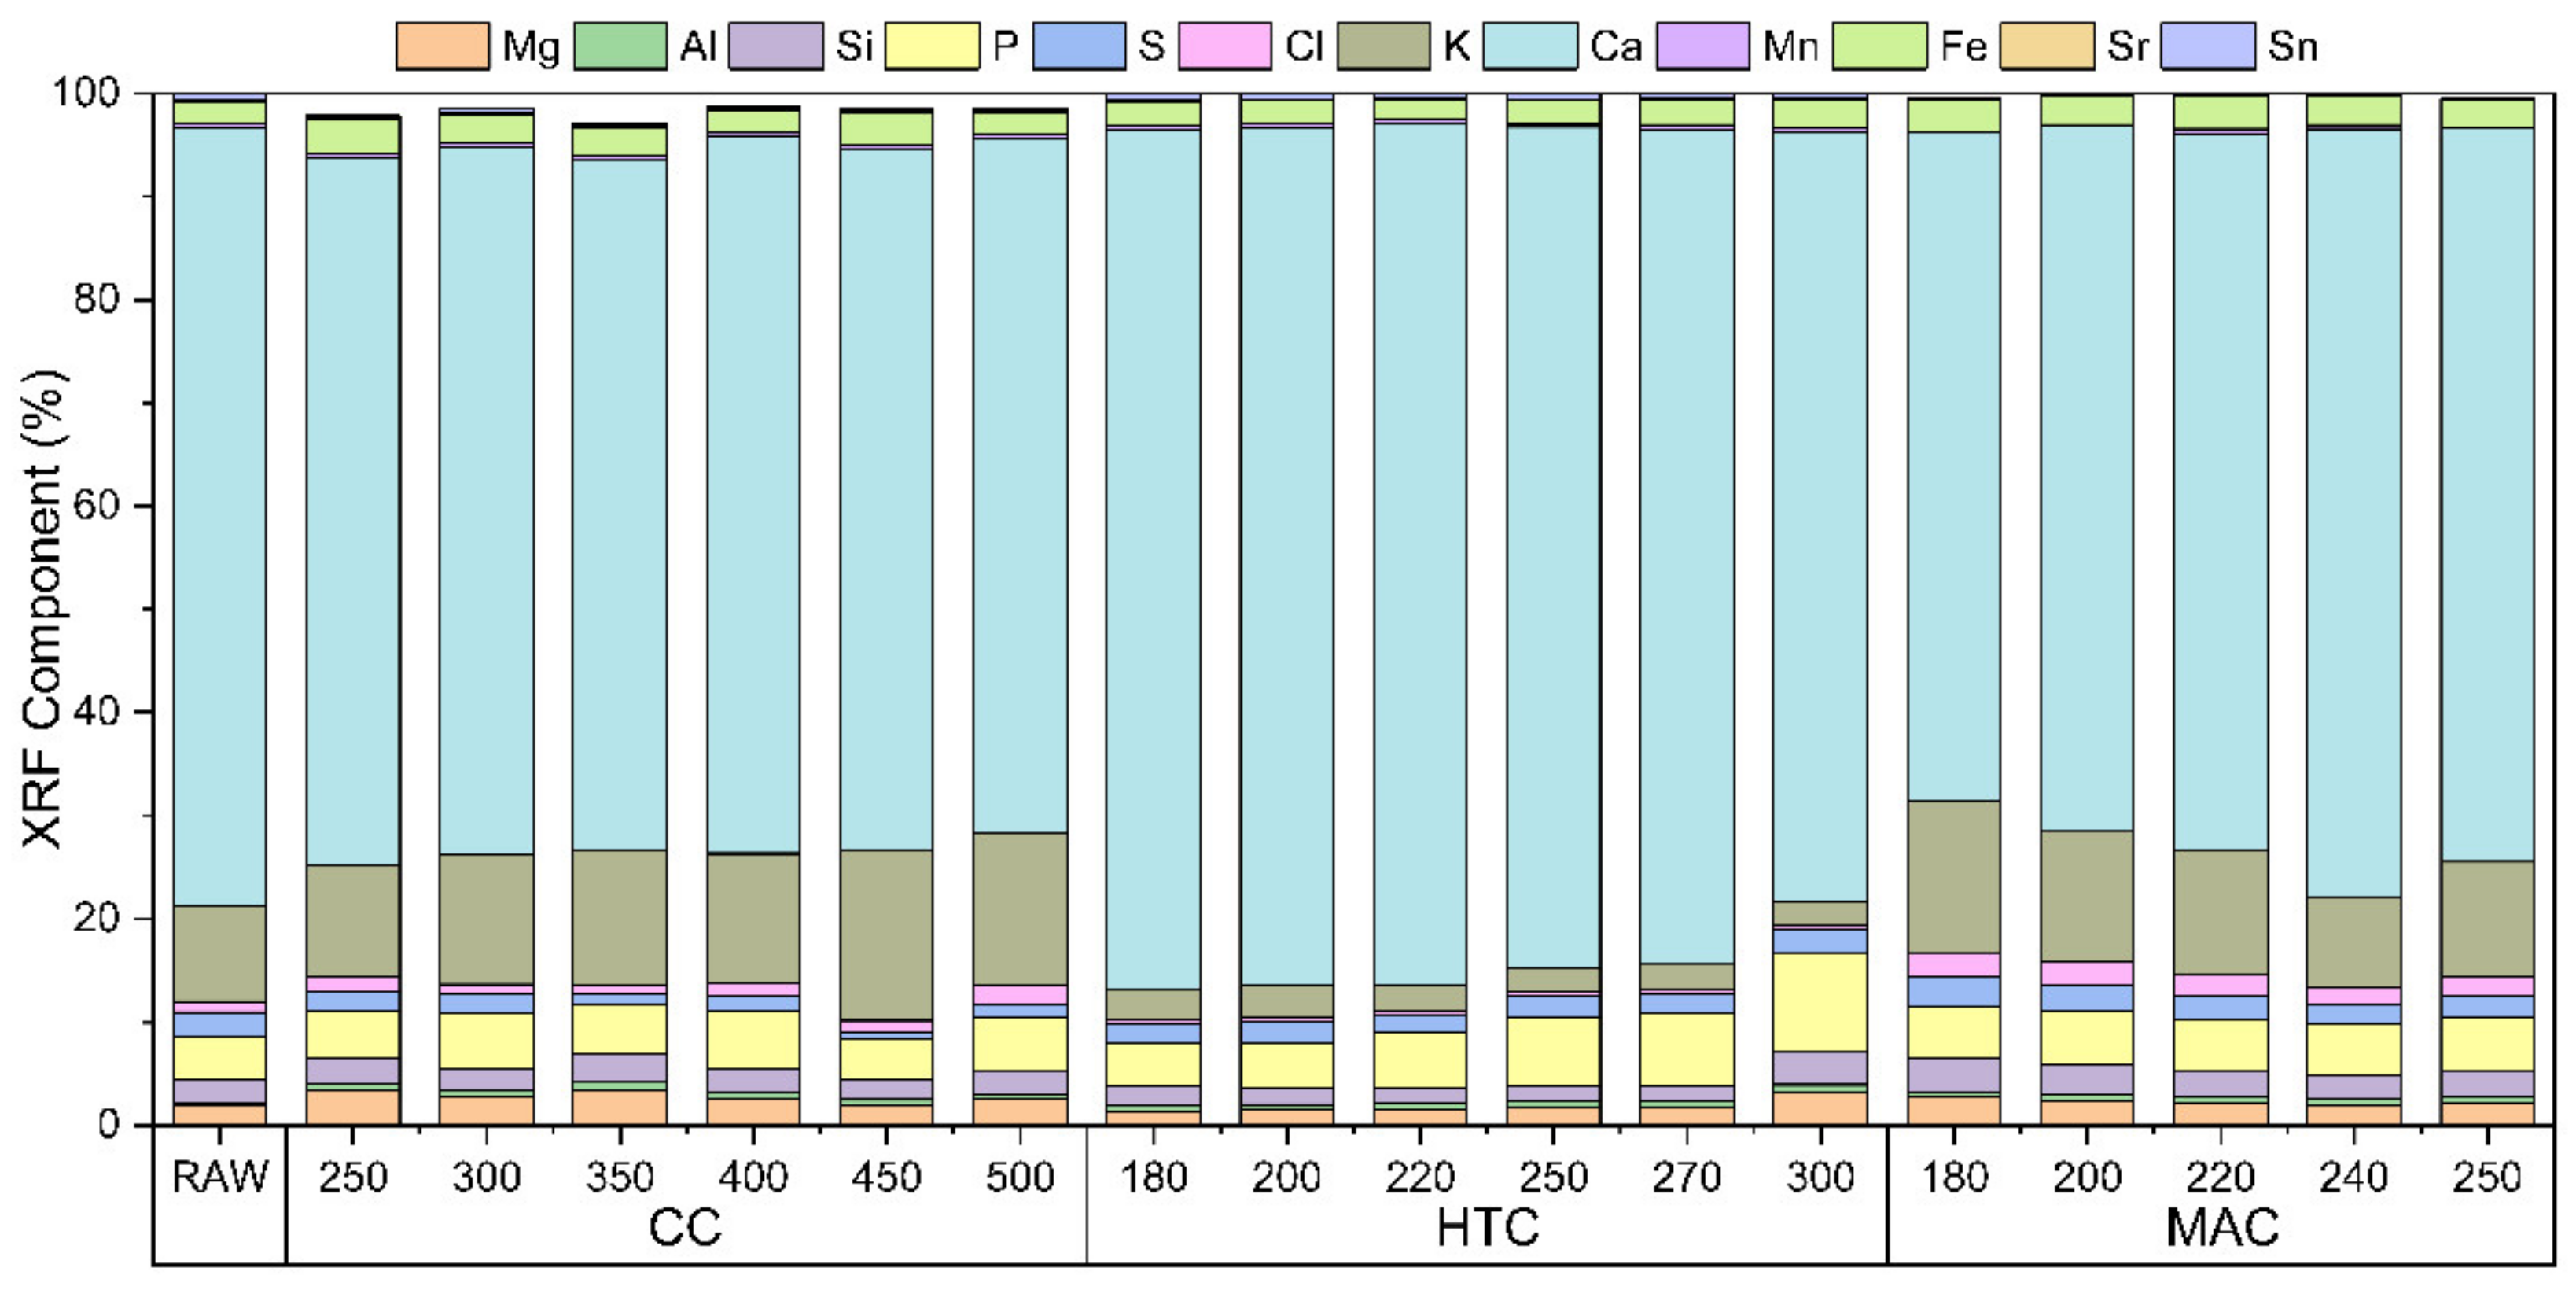
Calcium (Ca) and silicon (Si) were identified as the dominant inorganic components in both the raw biomass and derived chars (Figure 5). XRF analysis confirmed that Ca accounted for approximately 60–80% of the total inorganic content across all carbonization methods. This high-Ca fraction is characteristic of agricultural residues and influences ash-related behaviors, including melting characteristics and char reactivity during thermal conversion.
Chlorine (Cl) is a critical parameter for evaluating the applicability of char for thermal utilization because it is directly associated with high-temperature corrosion and material degradation in combustion systems [31]. In the CC- and MAC-derived chars, Cl content increased with increasing reaction temperature, which may be attributed to a concentration effect resulting from the progressive devolatilization of organic components.
In contrast, HTC exhibited fundamentally different behaviors with respect to inorganic matter transformations. Under hydrothermal conditions, water functions as a heat transfer medium and as a reactive solvent, facilitating the dissolution and migration of water-soluble inorganic species. As a result, chlorine-containing compounds were effectively transferred from the solid phase to the liquid phase, leading to a significant reduction in Cl content of HTC-derived hydrochar.
A similar trend was observed for potassium (K), which is known to play a key role in fouling and slagging owing to the formation of low-melting-point alkali compounds [32,33]. While the CC and MAC processes led to an apparent increase in K content owing to the concentration of inorganic residues, HTC resulted in a substantial reduction, decreasing from 9.22% in raw MWM to approximately 2–3% after carbonization. This reduction is consistent with the preferential leaching of water-soluble alkali species under hydrothermal conditions, whereas such leaching is limited in dry carbonization processes.
These results demonstrate that the transformation of inorganic matter is strongly governed by the reaction environment. Unlike CC and MAC, which primarily concentrate inorganic species through thermal decomposition, HTC facilitates simultaneous carbon densification and inorganic matter redistribution through dissolution–reprecipitation pathways.
From a processing perspective, the dual functionality of HTC is particularly important for the utilization of high-moisture and inorganic-rich biomass. The removal of Cl and K can substantially reduce operational issues, such as corrosion, fouling, and slagging, in downstream thermal systems. Therefore, rather than being universally superior, HTC can be considered a more suitable carbonization pathway for feedstocks in which inorganic-related limitations are critical.

3.5. Surface Structure Evolution and BET Specific Surface Area of Char

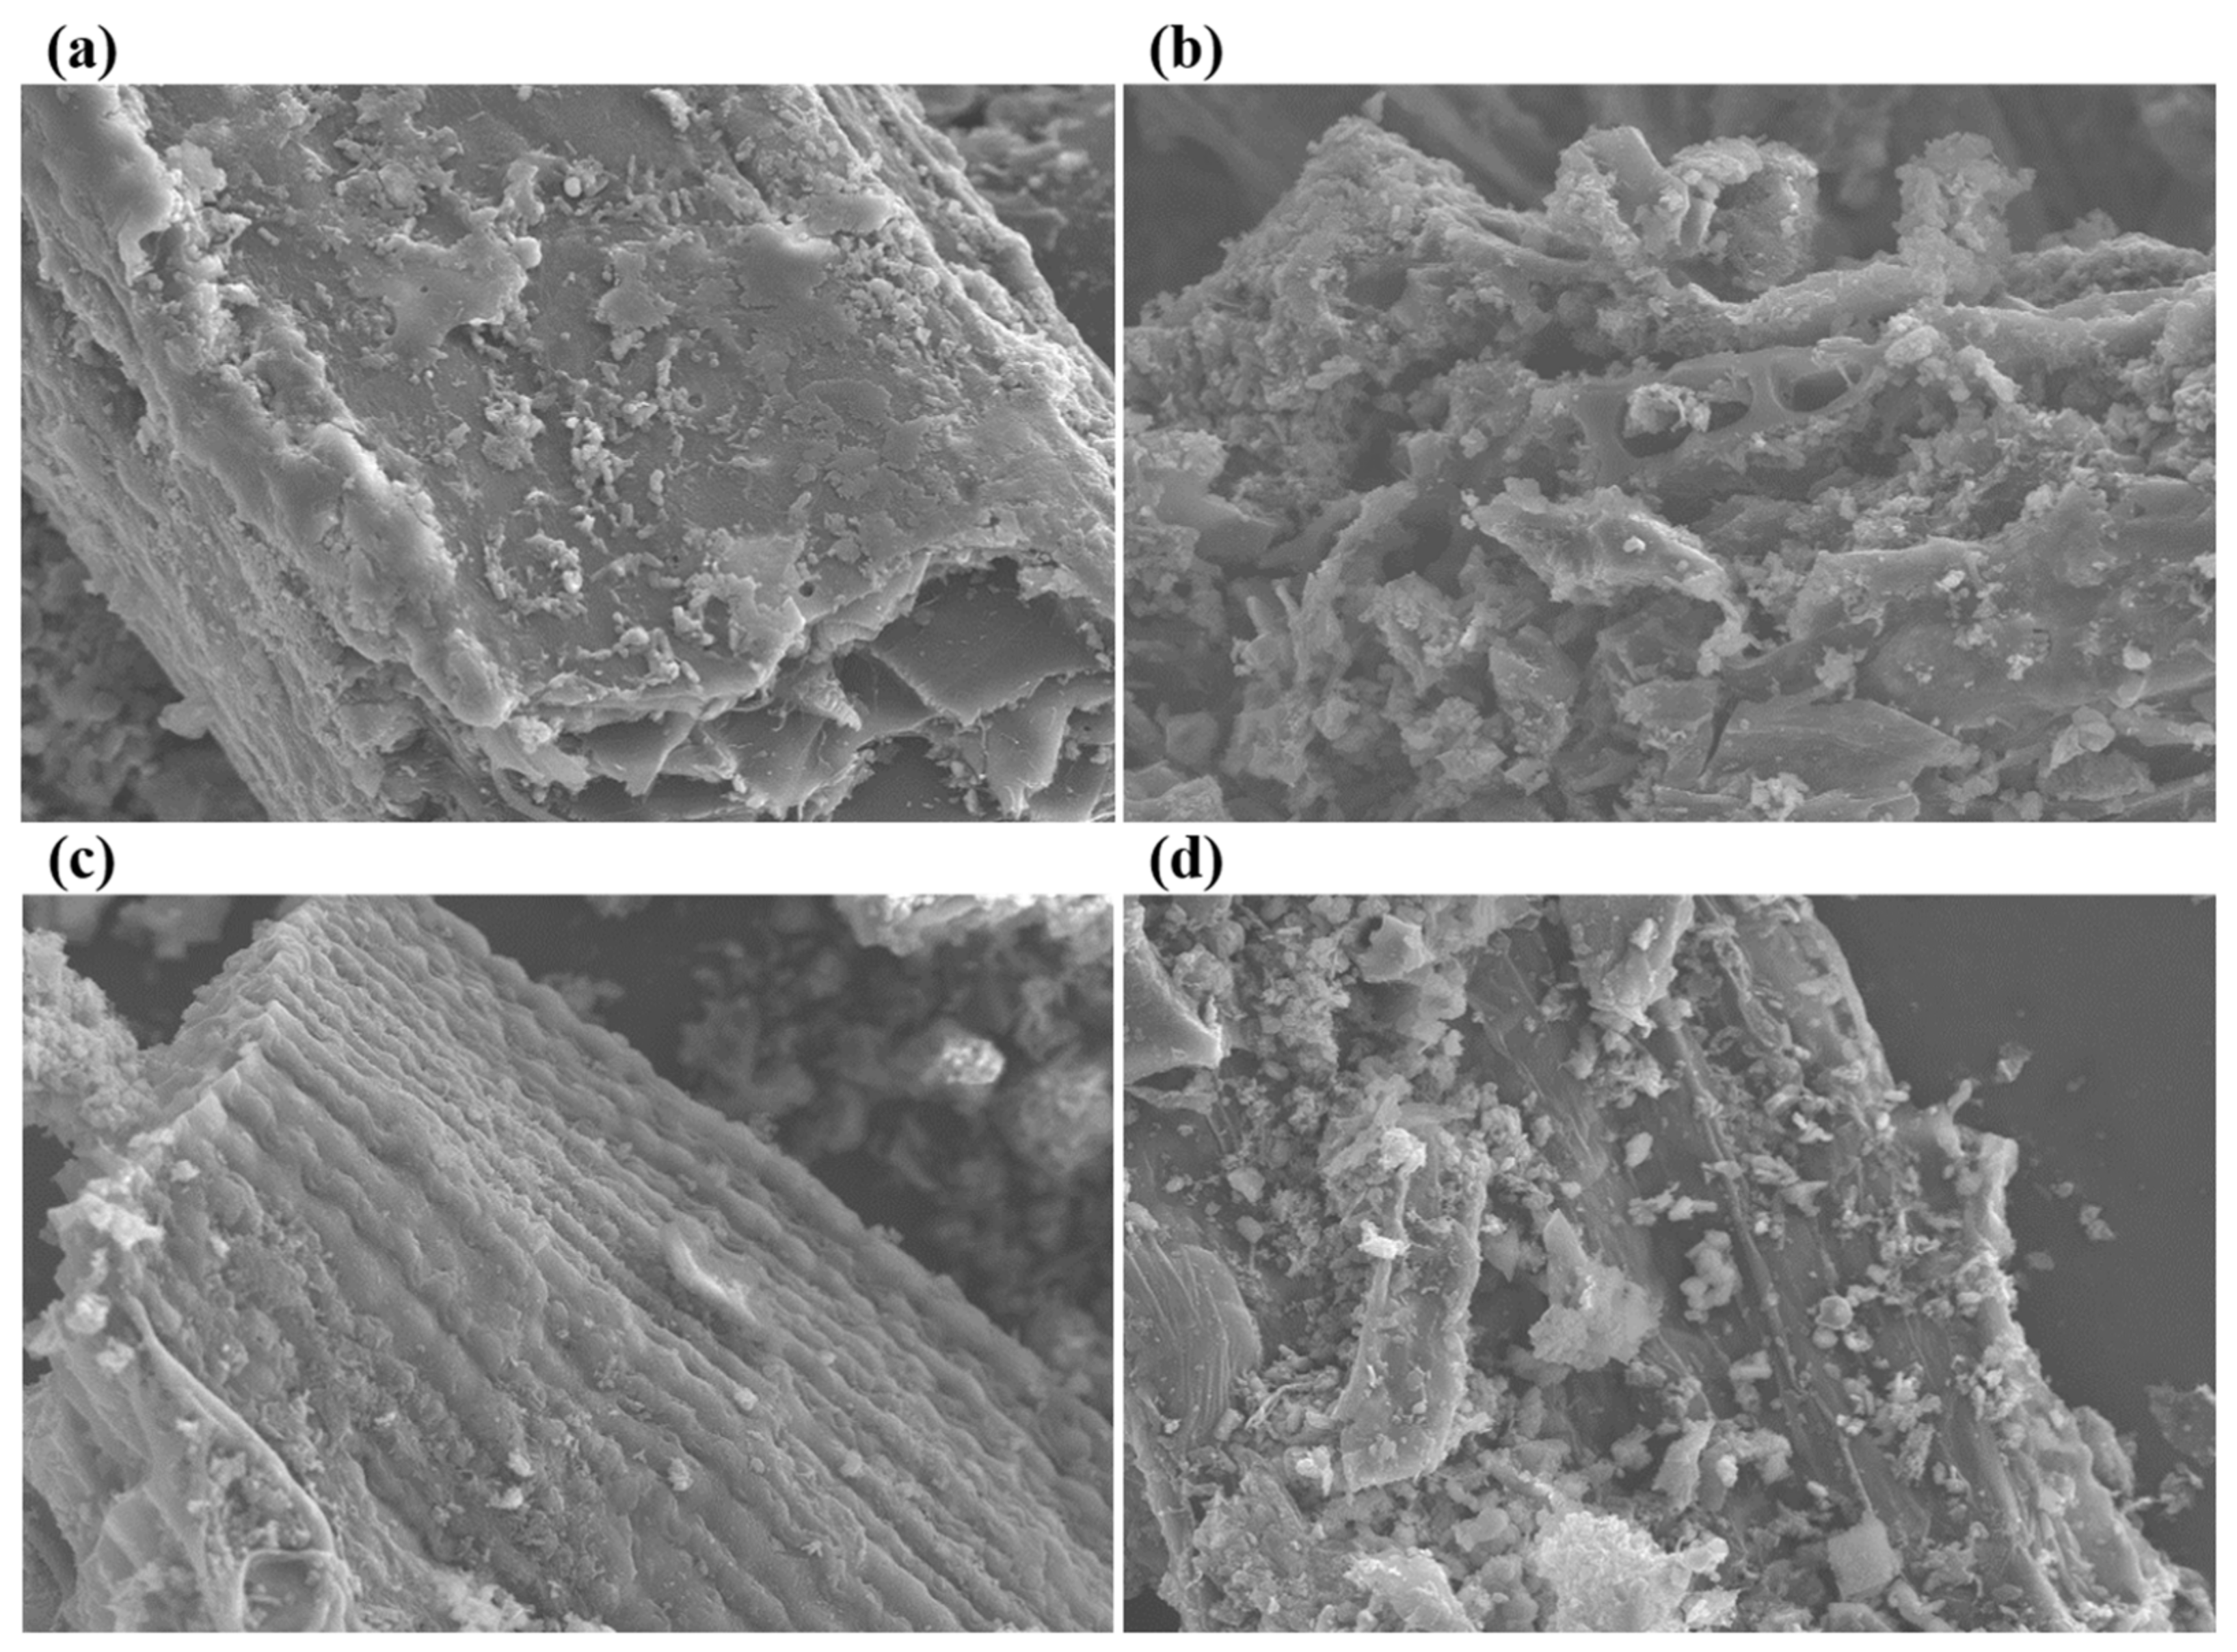
SEM images of raw MWM and the chars produced by CC, HTC, and MAC 250 °C (Figure 6) revealed significant morphological evolution of the char surfaces during carbonization. Compared with raw MWM, all carbonized samples exhibited increased surface roughness and pore development. These features became more pronounced as the carbonization temperature increased. This structural evolution is primarily associated with the progressive decomposition of organic components and the release of volatile matter, which contributes to pore formation and the development of a heterogeneous carbon matrix [34].
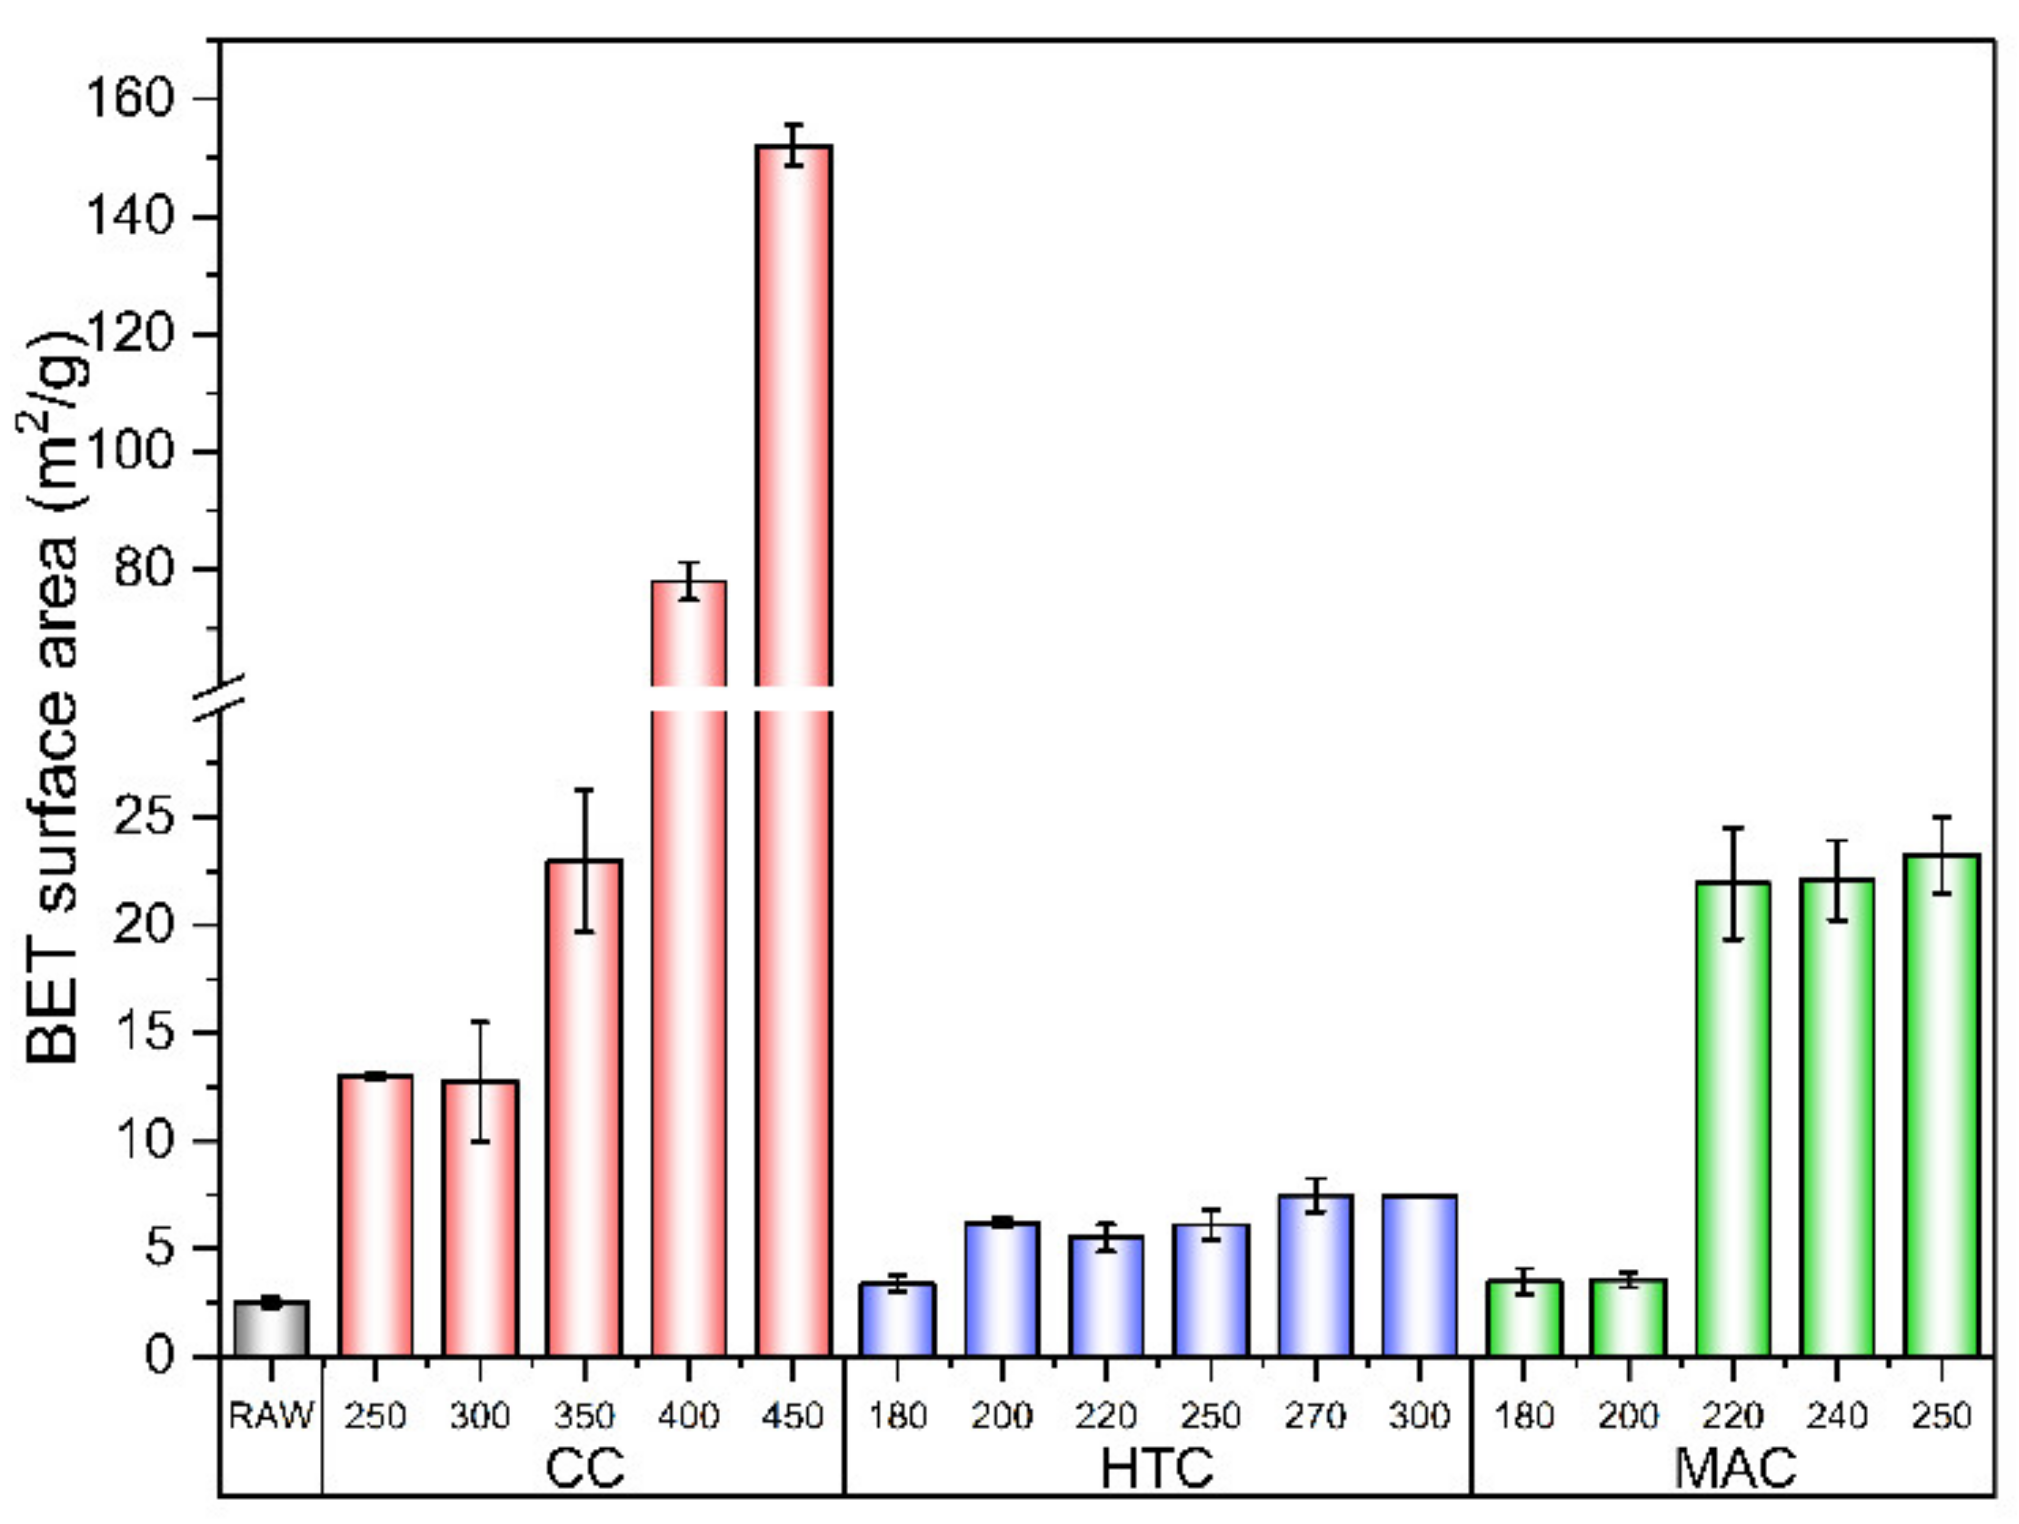
Among the three carbonization methods, the CC-derived biochars exhibited the most pronounced pore development, particularly at elevated temperatures. Well-developed pore networks and fractured surface structures were prominent, indicating extensive devolatilization and structural rearrangement. This behavior was strongly reflected in the BET surface area, which increased significantly from 0.96 m2/g at 250 °C to 77.97 m2/g at 400 °C (Figure 7). These results suggest that high-temperature dry carbonization promotes pore formation through the removal of volatile components and the collapse of carbon frameworks [35,36]. From an application perspective, these structural characteristics are advantageous for processes that require large surface areas, including adsorption and soil amendment applications.
In contrast, MAC exhibited a more gradual and controlled evolution of the surface structure. SEM indicated increased surface roughness without severe structural fragmentation, and the BET surface area increased steadily to 6.98 m2/g at 230 °C. This behavior can be attributed to the volumetric and rapid heating mechanism of microwave irradiation, which facilitates uniform internal heating while limiting excessive thermal gradients [37]. As a result, MAC facilitated controlled pore development with reduced structural damage, suggesting its suitability for applications requiring moderate porosity and low energy input. HTC-derived hydrochars exhibited relatively smooth and more compact surface morphologies with less apparent pore development as observed through SEM. Although the BET surface area increased with temperature up to 200 °C (6.20 m2/g), a slight decrease was observed at higher temperatures. This trend indicated a competing mechanism between pore formation and structural densification under hydrothermal conditions.
Notably, despite their relatively low BET surface areas, HTC hydrochars demonstrated favorable adsorption behavior in preliminary non-activated tests. This suggests that adsorption performance is governed by physical surface area and influenced by surface chemistry. HTC hydrochars are likely to retain a higher proportion of oxygen-containing functional groups and polar surface sites, which can enhance specific adsorption interactions.
Overall, these results demonstrate that pore structure development strongly depends on the carbonization pathway. While CC promotes extensive physical porosity through high-temperature devolatilization, HTC favors chemical modification and surface functionalization under hydrothermal conditions, and MAC provides an intermediate pathway with controlled structural evolution. Therefore, the selection of the carbonization method should be guided by the targeted application, considering the trade-off between physical surface area and surface chemical functionality.

4. Conclusions

This study systematically compared three carbonization pathways (CC, HTC, and MAC) in converting MWM into char, focusing on the physicochemical properties and fuel potential. Across all methods, increasing carbonization temperature led to progressive carbon densification, as reflected by decreases in oxygen and hydrogen contents and increased carbon and fixed carbon fractions. However, the extent and mechanisms of these transformations differ significantly depending on the reaction environment. HTC demonstrated strong performance under relatively mild conditions, producing hydrochar with higher carbon content and HHV at 250 °C. This behavior is attributed to water-mediated reactions that promote dehydration, decarboxylation, and structural reorganization. In addition, HTC effectively reduced inorganic species such as K and Cl, which are associated with fouling, slagging, and corrosion during thermal utilization. In contrast, CC required higher temperatures to achieve comparable carbonization, but generated chars with markedly higher BET surface areas, marking it suitable for applications requiring a high specific surface area. MAC exhibited intermediate characteristics, enabling controlled structural evolution with a moderate energy input. Overall, these results demonstrate that char properties are governed by both temperature and process-specific mechanisms, resulting in trade-offs among carbon densification, yield, surface structure, and inorganic content. Therefore, the optimal carbonization pathway should be selected based on the intended application and feedstock characteristics, particularly for high-moisture biomass, such as MWM.

Supplementary Materials

The following supporting information can be downloaded at https://www.mdpi.com/article/10.3390/en19163872/s1, Figure S1: (a) Product yield and (b) energy yield of the solid carbonized products obtained from CC, HTC, and MAC at different carbonization temperatures; Figure S2: SEM images of CC-derived biochars produced at different temperatures: (a) 250 °C, (b) 300 °C, (c) 350 °C, (d) 400 °C, and (e) 450 °C; Figure S3: SEM images of HTC-derived hydrochars produced at different temperatures: (a) 180 °C, (b) 200 °C, (c) 220 °C, (d) 250 °C, (e) 270 °C, and (f) 300 °C; Figure S4: SEM images of MAC-derived hydrochars produced at different temperatures: (a) 180 °C, (b) 200 °C, (c) 220 °C, (d) 240 °C, and (e) 250 °C.

Author Contributions

Conceptualization, D.-Y.K. and D.K.; Formal analysis, S.W. and D.Y.O.; Data curation, S.W.; Writing—original draft, S.W. and D.Y.O.; Writing—review & editing, D.Y.O. and D.K.; Project administration, D.K. All authors have read and agreed to the published version of the manuscript.

Funding

This work was supported by the National Research Foundation of Korea (NRF) grant funded by the Korea government (MSIT) (RS-2024-00455912).

Data Availability Statement

The original contributions presented in this study are included in the article. Further inquiries can be directed to the corresponding author.

Conflicts of Interest

The authors declare no conflict of interest.

References

  1. Kalak, T. Potential Use of Industrial Biomass Waste as a Sustainable Energy Source in the Future. Energies 2023, 16, 1783. [Google Scholar] [CrossRef] [Scilit]
  2. Oh, H.; Hong, I.; Oh, I. South Korea’s 2050 Carbon Neutrality Policy. East Asian Policy 2021, 13, 33–46. [Google Scholar] [CrossRef] [Scilit]
  3. Egli, F.; Zhang, R.; Hopo, V.; Schmidt, T.; Steffen, B. The Contribution of Corporate Initiatives to Global Renewable Electricity Deployment. Nat. Commun. 2023, 14, 4678. [Google Scholar] [CrossRef] [Scilit] [PubMed]
  4. Park, J. Voluntary Environmental Initiative and ESG Performance: Evidence from RE100; SSRN: Rochester, NY, USA, 2024. [Google Scholar]
  5. Ministry of Agriculture, Food and Rural Affairs. 2025 Key Statistics on Agriculture, Forestry, Livestock and Food; Ministry of Agriculture, Food and Rural Affairs: Sejong-si, Republic of Korea, 2025.
  6. Williams, B.C.; McMullan, J.T.; McCahey, S. An Initial Assessment of Spent Mushroom Compost as a Potential Energy Feedstock. Bioresour. Technol. 2001, 79, 227–230. [Google Scholar] [CrossRef] [Scilit] [PubMed]
  7. Lee, B.-H.; Jeong, T.-Y.; Trinh, V.T.; Jeon, C.-H. Thermal Degradation of Kenaf (Hibiscus cannabinus L.): Impact of Torrefaction on Pyrolysis Kinetics and Thermal Behavior. Energy Rep. 2021, 7, 951–959. [Google Scholar] [CrossRef] [Scilit]
  8. Mohd Hanafi, F.H.; Rezania, S.; Mat Taib, S.; Md Din, M.F.; Yamauchi, M.; Sakamoto, M.; Hara, H.; Park, J.; Ebrahimi, S.S. Environmentally Sustainable Applications of Agro-Based Spent Mushroom Substrate (SMS): An Overview. J. Mater. Cycles Waste Manag. 2018, 20, 1383–1396. [Google Scholar] [CrossRef] [Scilit]
  9. Campion, L.; Bekchanova, M.; Malina, R.; Kuppens, T. The Costs and Benefits of Biochar Production and Use: A Systematic Review. J. Clean. Prod. 2023, 408, 137138. [Google Scholar] [CrossRef] [Scilit]
  10. Cavali, M.; Libardi Junior, N.; de Sena, J.D.; Woiciechowski, A.L.; Soccol, C.R.; Belli Filho, P.; Bayard, R.; Benbelkacem, H.; de Castilhos Junior, A.B. A Review on Hydrothermal Carbonization of Potential Biomass Wastes, Characterization and Environmental Applications of Hydrochar, and Biorefinery Perspectives of the Process. Sci. Total Environ. 2023, 857, 159627. [Google Scholar] [CrossRef] [Scilit] [PubMed]
  11. Selvam, M.S.; Paramasivan, B. Microwave Assisted Carbonization and Activation of Biochar for Energy-Environment Nexus: A Review. Chemosphere 2022, 286, 131631. [Google Scholar] [CrossRef] [Scilit] [PubMed]
  12. Volpe, M.; Fiori, L.; Volpe, R.; Messineo, A. Upgrading of Olive Tree Trimmings Residue as Biofuel by Hydrothermal Carbonization and Torrefaction: A Comparative Study. In Chemical Engineering Transactions; Italian Association of Chemical Engineering-AIDIC: Milan, Italy, 2016; Volume 50, pp. 13–18. [Google Scholar]
  13. Elaigwu, S.E.; Greenway, G.M. Microwave-Assisted and Conventional Hydrothermal Carbonization of Lignocellulosic Waste Material: Comparison of the Chemical and Structural Properties of the Hydrochars. J. Anal. Appl. Pyrolysis 2016, 118, 1–8. [Google Scholar] [CrossRef] [Scilit]
  14. González-Arias, J.; Gómez, X.; González-Castaño, M.; Sanchez, M.E.; Rosas, J.G.; Cara-Jiménez, J. Insights into the Product Quality and Energy Requirements for Solid Biofuel Production: A Comparison of Hydrothermal Carbonization, Pyrolysis and Torrefaction of Olive Tree Pruning. Energy 2022, 238, 122022. [Google Scholar] [CrossRef] [Scilit]
  15. Kim, D.; Lee, K.; Park, K.Y. Upgrading the Characteristics of Biochar from Cellulose, Lignin, and Xylan for Solid Biofuel Production from Biomass by Hydrothermal Carbonization. J. Ind. Eng. Chem. 2016, 42, 95–100. [Google Scholar] [CrossRef] [Scilit]
  16. Lu, J.-J.; Chen, W.-H. Investigation on the Ignition and Burnout Temperatures of Bamboo and Sugarcane Bagasse by Thermogravimetric Analysis. Appl. Energy 2015, 160, 49–57. [Google Scholar] [CrossRef] [Scilit]
  17. Bach, Q.-V.; Chen, W.-H. Pyrolysis Characteristics and Kinetics of Microalgae via Thermogravimetric Analysis (TGA): A State-of-the-Art Review. Bioresour. Technol. 2017, 246, 88–100. [Google Scholar] [CrossRef] [Scilit] [PubMed]
  18. Chen, D.; Gao, A.; Cen, K.; Zhang, J.; Cao, X.; Ma, Z. Investigation of Biomass Torrefaction Based on Three Major Components: Hemicellulose, Cellulose, and Lignin. Energy Convers. Manag. 2018, 169, 228–237. [Google Scholar] [CrossRef] [Scilit]
  19. Guo, S.; Dong, X.; Wu, T.; Zhu, C. Influence of Reaction Conditions and Feedstock on Hydrochar Properties. Energy Convers. Manag. 2016, 123, 95–103. [Google Scholar] [CrossRef] [Scilit]
  20. Funke, A.; Ziegler, F. Hydrothermal Carbonization of Biomass: A Summary and Discussion of Chemical Mechanisms for Process Engineering. Biofuels Bioprod. Biorefining 2010, 4, 160–177. [Google Scholar] [CrossRef] [Scilit]
  21. Kang, S.; Li, X.; Fan, J.; Chang, J. Characterization of Hydrochars Produced by Hydrothermal Carbonization of Lignin, Cellulose, D-Xylose, and Wood Meal. Ind. Eng. Chem. Res. 2012, 51, 9023–9031. [Google Scholar] [CrossRef] [Scilit]
  22. Liao, W.; Zhang, X.; Ke, S.; Shao, J.; Yang, H.; Zhang, S.; Chen, H. The Influence of Biomass Species and Pyrolysis Temperature on Carbon-Retention Ability and Heavy Metal Adsorption Property during Biochar Aging. Fuel Process. Technol. 2023, 240, 107580. [Google Scholar] [CrossRef] [Scilit]
  23. Dai, L.; He, C.; Wang, Y.; Liu, Y.; Yu, Z.; Zhou, Y.; Fan, L.; Duan, D.; Ruan, R. Comparative Study on Microwave and Conventional Hydrothermal Pretreatment of Bamboo Sawdust: Hydrochar Properties and Its Pyrolysis Behaviors. Energy Convers. Manag. 2017, 146, 1–7. [Google Scholar] [CrossRef] [Scilit]
  24. Kim, D.; Lee, K.; Park, K.Y. Hydrothermal Carbonization of Anaerobically Digested Sludge for Solid Fuel Production and Energy Recovery. Fuel 2014, 130, 120–125. [Google Scholar] [CrossRef] [Scilit]
  25. Chen, L.; Wang, X.; Yang, H.; Lu, Q.; Li, D.; Yang, Q.; Chen, H. Study on Pyrolysis Behaviors of Non-Woody Lignins with TG-FTIR and Py-GC/MS. J. Anal. Appl. Pyrolysis 2015, 113, 499–507. [Google Scholar] [CrossRef] [Scilit]
  26. Volli, V.; Gollakota, A.R.K.; Shu, C.-M. Comparative Studies on Thermochemical Behavior and Kinetics of Lignocellulosic Biomass Residues Using TG-FTIR and Py-GC/MS. Sci. Total Environ. 2021, 792, 148392. [Google Scholar] [CrossRef] [Scilit] [PubMed]
  27. Kalina, M.; Sovova, S.; Svec, J.; Trudicova, M.; Hajzler, J.; Kubikova, L.; Enev, V. The Effect of Pyrolysis Temperature and the Source Biomass on the Properties of Biochar Produced for the Agronomical Applications as the Soil Conditioner. Materials 2022, 15, 8855. [Google Scholar] [CrossRef] [Scilit] [PubMed]
  28. Leng, L.; Yang, L.; Leng, S.; Zhang, W.; Zhou, Y.; Peng, H.; Li, H.; Hu, Y.; Jiang, S.; Li, H. A Review on Nitrogen Transformation in Hydrochar during Hydrothermal Carbonization of Biomass Containing Nitrogen. Sci. Total Environ. 2021, 756, 143679. [Google Scholar] [CrossRef] [Scilit] [PubMed]
  29. Smidt, E.; Meissl, K. The Applicability of Fourier Transform Infrared (FT-IR) Spectroscopy in Waste Management. Waste Manag. 2007, 27, 268–276. [Google Scholar] [CrossRef] [Scilit] [PubMed]
  30. Escalante, J.; Chen, W.-H.; Tabatabaei, M.; Hoang, A.T.; Kwon, E.E.; Andrew Lin, K.-Y.; Saravanakumar, A. Pyrolysis of Lignocellulosic, Algal, Plastic, and Other Biomass Wastes for Biofuel Production and Circular Bioeconomy: A Review of Thermogravimetric Analysis (TGA) Approach. Renew. Sustain. Energy Rev. 2022, 169, 112914. [Google Scholar] [CrossRef] [Scilit]
  31. Wang, Y.; Sun, Y.; Jiang, L.; Liu, L.; Li, Y. Characteristics of Corrosion Related to Ash Deposition on Boiler Heating Surface during Cofiring of Coal and Biomass. J. Chem. 2020, 2020, 1692598. [Google Scholar] [CrossRef] [Scilit]
  32. Ryu, D.; Lee, J.; Kim, D.; Jang, K.; Lee, J.; Kim, D. Enhancement of the Biofuel Characteristics of Empty Fruit Bunches through Hydrothermal Carbonization by Decreasing the Inorganic Matters. Energies 2022, 15, 8154. [Google Scholar] [CrossRef] [Scilit]
  33. Li, X.; He, F.; Behrendt, F.; Gao, Z.; Shi, J.; Li, C. Inhibition of K2SO4 on Evaporation of KCl in Combustion of Herbaceous Biomass. Fuel 2021, 289, 119754. [Google Scholar] [CrossRef] [Scilit]
  34. Collard, F.-X.; Blin, J. A Review on Pyrolysis of Biomass Constituents: Mechanisms and Composition of the Products Obtained from the Conversion of Cellulose, Hemicelluloses and Lignin. Renew. Sustain. Energy Rev. 2014, 38, 594–608. [Google Scholar] [CrossRef] [Scilit]
  35. Zhylina, M.; Miroshnichenko, D.; Melnykov, A.; Stepanova, V.; Lazdovica, K.; Zemcenkovs, V.; Sterna, V.; Ozolins, J. Biochar Structure Development during Slow Pyrolysis of Pellets from Barley Straw and Bran. Sci. Rep. 2025, 15, 42624. [Google Scholar] [CrossRef] [Scilit] [PubMed]
  36. Du, L.; Han, H.; Li, A.; Ren, Q.; Hu, S.; Su, S.; Wang, Y.; Jiang, L.; Xu, J.; Xu, K. Evolution of Biochar Structure and Its Impact on Volatile Adsorption and Reforming during Char-Recycled Pyrolysis. Energy Mater. Adv. 2025, 6, 167. [Google Scholar] [CrossRef] [Scilit]
  37. Qiu, T.; Li, C.; Guang, M.; Zhang, Y. Porous Carbon Material Production from Microwave-Assisted Pyrolysis of Peanut Shell. Carbon Res. 2023, 2, 45. [Google Scholar] [CrossRef] [Scilit]
Figure 1. Schematic diagrams of the carbonization reactions: (a) CC, (b) HTC, and (c) MAC.
Energies 19 03872 g001
Figure 2. Van Krevelen diagram for char generated from mushroom waste medium using three different carbonization reactors.
Energies 19 03872 g002
Figure 3. Changes in char chemical structure across a range of reaction temperatures determined using FT-IR analysis; (a) CC, (b) HTC, and (c) MAC.
Energies 19 03872 g003
Figure 4. Combustion characteristics of char reflected in TGA and DTG curves; (a) CC-TGA, (b) CC-DTG, (c) HTC-TGA, (d) HTC-DTG, (e) MAC-TGA, and (f) MAC-DTG.
Energies 19 03872 g004
Figure 5. Inorganic matter composition of the char determined by XRF analysis.
Energies 19 03872 g005
Figure 6. Scanning electron micrographs showing the surface structure of the char generated using three different carbonization reactions (×1000 magnification); (a) RAW, (b) CC (250 °C), (c) HTC (250 °C), and (d) MAC (250 °C).
Energies 19 03872 g006
Figure 7. Changes in char specific surface area across a range of temperatures determined using BET analysis.
Energies 19 03872 g007
Table 1. Characteristics of the mushroom waste medium (MWM).
Moisture Content
(wt.%)
Ultimate Analysis (wt.%) a,bProximate Analysis (wt.%) cHHV
(MJ/kg) c
CHONSFixed CarbonVolatile MatterAsh
MWM64.41
±0.45
44.45
±1.04
5.78
±0.10
46.68
±0.77
2.88
±0.37
0.22
±0.04
20.77
±1.39
71.60
±1.22
7.63
±0.28
16.20
±0.09
a Dry, ash-free. b C: carbon; H: hydrogen; O: oxygen; N: nitrogen; S: sulfur. c on a dry basis.
Table 2. Characteristics of char determined by ultimate analysis, proximate analysis, and calorimetry.
Char SamplesUltimate Analysis (wt.%) a,bProximate Analysis (wt.%) cHHV (MJ/kg) c
CHONSFixed CarbonVolatile MatterAsh
CC25051.03
±1.20
5.09
±0.06
39.46
±1.23
4.22
±0.10
0.21
±0.01
28.63
±0.62
58.63
±1.80
12.74
±1.18
19.49
±0.68
CC30053.33
±1.08
4.29
±0.08
38.77
±1.18
3.31
±0.11
0.30
±0.03
40.75
±0.49
44.77
±0.99
14.48
±1.36
22.23
±0.22
CC35061.25
±2.03
4.31
±0.09
29.84
±2.09
4.51
±0.11
0.08
±0.02
47.08
±2.97
30.15
±1.26
20.25
±1.71
22.62
±0.66
CC40063.45
±2.23
3.35
±0.13
29.65
±2.31
3.28
±0.03
0.26
±0.02
48.48
±2.20
30.89
±0.47
20.62
±2.00
22.78
±0.71
CC45071.62
±3.19
3.25
±0.11
20.66
±3.37
4.47
±0.20
0.00
±0.00
54.54
±4.90
20.59
±4.21
24.87
±0.69
23.19
±1.09
HTC18046.66
±0.56
5.25
±0.20
45.27
±0.77
2.73
±0.37
0.10
±0.04
24.60
±2.00
67.49
±1.41
7.91
±0.64
16.50
±0.23
HTC20051.30
±1.16
5.16
±0.20
40.28
±0.83
3.14
±0.02
0.12
±0.08
29.05
±2.50
62.17
±2.24
8.78
±0.67
18.22
±0.46
HTC22053.60
±1.50
5.20
±0.16
38.06
±1.64
2.99
±0.02
0.14
±0.01
29.63
±0.98
61.26
±0.98
9.11
±0.81
18.94
±0.39
HTC25060.15
±0.60
5.14
±0.06
30.79
±0.47
3.78
±0.00
0.14
±0.10
37.81
±1.28
50.63
±1.57
11.56
±0.42
20.93
±0.67
HTC27065.66
±1.60
5.34
±0.08
24.65
±1.74
4.17
±0.08
0.18
±0.01
44.80
±0.54
42.66
±0.52
12.54
±0.29
22.35
±1.02
HTC30068.29
±0.40
5.61
±0.02
21.67
±0.44
4.26
±0.03
0.17
±0.01
45.59
±1.89
44.04
±1.44
14.47
±1.65
24.47
±0.08
MAC18045.15
±1.91
5.72
±0.00
45.31
±1.80
3.50
±0.07
0.32
±0.04
21.75
±0.52
68.48
±0.31
9.77
±0.21
16.71
±0.59
MAC20046.42
±0.31
5.62
±0.05
44.10
±0.37
3.53
±0.03
0.32
±0.01
22.88
±0.54
67.09
±0.35
10.04
±0.20
16.93
±1.11
MAC22047.28
±1.04
5.58
±0.00
43.28
±1.10
3.54
±0.04
0.32
±0.03
24.98
±1.28
65.30
±1.26
9.72
±0.02
17.49
±1.14
MAC24048.48
±3.08
4.77
±0.02
42.11
±3.14
4.30
±0.06
0.34
±0.02
26.92
±1.22
61.60
±0.16
11.48
±1.06
18.83
±0.49
MAC25050.47
±1.32
4.94
±0.03
40.15
±1.38
4.11
±0.06
0.33
±0.03
27.16
±1.25
60.46
±0.69
12.37
±1.94
19.80
±0.04
a Dry, ash-free. b C: carbon; H: hydrogen; O: oxygen; N: nitrogen; S: sulfur. c on a dry basis.
Table 3. Combustion characteristics and pyrolysis activation energies determined from thermogravimetric analysis results.
Char SamplesMax
Temperature
(°C)
Ignition
Temperature
(°C)
Burnout
Temperature
(°C)
Activation Energy (kJ/mol)
KissingerOzawa
MWM414.45
±4.03
378.28
±0.50
594.59
±6.54
50.34
±6.91
61.84
±5.16
CC250454.86
±3.08
367.91
±6.93
654.39
±8.99
60.62
±3.26
75.27
±7.01
CC300426.41
±4.84
357.06
±0.83
644.15
±3.76
57.55
±4.47
81.53
±3.95
CC350458.83
±1.15
372.29
±2.62
671.49
±7.91
39.92
±2.61
60.83
±9.41
CC400396.42
±6.02
373.98
±4.07
703.25
±7.90
44.28
±7.13
61.80
±4.41
CC450389.10
±5.09
333.12
±7.28
707.84
±9.65
38.34
±2.35
51.63
±7.13
HTC180298.79
±3.59
278.97
±1.57
611.35
±0.28
50.75
±5.83
66.85
±2.13
HTC200292.41
±7.34
279.17
±0.31
617.15
±2.06
33.60
±6.29
64.41
±5.14
HTC220296.17
±2.04
254.59
±2.35
632.25
±5.28
30.42
±3.49
48.16
±2.78
HTC250430.55
±6.50
316.53
±8.04
630.52
±2.61
29.91
±8.54
41.81
±1.91
HTC270442.34
±2.91
310.94
±0.42
609.48
±3.52
24.40
±3.92
42.06
±7.13
HTC300428.87
±5.46
357.90
±2.21
589.28
±7.52
19.48
±7.65
38.44
±4.72
MAC180278.95
±4.31
209.49
±3.15
614.92
±3.16
158.28
±5.35
243.33
±2.50
MAC200281.06
±9.89
209.74
±0.66
618.54
±5.37
67.43
±3.36
65.31
±8.06
MAC220426.89
±2.26
373.12
±8.36
581.68
±1.51
113.78
±1.86
175.51
±1.98
MAC240284.93
±4.73
225.54
±7.45
636.50
±0.30
11.31
±3.81
76.30
±2.48
MAC250420.50
±0.59
224.28
±1.95
638.18
±6.47
54.27
±5.41
67.33
±9.26
Disclaimer/Publisher’s Note: The statements, opinions and data contained in all publications are solely those of the individual author(s) and contributor(s) and not of MDPI and/or the editor(s). MDPI and/or the editor(s) disclaim responsibility for any injury to people or property resulting from any ideas, methods, instructions or products referred to in the content.