Article

Understanding the Dual Role of Ionomer Content in PEMFC Catalyst Layers: Trade-Offs Between Performance and Durability


State Key Laboratory of Ocean Engineering, School of Ocean & Civil Engineering, Shanghai Jiao Tong University, 800 Dongchuan Road, Shanghai 200240, China
*
Author to whom correspondence should be addressed.
Energies 2026, 19(15), 3670; https://doi.org/10.3390/en19153670
Submission received: 24 June 2026 / Revised: 30 July 2026 / Accepted: 3 August 2026 / Published: 4 August 2026
(This article belongs to the Special Issue Research and Development of Key Materials and Devices for Fuel Cells)

Abstract

Electrochemical reactions in proton exchange membrane fuel cells (PEMFCs) predominantly occur within the membrane electrode assembly (MEA), dictating power output and lifetime. As a key functional component of the catalyst layer (CL), ionomer plays a decisive role in establishing effective three-phase boundaries, maintaining proton-conducting networks. While the impact of ionomer-to-carbon (I/C) ratio on MEA performance has been recognized, its coupled effect on durability remains underexplored. Herein, MEAs with I/C ratios ranging from 0.4 to 1.2 were fabricated, and the influence of ionomer content on performance and durability was systematically investigated through microstructural characterization, electrochemical measurement, and accelerated stress testing. Results reveal distinct trade-offs: insufficient ionomer impairs proton transport and durability, while excess ionomer hinders mass transport and electrochemical performance but helps maintain CL stability. Specifically, an I/C ratio of 1.2 exhibits the highest durability but the lowest performance. An I/C ratio of 0.8 achieves the optimal peak power density (1156 mW cm–2) while maintaining good durability, superior to lower I/C ratios. Balancing performance and durability, an I/C ratio of 0.8 emerges as the optimal choice. This work provides both experimental evidence and mechanistic insights into the influence of ionomer content in CL, offering guidance for the design of high-performance and durable PEMFCs.

1. Introduction

Proton exchange membrane fuel cells (PEMFCs) have emerged as a promising clean energy technology due to their compact structural design, high energy conversion efficiency, and diverse application scenarios [1]. As the core component of PEMFCs, the membrane electrode assembly (MEA) serves as the primary site for electrochemical reactions, and its performance and durability directly affect the output power and service life of PEMFCs. The development of high-performance and long-life MEAs is attracting increasing attention.
The catalyst layer (CL) of MEA is a multiphase composite system, and its microstructural characteristics have a decisive impact on the mass transport, electrochemical reaction efficiency, and long-term operation stability. The CL primarily consists of carbon-supported platinum (Pt/C) or its alloy nanoparticles, ionomer, and pores, which together form transport channels for electrons, protons, and reaction gases [2,3]. The performance of PEMFC is highly dependent on the construction of the three-phase boundary (TPB) within the CL. The microstructure features, such as porosity, ionomer distribution, and Pt particle state, directly determine the efficiency of transporting reactants, intermediates, and products, particularly under high current density conditions [4]. Therefore, optimizing the distribution and proportion of the CL components to tailor their microstructure is of great significance and practical engineering value for enhancing the performance and durability of PEMFCs.
Perfluorosulfonic acid (PFSA) ionomer is a key functional component of CL, performing a variety of critical roles. It not only acts as a proton conductor by establishing a continuous proton conduction network [5,6], but also enhances the mechanical integrity of the CL through molecular chain entanglement [7,8]. The distribution characteristics of PFSA ionomer within the CL, such as ionomer film thickness and network continuity, have a decisive impact on cell performance. Especially, when PEMFC operates at high current densities exceeding 1.5 A cm–2, the distribution of ionomer becomes increasingly critical due to the transport of H+ and O2 through both the ionomer network and the pores in the CL.
Current research primarily focuses on the impact of ionomer content (commonly expressed by the ionomer-to-carbon (I/C) ratio) and type (typically differing in side-chain length) within the CL on the transport of species (gases, electrons, protons, and water) [9]. When PFSA ionomer forms a three-dimensional interpenetrating network structure, catalyst utilization efficiency can be significantly improved [9]. Liu et al. found that ionomer can affect the microstructure and particle interactions of catalyst ink, thereby affecting PEMFC performance [10]. Chen et al. found that the thickness of the ionomer film in the CL can affect oxygen diffusion and proton conduction [11]. A higher ionomer content is beneficial for forming a continuous proton conduction network in CL, thereby promoting proton transport within CL [12]. However, excessive ionomer can reduce CL porosity and oxygen transport efficiency [13,14,15]. In addition, ionomer can cover catalyst particles and block electron conduction pathways [9]. On the contrary, a lower ionomer content favors higher porosity and improved electronic conductivity of the CL. However, it may reduce the active area of the catalyst and lead to discontinuity in the proton conduction pathway [16]. Xue et al. investigated the effect of ionomer content on the TPB microstructure and multiphase transport properties via molecular dynamics simulations [17]. Yakovlev et al. investigated the transport characteristics of the CL under different I/C ratios (0.1–1.0), and found that the CL with I/C = 0.6 (26.5 wt.%) exhibited lower oxygen and proton transport resistance [18]. Optimizing the ionomer content in CL is crucial for balancing the transport of protons, electrons, water, and gases, while maintaining an effective TPB. However, the optimal I/C ratio varies with preparation methods and materials used [19]. Li et al. highlighted that the optimal I/C ratio for spraying processes is generally lower than that for doctor-blading processes [19]. They prepared CL by the doctor-blading process, with an optimal I/C ratio of 1.1, which is higher than the optimal I/C ratio in conventional spraying processes (usually 0.6–0.8) [18]. Furthermore, the side-chain structure and equivalent weight (EW) of different ionomers can affect various characteristics of the CL, including proton conduction, water management, and gas diffusion [20,21]. In the actual preparation process of MEA, it is necessary to optimize the ionomer content in the CL through system testing to achieve optimal PEMFC performance.
During long-term operation under dynamic loads, the MEAs suffer significant performance degradation, making durability a critical challenge for the commercialization of PEMFC. Since these degradation mechanisms progress slowly under normal operating conditions, researchers often employ accelerated stress testing (AST) to evaluate fuel cell durability within a shorter timeframe. Although numerous studies have investigated the effects of the CL preparation methods, catalyst loading, and ionomer content and type on cell performance, relatively limited attention has been paid to the effect of ionomer content in the CL on the durability of PEMFC. Currently, contradictory conclusions still exist in the literature regarding the influence of ionomer content in the CL on durability. Young et al. compared cathode CLs with ionomer contents of 23 wt.% and 33 wt.%, and found that the MEA containing 33 wt.% Nafion exhibited higher platinum content in the proton exchange membrane (PEM) and a higher fluoride release rate [22]. In contrast, Shahgaldi et al. demonstrated that although increasing the ionomer content reduces the power density of PEMFCs at high current densities, it significantly enhances the long-term durability of the cell [23]. Therefore, it is necessary to further investigate the influence of the content of ionomer in the CL on PEMFC performance and durability.
In this study, the influence of ionomer content on the performance and durability of PEMFC was systematically investigated by designing a series of MEAs with cathode I/C ratios ranging from 0.4 to 1.2. The effects of the I/C ratio on key performance indicators and durability parameters (electrochemical surface area (ECSA), Pt particle size, etc.) of MEAs were analyzed from multiple dimensions through the comprehensive use of physical characterization, electrochemical testing, and AST methods. Specifically, this study focuses on the correlation mechanism between the evolution of the ionomer network structure and the degradation of MEA performance under different I/C ratios. These research results can provide an important theoretical basis for the rational design and optimization of the CL.

2. Materials and Methods

2.1. Materials

PFSA ionomer solution (Nafion D2020, 20 wt.%, EW ≈ 1000 g mol–1, Wilmington, DE, USA) was obtained from The Chemours Chemical Co., Ltd. Pt/C catalyst (40 wt.%, HiSPEC 4000, UK) was supplied by Johnson Matthey. Isopropyl alcohol (IPA, ≥99.7% purity) was purchased from Shanghai Sinopharm Chemical Reagent Co., Ltd. The GORE-SELECT membrane (M820.15, 15 μm, W. L. Gore & Associates, Newark, DE, USA) and gas diffusion medium (Toray TGL-R-055, 168 μm, Toray Industries, Inc., Tokyo, Japan) were employed as the PEM and gas diffusion layer (GDL), respectively. All chemicals and materials were used as received without further purification or treatment.

2.2. Preparation of MEA

To prepare the catalyst ink, a commercial Pt/C catalyst was mixed with deionized water, IPA, and the PFSA ionomer solution, followed by ultrasonic dispersion for 30 min to achieve a homogeneous mixture. The solid content of the catalyst ink was 2 wt.%, with a water-to-IPA mass ratio of 1:1. The I/C ratio was systematically varied to 0.4 (19.4 wt.%), 0.6 (26.5 wt.%), 0.8 (32.4 wt.%), 1.0 (37.5 wt.%), and 1.2 (41.9 wt.%) by precisely controlling the amount of ionomer solution added to the catalyst ink.
The PEM was placed on a pre-heated plate (set to 80 °C) to accelerate the evaporation of residual solvents from the ink. The catalyst ink was sprayed onto both sides of the PEM using a manual spray gun (IWATA HP-CH, Anest Iwata Corp., Yokohama, Japan) to prepare a catalyst-coated membrane (CCM). By regulating the spraying amount of the catalyst ink, the target Pt loadings on the cathode and anode were controlled at 0.3 and 0.1 mg cm–2, respectively, with the actual Pt loadings verified using X-ray fluorescence (XRF). To isolate the impact of the ionomer content on the cathode, the anode I/C ratio was fixed at 0.8, while the cathode I/C ratio was varied among 0.4, 0.6, 0.8, 1.0, and 1.2. The MEA with a designated active area of 5 cm2 was fabricated by sandwiching the CCM between two GDLs.

2.3. Characterization and Evaluation of MEA

The MEA, polytetrafluoroethylene (PTFE) gaskets, and graphite bipolar plates featuring a single serpentine flow field were assembled into the single cell under a compressive torque of 2 N·m. The compression ratio of the GDL was 18.4%. The electrochemical performance of the single cell was systematically evaluated using a fuel cell test system. Polarization curves were acquired using a fuel cell testing platform (Minitest 3000) coupled with an electronic load (PLZ164WA, Kikusui Electronics Corp., Yokohama, Japan). The other electrochemical properties and durability of the MEAs were tested using an electrochemical workstation (Energylab XM, Solartron Analytical, UK). Prior to formal testing, all MEAs were subjected to a comprehensive activation procedure until stable performance was achieved. The single cell was operated at a temperature of 80 °C and 100% RH.
During the polarization curve measurements, air and H2 were supplied to the cathode and anode at flow rates of 0.6 and 0.3 L min–1, respectively, under ambient pressure and a back pressure of 150 kPa. The voltage range for the polarization testing was from the open-circuit voltage to 0.3 V. The voltage losses in the polarization curve can be classified into activation overpotential loss, ohmic overpotential loss, and concentration overpotential loss. Therefore, the actual voltage can be calculated by Equation (1) [24].
E cell = E η act η ohm η con
where E cell is the actual voltage, E is the theoretical voltage, η act is the activation overpotential, η ohm is the ohmic overpotential, and η con is the concentration overpotential.
The ohmically corrected cell voltage E IR free can be determined directly from Equation (2) [25].
E IR free = E cell + iR Ω
where R Ω is the ohmic resistance used to correct the measured cell voltage for ohmic losses, and i is the current density. It should be noted that due to the absence of high-frequency resistance (HFR) detection tools, R Ω is derived from EIS curves, and it is assumed that the R Ω remains constant over the examined current density range.
Furthermore, considering the mixed potential coming from the oxidation of Pt and H2 crossover, according to the derivation of Liu et al. and Cai et al. [24,26], the above equation can be ultimately simplified to Equation (3).
E IR free = OCV blog i + i l i l η con
where i l is the H2 crossover current density, and b is the Tafel slope.
The activation overpotential was then obtained by fitting the Tafel region (low current density region, i < 0.2 A cm–2) using the Tafel equation ( η act = blog ( i   +   i l i l ) ). The remaining voltage loss at high current densities was attributed to concentration overpotential ( η con = OCV E IR free η act ).
The electrochemical impedance spectroscopy (EIS) curve was conducted at a constant current of 1 A (equivalent to 200 mA cm–2), with an AC amplitude of 30 mA. In these EIS measurements, the operating conditions remained consistent with those used in the polarization curve test. The frequency range of the EIS curve was from 104 Hz to 0.1 Hz. The EIS curves were conducted at a relatively low current density with sufficient gas supply, thereby minimizing mass transport limitations. Under these conditions, the overall electrochemical process was mainly controlled by the kinetics of the oxygen reduction reaction (ORR), and the corresponding Nyquist curves generally exhibited a single semicircular feature [27]. The acquired Nyquist curves were further analyzed using the distribution of relaxation times (DRT) method [28]. The DRT analysis was performed using DRT-tools, and the regularization parameter (λ) was 10–5. Before DRT analysis, the impedance data obtained from EIS testing were verified using the Kramers-Kronig relation. The relationship between the impedance Z(ω) and relaxation time g(τ) can be expressed as Equation (4) [29].
Z ω = R 0 + R pol 0 g τ 1 + iw τ d τ
Cyclic voltammetry (CV) curves were carried out in the potential range of 0 V to 1.0 V at a scan rate of 20 mV s–1. The cathode was fed with N2 at 100% RH and a flow rate of 0.1 L min–1, while the anode was fed with H2 under the same RH and flow conditions. The ECSA value was obtained by integrating the area of the hydrogen desorption peak in the CV curve [27].
The H2 permeation behavior of the PEM within the MEA could be characterized using linear sweep voltammetry (LSV). The LSV measurement was conducted under the same operating conditions as the CV test, except that the voltage was scanned from 0 V to 0.6 V at a scan rate of 2 mV s–1. With an increase in the applied voltage, H2 diffusing from the anode to the cathode is oxidized at the cathode, leading to a sharp rise in the current density, and reaches a limit current density when the voltage increases above 0.35 V [30]. Under the present experimental conditions, the H2 crossover current density was typically determined at 0.4 V.
The HN-EIS measured under an N2 atmosphere can be utilized to assess the proton conduction resistance within the CL. During the HN-EIS test, the cell operation temperature and gas supply were consistent with those during CV and LSV testing. Under these conditions, the Nyquist curve was obtained using the electrochemical workstation in potentiostatic EIS mode. The applied voltage was set at 0.2 V, with an AC amplitude of 1 mV and a frequency range from 2000 Hz to 0.2 Hz. The proton conduction resistance (Rproton) in the CL can be obtained using Equation (5) [31,32].
Z ω 0 = R Ω + R proton 3 + 1 jwC
where Z is the impedance, j is the imaginary unit, ω is the angular frequency, and C is capacitance.
The RΩ can be obtained based on the intersection of the high-frequency curve and the real axis, while the R Ω + R proton 3 can be obtained from the intersection point between the extension line of the low-frequency curve and the real axis [31,33]. Finally, the Rproton value is determined.
The AST was conducted according to the official U.S. Department of Energy (DOE) protocol [34]. A square wave cycle protocol between 0.95 V and 0.6 V at a sweep rate of 350 mV s–1. A square wave cycle takes 8 s. During the AST, the cathode and anode were continuously supplied with fully humidified N2 (0.1 L min–1) and H2 (0.1 L min–1), respectively. Electrochemical performance was evaluated after 0, 1000, 3000, and 5000 cycles to monitor degradation characteristics.
The surface morphology of fresh CLs with various I/C ratios was observed using scanning electron microscopy (SEM, JSM 7800, JEOL Ltd., Tokyo, Japan). Both fresh and post-operation cathode CLs were carefully detached from the PEM, and subsequently characterized via transmission electron microscopy (TEM, Talos-F200X, Thermo Fisher Scientific, Waltham, MA, USA).

3. Results

3.1. Structural Properties of CL

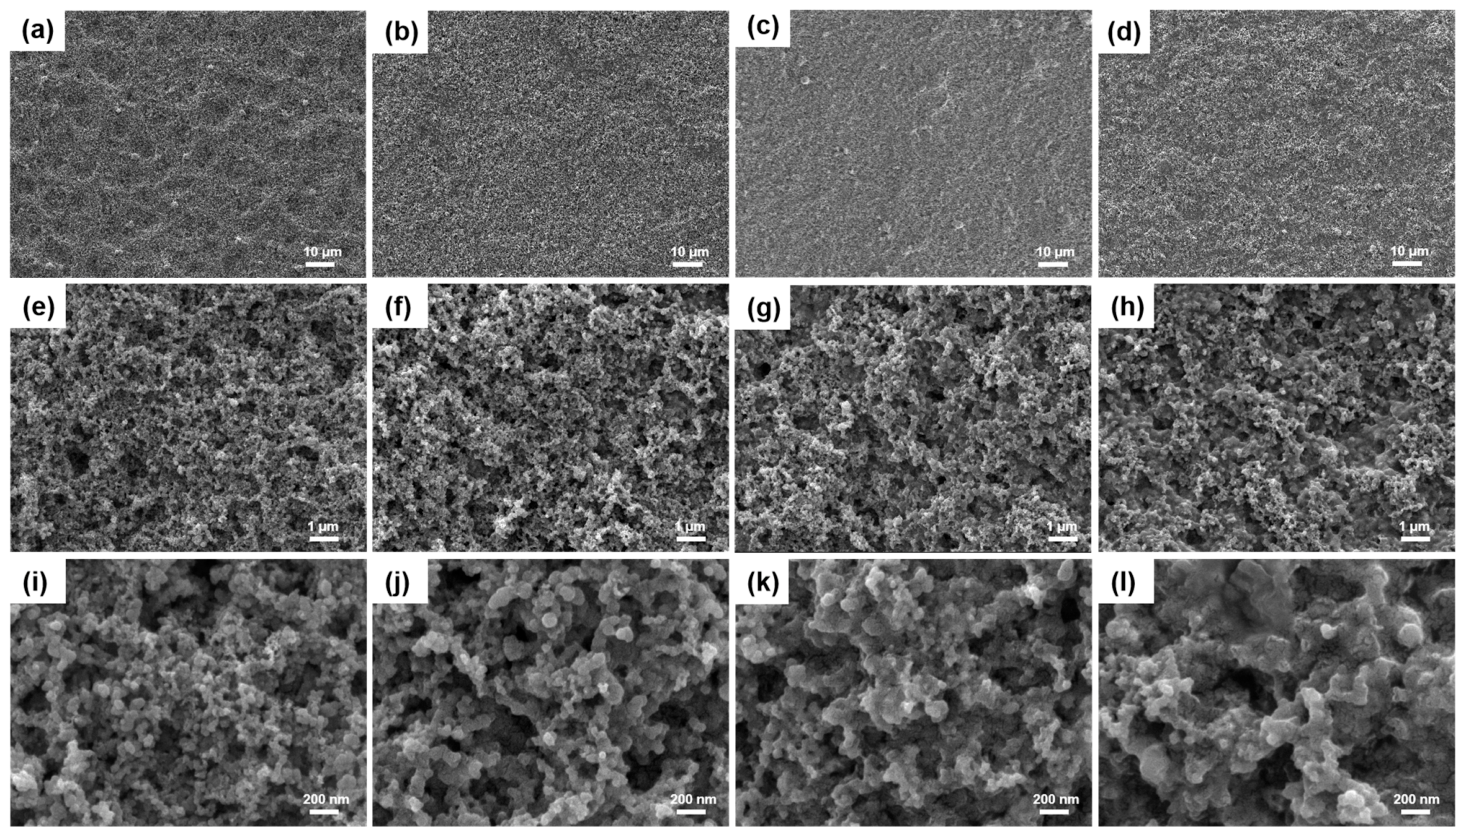
To investigate the effect of ionomer content on the structure of CL, the surface morphology of CL prepared by the spray coating method was characterized using SEM, as shown in Figure 1. As depicted in Figure 1a–d, the CL surface progressively becomes smoother with increasing I/C ratio, which is primarily attributed to the increased viscosity and yield stress of the catalyst ink [10]. The surface of CL with an I/C ratio of 0.4 was the roughest, which may affect the interface contact between the CL and the GDL and increase the contact resistance within the MEA. From Figure 1e–h, it can be observed that the size of aggregates increases with I/C ratio, while the pore size gradually decreases. It is worth noting that in Figure 1l, the ionomer forms a continuous coating layer on the surface of the catalyst particles, and obvious ionomer aggregation occurs. These images indicate that the ionomer content influences the CL structure, which is expected to affect electrochemical reactions and mass transport in the CL.

3.2. Impact of I/C Ratio on Performance of MEA

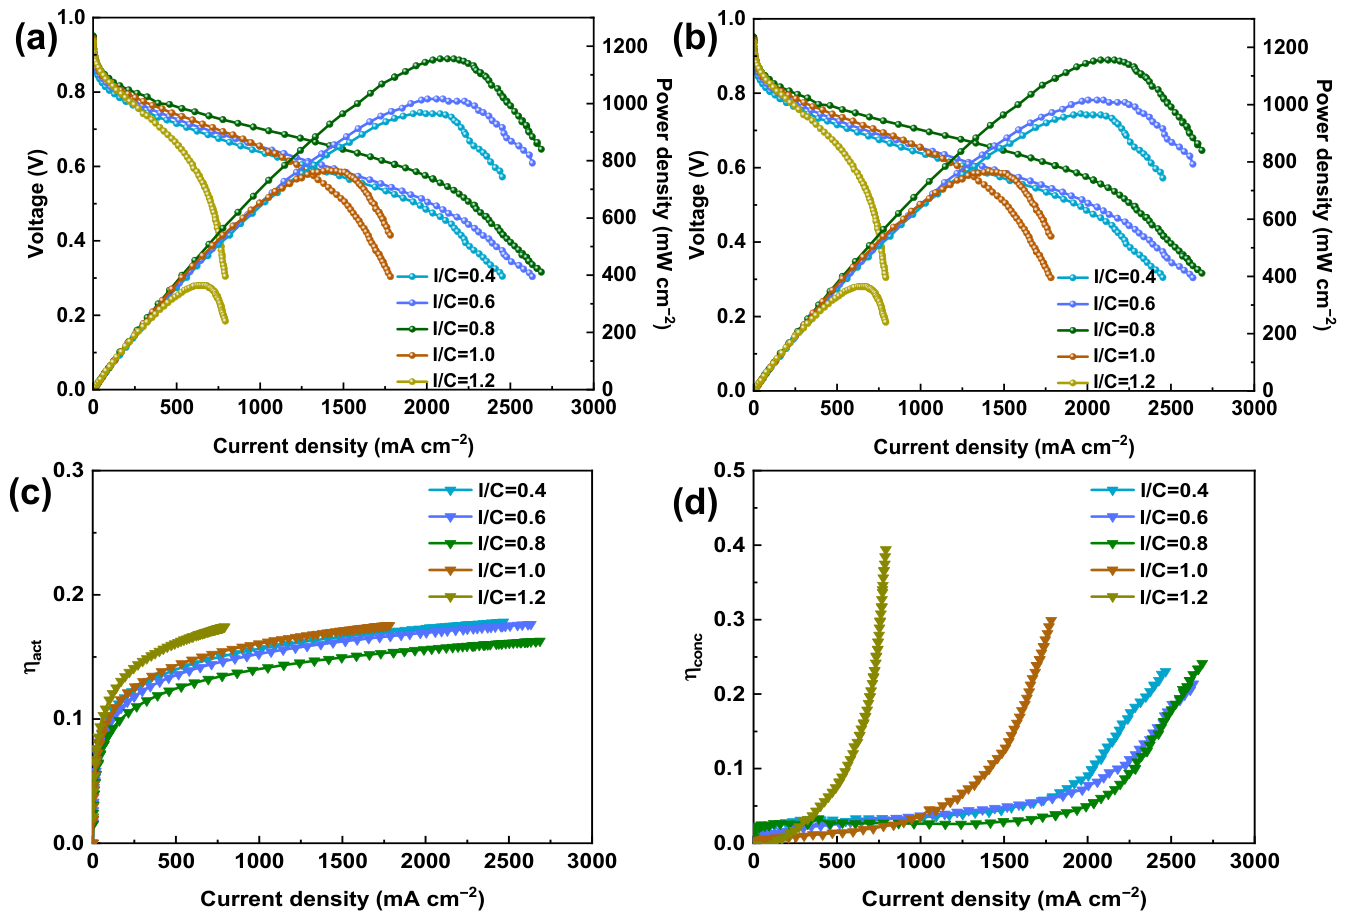
The structure and components of the CL can affect the performance of PEMFCs. Figure 2a,b shows the polarization curves of MEAs with different I/C ratios at 0 kPa and 150 kPa, respectively. For the MEA with I/C = 0.8, its peak power was highest at both 0 kPa and 150 kPa. When the backpressure was increased from 0 kPa to 150 kPa, the peak power of MEAs with I/C ratios of 0.4, 0.6, 0.8, 1.0, and 1.2 increased by 101.6%, 62.8%, 60.5%, 90.1%, and 78.4%, respectively. Notably, while the MEA with I/C = 0.8 exhibited the best performance, it had the smallest relative increase under high backpressure. This suggests that higher operating backpressure can indeed alleviate the negative effects of an I/C ratio imbalance on kinetics and mass transfer losses to a certain extent, though it cannot completely eliminate the performance differences between the MEAs with different I/C ratios. The activation overpotential (ηact) (Figure 2c) and concentration overpotential (ηconc) curves (Figure 2d) were separated from the polarization curve in Figure 2b. As the I/C ratio increases from 0.4 to 0.8, the peak power density increases. Moreover, the MEA with an I/C ratio of 0.4 has a higher activation loss, which may be related to the low ionomer content in the CL. Some Pt particles failed to contact the ionomer, becoming ineffective catalysts for proton isolation, greatly limiting the number of effective TPBs. As the I/C ratio is elevated to 0.8, the continuity of the ionomer network in the CL is improved, leading to enhanced Pt utilization. The MEA with an I/C ratio of 0.8 exhibited optimal electrochemical performance, with a maximum peak power density of 1156 mW cm–2. Further increasing the I/C ratio to 1.0 and 1.2, the peak power density decreases significantly. At high current densities, the MEAs with I/C ratios of 1.0 and 1.2 show rapid performance degradation. As observed in Figure 2c,d, the MEAs with higher I/C ratios (1.0 and 1.2) display higher activation and concentration overpotentials. This is primarily attributed to the detrimental effects of excessive ionomer within the CL. On the one hand, excessive ionomer can encapsulate the catalyst particles, reducing the number of active sites and leading to a higher activation overpotential. On the other hand, excessive ionomer can block the pores within the CL, hindering the transport of gas and water, resulting in severe concentration overpotential [18,35,36]. Therefore, optimizing the I/C ratio is crucial to minimize both activation and concentration overpotentials. A specific optimal I/C ratio exists where these overpotentials are concurrently kept at their lowest values, leading to superior overall cell performance.
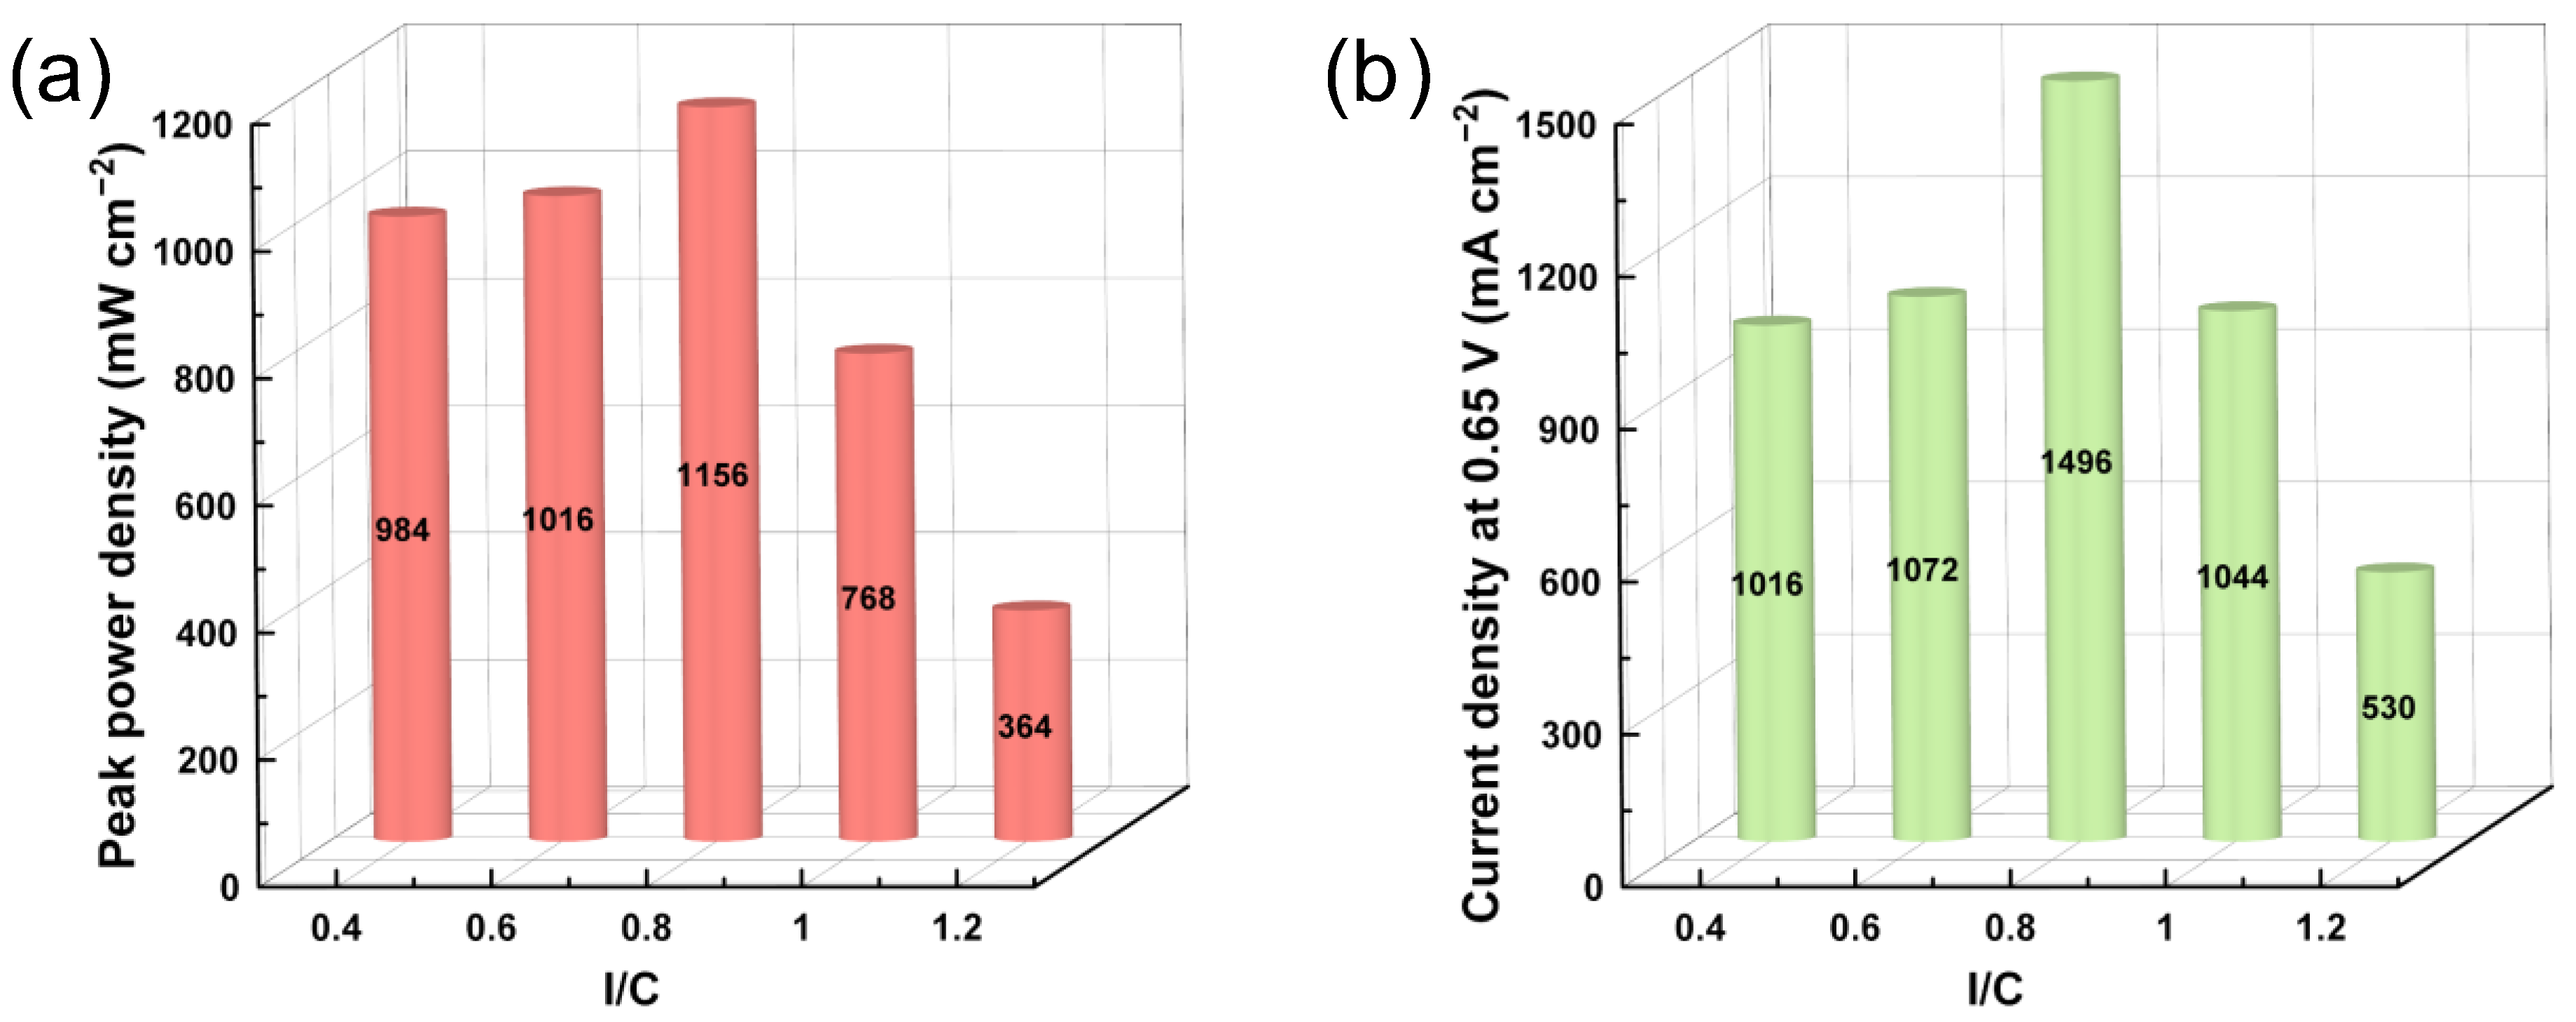
Figure 3a shows the peak power density of MEAs with various I/C ratios under a back pressure of 150 kPa, while Figure 3b displays the corresponding current density under a medium voltage condition of 0.65 V. Both sets of bar charts exhibit a trend of first increasing and then decreasing sharply as the I/C ratio increases. Analysis of Figure 2 and Figure 3 shows that the MEA with an I/C ratio of 0.8 delivered the optimal fuel cell performance under the present experimental conditions.
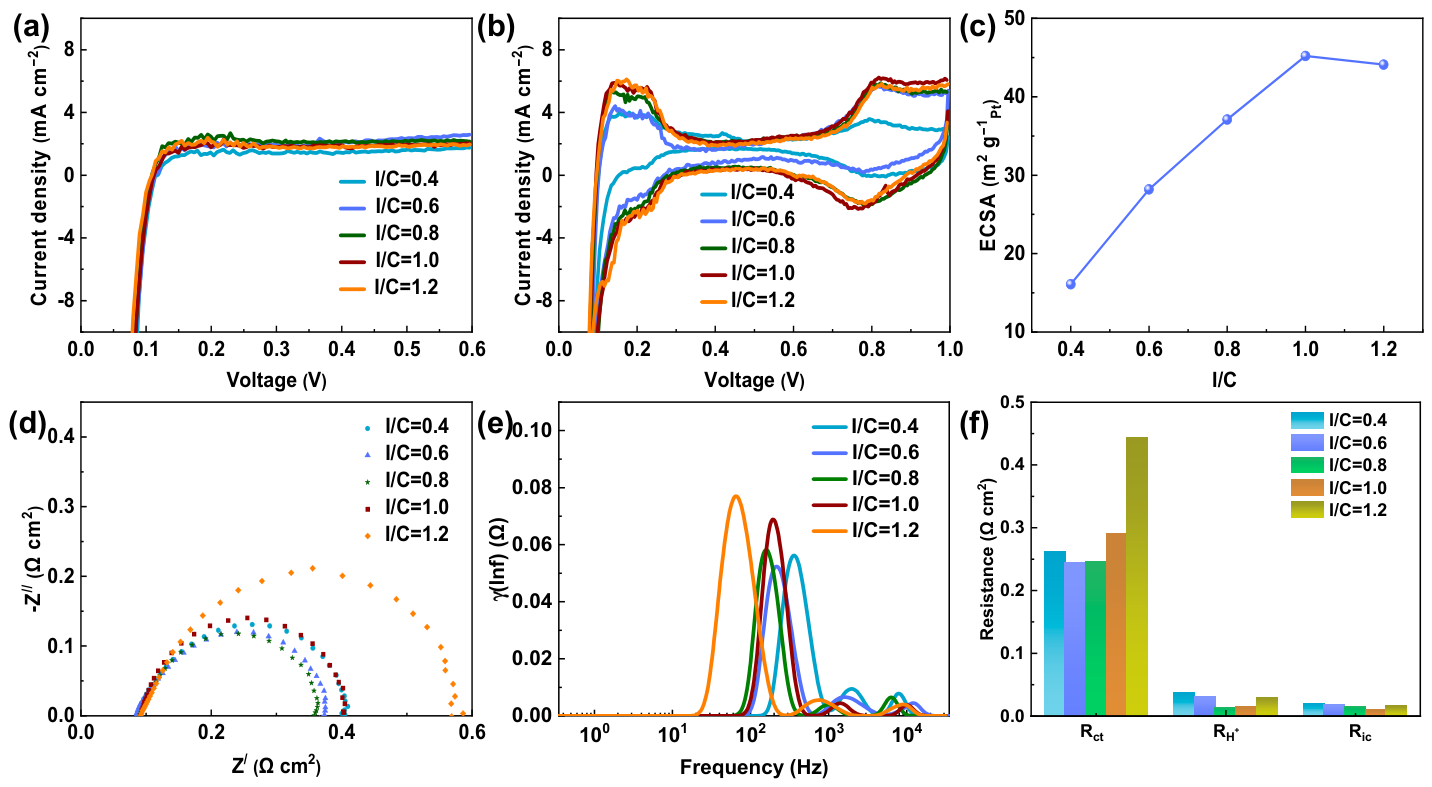
Figure 4a shows the LSV curves of five MEAs. Due to the high diffusion coefficient of H2 within both the gas phase and the ionomer, along with the absence of water production during the hydrogen oxidation reaction (HOR) (unlike the cathode, where water generation causes flooding and additional mass transport limitations), the anode potential exhibits significantly lower sensitivity to the catalyst state and mass transfer conditions in the CL compared to the ORR. Additionally, the H2 crossover current density is primarily determined by the gas barrier ability of the PEM. As shown in Figure 4a, no significant differences in H2 crossover current density or internal short-circuit resistance were observed among the five MEAs. Therefore, differences in gas and electron barrier capabilities caused by the PEM among these MEAs can be ignored.
The ECSA is one of the main factors affecting the performance of fuel cells. Figure 4b shows the CV curves of MEAs with various I/C ratios. The ECSA values can be derived from the integrated area of hydrogen desorption peaks of the CV curves. As shown in Figure 4c, the ECSA values of MEAs with I/C ratios of 0.4, 0.6, 0.8, 1.0, and 1.2 were 16.1, 24.2, 37.1, 45.2, and 44.1 m2 gPt–1, respectively. For the MEA with an I/C ratio of 0.4, the ECSA value was the lowest, which was attributed to insufficient ionomer in the CL and an incomplete proton conduction network, resulting in some Pt not being in contact with ionomer and being difficult to exert catalytic activity, leading to a relatively low ECSA [18,36]. As the I/C ratio increased from 0.4 to 1.0, the ECSA showed an upward trend. This improvement can be attributed to the enhanced continuity of the proton conduction network in the CL as the I/C ratio is progressively increased, which facilitates higher Pt utilization [37]. Although the MEA with an I/C of 1.0 has the highest ECSA value, its performance is not as good as the MEA with an I/C ratio of 0.8, indicating that ECSA was not a critical factor affecting the ORR kinetic process. In the actual operating environment of fuel cells, the performance of the cell is determined by catalytic reaction kinetics, proton conduction, electron conduction, and reactant gas transport. The presence of more ionomer in CL significantly increases the transport resistance of O2, especially at high current densities, which exacerbates the limitation of gas mass transfer and leads to rapid increases in concentration polarization [38]. However, once the I/C ratio exceeded 1.0, a slight decline in ECSA is observed. Similar phenomena have been reported by Kim et al. [35] and Saidin et al. [36], potentially due to excessive ionomer coating on Pt particles and the blockage of gas transport channels.
Figure 4d,e show the EIS curves and corresponding DRT analysis results of MEAs with various I/C ratios. Due to the EIS testing at 200 mA cm–2, the polarization curve is still in the kinetics-dominant region, and the concentration overpotential can be ignored (as shown in Figure 2). Therefore, the mass transfer resistance (Rmt) is negligible under these tested conditions. The DRT peaks are correlated with specific physicochemical processes on the basis of interpretations reported in the literature. According to Yuan et al. [39], the first peak in the frequency range of approximately 102–103 Hz corresponds to the charge-transfer resistance (Rct) associated with the ORR. The subsequent two peaks at higher frequencies are assigned to the proton transfer process inside the cathode CL ionomer (RH+) and the contact process between the electrode and the PEM (Ric), respectively. It should be emphasized that these peak assignments are primarily grounded in the literature precedents and kinetic rationality, rather than being validated through independent control experiments that isolate each transport process. Consequently, the above interpretations, while providing physically meaningful insights into the underlying kinetic processes, should be regarded as tentative at the current stage.
The integrated results of each resistance were summarized in Figure 4f. It can be observed that with the increase in I/C ratio, Rct and RH+ both exhibit a V-shaped trend, first decreasing and then increasing. Specifically, the RH+ for the MEA with an I/C ratio of 0.4 exhibits the highest value among all samples. This can be attributed to the insufficient ionomer content in the CL, which leads to discontinuous proton transport channels and thus increases the proton transfer resistance. When the I/C increases from 0.4 to 0.8, the ionomer provides a crucial proton transport channel and increases the effective reactive site, which optimizes reaction kinetics and leads to a continuous decrease in Rct and RH+. However, when the I/C ratio increased to 1.0, the ionomer no longer solely formed efficient proton transport channels but began to exert negative effects, such as covering the active sites of the catalyst, hindering the transport of electrons, reaction gases, and water within the CL, reducing the effective reaction interface, and thus increasing Rct [17]. It should be noted that there are discrepancies between the activation loss calculated from the DRT-derived Rct in Figure 4f and the activation loss in Figure 2c. The primary origins of this difference lie in fundamental differences in testing conditions, measurement principles, and underlying assumptions between the two characterization methods. The EIS-DRT results are measured at an individual steady-state point (200 mA cm−2), while the ηact obtained from polarization curves is acquired under quasi-steady-state scanning over a broad current density range, where the Tafel behavior, local reactant partial pressure, catalyst surface coverage, and interfacial environment dynamically change with current density. Therefore, these fundamental differences lead to unavoidable quantitative divergences.
For the MEA with an I/C ratio of 0.4, the insufficient ionomer content in the CL failed to adequately connect Pt particles, resulting in the highest RH+, which seriously affected overall performance. As the I/C ratio increased from 0.4 to 1.0, RH+ decreased significantly. When the I/C ratio reached 1.0, the ionomer content was close to a saturated state [40]. From the SEM images in Figure 1k, it can be seen that almost all surfaces of catalyst particles in the CL were covered by ionomer at an I/C ratio of 1.0, and a small amount of ionomer aggregation began to occur locally. Although increasing the I/C ratio from 0.8 to 1.0 increased ECSA, the overall cell performance declined due to excessive ionomer coverage that blocks gas transport pathways and creates larger ηconc. Thus, the optimal state is the balanced three-phase boundary where sufficient ionomer network connectivity for proton transport is achieved without compromising gas accessibility to the Pt active sites [40]. Interestingly, when the I/C ratio was increased to 1.2, RH+ began to rise. The increase in RH+ at excessive I/C ratios arises from multiple microstructural factors. Excess ionomer tends to form local agglomerates on the carbon surfaces rather than a uniform film, degrading the connectivity of the proton-conducting channels [41]. Meanwhile, morphological changes and pore blockage caused by excess ionomer diminish the accessibility of proton transport within the CL. This phenomenon is consistent with the observations of Li et al. [19], who explained that there is an upper limit to the continuity of the ionomer network as the I/C ratio increases beyond its optimal range. According to the previous analysis, the Rmt, Rct, and RH+ all showed a trend of decreasing first and then increasing, indicating that more ionomer was not always better. Exceeding the optimal content would have negative effects, ultimately affecting cell performance.
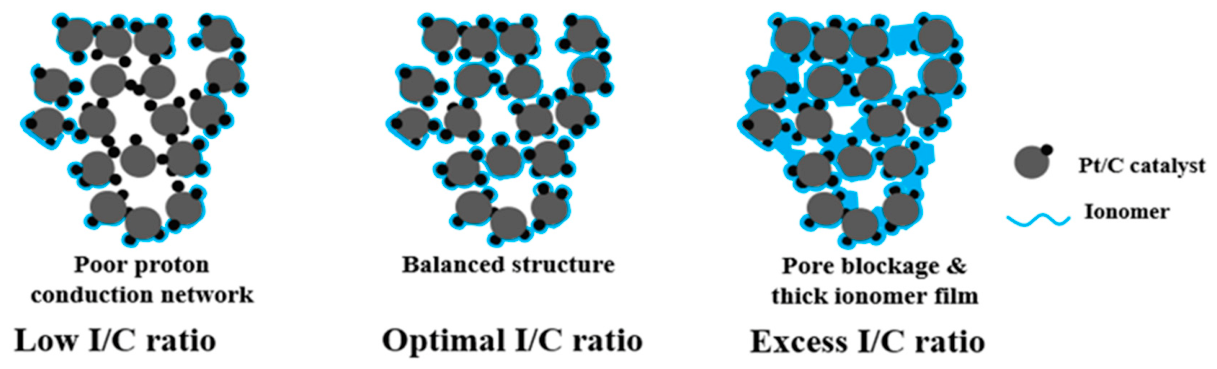
Through the above discussion, we can obtain the schematic diagrams of the morphology of the cathode CL under various I/C conditions (Figure 5). When the ionomer content is too low, most catalyst particles fail to contact the ionomer, resulting in discontinuous proton transport channels, low proton transport efficiency, and poor catalyst utilization. Conversely, when ionomer is in excess, although catalyst particles can interact with the ionomer, the CL is covered with an excessively thick ionomer layer, and numerous pores are filled with ionomer. This excessively thick ionomer film and low CL porosity impair electron and gas transport [37]. The CL with high performance should construct a reasonable TPB to achieve efficient transport of reaction gases, electrons, protons, and product water. Therefore, precise control of the ionomer content in the CL is necessary to simultaneously optimize proton conduction, gas transport, and active site utilization. Taking into account the aforementioned key parameters, it is concluded that an I/C ratio of 0.8 is optimal for the electrochemical performance of the CL.

3.3. Impact of I/C Ratio on MEA Durability

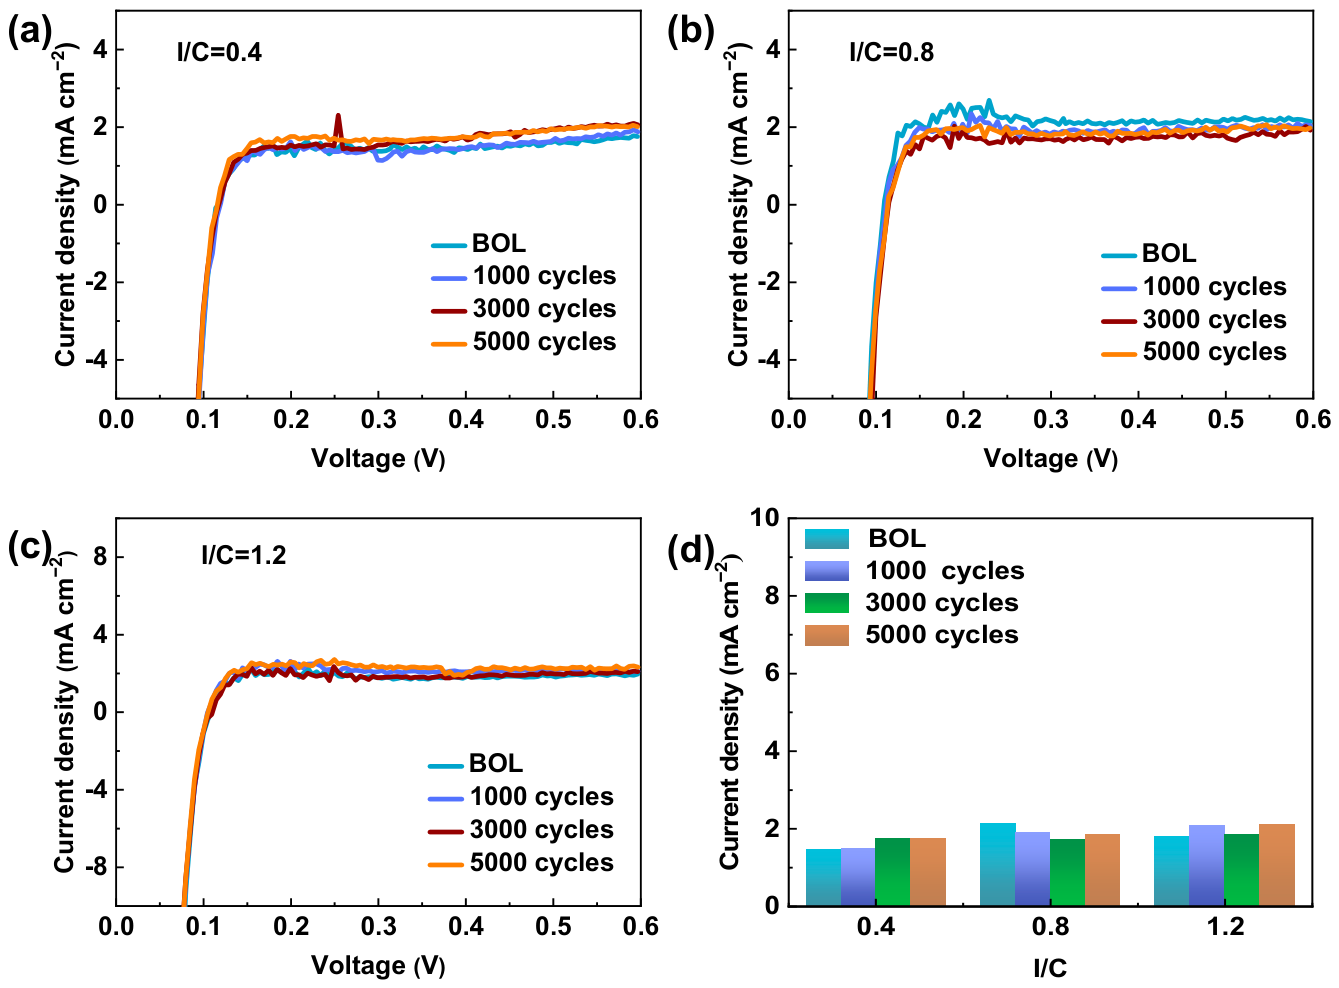
This section focuses on the impact of the I/C ratio on the durability of MEA. The AST was performed according to United States DOE protocols to evaluate the durability of MEAs with various I/C ratios. As shown in Figure 6, no significant or systematic increase in the H2 crossover current densities of the MEAs throughout the AST stages. This indicates that PEM degradation was negligible, allowing the following discussion to focus primarily on the impact of CL degradation on the overall MEA performance loss.
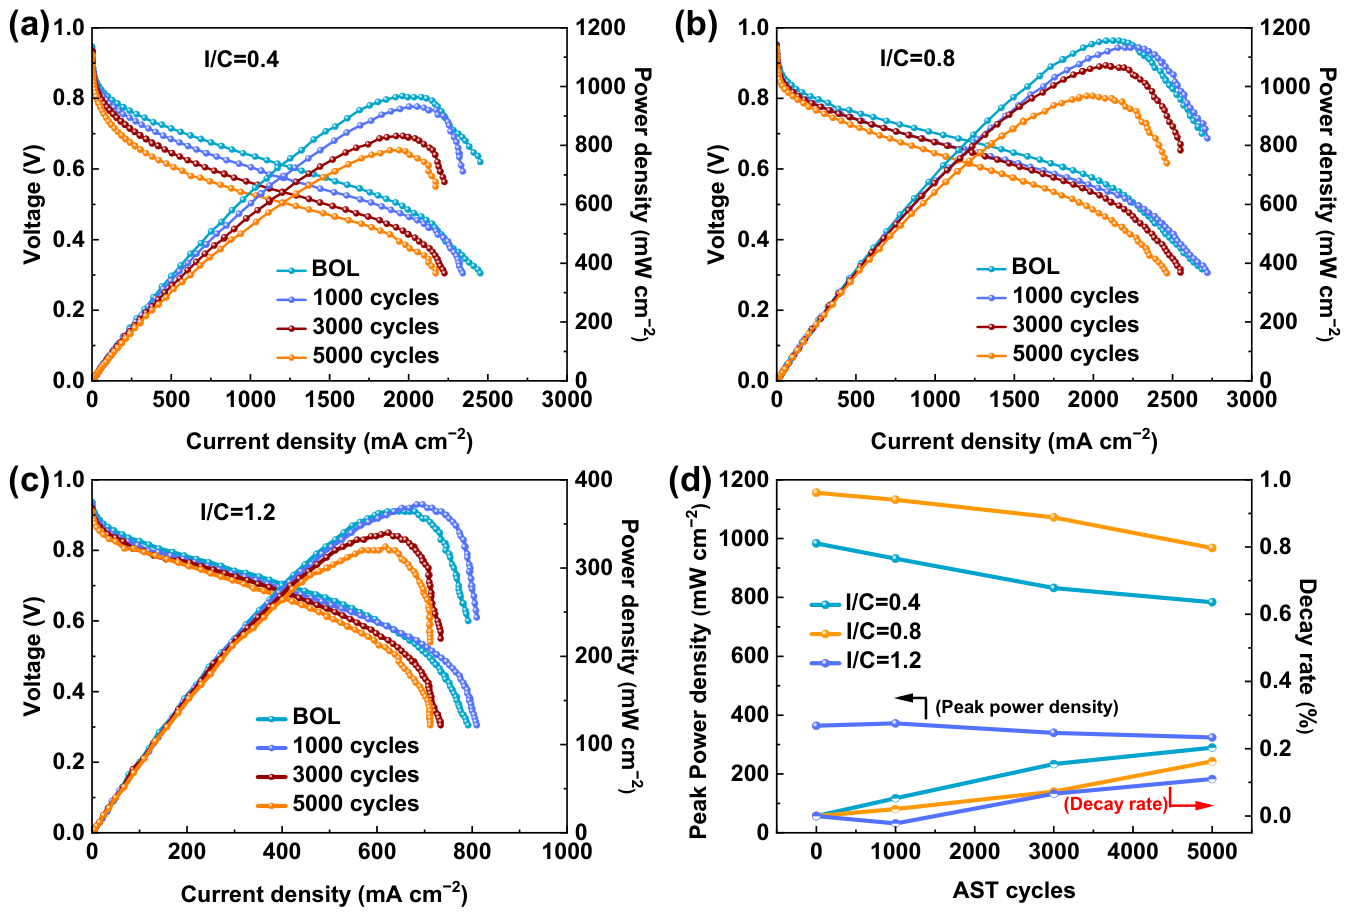
During the AST process, the Pt/C catalyst exhibits several degradation modes, including carbon corrosion and Pt particle migration and growth. Figure 7a–c shows that the MEAs with I/C ratios of 0.4, 0.8, and 1.2 all exhibited a certain performance degradation after voltage cycling. The MEA with an I/C ratio of 0.4 displayed the most significant performance degradation. After 5000 voltage cycles, its peak power density decreased by 20.3%, higher than that of MEAs with I/C ratios of 0.8 (16.2%) and 1.2 (11.0%).
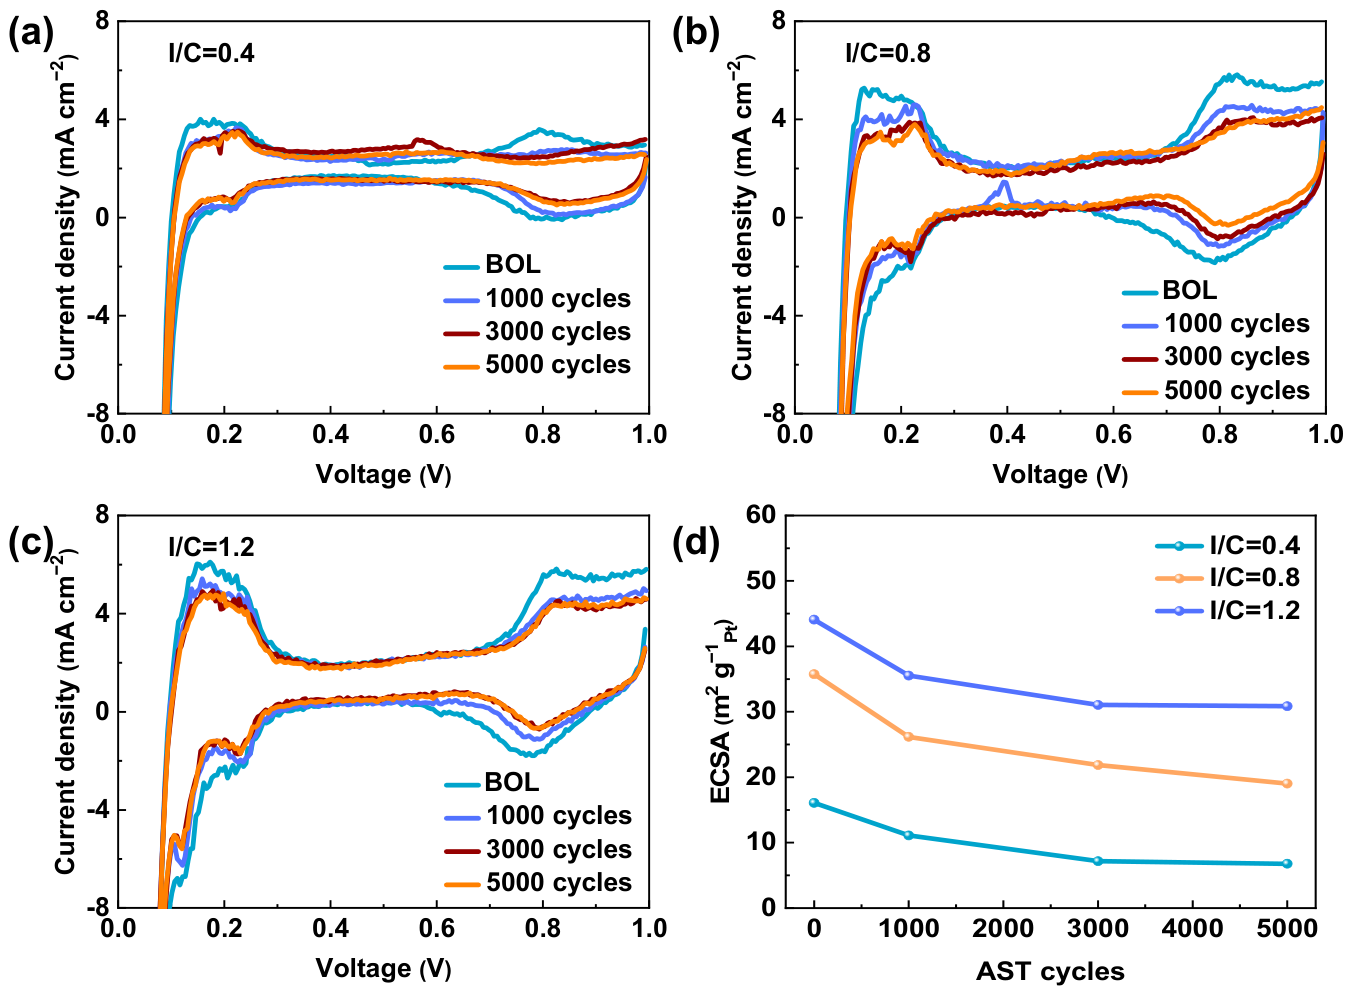
Figure 8 shows the CV curves and ECSA values of MEAs with I/C ratios of 0.4, 0.8, and 1.2 during the AST process. All MEAs showed significant ECSA value decay after the first 1000 voltage cycles, with values of 30.8%, 26.8%, and 19.4%, respectively, as shown in Table 1. The AST protocol employed in this study intensified the dissolution and redeposition of Pt particles through continuous voltage cycling, which facilitated the Ostwald ripening effect and led to an overall increase in the size of Pt particles. Following the initial 1000 cycles, the redeposited Pt particles exhibited enhanced electrochemical stability, effectively mitigating the rate of Ostwald ripening [27]. Consequently, the pace of ECSA decay decelerated during 3000 and 5000 cycles. Derived from the ECSA decay rates, the final retention rates after 5000 cycles for MEAs with I/C ratios of 0.4, 0.8, and 1.2 were 42.2%, 53.3%, and 70.0%, respectively. For the MEA with an I/C ratio of 0.4, the lower ionomer content caused the CL to fail to form a continuous ionomer network, resulting in a lower initial ECSA value. In addition, during the AST process, more carbon support was exposed to high potential (0.95 V), leading to a carbon corrosion reaction (C + 2H2O → CO2 + 4H+ + 4e). As the carbon support underwent corrosion, Pt particles anchored to its surface detached and aggregated due to the loss of structural support. The ECSA of the MEA with the lowest I/C ratio (0.4) exhibited the most rapid decline as the number of voltage cycles increased. The MEA with an I/C ratio of 1.2, it exhibited the highest initial ECSA value and maintained the highest ECSA initial value and retention rate after 5000 voltage cycles. The MEA with an I/C ratio of 0.8 exhibited ECSA initial values and retention rates that fell between those of the MEAs with I/C ratios of 0.4 and 1.2. This suggests that ionomer plays a positive role in stabilizing catalyst active sites [42,43]. This is because the presence of ionomer significantly inhibits Pt migration and carbon corrosion [42,44], thereby improving the durability of the CL.
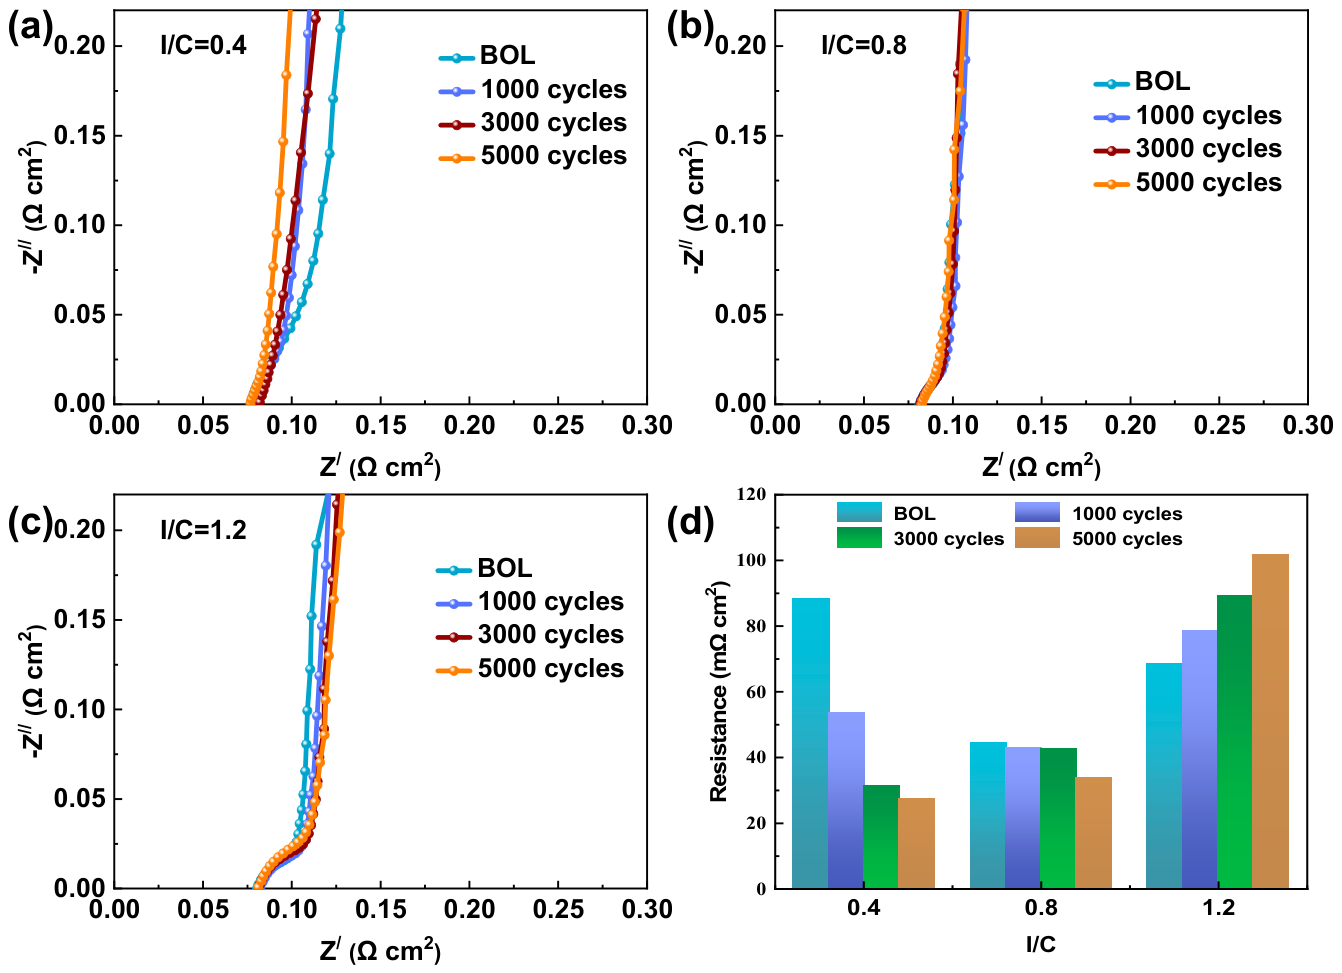
To further investigate the effect of I/C ratio on proton conduction in the CL, we tested the HN-EIS curves of MEAs in a H2-N2 gas environment under non-power generation conditions (Figure 9a–c). As shown in Figure 9d, the initial Rproton for the MEAs with I/C ratios of 0.4, 0.8, and 1.2 were 88.2, 44.4, and 68.7 mΩ cm2, respectively. Initially, increasing the ionomer content enhanced the continuity of the ionomer network in the CL, thereby reducing the Rproton. However, for the MEA with an I/C ratio of 1.2, excessive ionomer covered the catalyst surface, forming local aggregates and causing pore blockage, which reduced the accessibility of proton transport and led to an increase in Rproton [19]. During the AST process, the forced current flow promotes the formation of a water-filled continuous ionomer network [45]. In addition, accompanied by the aggregation and migration of Pt nanoparticles and carbon corrosion, this results in the reorientation or structural rearrangement of ionomer side chains, gradually forming a more interconnected proton-conducting network [9,41]. The impact of this structural evolution varied with the I/C ratio. For the MEA with an I/C ratio of 0.4, a more interconnected proton conduction network was gradually established during the voltage cycling process, resulting in a decrease in Rproton. For the MEA with an I/C ratio of 0.8, the initial ionomer network was almost continuous, so the rearrangement effect was less pronounced, only leading to a moderate decrease in Rproton (from 44.4 to 33.9 mΩ cm2). For the MEA with an I/C ratio of 1.2, the ionomer tended to aggregate further, thereby reducing the accessibility of proton transport, resulting in an increase in proton conduction resistance (from 68.7 to 101.7 mΩ cm2).
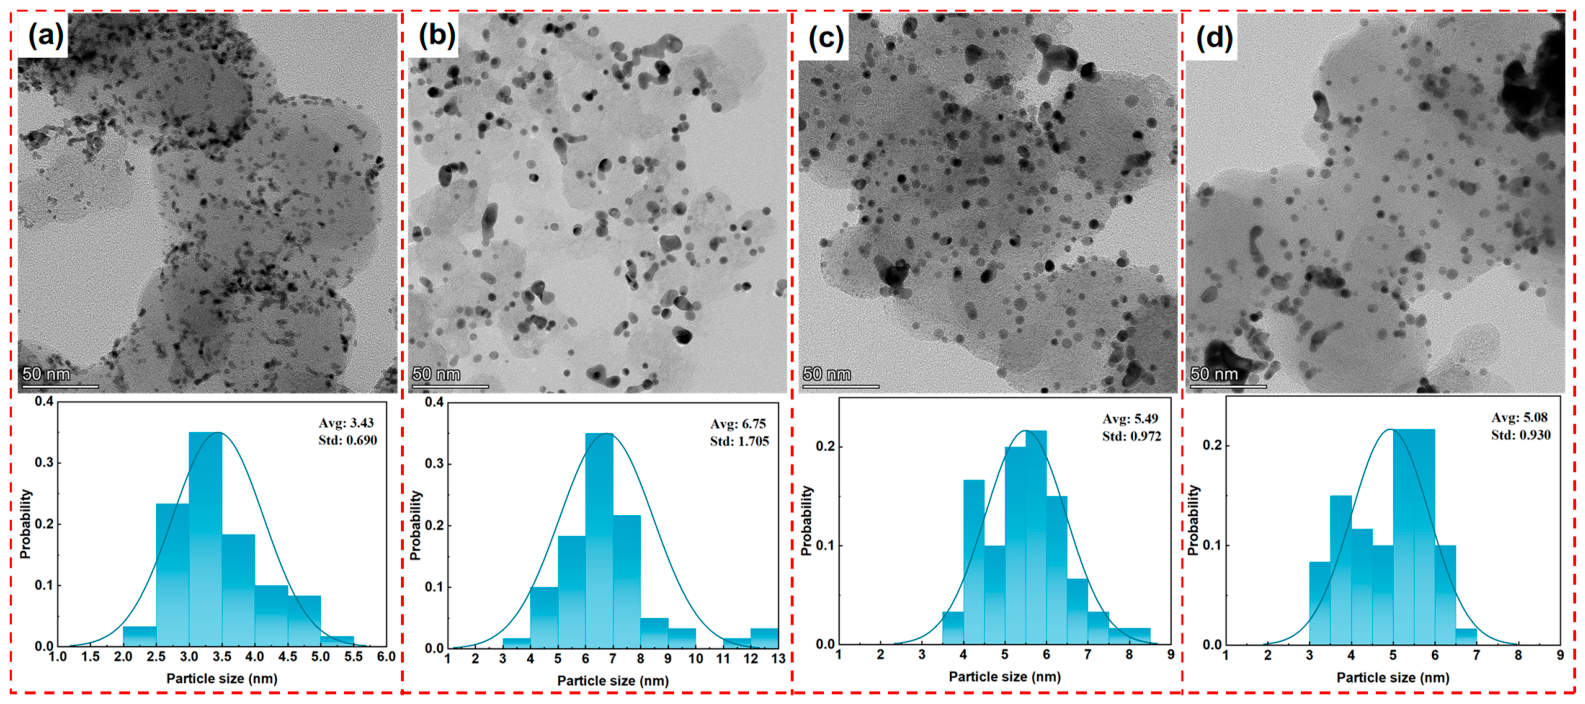
The AST protocol employed here accelerates Ostwald ripening, a process characterized by the dissolution of Pt from smaller particles and its redeposition on larger ones [27,46]. As shown in Figure 10, TEM images were utilized to compare the microstructures of the cathode CLs before and after 5000 square-wave cycles (0.6–0.95 V). Particle size distributions were statistically analyzed using Velox software (v3.18.0) by manually outlining particle contours, with approximately 60 individual particles measured per sample to ensure statistical reliability. In the pristine CL (initial state), Pt nanoparticles were uniformly dispersed on the carbon support with an average size of 3.43 nm (Figure 10a). After 5000 cycles, Pt nanoparticles across all MEAs with different I/C ratios underwent significant coarsening (Figure 10b–d), exhibiting a clear dependence on the I/C ratio. Specifically, for MEAs with I/C ratios of 0.4, 0.8, and 1.2, their average Pt particle sizes increased to 6.75 nm, 5.49 nm, and 5.08 nm, respectively. Notably, the extent of particle growth was negatively correlated with the I/C ratio. The MEA with an I/C ratio of 0.4 exhibited pronounced coarsening and the broadest size distribution, indicating intense Ostwald ripening coupled with significant Pt particle migration and aggregation. In contrast, in the MEA with an I/C ratio of 1.2, the high ionomer content likely prolonged the diffusion pathway of Pt2+, thereby mitigating the redeposition rate and minimizing particle growth. These results demonstrate that the ionomer not only serves as a binder and proton conductor in the CL, but more importantly, it also governs the coarsening kinetics of Pt particles during electrochemical aging. Consequently, optimizing the I/C ratio in the cathode CL is a crucial strategy for mitigating catalyst degradation and enhancing the durability of PEMFCs.

4. Conclusions

This study systematically investigated the impact of the I/C ratio (0.4–1.2) on the cathode CL structure, electrochemical performance, and durability of MEAs. The results reveal that at a low I/C ratio of 0.4, insufficient ionomer coverage leads to elevated ηact and ηconc, as well as increased Rct and RH+. With the increase in ionomer content, Rct and RH+ follow a V-shaped trend with the coupling effect of ionomer network continuity and ionomer film thickening. At an I/C ratio of 1.2, excessive ionomer covered the active sites and blocked the pores in the CL, causing Rct to reach maximum values. Consequently, the MEA with an I/C ratio of 0.8 exhibited the optimal electrochemical performance, achieving a peak power density of 1156 mW cm–2. After durability tests consisting of 5000 voltage cycles, all MEAs showed increased Pt particle size and ionomer rearrangement. A higher content of ionomer in the CL significantly improved performance stability and inhibited Ostwald ripening of Pt particles. The MEA with an I/C ratio of 0.8 demonstrated the smallest change in Rproton (from 44.4 to 33.9 mΩ cm2). In summary, an I/C ratio of 0.8 is identified as the optimal composition for the cathode CL, striking a balance between high initial power density and superior electrochemical durability. This work provides critical guidance for the precise regulation of ionomer content in the cathode CL and establishes a foundation for future studies into gradient ionomer architectures to further extend the performance and lifespan of PEMFCs.

Author Contributions

Conceptualization, methodology, investigation, formal analysis, validation, and writing—original draft, Y.X.; data collection and analysis, Z.F., Y.L. and B.Y.; visualization, methodology, supervision, project administration, funding acquisition, and writing—review and editing, H.L. All authors have read and agreed to the published version of the manuscript.

Funding

This work was funded by the National Natural Science Foundation of China, grant number 22179084, and the Anhui Provincial Major Industrial Innovation Plan, grant number AHZDCYCXJH-QC2024-04.

Data Availability Statement

The original contributions presented in the study are included in the article; further inquiries can be directed to the corresponding author.

Acknowledgments

The authors gratefully acknowledge the Analysis and Testing Center of Shanghai Jiao Tong University for providing support for material characterization.

Conflicts of Interest

The authors declare no conflicts of interest.

References

  1. Lü, X.; Qu, Y.; Wang, Y.; Qin, C.; Liu, G. A comprehensive review on hybrid power system for PEMFC-HEV: Issues and strategies. Energy Convers. Manag. 2018, 171, 1273–1291. [Google Scholar] [CrossRef]
  2. Guo, Y.; Pan, F.; Chen, W.; Ding, Z.; Yang, D.; Li, B.; Ming, P.; Zhang, C. The Controllable Design of Catalyst Inks to Enhance PEMFC Performance: A Review. Electrochem. Energy Rev. 2020, 4, 67–100. [Google Scholar] [CrossRef]
  3. Hao, C.; Meng, Q.; Yan, B.; Liu, J.; Yang, B.; Feng, L.; Shen, P.K.; Tian, Z.Q. Efficient catalyst layer with ultra-low Pt loading for proton exchange membrane fuel cell. Chem. Eng. J. 2023, 472, 144945. [Google Scholar] [CrossRef]
  4. Ren, H.; Meng, X.; Lin, Y.; Shao, Z. Microstructure formation mechanism of catalyst layer and its effect on fuel cell performance: Effect of dispersion medium composition. J. Energy Chem. 2022, 73, 588–598. [Google Scholar] [CrossRef]
  5. Okonkwo, P.C.; Ben Belgacem, I.; Emori, W.; Uzoma, P.C. Nafion degradation mechanisms in proton exchange membrane fuel cell (PEMFC) system: A review. Int. J. Hydrogen Energy 2021, 46, 27956–27973. [Google Scholar] [CrossRef]
  6. Wang, C.; Cheng, X.; Yan, X.; Shen, S.; Ke, C.; Wei, G.; Zhang, J. Respective Influence of Ionomer Content on Local and Bulk Oxygen Transport Resistance in the Catalyst Layer of PEMFCs with Low Pt Loading. J. Electrochem. Soc. 2019, 166, F239–F245. [Google Scholar] [CrossRef]
  7. Kim, T.-H.; Yoo, J.H.; Maiyalagan, T.; Yi, S.-C. Influence of the Nafion agglomerate morphology on the water-uptake behavior and fuel cell performance in the proton exchange membrane fuel cells. Appl. Surf. Sci. 2019, 481, 777–784. [Google Scholar] [CrossRef]
  8. Cho, M.K.; Park, H.Y.; Lee, S.Y.; Lee, B.S.; Kim, H.J.; Henkensmeier, D.; Jang, J.H. Effect of Catalyst Layer Ionomer Content on Performance of Intermedi-ate Temperature Proton Exchange Membrane Fuel Cells (IT-PEMFCs) under Reduced Humidity Conditions. Electrochim. Acta 2017, 224, 228–234. [Google Scholar] [CrossRef]
  9. Huang, X.; He, Y.; Sun, Y.; Sun, L.; Wang, T.; Zhang, X. Gradient ionomer designed cathode catalyst layer for proton exchange membrane fuel cells with enhanced performance. J. Power Sources 2024, 603, 234488. [Google Scholar] [CrossRef]
  10. Liu, P.; Li, B.; Yang, D.; Zhang, C.; Ming, P. New insights on the agglomeration and sedimentation behaviours of catalyst ink of proton exchange membrane fuel cells affected by ionomers concentration. J. Power Sources 2023, 556, 232427. [Google Scholar] [CrossRef]
  11. Chen, D.; Kongkanand, A.; Jorne, J. Proton Conduction and Oxygen Diffusion in Ultra-Thin Nafion Films in PEM Fuel Cell: How Thin? J. Electrochem. Soc. 2019, 166, F24–F33. [Google Scholar] [CrossRef]
  12. Modestov, A.D.; Kapustin, A.V.; Avakov, V.B.; Landgraf, I.K.; Tarasevich, M.R. Cathode catalyst layers with ionomer to carbon mass ratios in the range 0–2 studied by electrochemical impedance spectroscopy, cyclic voltammetry, and performance measurements. J. Power Sources 2014, 272, 735–742. [Google Scholar] [CrossRef]
  13. Yu, H.; Bonville, L.; Maric, R. Analysis of H2/Air Polarization Losses of Low-Platinum-Loading Cathodes with Various I/C Ratios and Carbon Supports. J. Electrochem. Soc. 2018, 165, J3318–J3334. [Google Scholar] [CrossRef]
  14. Salari, S.; Stumper, J.; Bahrami, M. Direct measurement and modeling relative gas diffusivity of PEMFC catalyst layers: The effect of ionomer to carbon ratio, operating temperature, porosity, and pore size distribution. Int. J. Hydrogen Energy 2018, 43, 16704–16718. [Google Scholar] [CrossRef]
  15. Ishikawa, H.; Sugawara, Y.; Inoue, G.; Kawase, M. Effects of Pt and ionomer ratios on the structure of catalyst layer: A theoretical model for polymer electrolyte fuel cells. J. Power Sources 2018, 374, 196–204. [Google Scholar] [CrossRef]
  16. Yu, H.; Roller, J.M.; Mustain, W.E.; Maric, R. Influence of the ionomer/carbon ratio for low-Pt loading catalyst layer prepared by reactive spray deposition technology. J. Power Sources 2015, 283, 84–94. [Google Scholar] [CrossRef]
  17. Xue, Q.; Zhang, R.; Yang, D.; Li, B.; Ming, P.; Zhang, C. Effect of ionomer content on cathode catalyst layer for PEMFC via molecular dynamics simulations and experiments. Int. J. Hydrogen Energy 2022, 47, 23335–23347. [Google Scholar] [CrossRef]
  18. Yakovlev, Y.V.; Lobko, Y.V.; Vorokhta, M.; Nováková, J.; Mazur, M.; Matolínová, I.; Matolín, V. Ionomer content effect on charge and gas transport in the cathode catalyst layer of proton-exchange membrane fuel cells. J. Power Sources 2021, 490, 229531. [Google Scholar] [CrossRef]
  19. Li, D.; Niu, K.; Yang, R.; Van Haeverbeke, M.; Zhang, Y.; Shi, W.; Yang, Y.; Zhang, J.; Wang, Y. Effect of Solid Content and Ionomer-to-Carbon Ratio on High-Solid-Content Ink-Cast Catalyst Layers for PEM Fuel Cells. Energy Fuels 2025, 39, 2782–2789. [Google Scholar] [CrossRef]
  20. Gao, W.; Yin, Q.; Chen, J.; Liu, Z.; Zhang, Z.; Lu, J.; Lei, Y.; Xu, H.; Ouyang, H.; Yin, Y.; et al. Mechanism study of the improved catalytic activity of PEMFC catalyst layer by short-side-chain ionomer: Focusing on the ionomer/Pt interface. Chem. Eng. J. 2024, 479, 147787. [Google Scholar] [CrossRef]
  21. Liu, S.; Lin, R.; Lu, J.; Wang, Y.; Cai, X. The impact of different side chain ionomer on membrane electrode assembly performance and durability. Chem. Eng. J. 2023, 472, 145050. [Google Scholar] [CrossRef]
  22. Young, A.P.; Stumper, J.; Knights, S.; Gyenge, E. Ionomer Degradation in Polymer Electrolyte Membrane Fuel Cells. J. Electrochem. Soc. 2010, 157, B425–B436. [Google Scholar] [CrossRef]
  23. Shahgaldi, S.; Alaefour, I.; Li, X. Influence of ionomer structures and ratios on performance and degradation of PEM fuel cells. Electrochem. Soc. Trans. 2018, 83, 71–78. [Google Scholar] [CrossRef]
  24. Cai, C.; Rao, Y.; Zhang, Y.; Wu, F.; Li, S.; Pan, M. Failure mechanism of PEM fuel cell under high back pressures operation. Int. J. Hydrogen Energy 2019, 44, 13786–13793. [Google Scholar] [CrossRef]
  25. Gasteiger, H.A.; Kocha, S.S.; Sompalli, B.; Wagner, F.T. Activity benchmarks and requirements for Pt, Pt-alloy, and non-Pt oxygen reduction catalysts for PEMFCs. Appl. Catal. B Environ. 2005, 56, 9–35. [Google Scholar] [CrossRef]
  26. Liu, S.; Lin, R.; Tian, J.; Wang, H.; Jing, Y.; Lu, K. Morphology and overpotential analysis of cathode catalyst layer with different ink compositions in low Pt-loaded membrane electrode assembly. J. Power Sources 2023, 558, 232603. [Google Scholar] [CrossRef]
  27. Saeidfar, A.; Kirlioglu, A.C.; Gursel, S.A.; Yesilyurt, S. Role of catalyst layer composition in the degradation of low platinum-loaded proton exchange membrane fuel cell cathodes: An experimental analysis. J. Power Sources 2025, 625, 235676. [Google Scholar] [CrossRef]
  28. Wan, T.H.; Saccoccio, M.; Chen, C.; Ciucci, F. Influence of the Discretization Methods on the Distribution of Relaxa-tion Times Deconvolution: Implementing Radial Basis Functions with DRTtools. Electrochim. Acta 2015, 184, 483–499. [Google Scholar] [CrossRef]
  29. Yoo, D.; Park, J.; Oh, S.; Park, S.; Kim, M.H.; Choi, Y.; Park, K. Impact of ionomer binder degradation on mass transport at high current densities in polymer electrolyte membrane fuel cell stack after 5,000 h dynamic load cycling. J. Power Sources 2025, 655, 237902. [Google Scholar] [CrossRef]
  30. Pei, P.; Wu, Z.; Li, Y.; Jia, X.; Chen, D.; Huang, S. Improved methods to measure hydrogen crossover current in proton exchange membrane fuel cell. Appl. Energy 2018, 215, 338–347. [Google Scholar] [CrossRef]
  31. Malevich, D.; Jayasankar, B.R.; Halliop, E.; Pharoah, J.G.; Peppley, B.A.; Karan, K. On the Determination of PEM Fuel Cell Catalyst Layer Resistance from Impedance Measurement in H2/N2Cells. J. Electrochem. Soc. 2012, 159, F888–F895. [Google Scholar] [CrossRef]
  32. Makharia, R.; Mathias, M.F.; Baker, D.R. Measurement of Catalyst Layer Electrolyte Resistance in PEFCs Using Electrochemical Impedance Spectroscopy. J. Electrochem. Soc. 2005, 152, A970–A977. [Google Scholar] [CrossRef]
  33. Karmakar, A.; Sarker, M.; Najafianashrafi, Z.; Mora, J.M.; Kakati, N.; Chuang, P.-Y.A. Influence of Ionomer Overcoating on the Interfacial Properties and Performance of Gas Diffusion Electrode-Based Proton Exchange Membrane Fuel Cells. Energies 2026, 19, 2728. [Google Scholar] [CrossRef]
  34. US Drive. Fuel Cell Technical Team Roadmap. 2017. Available online: https://www.energy.gov/sites/prod/files/2017/11/f46/FCTT_Roadmap_Nov_2017.pdf (accessed on 12 June 2026).
  35. Kim, K.-H.; Lee, K.-Y.; Lee, S.-Y.; Cho, E.; Lim, T.-H.; Kim, H.-J.; Yoon, S.P.; Kim, S.H.; Lim, T.W.; Jang, J.H. The effects of relative humidity on the performances of PEMFC MEAs with various Nafion® ionomer contents. Int. J. Hydrogen Energy 2010, 35, 13104–13110. [Google Scholar] [CrossRef]
  36. Saidin, N.U.; Jehan, O.S.; Leong, K.S.; Choo, T.F.; Wong, W.Y.; Loh, K.S.; Yunus, R.M. Influence of ionomer concentration and membrane thickness on membrane electrode assembly in alkaline fuel cell performance. Asia-Pac. J. Chem. Eng. 2024, 19, 3024. [Google Scholar] [CrossRef]
  37. Song, J.; Zhao, W.; Wang, H.; Meng, H.; Zhang, S.; Zhong, W.; Wu, X.; Li, M.; Guan, P.; Zhang, M.; et al. Ionomer distribution control for improving the performance of proton exchange membrane fuel cells: Insights into structure–property relationships. Chem. Eng. J. 2024, 496, 153971. [Google Scholar] [CrossRef]
  38. Jinnouchi, R.; Kudo, K.; Kodama, K.; Kitano, N.; Suzuki, T.; Minami, S.; Shinozaki, K.; Hasegawa, N.; Shinohara, A. The role of oxygen-permeable ionomer for polymer electrolyte fuel cells. Nat. Commun. 2021, 12, 4956. [Google Scholar] [CrossRef] [PubMed]
  39. Yuan, H.; Dai, H.; Ming, P.; Wang, X.; Wei, X. Quantitative analysis of internal polarization dynamics for polymer electrolyte membrane fuel cell by distribution of relaxation times of impedance. Appl. Energy 2021, 303, 117640. [Google Scholar] [CrossRef]
  40. Nagamori, K.; Aoki, S.; Ikegawa, M.; Seki, Y.; Igarashi, H.; Uchida, M. Analysis of Ionomer Distribution and Reaction Mechanisms on Polymer Electrolyte Fuel Cell Pt Catalysts Supported on Mesoporous Carbon under Various Humidity Conditions. ACS Appl. Energy Mater. 2025, 8, 9796–9814. [Google Scholar] [CrossRef]
  41. Schneider, P.; Scherzer, A.-C.; Storey, B.D.; Klingele, M.; Zamel, N.; Gerteisen, D. The Effect of Ionomer to Carbon Ratio and Relative Humidity on Cathode Catalyst Degradation in PEM Fuel Cells. J. Electrochem. Soc. 2023, 170, 104505. [Google Scholar] [CrossRef]
  42. Pedersen, A.; Snitkoff-Sol, R.Z.; Presman, Y.; Dubau, L.; Cai, R.; Barrio, J.; Haigh, S.J.; Maillard, F.; Stephens, I.E.L.; Titirici, M.; et al. Fe-N-C in Proton Exchange Membrane Fuel Cells: Impact of Ionomer Loading on Degradation and Stability. Adv. Energy Mater. 2024, 15, 2403920. [Google Scholar] [CrossRef]
  43. Yakovlev, Y.V.; Lobko, Y.V.; Rodríguez, M.G.; Darabut, A.M.; Redondo, L.B.; Kalabis, D.; Matolínová, I. Investigation of fuel cell behavior with different catalyst loadings at varying humidities and temperatures. J. Power Sources 2025, 663, 238804. [Google Scholar] [CrossRef]
  44. Sakthivel, M.; Drillet, J.-F. An extensive study about influence of the carbon support morphology on Pt activity and stability for oxygen reduction reaction. Appl. Catal. B-Environ. 2018, 231, 62–72. [Google Scholar] [CrossRef]
  45. Hiesgen, R.; Morawietz, T.; Handl, M.; Corasaniti, M.; Friedrich, K. Atomic Force Microscopy on Cross Sections of Fuel Cell Membranes, Electrodes, and Membrane Electrode Assemblies. Electrochim. Acta 2015, 162, 86–99. [Google Scholar] [CrossRef]
  46. Martens, I.; Chattot, R.; Drnec, J. Decoupling catalyst aggregation, ripening, and coalescence processes inside operating fuel cells. J. Power Sour. 2022, 521, 230851. [Google Scholar] [CrossRef]
Figure 1. SEM images of MEAs with various I/C ratios. (a,e,i) I/C = 0.4, (b,f,j) I/C = 0.8, (c,g,k) I/C = 1.0, and (d,h,l) I/C = 1.2.
Energies 19 03670 g001
Figure 2. Polarization curves of MEAs with various I/C ratios at (a) 0 kPa and (b) 150 kPa. (c) ηact and (d) ηconc of MEAs with various I/C ratios, which were obtained by analyzing the polarization curves in (b).
Energies 19 03670 g002
Figure 3. (a) Peak power densities and (b) current densities at 0.65 V of MEAs with various I/C ratios at 150 kPa.
Energies 19 03670 g003
Figure 4. (a) LSV curves, (b) CV curves, and (c) ECSA values of MEAs with various I/C ratios. (d) EIS curves at 200 mA cm–2, (e) corresponding DRT results, and (f) resistance separation results of MEAs with various I/C ratios.
Energies 19 03670 g004
Figure 5. The schematic diagrams of the morphology of cathode CL with various I/C ratios.
Energies 19 03670 g005
Figure 6. (ac) The LSV curves and (d) H2 crossover current densities of MEAs with various I/C ratios during AST.
Energies 19 03670 g006
Figure 7. (ac) Polarization curves of MEAs with various I/C ratios during AST, (d) Peak power density and decay rate curves during AST cycles.
Energies 19 03670 g007
Figure 8. (ac) The CV curves of MEAs with various I/C ratios during AST, (d) ECSA values of MEAs with various I/C ratios during AST.
Energies 19 03670 g008
Figure 9. (ac) HN-EIS curves and (d) the Rproton of MEAs with various I/C ratios during AST.
Energies 19 03670 g009
Figure 10. TEM images of cathode CLs: (a) representative pristine state, and (bd) after 5000 AST cycles for MEAs with I/C ratios of 0.4, 0.8, and 1.2.
Energies 19 03670 g010
Table 1. ECSA and decay rate of MEAs with various I/C ratios during AST.
CyclesI/C = 0.4I/C = 0.8I/C = 1.2
ECSA
(m2 gPt−1)
Decay Rate (%)ECSA
(m2 gPt−1)
Decay Rate (%)ECSA
(m2 gPt−1)
Decay Rate (%)
016.07035.76044.080
100011.1130.826.1726.835.5419.4
30007.1655.421.8738.831.0529.5
50006.7757.819.0346.730.8530.0
Disclaimer/Publisher’s Note: The statements, opinions and data contained in all publications are solely those of the individual author(s) and contributor(s) and not of MDPI and/or the editor(s). MDPI and/or the editor(s) disclaim responsibility for any injury to people or property resulting from any ideas, methods, instructions or products referred to in the content.