Article

Dual-Mode Adaptive Defocusing Control for Net Energy Yield Optimization in Solar-Integrated Biophotovoltaic Systems


School of Intelligent Manufacturing and Aeronautics, Zhuhai College of Science and Technology, Zhuhai 519041, China
*
Author to whom correspondence should be addressed.
Energies 2026, 19(15), 3597; https://doi.org/10.3390/en19153597
Submission received: 20 June 2026 / Revised: 27 July 2026 / Accepted: 30 July 2026 / Published: 31 July 2026

Abstract

Microalgae biophotovoltaic (BPV) systems convert solar energy into electricity through photosynthetic electron transfer (PET) and have emerged as a promising solar-integrated bioenergy technology. However, high-density tubular arrays suffer from the “canyon effect” at low solar angles and from photoinhibition under peak irradiance (>450 W/m2), where non-photochemical quenching (NPQ) and reactive oxygen species (ROS) dissipate bioelectric potential as heat. To address this, a hysteresis-based dual-mode PID controller with hysteresis switching is proposed within an optical–mechanical–biological co-optimization framework, integrating array self-shading, nonlinear microalgal photoresponse, and tracking parasitic losses. In low-light mode, the system actively tracks the sun to minimize shading; in peak-light mode, it defocuses the incident angle to limit irradiance near the saturation threshold, mitigating the risk of photoinhibition. Structural control boundaries, including tube spacing and connecting rod length, are determined numerically. Under the nominal clear-sky design day, the defocusing mode reduces the daily exposure of the culture to irradiance above the saturation threshold (450 W/m2) from 5.28 h to 3.08 h. Numerical simulations indicate a daily net energy yield improvement of +14.9% over continuous dual-axis tracking and +6.3% over the latitude-based fixed-tilt baseline under idealized clear-sky design-day conditions. These values are simulation-derived estimates; experimental validation with a physical prototype is required before the framework can be interpreted as a validated system-level performance gain.

1. Introduction

Solar-integrated biomass systems, such as microalgae biophotovoltaic (BPV) arrays, enable the direct conversion of solar energy into electricity via photosynthetic electron transfer (PET) [1]. Unlike traditional bioenergy processes that require biomass harvesting and subsequent conversion, BPV systems derive electrical output from electron transfer processes associated with water splitting in Photosystem II, bypassing intermediate thermal or chemical stages [2]. This direct conversion feature positions BPV systems as promising candidates for distributed renewable energy generation and carbon-neutral energy applications.
However, significant optical and structural bottlenecks emerge when such systems are scaled to high-density outdoor tubular arrays. The core challenge is the spatiotemporal mismatch of the incident light field. At low solar elevation angles, dense tubular arrays cast long, overlapping shadows. This macroscopic “canyon effect” severely restricts the penetration of interior light [3,4]. At noon, peak surface irradiance substantially exceeds the light saturation threshold for microalgae (generally >450 W/m2), triggering accumulation of non-photochemical quenching (NPQ) and reactive oxygen species (ROS) in microalgal cells [5,6]. Consequently, the system design must simultaneously address two conflicting challenges: (1) deep illumination shortage within the array interior during off-peak periods, and (2) severe photoinhibition during peak irradiance.
Researchers have sought to mitigate uneven light distribution through both biological and engineering approaches. Biological interventions, such as truncated light-harvesting antenna complexes, can delay light saturation. In engineering, internal fluid dynamics can be optimized to induce a “flashing light” effect. Although it can effectively improve cell mixing, it significantly increases the cost and complexity of the system. The standard solar tracking systems aim to maintain the normal incidence of light to maximize the efficiency of photon capture. However, directly applying the traditional conventional BPV tracking strategies to the biological systems has essential limitations: once the tubular BPV array enters the light saturation state, the excess irradiance cannot be effectively converted into additional electrical output; instead, it will intensify thermal dissipation through NPQ; in addition, the parasitic energy losses generated by the continuous operation of the motor constantly erode the net system yield [7,8].
Therefore, evaluating biophotovoltaic systems solely by optical efficiency or gross power output is insufficient. A unified model that simultaneously accounts for light distribution, microalgal photoresponse, and tracking-related parasitic energy consumption is still lacking [9].
Although the literature has extensively discussed BPV systems, most studies rely on isolated analyses that oversimplify the complex coupling among optical, biological, and mechanical subsystems.
Existing studies address several independent topics: (1) canyon-effect shading in high-density arrays [3,4,10,11]; (2) idealized light-suppression mechanisms [6,12,13,14,15]; and (3) isolated structural or control optimizations [7,16,17,18]. Although preliminary multi-objective evaluations exist [19], these studies generally treat light fields, biological photoinhibition, and mechanical tracking dynamics as disjoint elements. Consequently, the nonlinear coupling among light regulation, biological metabolism, and mechanical driving energy consumption has not been quantitatively characterized [12,20].
Therefore, a unified system-level framework for evaluating net energy yield has not yet been developed. In particular, three core elements are seldom integrated: (1) the spatiotemporal variation in light distribution in dense tubular arrays; (2) the nonlinear photoresponse of microalgae under light limitation and inhibition; and (3) the parasitic energy consumption of active solar tracking. Without a system-level trade-off among these coupled factors, improvements in optical capture cannot be objectively translated into verifiable net energy gains.
To fill this gap, this paper proposes a system optimization and adaptive control framework for solar biophotovoltaic array (BPV array). Taking net system yield as the unified target, this framework realizes multi-physical field coupling among optical, mechanical and biological fields. Different from the traditional idea of “maximum irradiance capture”, this framework realizes adaptive control of light intensity based on biological saturation threshold. To meet the real-time requirements under outdoor dynamic conditions and adapt to the computational power constraints of the microcontroller, a hysteresis-based dual-mode PID control strategy with hysteresis loop switching is designed. On this basis, the structure-control cooperative optimization mapping is established, and the dynamic response boundary and stable working range of the system are defined. This framework is positioned as a physics-based simulation and evaluation framework. Full-scale experimental validation with a physical outdoor prototype constitutes an essential future step beyond the scope of the present study.
This paper focuses on the system-level macro-energy balance; transient intracellular dynamics, such as reactive oxygen species (ROS) accumulation, non-photochemical quenching (NPQ) kinetics, and micro-fluidic algal mixing, are outside the current scope. Accordingly, the biological benefit of defocusing is quantified strictly in steady-state energy terms—as a reduction in the daily exposure duration above the saturation irradiance (from 5.28 to 3.08 h/day)—and no claim of photodamage prevention is made.

2. Materials and Methods

2.1. System Configuration and Physical Constraints

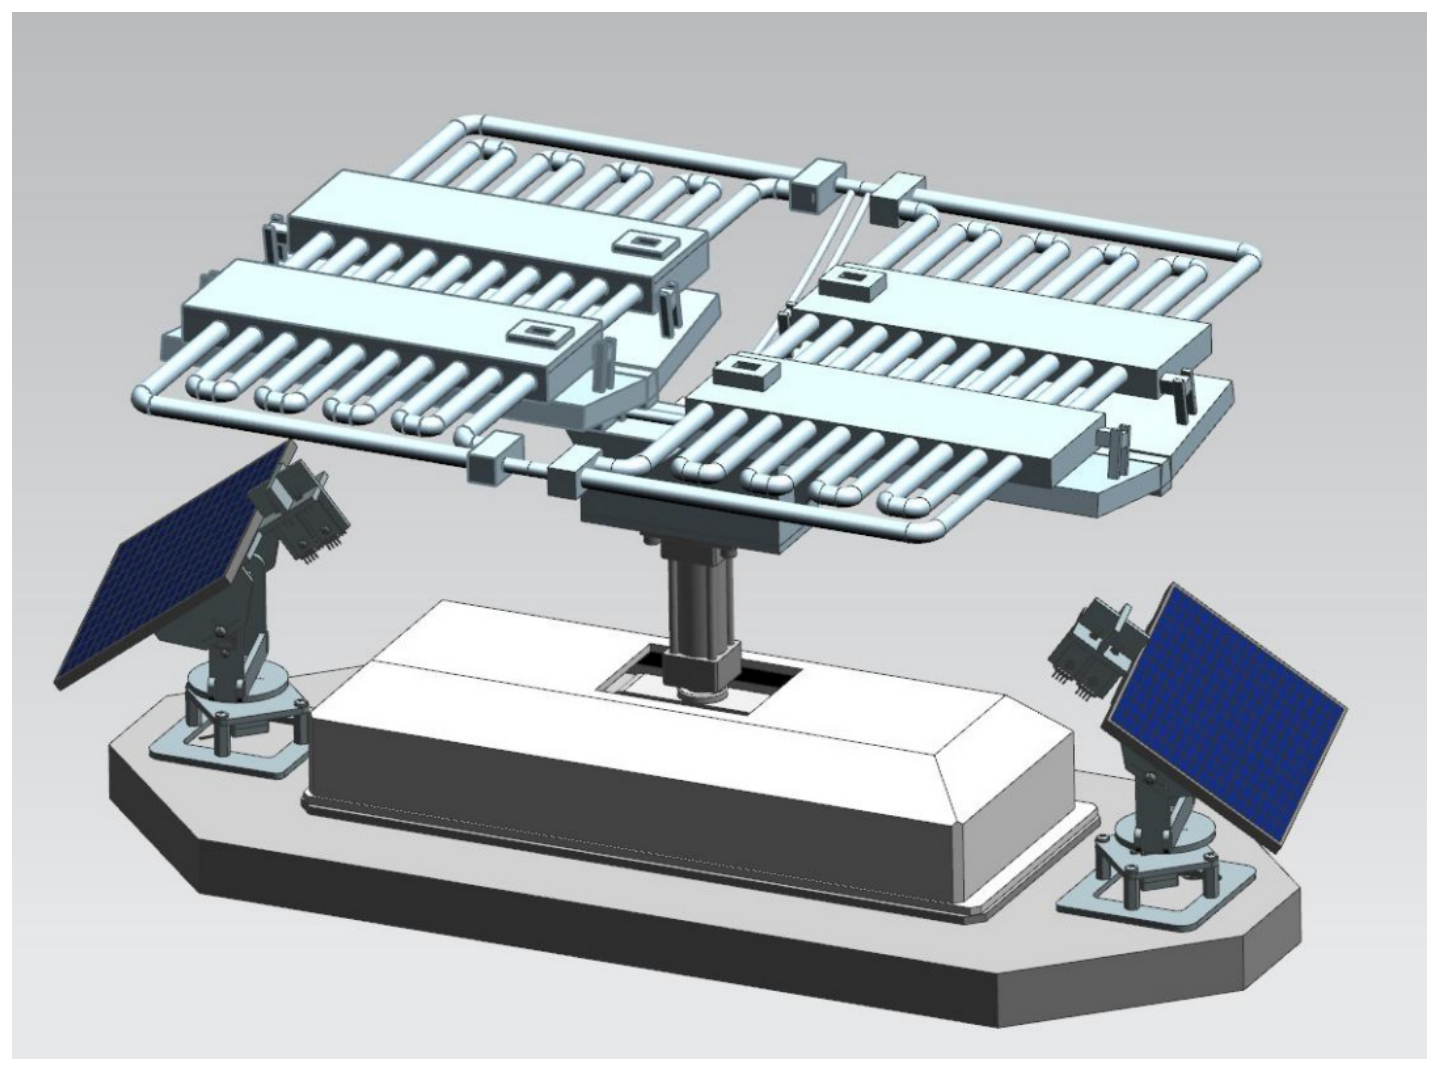
The 3D topology of the tubular BPV array determines the distribution of key physical fields and is therefore described first. Physical constraints governing the electrochemical and mechanical subsystems are then formulated based on this topology. For outdoor applications, dense cultivation is a core requirement to improve energy conversion efficiency; thus, a modular tubular BPV array integrated with a dual-axis tracking platform was designed for outdoor deployment. The physical configuration and mechanical assembly of the prototype, including the connection mode of the tubular modules and the installation accuracy of the tracking platform, are illustrated in Figure 1.

2.1.1. Tubular BPV Array Topology and Bio-Electrochemical Interface

The core of the BPV system is to achieve deep coupling between microalgal photosynthesis and direct electron transfer (DET) to the external circuit, thereby minimizing electron loss–a key bottleneck in current BPV systems. Generally, borosilicate glass tubes are selected as the core concentrating component because they combine excellent thermal stability, high optical transmittance, and long-term outdoor durability. In the system structure, the glass tube is fixed to the tracking support in a parallel array, and the algal liquid circulating in the tube maintains close contact with the three-dimensional graphene biological electrode network. This design provides a low-resistance path for the in situ capture of high-energy electrons generated by Photosystem II (PSII) during water photolysis, underscoring the importance of micro-interface engineering for macroscopic energy collection [21].
The biophotovoltaic power generation process involves multiple coupling biochemical reactions such as biomembrane attachment, concentration polarization and ohmic loss. Modeling each process one by one not only significantly increases the complexity of the model, but also introduces a large number of parameters that are difficult to accurately calibrate. More importantly, from a system-level coupling perspective, the correlation between light regulation and energy output is not a core element that must be rigorously matched.
To improve the model’s solvability, a series of simplifying assumptions are introduced: the algal growth system is treated as an ideal mixed system, the biomass concentration is assumed to be evenly distributed, and the total parameter method is used to represent electrochemical loss. The electrochemical loss is represented by a steady-state electrochemical extraction-efficiency coefficient ( η e x t ) that quantifies the effective mobility of photo-electrons to the external circuit. This coefficient links the bio-optical response to the electrical output and accounts for electrochemical uncertainties and other submodels.
Based on the above assumptions, this study ignores the fine details of electrochemical kinetic techniques and focuses on the effects of both light distribution and control strategies on the system’s net energy yield.

2.1.2. Precision Actuation and Kinematic Dead Zone Constraints

To mitigate the light-suppression effect of algae at high irradiance, the system employs an “active defocusing” strategy for accurate attitude control, built on conventional solar tracking. This strategy reduces peak photon flux to enhance operational stability and improve the reactor microclimate. The tracking subsystem uses a high-precision stepping motor, and the transmission mechanism comprises anti-backlash gear and a torsional spring pre-tensioning device. This design increases mechanical complexity but is necessary to achieve the required accuracy and significantly reduces the drive clearance [22]. With a resolution of approximately 0.05°, the system ensures that small off-focus commands are translated into actual actuator action without being overwhelmed by the mechanical idle path. However, whether this accuracy can be practically translated into a net system yield improvement depends essentially on the radiation volume and algal strain sensitivity, both of which are beyond the consideration of pure mechanical design.
In actual outdoor operations, the system’s motion range is constrained by physical conditions. Changes in inclination not only create additional stresses in piping, wiring, and support structures, but can also induce mutual interference between adjacent units. Therefore, the mechanical inclination of the reactor plane can only be limited within a mechanical inclination angle ( θ m ):
| θ m | 70 °
When the parameter exceeds the limit, the hardware protection mechanism will immediately stop the motor pulse output and prevent further action. Dead zone constraints ensure that the system operates within mechanical safety limits. This protection mechanism defines both the safety boundary and the controllable range of the tracking system; all subsequent control strategies must satisfy these dead zone constraints. The optimization results and actual performance of the system are also directly affected by the dead zone constraint.

2.1.3. Hardware Architecture and Signal Flow

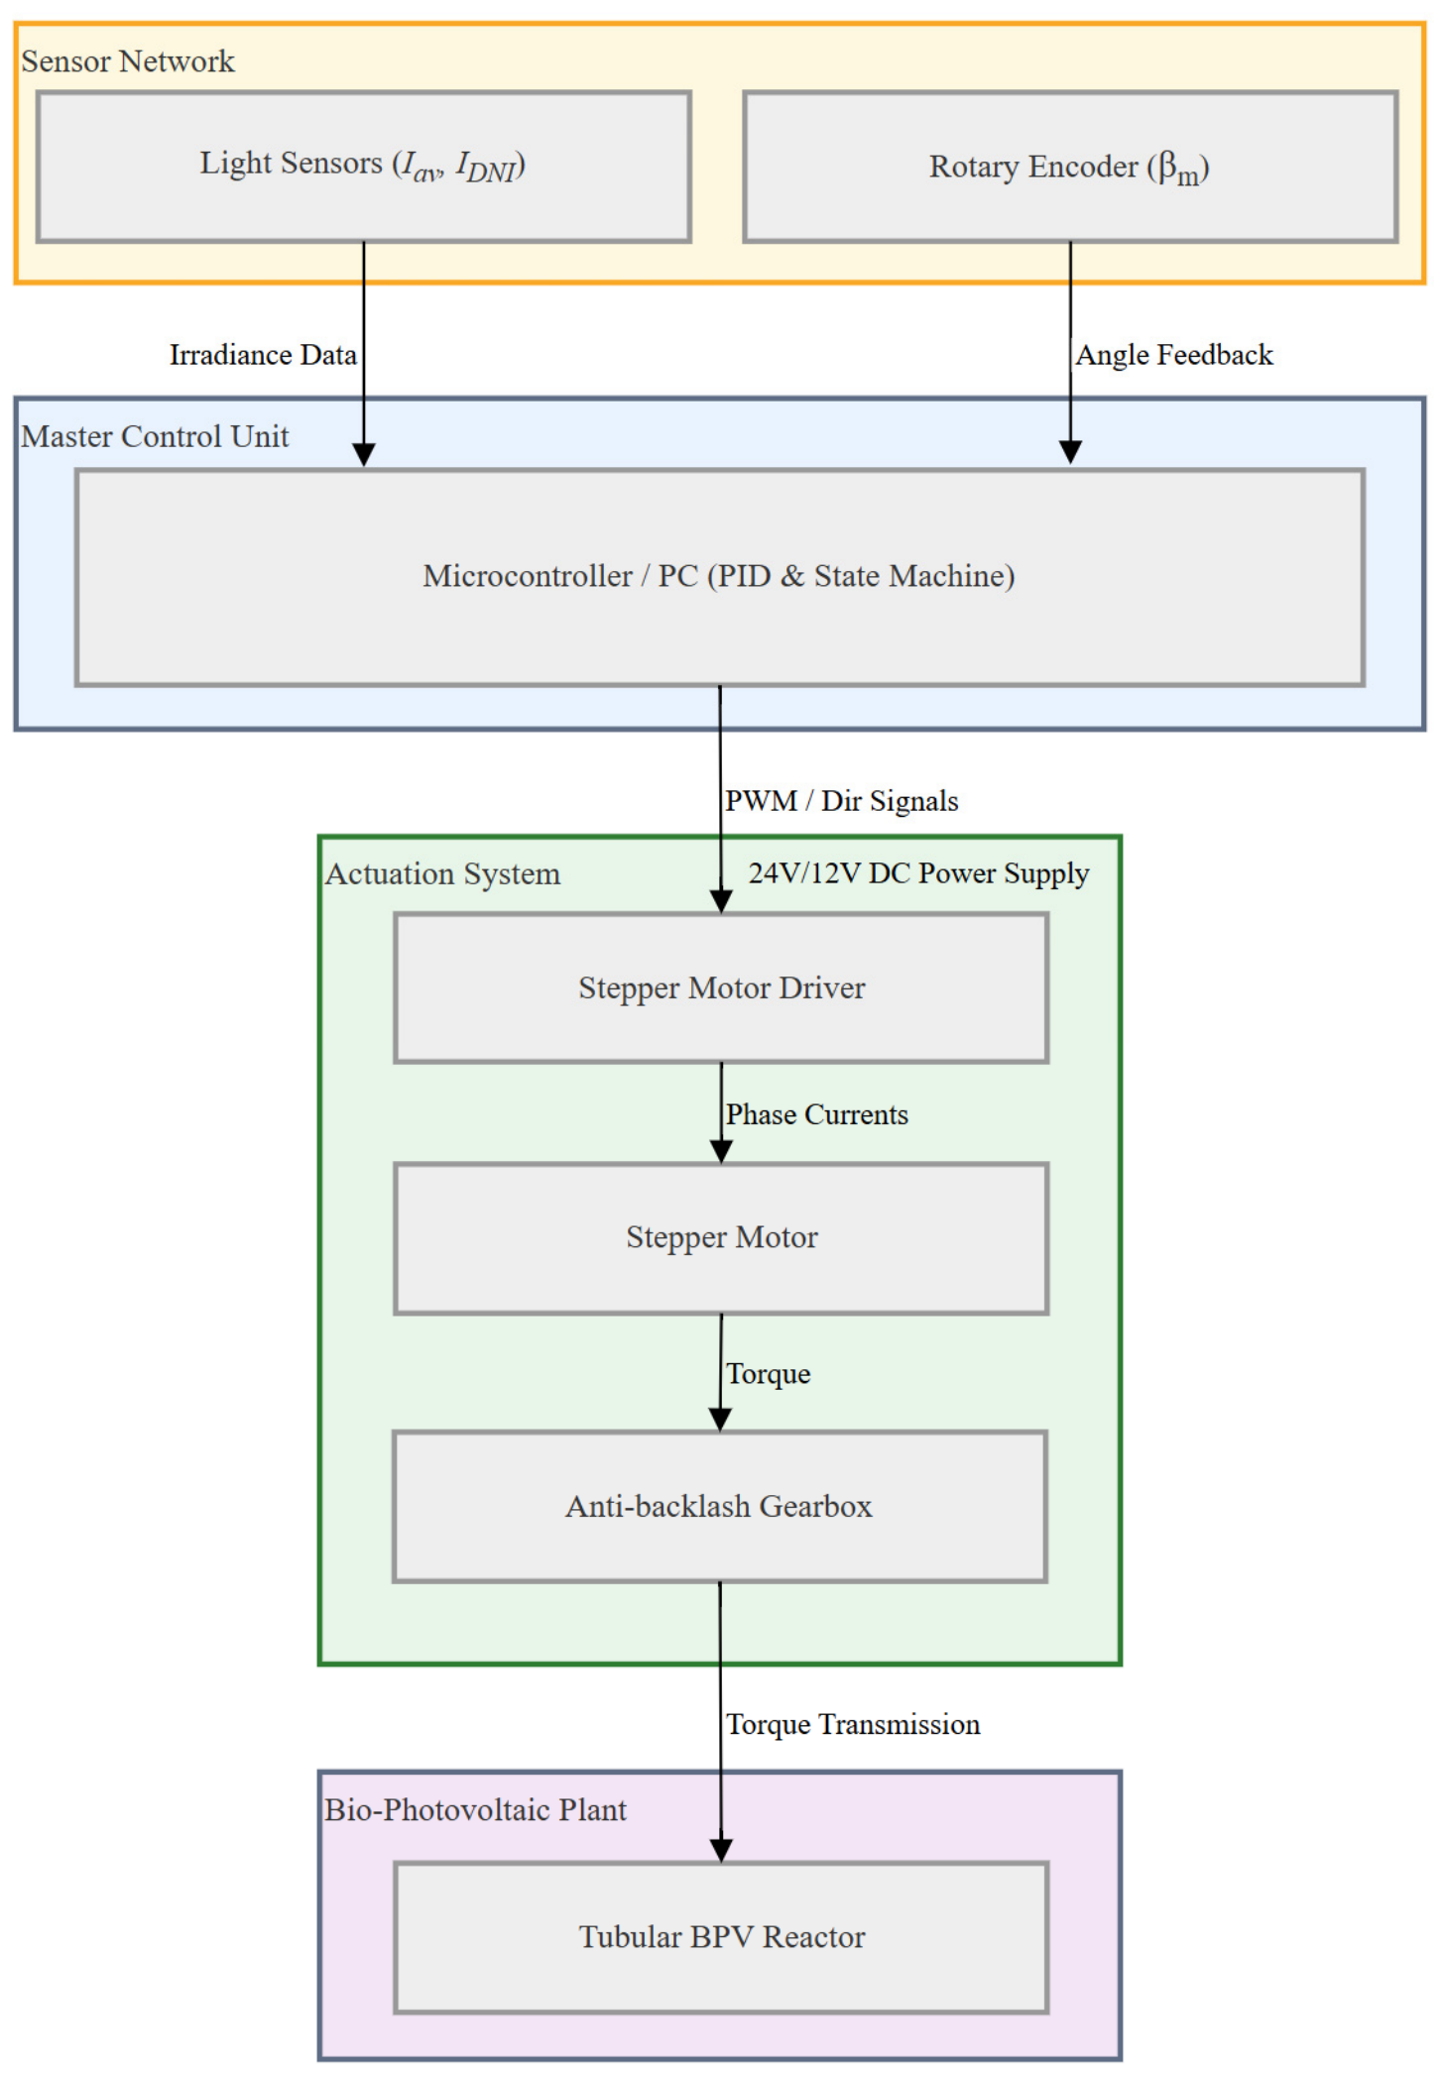
To realize the automatic operation of the dual-mode defocusing strategy, a closed-loop control architecture is established in this study, as shown in Figure 2. The integrated solution comprises a sensor network, an MCU, a drive system, and the communication links between them.
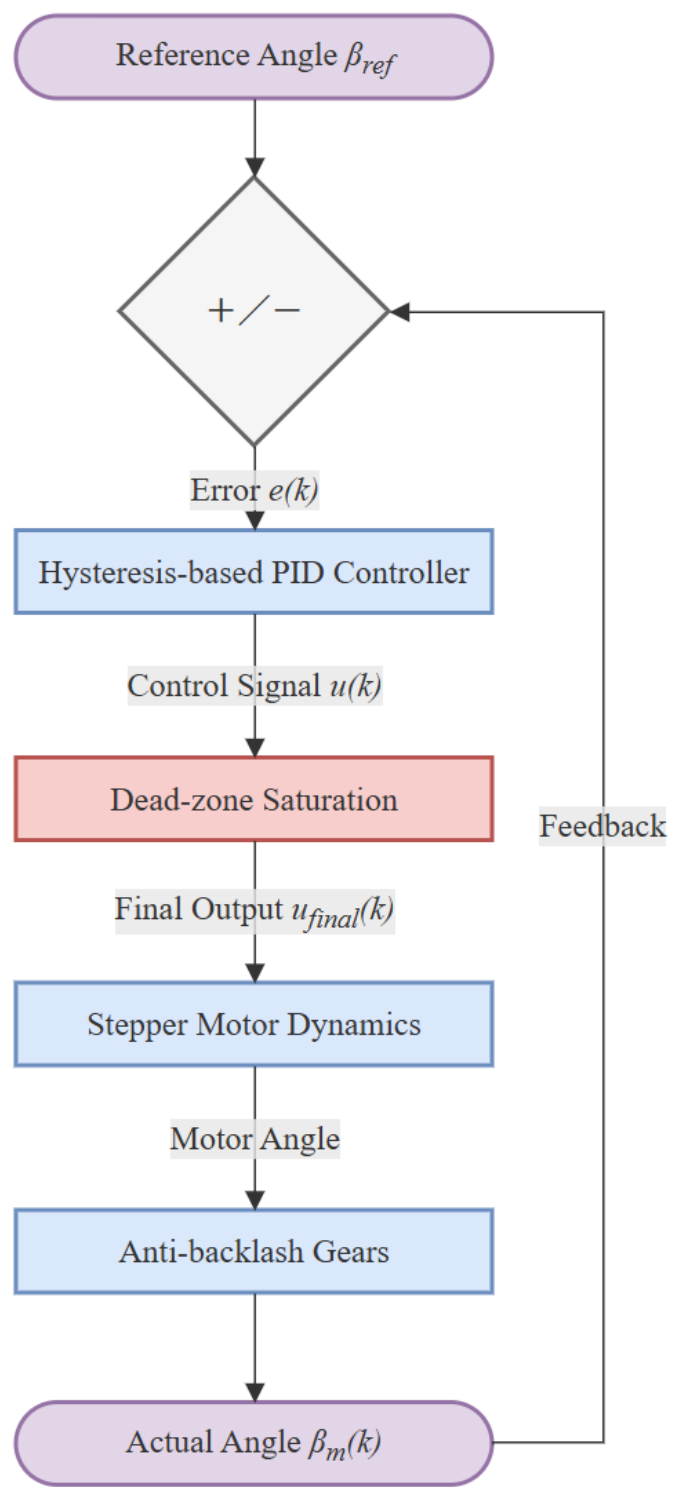
The sensor network monitors the effective surface irradiance in real time, and the rotary encoder synchronously provides position feedback. This encoder is selected to suppress the position errors prevalent in the outdoor biaxial tracking systems. The microcontroller collects and solves two signals and executes a discrete PID control algorithm. Figure 3 shows the closed-loop control flow, which includes a discrete PID controller and a nonlinear saturation constraint module, the latter of which is used to prevent actuator overloading as a key engineering protection measure.
During the operation of the system, the hardware driver level sets internal limiting protection and strict physical angle constraints ( | θ m ( k ) + u ( k ) | 70 ° , where u ( k ) represents the control increment).

2.2. Opto-Mechanical–Biological Coupled Modeling Framework

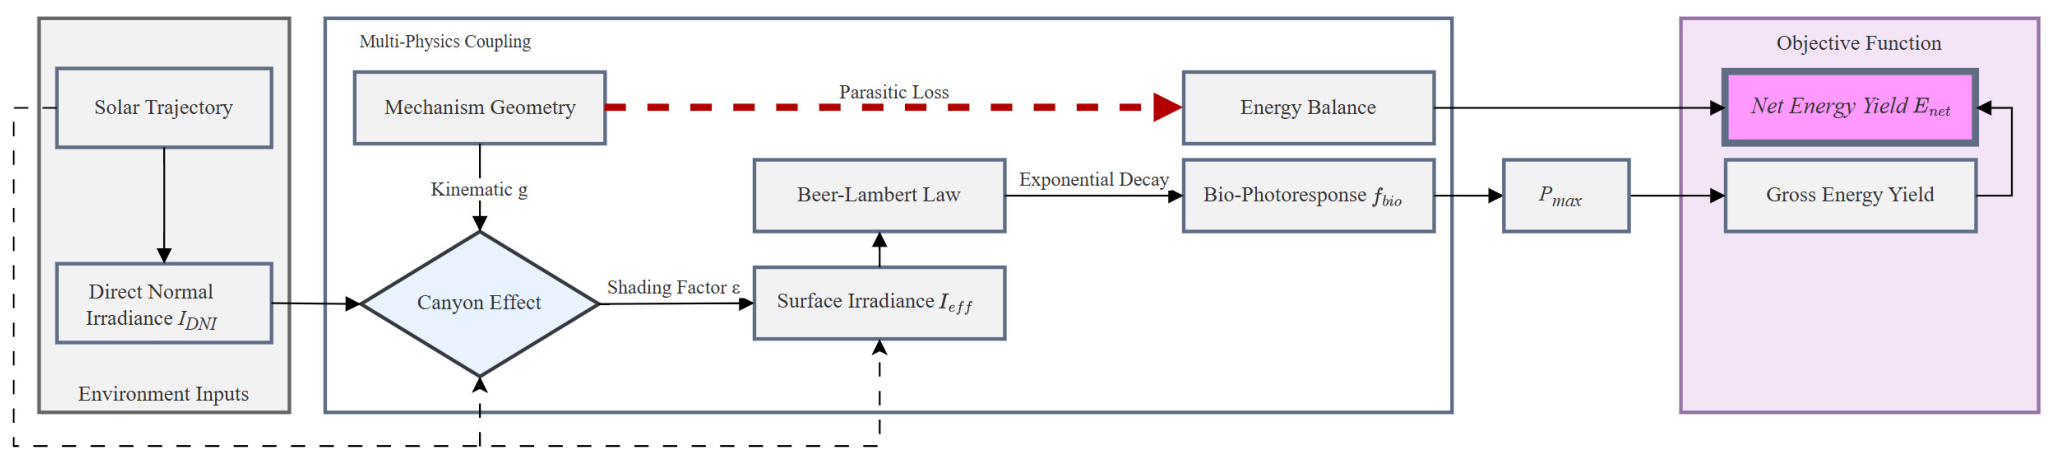
In order to make up for the shortcomings of traditional strategies, a coupled opto-mechanical–biological model is established to quantify the coupling effects of multiple factors. The model considers solar geometry, canyon shading, kinematic constraints, microalgae light response and actuator energy consumption, and constructs a complete net system yield calculation system. As shown in Figure 4, the model can systematically analyze the performance bottlenecks under different working conditions and provide empirical basis for strategy optimization.

2.2.1. Dynamic Incident Angle and Canyon-Effect Shading Model

The regulation of light distribution begins with determining the relative position between the sun and the tubular BPV array. For a given geographical latitude ϕ and solar time t, the altitude angle α and azimuth angle γ s can be described by the standard astronomical trajectory equation, and the core relationship is as follows [23]:
sin α = sin ϕ sin δ + cos ϕ cos δ cos ω
where δ is the solar declination angle and ω is the hour angle. These parameters together define the spatiotemporal trajectory of solar radiation relative to the ground reference frame.
For the dual-axis tracker in our integrated model, if its azimuth axis can accurately follow the sun’s azimuth angle, the instantaneous incident angle between the direct beam and the reactor plane can be determined by the difference between the sun’s zenith angle θ and the mechanical inclination angle β m set by the controller. This dynamic angle of incidence simplifies to the following equation:
θ = | ( 90 ° α ) β m |
When the sun hangs low at dawn or dusk, the upstream tube casts a long shadow on the downstream reactor’s surface, creating a pronounced “canyon effect”.
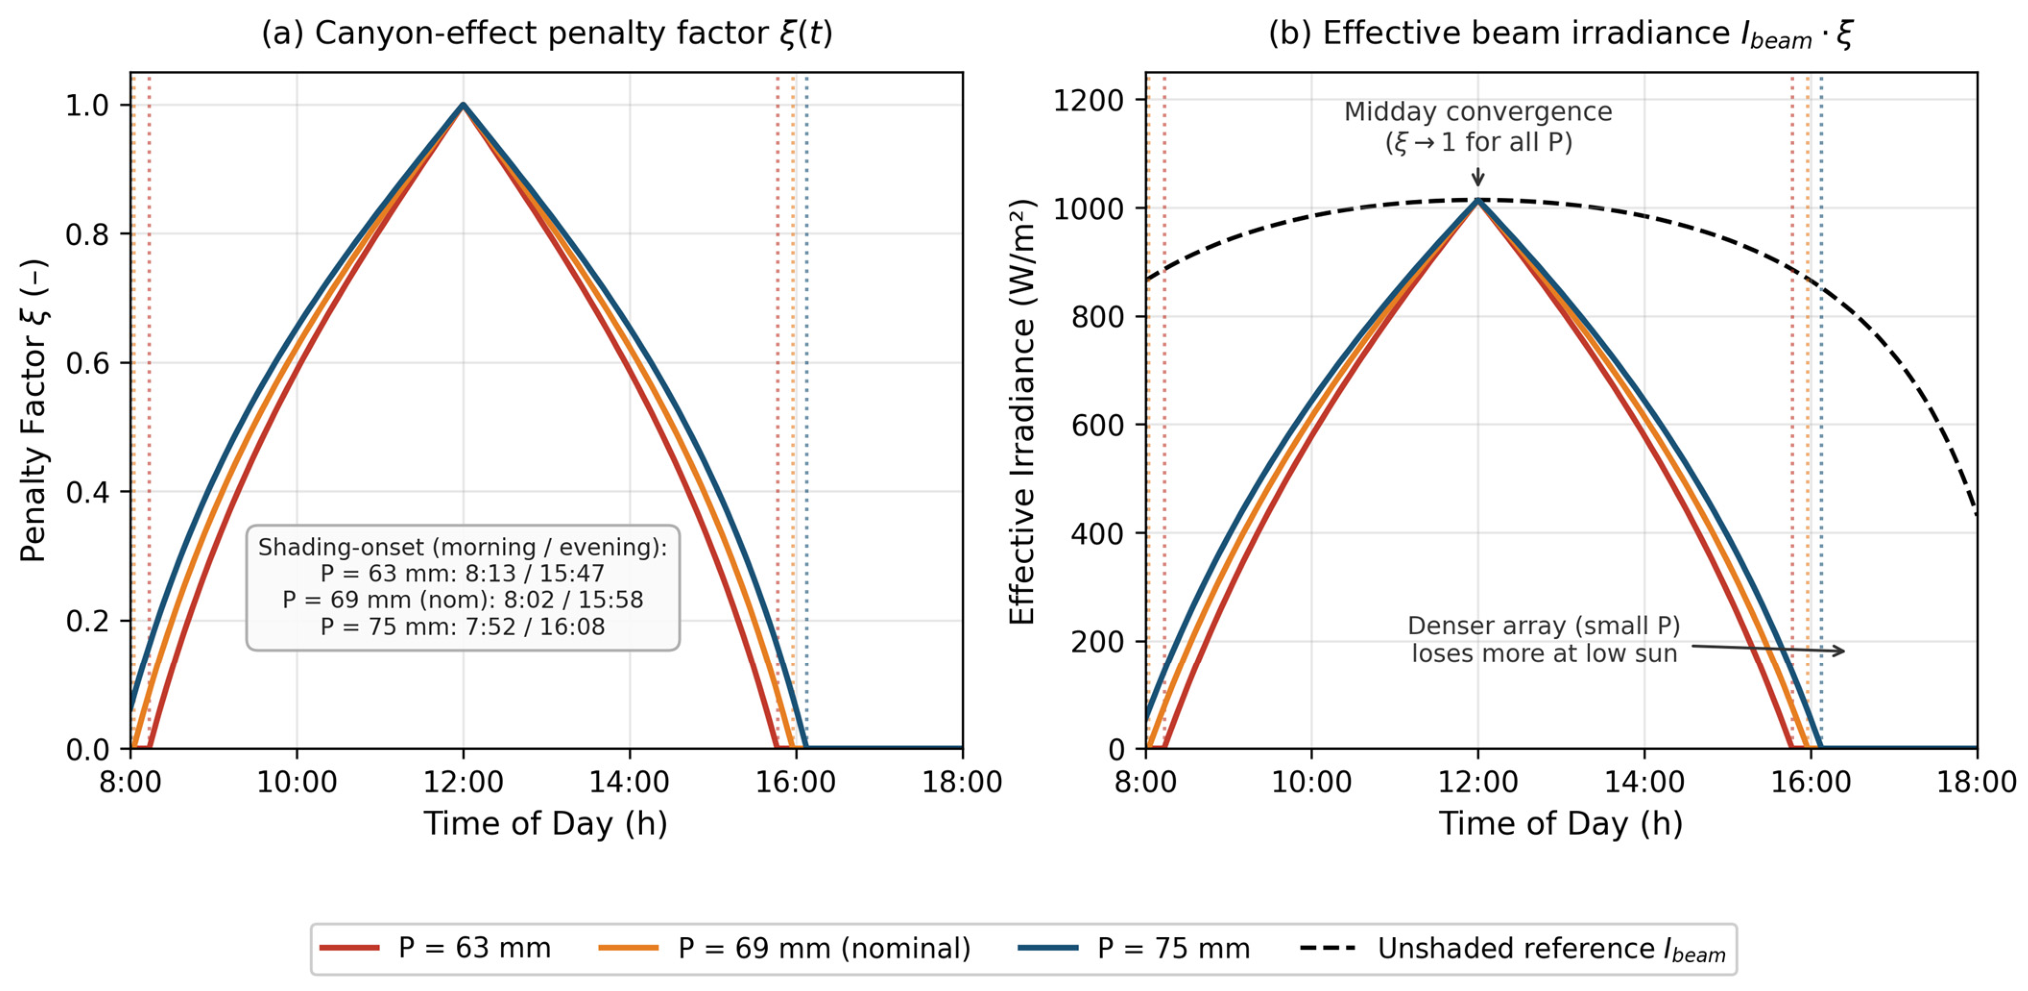
To quantify this effect, we establish a geometric relationship between the tube outer diameter (D) and the center-to-center pitch (P). The inter-tube geometry is defined by P = D + G , where G is the clear gap between adjacent tube walls; for a fixed tube outer diameter of D = 50   mm , the pitch is evaluated within the range P [ 63 , 75 ]   mm , ensuring a positive clear gap throughout. Shadows are triggered when the width of the light projection is smaller than the tube diameter due to geometric constraints. Instead of computationally intensive ray tracing, we capture this width reduction in a dimensionless canyon-effect penalty factor ξ [11]. This factor enables the model to quantitatively penalize the structural self-occlusion of the array through the normal irradiance:
ξ = max 0 , 1 D P cot ( α s o l )
The penalty factor ξ is derived from the dimensionless ratio of the tube diameter (D) to the center-to-center pitch (P), modulated by the solar elevation angle α: mutual shading between adjacent tubes vanishes once the elevation exceeds the geometric horizon set by D / P , and ξ approaches 1 at low sun. When the dimensionless ratio D / P compresses the available light width, the effective surface irradiance I e f f that ultimately succeeds in crossing the “canyon” and irradiating the reactor surface can be analytically expressed as follows:
I e f f = ξ ( α ) I a v cos θ p r o j
where I a v represents the available beam irradiance measured by the sun-facing reference sensor, and θ p r o j is the attitude projection angle. The resulting areal biological power output is given by P b i o = P m a x f b i o ( I e f f ) . Crucially, mode switching between active tracking (Mode I) and defocusing (Mode II) is decided on I a v , not on I e f f , so that the Mode II exit condition remains physically executable by the reference sensor.
The simulation assumptions, particularly the constant optical attenuation coefficient ( κ = 0.15   mm 1 ), are formulated under the premise of a well-mixed, mature Chlorella vulgaris culture. These optical and biological parameters hold strictly for an operational dry biomass concentration range of 1.2–1.8 g/L. Culture densities deviating significantly from this range would require recalibration of both the light penetration depth and the threshold penalty function.

2.2.2. Kinematic Mapping and Rigid Dead Zone Constraints

The control command needs to be converted by the mechanical drive chain to drive the BPV array to adjust the attitude. Let the linear displacement of the stepping motor be s and the effective length of the connecting rod be L. Due to transmission eccentricity e, the output mechanical inclination β m does not change linearly with the displacement, but follows the nonlinear geometric mapping relationship:
β m = g ( s , L , e , β o f f s e t )
where β o f f s e t represents the initial mounting angle. Because this mapping is nonlinear, the same control command produces different tilt increments depending on the instantaneous attitude and structural parameters.
These constraints impose strict bounds on the achievable tilt angle, which is expressed as:
β m i n β m β m a x

2.2.3. Nonlinear Microalgal Photoresponse Modeling

Once the solar photons pass through the glass wall (losing about 8–10% of their energy to Fresnel reflection and volume absorption), they enter the algal suspension, after which attenuation follows Lambert–Beer’s law—an optical simplification sufficient for primary-production estimates [24,25]. However, the response of the photosynthetic electron transport chain (PET) of microalgae to local irradiance is nonlinear and cannot be accurately described by a linear model. Microalgae operate in three regimes: light-limited, light-saturated, and photoinhibited.
To capture the unique “energy cliff” effect of biological systems at the system level, a penalty mechanism needs to be incorporated into the mathematical model. In this study, the effective surface irradiance Ieff is mapped as a normalized biological photoresponse function f b i o ( I e f f ) using a Steele curve with the following functional relationship [14,15,26]:
f b i o ( I e f f ) = I e f f I s a t exp 1 I e f f I s a t
This curve characterizes the physiological response of microalgae: the efficiency peaks as irradiance rises to the light saturation threshold Isat and then decays exponentially as it enters the photoinhibition zone.
Extending this mechanism to system evaluation at the array level faces a scaling gap between microtransient processes and macro-level steady-state simulations. Reactive oxygen (ROS) accumulation and non-photochemical quenching (NPQ) activation are millisecond biological responses that, if resolved directly in macroscopic models, would impose prohibitive computational costs. We therefore use a steady-state approximation—time-averaged penalty functions instead of transient simulations—to maintain tractability while preserving a conservative safety boundary.
For the core problem of structural-control co-optimization, the model deliberately omits secondary effects, such as the glass tube lens effect, internal light gradient and flash effect caused by fluid stirring. The model is designed to bound theoretical performance, not to predict instantaneous output. Under the isothermal assumption, although the simplified model numerically overestimates the absolute power due to the absence of local and biofouling effects, this does not affect the design objective.

2.2.4. Net Energy Balance with Tracking Parasitic Consumption

BPV reactors employing enhanced light-management strategies are usually evaluated solely by total light absorption or volumetric yield, and the mechanical energy required for tracking is often neglected. This simplified evaluation method can easily overestimate net energy yield [7,8]. To solve this problem, we introduced a closed-loop net energy yield E n e t calculation framework. This framework explicitly incorporates the system’s energy break-even point, enabling a more accurate assessment of actual net energy yields under different operational strategies.
The areal biological power output is given by the following equation:
P b i o = P m a x f b i o ( I e f f )
where f b i o ( I ) = ( I / I s a t ) exp ( 1 I / I s a t ) is the normalized Steele photoresponse function. By construction, f b i o attains its maximum value of 1 at I = I s a t = 450   W / m 2 , so the predicted output peak, the saturation irradiance, and the defocusing setpoint coincide. The defocusing controller therefore regulates the effective irradiance to I s a t ± Δ I h y s .
The absolute power scale is anchored to independently reported BPV power densities rather than to any single-fit calibration: reported values span from a review-level mean of 58.9 mW/m2 [27] through the experimental record of 0.54 ± 0.05 W/m2 [28] to a theoretical range of 0.7–7.7 W/m2 [29]. The nominal analysis adopts the theoretical upper bound P m a x = 7.7   W / m 2 , and the bandwidth analysis of Section 3.5 reports the consequences of the full range.
To accurately quantify the parasitic power consumption of the biaxial tracking system, the rigid-body dynamic integration is formulated to capture real-world operational transients, including nonlinear friction and stick-slip effects. The mechanical dynamics are governed by the following second-order torque balance equation incorporating the Stribeck friction model:
J β ¨ m = τ d r i v e sgn ( β ˙ m ) τ c + ( τ s τ c ) e | β ˙ m / ω s | + b β ˙ m
In this formulation, J is the rotational inertia of the array about the tracking axis, β m is the mechanical inclination angle, and τ d r i v e is the active driving torque. For the nonlinear friction components within the brackets, τ s represents the break-away static friction that the actuator must overcome during the frequent low-speed start–stop cycles characteristic of the hysteresis mode, τ c is the Coulomb dynamic friction, ω s is the Stribeck critical velocity, and b is the viscous friction coefficient.
As shown in Table 1, the nominal platform is an 8 m2 array of 77 parallel tubes (outer diameter of 50 mm, length of 1.5 m, pitch of 63–75 mm). With wall, fluid and manifold contributions, the tube mass is 3.70 kg, giving an array mass of 327 kg and a rotational inertia about the tracking axis of J = 770   kg m 2 . The operating torque budget is τ o p = 147   N m , comprising wind load at the 6 m/s operational rating (74 N·m), residual mass imbalance (32 N·m), and inertial torque at the maximum slew acceleration (40 N·m) (component values rounded); a gearbox safety factor SF = 2 is applied. A 1200:1 reduction (planetary 20:1 × worm 60:1) couples the array to a 12 W nameplate motor, yielding a slew-rate limit ω m a x = 1.4 ° / s . Survival wind loading at 15 m/s (465 N·m) is sustained passively by the self-locking worm stage with the drive unpowered; no holding current is required in survival conditions. The resulting daily actuator duty cycle is 0.21%, and the simulated peak mechanical power of 9.5 W remains below the motor nameplate.
The total instantaneous mechanical power consumption, P m e c h , integrates the static standby power required for the microcontroller and driver ( P s t a t i c ) and the active mechanical power required to overcome the aforementioned nonlinear friction and external wind-load disturbances while slewing [7,8]. The fluid circulation pump energy is constant under steady flow and is treated as a static baseline excluded from dynamic optimization.
The total daily net energy yield E d a y is defined as the time integral of electrical output minus tracking parasitic losses over the diurnal cycle [20]:
E d a y = t s t a r t t e n d ( P b i o P m e c h ) d t
This closed-loop accounting ensures that the evaluated net energy yield improvements remain robustly bounded by realistic mechanical execution costs.

2.2.5. Global Parameter Calibration and Baseline Configuration

All parameters were calibrated against published experimental data and the physical constraints of the tubular BPV device. The calibration process is based on two sources: first, published experimental data on microalgae culture, providing a benchmark for biological and optical parameters; second, the optimization target specifically designed for the tubular BPV device, which is highly consistent with the system topology. See Table 2 for all calibration parameters.
In the model construction, we defined the geometric design space using the actual pipe diameter and center-to-center pitch to ensure consistency with the real plant and prevent boundary overlap. For the biological model, the light saturation threshold ( I s a t ) and the peak areal power density ( P m a x ) are primarily considered. These parameters are directly related to the known characteristics of commonly used microalgae such as Chlorella vulgaris and biophotovoltaic performance limits bounded by the literature. At the mechanical level, empirical energy correction factors have been replaced by derived rigid-body rotational inertia ( J ) and nonlinear linkage friction thresholds ( τ s , τ c ) to capture realistic operational transients. At the hardware control level, the discrete PID gains ( K p , K i , K d ) and the hysteresis band ( Δ I h y s ) are reasonably limited, set to a range that can stably operate on a basic low-power microcontroller to drive the physical actuator while suppressing noise-induced chattering. In general, these explicitly defined parameters eliminate completely idealized simulation scenarios, finding a rigorous balance between the mathematical model and the actual physical constraints of the tracking platform.

2.3. Control Strategy and Optimization Methodology

The control strategy is designed to balance the dynamic demands of the diurnal cycle: under low irradiance, the system actively tracks the sun to minimize canyon-effect shading; under peak irradiance, it defocuses the incident angle to prevent photoinhibition. The core component is a hysteresis-based dual-mode PID controller driven by real-time irradiance feedback, which dynamically adjusts its behavior according to the operating state.

2.3.1. Controller Architecture and Discrete Solving Mechanism

The controller utilizes a closed-loop control architecture, and its operation is entirely driven by real-time data. Rather than relying on theoretical solar models, surface irradiance sensors around the BPV reactor arrays transmit effective irradiance data to the microcontroller (MCU). At each discrete time step k , the MCU fuses incident light data using weighted coefficients (denoted I s a t ) with a preset biological limit threshold. However, transforming the data into controller decisions (denoted as g ) via nonlinear kinematic mapping requires rigorous numerical processing to ensure stability.

2.3.2. Discrete PID Control Law and Anti-Backlash Compensation

Unlike PV tracking that typically aims to minimize the angle of incidence, the BPV systems considered here must track a time-varying target direction. To achieve this, the attitude controller is a hysteresis-based dual-mode PID controller with fixed gains. The term “dual-mode” refers exclusively to the hysteresis-driven switching between tracking (Mode I) and defocusing (Mode II) setpoints; the control gains are identical in both modes and are not adapted online.
Following the standard discrete-time formulation, the position PID control law can be written as follows [32,33]:
u ( k ) = K p e ( k ) + K i j = 0 k e ( j ) T s K d β m ( k ) β m ( k 1 ) T s
where e ( k ) denotes the tracking error at step k , β m ( k ) is the actual mechanical tilt angle, and K p , K i , and K d correspond to the proportional, integral, and differential gains, respectively. To prevent actuator shock caused by step changes in the target reference angle during mode switching, the derivative term acts exclusively on the rate of change in the actual mechanical tilt angle (derivative on measurement) rather than the tracking error. Integral action is governed by conditional anti-windup: integration is frozen whenever the commanded slew rate exceeds the actuator limit ω m a x = 1.4 ° / s and the error has the same sign as the control output. The commanded rate is then saturated at ± ω m a x before being applied to the plant.
In practical engineering, mechanical clearance in gear transmission mechanisms can easily cause a dead zone in the system, especially when the control command changes little. If left uncompensated, tracking accuracy degrades significantly. Therefore, this design combines an anti-backlash gear with a pre-tensioned torsional spring, achieving collaborative optimization through the integral and differential terms of the control algorithm: the integral term accumulates deviation to generate static torque that offsets spring-preload friction, reducing steady-state error; the differential term monitors the speed change rate in real time and suppresses the low-frequency mechanical oscillation caused by transient disturbances such as fast cloud movement through dynamic damping. The hardware–software coordination strategy effectively addresses the dead zone problem and improves the system’s response accuracy and stability.

2.3.3. Dual-Mode Switching Logic with Hysteresis Anti-Chattering

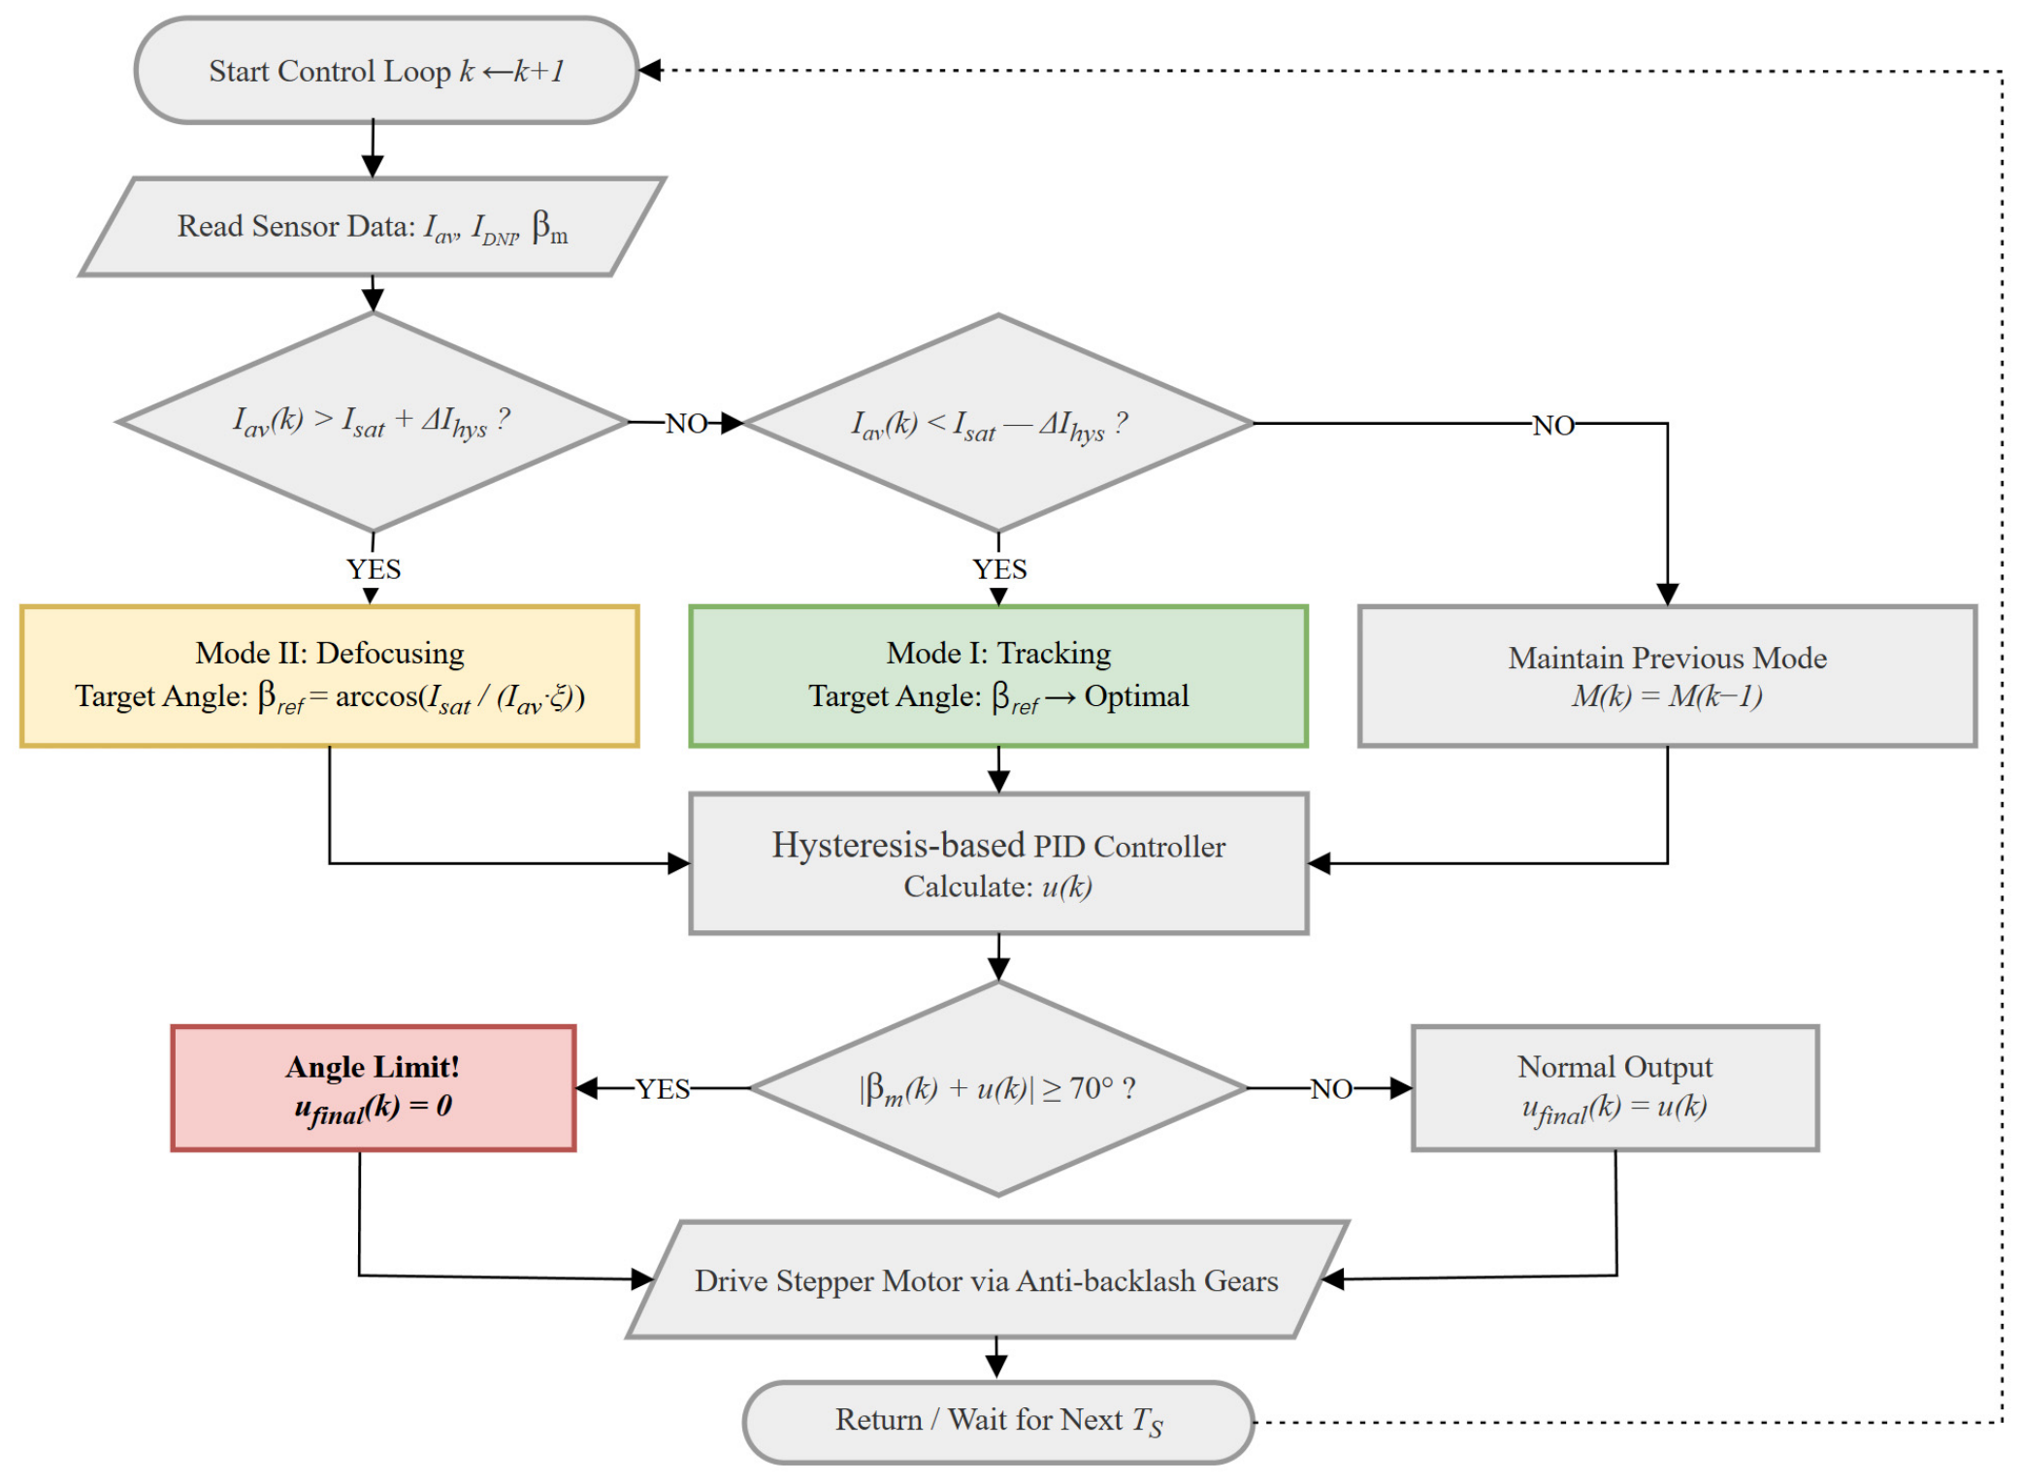
The key to the control logic is determining when to track the solar path and when to switch to the off-focus “light avoidance” state. To achieve this optimal biological balance, the controller minimizes actuator energy consumption while maximizing net power output. This requires intelligent decision-making with strict hysteresis constraints, rather than simple fixed thresholds. If only the light intensity passing through the theoretical threshold is used as the switching condition, a small fluctuation in the sensor or a rapid change in cloud cover may cause the BPV array to vibrate frequently and ultimately damage the gear drive system. A buffer control mechanism is introduced Δ I h y s in the decision algorithm (as shown in Figure 5): by setting the upper and lower hysteresis bands for the illumination threshold, the switching is triggered only when the illumination trend changes significantly, and the malfunction caused by short-term disturbance is effectively filtered out [34,35].
The hysteresis bandwidth of 20 W/m2 was determined by two complementary criteria within the computational framework. From a numerical stability perspective, this bandwidth prevents high-frequency chattering in the ODE solver at the switching threshold boundary, ensuring that the discrete-time state machine does not generate spurious mode transitions between consecutive sampling steps. From a photobiological perspective, this bandwidth is commensurate with the characteristic hysteresis time constant of the Steele photoresponse function: near the saturation threshold I s a t , a 20 W/m2 irradiance deviation corresponds to a biologically negligible efficiency change of less than 2% (derived from the slope of Equation (8) at I = I s a t ), ensuring that mode switching is only triggered by physiologically meaningful irradiance shifts. This parameter is designed as an algorithm-level safety margin that can be directly adapted upon future hardware deployment by calibrating against the specific sensor specifications and actuator response latency of the physical prototype.
The controller realizes regulation through the following state switching, with hysteresis thresholds I s a t ± Δ I h y s = 450 ± 20   W / m 2 evaluated on the available beam irradiance I a v from the sun-facing reference sensor [31]:
  • Mode I (active tracking): when I a v < I s a t Δ I h y s , the array aligns to intercept all available photons, counteracting the canyon effect.
  • Mode II (defocusing operation): when I a v > I s a t + Δ I h y s , the system leaves the tracking attitude; the solver recomputes the target attitude so that the effective surface irradiance is regulated to I s a t via the forced cosine projection relation (Equation (13)):
    θ i n * = arccos ( I s a t / ( I 0 ξ ) )
At this time, the motor-driven reactor deviates from the direct solar radiation direction and precisely limits the surface radiation intensity to the safety threshold I s a t .
  • Hysteresis dead band: The hysteresis logic implemented in the state machine is strictly defined as follows: if Mode I and I a v > I s a t + Δ I h y s switch to Mode II; if Mode II and I a v < I s a t Δ I h y s switch to Mode I. When the real-time irradiance fluctuation enters the transition zone, the algorithm maintains the current mechanical state unchanged. By issuing a “no action” command, the algorithm avoids high-frequency spurious switching caused by rapid changes in weather, ensuring the stability and service life of the mechanical system.

2.3.4. Structural-Control Co-Optimization and Rigid Dead Zone Protection

To this end, we apply a rigid deadband saturation module at the controller output to force this:
u f i n a l ( k ) = sat ( u ( k ) , ± 70 ° )
This constraint mechanism protects against over-execution and enables the system to operate stably as it approaches the functional limits. This closes the opto-mechanical–biological feedback loop.
At the same time, the optimization process also needs to analyze the influence of structural parameters on the control behavior. Specifically, the tube pitch and drive link length together determine the shading characteristics, kinematic nonlinearity, and the maximum achievable tilt range [22].
Rather than pursuing a purely theoretical optimum, this paper focuses on configurations near the feasible motion boundary under actual conditions. Such a configuration can generally achieve a good balance between land use, canyon shading reduction, and attitude control stability.

2.4. Numerical Implementation and Simulation Protocol

2.4.1. Solver Configuration and Time Discretization

The plant dynamics are integrated with a fixed-step fourth-order Runge–Kutta scheme at h = 0.1 s. The controller operates at a sampling period of 1 s, such that each control update is preceded by 10 integration sub-steps of the plant. The control signal is held constant between updates (zero-order hold).

2.4.2. Simulation Environment and Scenario Setup

All simulations are implemented in Python (version 3.1, Python Software Foundation, Wilmington, DE, USA) using NumPy and SciPy libraries. A 24 h a discrete-time simulation environment is constructed to evaluate the coupled opto-mechanical–biological framework and the hysteresis-based dual-mode defocusing PID control strategy. The primary simulation scenario assumes clear-sky conditions during typical daytime operational periods (08:00–18:00), with peak surface irradiance reaching 1000 W/m2 under standard test conditions.
Direct normal irradiance is computed with the Meinel & Meinel clear-sky model [36] combined with the Kasten–Young air-mass formulation [37], using standard astronomical solar-position equations (Cooper declination). The implementation was verified against the NOAA solar-position algorithm (maximum positional deviation 0.31°) and the Ineichen–Perez clear-sky model (DNI deviation −1.4% to −5.6% over the day). The simulated day is the summer solstice (21 June) at 23.5° N, UTC+8, representing peak annual irradiance loading. The diffuse component is neglected on the clear-sky design day. The multirate solver defined in Section 2.4.1 (RK4 plant integration at h = 0.1 s nested within the 1 s control sampling period) is used throughout. All boundary conditions, initial states, and the optimization grid (tube pitch P ∈ [63, 75] mm and the corresponding tube count parameter range) have been explicitly defined for the simulation.
The PID controller is tuned with a discrete sampling period of Ts = 1 s, with fixed gains of Kp = 1.25, Ki = 0.05 and Kd = 0.10 (Table 2) to minimize steady-state tracking error without inducing high-frequency actuator chattering.

2.4.3. Model Validation Protocol and Verification Hierarchy

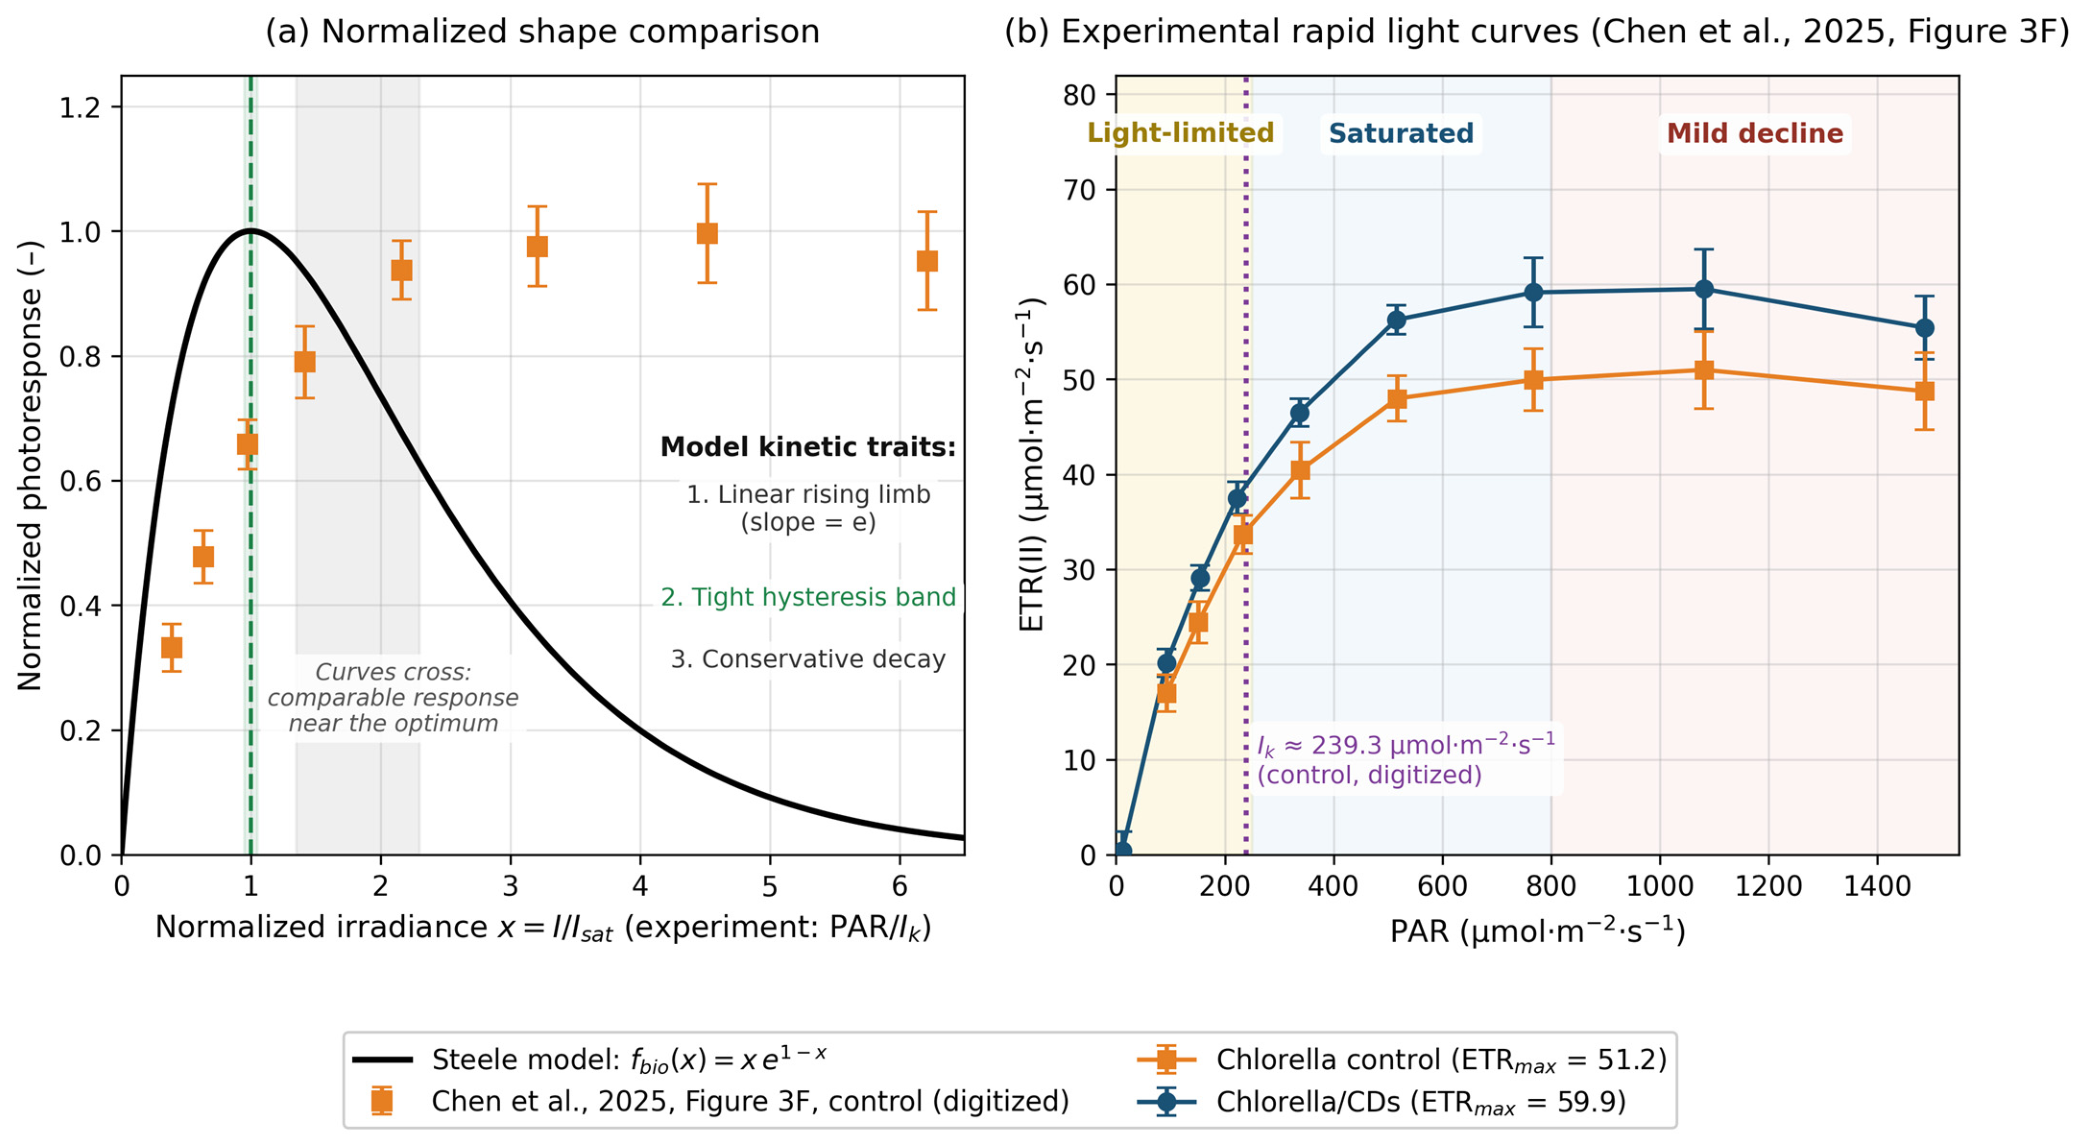
In the absence of a 100-liter-scale pilot plant, the validation in this study is structured hierarchically. At the sub-model level, the biochemical consistency of the core photoresponse penalty function (fbio) is assessed through indirect validation: steady-state light-response curves predicted by the Steele model (Equation (8)) are compared against publicly tabulated experimental data for Chlorella vulgaris, with a focus on reproducing the characteristic nonlinear decay in photosynthetic efficiency when incident photon flux density exceeds the light saturation threshold ( I s a t = 450   W / m 2 ) [38]. At the system level, internal consistency is verified through multi-scenario numerical simulations of the complete dual-mode tracking framework. This protocol provides a rigorous physics-based proof of concept, while we explicitly acknowledge that it does not substitute for system-level experimental validation; full-scale outdoor prototype testing, including actual BPV electrical-output measurements under dynamic environmental conditions, remains an essential future step to fully validate the proposed control framework.
The normalized Steele photoresponse f b i o ( I ) = ( I / I s a t ) exp ( 1 I / I s a t ) is adopted as a shape-level model of the photoinhibited biological response: it is the standard functional form for light-saturated, photoinhibited photosynthesis in the microalgal literature, and it provides the two features the controller uses—a single saturation optimum at Isat and a declining response beyond it. The absolute power level is anchored separately to power densities reported in the literature through Pmax (Section 2.2.4); no calibration of the curve against measured BPV electrical output is claimed.
The support for the biological model is therefore threefold and explicitly bounded: (1) the functional form is standard in the literature for photoinhibited photoresponse; (2) the saturation irradiance Isat = 450 W/m2 follows the value reported for Chlorella vulgaris [31]; and (3) the sensitivity of every reported result to Isat and Pmax is quantified in Section 2.4.5 and Section 3.5. Experimental validation against measured BPV output is beyond the scope of this simulation study and is identified as future work.

2.4.4. Baseline Strategies and Performance Metrics

To objectively quantify the net energy benefit of the proposed dual-mode strategy, two baseline configurations are established for comparison:
  • Baseline A (latitude-based fixed tilt): a static tubular array facing true south (azimuth = 0°) with tilt equal to the local geographical latitude (23.5°). This is the standard passive engineering choice for maximizing annual solar interception of static collectors; it is not presented as an optimized configuration. The baseline incurs no actuator energy consumption but is exposed to canyon-effect shading at low solar elevations and to photoinhibition around solar noon.
  • Baseline B (continuous dual-axis tracking): the array tracks the sun continuously under the same actuator model and the same loss accounting as the dual-mode system, including driving power and standby holding power.
To ensure a methodologically consistent comparison, the biological output model P b i o = P m a x f b i o ( I e f f ) and the canyon-effect shading model are applied identically to all three configurations; net energy yield is gross biological output minus actuator consumption for the active configurations. For the active configurations, the net energy yield is calculated by subtracting the continuous mechanical control efforts—including the simulated torque-based active driving power (Section 2.2.4) and the standby holding power (3.5 W)—from the gross BPV output.
Because Baseline B (continuous dual-axis tracking) maintains normal incidence at all times, it more frequently drives the reactor into the photoinhibition regime and therefore experiences a systematically stronger biological penalty fbio than the dual-mode strategy, which actively limits irradiance near the saturation threshold. This asymmetry in biological stress is an inherent consequence of the different control strategies and constitutes the core question that the present framework aims to quantify, rather than a methodological unfairness in the baseline definition.
The primary performance metric is the daily net energy yield ( E n e t ), defined as the time integral of electrical output minus tracking-related parasitic power consumption over the 10 h operational window (Equation (11)). Secondary metrics include the percentage improvement in net energy yield relative to Baseline A and the hysteresis switching frequency (number of Mode I/II transitions per day).

2.4.5. Robustness Testing Protocol

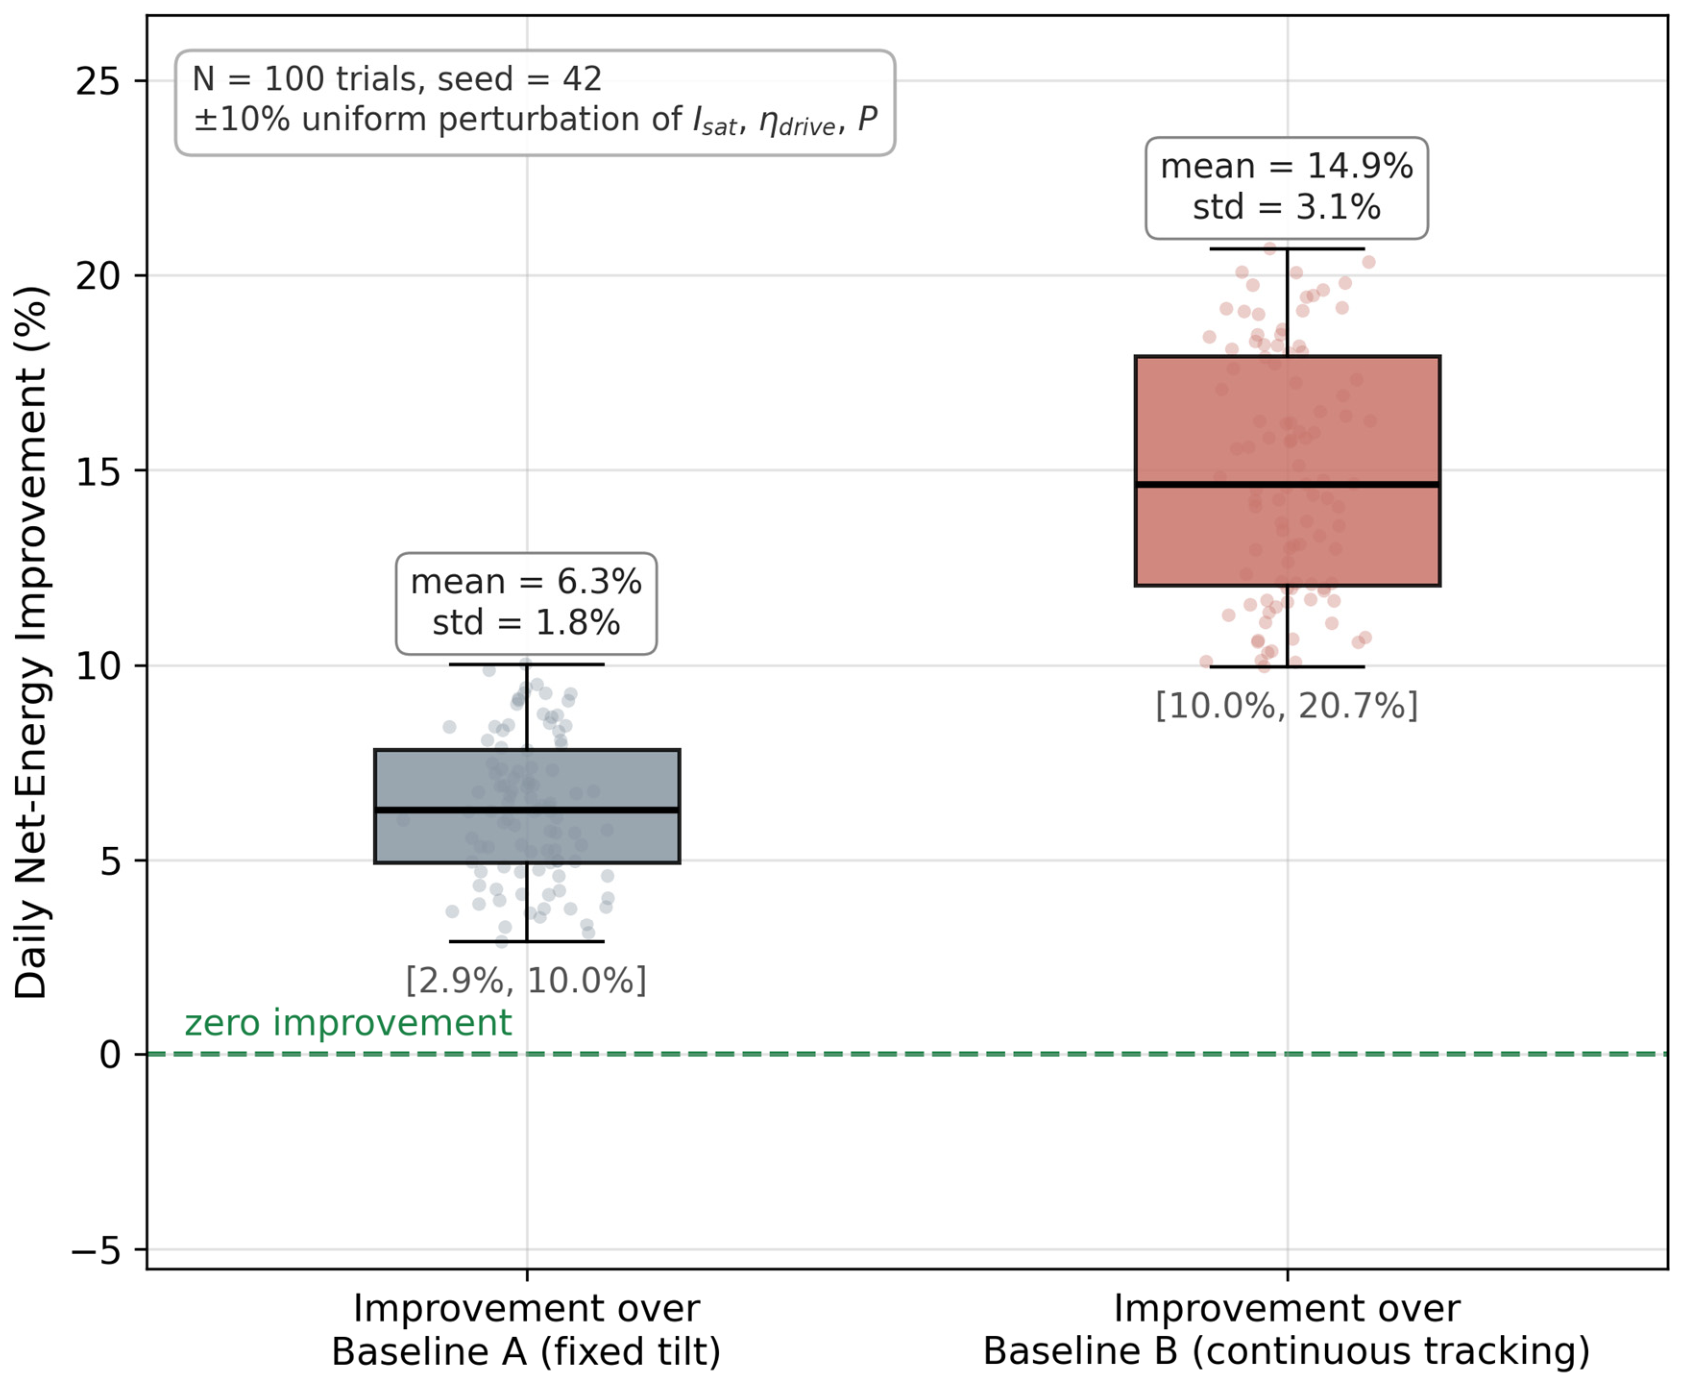
To evaluate performance under real-world uncertainty, two supplementary test protocols are implemented. Uncertainty is quantified by N = 100 Monte Carlo trials with independent uniform ±10% perturbations on the saturation irradiance Isat, the drive efficiency ηdrive, and the tube pitch P, using a fixed random seed (seed = 42). Outcomes are reported as mean ± standard deviation with the observed min–max range. Sensor-noise robustness is evaluated with additive zero-mean Gaussian noise (σ = 50 W/m2) on the irradiance measurement during the midday defocusing window (12:00–12:30, seed = 7); mode transitions are counted from the simulated switching signal.

3. Results

The results presented in this section are derived from the multi-physics simulation framework and the baseline configurations defined in Section 2. All numerical values, thresholds, and dynamic trajectories are generated under the established parameter boundaries; specific scenarios and boundary conditions corresponding to each analysis are detailed in the respective figure captions.

3.1. Pseudo-Experimental Benchmarking and Solver Configuration

Following the model validation protocol described in Section 2.4.3, the core photoresponse penalty function was benchmarked against experimental rapid-light-curve data for Chlorella vulgaris digitized [38] (Figure 6). The comparison confirms the unimodal structure of the Steele response—an optimum at the saturation irradiance followed by a declining photoinhibited branch—while the decay beyond the optimum is deliberately steeper than the short-exposure fluorometric reference, such that the steady-state penalty acts as a conservative envelope for chronic daily exposure. Within this validated configuration, the dual-mode controller and benchmark tracking strategies are implemented using a fixed-step fourth-order Runge–Kutta scheme nested within a 1 s control sampling period, and the subsequent subsections present the resulting dynamic behavior and energy yield performance.

3.2. Dynamic Tracking Behavior and Microclimate Stabilization

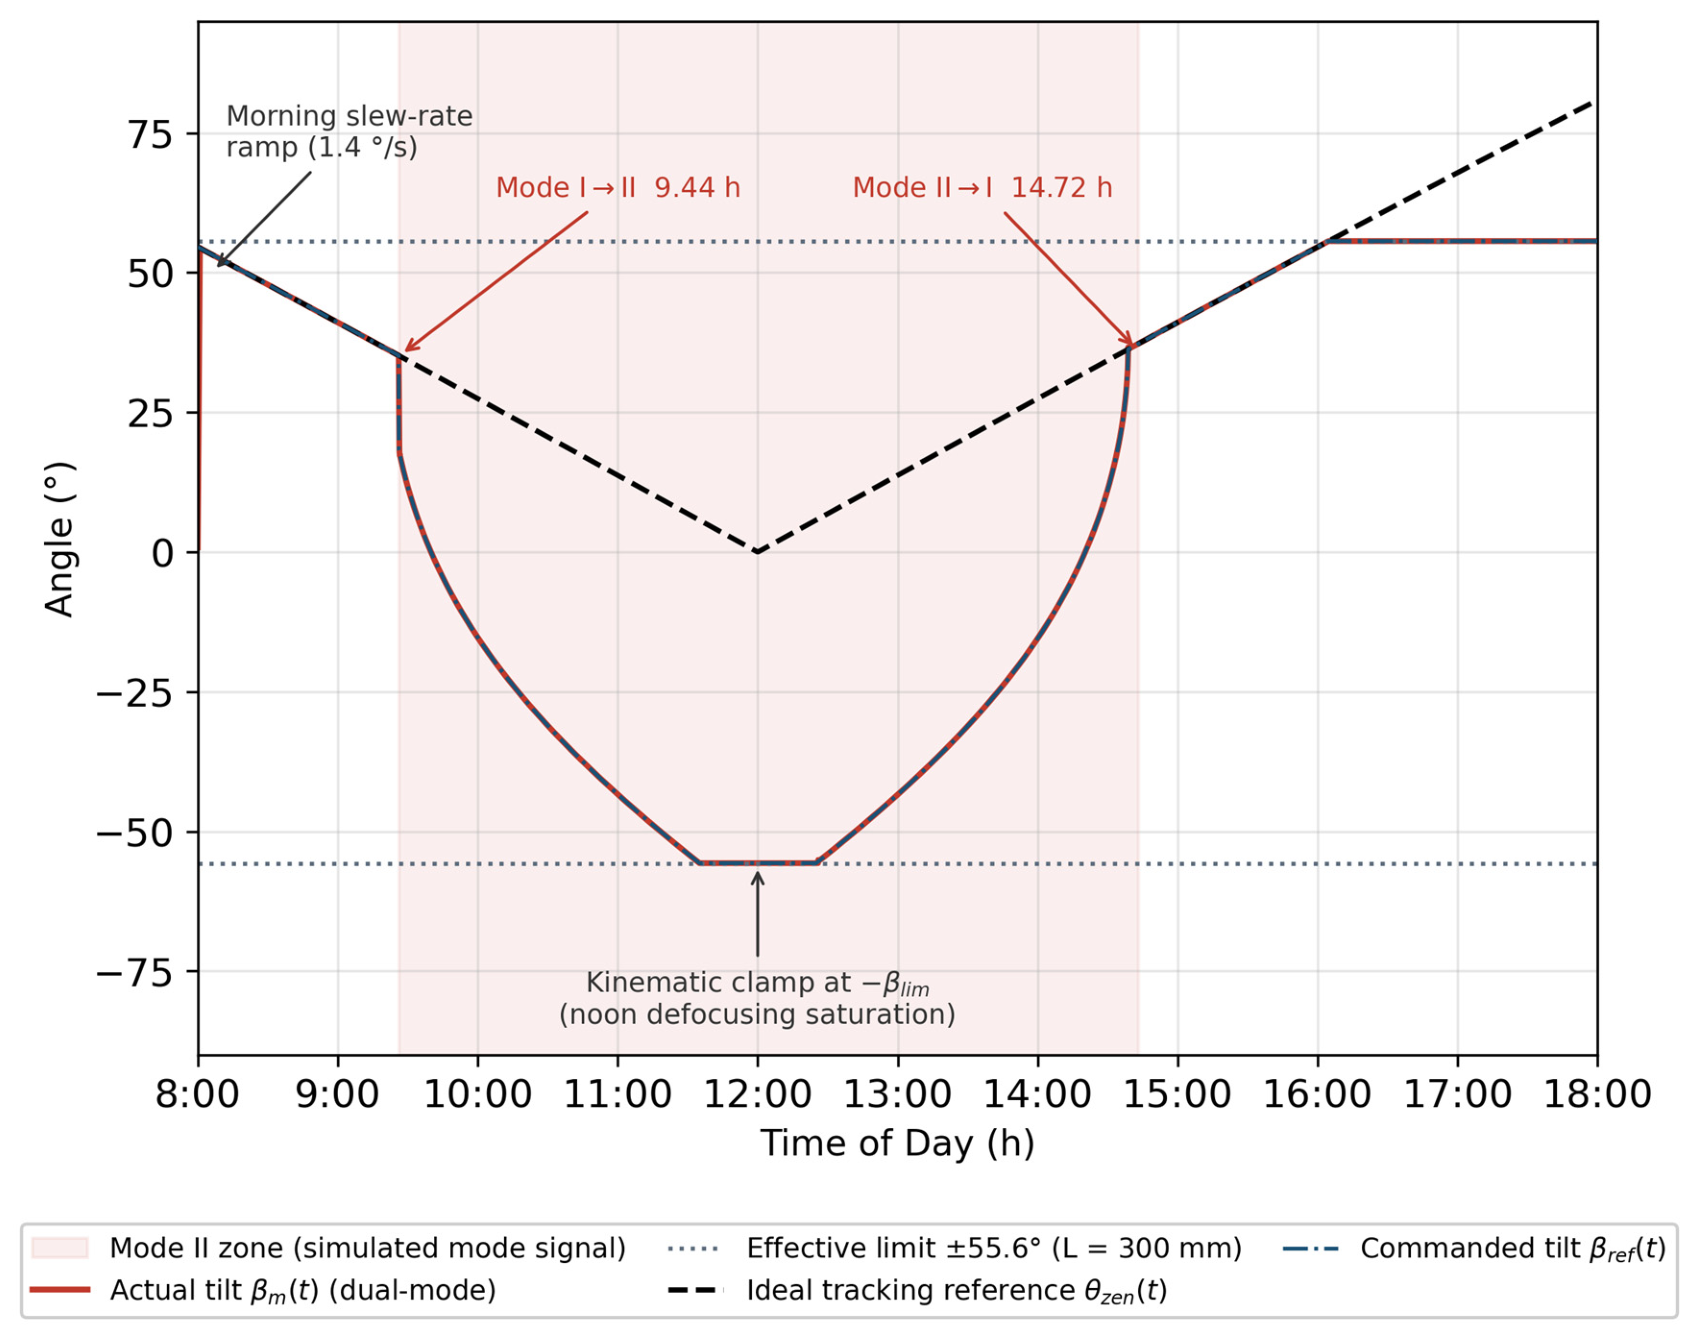
Figure 7 illustrates the difference between conventional solar tracking and the proposed dual-mode control strategy. Unlike conventional algorithms that minimize the incidence angle to maximize photon capture, this behavior demonstrates the feasibility of utilizing mechanical attitude control as an active optical throttle. By deliberately increasing the incidence angle θact during solar noon (as governed by the dynamic incidence angle model in Equation (3) and the forced cosine projection in Equation (13)), the system establishes a controlled photonic ceiling at I s a t = 450 W/m2. This mechanism indicates that mechanical systems can be designed to respond to biological irradiance thresholds—not merely to geometric solar angles.
In the early morning and late afternoon, the mechanical trajectory closely follows the ideal solar path within the imposed tilt limits. As shown in Figure 7, the mechanical tilt angle deviates from the ideal tracking trajectory at midday.
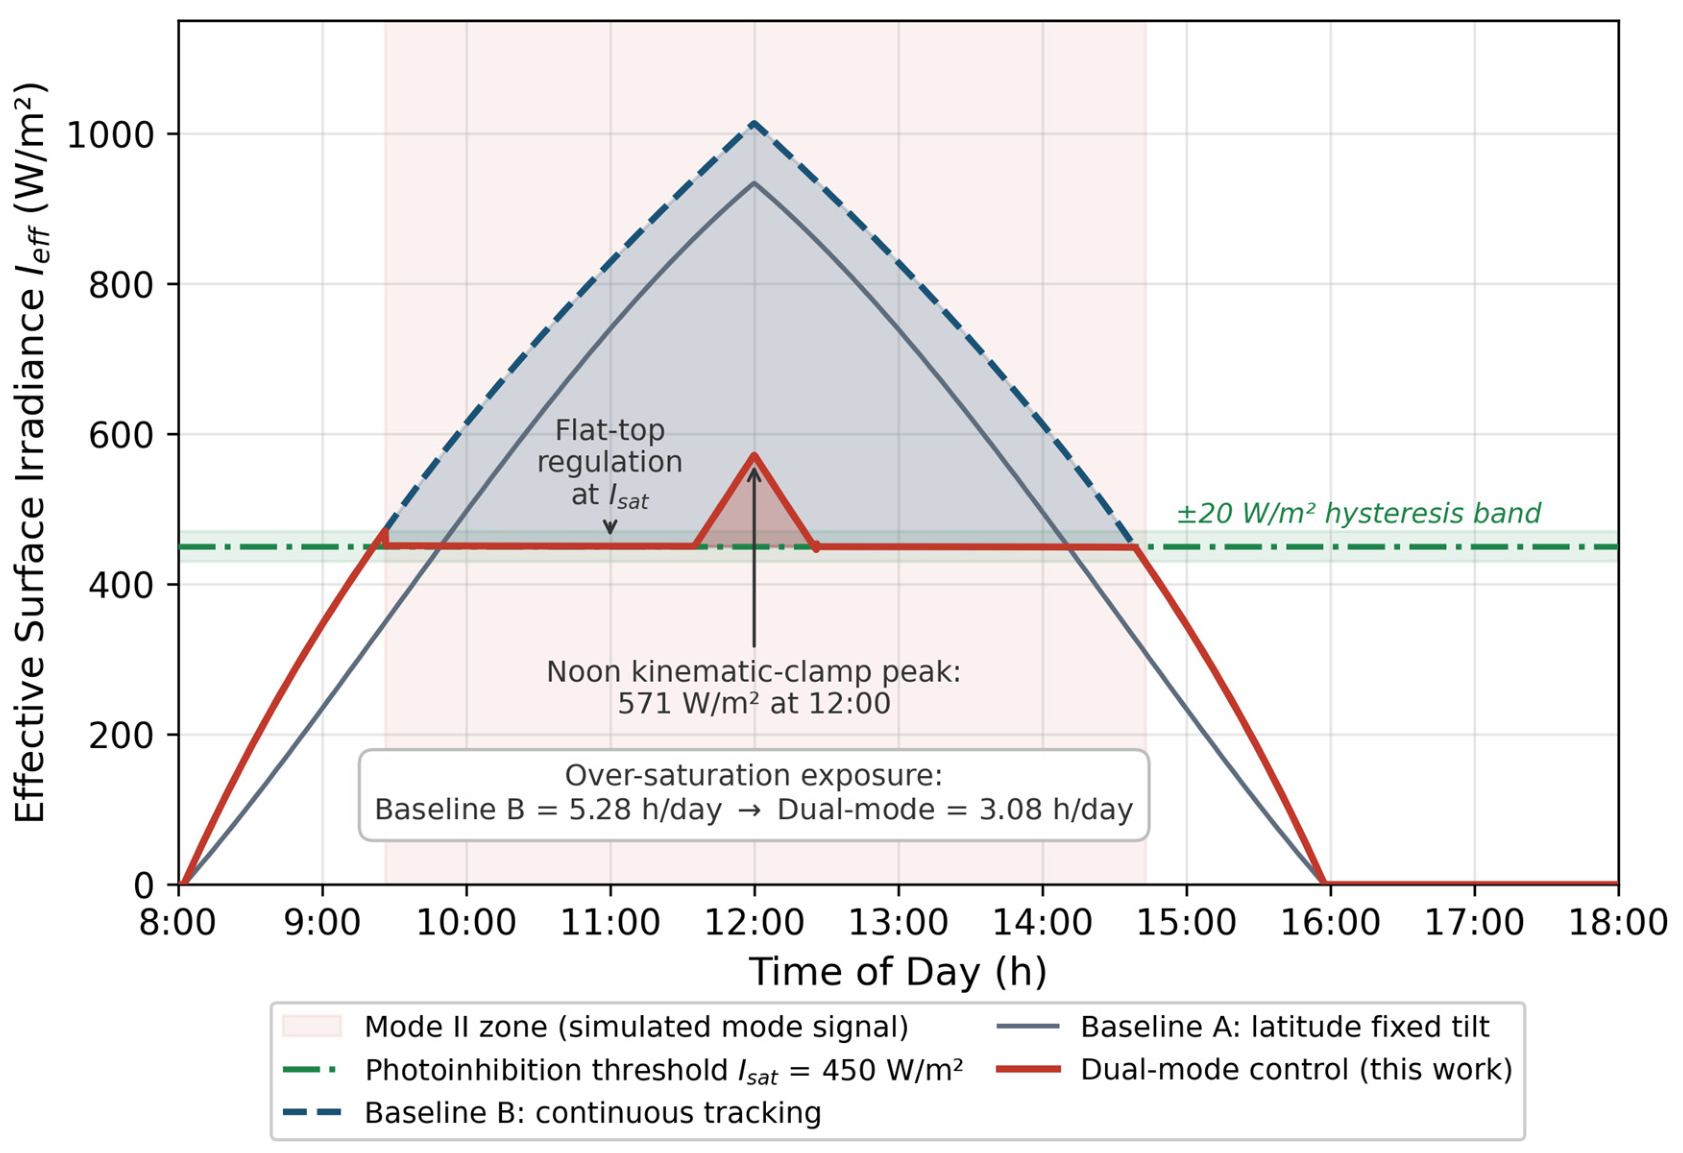
The irradiance stabilization shown in Figure 8 and Figure 9 extends beyond mere optical leveling. During Mode II operation (5.28 h/day under the nominal scenario), the effective irradiance is regulated to 450 ± 20 W/m2, reducing the daily over-saturation exposure of the culture from 5.28 h/day (Baseline B) to 3.08 h/day. Numerically, the Mode II activation duration coincides with the baseline over-saturation window, since the defocusing mode is triggered precisely within the over-saturation interval. The present steady-state model does not resolve NPQ kinetics or ROS dynamics; the exposure-duration reduction is therefore reported as the model-supported benefit, and its physiological consequences are identified as an experimental question for future work.
If Baseline B is used, the array will inevitably force surface irradiance beyond a critical point, causing large-scale photoinhibition. The dual-mode strategy directly regulates incident irradiance to mitigate excessive illumination during peak periods. It can improve irradiance uniformity and reduce the likelihood of photoinhibition under high-light conditions. While noon protection is critical, overall performance depends more on off-peak hours.
Figure 9 independently quantifies the canyon-effect shading penalty at low solar altitudes, providing complementary evidence for the optical–biological coupling mechanism discussed above.

3.3. Co-Optimization of Structural Parameters

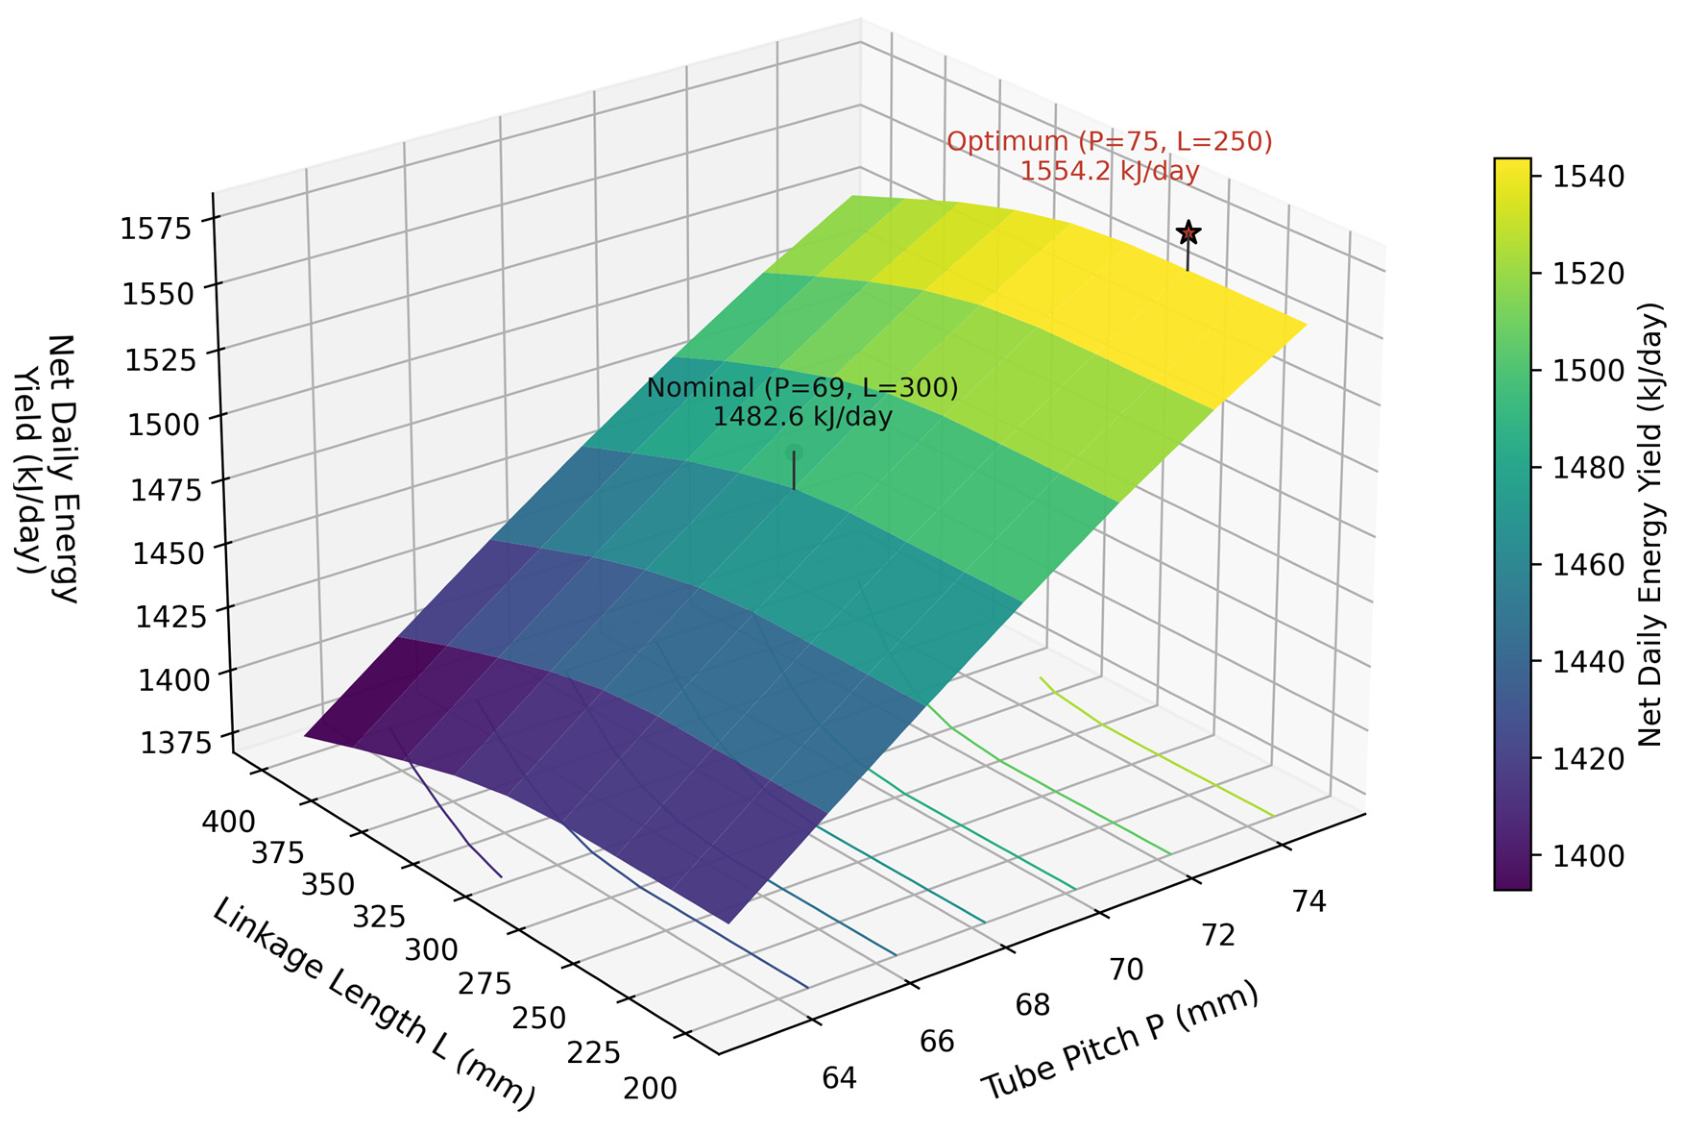
Tube pitch P and linkage length L are key design variables governing macroscopic scale shadows and system drive nonlinearity. To explore the combined effects of both, we conducted a global grid search in a two-dimensional parameter space, with values ranging from 63 to 75 mm (P) and 200 to 400 mm (L), to systematically evaluate the net daily energy yield achievable by different parameter combinations.
The 3D response surface shown in Figure 10 reveals an obviously infeasible region of the system under the combined effects of geometric and control constraints. Specifically, the rigid dead zone constraint ( | θ m | 70 ° ) significantly compresses the action space of the drive mechanism, while the excessively narrow tube spacing increases the risk of interference with the physical wall, both of which together lead to substandard performance in this region. The finalized optimal configuration lies at the boundary of the feasible domain and requires a delicate balance between land use efficiency (e.g., volumetric productivity) and deep shadowing: as described in the literature, efficiency gains are often accompanied by an increase in shadowing, confirming the existence of an inherent contradiction between the design variables. This finding provides a key rationale for system optimization.

3.4. Comprehensive Assessment of Net Energy Yield

The core of the industrial feasibility assessment is to balance optical capture efficiency with tracking energy consumption. We compare three strategies: Baseline A (latitude-based fixed tilt, zero tracking cost), Baseline B (continuous dual-axis tracking), and the proposed dual-mode strategy.
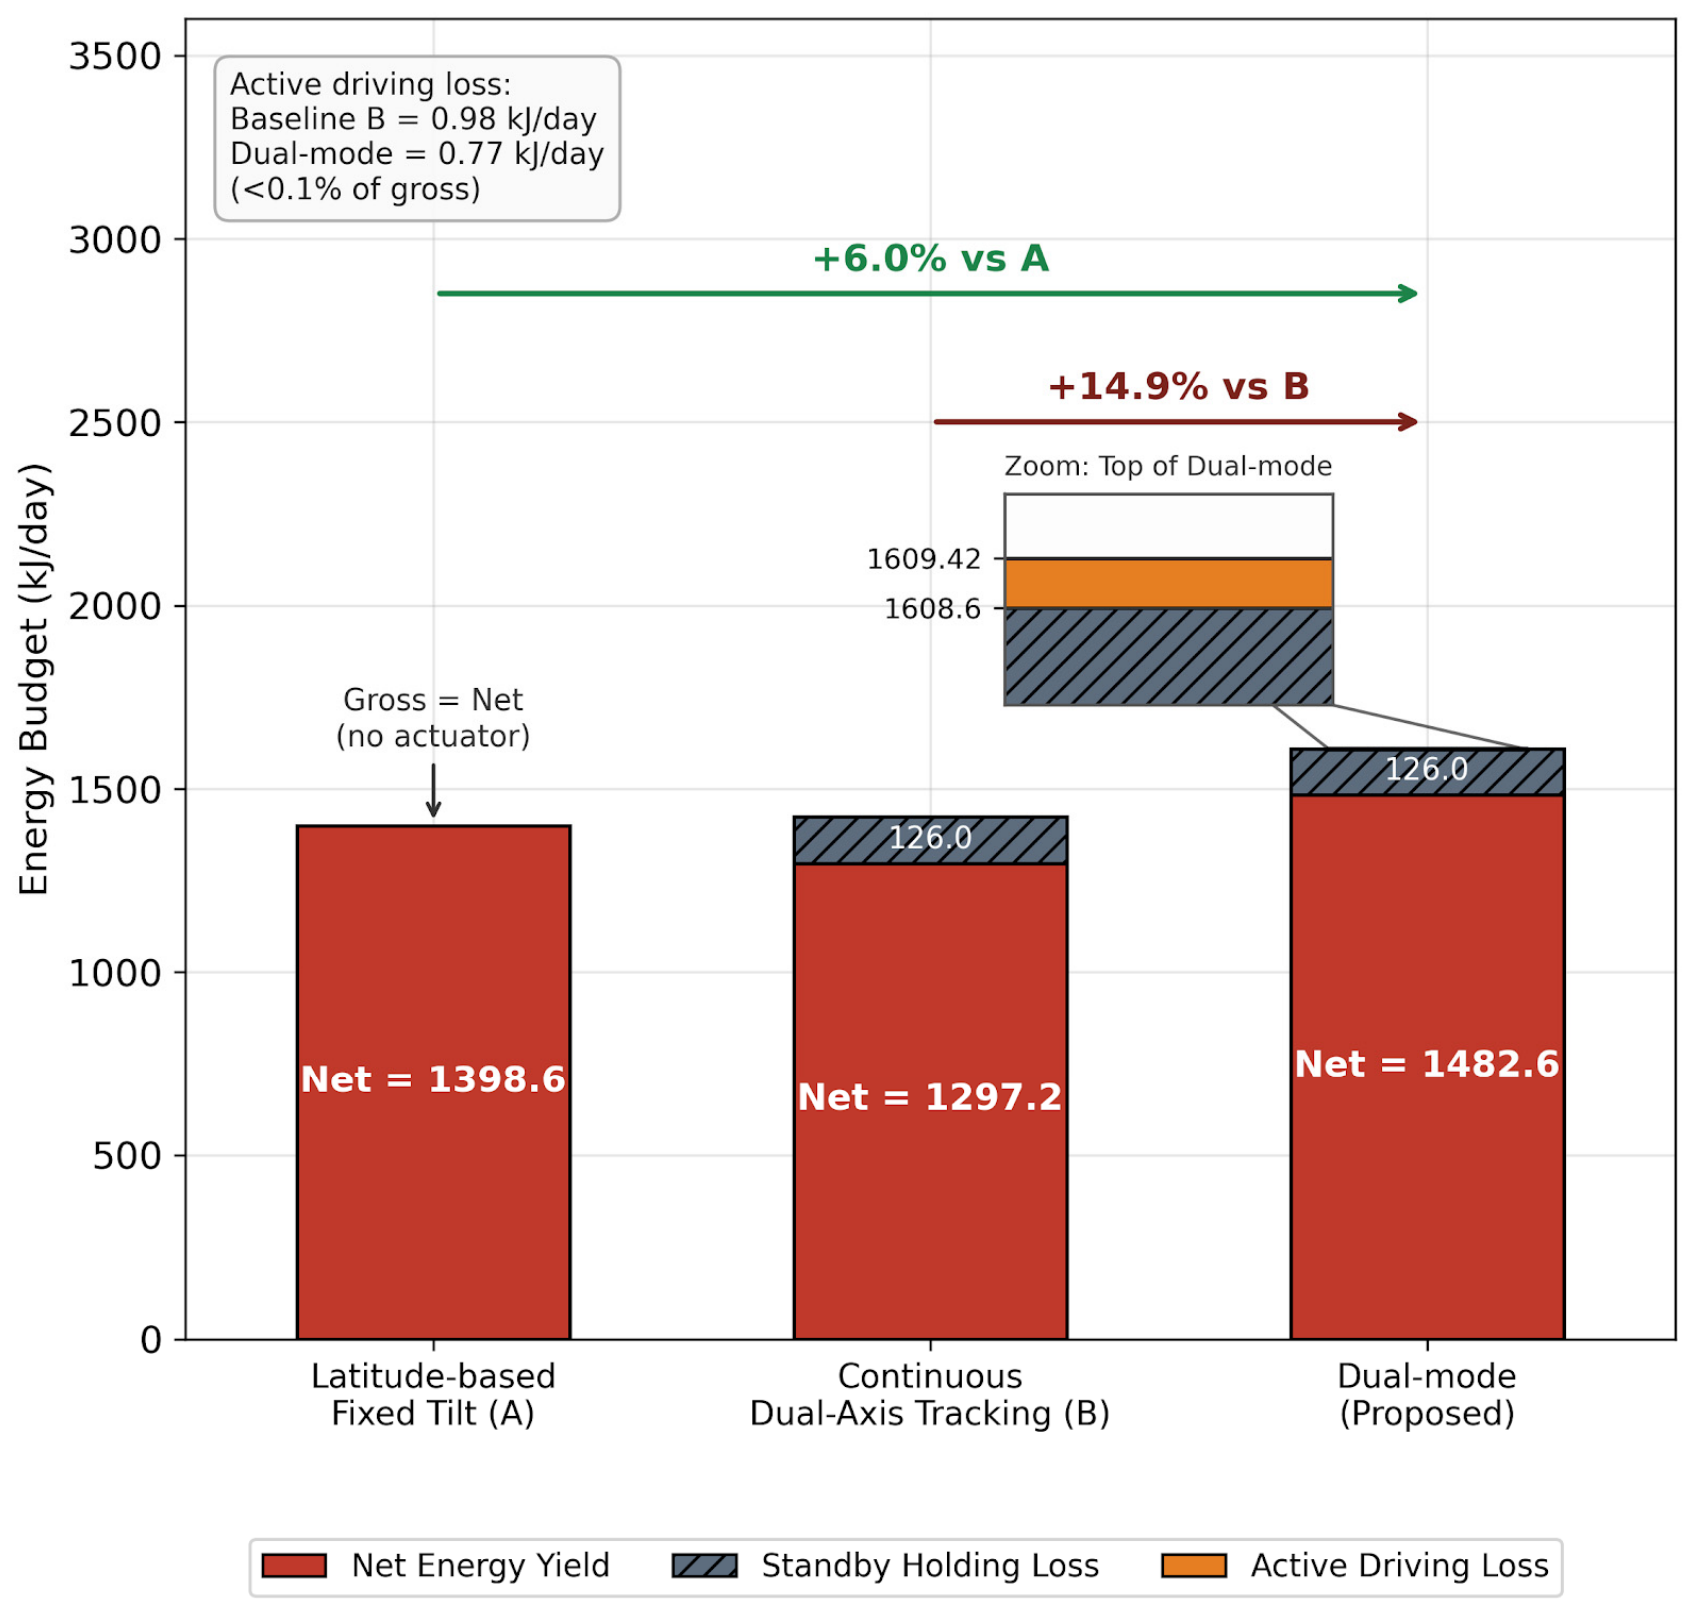
Figure 11 shows that the dual-mode array outperforms both baselines in daily net energy yield. Under the nominal clear-sky design day, and after tracking-related energy consumption is taken into account under identical loss accounting, the dual-mode strategy improves the daily net energy yield by +14.9% over continuous dual-axis tracking (Baseline B) and +6.3% over the latitude-based fixed tilt (Baseline A). These values are simulation-derived estimates rather than validated performance gains.
Under the lower-bound biological scenario ( P m a x = 0.54   W / m 2 ), both active configurations yield negative net energy benefits (−13.9 kJ/day for the dual-mode strategy and −27.1 kJ/day for Baseline B, versus +98.1 kJ/day for the passive Baseline A): the passive baseline dominates at this power density, delineating the feasibility boundary of active solar management for BPV systems—active attitude control is energetically justified only above a threshold biological power density. Although Baseline B can improve instantaneous energy capture efficiency, the dual effects of light suppression and actuator energy consumption often detract from the system’s net output performance during peak irradiation periods.

3.5. Disturbance Sensitivity and Robustness Analysis

The nominal results are subject to asymmetric uncertainties. Overestimation risks include the idealized clear-sky design day, the steady-state biological model, and the nominal P m a x at the theoretical upper limit. Underestimation risks include the torque-based actuator model with safety factor SF = 2 , standby holding power charged over the full day, and wind-loading at 6 m/s operational/15 m/s survival ratings. These factors are quantified individually rather than merged into a single bound claim.
Across the 100 trials, the net energy yield improvement over the latitude-based fixed-tilt baseline is +6.3% ± 1.8% (mean ± std), with an observed range of +2.9% to +10.0% (Figure 12); the improvement is positive in every trial. The improvement over Baseline B is +14.9% ± 3.1% (range +10.0% to +20.7%) and likewise remains positive in every trial. The dual-mode benefit is therefore robust to simultaneous ±10% uncertainty in the biological, mechanical, and geometric parameters.
Under additive irradiance noise ( σ = 50   W / m 2 , 12:00–12:30), the controller executes two mode-switching events, identical to the noise-free reference case: the ±20 W/m2 hysteresis band prevents noise-induced chattering during the defocusing window. The defocusing setpoint tracking error under noise remains within the hysteresis band throughout the disturbance interval.
The hysteresis band (±20 W/m2) is an anti-chattering design feature: in simulation it yields two switching events per day under the nominal scenario, and this count is unchanged under additive measurement noise ( σ = 50   W / m 2 ). A formal closed-loop stability proof is beyond the scope of this study; the reported behavior is the simulated switching performance of the implemented controller. The results show that the system can maintain a robust positive energy yield even if the hardware and meteorological conditions deviate from the ideal state.

4. Discussion

The structure-control collaborative optimization framework developed in this study realizes the integrated design of geometry and control strategy under biological constraints, formally coupling a nonlinear photobiological penalty function with a rigid-body kinematic tracking model and a closed-loop net energy balance objective. The observed theoretical improvement in daily net energy yield demonstrates that dynamic regulation of irradiance distribution is a more appropriate optimization strategy compared to simply pursuing maximum photon capture—a conclusion that holds even under the conservative mechanical energy consumption boundary (Pmotor = 12 W, SF ≥ 2.0) adopted in this study. The underlying mechanism is energetically favorable under the modeled conditions: under high-irradiance conditions, the biological output preserved by maintaining microalgal cultures below the photoinhibition threshold substantially outweighs the continuous parasitic electromechanical losses of the dual-axis tracking system. This finding establishes a theoretical boundary condition where active mechanical intervention is energetically justified for low-power-density biological systems—a condition that cannot be determined from optical efficiency metrics or gross power output alone.
The primary scientific contribution of this study is the direct numerical coupling of a nonlinear photobiological penalty function—specifically, the Steele-type photoresponse curve governing microalgal light saturation and photoinhibition—with a rigid-body kinematic tracking model and a closed-loop net energy balance framework, applied to a tubular BPV array configuration. Prior BPV studies have addressed optical optimization, biological photoinhibition modeling [5,6,12,13,14,15], and control-oriented tracking [7,16,17,18] as separate problems, but the nonlinear biological–kinematic interaction that emerges when a mechanical actuator must satisfy a biologically defined irradiance ceiling has not been quantitatively characterized in a net energy framework for BPV systems. It is precisely this interaction that the dual-mode adaptive defocusing framework formalizes.
Limitations of the Simplified Biological Model: Several simplifying assumptions define the theoretical scope of the present framework and must be acknowledged for proper interpretation of the results. First, the biological model employs a steady-state Steele photoresponse function calibrated to Chlorella vulgaris under well-mixed culture conditions; transient intracellular processes including non-photochemical quenching (NPQ) kinetics, reactive oxygen species (ROS) accumulation, and temperature-dependent metabolic shifts are not resolved. Second, the optical model omits internal light gradients within the algal suspension, potential biofouling-induced glass surface attenuation, and the microlensing effect induced by the cylindrical tube geometry. Third, the isothermal assumption does not account for temperature-induced inhibition effects arising from thermo-optical coupling under peak solar loading. Fourth, the electrochemical subsystem is represented by a lumped extraction-efficiency coefficient η e x t = 0.82 rather than a full kinetic electrode model. Both the lumped extraction-efficiency coefficient η e x t = 0.82 and the attenuation coefficient κ = 0.15 mm−1 are chosen within experimentally reported ranges for graphene-based BPV electrodes and well-mixed Chlorella cultures at biomass concentrations of 1.2–1.8 g/L, respectively, so that the macroscopic behavior remains representative despite the simplified treatment. Collectively, these omissions mean that the reported +14.9% and +6.3% improvements represent simulation-derived estimates under idealized clear-sky, isothermal, and biofouling-free conditions. Consequently, no claim regarding the prevention of photodamage is made; the model quantifies exposure duration above the saturation threshold, and any physiological benefit must be established experimentally. The actuator consumption is parameterized from a bottom-up torque budget rather than measured on hardware. Experimental prototype validation and year-round TMY-driven simulation are required future work. The impact of ±10% perturbations in the key optical, biological and mechanical parameters on daily net energy yield has been quantified in Section 3.5, which indicates that the qualitative conclusions of the framework remain robust within this uncertainty band. Future studies should couple CFD, heat transfer, and radiation transport models to more fully resolve the internal micro-environment of the reactor, thereby providing the theoretical substrate for Life Cycle Assessment (LCA) and Techno-Economic Analysis (TEA) for large-scale BPV deployments.
Meteorological Variations and Seasonal Applicability: Under realistic meteorological profiles—such as overcast days with high diffuse radiation or winter seasons with lower peak solar elevation—the local effective irradiance may naturally remain below 450 W/m2. Under such conditions, the defocusing mode would not be triggered. In this regime the system reduces to a conventional dual-axis tracker: the strategy degrades gracefully rather than failing. Under such conditions, however, the marginal energy benefit of tracking itself diminishes, and the bandwidth analysis (Section 3.5) delineates the biological power-density range over which active solar management remains energetically justified. Transitioning this proof-of-concept to real-world deployment will require coupling the algorithm with annual Typical Meteorological Year (TMY) datasets to optimize the tracking-standby logic across multi-day cloudy conditions. It should be emphasized that, in the present work, these cloudy-sky and seasonal effects are discussed qualitatively only; quantitative long-term simulations using full Typical Meteorological Year (TMY) datasets remain outside the current scope and are identified as a priority for future extensions of the framework.
Framework Versatility and Applicability to Diverse Algal Strains: The proposed dual-mode framework features a species-agnostic control architecture that extends its applicability beyond the Chlorella vulgaris case studied here. The controller’s decision logic is governed entirely by two biologically defined setpoints—the saturation irradiance threshold Isat and the biological penalty function fbio—both of which are strain-specific but freely reconfigurable. Adapting the framework to Spirulina (Arthrospira platensis), for instance, requires only updating Isat to match the strain’s characteristic photophysiological limit and adjusting the shape parameters of fbio to reflect its filamentous self-shading geometry and different light-harvesting antenna cross-section. The kinematic model, hysteresis switching logic, and net energy balance objective function remain structurally unchanged. This algorithmic flexibility positions the dual-mode defocusing strategy as a generalizable platform for optimizing energy yields across diverse electrogenic microorganism platforms, provided that the relevant strain-specific photoresponse parameters are experimentally characterized and supplied as calibration inputs. It should nevertheless be emphasized that all quantitative results in this study are parameterized for Chlorella vulgaris ( I s a t = 450 W/m2) with P m a x bounded by the literature range 0.54–7.7 W/m2. Transfer to other strains, reactor geometries, or latitudes requires re-parameterization; the bandwidth and Monte Carlo analyses (Section 3.5) indicate how sensitive the conclusions are to such changes, but do not constitute evidence of performance for other configurations.

5. Conclusions

In outdoor movable high-density tubular microalgae BPV systems, canyon-effect shading and photoinhibition phenomena lead to significant energy losses. To solve the above challenges, a hysteresis-based dual-mode defocusing PID controller with hysteresis switching is proposed in the framework of system optimization. The controller regulates the tubular array irradiance near the biological saturation threshold, thereby improving the operational stability of solar-integrated BPV systems.
Under the simulated nominal clear-sky design-day conditions, the dual-mode strategy achieves a daily net energy yield improvement of +14.9% over continuous dual-axis tracking and +6.3% over the latitude-based fixed-tilt baseline. These values are simulation-derived estimates obtained under idealized clear-sky and isothermal conditions; the conservative bottom-up actuator parameterization (12 W nameplate motor, gearbox safety factor SF = 2, standby holding power charged over the full day) ensures that the estimates remain robust even under elevated parasitic-loss boundary conditions. Nonetheless, the scientific significance of this framework lies not in this specific numerical outcome, but in its formal integration of nonlinear photobiological dynamics with rigid-body kinematics and net energy balance—a multi-physics coupling that has not been previously characterized in a net energy framework for BPV systems. This integration provides a quantitative theoretical basis for evaluating when active mechanical defocusing is energetically justified, establishing a mathematical benchmark for future experimental design and prototype validation.
The dual-mode strategy is robust to irradiance disturbances and parameter variations: across 100 Monte Carlo trials with ±10% perturbations, the net energy yield improvement over the latitude-based fixed-tilt baseline (Baseline A) remains positive in every trial (+6.3% ± 1.8%, range +2.9% to +10.0%), and the hysteresis controller maintains exactly two switching events under additive irradiance noise ( σ = 50   W / m 2 ). This framework offers a physics-based computational path to balancing light regulation and energy efficiency in BPV systems, pending future experimental prototype validation.
The dual-mode defocusing framework is presented as a physics-based simulation and evaluation tool. Practical deployment presupposes prototype-scale experimental validation and year-round TMY-based analysis, both identified as future work.

Supplementary Materials

The following supporting information can be downloaded at https://www.mdpi.com/article/10.3390/en19153597/s1: SM1: simulation scripts; SM2: full annotated parameter table; SM3: raw numerical output.

Author Contributions

Conceptualization and methodology, X.Z. and X.L.; resources, X.Z.; data curation and investigation, J.H. and L.G.; formal analysis, J.C.; writing—original draft preparation, X.Z.; writing—review and editing, X.Z. and X.L.; funding acquisition, J.H. All authors have read and agreed to the published version of the manuscript.

Funding

This research was funded by the Tri-level Talents Development Project of Zhuhai College of Science and Technology and the Key Special Foundation of universities in Guangdong Province, China (grant numbers 2024ZDJS135 and 2024ZDZX3003), and by the Natural Science Foundation Project of Guangdong Province, China (grant numbers 2026A1515010284).

Data Availability Statement

The data presented in this study are available in the Supplementary Material. The complete Python simulation scripts (utilizing NumPy and SciPy libraries), full optimization grid configurations, and the raw numerical output data supporting the findings of this study have been submitted as Supplementary Material.

Conflicts of Interest

The authors declare no conflicts of interest.

Abbreviations

The following abbreviations are used in this manuscript:
BPVBiophotovoltaic
PETPhotosynthetic Electron Transfer
NPQNon-Photochemical Quenching
ROSReactive Oxygen Species
PSIIPhotosystem II
DETDirect Electron Transfer
MCUMicrocontroller
STCStandard Test Conditions
RK4Fourth-Order Runge–Kutta
LCALife Cycle Assessment
TEATechno-Economic Analysis
SymbolDescription
I D N I Direct normal irradiance, clear-sky beam irradiance on a sun-normal plane (W/m2)
I a v Available beam irradiance measured by the sun-facing reference sensor; the mode-switching signal (W/m2)
I e f f Effective surface irradiance on the tubular array after cosine projection and canyon-effect shading; the regulated quantity and the argument of the biological response (W/m2)
f b i o ( I e f f ) Normalized biological photoresponse (dimensionless)
P m a x Peak areal power density (W/m2)
P Center-to-center tube pitch (mm)
D Tube outer diameter (mm)
G Clear gap (mm)
ξ Canyon-effect shading penalty factor, Equation (4) (dimensionless, dynamic)
β m ( k ) Actual mechanical tilt angle at step k (°)
β r e f Reference (target) tilt angle (°)
u ( k ) Commanded slew rate (°/s)
e ( k ) Tracking error (°)
Δ I h y s Hysteresis band around Isat (±20 W/m2)
ω m a x Slew-rate limit (1.4°/s)
J Rotational inertia of the array (kg·m2)
τ s , τ c Break-away static and Coulomb dynamic friction torques (N·m)
η d r i v e Drive-chain efficiency (–)
Note: All irradiances are reported in W/m2; for comparison with the microalgal literature, 1 W/m2 PAR ≈ 4.6 μmol photons m−2 s−1.

References

  1. Tschörtner, J.; Lai, B.; Krömer, J.O. Biophotovoltaics: Green Power Generation From Sunlight and Water. Front. Microbiol. 2019, 10, 866. [Google Scholar] [CrossRef] [PubMed]
  2. Yuan, J.; Appel, J.; Gutekunst, K.; Lai, B.; Krömer, J.O. Molecular dynamics of photosynthetic electron flow in a biophotovoltaic system. Environ. Sci. Ecotechnol. 2025, 23, 100519. [Google Scholar] [CrossRef] [PubMed]
  3. Quinn, J.C.; Turner, C.W.; Bradley, T.H. Scale-Up of flat plate photobioreactors considering diffuse and direct light characteristics. Biotechnol. Bioeng. 2012, 109, 363–370. [Google Scholar] [CrossRef] [PubMed]
  4. Janssen, M.; Tramper, J.; Mur, L.R.; Wijffels, R.H. Enclosed outdoor photobioreactors: Light regime, photosynthetic efficiency, scale-up, and future prospects. Biotechnol. Bioeng. 2003, 81, 193–210. [Google Scholar] [CrossRef] [PubMed]
  5. Sawa, M.; Fantuzzi, A.; Bombelli, P.; Howe, C.J.; Hellgardt, K.; Nixon, P.J. Electricity generation from digitally printed cyanobacteria. Nat. Commun. 2017, 8, 1327. [Google Scholar] [CrossRef] [PubMed]
  6. Nishiyama, Y.; Allakhverdiev, S.I.; Murata, N. A new paradigm for the action of reactive oxygen species in the photoinhibition of photosystem II. Biochim. Biophys. Acta BBA-Bioenerg. 2006, 1757, 742–749. [Google Scholar] [CrossRef] [PubMed]
  7. Tan, M.-H.; Wang, T.-K.; Wong, C.-W.; Lim, B.-H.; Yew, T.-K.; Tan, W.-C.; Lai, A.-C.; Chong, K.-K. Optimization Study of Parasitic Energy Losses in Photovoltaic System with Dual-Axis Solar Tracker Located at Different Latitudes. Energy Procedia 2019, 158, 302–308. [Google Scholar] [CrossRef]
  8. Tan, M.-H.; Wang, T.-K.; Wong, C.-W.; Chong, K.-K.; Lim, B.-H.; Yew, T.-K.; Tan, W.-C.; Lai, A.-C. Comprehensive Methodology to Evaluate Parasitic Energy Consumption for Different Types of Dual-Axis Sun Tracking Systems. Int. J. Photoenergy 2021, 2021, 2870386. [Google Scholar] [CrossRef]
  9. Sun, H.; Xie, X.; Ding, J. Electrogenic performance and carbon sequestration potential of biophotovoltaics. Sci. Nat. 2024, 111, 50. [Google Scholar] [CrossRef] [PubMed]
  10. Hu, Q.; Guterman, H.; Richmond, A. A flat inclined modular photobioreactor for outdoor mass cultivation of photoautotrophs. Biotechnol. Bioeng. 1996, 51, 51–60. [Google Scholar] [CrossRef]
  11. Slegers, P.M.; Wijffels, R.H.; van Straten, G.; van Boxtel, A.J.B. Design scenarios for flat panel photobioreactors. Appl. Energy 2011, 88, 3342–3353. [Google Scholar] [CrossRef]
  12. Kromdijk, J.; Głowacka, K.; Leonelli, L.; Gabilly, S.T.; Iwai, M.; Niyogi, K.K.; Long, S.P. Improving photosynthesis and crop productivity by accelerating recovery from photoprotection. Science 2016, 354, 857–861. [Google Scholar] [CrossRef] [PubMed]
  13. Sarkar, N.; Dhar, S.; Sen, R. Process engineering analysis of LED-driven microalgal growth and lipid lodgement dynamics through kinetic modelling and illumination energetic approach. Energy Convers. Manag. 2024, 322, 119127. [Google Scholar] [CrossRef]
  14. Steele, J.H. Environmental control of photosynthesis in the sea. Limnol. Oceanogr. 1962, 7, 137–150. [Google Scholar] [CrossRef]
  15. Nikolaou, A.; Bernardi, A.; Meneghesso, A.; Bezzo, F.; Morosinotto, T.; Chachuat, B. A model of chlorophyll fluorescence in microalgae integrating photoproduction, photoinhibition and photoregulation. J. Biotechnol. 2015, 194, 91–99. [Google Scholar] [CrossRef] [PubMed]
  16. Yu, G.; Li, Y.; Shen, G.; Wang, W.; Lin, C.; Wu, H.; Chen, Z. A novel method using CFD to optimize the inner structure parameters of flat photobioreactors. J. Appl. Phycol. 2009, 21, 719–727. [Google Scholar] [CrossRef]
  17. Zhao, R.; Wang, L.; Wang, Q.; Dai, S.; Han, Z.; Lei, X.; Mao, X.-Z. Integrated model for design, optimization, scale-up, culture scheme, and production evaluation of a bioreactor and its application for improving algal biomass and carbon fixation in bioreactors. ACS Sustain. Chem. Eng. 2022, 10, 15939–15949. [Google Scholar] [CrossRef]
  18. Uyar, B.; Ali, M.D.; Uyar, G.E.O. Design parameters comparison of bubble column, airlift and stirred tank photobioreactors for microalgae production. Bioprocess Biosyst. Eng. 2024, 47, 195–209. [Google Scholar] [CrossRef] [PubMed]
  19. Shoaei, M.; Kowsary, F. Multi-objective optimization of geometrical parameters of a pipe with internal baffle using artificial neural networks and genetic algorithm. Appl. Therm. Eng. 2025, 262, 125212. [Google Scholar] [CrossRef]
  20. Osman, I.S.; Almadani, I.K.; Hariri, N.G.; Maatallah, T.S. Experimental Investigation and Comparison of the Net Energy Yield Using Control-Based Solar Tracking Systems. Int. J. Photoenergy 2022, 2022, 7715214. [Google Scholar] [CrossRef]
  21. Al Abdulla, S.A.; Al Hammadi, K.; Al-Ali, H.; Alami, A.H.; Abdelkareem, M.A.; Olabi, A.G. Experimental development of a biological photovoltaic cell (BPV) for energy conversion and simultaneous CO2 capture by utilizing marine microalgae on copper mesh. Renew. Energy 2024, 223, 120096. [Google Scholar] [CrossRef]
  22. Alexandru, C. Simulation and Optimization of a Dual-Axis Solar Tracking Mechanism. Mathematics 2024, 12, 1034. [Google Scholar] [CrossRef]
  23. Reda, I.; Andreas, A. Solar position algorithm for solar radiation applications. Sol. Energy 2004, 76, 577–589. [Google Scholar] [CrossRef]
  24. Fernández, F.G.A.; Camacho, F.G.; Pérez, J.A.S.; Sevilla, J.M.F.; Grima, E.M. A model for light distribution and average solar irradiance inside outdoor tubular photobioreactors for the microalgal mass culture. Biotechnol. Bioeng. 1997, 55, 701–714. [Google Scholar]
  25. Wágner, D.S.; Valverde-Pérez, B.; Plósz, B.G. Light attenuation in photobioreactors and algal pigmentation under different growth conditions – Model identification and complexity assessment. Algal Res. 2018, 35, 488–499. [Google Scholar] [CrossRef]
  26. Nikolaou, A.; Hartmann, P.; Sciandra, A.; Chachuat, B.; Bernard, O. Dynamic coupling of photoacclimation and photoinhibition in a model of microalgae growth. J. Theor. Biol. 2016, 390, 61–72. [Google Scholar] [CrossRef] [PubMed]
  27. Tay, Z.H.-Y.; Ng, F.-L.; Ling, T.-C.; Iwamoto, M.; Phang, S.-M. The use of marine microalgae in microbial fuel cells, photosynthetic microbial fuel cells and biophotovoltaic platforms for bioelectricity generation. 3 Biotech 2022, 12, 148. [Google Scholar] [CrossRef] [PubMed]
  28. Saar, K.L.; Bombelli, P.; Lea-Smith, D.J.; Call, T.; Aro, E.-M.; Müller, T.; Howe, C.J.; Knowles, T.P.J. Enhancing power density of biophotovoltaics by decoupling storage and power delivery. Nat. Energy 2018, 3, 75–81. [Google Scholar] [CrossRef]
  29. McCormick, A.J.; Bombelli, P.; Bradley, R.W.; Thorne, R.; Wenzel, T.; Howe, C.J. Biophotovoltaics: Oxygenic photosynthetic organisms in the world of bioelectrochemical systems. Energy Environ. Sci. 2015, 8, 1092–1109. [Google Scholar] [CrossRef]
  30. Gueymard, C.A.; Myers, D.; Emery, K. Proposed reference irradiance spectra for solar energy systems testing. Sol. Energy 2002, 73, 443–467. [Google Scholar] [CrossRef]
  31. Hindersin, S.; Leupold, M.; Kerner, M.; Hanelt, D. Irradiance optimization of outdoor microalgal cultures using solar tracked photobioreactors. Bioprocess Biosyst. Eng. 2013, 36, 345–355. [Google Scholar] [CrossRef] [PubMed]
  32. Franklin, G.F.; Powell, J.D.; Workman, M.L. Digital Control of Dynamic Systems, 3rd ed.; Addison-Wesley: Boston, MA, USA, 1998. [Google Scholar]
  33. Åström, K.J.; Hägglund, T. Advanced PID Control; ISA: Research Triangle Park: Durham, NC, USA, 2006. [Google Scholar]
  34. Kay, R.; Omair, R.; Aizenberg, J. Self-regulated dual-mode solar energy harvesting. Proc. Natl. Acad. Sci. USA 2026, 123, e2534717123. [Google Scholar] [CrossRef] [PubMed]
  35. Zeng, X.; Wang, Y.; Zhu, J.; Chu, Y.; Li, H.; Peng, H. Dual-Mode PID Control for Automotive Resolver Angle Compensation Based on a Fuzzy Self-Tuning Divide-and-Conquer Framework. World Electr. Veh. J. 2025, 16, 546. [Google Scholar] [CrossRef]
  36. Meinel, A.B.; Meinel, M.P.; McGowan, J.G. Applied Solar Energy: An Introduction. Am. J. Phys. 1977, 45, 499. [Google Scholar] [CrossRef]
  37. Kasten, F.; Young, A.T. Revised optical air mass tables and approximation formula. Appl. Opt. 1989, 28, 4735–4738. [Google Scholar] [CrossRef] [PubMed]
  38. Chen, X.; Zheng, Y.; Zhang, Y.; Chi, Z.; Zeng, Y.; Huang, A.; Xie, Z. Intracellular diatom-derived carbon dots for enhancing photosynthetic efficiency and biomass production of Chlorella. Bioresour. Technol. 2025, 420, 132129. [Google Scholar] [CrossRef] [PubMed]
Figure 1. Physical configuration and mechanical assembly of the proposed BPV solar tracking system.
Energies 19 03597 g001
Figure 2. System hardware architecture and signal flow diagram highlighting the interconnection of the sensor network and actuation system.
Energies 19 03597 g002
Figure 3. Closed-loop control block diagram of the BPV system featuring a discrete PID controller and nonlinear saturation constraints.
Energies 19 03597 g003
Figure 4. The multi-physics modeling framework illustrates the coupling between environmental inputs, mechanical loss, and biological energy yield.
Energies 19 03597 g004
Figure 5. Algorithmic flowchart of the dual-mode control strategy with integrated hysteresis-based switching logic.
Energies 19 03597 g005
Figure 6. Validation of the Steele photoresponse model against experimental rapid-light-curve data digitized from [38]. (a) Normalized shape comparison: the Steele curve attains its optimum at x = 1, provides an upper-bound rising limb, and imposes a conservative exponential penalty beyond saturation, whereas the 30 s step fluorometric reference exhibits a broader optimum with weak dynamic decline; the two responses are comparable in the vicinity of the optimum (shaded band). The vertical green dashed line indicates the optimum saturation threshold corresponding to the tight hysteresis band. (b) Native-unit experimental curves for the Chlorella control and Chlorella/CDs groups (adapted from Figure 3F in [38]); the digitized saturation parameter Ik ≈ 239 μmol·m−2·s−1 is marked.
Energies 19 03597 g006
Figure 7. Simulated tracking trajectories under dual-mode control: the ideal zenith-angle reference, the commanded tilt, and the actual mechanical tilt angle βm(t). The Mode II defocusing window (shaded) is taken directly from the simulated mode signal, and the dotted lines mark the effective linkage-limited tilt bounds (±55.6° at L = 300 mm).
Energies 19 03597 g007
Figure 8. Simulated effective surface irradiance for the dual-mode strategy and the two baselines, with the Mode II window taken from the simulated mode signal (shaded band). Flat-top regulation holds at the saturation threshold except for the kinematically clamped noon peak (571 W/m2); the shaded areas above the threshold visualize the over-saturation exposure, reduced from 5.28 h/day (Baseline B) to 3.08 h/day.
Energies 19 03597 g008
Figure 9. Quantification of the macro-shading (canyon effect) at tube pitches P = 63/69/75 mm: (a) daily evolution of the shading penalty factor; (b) effective beam irradiance against the unshaded reference. Denser arrays (small P) lose more irradiance at low solar altitudes, while all pitches converge at midday. The vertical dotted lines indicate the shading-onset and shading-end times for each tube pitch, with their colors corresponding to the respective legend entries.
Energies 19 03597 g009
Figure 10. Simulated three-dimensional response surface of the daily net energy yield over tube pitch P ∈ [63, 75] mm and link length L ∈ [200, 400] mm (7 × 9 grid of full-day simulations). The surface increases monotonically with P, stays flat for L ≤ 275 mm, and degrades gradually at larger L (kinematic-clamp region); the optimum (1554.2 kJ/day) lies at the corner where P = 75 mm, L = 250 mm, with the nominal configuration (P = 69 mm, L = 300 mm; 1482.6 kJ/day) marked. The black asterisk indicates the optimum configuration.
Energies 19 03597 g010
Figure 11. Daily energy budget of the three configurations under the nominal clear-sky design day: latitude-based fixed tilt (A), continuous dual-axis tracking (B), and the proposed dual-mode strategy. Bars decompose net biological output (solid), standby holding loss (126.0 kJ/day, hatched), and active driving loss (cross-hatched); net yields are annotated on the bars. The dual-mode strategy improves the daily net energy yield by +14.9% over Baseline B and +6.3% over Baseline A.
Energies 19 03597 g011
Figure 12. Distribution of the daily net energy improvement across the N = 100 Monte Carlo trials (seed = 42; independent ±10% uniform perturbation of Isat, ηdrive, and P). Boxes show the interquartile range with median lines; whiskers extend 1.5 × IQR; jittered points show individual trials. The improvement is positive in every trial for both baselines (+6.3% ± 1.8% over Baseline A; +14.9% ± 3.1% over Baseline B).
Energies 19 03597 g012
Table 1. Actuator estimation table derived bottom-up from the physical platform.
QuantitySymbolValueUnitBasis
Array aperture A 8.0m2nominal platform
Tube count × length77 × 1.5mgeometry
Array mass m 327kg3.70 kg/tube
Rotational inertia J 770kg·m2parallel-axis assembly
Operating torque τ o p 147N·mwind 74 + imbalance 32 + inertia 40 (components rounded)
Gear ratio1200:1planetary 20 × worm 60
Slew-rate limit ω m a x 1.4°/s12 W nameplate via SF = 2
Survival wind load τ s u r v 465N·m15 m/s, passive worm self-lock
Daily duty cycle0.21%simulation
Peak mechanical power9.5Wsimulation
Table 2. Summary of global physical, biological, and control parameters used in the multi-physics simulation.
CategoryParameterSymbolValueUnitSource/Reference
GeometricTube outer diameter D 50mmThis work
Center-to-center pitch P 63–75mmNominal
Linkage length/stroke L / s 300/280mmNominal geometric design
OpticalPeak surface irradiance (STC)1000W/m2Ref. [30]
Canyon-effect factor ξ dynamic, Equation (4)range 0–1Derived
Attenuation coefficient κ 0.15mm−1Ref. [25]
BiologicalSaturation irradiance I s a t 450W/m2Ref. [31]
Peak areal power density (nominal) P m a x 7.7W/m2Ref. [29]
Peak areal power density (range) P m a x 0.54–7.7W/m2Refs. [28,29]
Review-level mean power density58.9mW/m2Ref. [27]
Operational biomass concentration1.2–1.8g/LThis work (nominal operating range)
MechanicalArray aperture A 8.0m2Section 2.2.4
Array mass m 327kgDerived; Section 2.2.4
Rotational inertia J 770kg·m2Derived; Section 2.2.4
Operating torque τ o p 147N·mDerived; Section 2.2.4
Survival wind load τ s u r v 465N·mSection 2.2.4
Stepper motor rated power12WRef. [7]; this work
Actuator standby power3.5WRef. [7]; this work
Gear ratio/slew-rate limit—/ ω m a x 1200:1/1.4—/°/sMotor nameplate; Section 2.2.4
Drive-chain efficiency η d r i v e 0.60Typical worm-gear efficiency
Break-away static friction τ s 65N·mNominal linkage
Coulomb dynamic friction τ c 40N·mNominal linkage
Servo closed-loop stiffness K v 100N·m/(°/s)Control design
Stribeck critical velocity ω s 0.1°/sNominal friction assumption
Viscous friction coefficient b 5.0N·m/(°/s)Nominal friction assumption
ControlHysteresis band Δ I h y s ±20W/m2Section 2.3.3
Sampling period T s 1sThis work
Maximum tracking angle β m a x ±70°Physical limit
RK4 integration step (plant) h 0.1sSolver configuration
Sensor filter time constant τ f 15sControl design
Proportional gain K p 1.25Tuned
Integral gain K i 0.05Tuned
Derivative gain K d 0.10Tuned
Anti-windupconditional (freeze)Section 2.3.2
Slew-rate saturation ω m a x 1.4°/sSection 2.2.4
Disclaimer/Publisher’s Note: The statements, opinions and data contained in all publications are solely those of the individual author(s) and contributor(s) and not of MDPI and/or the editor(s). MDPI and/or the editor(s) disclaim responsibility for any injury to people or property resulting from any ideas, methods, instructions or products referred to in the content.