Article

Local Electric-Field Direction Measurement in SF6 Based on Electric Field-Induced Second-Harmonic Generation


1
State Key Laboratory of Electrical Insulation and Power Equipment, Xi’an Jiaotong University, Xi’an 710049, China
2
China Electric Power Research Institute, Beijing 100192, China
*
Author to whom correspondence should be addressed.
Energies 2026, 19(15), 3548; https://doi.org/10.3390/en19153548
Submission received: 17 June 2026 / Revised: 19 July 2026 / Accepted: 20 July 2026 / Published: 28 July 2026
(This article belongs to the Section F6: High Voltage)

Abstract

Non-intrusive measurement of the local electric-field direction in SF6 gas-insulated equipment is important for insulation-condition assessment and electric-field distortion analysis. In this study, a three-projection electric-field direction measurement method based on electric field-induced second-harmonic generation is proposed. The feasibility of the method is validated using a known reference electric field, and the effects of electric-field strength, laser pulse energy, SF6 pressure, and spatial electric-field non-uniformity on the direction-retrieval results are systematically investigated. The results show that increasing the electric-field strength or laser pulse energy enhances the second-harmonic modulation signal and thus reduces the direction-retrieval deviation. SF6 pressure has a non-monotonic influence on the effective accumulation of the second-harmonic signal and the direction-retrieval accuracy through the competition between increased molecular number density and enhanced phase mismatch. Spatial electric-field non-uniformity weakens the ability of the three-projection retrieved direction to represent the local electric-field direction at the focus. Under the present experimental conditions, the maximum absolute angular deviations in the strongly non-uniform edge regions of the cylindrical and hemispherical electrodes are 6.68 ± 1.62° and 9.20 ± 1.84°, respectively.

1. Introduction

DC GILs have advantages such as compact structure, high transmission capacity, and high operational reliability, making them suitable for special transmission scenarios with limited corridors and dense line crossings [1,2,3]. In SF6 gas-insulated equipment, the local electric-field distribution is an important parameter for evaluating the insulation state [4,5,6]. In particular, near electrode ends, curved surfaces, and other non-uniform field regions, the electric-field direction may vary significantly over a small spatial scale. Therefore, local electric-field direction measurement methods with high spatial resolution and minimal disturbance to the original field distribution are required. Invasive methods, such as electrostatic probes [7] and contact electro-optic sensors [8], can readily disturb the original electric field. Non-invasive optical methods, including Stark splitting and four-wave mixing, have been used to investigate electric fields in discharges and plasmas; however, the former is restricted by specific emission conditions, whereas the latter usually relies on molecular resonance conditions and a two-laser configuration [9,10].
E-FISH has recently developed into an important non-invasive diagnostic technique for electric-field measurements. It was first used to measure nonlinear polarization coefficients of different gas species [11,12,13] and was later extended to terahertz-wave detection [14], semiconductor surface-field measurements [15], and electric-field diagnostics in gases and discharges [16,17,18]. To address weak-field and low-signal conditions, Hogue et al. proposed locally oscillator-enhanced E-FISH (LOE-FISH), in which coherent superposition between a second-harmonic local oscillator and the E-FISH signal improves the signal-to-noise ratio and extends the potential application of E-FISH to low-field diagnostics [19]. More recently, E-FISH has also been used to analyze coupled electric-field and space-charge dynamics in dielectric barrier discharges, further illustrating its capability for non-invasive plasma and insulation diagnostics [20]. In addition to field-strength measurement, vector E-FISH measurements have also been investigated. Chng et al. demonstrated electric-field vector measurements using nanosecond E-FISH by exploiting the polarization dependence of the generated second-harmonic signal [21]. Nakamura et al. further reported electric-field-vector-profile measurements in gases based on E-FISH [22]. However, existing vector E-FISH methods generally rely on orthogonal component detection, vector-profile reconstruction, or spatial scanning measurements.
When E-FISH is extended to the diagnosis of complex spatial electric fields, the electric-field distribution within the laser focal region becomes an important factor affecting the signal. Based on a focused Gaussian-beam model, Chng et al. showed that the E-FISH signal depends not only on the magnitude of the applied electric field, but also on the length and shape of the applied field along the laser propagation direction [23]. In strongly non-uniform fields, such as those in ionization waves, the influence of the electric-field profile on measurement accuracy must also be considered [24]. Recent studies have attempted to reconstruct inhomogeneous electric-field strength distributions from E-FISH signals and further explored electric-field vector-profile measurements along the probing path in gases [25]. In confined or strongly non-uniform geometries, coherent interference and phase effects can also distort the detected E-FISH signal and must be considered when interpreting the measurement results [26]. To improve longitudinal spatial resolution, Raskar et al. proposed spatially enhanced E-FISH (SEEFISH), which shortens the effective signal-generation region through non-collinear pump beams [27].
Existing vector E-FISH studies have mainly focused on electric-field conditions in air, discharge plasmas, or general gas media, whereas local electric-field direction measurement in SF6 gas-insulated environments still faces several practical issues. First, the phase-mismatch effect in SF6 affects the coherent accumulation of the second-harmonic signal along the laser propagation path, and its influence on fixed polarization projection-based direction retrieval still needs to be further clarified. Second, for spatial multi-point measurements using a low-repetition-rate pulsed laser, a complete polarization-angle scan has low acquisition efficiency, and the measurement results are more susceptible to laser pulse energy drift, gas-state variations, and changes in the optical system response. In addition, in spatially non-uniform electric fields, second-harmonic components generated at different positions along the laser propagation path have different amplitudes, phases, and polarization directions. Their coherent superposition may cause the finally detected equivalent polarization direction to deviate from the local electric-field direction at the laser focus.
To address these issues, this study establishes a three-projection E-FISH method for local electric-field direction measurement in an SF6 gas environment. The equivalent electric-field direction is retrieved from the second-harmonic intensities measured at three fixed analyzer angles of 0°, 45°, and 90°. The feasibility of the three-projection method is first validated in a known reference electric field, and the effects of electric-field strength, laser pulse energy, and SF6 pressure on the stability of direction retrieval are further investigated. Combined with finite-element simulations and coherent-superposition analysis of second-harmonic components along the laser propagation path, the influence of electric-field non-uniformity on the three-projection direction-retrieval results is analyzed, and the mechanisms by which the finite interaction length, phase mismatch, and spatial non-uniformity of the electric-field direction affect the retrieved results are clarified. The results provide a basis for applying the three-projection E-FISH method to local electric-field direction diagnosis in SF6 gas-insulated structures.

2. Methods

In the absence of an external electric field, the second-order nonlinear susceptibility of a centrosymmetric gas medium is zero under the electric-dipole approximation. Consequently, the second-harmonic generation process is suppressed. Under an applied electric field, centrosymmetric atoms or molecules undergo field-induced polarization. Two incident photons produce an oscillating polarization in the atom or molecule, thereby generating photons at twice the incident frequency [21,28]. The induced polarization intensity associated with the E-FISH effect can be expressed as [16,17]:
P i ω 2 = 3 2 χ i , j , k , l ( 3 ) ( − ω 2 , 0 , ω , ω ) E j F E k ω E l ω
where P i ω 2 is the induced polarization intensity at the second-harmonic frequency ω 2 , ω is the frequency of the fundamental laser, χ i , j , k , l ( 3 ) is the third-order nonlinear susceptibility tensor, and the subscripts i, j, k, and l denote the second-harmonic polarization direction, the applied electric-field direction, and the polarization directions of the two fundamental optical fields, respectively. E j F is the external electric field, and E k ω and E l ω are the electric-field components of the incident fundamental laser, which are identical for second-harmonic generation. For a sufficiently long focusing length, the fundamental laser may be treated as a plane wave. The intensity of the second harmonic signal can be described as
I ω 2 = ( 3 μ 0 ω 2 c 4 n 2 ) 2 N 2 ( χ i , j , k , l ( 3 ) ) 2 ( E j F ) 2 ( I ω ) 2 L 2 sin c 2 ( Δ k L / 2 )
where I ω 2 is the second-harmonic intensity, μ 0 is vacuum permeability, n2 is relative refractive index of the second-harmonic in the gas, N is the molecular number density of the gas, I ω is fundamental laser intensity, L is coherence length, Δ k is phase-mismatch coefficient. When the focusing length is shorter than the interaction length of the laser and the external field, the focusing of the fundamental beam must be accounted for, and the second-harmonic signal can be described by an integral model:
I ω 2 = 3 μ 0 ω 2 c 4 n 2 N χ i , j , k , l ( 3 ) E 0 I ω | ∫ z 0 z 1 f ( z ) e i Δ k z 1 + i ( z / z R ) d z |
where E0 denotes the maximum field strength near the electrode surface, f(z) is normalized electric-field intensity distribution, Z0 and Z1 are the axial entrance and exit boundaries of the interaction region between the external electric field and the laser, ZR, is the Rayleigh length.
For each detection polarization angle θ, the background signal were first subtracted from the PMT waveform, and the second-harmonic signal was then obtained by integrating the waveform within a fixed temporal window corresponding to the second-harmonic pulse. The fundamental pulse energy of the same laser shot was evaluated from the synchronously recorded PD waveform. Since the second-harmonic intensity is proportional to the square of the fundamental pulse energy, the normalized second-harmonic intensity for the m-th laser shot was calculated as
I θ , m = S P M T , θ , m − B P M T , θ [ ( S P D , θ , m − B P D , θ ) / S P D , r e f ] 2
where S P M T , θ , m is the integrated PMT signal at the detection polarization angle θ, S P D , θ , m is the synchronously recorded PD signal of the same laser shot, B P M T , θ is the PMT background signal at the corresponding detection polarization angle, BPD is the PD-channel background, and S P D , r e f is the reference PD signal, taken as the average value of the background-subtracted PD signals in the corresponding measurement set. Both B P M T , θ and B P D were determined as the ensemble averages of repeated background acquisitions performed under the same acquisition settings with no external voltage applied.
A total of M = 30 independent three-projection groups were acquired. For the m-th group, the normalized projection intensities at 0°, 45°, and 90° are denoted as I0,m, I45,m, and I90,m, respectively. The modulation components were defined as
X m = I 0 , m − I 90 , m Y m = 2 I 45 , m − I 0 , m − I 90 , m
The electric-field direction of the m-th group was retrieved using
ϕ m = 1 2 arctan 2 ( Y m , X m )
The modulation amplitude of the m-th group was defined as R m = X m 2 + Y m 2 . To evaluate the noise sensitivity of the retrieved angle, first-order error propagation was applied. Small perturbations in Xm and Ym give
d ϕ m = 1 2 X m d Y m − Y m d X m R m 2
Since the three projection intensities were acquired from independent repeated measurements at different detection polarization directions, the angle variance was simplified as
σ ϕ , m 2 = X m 2 σ Y 2 + Y m 2 σ X 2 − 2 X m Y m cov ( X , Y ) 4 R m 4 σ X 2 = σ 0 2 + σ 90 2 σ Y 2 = 4 σ 45 2 + σ 0 2 + σ 90 2 cov ( X , Y ) = − σ 0 2 + σ 90 2
where σ 0 2 , σ 45 2 , and σ 90 2 denote the variances of the normalized projection intensities estimated from the M repeated groups at 0°, 45°, and 90°, respectively. The residual correlations among different projection channels were evaluated using the Pearson correlation coefficients of the repeated measurements. For each set of 0°, 45°, and 90° projection measurements, the normalized second-harmonic intensities obtained within the same measurement cycle were used as paired samples to calculate ρ 0 , 45 , ρ 0 , 90 , and ρ 45 , 90 . The results showed that the correlation coefficients between different projection channels were all below 0.08, indicating weak residual correlations in the sequential projection measurements. Further evaluation based on the uncertainty propagation relationship showed that the relative contribution of the covariance terms to the total angular variance was less than 4.8%. Therefore, the residual covariance terms were considered secondary contributions and were neglected in the simplified uncertainty expression of Equation (8). This expression shows that the angular uncertainty increases rapidly as the modulation amplitude Rm decreases. The modulation signal-to-noise ratio of the m-th group was defined as
S N R m = R m σ R
where σ R is the standard uncertainty of the modulation amplitude. Measurements with SNRm ≥ 10 were used for quantitative direction retrieval, and those with 5 ≤ SNRm < 10 were retained only for qualitative trend analysis. The final retrieved direction ϕ ¯ was calculated from the valid groups using the circular mean:
ϕ ¯ = 1 2 arctan 2 ( ∑ m = 1 M sin 2 θ m , ∑ m = 1 M cos 2 θ m )
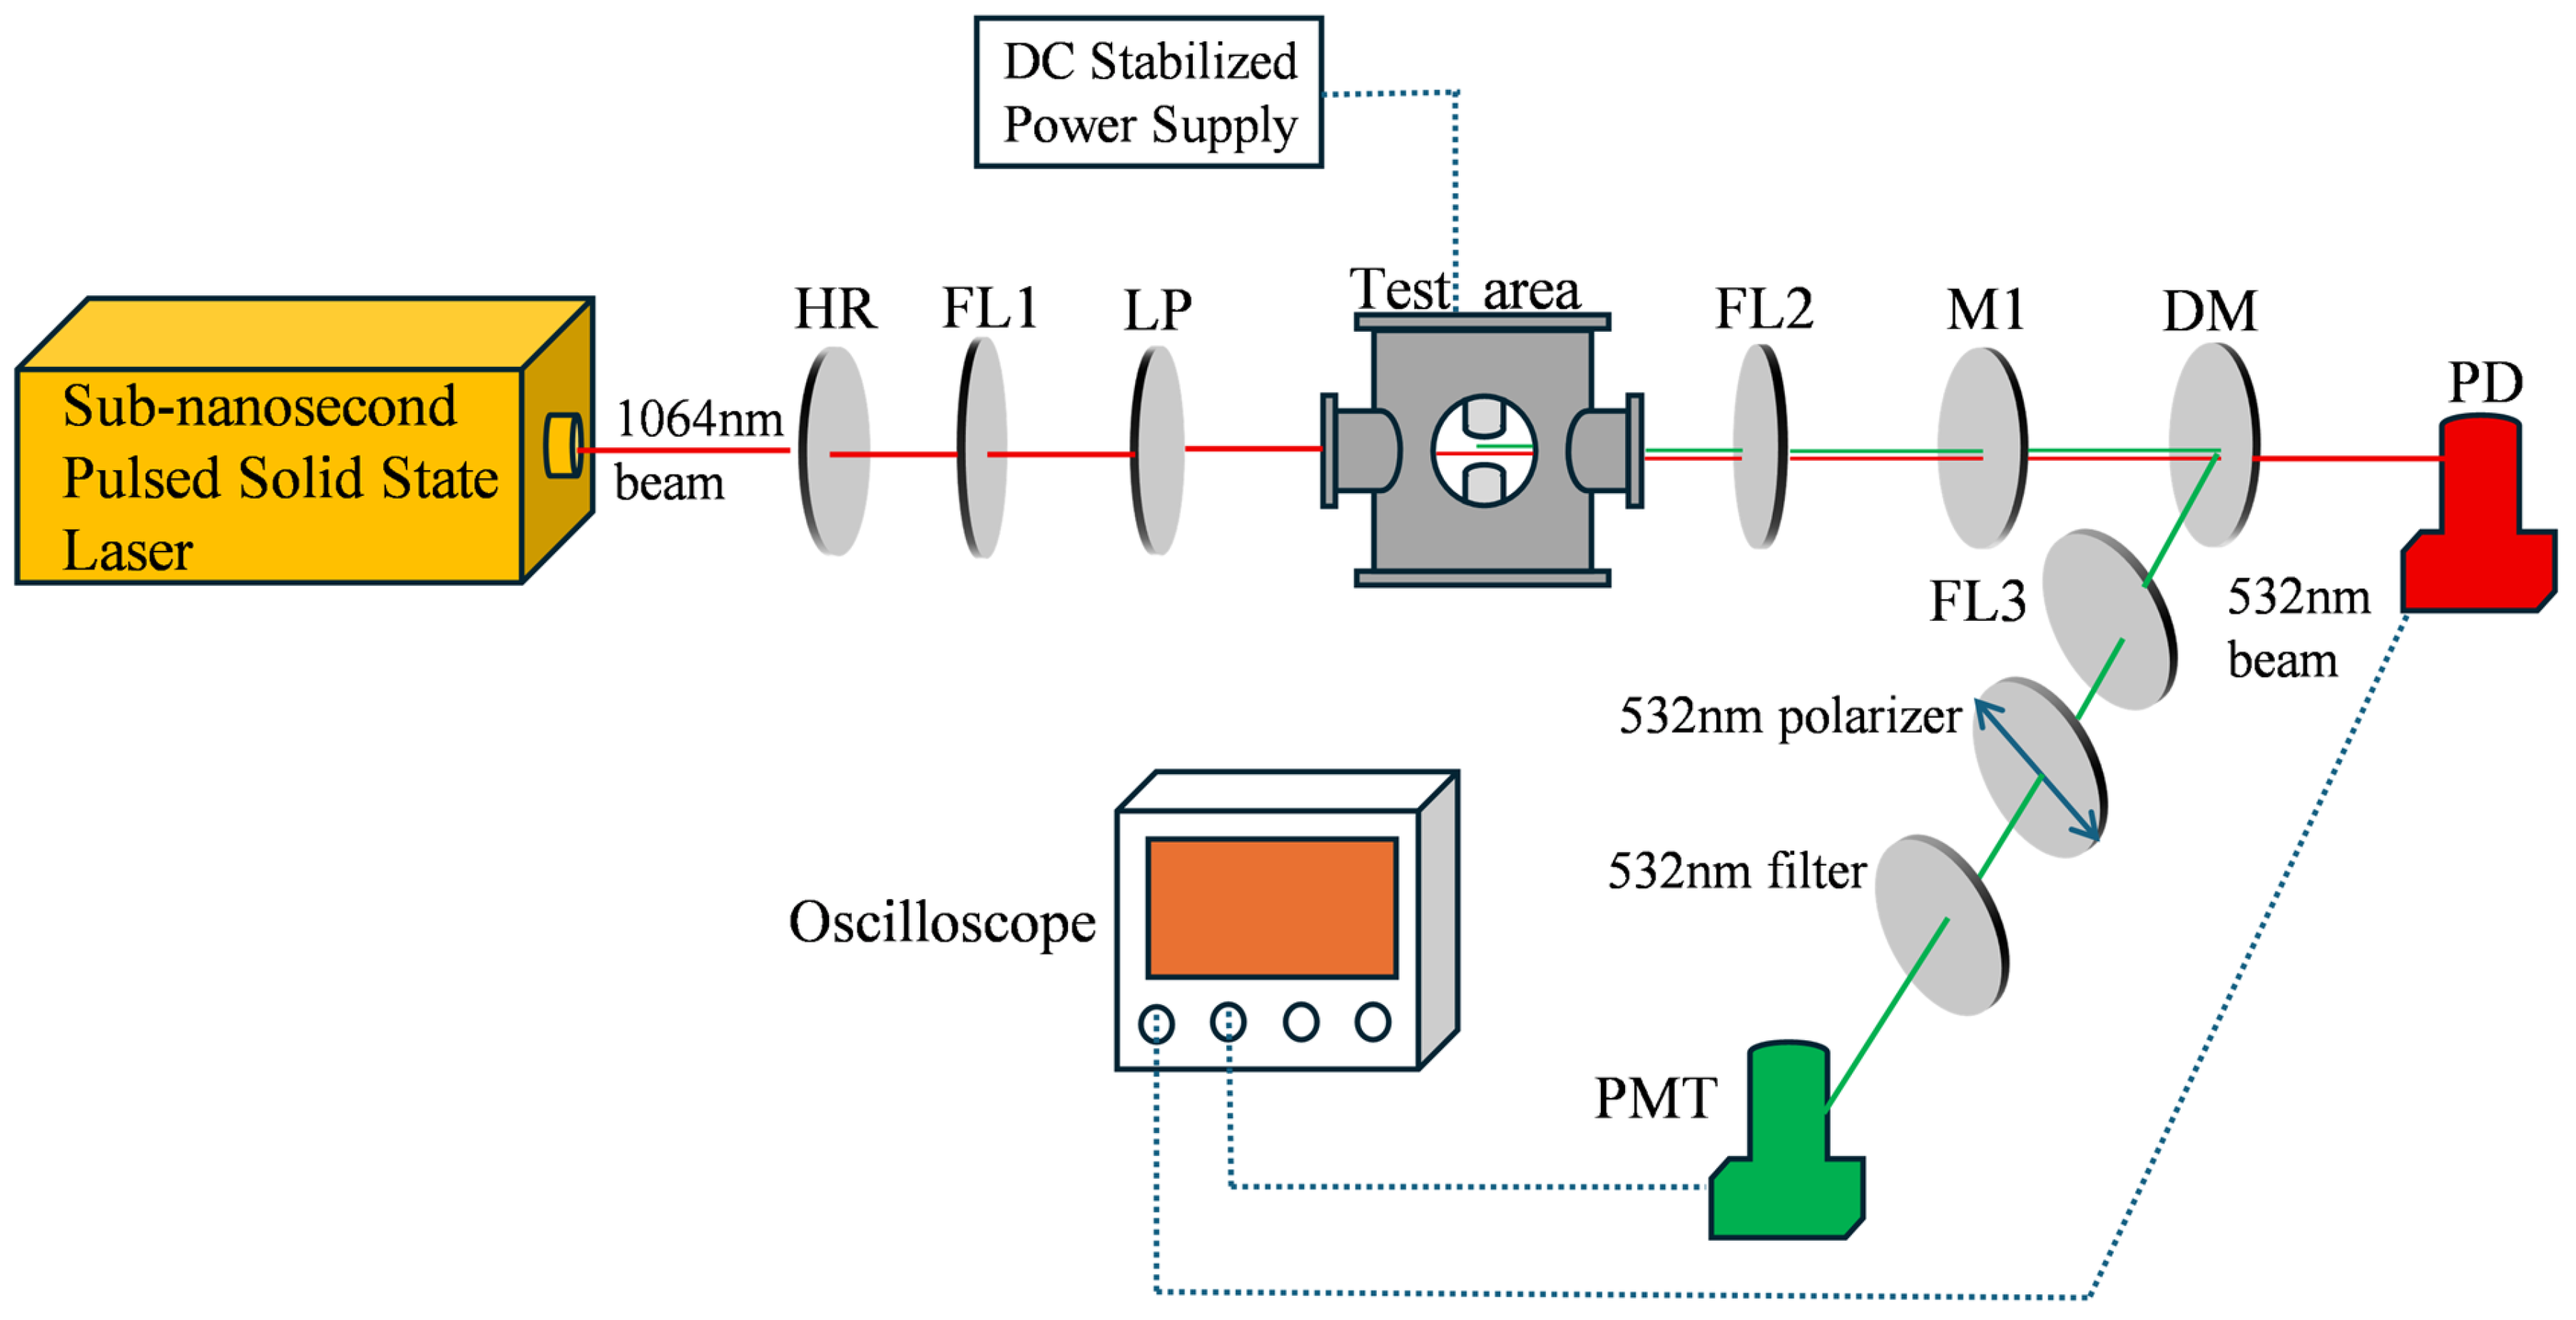
Figure 1 shows the optical configuration of the E-FISH system for local electric-field direction measurement in SF6 gas. The experiments were performed in a sealed SF6 gas chamber filled with SF6 gas with a purity of 99.9% at a pressure of 0.5 MPa. The laboratory temperature was maintained at 23.5 ± 1.0 °C during the measurements. A 1064 nm sub-nanosecond pulsed laser was used as the fundamental light source. The measured pulse width was 3.0 ± 0.1 ns, the repetition rate was 2 Hz, and the maximum single-pulse energy was 40.20 mJ. Before the measurements, the laser output direction and the positions of the front-end optical components were adjusted at a low laser energy so that the fundamental beam passed successively through the centers of the front- and rear-alignment apertures of the experimental chamber. This beam path was defined as the reference optical axis. The experimental chamber was mounted on a three-axis motorized translation stage. With the optical path kept fixed, the chamber was moved using the translation stage so that the geometrical center of the electrode gap coincided with the reference optical axis. Then, under a constant applied voltage, the relative axial position between the experimental chamber and the focusing lens FL1 was finely adjusted, and the position at which the E-FISH signal reached its maximum was taken as the optimal overlap between the laser focus and the electrode-gap region.
After alignment, the laser beam passed through an HR to reduce the influence of ambient stray light on subsequent second-harmonic detection. The fundamental beam was focused by FL1, with a focal length of 30 cm, into the electrode-gap region. Under the present focusing condition, the fundamental beam had a beam-waist radius of ~40.8 μm. An LP was placed after FL1 to block low-frequency background light while transmitting the 1064 nm fundamental beam. When the fundamental beam passed through the SF6 region with the applied electric field, a 532 nm signal was generated through the E-FISH process. The 1064 nm and 532 nm lasers then entered the reversely placed collimating lens FL2, which had a focal length of 25 cm. Because the 1064 nm laser transmitted through the test region was too intense to be directly incident on the photodetector used for energy monitoring, M1 was inserted into the optical path to split the fundamental beam. A DM was then used to further separate the 1064 nm and 532 nm beams. The separated 1064 nm signal was collected by the PD. The second-harmonic signal reflected by the DM was focused by FL3, passed through the polarizer in front of the PMT, and then entered the photomultiplier tube for weak-light amplification and conversion into an electrical signal. The output signals from the PD and PMT were finally recorded by an oscilloscope with a sampling rate of 2.5 GS/s and a bandwidth of 100 MHz.

3. Results and Discussion

3.1. Reference-Field Validation and Comparison of Direction-Retrieval Methods

A parallel-plate electrode configuration was used to establish a reference electric field with a direction determined by the electrode geometry. The electrode spacing was 4 mm, the lateral dimensions of the plates were much larger than the gap distance, and the laser focus was positioned at the center of the parallel-plate electrodes and sufficiently far from the electrode edges. A DC voltage of 20 kV was applied, and the laser pulse energy was maintained at 20 mJ during the experiment.
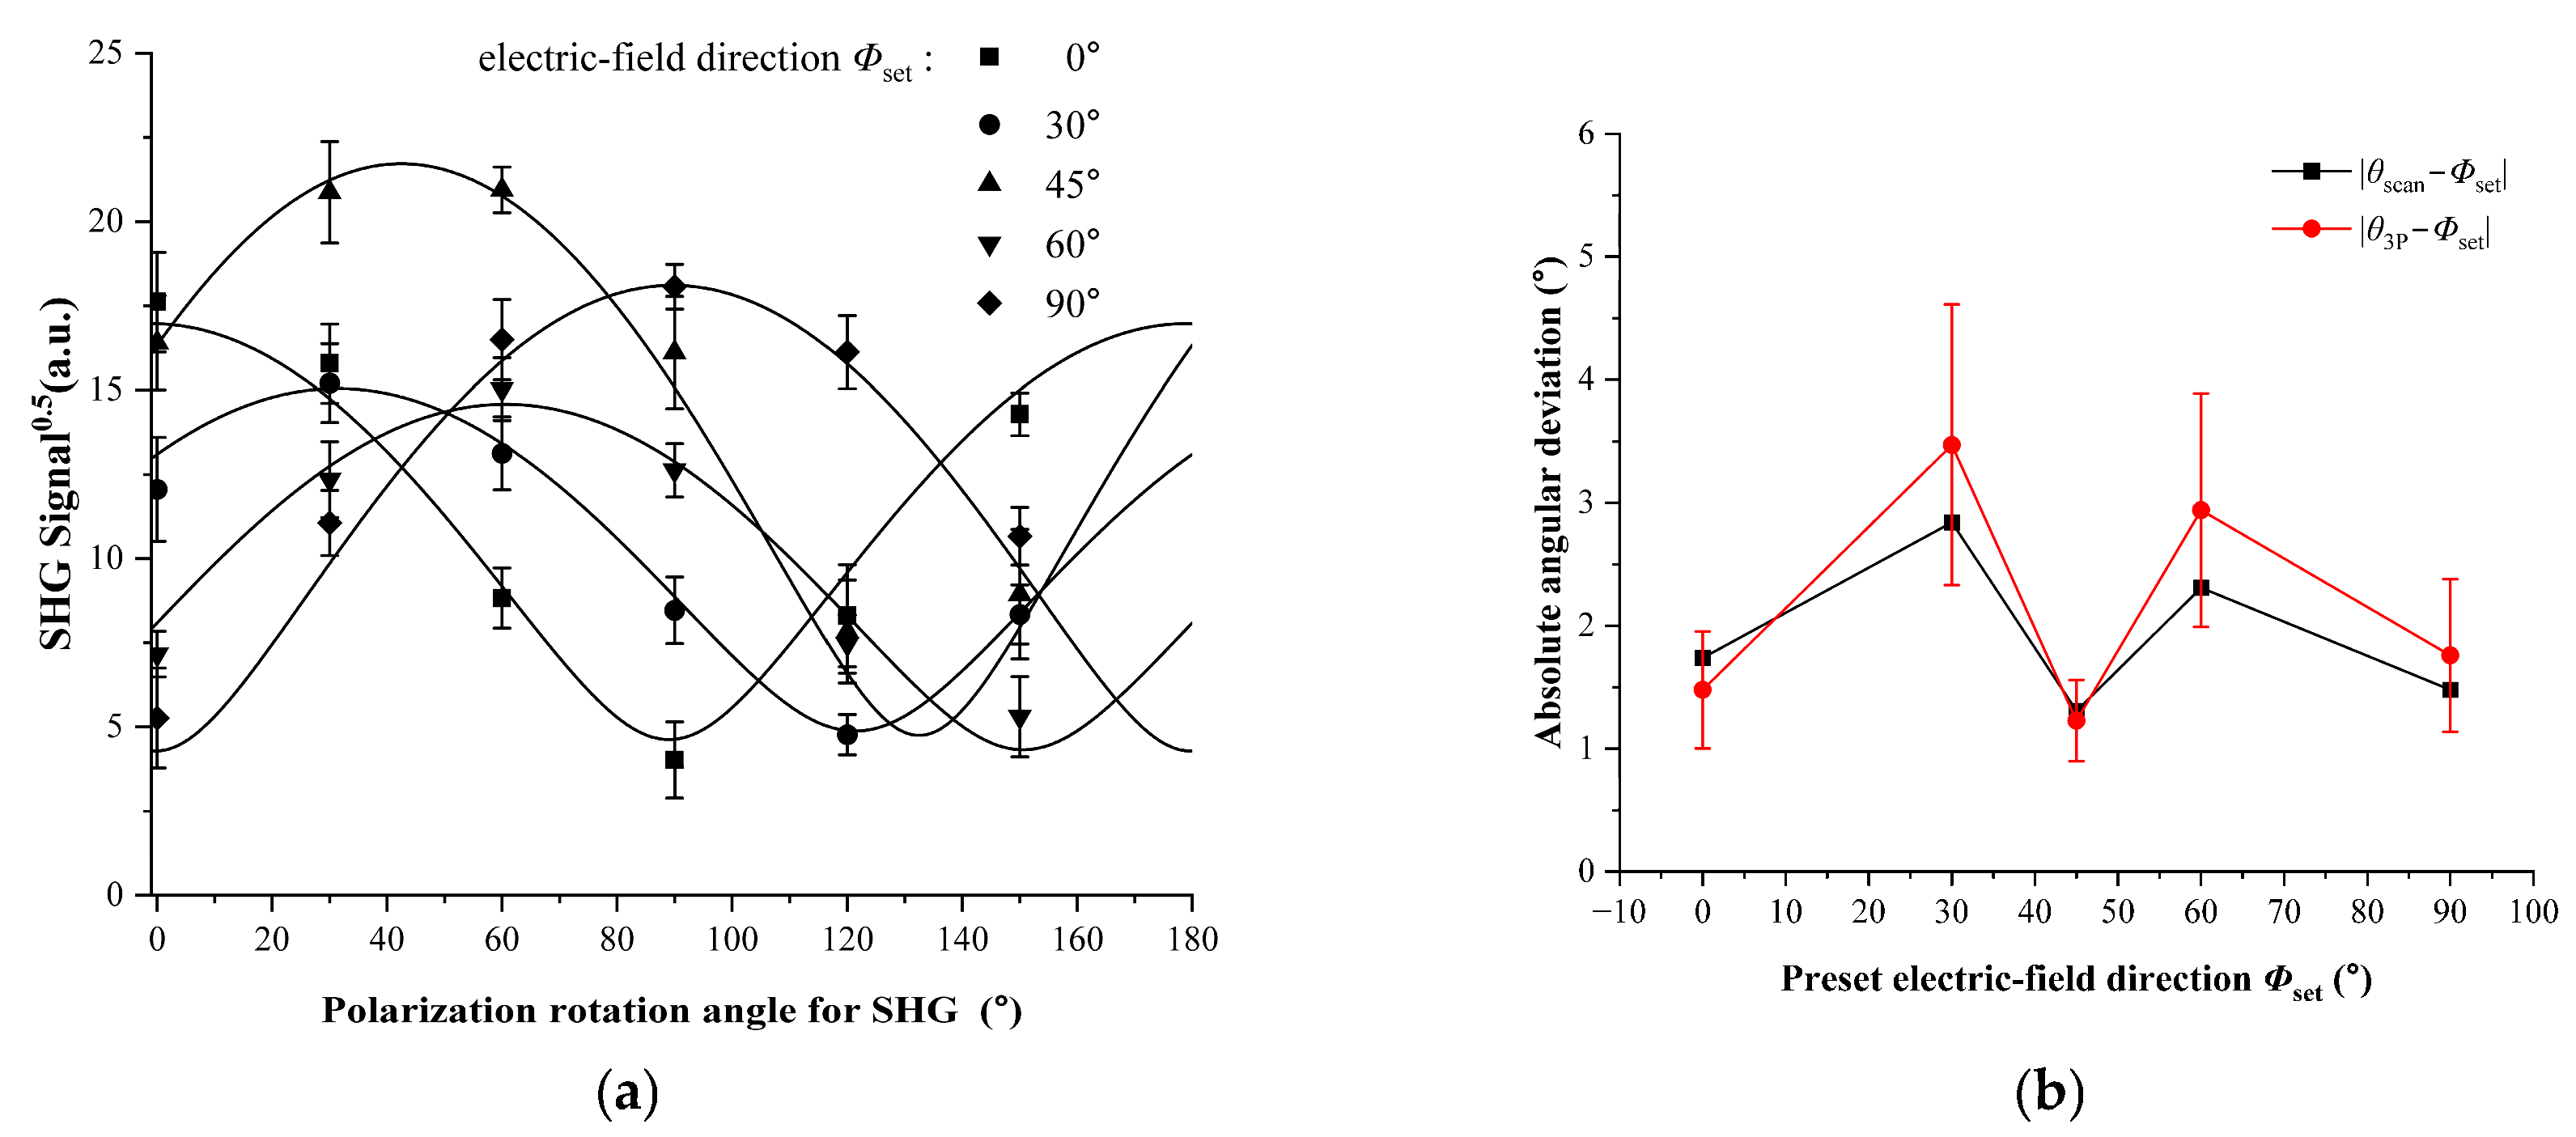
By rotating the parallel-plate electrode assembly, a series of preset electric-field directions, Φset, were established. For each Φset, the second-harmonic signal was recorded while the analyzer angle was varied from 0° to 180°. As shown in Figure 2a, the second-harmonic intensity exhibits a periodic dependence on the analyzer angle, with the maximum and minimum values occurring when the analyzer transmission axis is approximately parallel and perpendicular to the applied electric-field direction, respectively. The polarization-angle response was fitted using Malus’ law to obtain the direction retrieved from the polarization-angle scanning, θscan. Subsequently, under the same measurement point and the same preset direction, the direction θ3P was obtained using the three fixed projections at 0°, 45°, and 90°. Figure 2b presents the absolute angular deviations of θscan and θ3P from the preset direction Φset. The results show that the two methods provide comparable direction-retrieval accuracy under the present experimental conditions. The angular deviation of the three-projection method is slightly larger than that of polarization-angle scanning, with an absolute angular deviation ranging from 1.23 ± 0.33° to 3.47 ± 1.14°.
Combined with Figure 2a, the larger absolute angular deviations mainly occur at preset electric-field directions with weaker second-harmonic signals. According to the error propagation relationship described above, when the modulation amplitude decreases, an intensity perturbation of the same level leads to a larger angular variation. Compared with polarization-angle scanning, the three-projection method relies only on three projection intensities and therefore exhibits higher noise sensitivity under weak-modulation conditions. The maximum difference between the two methods is approximately 0.64°. These results indicate that, when the second-harmonic signal is sufficiently strong, the three-projection method can maintain acceptable direction-retrieval accuracy while substantially reducing the number of analyzer angles and the data acquisition time.

3.2. Stability of the Direction-Retrieval Method Under Different Operating Conditions

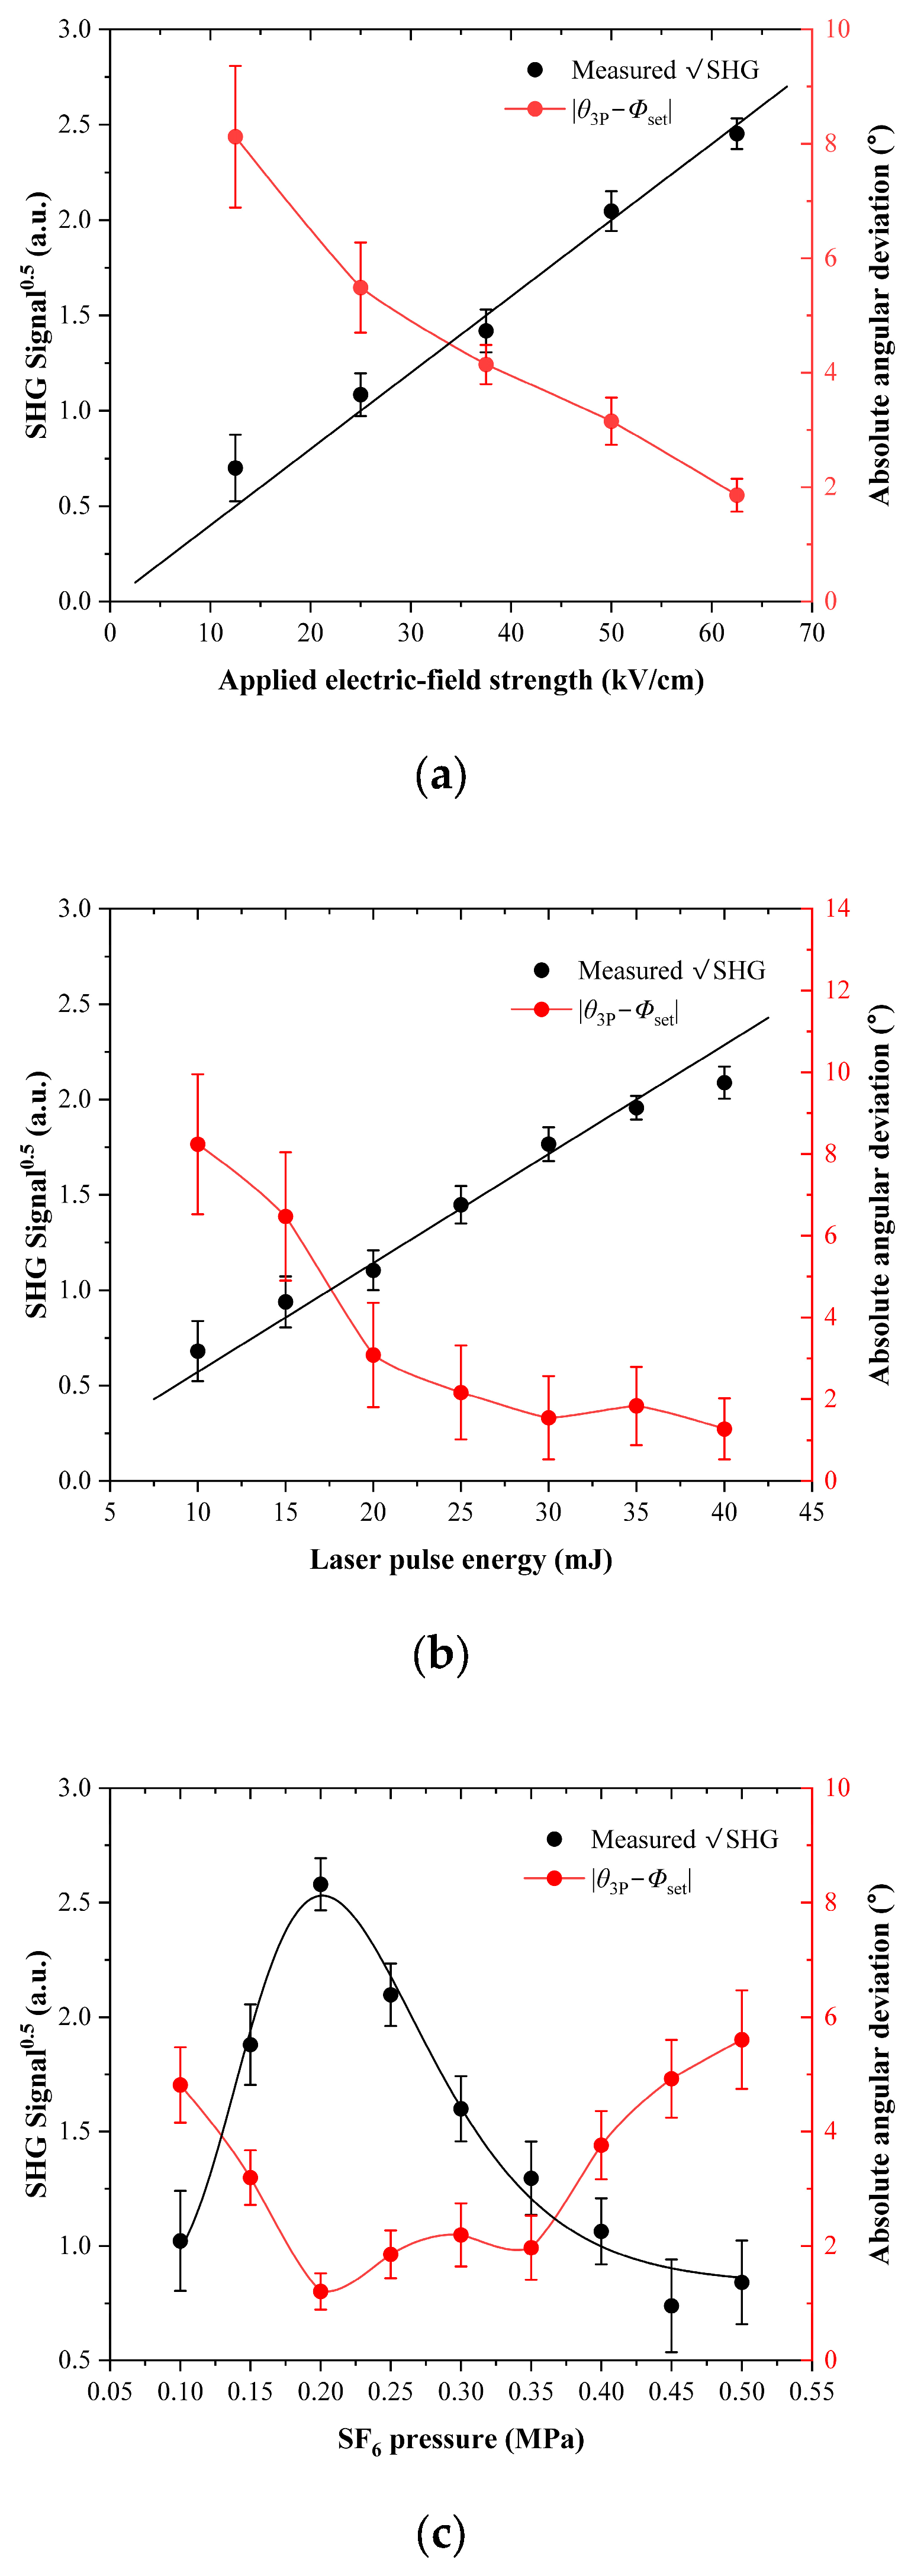
To evaluate the stability of the three-projection direction-retrieval method under different operating conditions and signal levels, the parallel-plate electrode configuration and the same electrode-gap setting as those used in Section 3.1 were adopted in this section. The preset electric-field direction was fixed at Φset = 30°, and the laser focus was positioned at the center of the electrode gap. The applied electric-field strength, laser pulse energy, and SF6 pressure were varied separately, while the other experimental parameters were kept unchanged. Figure 3 shows both the square root of the second-harmonic intensity, I ω 2 , and the absolute angular deviation, |θ3P − Φset|.
Figure 3a shows the influence of the applied electric-field strength on the measurement results. As the electric-field strength increased from 12.5 kV/cm to 62.5 kV/cm, I ω 2 was proportional to the electric-field strength, while the absolute angular deviation decreased from 6.12 ± 1.24° to 0.86 ± 0.29°. The results indicate that the three-projection method can retrieve directions close to the preset electric-field direction of 30°, and its measurement accuracy clearly depends on the second-harmonic signal level. At lower electric-field strengths, the E-FISH modulation signal is weaker, and the relative contribution of random noise to the modulation component increases. As a result, both the angular deviation from the preset direction and the dispersion among different measurement sets increase significantly.
Figure 3b shows the influence of laser pulse energy on the measurement results. As the fundamental laser energy increased from 10 mJ to 40 mJ, I ω 2 was proportional to the fundamental laser energy, while the absolute angular deviation decreased from 8.24 ± 1.73° to 1.27 ± 0.75°. The results show that increasing the laser pulse energy can significantly reduce the error in direction retrieval. In the weak-signal region corresponding to low laser energy, the absolute angular deviation exceeds 8°, and the dispersion of repeated measurements is relatively large. When the laser energy reaches above 20 mJ, the angular deviation decreases markedly and gradually becomes stable under higher-energy conditions.
Figure 3c shows the influence of SF6 pressure on the measurement results. In the low-pressure range of 0.1–0.2 MPa, as the gas molecular number density increases, the third-order nonlinear polarization is enhanced, and I ω 2 is approximately proportional to the gas pressure. The absolute angular deviation reaches a minimum value of 1.21 ± 0.53°. As the pressure further increases, the phase mismatch becomes stronger, and destructive interference among second-harmonic components generated at different positions gradually increases. Consequently, the second-harmonic intensity decreases, and the angular deviation reaches a maximum value of 5.60 ± 1.49°.

3.3. Influence of Electric-Field Non-Uniformity on Direction Retrieval

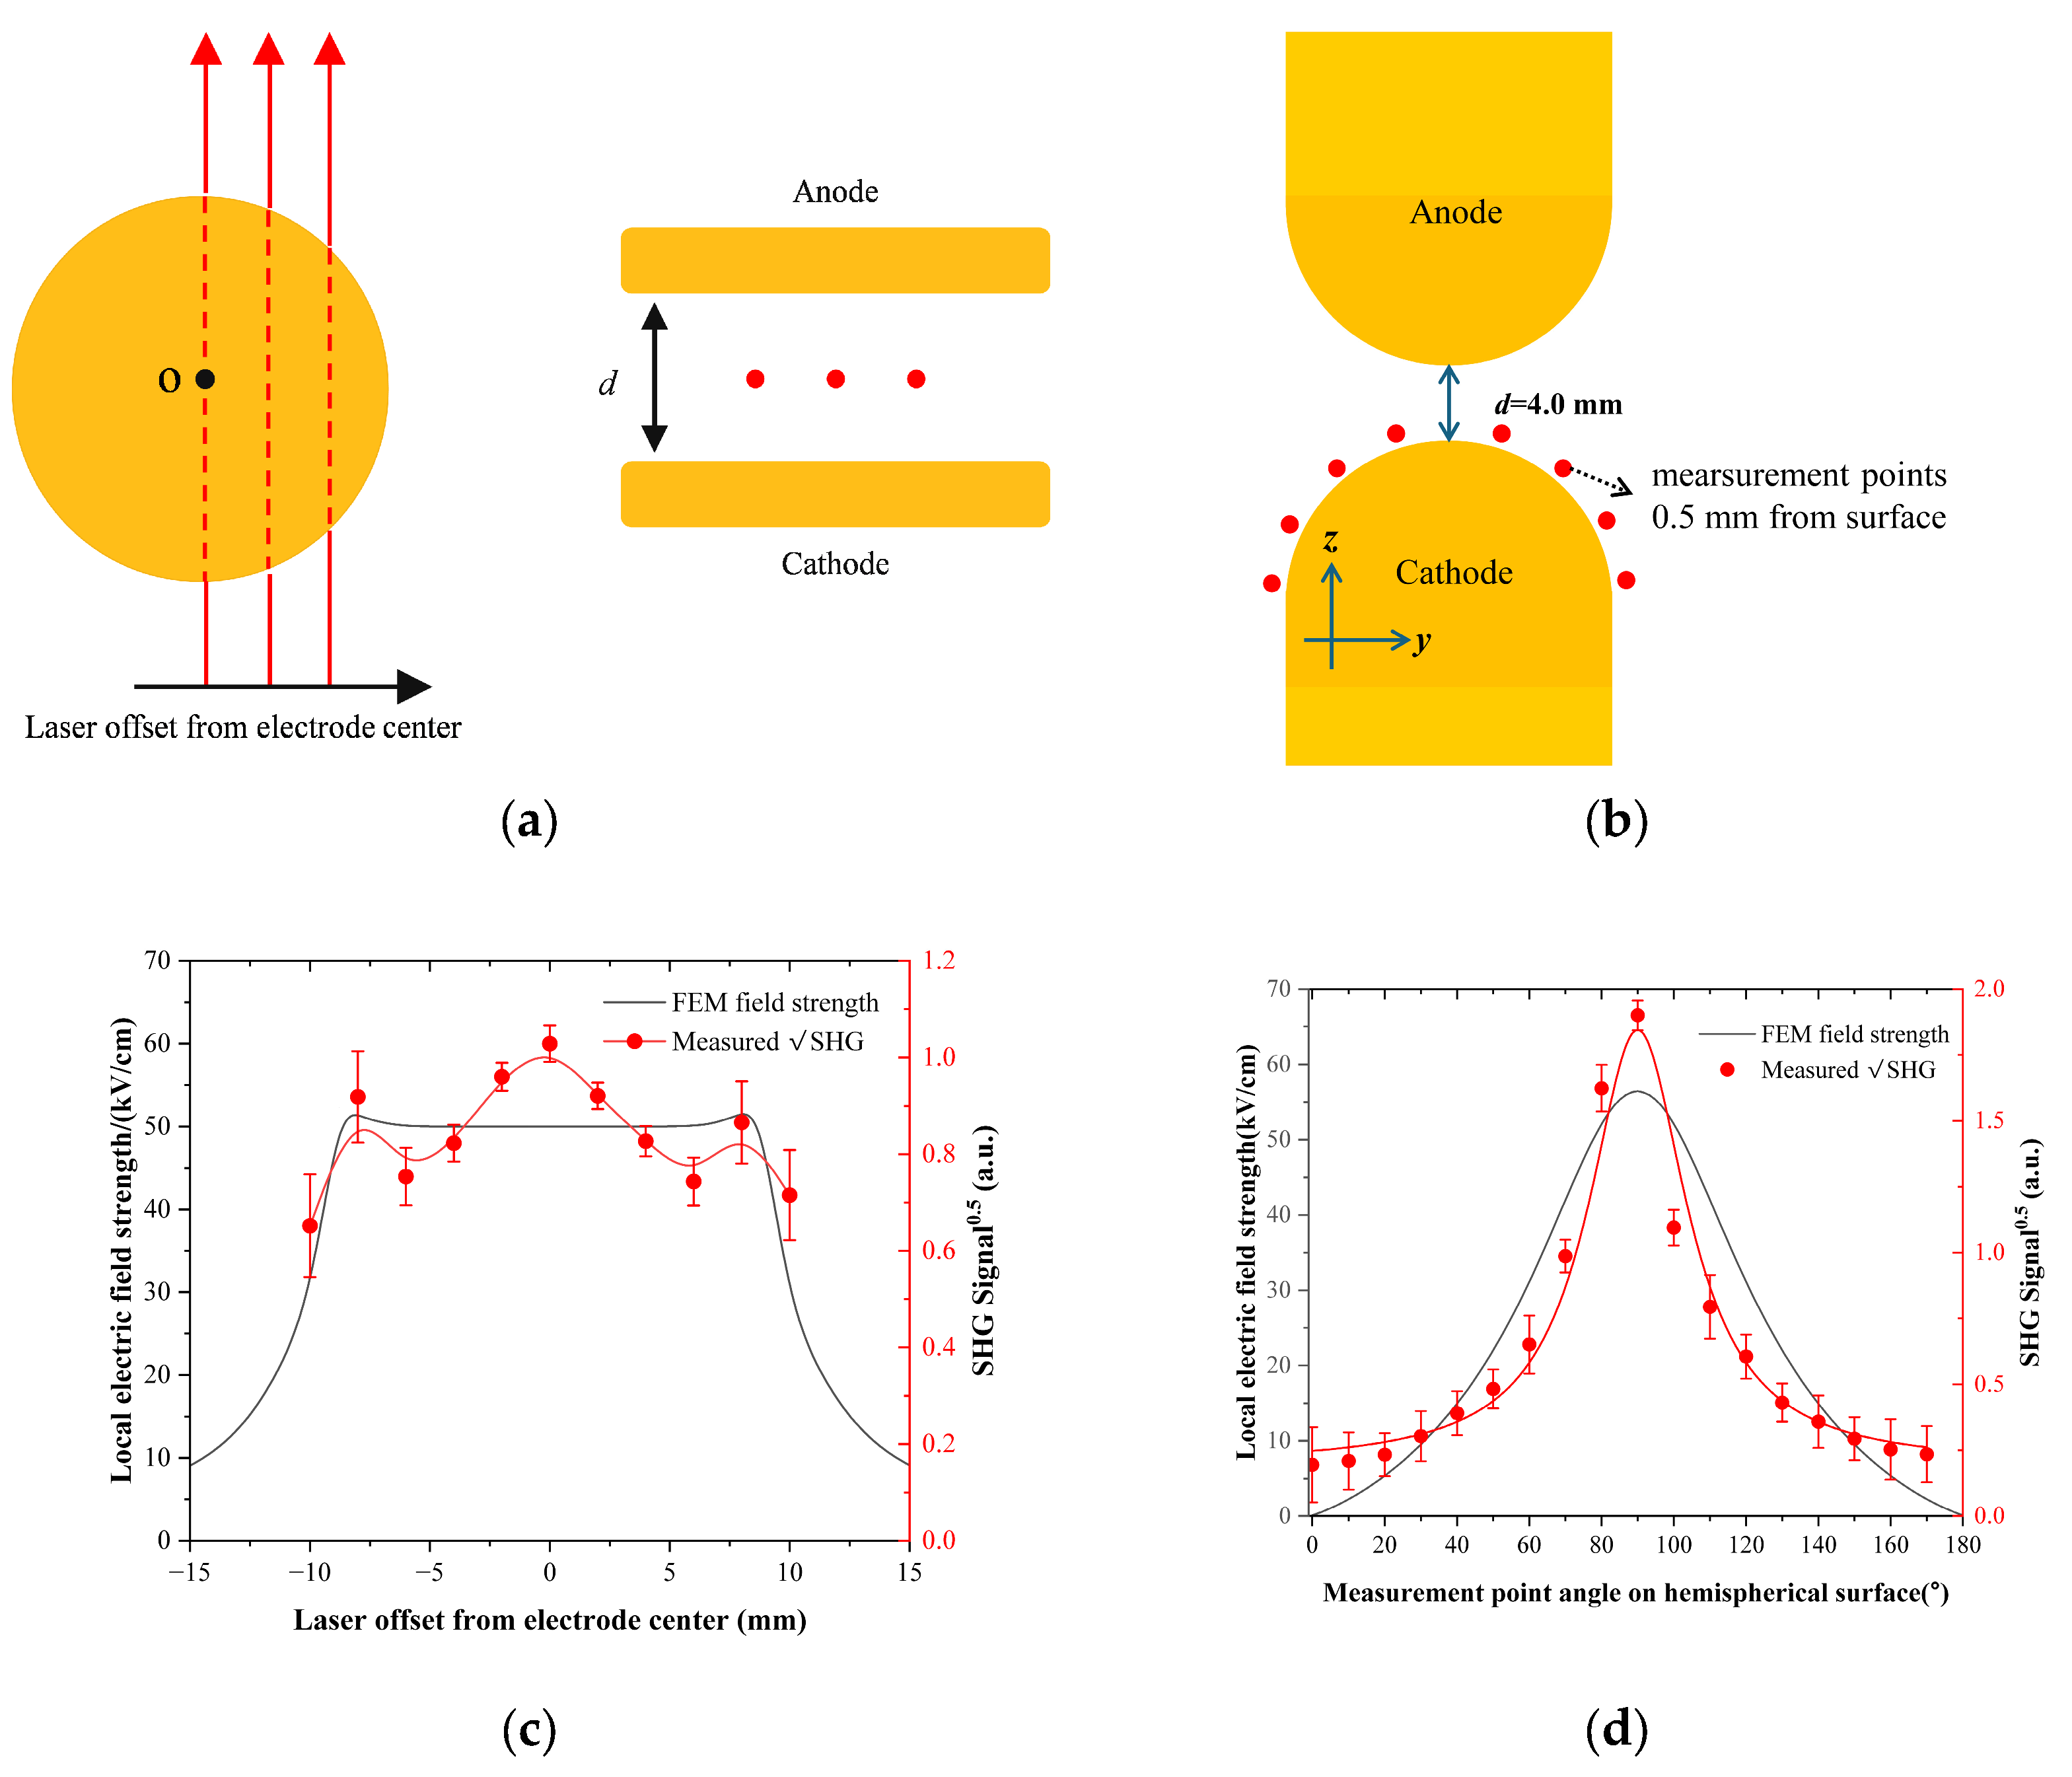
This study further employs cylindrical and hemispherical electrodes to investigate the influence of electric-field non-uniformity on the three-projection direction-retrieval method. In the experiments, the fundamental laser energy was maintained at 20 mJ, and the SF6 gas pressure was kept at 0.5 MPa. Non-uniform electric fields were constructed by varying the electrode geometry. As shown in Figure 4a,b, the cylindrical electrode had a radius of 10.0 mm and an electrode gap of 4.0 mm, while the hemispherical electrodes had a curvature radius of 10.0 mm, with a minimum electrode gap of 4.0 mm. The measurement points for the hemispherical electrode were located 0.5 mm outside the electrode surface.
As shown in Figure 4c, for the cylindrical electrode, as the measurement position moved from the electrode edge toward the electrode center, the second-harmonic intensity first gradually increased and reached a relatively high level at ~8 mm from the electrode center. It then decreased markedly at ~6 mm from the center, forming a local minimum. As the measurement position continued to approach the electrode center, the second-harmonic intensity increased again and remained relatively high near the central region.
The spatial distribution of the second-harmonic signal is jointly determined by the applied electric-field distribution, the laser-focusing weight, and the phase-matching condition. Under the present experimental conditions, the phase-mismatch coefficient Δ k was 0.78 mm−1, corresponding to a coherence length of approximately 4.03 mm, and the Rayleigh length L was 4.92 mm. These values are of the same order as the laser–electric field interaction length. As a result, second-harmonic components generated along the laser propagation direction accumulate a substantial phase difference during propagation. When the second-harmonic component generated in an additional interaction region has a phase close to that of the existing component, the signal undergoes constructive superposition; when its phase is opposite or differs significantly, destructive superposition occurs.
Taking the left side of the electrode center as an example, when the measurement point moved from −10 mm to −8 mm and from −2 mm to 0 mm, the phase shift of the second-harmonic contribution was less than 1°. The dominant phase direction of the second-harmonic contribution therefore remained nearly unchanged, and the signal increased as the effective electric-field contribution increased. When the measurement point moved from −8 mm to −6 mm, the resultant phase changed abruptly from 1.53° to −40.1°, indicating that the second-harmonic components generated in the newly involved effective interaction region undergo destructive interference with the existing second-harmonic components.
As shown in Figure 4d, for the hemispherical electrode, the 0° position corresponds to the electrode axis, whereas positive and negative angles indicate measurement points shifted along the spherical surface toward the two sides of the axis. The experimental results show that the SHG intensity reaches its maximum at the 0° measurement position. As the measurement angle increases, the effective electric-field component decreases significantly, resulting in a rapid reduction in the SHG intensity.
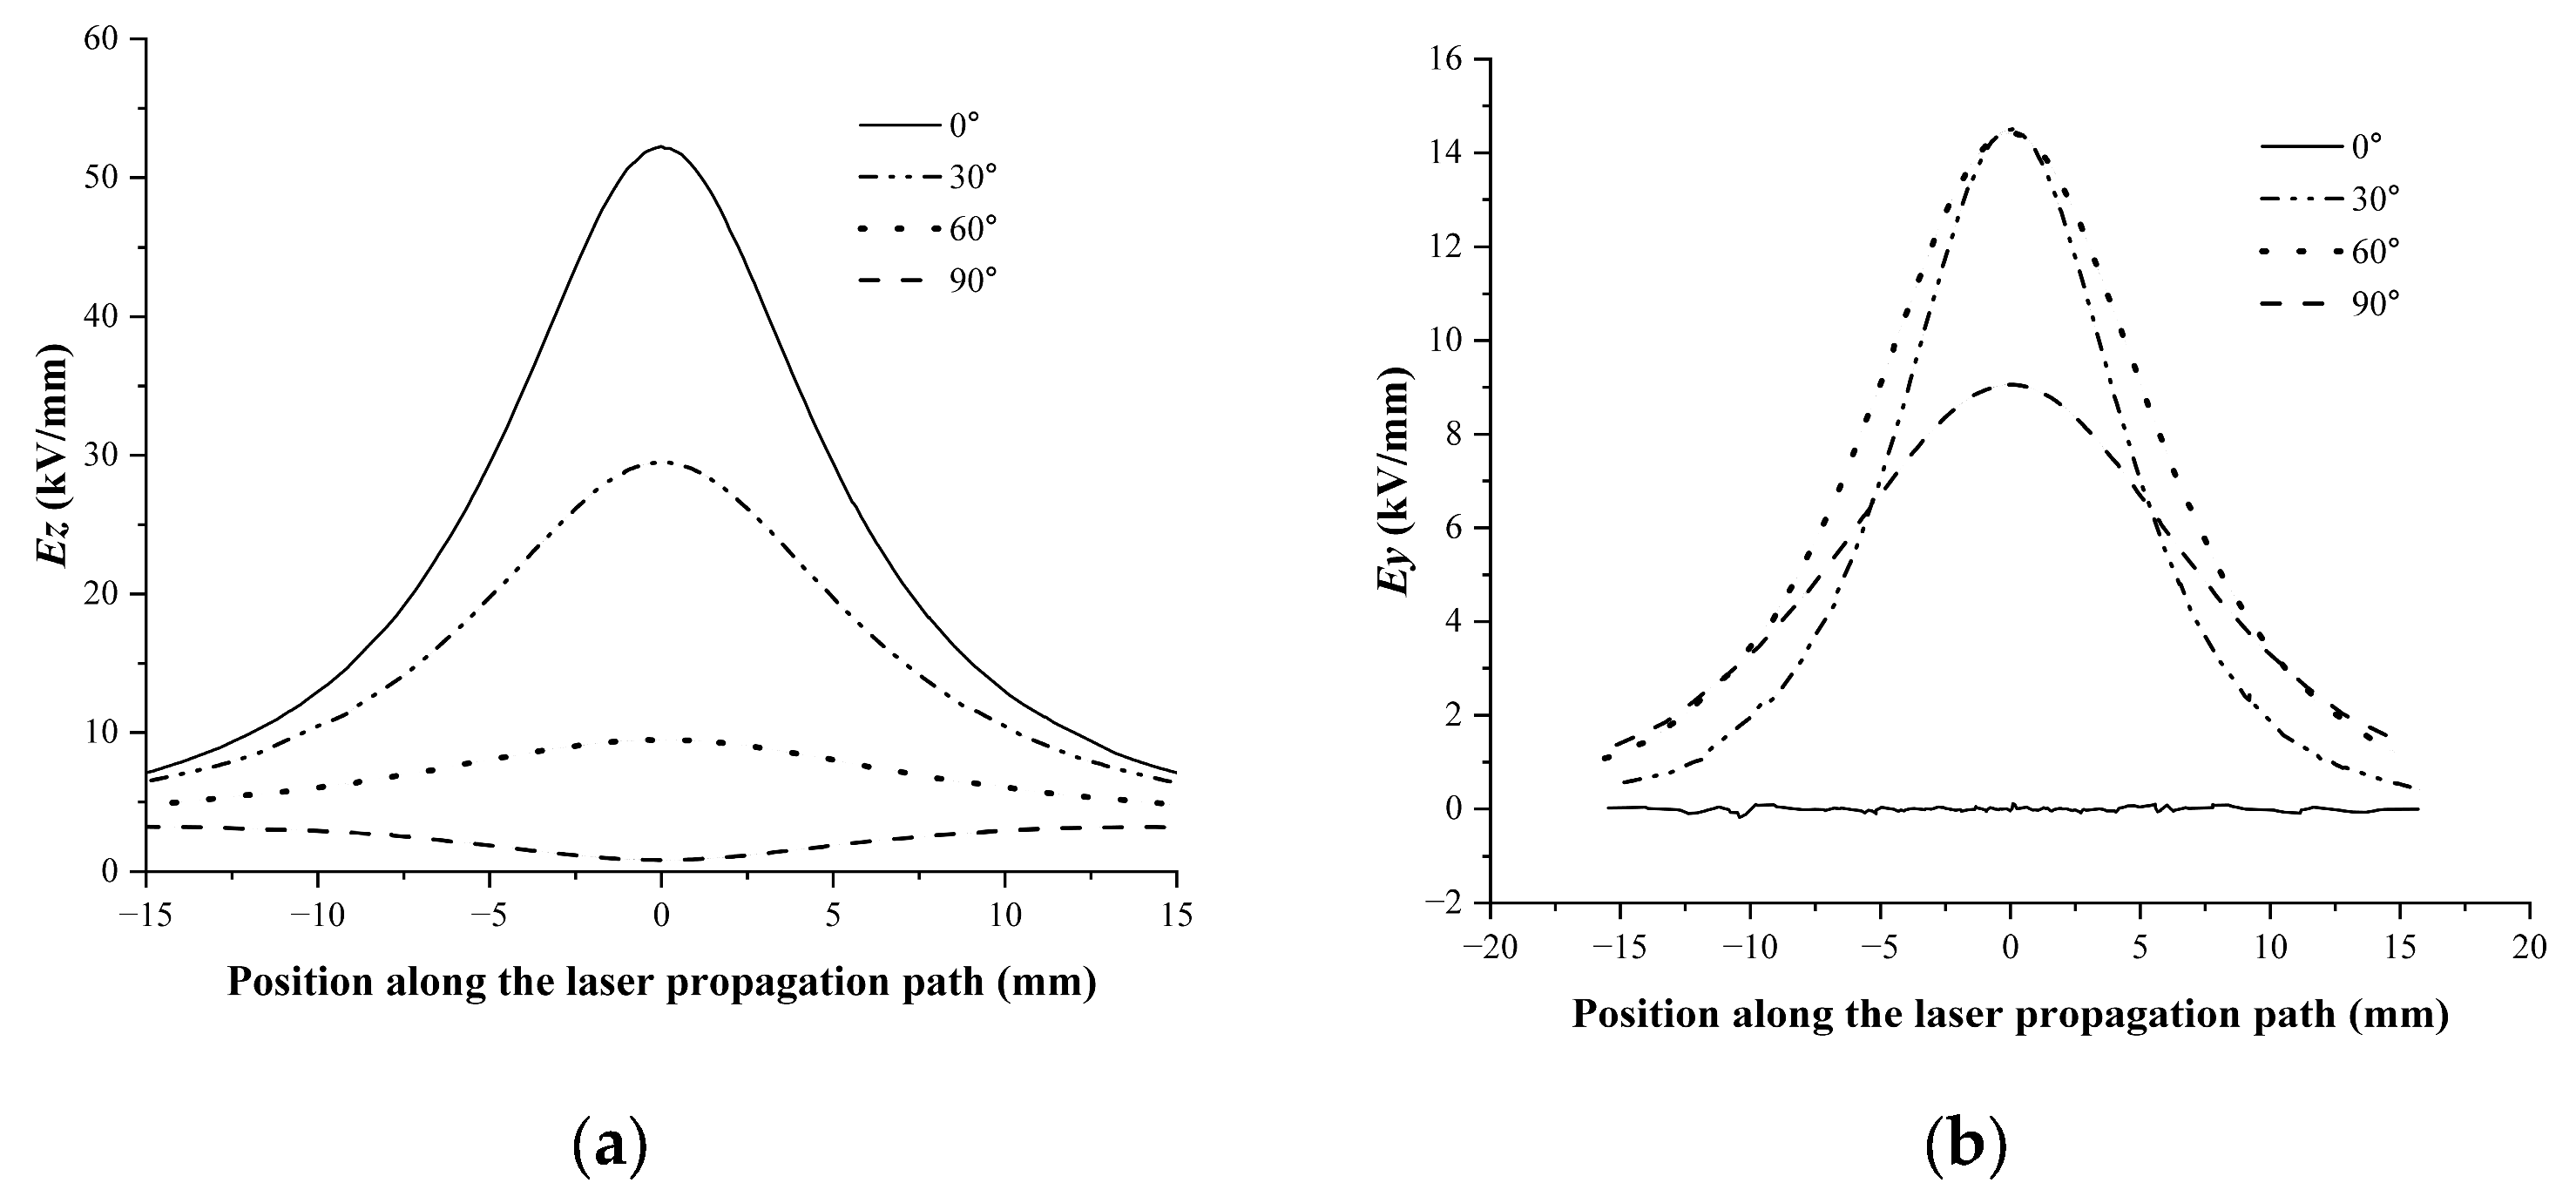
This phenomenon can be further interpreted by analyzing the distributions of the electric-field components along the laser propagation path, as shown in Figure 5. At the 0° measurement position, the Ez component along the electrode axis reaches its peak near the laser focus, and the high-field region is mainly concentrated around the focus, thereby producing strong third-order nonlinear polarization. As the measurement angle increases, the peak value of the Ez component decreases rapidly, and the effective electric-field contribution aligned with the electrode axis is significantly weakened. Meanwhile, the transverse Ey component first increases and then decreases as the measurement point deviates from the axis; however, its response weight in the third-order nonlinear polarization is lower than that of the Ez component. For a fundamental laser polarized along the z direction, the ratio of the third-order nonlinear polarization coefficients induced by the Ez and Ey components is approximately 3:1, as derived from the third-order nonlinear susceptibility tensor relation of an isotropic gas medium under the non-resonant, Kleinman symmetry approximation [29,30]. Therefore, although the Ey component is enhanced within an intermediate angular range, its contribution is still insufficient to compensate for the signal reduction caused by the attenuation of the Ez component.
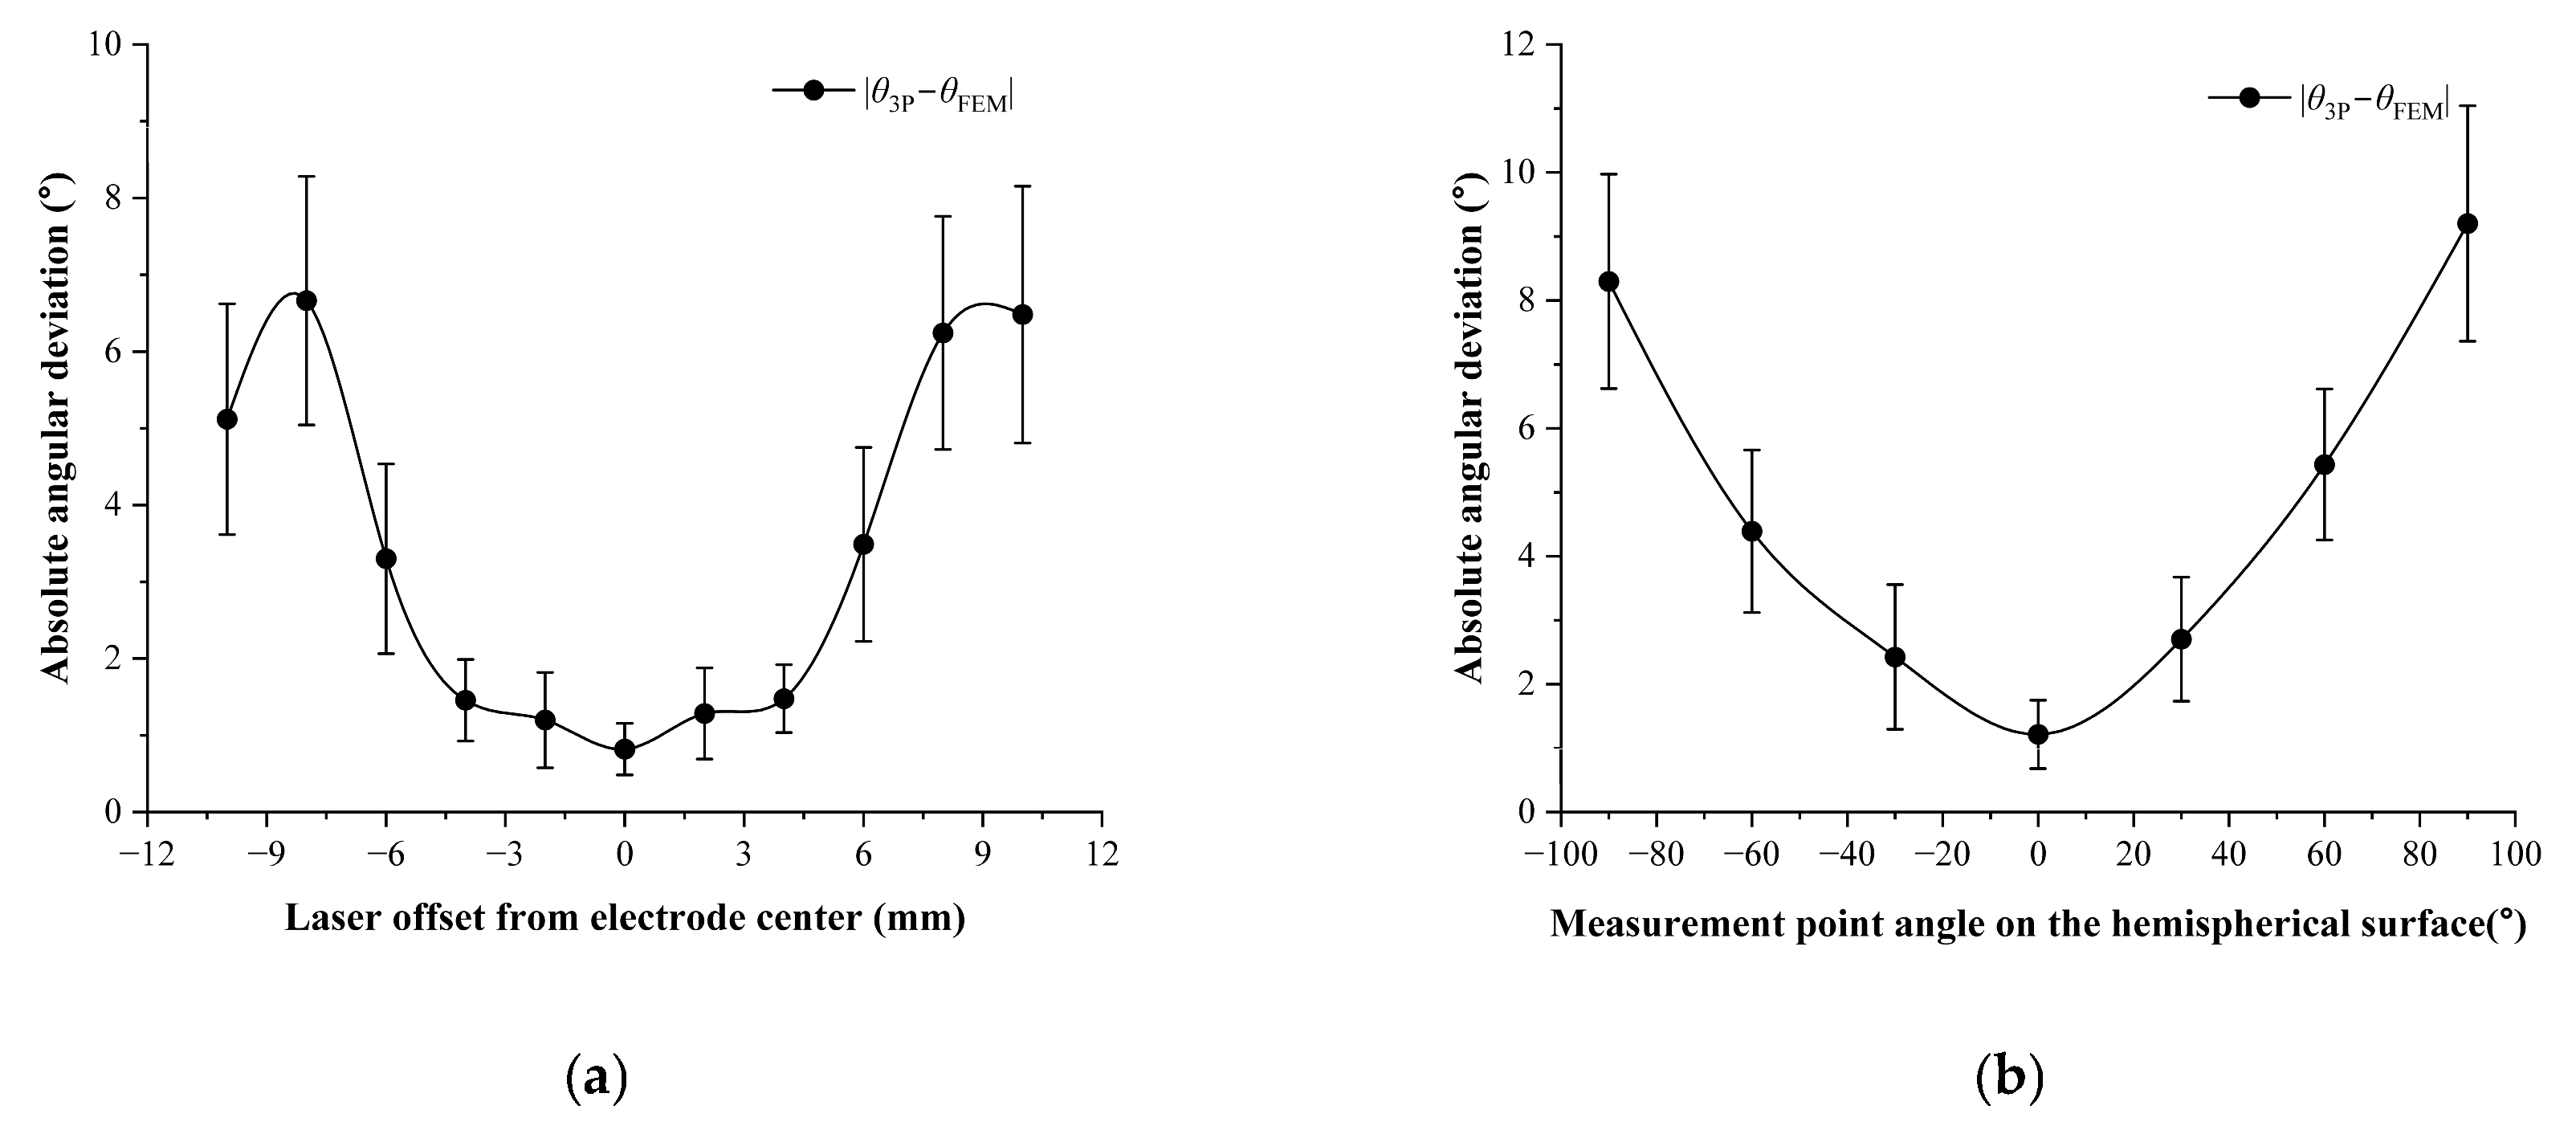
Figure 6 compares the absolute angular deviations between the three-projection direction-retrieval results θ3P and the finite-element simulation results θFEM under different non-uniform electric-field configurations. The results indicate that the absolute angular deviation is related to the spatial non-uniformity of the electric-field direction within the effective laser interaction region.
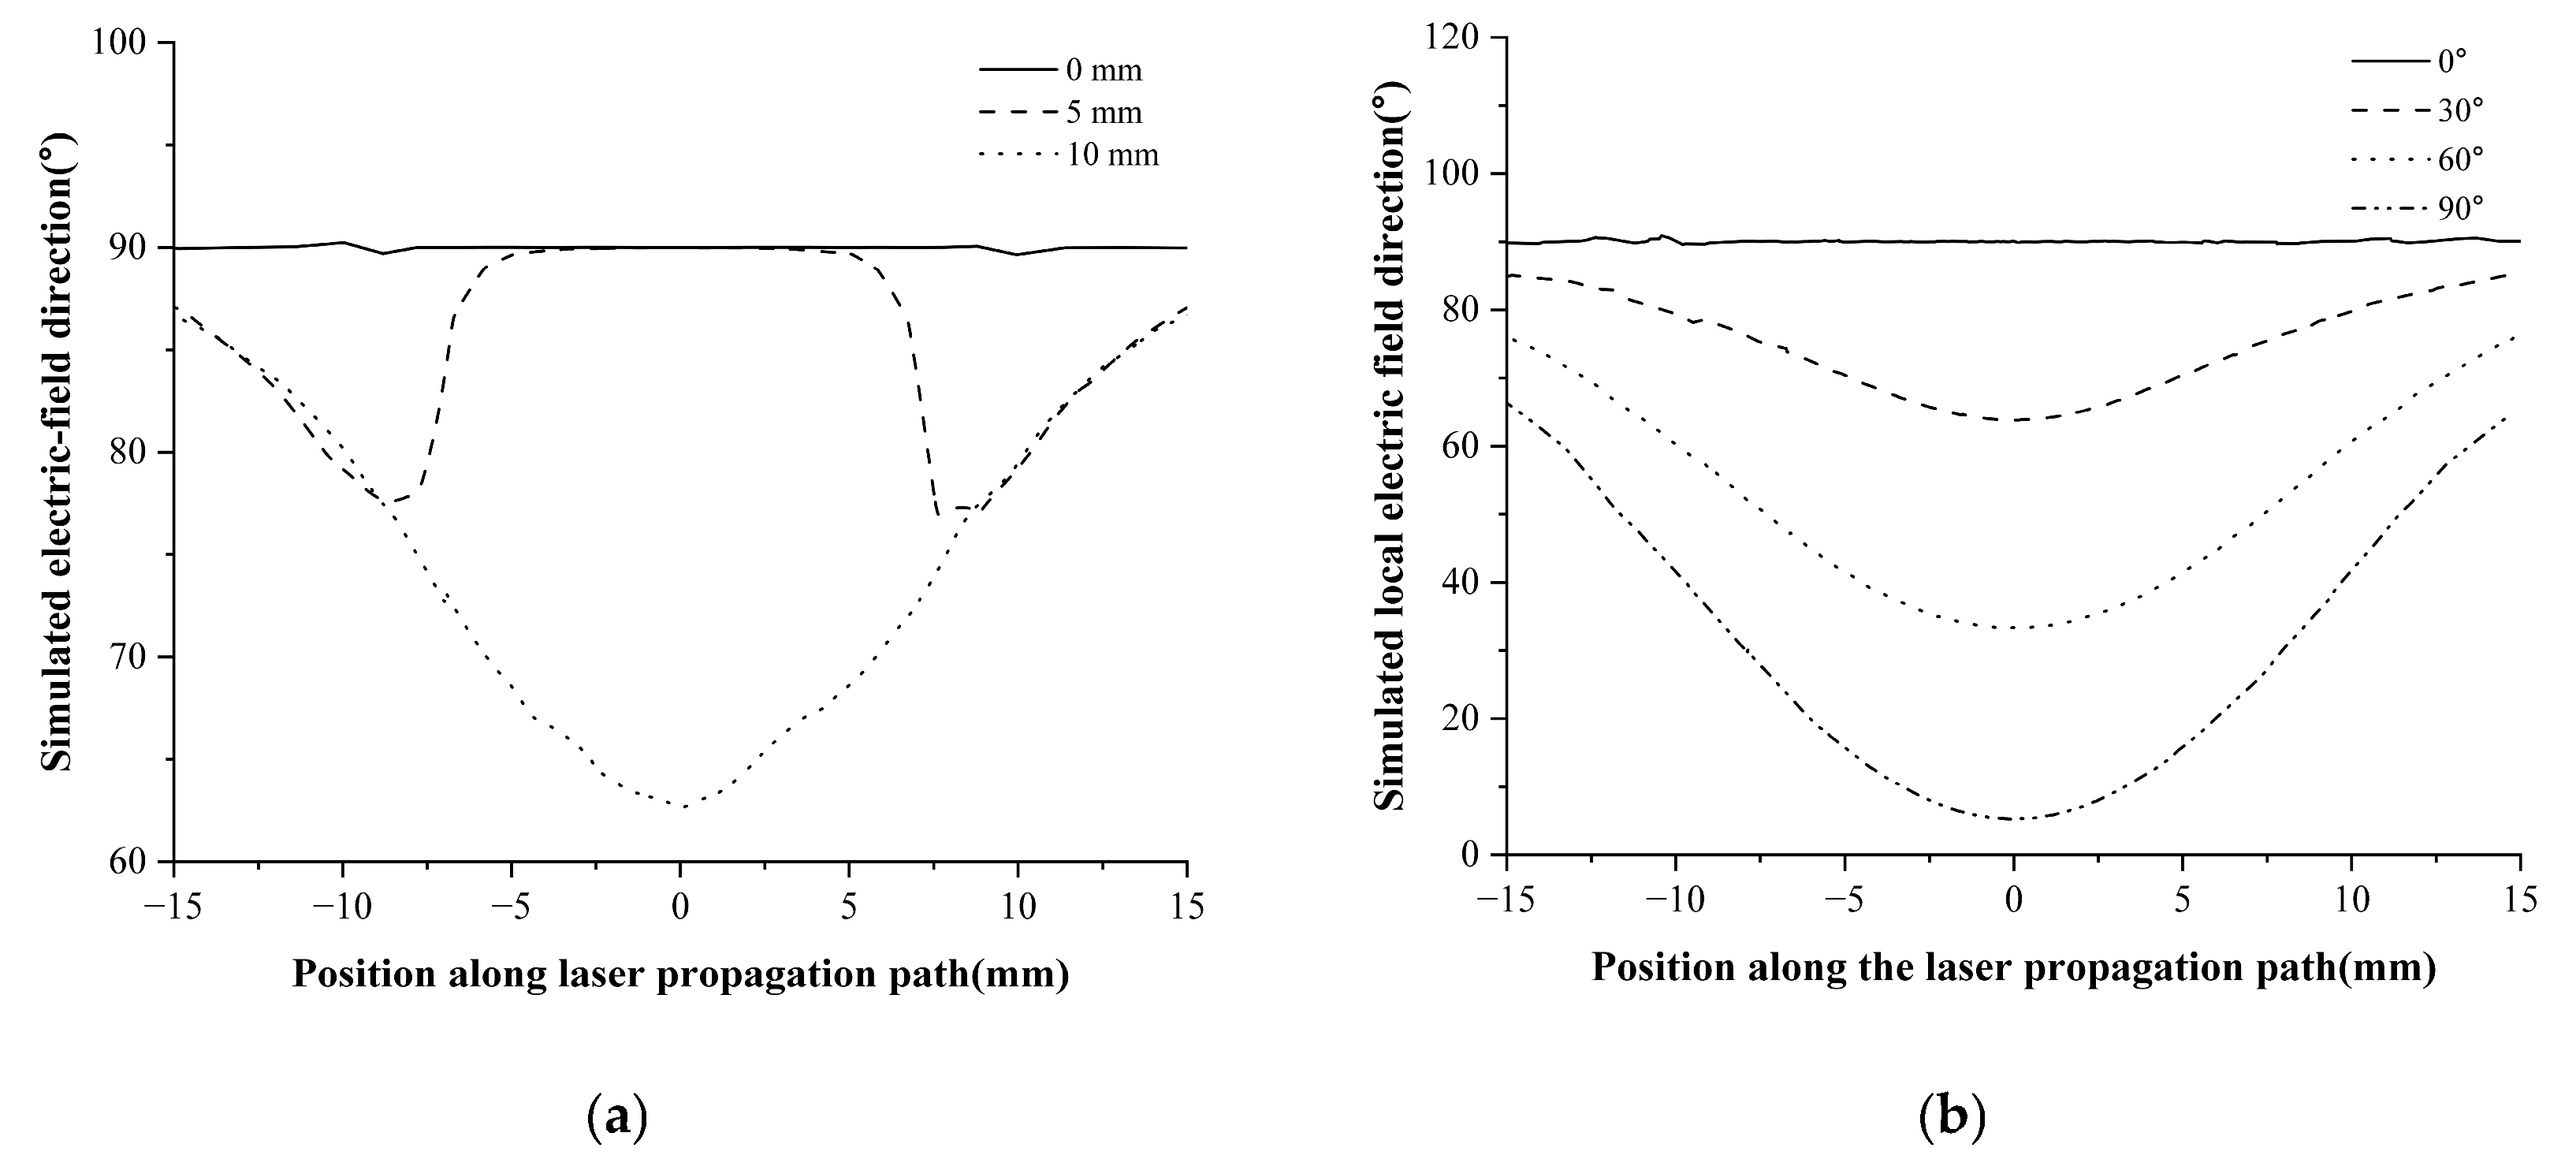
For the cylindrical electrode, the electric-field direction varies only slightly along the laser propagation direction in the central region, as shown in Figure 7a. Within the effective interaction length between the laser and the electric field, the second-harmonic components generated at different positions have similar polarization directions. Therefore, the equivalent polarization direction of the coherently superposed second-harmonic signal can well represent the local electric-field direction near the laser focus. The absolute angular deviation between the experimentally retrieved result and the finite-element simulation result is 1.48 ± 0.44°. When the measurement point is approximately 5 mm away from the electrode center, the electric-field direction near the center of the optical path remains close to the local dominant direction, but a certain degree of directional deflection appears at both ends of the effective interaction region, increasing the absolute angular deviation to 3.49 ± 1.23°. When the measurement point moves to the electrode-edge region, namely d = 10 mm, the electric-field direction changes more significantly along the laser propagation path. The second-harmonic components generated at different spatial positions have different polarization directions and propagation phases. In this case, the detected signal no longer corresponds only to the local electric-field direction at the focus, but represents the equivalent result of coherent superposition of multiple spatial contributions within the finite interaction length. Consequently, the absolute angular deviation between the retrieved direction and the simulated electric-field direction further increases to 6.68 ± 1.62°.
For the hemispherical electrode, the spatial non-uniformity of the electric-field direction increases with the measurement angle. Within the range of ±60°, the experimentally retrieved results remain in good agreement with the finite-element simulation results, with a maximum absolute angular deviation of 5.43 ± 1.27°. This indicates that, in this region, the second-harmonic signal intensity is relatively high and the electric-field direction within the effective laser interaction region remains comparatively stable. As a result, the three-projection retrieval method can accurately reflect the local electric-field direction at the measurement point. When the measurement point approaches the edge of the hemispherical electrode, the absolute angular deviation increases to 9.20 ± 1.84°.
As shown in Figure 7b, the non-uniformity of the electric-field direction along the laser propagation path increases as the measurement point gradually moves toward the edge of the hemispherical electrode. To quantify the axial length scale over which the detected signal is accumulated, the effective interaction length near the edge measurement position was estimated from the cumulative second-harmonic contribution along the laser propagation direction. The effective interaction length Leff was defined as the axial distance over which the cumulative contribution increases from 5% to 95%. For the edge measurement position, the corresponding 5% and 95% cumulative contribution positions are approximately −10.44 mm and 10.43 mm, respectively, giving Leff ≈ 20.87 mm.
Within this finite interaction length, the electric-field direction at larger measurement angles varies appreciably along the optical path. In particular, a clear difference appears between the electric-field direction near the focus and those at both ends of the effective interaction region. The second-harmonic components generated at different axial positions therefore have dispersed polarization directions and phases, causing the final equivalent polarization direction to deviate from the local electric-field direction at the focus.
The three-projection method can therefore achieve relatively accurate local direction retrieval in regions where the electric-field direction varies slowly. To further improve the direction-retrieval accuracy in strongly non-uniform regions, stronger laser focusing, a shorter Rayleigh length, or a reduced effective interaction length can be adopted, so that the second-harmonic signal mainly originates from the region near the focus. This would reduce the influence of electric-field direction non-uniformity along the optical path on the retrieved result.

4. Conclusions

This study establishes a three-projection E-FISH method for local electric-field direction measurement in SF6 gas. The results show that, under sufficient signal conditions, the direction retrieved by the proposed method agrees well with that obtained from polarization-angle scanning, with a maximum difference of 0.64°, while reducing the number of required analyzer angles. Increasing the electric-field strength or laser pulse energy enhances the second-harmonic modulation amplitude, thereby reducing the absolute angular deviation. Under weak-signal conditions, intensity fluctuations have a stronger influence on the retrieved angle, resulting in larger deviations and greater dispersion. SF6 pressure exhibits a non-monotonic influence on the direction-retrieval results, which is mainly associated with the competition between enhanced nonlinear polarization due to increased molecular number density and limited coherent accumulation of the second-harmonic signal caused by increased phase mismatch.
The electric-field direction retrieved by the three-projection method is an equivalent direction formed by the coherent superposition of second-harmonic components within the finite interaction region. When the field direction varies only slightly within the effective interaction region, the retrieved direction can well represent the local electric-field direction near the focus, with a maximum absolute angular deviation of 1.48 ± 0.44° in the central region of the cylindrical electrode and 5.43 ± 1.27° within the ±60° measurement range of the hemispherical electrode. When the directional non-uniformity increases, the retrieved result deviates from the local electric-field direction at the focus; the absolute angular deviations in the edge regions of the cylindrical and hemispherical electrodes increase to 6.68 ± 1.62° and 9.20 ± 1.84°, respectively. Future work will further investigate electric-field distortions caused by practical spacer geometries and surface charge accumulation, and will improve the direction-measurement capability in strongly non-uniform electric fields through stronger laser focusing.

Author Contributions

Conceptualization, J.Z., C.G., M.Y. and X.L.; fund acquisition, J.Z. and C.G.; methodology, J.Z. and C.H.; formal analysis, J.Z., C.G., M.Y. and Y.W.; resources, C.G.; investigation, M.Y., C.H., D.L. and Y.W.; data curation, C.G., M.Y., C.H. and D.L.; writing—original draft, J.Z. and M.Y.; writing—review and editing, J.Z., C.G., M.Y. and Z.A.; supervision, J.Z., C.G., Z.A. and X.L. All authors have read and agreed to the published version of the manuscript.

Funding

This research was funded by the Science and Technology Project of State Grid Corporation of China (SGCC), grant number 5500-202355792A-3-8-KJ.

Data Availability Statement

The original contributions presented in this study are included in the article. Further inquiries can be directed to the corresponding author.

Conflicts of Interest

The authors declare that this study received funding from the Science and Technology Project of State Grid Corporation of China (Grant No. 5500-202355792A-3-8-KJ). The funder was not involved in the study design, collection, analysis, or interpretation of data, the writing of this article, or the decision to submit it for publication. Authors Chong Guo, Zhengjie An, and Yuyi Wu were employed by China Electric Power Research Institute. The remaining authors declare that the research was conducted in the absence of any commercial or financial relationships that could be construed as a potential conflict of interest.

References

  1. Magier, T.; Tenzer, M.; Koch, H. Direct Current Gas-Insulated Transmission Lines. IEEE Trans. Power Deliv. 2018, 33, 440–446. [Google Scholar] [CrossRef] [Scilit]
  2. Koch, H.; Goll, F.; Magier, T.; Juhre, K. Technical aspects of gas insulated transmission lines and application of new insulating gases. IEEE Trans. Dielectr. Electr. Insul. 2018, 25, 1448–1453. [Google Scholar] [CrossRef] [Scilit]
  3. Tu, Y.; Chen, G.; Li, C.; Wang, C.; Ma, G.-M.; Zhou, H.; Ai, X.; Cheng, Y. ±100-kV HVDC SF6/N2 Gas-Insulated Transmission Line. IEEE Trans. Power Deliv. 2020, 35, 735–744. [Google Scholar] [CrossRef] [Scilit]
  4. Zhang, B.; Qi, Z.; Zhang, G. Charge accumulation patterns on spacer surface in HVDC gas-insulated system: Dominant uniform charging and random charge speckles. IEEE Trans. Dielectr. Electr. Insul. 2017, 24, 1229–1238. [Google Scholar] [CrossRef] [Scilit]
  5. Wu, S.; Xu, H.; Zhang, X.; Liang, Y.; Shao, Y.; Wang, C.; Tu, Y.; Xu, Y. Towards the surface flashover in DC GIL/GIS: The electric field distribution and the surface charge accumulation. Phys. Scr. 2022, 97, 072001. [Google Scholar] [CrossRef] [Scilit]
  6. Li, C.; Lin, C.; Zhang, B.; Li, Q.; Liu, W.; Hu, J.; He, J. Understanding surface charge accumulation and surface flashover on spacers in compressed gas insulation. IEEE Trans. Dielectr. Electr. Insul. 2018, 25, 1152–1166. [Google Scholar] [CrossRef] [Scilit]
  7. Demidov, V.I.; Ratynskaia, S.V.; Rypdal, K. Electric probes for plasmas: The link between theory and instrument. Rev. Sci. Instrum. 2002, 73, 3409–3439. [Google Scholar] [CrossRef] [Scilit]
  8. Sun, S.; Guo, H.; Luiten, A.N.; Weng, W. Photonic electrometry using a piezoelectric Pockels microresonator. Phys. Rev. Appl. 2025, 24, 044001. [Google Scholar] [CrossRef] [Scilit]
  9. Mohapatra, A.K.; Jackson, T.R.; Adams, C.S. Coherent Optical Detection of Highly Excited Rydberg States Using Electromagnetically Induced Transparency. Phys. Rev. Lett. 2007, 98, 113003. [Google Scholar] [CrossRef] [Scilit] [PubMed]
  10. Holloway, C.L.; Gordon, J.A.; Jefferts, S.; Schwarzkopf, A.; Anderson, D.A.; Miller, S.A.; Thaicharoen, N.; Raithel, G. Broadband Rydberg Atom-Based Electric-Field Probe for SI-Traceable, Self-Calibrated Measurements. IEEE Trans. Antennas Propag. 2014, 62, 6169–6182. [Google Scholar] [CrossRef] [Scilit]
  11. Sitz, P.; Yaris, R. Frequency Dependence of the Higher Susceptibilities. J. Chem. Phys. 1968, 49, 3546–3557. [Google Scholar] [CrossRef] [Scilit]
  12. Finn, R.S.; Ward, J.F. dc-Induced Optical Second-Harmonic Generation in the Inert Gases. Phys. Rev. Lett. 1971, 26, 285–289. [Google Scholar] [CrossRef] [Scilit]
  13. Ward, J.F.; Bigio, I.J. Molecular second- and third-order polarizabilities from measurements of second-harmonic generation in gases. Phys. Rev. A 1975, 11, 60–66. [Google Scholar] [CrossRef] [Scilit]
  14. Dai, J.; Xie, X.; Zhang, X.-C. Detection of Broadband Terahertz Waves with a Laser-Induced Plasma in Gases. Phys. Rev. Lett. 2006, 97, 103903. [Google Scholar] [CrossRef] [Scilit] [PubMed]
  15. Peterson, K.A.; Kane, D.J. Electric-field-induced second-harmonic generation in GaN devices. Opt. Lett. 2001, 26, 438–440. [Google Scholar] [CrossRef] [Scilit] [PubMed]
  16. Dogariu, A.; Goldberg, B.M.; O’bYrne, S.; Miles, R.B. Species-Independent Femtosecond Localized Electric Field Measurement. Phys. Rev. Appl. 2017, 7, 0240244. [Google Scholar] [CrossRef] [Scilit]
  17. Goldberg, B.M.; Chng, T.L.; Dogariu, A.; Miles, R.B. Electric field measurements in a near atmospheric pressure nanosecond pulse discharge with picosecond electric field induced second harmonic generation. Appl. Phys. Lett. 2018, 112, 064102. [Google Scholar] [CrossRef] [Scilit]
  18. Cui, Y.; Wang, H.; Zhuang, C.; Luo, H.; Wang, X.; Zeng, R. Electric Field Measurement in Dielectric Barrier Discharges Using Electric Field Induced Second Harmonic Generation in Ambient Air. IEEE Trans. Dielectr. Electr. Insul. 2020, 27, 2071–2077. [Google Scholar] [CrossRef] [Scilit]
  19. Hogue, J.; Cusson, P.; Meunier, M.; Seletskiy, D.V.; Reuter, S. Sensitive detection of electric field-induced second harmonic signals. Opt. Lett. 2023, 48, 4601–4604. [Google Scholar] [CrossRef] [Scilit] [PubMed]
  20. Park, J.; Cha, M.S. Measuring space charge and electric field in axisymmetric dielectric barrier discharge using EFISH technique. Sci. Rep. 2025, 15, 9127. [Google Scholar] [CrossRef] [Scilit] [PubMed]
  21. Chng, T.L.; Naphade, M.; Goldberg, B.M.; Adamovich, I.V.; Starikovskaia, S.M. Electric field vector measurements via nanosecond electric-field-induced second-harmonic generation. Opt. Lett. 2020, 45, 1942–1945. [Google Scholar] [PubMed]
  22. Nakamura, S.; Sogame, M.; Sato, M.; Fujii, T.; Oishi, Y.; Kumada, A. Electric-Field-Vector-Profile Measurement in Gas Based on Electric-Field-Induced Second-Harmonic Generation. IEEE Trans. Dielectr. Electr. Insul. 2025, 32, 3448–3453. [Google Scholar] [CrossRef] [Scilit]
  23. Chng, T.L.; Starikovskaia, S.M.; Schanne-Klein, M.-C. Electric field measurements in plasmas: How focusing strongly distorts the E-FISH signal. Plasma Sources Sci. Technol. 2020, 29, 125002. [Google Scholar] [CrossRef] [Scilit]
  24. Chng, T.L.; Brisset, A.; Jeanney, P.; Starikovskaia, S.M.; Adamovich, I.V.; Tardiveau, P. Electric field evolution in a diffuse ionization wave nanosecond pulse discharge in atmospheric pressure air. Plasma Sources Sci. Technol. 2019, 28, 09LT02. [Google Scholar] [CrossRef] [Scilit]
  25. Chen, S.; He, H.; Chen, Y.; Liu, Z.; Xie, S.; Che, J.; He, K.; Chen, W. Measurement of inhomogeneous electric field based on electric field-induced second-harmonic generation. Measurement 2024, 231, 114576. [Google Scholar] [CrossRef] [Scilit]
  26. Vorenkamp, M.; Steinmetz, S.A.; Chen, T.Y.; Ju, Y.; Kliewer, C.J. Suppression of coherent interference to electric-field-induced second-harmonic (E-FISH) signals for the measurement of electric field in mesoscale confined geometries. Opt. Lett. 2023, 48, 1930–1933. [Google Scholar] [CrossRef] [Scilit] [PubMed]
  27. Raskar, S.; Orr, K.; Adamovich, I.V.; Chng, T.L.; Starikovskaia, S.M. Spatially enhanced electric field induced second harmonic (SEEFISH) generation for measurements of electric field distributions in high-pressure plasmas. Plasma Sources Sci. Technol. 2022, 31, 085002. [Google Scholar] [CrossRef] [Scilit]
  28. Fan, H.; Proskurin, A.; Song, M.; Kivshar, Y.; Bogdanov, A. Electric-field-induced second-harmonic generation. Opto-Electron. Adv. 2026, 9, 250193. [Google Scholar]
  29. Feng, T.; Raabe, N.; Rustige, P.; Steinmeyer, G. Electric-field induced second-harmonic generation of femtosecond pulses in atmospheric air. Appl. Phys. Lett. 2018, 112, 241101. [Google Scholar] [CrossRef] [Scilit]
  30. Mizrahi, V.; Shelton, D.P. Deviations from Kleinman symmetry measured for several simple atoms and molecules. Phys. Rev. A 1985, 31, 3145–3154. [Google Scholar] [CrossRef] [Scilit]
Figure 1. E-FISH measurement system for SF6 gas. HR: 1064 nm filter. FL1, FL2 and FL3 are plano-convex lenses. LP: 655 mm long-wave pass filter. M1: dichroic mirror (1064 nm reflection, 532 nm transmission). DM: dichroic mirror (1064 nm transmission, 532 nm reflection). PD: silicon-biased photodetector. PMT: photomultiplier tube.
Energies 19 03548 g001
Figure 2. Reference-field validation and comparison between polarization-angle scanning and three-projection retrieval. (a) Polarization-angle responses under different preset electric-field directions. (b) Absolute angular deviation of the scan-fitting and three-projection retrieval methods.
Energies 19 03548 g002
Figure 3. Influence of operating conditions on second-harmonic signal amplitude and direction-retrieval stability in the parallel-plate electrode configuration. (a) Applied electric-field strength. The laser pulse energy was 20 mJ and the SF6 pressure was 0.5 MPa. (b) Laser pulse energy. The applied voltage was 20 kV and the SF6 pressure was 0.5 MPa. (c) SF6 pressure. The applied voltage was 20 kV and the laser pulse energy was 20 mJ.
Energies 19 03548 g003
Figure 4. Measurement configurations and SHG signal distributions for different electrode structures. (a) Measurement configuration for the cylindrical electrode. (b) Measurement configuration for the hemispherical electrode. (c) SHG signal distribution for the cylindrical electrode. (d) SHG signal distribution for the hemispherical electrode.
Energies 19 03548 g004
Figure 5. Distributions of Ey and Ez along the laser path in the hemispherical electrode. (a) Ez component distribution. (b) Ey component distribution.
Energies 19 03548 g005
Figure 6. Absolute angular deviations of the three-projection direction retrieval under different non-uniform electrode configurations. (a) The cylindrical electrode. (b) The hemispherical electrode.
Energies 19 03548 g006
Figure 7. Simulated electric-field direction distributions along the laser propagation path. (a) The cylindrical electrode. (b) The hemispherical electrode.
Energies 19 03548 g007
Disclaimer/Publisher’s Note: The statements, opinions and data contained in all publications are solely those of the individual author(s) and contributor(s) and not of MDPI and/or the editor(s). MDPI and/or the editor(s) disclaim responsibility for any injury to people or property resulting from any ideas, methods, instructions or products referred to in the content.