Article

Predicting Failure in Carbon Steel Pipeline Hydrogen–Methane Blend Transporting

by
Hossein Moradi
,
Maria Francesca Milazzo
*,
Elpida Piperopoulos
and
Edoardo Proverbio
Department of Engineering, University of Messina, Contrada di Dio, 98166 Messina, Italy
*
Author to whom correspondence should be addressed.
Energies 2026, 19(14), 3449; https://doi.org/10.3390/en19143449
Submission received: 19 June 2026 / Revised: 10 July 2026 / Accepted: 16 July 2026 / Published: 22 July 2026

Abstract

The transition to a decarbonized energy infrastructure relies on repurposing existing pipelines for hydrogen–methane mixtures, which introduces significant concerns regarding hydrogen embrittlement. Accordingly, a coupled Multiphysics phase-field model was developed to predict hydrogen-assisted failure in elastic–plastic solids. This framework is numerically implemented via the finite element method to predict the structural integrity of pipeline steel strength classes representative of API 5L X65, X70, and X80 by explicitly accounting for elastoplastic deformation, hydrogen trapping effects, and stress-driven diffusion. By computing crack growth resistance curves across various scenarios, it has been demonstrated the capability of the model to capture material sensitivities by varying hydrogen–methane blend compositions, operational pressures, and the elastoplastic deformation behavior of different strength grades. The investigation revealed that methane limits surface hydrogen coverage, thereby mitigating the crack-tip decohesion mechanism. Furthermore, the model indicates that at a pressure of 7.5 MPa, a 15 vol% hydrogen–methane blend enables these materials to retain 80–90% of their fracture toughness and exhibit ductile failure. Finally, higher-strength steel classes (representative of X80) demonstrate greater susceptibility to hydrogen embrittlement under these conditions due to yield stress-amplified hydrostatic stress, whereas lower-strength steels exhibit greater defect tolerance for the hydrogen-blend transition.

1. Introduction

Reducing greenhouse gas emissions is one of the primary challenges in mitigating global climate change [1]. In the pursuit of a carbon-neutral economy by 2050, transitioning away from fossil fuels to clean energy carriers is essential [2,3,4]. However, a complete shift to pure hydrogen infrastructure requires massive capital investment [5]. Consequently, an incremental strategy involving the blending of hydrogen with methane (natural gas) has emerged as a pragmatic approach [4]. This strategy facilitates a transition, repurposing already existing natural gas infrastructure ranging from transmission networks to power plant feed lines and gas turbines [6], and the modern power plants are adopting technologies to utilize these gas mixtures as fuel, decarbonizing energy production without the need to construct pure-hydrogen facilities [7,8,9,10,11,12]. Despite these advantages, the introduction of hydrogen into natural gas systems presents safety challenges [13,14,15]. The interaction between hydrogen and the metallic infrastructure leads to material performance reduction via a phenomenon known as hydrogen embrittlement (HE) [16,17,18]. Hydrogen atoms can diffuse into the crystal lattice of carbon steels such as the API 5L grades and accumulate at microstructural defects [19]. This accumulation alters the mechanical properties, leading to a reduction in ductility and a loss of fracture toughness [20,21]. The presence of hydrogen accelerates fatigue crack growth rates, leaving the material susceptible to sudden, brittle fracture under operational stresses [22]. Therefore, it is necessary to quantify the effect of mixing hydrogen and methane on the structural integrity to define safe operational boundaries and prevent failure. Experimental studies show that methane itself does not dissolve or diffuse appreciably within steels due to its molecular nature and low solubility [23]; instead, it influences HE through competitive adsorption at the metal surface [24,25,26]. Numerical modeling has become an indispensable tool for safety assessments. Numerical studies allow for analyzing the interactions between hydrogen diffusion and mechanical stress gradients. Among computational techniques, the phase field method for fracture has emerged as robust and effective [27,28]. Unlike traditional fracture mechanics, which struggle to track sharp crack topologies and propagation paths [29,30], the PFM regularizes the sharp crack using a continuous scalar variable to represent the hydrogen accumulation, hydrostatic stress gradients, and material degradation [27,28]. This mathematical approach couples the embrittlement mechanism with the mechanical equations, enabling the prediction of crack initiation and propagation [31]. In the literature on the phase field method for pure hydrogen, the core of the embrittlement mechanism is governed by a degradation function. Recent implementations have shown the capabilities of the PFM in predicting the critical burst pressures of hydrogen transmission pipelines, cyclic fatigue and welded structures [22,32,33]. The underlying coupled elastoplastic deformation, stress-assisted diffusion, and defect trapping algorithms have been established through the phase-field frameworks by Martínez-Pañeda et al. [27] and generalized by Díaz et al. [34]. Despite these extensive advancements, existing frameworks focus on pure hydrogen environments and the interactions governing hydrogen–methane pipeline blending remain unaddressed. Building upon the established foundation, the present work is an engineering application and extension of the phase field method to hydrogen–methane blending environments. This study embeds a Langmuir adsorption isotherm governed by gas partial fugacity derived from the Noble–Abel equation. Furthermore, boundary layer crack growth resistance curves in pipeline grades (API 5L X65, X70, and X80) are calculated under small-scale yielding. Ultimately, this application establishes engineering thresholds for repurposing existing natural gas infrastructure and surveys operational boundaries of pressure (1 MPa to 10 MPa) and blend composition (5% to 15% vol H2). Furthermore, to capture the three-dimensional stress gradients and plastic dissipation in flaws, a Boundary Layer Model is employed. The remainder of this paper is organized as follows: Section 2 details the proposed methods, Section 3 presents the results, and Section 4 outlines the conclusions.

2. Materials and Methods

2.1. Phase Field Formulation for Fracture

Phase field fracture modeling relies on the thermodynamic principles established by Griffith [35], where crack growth initiates once the released elastic energy exceeds the material’s fracture toughness, G c . This concept was later translated into a variational framework by Francfort and Marigo [36]. Consequently, the phase field formulation dictates that cracks evolve to minimize the total energy functional, Π , that consists of the elastic strain energy stored in the bulk material, Ψ b , and the surface energy of the fracture, Ψ s :
Π l = Ψ b +   Ψ s = Ω ψ ε   d V + Γ G c   d Γ ,
where ψ ε is the elastic strain energy density, ε is the strain tensor, Ω is the domain, and Γ represents the discrete crack surface.
To account for elastoplasticity, the strain tensor, ε , is decomposed into its elastic and plastic components:
ϵ = 1 2 u + u = ε e + ε p .
where u is the displacement vector field and ε e and ε p are the elastic and plastic strain tensors, respectively.
Because tracking a discrete crack interface ( Γ ) is prohibitive, Bourdin et al. [37] introduced a regularized approximation to replace the sharp crack topology. This method employs a scalar damage variable, as a function of the diffusion direction (x) and time (t), ϕ x , t , that transitions smoothly from ϕ = 0 in the intact material to ϕ = 1 where the material is fractured [27,38,39]. Following the Ambrosio and Tortorelli (AT2) formulation [40], the internal energy is expressed as a combination of the degraded bulk strain energies and the smeared fracture surface energy. Based on the concept of Γ -convergence, the regularized functional, Π l , recovers the sharp crack potential energy, Π , as the internal regularization length scale approaches zero ( l 0 + ):
Π = Ω g ϕ ψ e ε e + h ϕ ψ p ε p + G c 1 2 l ϕ 2 + l 2 ϕ 2 d V ,
where l is the length scale parameter, g ϕ and h ϕ are the degradation functions associated with the elastic and plastic contributions respectively, and ψ e ε e and ψ p ε p represent the elastic and plastic strain energy densities.
Cracks do not propagate under pure compression. To account for this asymmetry, the hybrid phase-field approach introduced by Ambati et al. [41] is implemented. In this scheme, the elastic strain energy dictates the balance of linear momentum, thereby preserving the linearity of the mechanical equilibrium equations, while the tensile component of the strain energy is assumed to drive damage. One of the advantages of this method is that calculating the stress field does not require the decomposition of the strain tensor. Instead, the damage variable reduces the material stiffness through the elastic degradation function g ϕ = 1 ϕ 2 + k . This yields the following Cauchy stress tensor:
σ = g ϕ L 0 ε e = 1 ϕ 2 + k L 0 ε ε p ,
where L 0 is the undamaged linear elastic stiffness tensor and k is a small positive residual parameter introduced to prevent numerical singularities in the broken state ( ϕ = 1).
Even though the material’s stress tensor undergoes isotropic degradation, evaluating the crack driving force necessitates isolating the tensile portion of the undamaged elastic strain energy density, ψ e + . To achieve this, we apply the volumetric–deviatoric split introduced by Amor et al. [42], which separates the elastic strain energy into tensile and compressive components. The tensile energy, which is responsible for crack propagation, is expressed as:
ψ e + ε e = 1 2 tr ε e + 2 + µ ε D e : ε D e ,
where is the bulk modulus, µ is the shear modulus, and ε D e = ε e 1 3 tr ε e I is the deviatoric elastic strain tensor and I represents the identity tensor.
The compressive elastic strain energy density, ψ e , takes the following form:
ψ e ε e = 1 2 tr ε e 2
Following Díaz et al. [34], a fraction of the plastic work, β p , is assumed to be stored in the material and available to create new crack surfaces and the plastic degradation function h ϕ is defined as:
h ϕ = β p 1 ϕ 2 + 1 β p ,
The evolution of plasticity is governed by the von Mises yield criterion, where the undamaged flow stress, σ f 0 , is degraded by h ϕ :
F σ , ε ¯ p = σ h ϕ σ f 0 ε ¯ p 0
where F is the yield function, σ is the damaged equivalent von Mises stress, σ f 0 is the undamaged flow stress of the material, ε ¯ p is the equivalent plastic strain and the undamaged stress evolves as:
σ f 0 ε ¯ p = σ y 0 + H 0 ε ¯ p
where σ y 0 is the initial undamaged yield stress and H 0 is the isotropic hardening modulus.
Consequently, the undamaged plastic strain energy density is obtained by integrating the stress, yielding:
ψ p ε ¯ p = σ y 0 ε ¯ p + 1 2 H 0 ε ¯ p 2
Under quasi-static conditions and in the absence of body forces, minimizing the total energy functional with respect to the displacement field yields the form of mechanical equilibrium:
. σ = 0 ,
Subsequently, minimizing the functional with respect to ϕ leads to the governing evolution equation for damage:
G c l ϕ l 2 2 ϕ 2 1 ϕ H = 0
To ensure damage irreversibility, the history field H is introduced as:
H t = max τ 0 , t ψ e 0 + τ + β p ψ p 0 t
Evaluating the one-dimensional homogeneous response ( σ = h φ E ε ) reveals that the regularization length scale, l , functions as a material property governing the critical tensile strength, σ c   :
σ c = 27   E G c 256   l  
By defining the ultimate strength, the phase-field framework predicts spontaneous crack initiation and captures transition flaw-size effects [43].

2.2. Transport of Dilute and Trapping

The migration of hydrogen is driven by chemical potential gradients and hydrostatic stress. The hydrogen concentration, C , is expressed as the sum of lattice hydrogen, CL, occupying interstitial sites, and trapped hydrogen, C T :
C = C L + C T .
where C L is lattice hydrogen and C T is trapped hydrogen and the evolution of the hydrogen profile must satisfy the mass conservation law:
C t + · J = 0 .
where J represents the hydrogen flux vector.
Transport through the lattice is driven by Fickian diffusion coupled with stress-driven diffusion. Substituting the flux definition into the mass balance yields the governing transport equation:
C L t + C T t · D L C L + D L C L V ¯ H R g T σ h = 0 ,
where D L is the lattice diffusion coefficient for hydrogen, V ¯ H is the partial molar volume of hydrogen, R g is the gas constant, σ h is the hydrostatic stress, and T is the temperature.
The hydrostatic stress, σ h = t r ( σ ) / 3 , is derived from the damaged Cauchy stress tensor to capture the effect of the mechanical field on hydrogen accumulation. To resolve the exchange between the interstitial lattice sites and the traps, we adopt Oriani’s equilibrium formulation [44]. The evolution of the trapped concentration C T d is given by:
C T d t = K T d N T d / N L 1 + K T d 1 C L / N L 2 C L t + θ T d d N T d d ε ¯ p ε ¯ p t
where θ T d is the trap occupancy fraction, K T d is the equilibrium constant, E B is the binding energy, and N L represents the density of interstitial lattice sites.
The equilibrium constant K T d = exp E B / R g T characterizes the trapping affinity based on the binding energy. The generation of new trap sites is coupled to the evolving plastic strain field. The dislocation trap density, N T d , scales with the local dislocation density, ρ :
N T d = 2 ρ a
where a is the lattice parameter.
The strain-induced saturation model utilized in the formulation by Díaz et al. [34], originally proposed in [45], is:
ρ = ρ 0 + 2 γ min ε ¯ p , 0.5
where ρ 0 represents the initial dislocation density of the virgin material, and γ is the dislocation generation coefficient.
When methane is present, a modification of the boundary conditions has to be taken into account. The composition of the mixture is defined by the respective molar fractions, y H 2 and y C H 4 , which sum to unity ( y C H 4 = 1 y H 2 ). Reliance was placed on the fugacity ( f ) that is calculated using the Noble–Abel equation of state [46]; this relationship is expressed as:
f = P exp P b R T
where P is the pressure and b is the co-volume constant.
The partial fugacity of each component in the gas mixture is proportional to its mole fraction, yielding the effective external partial fugacity for hydrogen, f ^ H 2 = y H 2 f H 2 , and the partial pressure driving force for methane, f ^ C H 4 = y C H 4 f C H 4 . Assuming local thermodynamic equilibrium across the newly generated crack faces, the competitive adsorption onto the surface is described by a modified Langmuir isotherm. The resulting fractional surface coverage, θ H , is given by:
θ H = K H f ^ H 2 1 + K H f ^ H 2 + K C H 4 f ^ C H 4 ,
where K H and K C H 4 are the constants for hydrogen and methane on iron surfaces.
Finally, to couple the environmental exposure to the mechanical degradation of the material, the fracture toughness must be formulated as a function of the hydrogen surface coverage. The degraded critical fracture energy is expressed as:
G c θ H = G c 0 1 χ θ H ,
where G c 0 is the baseline fracture energy of the material in an inert environment, and χ is the hydrogen degradation coefficient.

2.3. Numerical Implementation

The finite element (FE) method is employed to solve the coupled mechanical-diffusion-phase field Equations (11), (12) and (16) within COMSOL Multiphysics version 6.2. The primary variables are the displacement field (u), the phase field ( ϕ ), and the lattice hydrogen concentration ( C L ). All simulations are discretized under the plane strain assumption. For damage evolution, the AT2 phase-field model is employed. The present numerical framework further develops the phase field fracture model recently presented by Díaz et al. [34]. First, to ensure damage irreversibility, a history variable ( H t ) is introduced. Second, to prevent damage under compression, the volumetric–deviatoric split approach proposed by Amor et al. [42] is employed, which decomposes the elastic strain energy density into tensile and compressive components. Finally, a penalty-based moving chemical boundary condition is implemented to capture hydrogen diffusion toward the newly created crack surfaces, allowing the diffusion–environment interface to evolve as dictated by the phase-field crack [47,48,49]. Stress-driven diffusion is incorporated using the damaged hydrostatic stress gradient ( σ h ), while hydrogen capture, at plastic strain-induced dislocations, is governed by an equilibrium reaction term. A monolithic method has been utilized to solve coupled equations. For time integration, an implicit backward differentiation formula (BDF) has been implemented to ensure numerical stability and Anderson acceleration is utilized to enhance the convergence efficiency of the sequential solver. The Jacobian matrix is calculated with a maximum limit of 1000 iterations. The convergence criterion is governed by a tolerance of R t o l = 10 3 , supplemented by tolerances ( 10 4 for the displacement u, history field H t , and concentration C L ; 10 5 for the phase-field ϕ ). The time stepping constrained by t m a x = 10 2 · t t o t a l .

3. Results

In this section, the predictive capabilities of the phase-field fracture model are demonstrated through a series of virtual experiments, ensuring that crack initiation and growth align with the fracture energy balance. First, in Section 3.1 (Elastic Regime), the benchmark problem of a square plate with a pre-defined defect under uniaxial tension is modeled, by validating this implementation against data obtained in the absence of hydrogen by Diaz et al. [34], and then extending this benchmark to various hydrogenous environments to illustrate hydrogen-accelerated crack growth. Subsequently, the framework is applied to a cylindrical dog-bone tensile specimen to investigate hydrogen–methane-assisted failure. Next, in Section 3.2 (Ductile Plastic Regime), a boundary layer formulation is employed to investigate the sensitivity of crack growth resistance curves (R-curves) to varying hydrogen content across three steel grades (X65, X70, and X80).
Table 1 summarizes the parameters employed across all simulations in this study.

3.1. Validation in the Elastic Regime

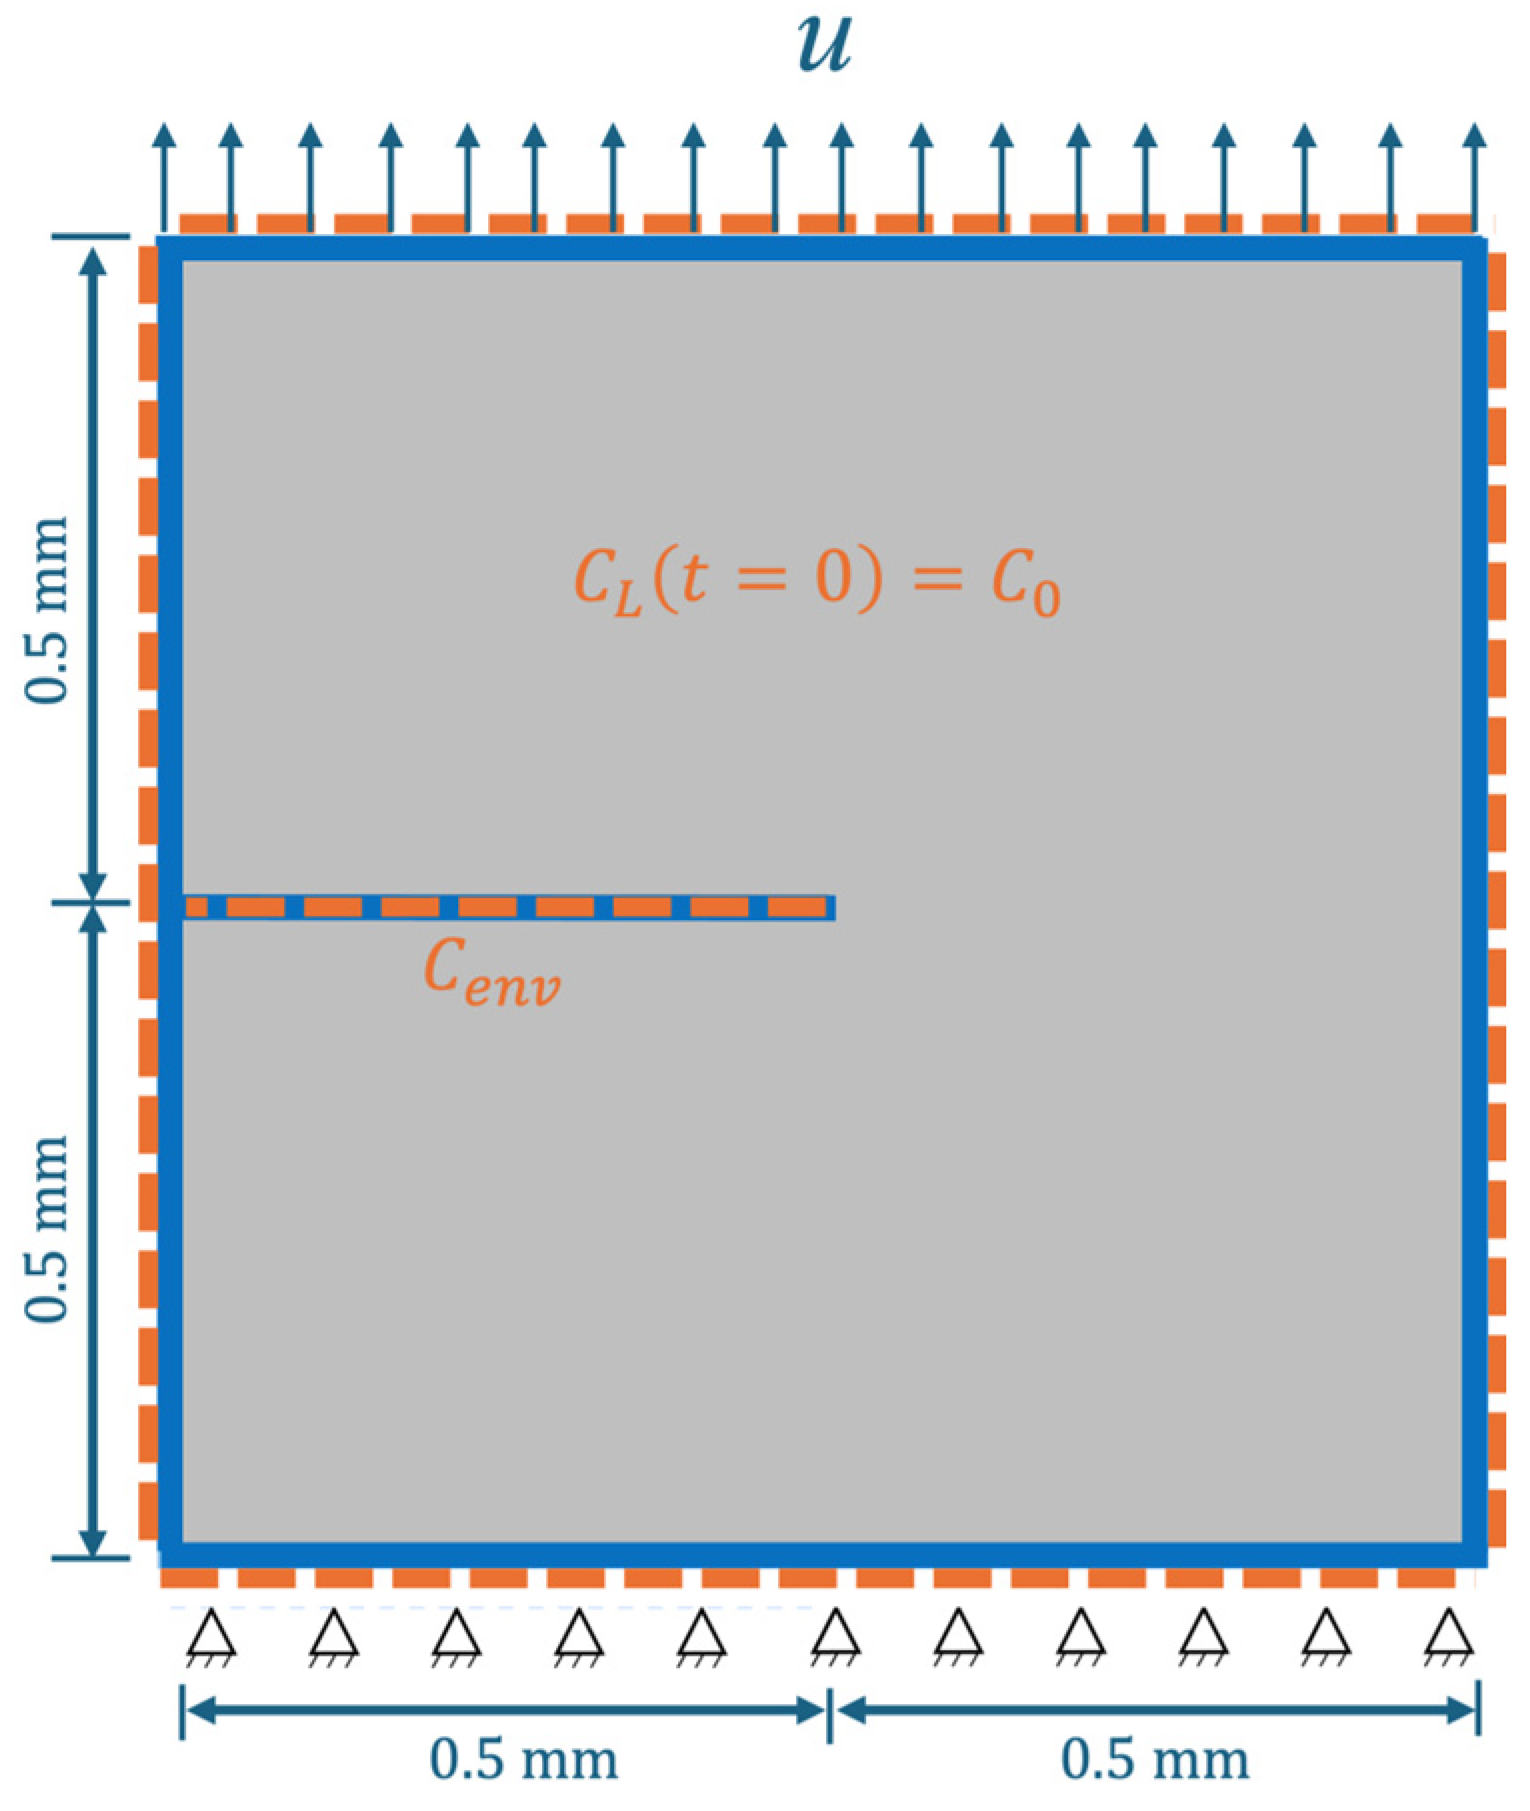
Initially, a single-edge notched specimen subjected to uniaxial tensile loading is considered. This configuration has become a paradigmatic benchmark in the phase-field fracture community [52,53,54,55] and acts as a validation problem for the present implementation. The dimensions of the 2D square plate specimen are height H = 1 mm and width W = 1 mm. The pre-crack extends horizontally from the left boundary to the center (a0 = 0.5 mm), yielding an initial crack-to-width ratio of a0/W = 0.5. This defect is implemented as a discrete slit, forming a sharp pre-crack with a tip radius of zero ( r t = 0). The motivation for utilizing a sharp pre-crack is to introduce a true stress singularity, ensuring that the subsequent crack propagation and the regularized crack surface energy are correctly governed by the length scale parameter . The specimen geometry, dimensions (in mm), and loading configuration are illustrated in Figure 1. The domain is discretized using approximately 21,000 quadrilateral elements, with a refined region near the crack tip, where the characteristic element size h is chosen to be at least five times smaller than the phase-field length scale , thereby ensuring mesh-independent and fully converged results [27,56]. The specimen is subjected to a prescribed displacement applied at the top edge. To ensure that hydrogen diffusion occurs within the quasi-steady state, the displacement is ramped at a rate of 10 10   m m / s up to a maximum displacement of U m a x = 0.007 mm over a total time of 7 × 10 7 s. A single-pass staggered scheme with a small-time step is utilized to accurately capture the material behavior in the fracture process zone. Accordingly, the maximum displacement step is limited to u ¯ = 10 3 mm, with the phase-field length scale defined as = 0.0075 mm and an initial yield stress of σ y 0 = E / 300 . To match the established literature [34,54], the fracture toughness is assigned a baseline, hydrogen-free critical strain energy release rate of G c 0 = 2.7   N / m m ; different values are investigated in subsequent sections.
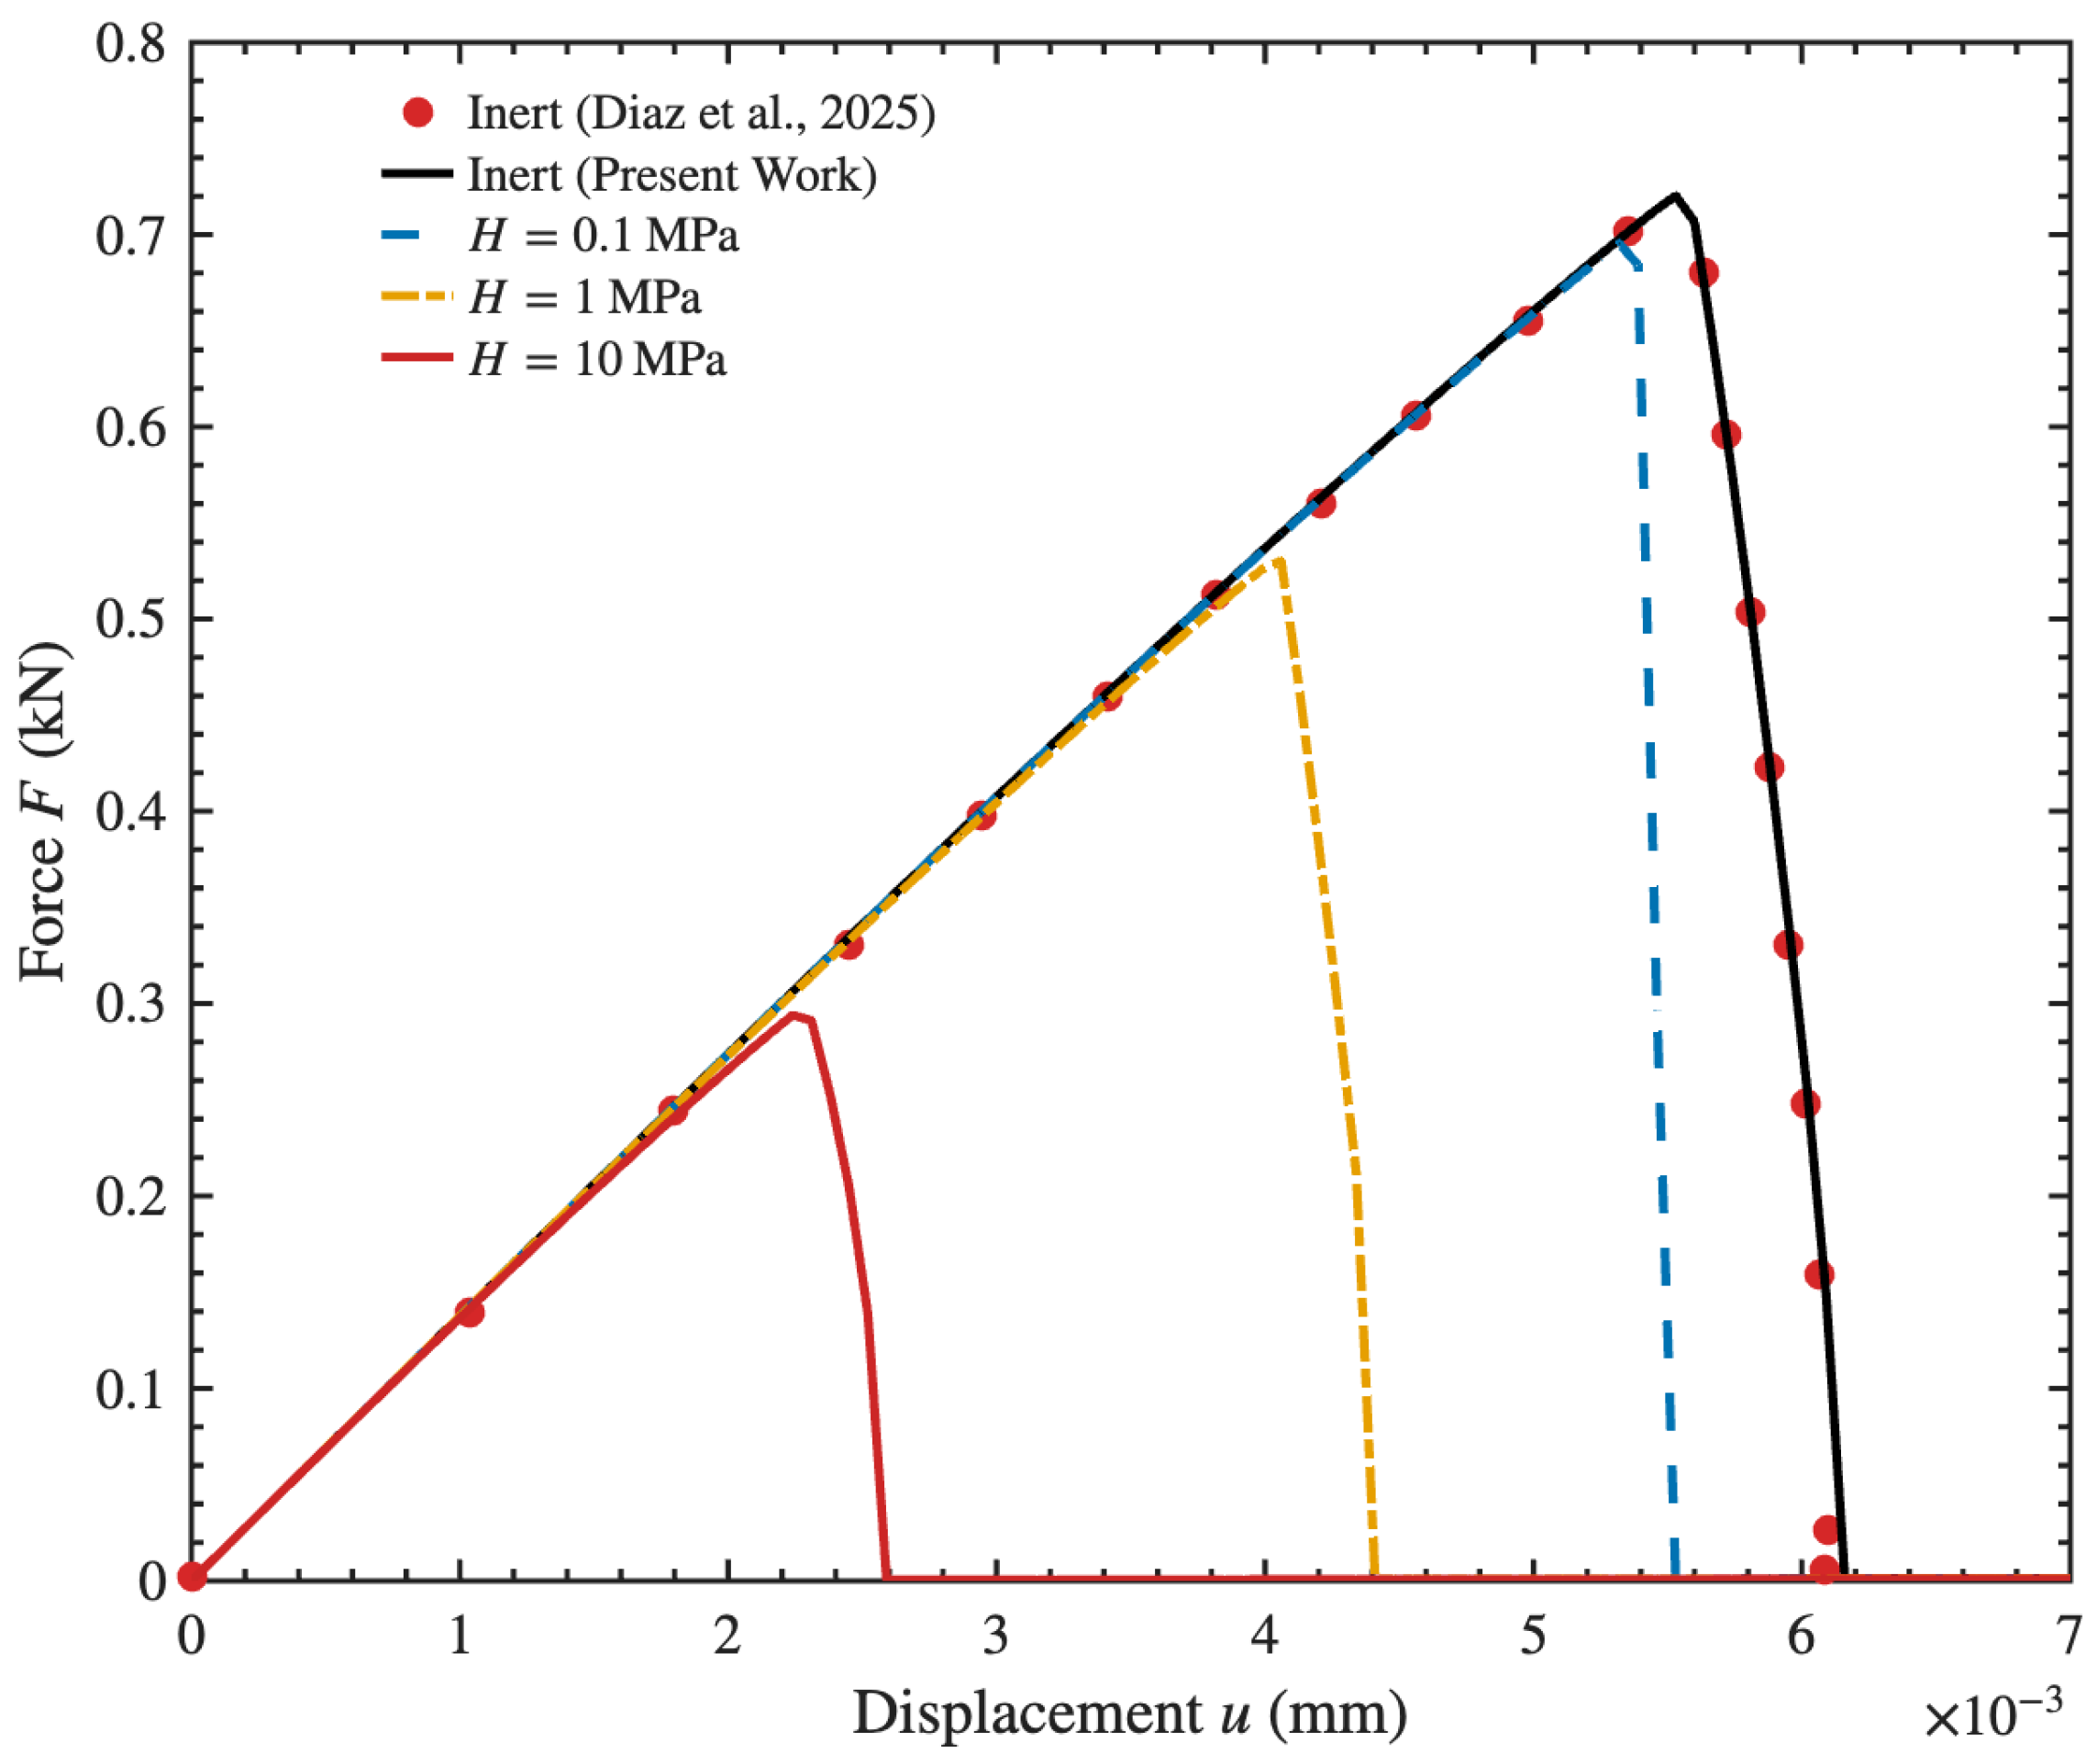
To assess the role of hydrogen, the model is first validated in the absence of hydrogen by comparing the predicted load–displacement response against the results reported in the literature. As shown in Figure 2, the computed results in the absence of hydrogen show a good agreement with the results reported by Diaz et al. [34], validating the model. Subsequently, the iron-based specimen is exposed to three distinct gaseous hydrogen environments with pressures ranging from 0.1 MPa to 10 MPa at room temperature, as shown in Figure 2. According to Sievert’s law, the environmental hydrogen concentration ( C e n v ) can be determined through C e n v = S f ^ H 2 , where S denotes the material solubility and ( f ^ H 2 ) is the hydrogen fugacity. It is assumed that the specimen has been pre-charged before being subjected to a mechanical load. Therefore, a uniform initial hydrogen concentration is defined across the domain C t = 0 =   C 0 =   C e n v , and a constant Dirichlet boundary condition C t =   C e n v is prescribed at all outer boundaries and crack faces. As the crack grows, a penalty boundary condition illustrates how the environmental hydrogen content quickly fills newly cracked surfaces C L = C e n v , thereby updating the environmental boundary conditions. Figure 2 presents the force–displacement responses obtained for various hydrogen pressures, alongside the ambient condition. The predicted results demonstrate a sensitivity to the hydrogen environment, with increasing hydrogen pressure leading to a reduction in load-bearing capacity and earlier failure due to the hydrogen embrittlement phenomenon.
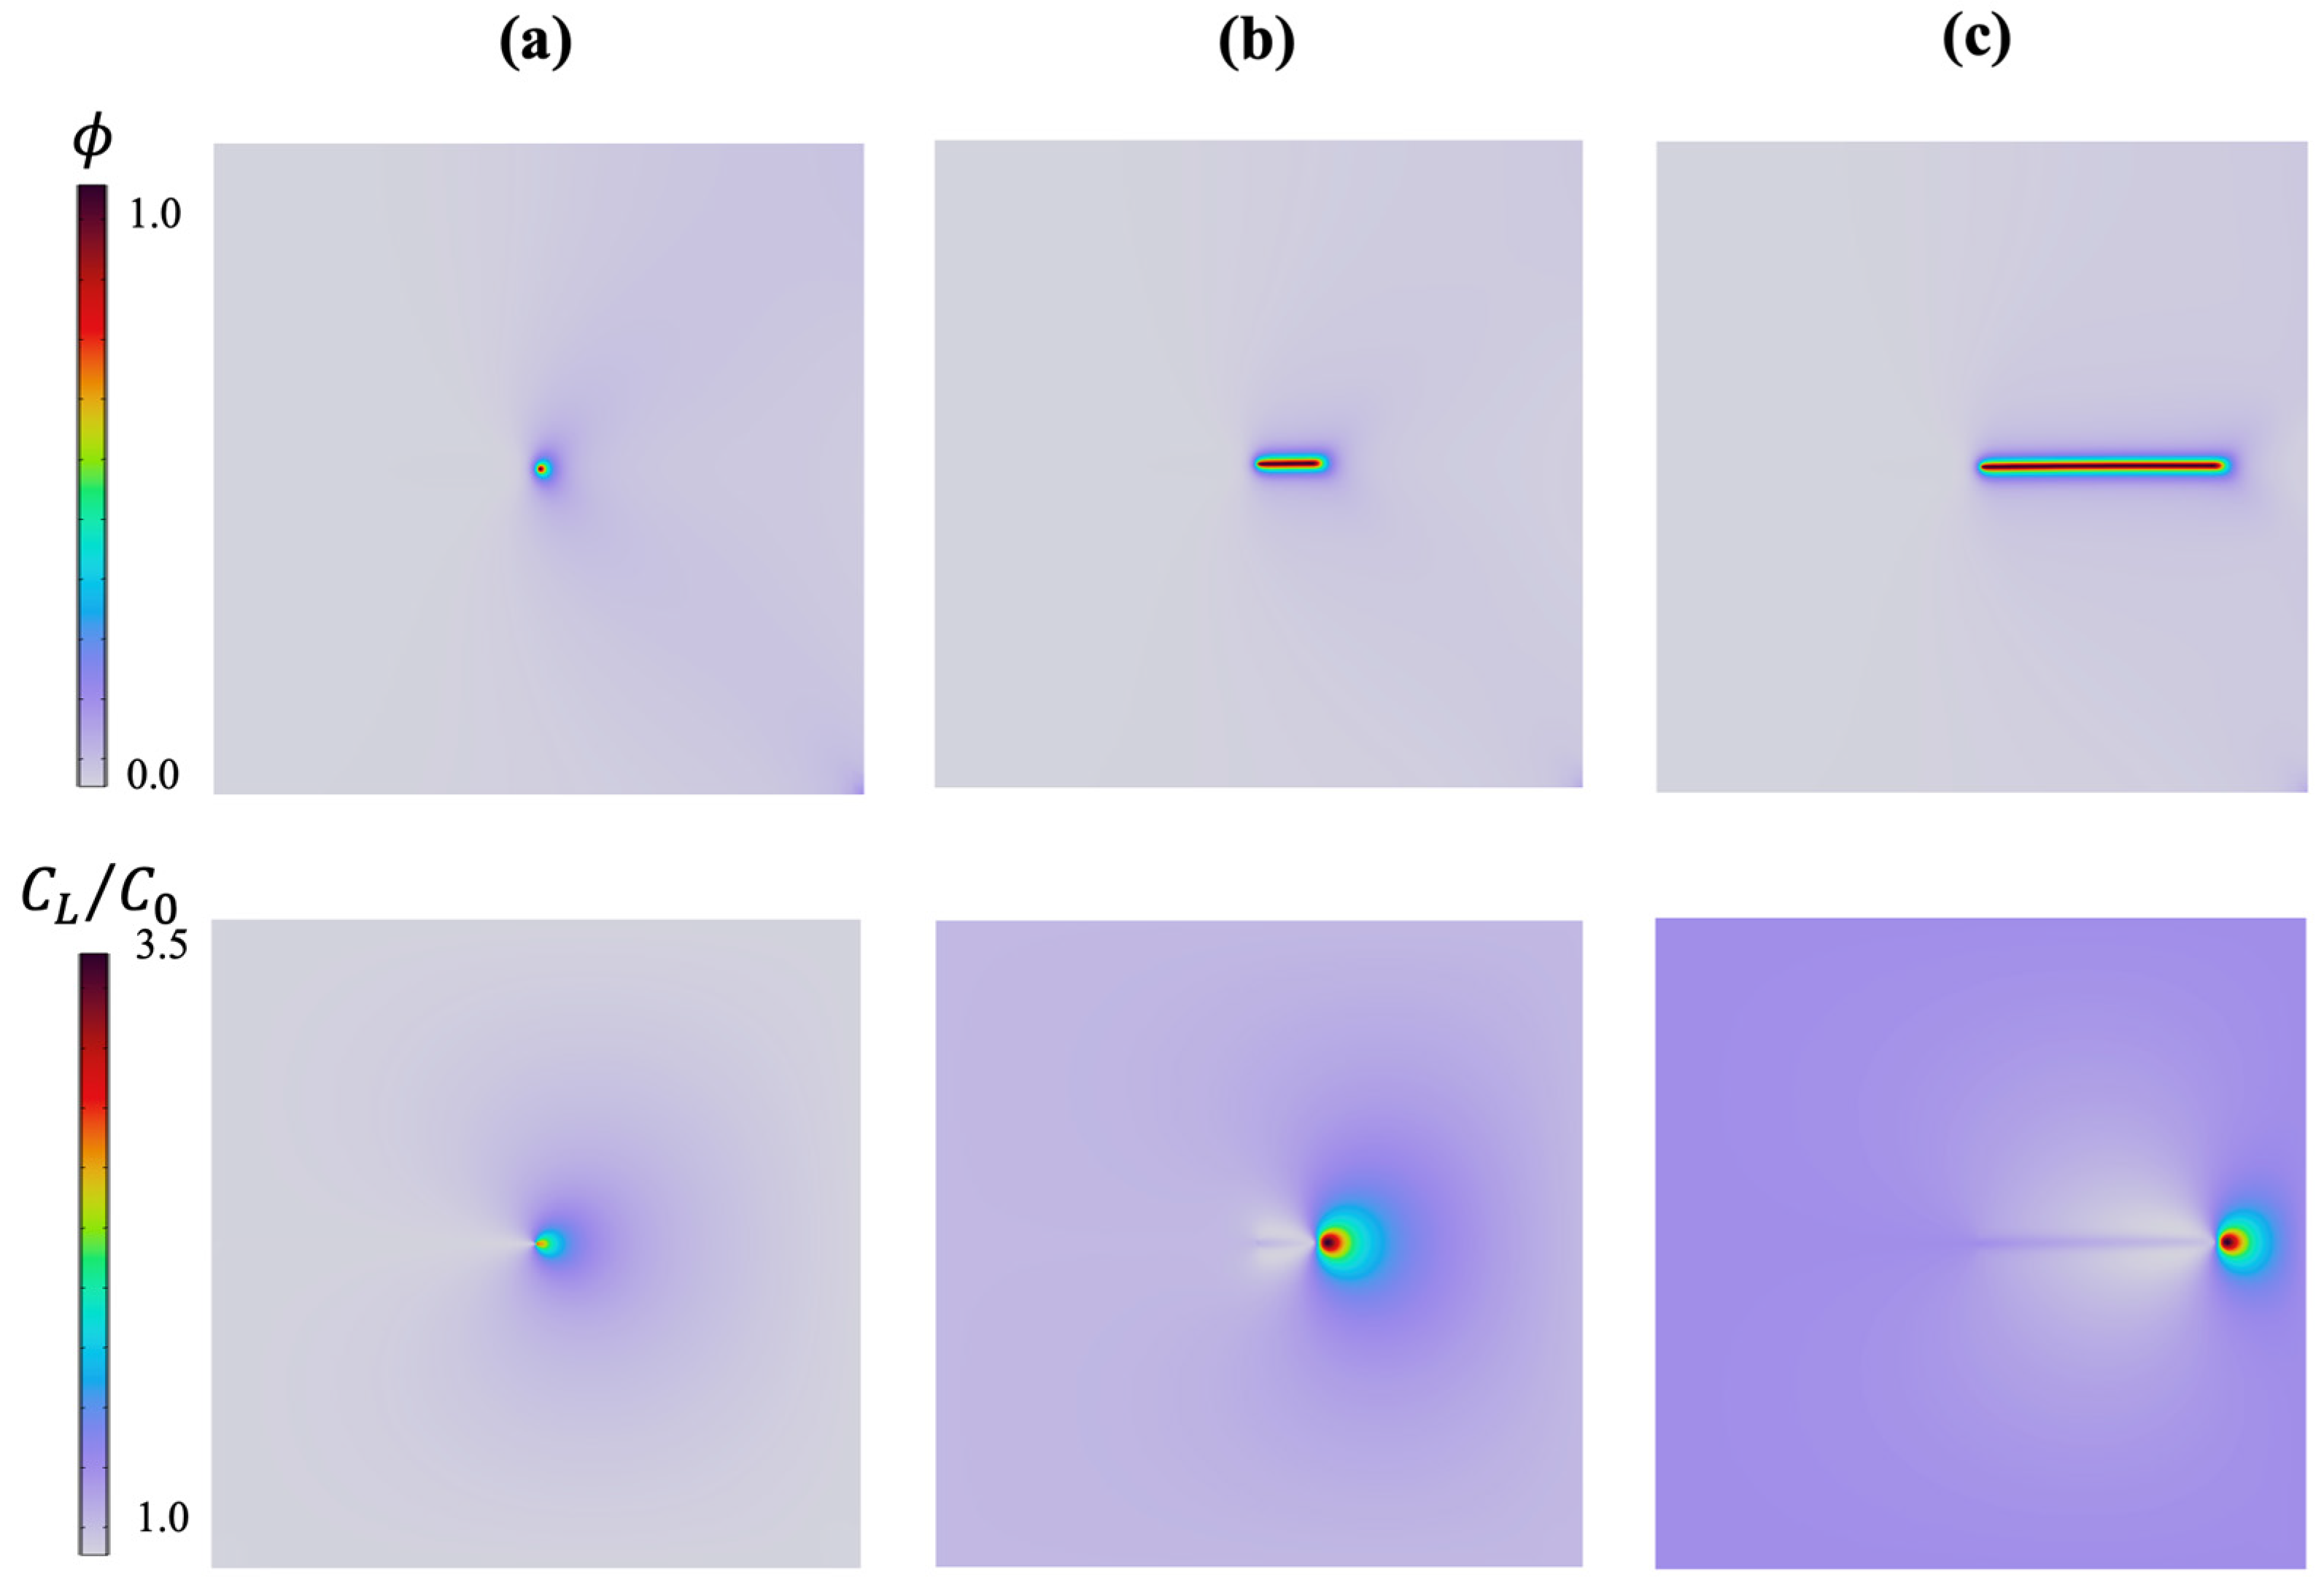
To enforce chemical boundary conditions that evolve with the propagating crack, a penalty method is employed, capturing the prompt exposure of newly created fracture surfaces to the environment. This coupled behavior is illustrated in Figure 3, which shows how phase-field contours track the crack propagation, characterized by a smooth transition from intact material ( ϕ = 0 ) to a fully broken state ( ϕ = 1 ) across a diffuse boundary and the normalized hydrogen concentration ( C L / C 0 ) at progressive displacement levels for the elastic SENT specimen exposed to 10 MPa (10% H2-90% CH4) blend. As the crack grows, the penalty formulation ensures that the hydrogen concentration within the fully damaged regions ( ϕ = 1 ) equals the environmental concentration. At the peak load in Figure 3a, u = 0.00413 mm, crack initiation begins. As the force and elastic stresses increase, atomic hydrogen accumulates in the vicinity of the tip. During crack propagation, in Figure 3b, at u = 0.00427 mm, a distinct fracture path forms. Because the diffusion model is coupled to the mechanical deformation, the region of maximum hydrogen accumulation moves forward. Finally, Figure 3c at u = 0.00448 mm, the specimen breaks. The concentration contours, illustrating the distribution of hydrogen during crack growth, highlight hydrogen accumulation in regions of high hydrostatic stress immediately ahead of the moving crack tip. Ultimately, these findings confirm how hydrogen diffusion is governed by the evolving phase-field damage.
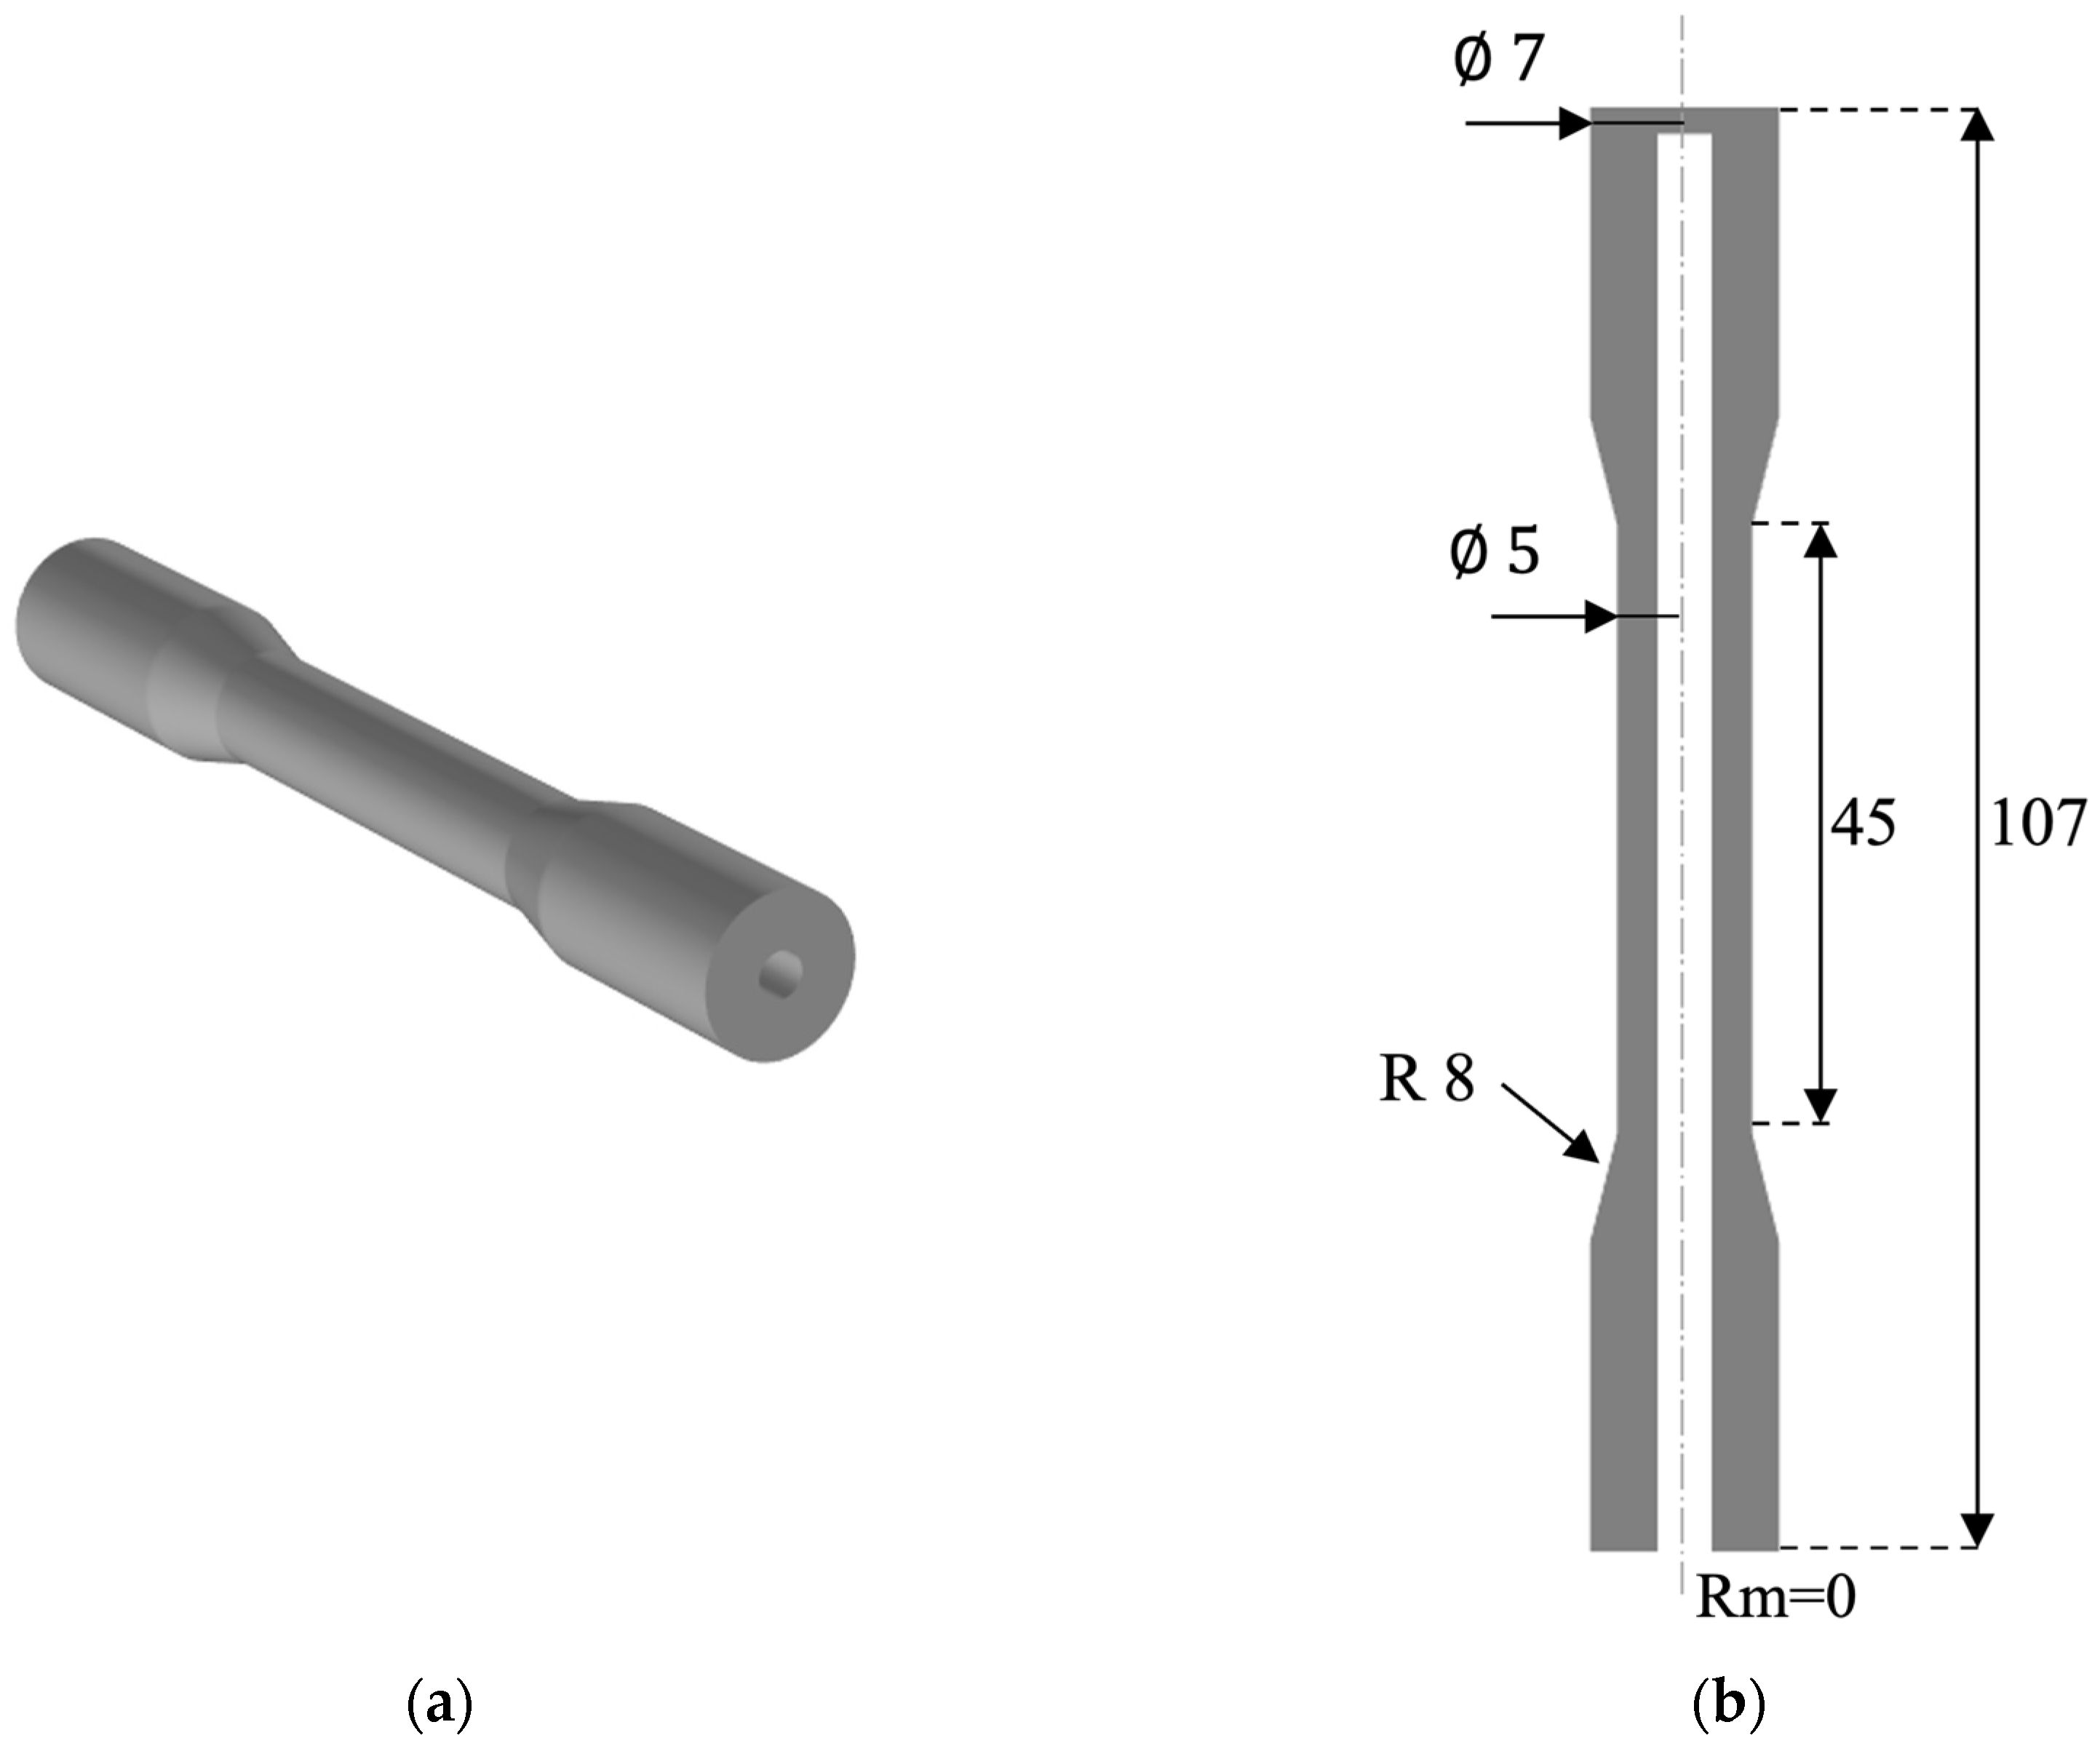
To investigate the material behavior in various hydrogen–methane blends, a pre-cracked cylindrical tensile specimen is modeled using a 2D axisymmetric domain. As illustrated in Figure 4, the section has an outer radius of R = 5 mm and a height of H = 45 mm. A sharp circumferential pre-crack (a0 = 0.5 mm) is introduced at the outer surface, establishing a shallow defect ratio of a0/R = 0.1 to calculate defect tolerance. The mesh comprises approximately 14,268 quadrilateral elements with refinement along the crack path. The model utilizes rotational symmetry, where an axial symmetry constraint enforcing zero radial displacement ( u r = 0 ) is applied at the symmetry axis (r = 0). The specimen is pre-charged and then subjected to uniaxial tension with a slow displacement rate of u ˙ = 10 6 mm/s. The remote displacement follows a linear ramp, u z = U m a x t / t t o t a l , reaching a maximum displacement of U m a x = 0.8 mm over a total simulation time of 8 × 10 5   s . The material properties include a critical fracture energy of G c 0 = 25   N / m m , phase-field length scale of l = 0.2 mm, and an initial yield stress of σ y 0 = 450 MPa. A Dirichlet boundary condition ( C L = C e n v ) is applied along the external surface ( r = R ). The results reveal that an increasing hydrogen fraction diminishes the competitive surface adsorption of methane, thereby promoting hydrogen diffusion and degrading the material’s load-bearing capacity, which leads to a reduction in the peak load.
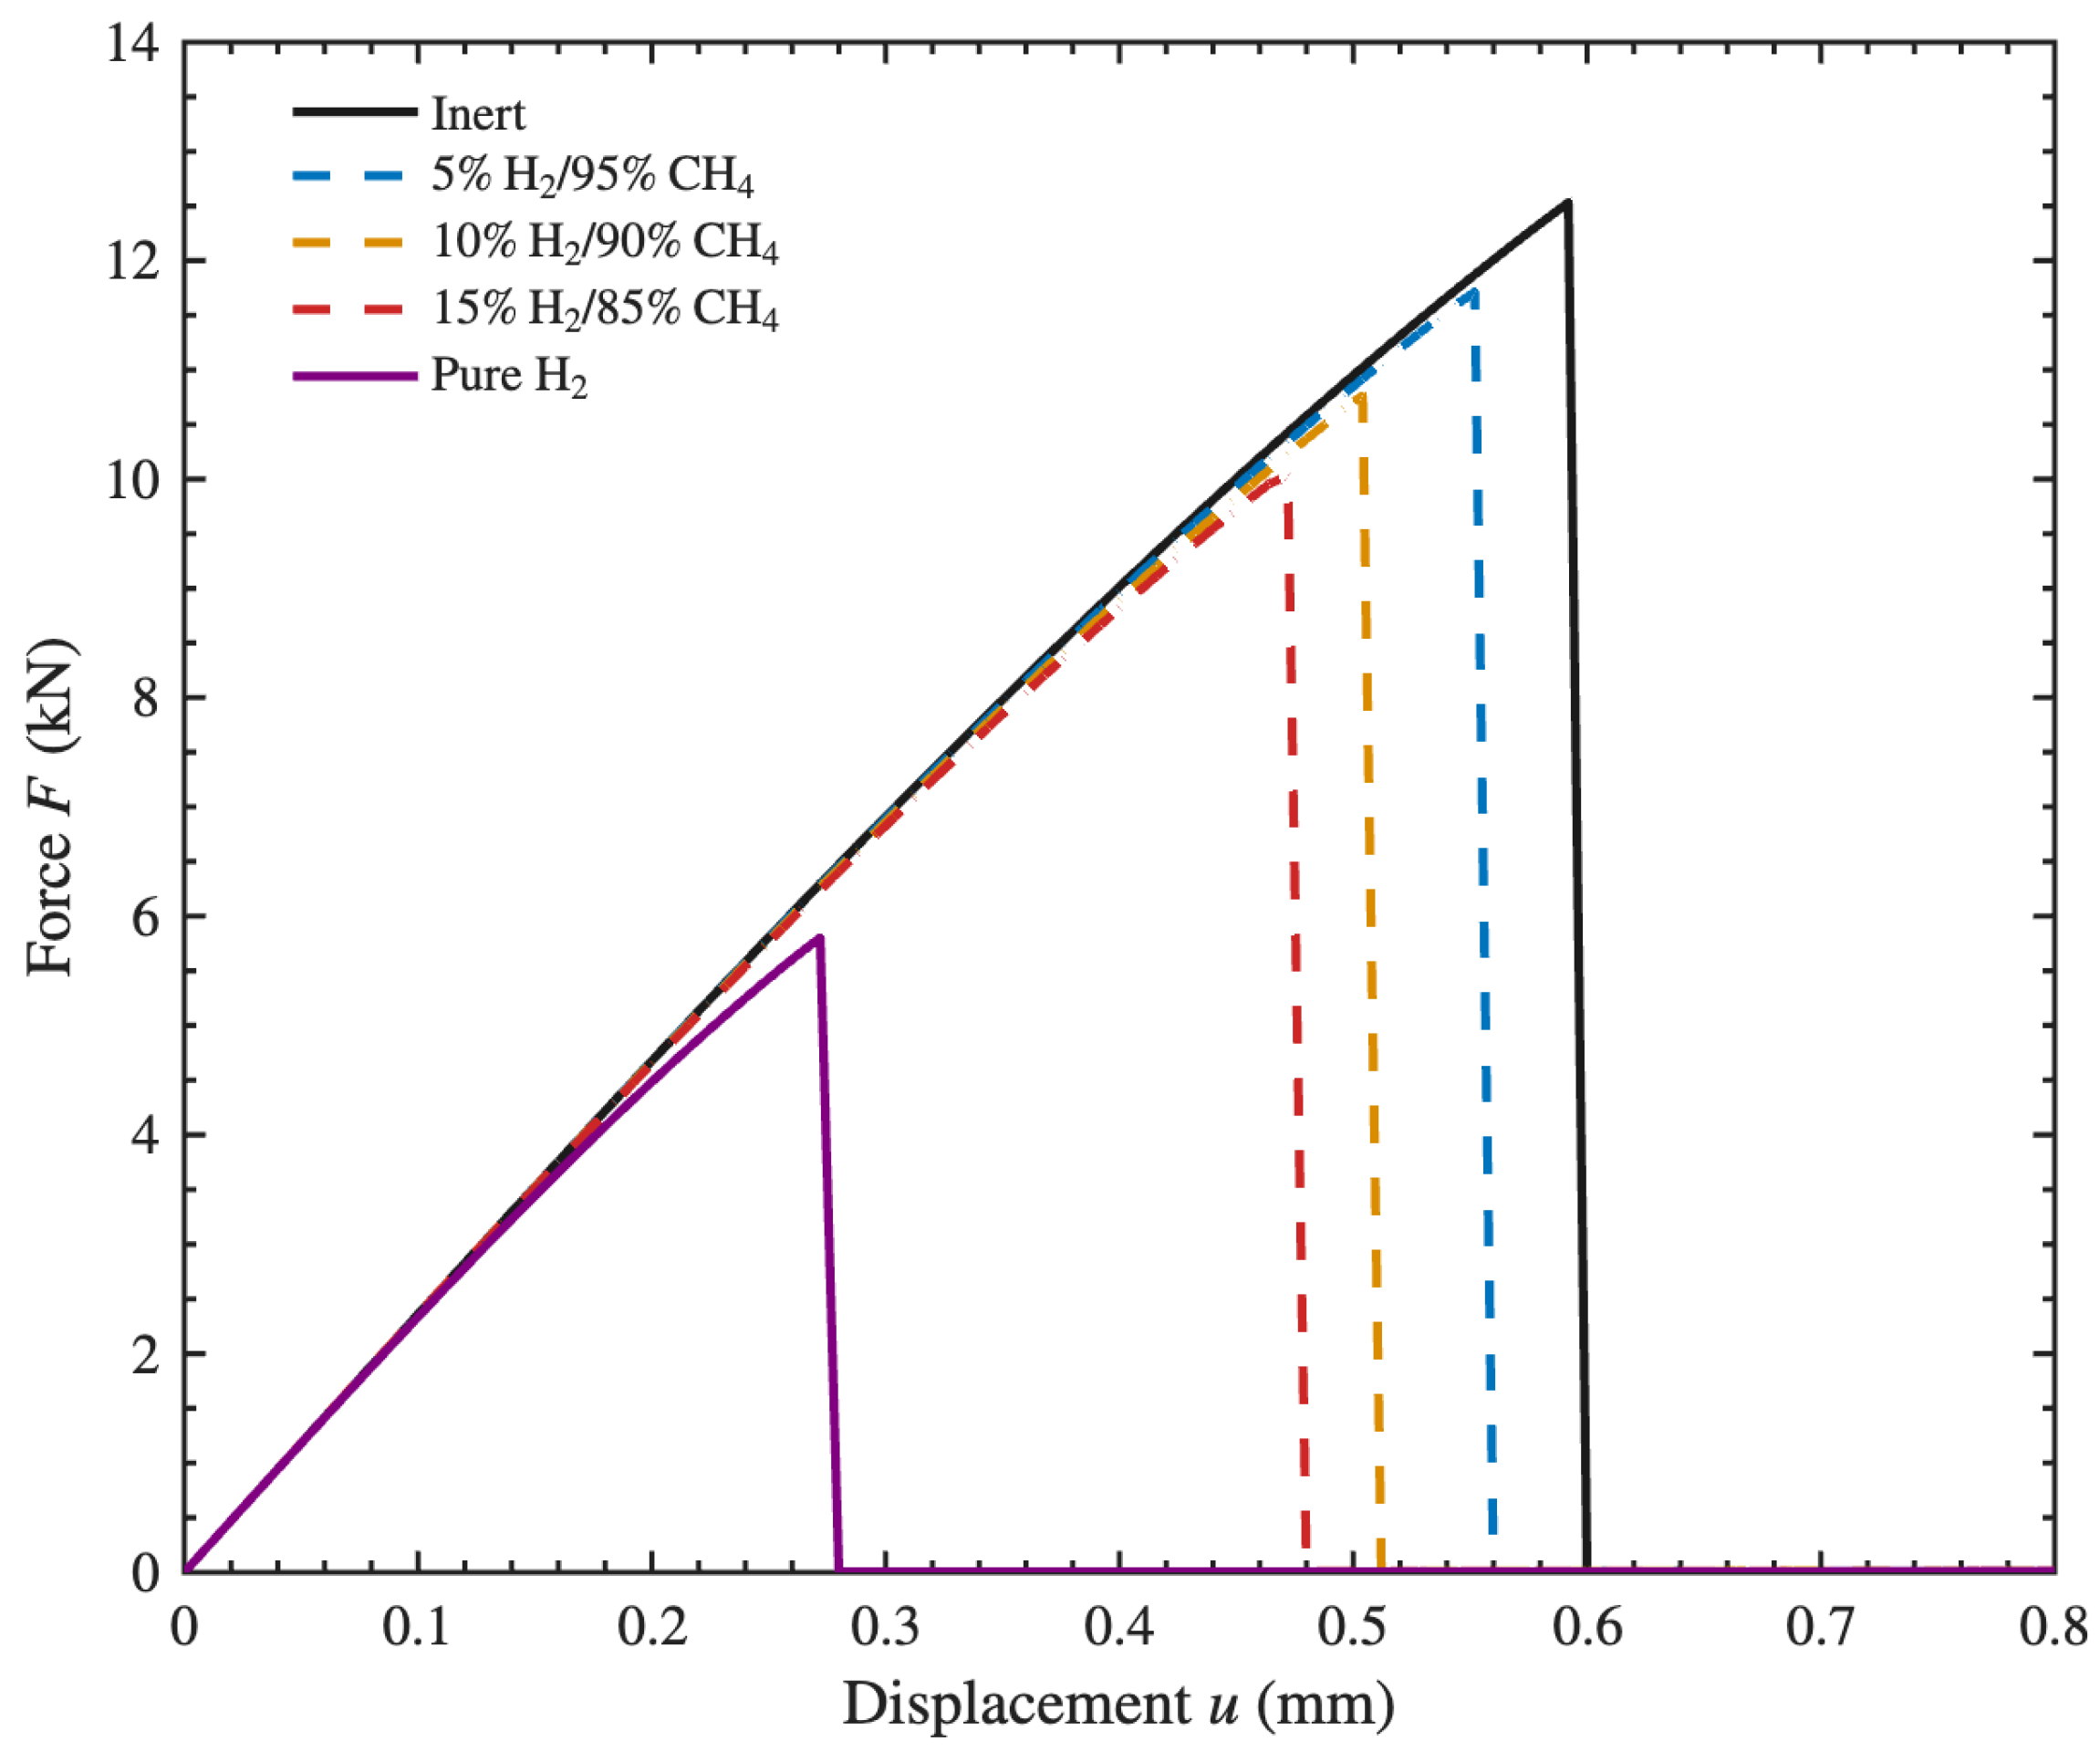
Next, the influence of hydrogen–methane blending ratios on the mechanical response of the cylindrical tensile specimen was evaluated at a constant total pressure of P = 7.5 MPa. Figure 5 compares the load–displacement curves under three distinct hydrogen fractions (5%, 10%, 15%) along with a pure H 2 environment against the inert environment. The numerical results demonstrate that the onset of failure is influenced by the gas composition. As the H 2 fraction increases within the range of 5–15%, the peak load and the displacement at failure decrease. This occurs because, under constant total pressure, an increasing hydrogen fraction enhances its partial pressure, which leads to a diminution of the competitive surface adsorption ‘site-blocking’ effect of methane, therefore enhancing hydrogen embrittlement. Notably, exposure to pure H 2 induces a premature failure, dropping the peak load by more than 50% against the inert environment.
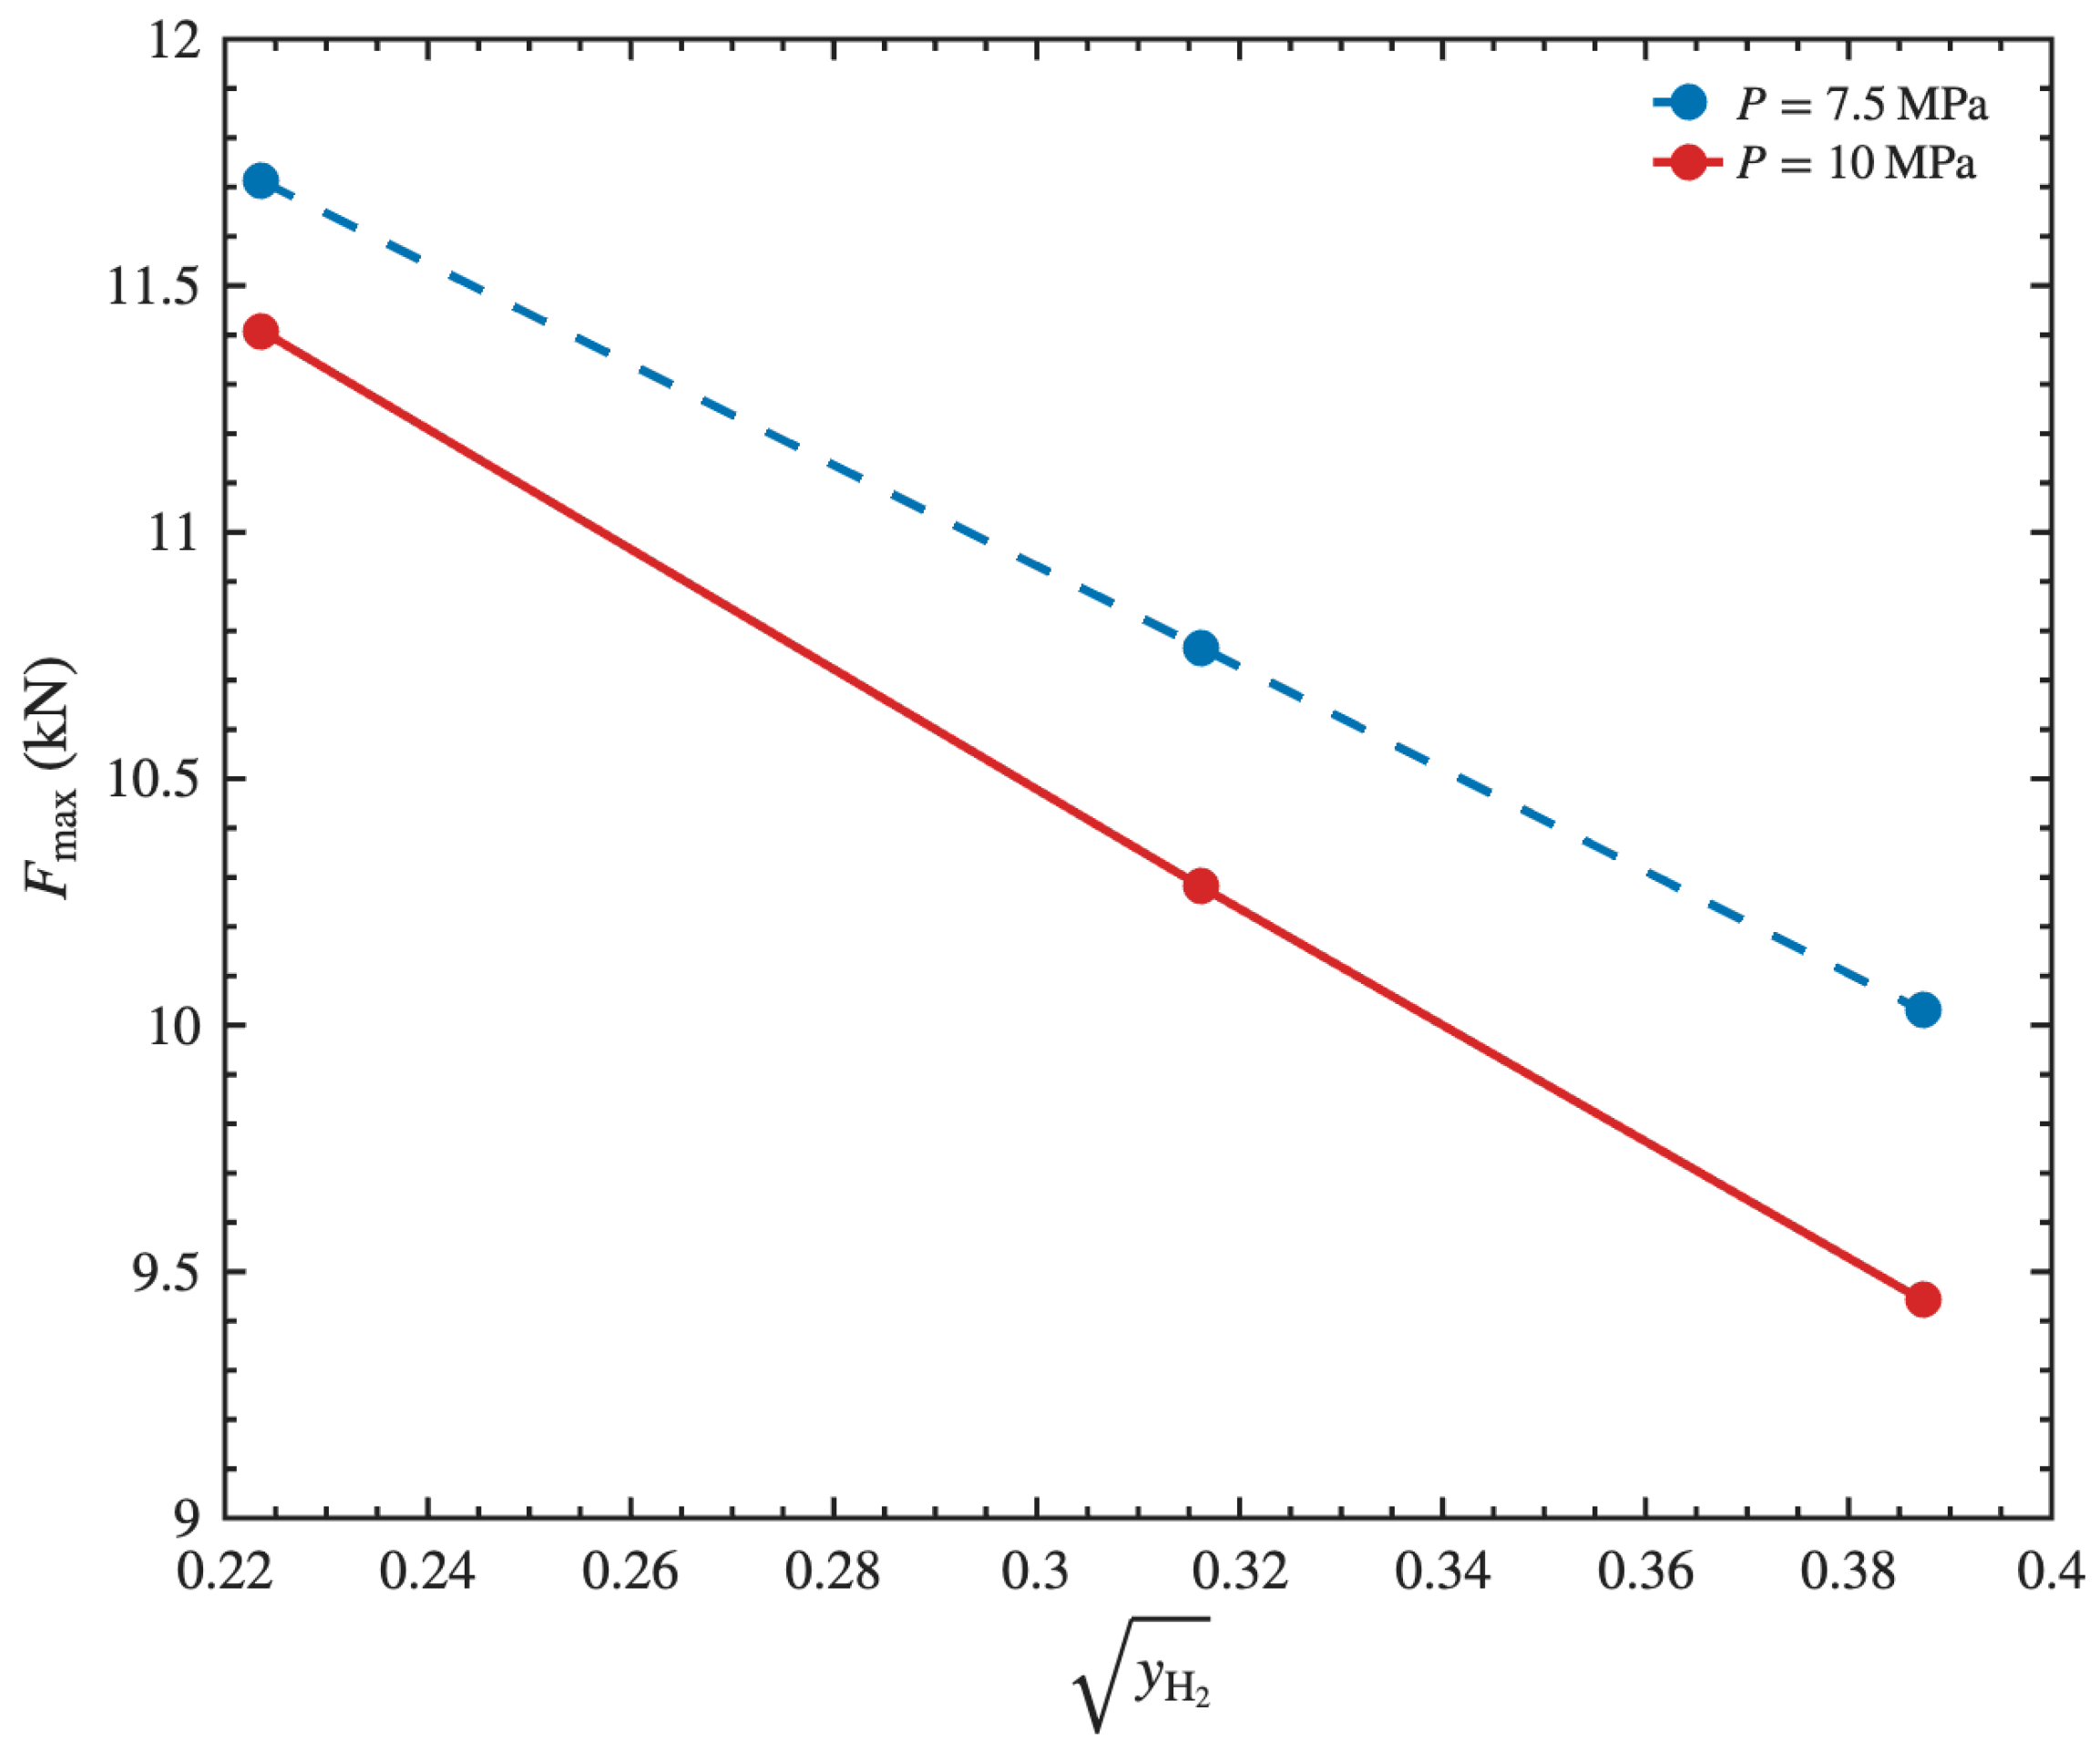
To measure the severity of hydrogen embrittlement, the peak load ( F m a x ) of the cylindrical tensile specimen was evaluated for the gas mixtures at both 7.5 MPa and 10 MPa. Figure 6 presents the variation in F m a x as a function of the square root of the hydrogen volume fraction ( y H 2 ). At a pressure of 7.5 MPa, increasing the hydrogen blend from 5% to 15% reduces the peak load from 11.71 kN to 10.03 kN, a 14.3% loss in load-bearing capacity. This degradation is even more pronounced at a pressure of 10 MPa, where the increase in hydrogen fraction suppresses F m a x from 11.41 kN to 9.44 kN (17.3% reduction). Notably, plotting the failure load against y H 2 reveals a relationship governed by Equation (22). The fractional surface coverage ( θ H ) scales with the hydrogen fugacity ( f ^ H 2 ), which directly maps to y H 2 . This accumulation of hydrogen degrades the critical fracture energy ( G c ) of the material. This reduced fracture energy lowers the mechanical energy required to initiate and propagate damage, thereby explaining the observed reduction in the load-bearing capacity.

3.2. Elastoplastic Fracture in Boundary Layer Models

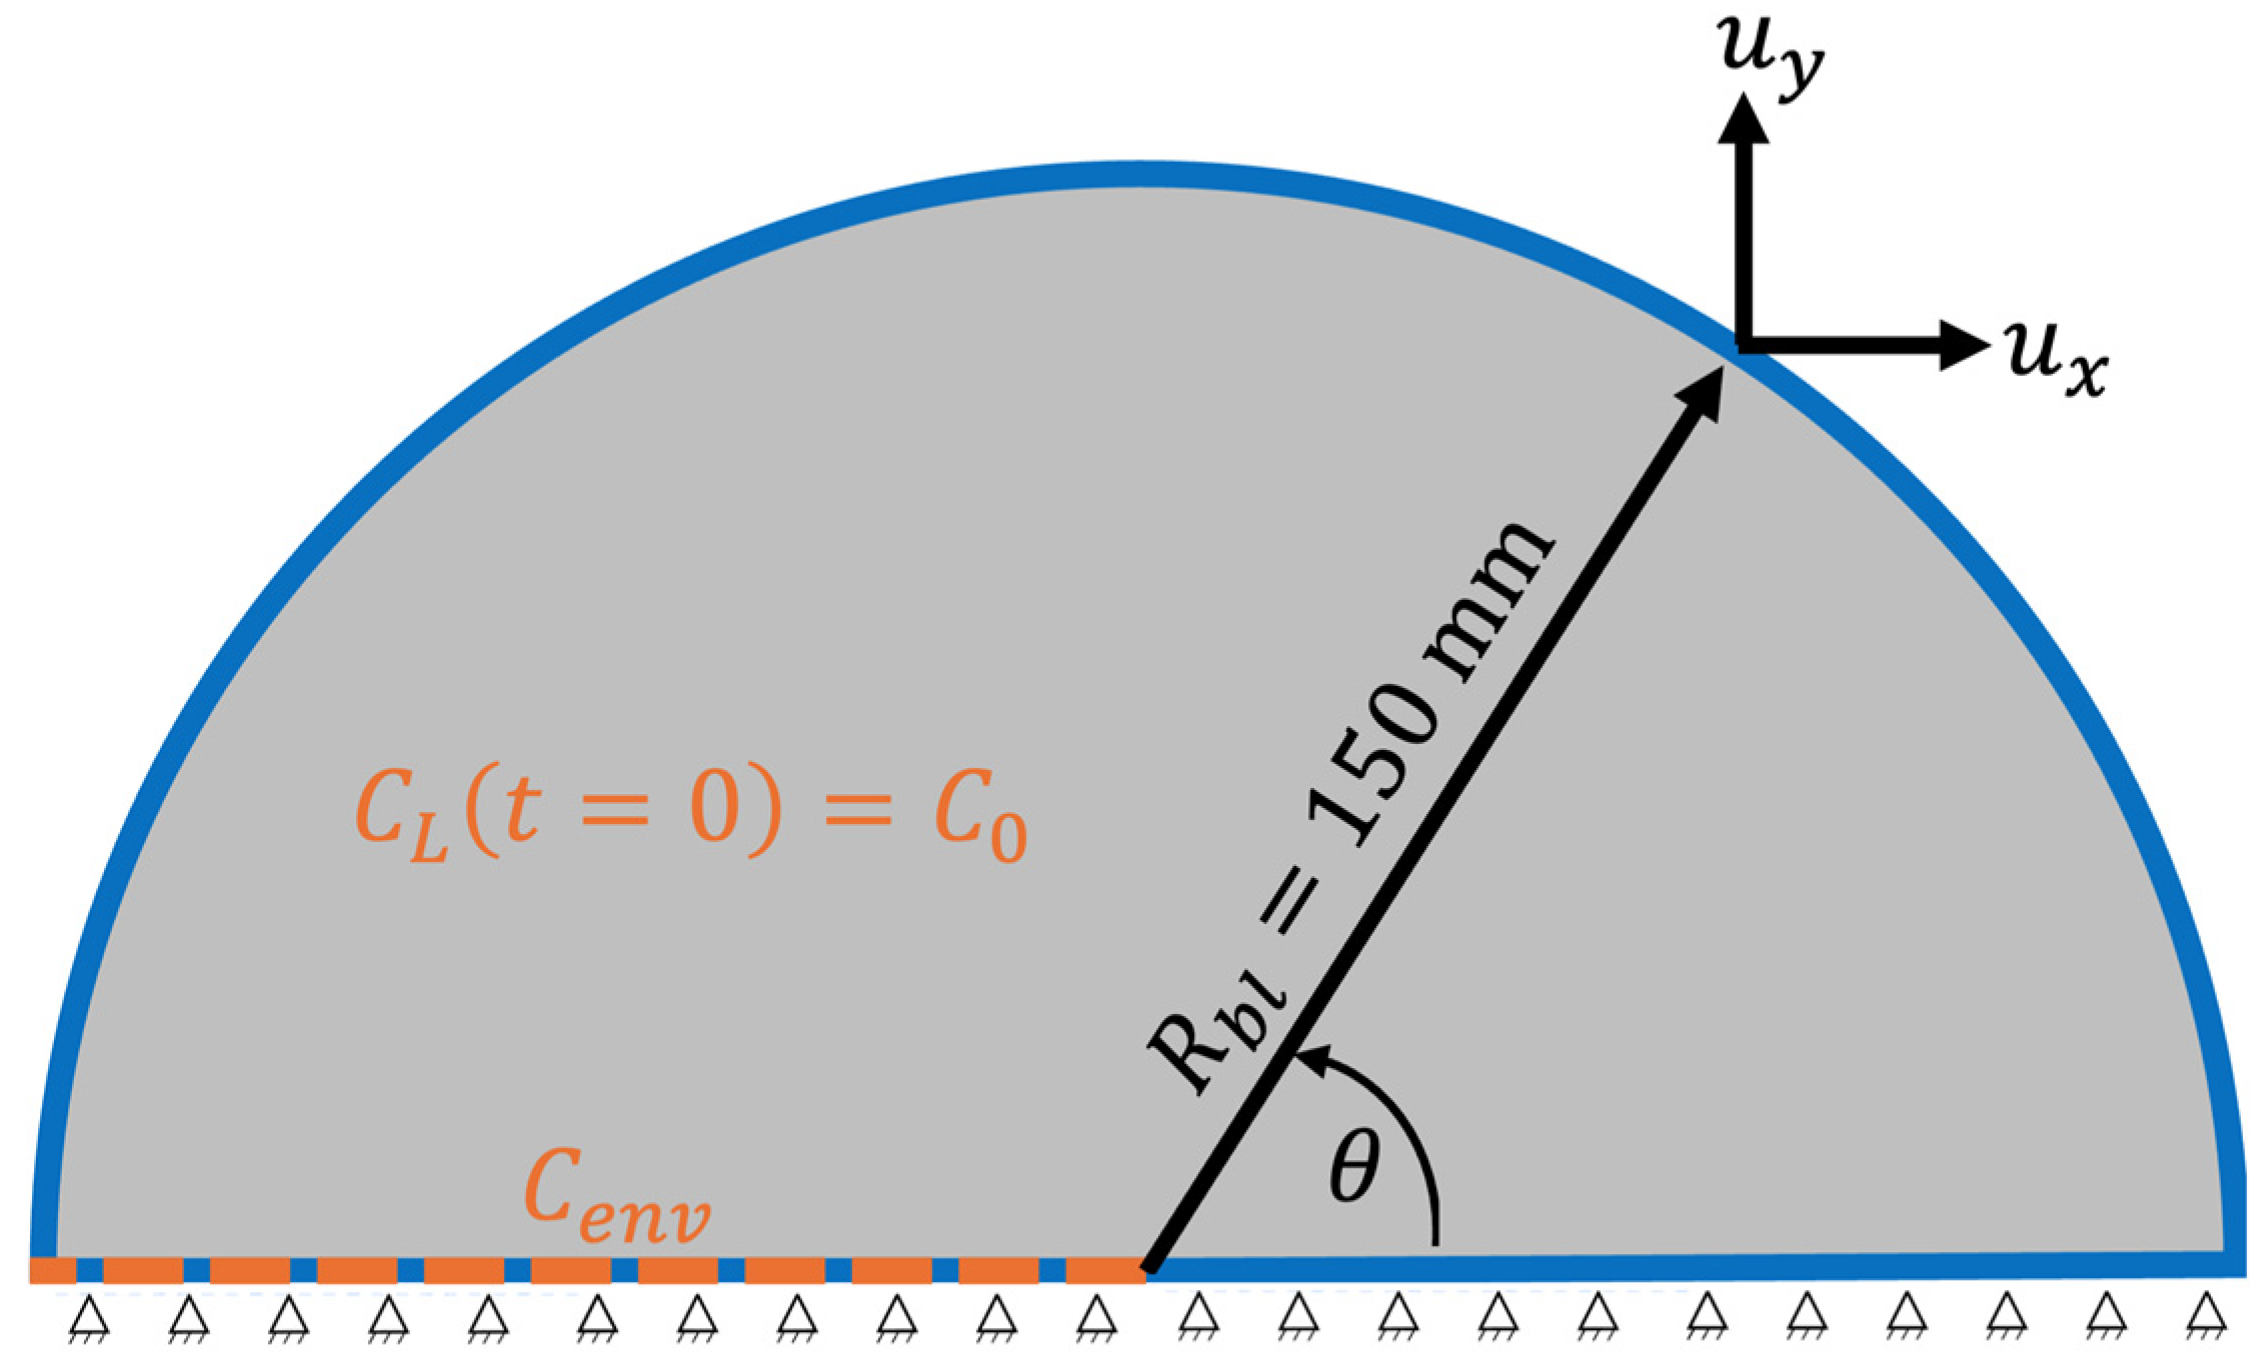
Next, to investigate the interaction between plastic deformation, fracture evolution, and hydrogen diffusion and trapping under small-scale yielding conditions, virtual fracture experiments are performed using a boundary layer formulation. A remote stress intensity factor K I is applied through prescribed boundary displacements. Taking advantage of symmetry, only the upper half of the sample is modeled. Loading conditions and sample dimensions (in mm) are illustrated in Figure 7. The remote K I field is imposed by prescribing the nodal displacements along the outer boundary according to the Williams [57] expansion at a constant stress intensity factor rate of K I ˙ = 10 3   M P a m / s . Accordingly, in a polar coordinate system (r, θ), centered at the crack tip, the horizontal ( u x ) and vertical ( u y ) displacement components are given by:
u x R b l , θ = K I 1 + ν E 0 R b 2 π cos θ 2 2 4 ν + 2 sin 2 θ 2
u y R b l , θ = K I 1 + ν E 0 R b 2 π cos θ 2 4 4 ν + 2 cos 2 θ 2
where K I is the mode I stress intensity factor characterizing the crack tip stress state and R b l is the radius of the remote boundary layer.
Following the established literature, the outer boundary radius is set to R b l = 0.15 m [34,58,59] and l = 0.05 mm. The model is discretized using 14,365 elements, with a refined mesh along the fracture process zone. To ensure mesh-independent results, the characteristic element size is taken to be at least 5 times smaller than the phase field length scale l [27,56]. Crack growth resistance R-curves are obtained in the boundary layer model by recording the applied stress intensity factor K I as a function of crack extension a . A reference stress intensity factor K c 0 and a reference fracture process zone length R 0 have been established, as defined in [60]:
K c 0 = E 0 G c 0 1 ν 2               a n d               R 0 = 1 3 π 1 ν 2 E G c 0 σ y 0 2
where the applied stress intensity factor K I is normalized by K c 0 .
While the elastic properties (Young’s modulus and Poisson’s ratio) and thermodynamic constants established in Table 1 remain unchanged, Table 2 details the specific elastoplastic properties and hydrogen trapping parameters. It should be noted that the initial trapping parameters ( N T 1 , N T 2 , E b 1 , E b 2 ) are held invariant. This is a deliberate choice under small-scale yielding (SSY) conditions to isolate the role of elastoplastic properties ( σ y 0 and H 0 ). Because dislocation trapping evolves with plastic deformation, varying initial trap densities with yield strength and strain hardening would conflate the interactions between trapping and stress gradients. In addition, as demonstrated in parametric sensitivity evaluations by Díaz et al. [34], the influence of χ (e.g., 0.3 or 0.6) linearly reduces the sensitivity of the critical fracture energy ( G c ) to hydrogen accumulation, yielding elevated R-curves. While varying χ scales the vertical magnitude of crack growth resistance, it does not alter the relative efficiency of the methane, nor the yield-stress-amplified hydrostatic stress.
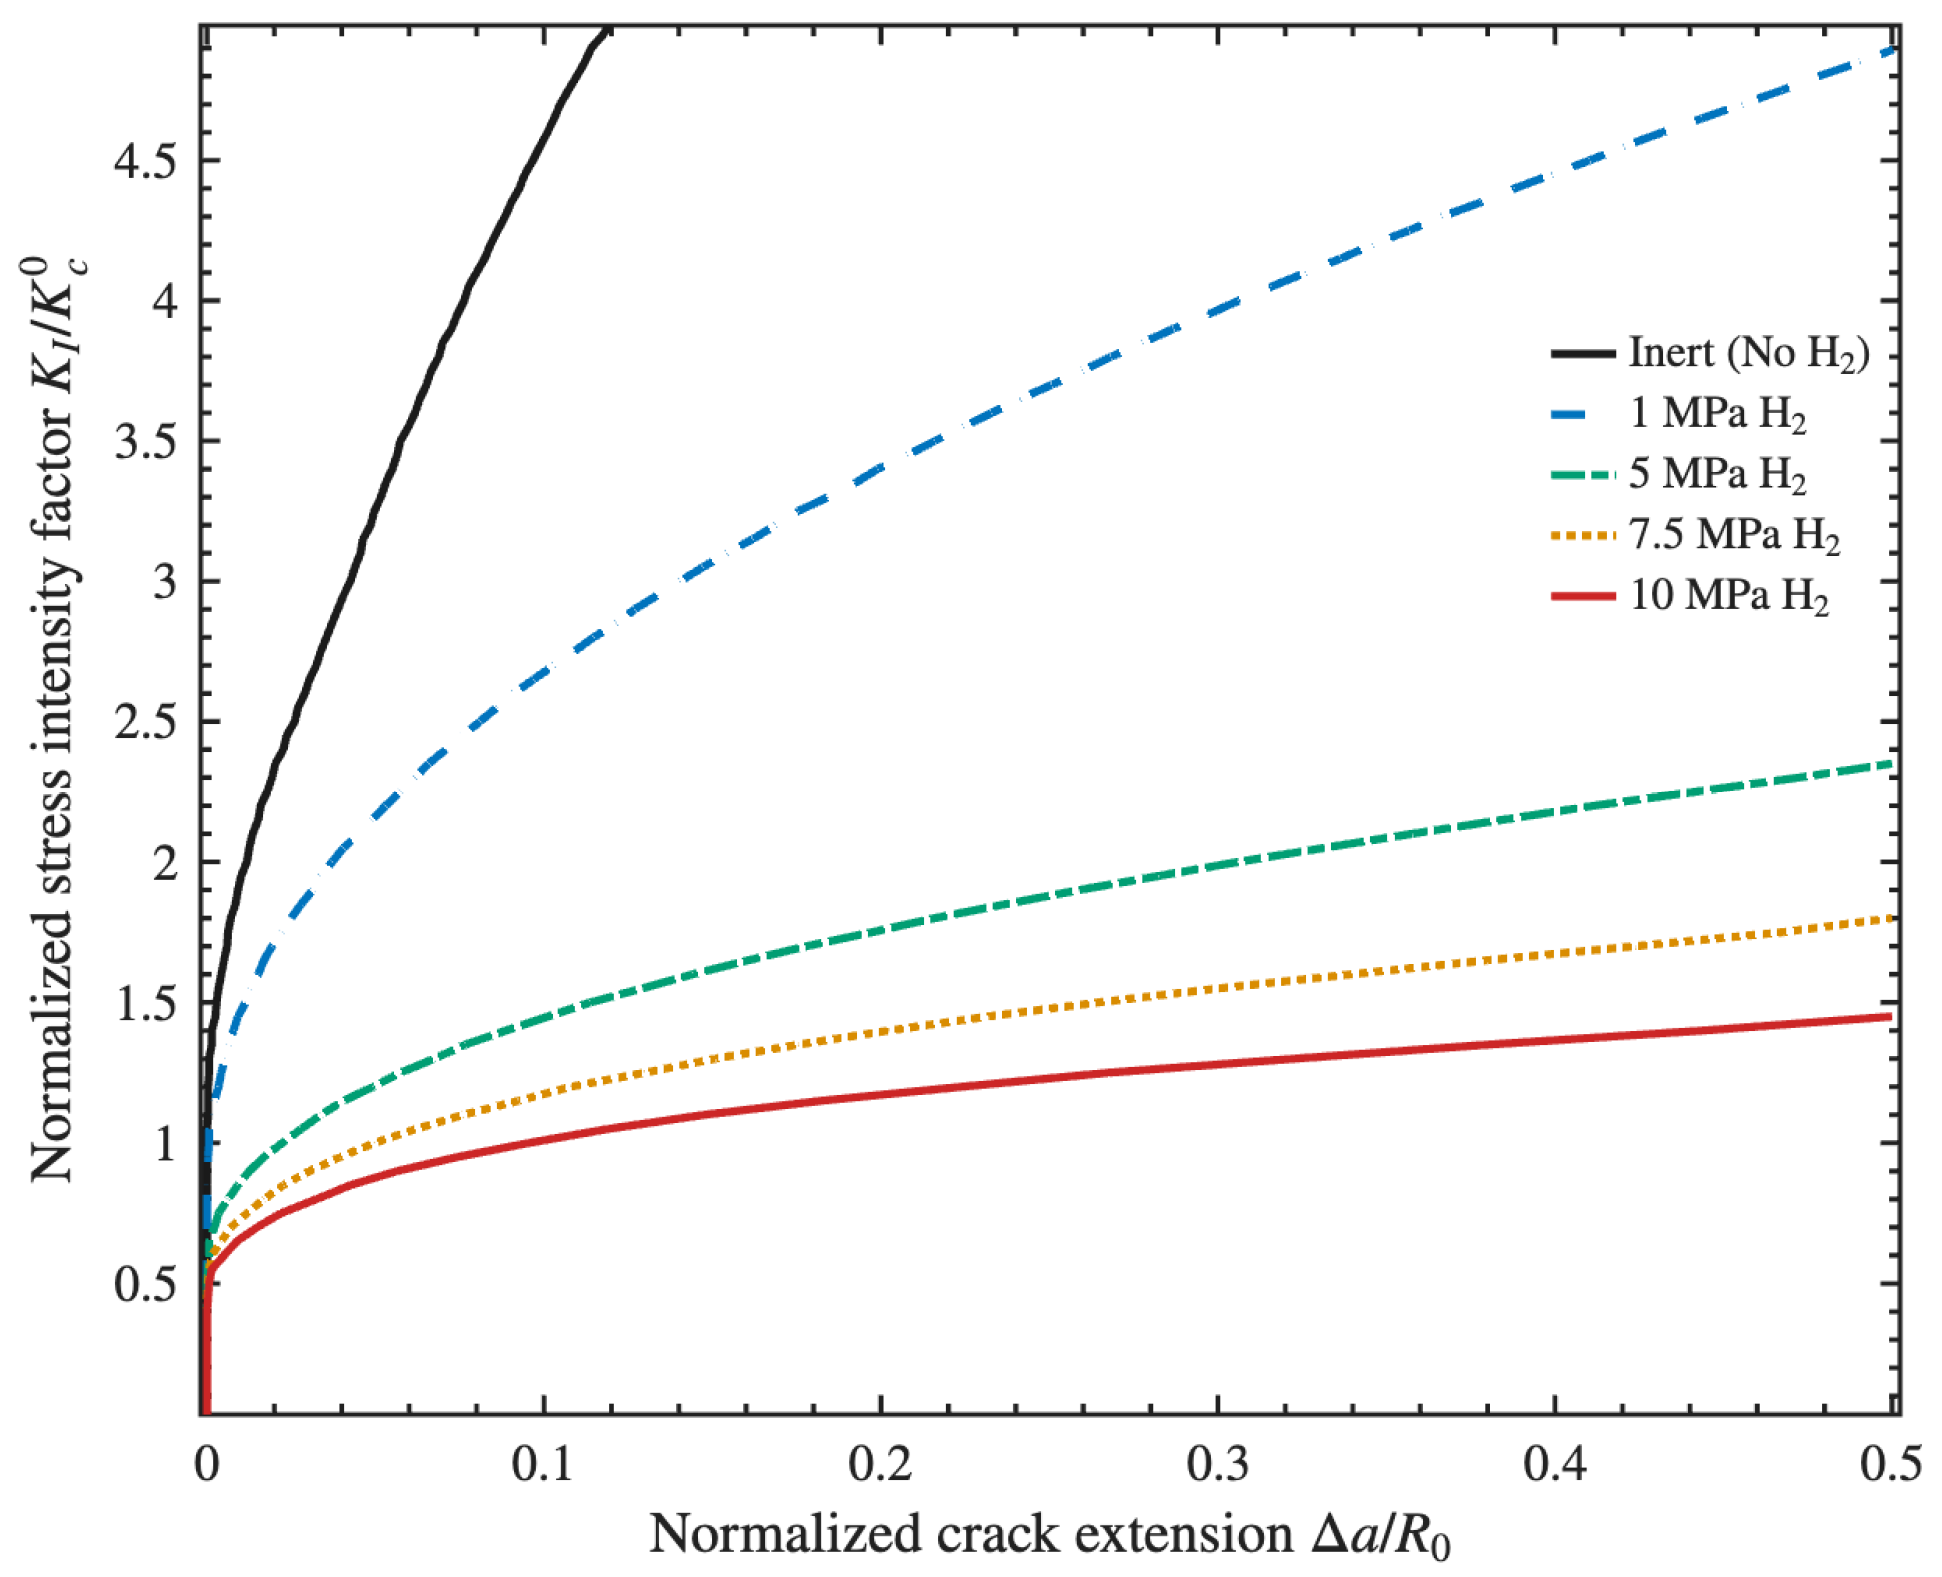
Now consider the effect of hydrogen pressure on the crack growth resistance of X65 pipeline steel with a strain hardening modulus of H 0 = 4 GPa and an initial yield stress of σ y 0 = 450 MPa [61]. When evaluating and comparing steel grades, hardening moduli of H 0 = 4 GPa, 5 GPa, and 6 GPa were assigned alongside initial yield stresses of 450 MPa, 485 MPa, and 550 MPa for X65, X70, and X80, respectively. To this end, four different hydrogen gas environments (1, 5, 7.5, and 10 MPa) are evaluated alongside an inert, ambient environment (No H 2 ). The crack growth resistance curves (R-curves) are computed using a baseline material toughness of G c 0 = 25 k J / m 2 . Figure 8 illustrates the resulting normalized stress intensity factor ( K I / K c 0 ) versus the normalized crack extension ( a / R 0 ) as a function of environmental hydrogen pressure. The results reveal that an increase in hydrogen gas pressure shifts the material behavior from ductile toward a brittle failure mode. In the inert environment, the material exhibits high plastic toughening and immense resistance to crack propagation, naturally resisting crack initiation until K I K c 0 . However, as the hydrogen pressure increases, the slope of the R-curve reduces and crack propagation initiates at values below K c 0 . Exposure to 1 MPa of hydrogen yields only a reduction in crack growth resistance, allowing the X65 steel to retain a substantial degree of inelastic toughening and stable crack growth. Conversely, elevating the pressure to 5 MPa triggers a severe drop in fracture resistance. Beyond 5 MPa, the degradation rate begins to saturate; the R-curves for 7.5 MPa and 10 MPa cluster closely together, exhibiting almost no plastic toughening and resulting in highly unstable fracture. For example, at 10 MPa hydrogen pressure, the onset of crack propagation drops to K I 0.45   K c 0 , and the fracture resistance curve reaches a near-horizontal plateau. This saturation is mathematically consistent with the thermodynamic formulation: as gas fugacity increases with pressure, the stress-assisted lattice concentration at the crack tip increases, driving the local surface coverage ( θ H ) in the fracture process zone closer to its maximum. Consistent with atomic-scale calculations regarding hydrogen degradation laws [27], lower hydrogen concentrations induce a sharp decrease in crack growth resistance, while higher concentrations provide sufficient hydrogen to reach the plateau region of the degradation curve. It must be noted that the normalization variables K c 0 and R 0 are formulated strictly using the undamaged base toughness ( G c 0 ). Because the actual local G c during the simulation is heterogeneous and dependent on the localized concentration ( C L ) distribution, hydrogen-assisted crack propagation occurring at K I < K c 0 does not imply a deviation from Griffith’s criterion. Ultimately, elevated pressures generate continuously sharper cracks and drastically suppress the plastic dissipation zone ahead of the advancing front, confirming that the high thermodynamic driving force at 10 MPa completely overrides the inherent macroscopic ductility of the X65 steel. Interestingly, the results illustrate the inverse effect of hydrogen pressure on the crack growth resistance (R-curves). As hydrogen pressure increases, the slope of the curve decreases significantly, reflecting a severe degradation in crack growth resistance and an increased susceptibility to hydrogen embrittlement.
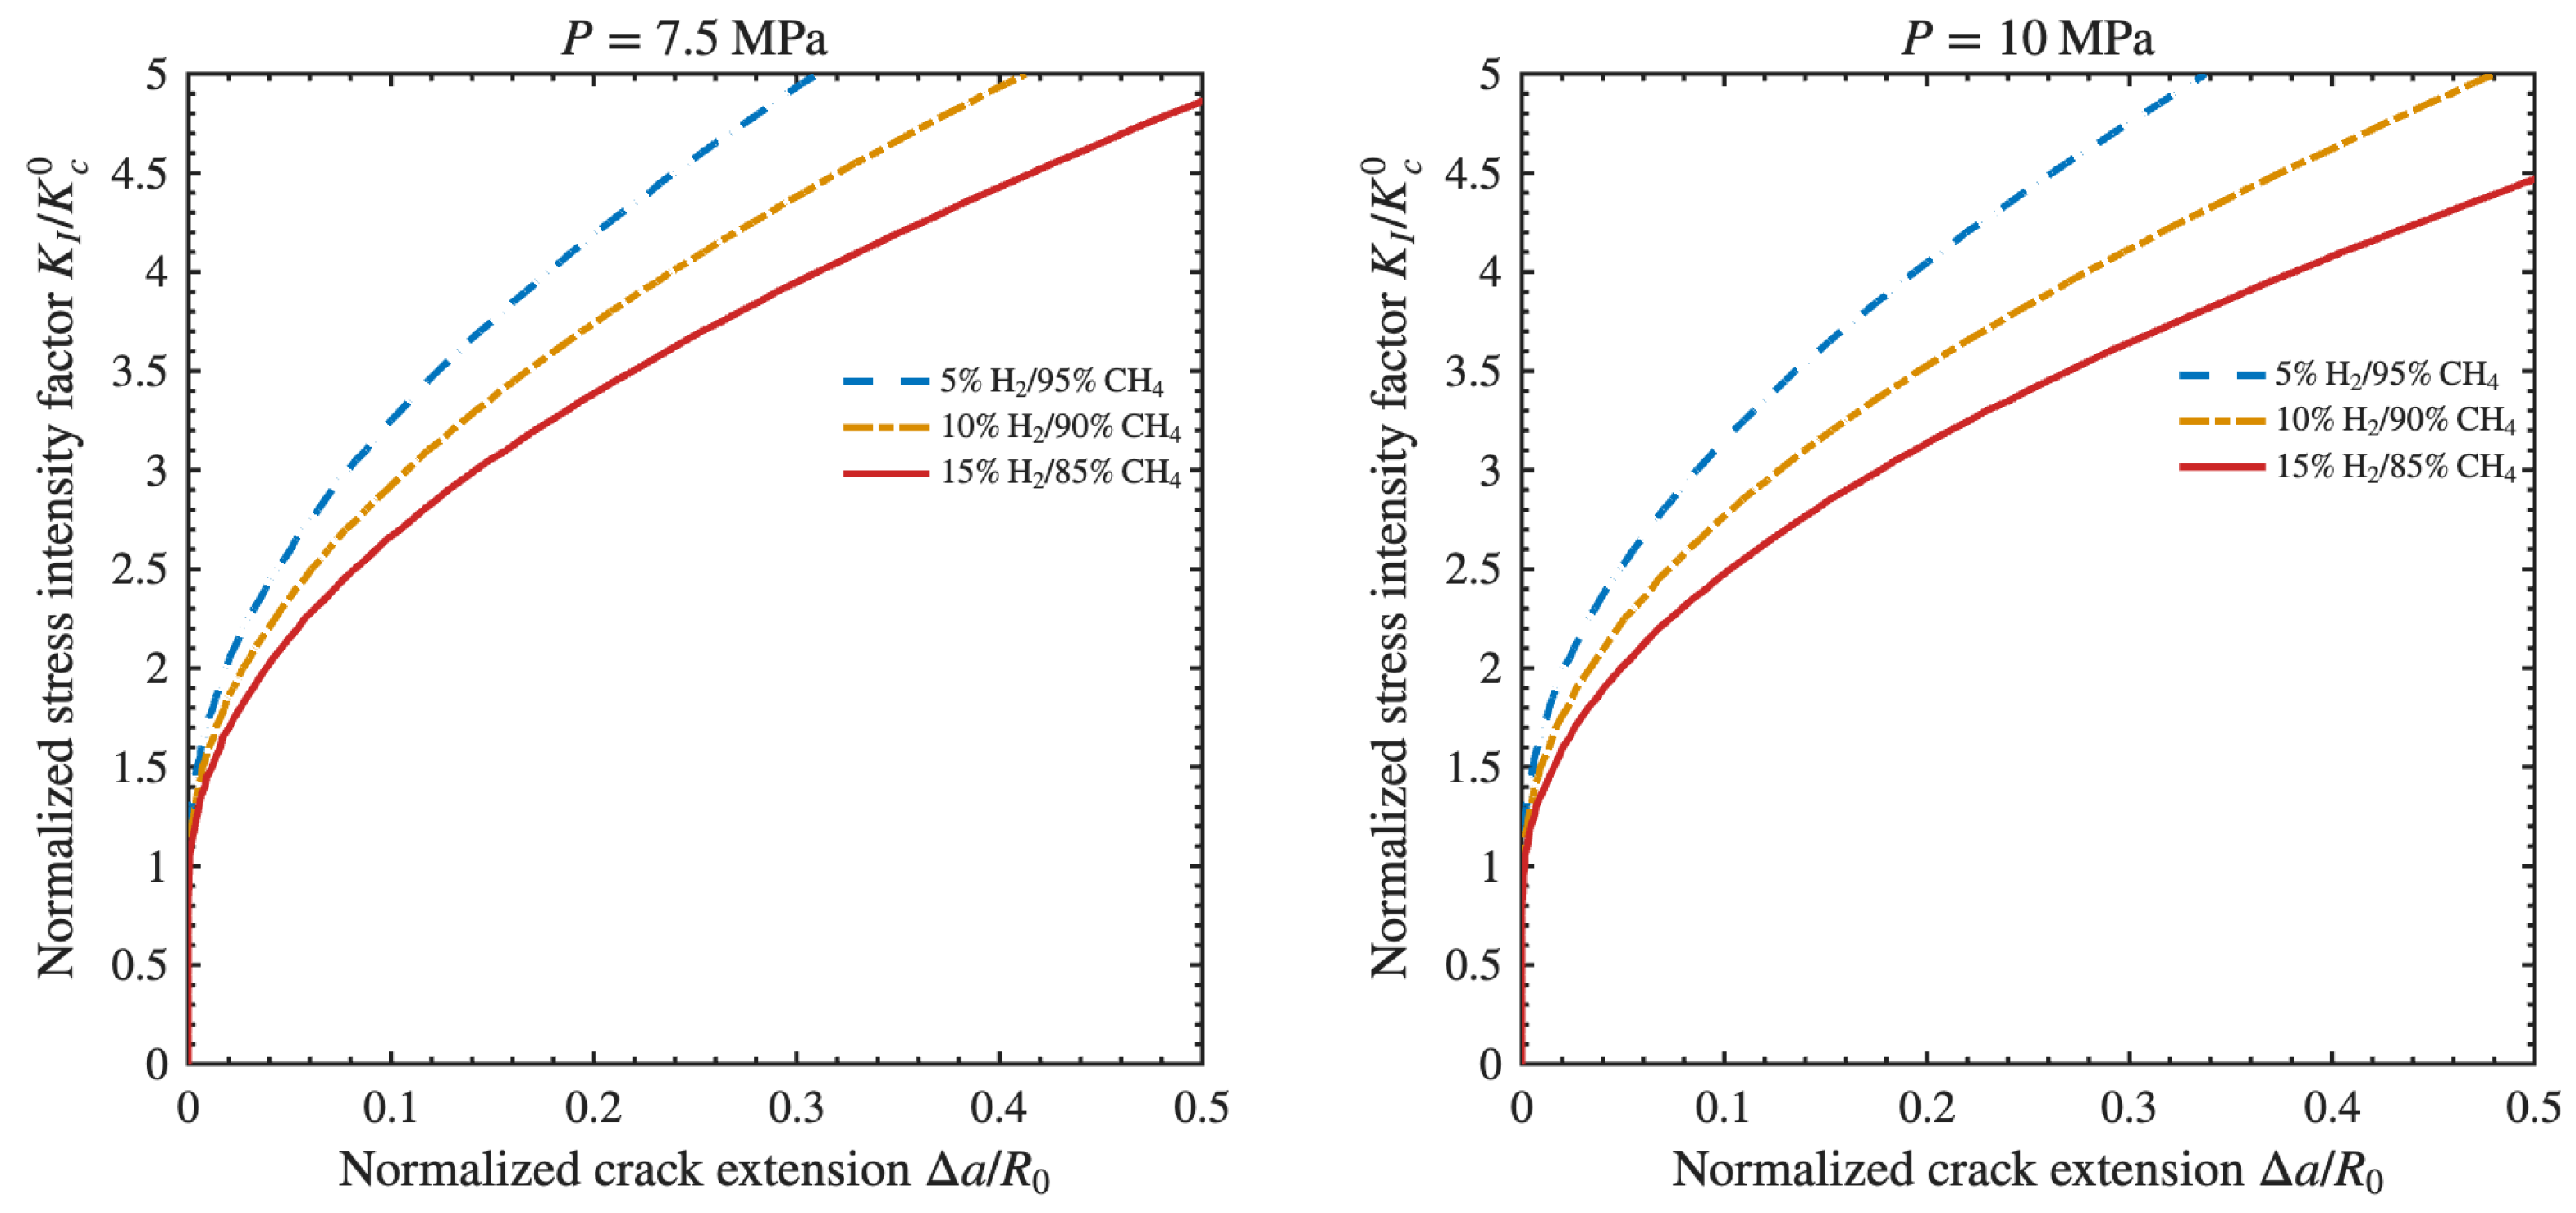
To incorporate the effect of blending hydrogen with natural gas on crack growth resistance, three different volumetric hydrogen fractions (5%, 10%, and 15%, with the balance being (CH4) are considered at two pipeline pressures of 7.5 MPa and 10 MPa. The numerical results in Figure 9 were obtained in terms of the normalized crack growth resistance as a function of normalized crack extension for different hydrogen-gas mixtures, illustrating how increasing the hydrogen content within the gas mixture shifts the resistance curves toward a more brittle behavior, reducing the threshold at which crack propagation initiates. At a pressure of 7.5 MPa, the 5% H2 blend exhibits minimal degradation, initiating crack growth at K I 1.05 K c 0 . Increasing the hydrogen content to 15% elevates the hydrogen partial pressure to 1.125 MPa, consequently reducing the initiation threshold to K I 0.90   K c 0 . The same trend, slightly exacerbated, is observed at a pressure of 10 MPa. Therefore, the onset of crack growth drops from K I K c 0 for the 5% blend down to K I 0.85   K c 0 for the 15% mixture. Despite these measurable reductions in the initiation thresholds, the R-curves for all investigated blends exhibit a steep rising trajectory, characteristic of significant plastic dissipation and inelastic toughening. For both the 7.5 MPa and 10 MPa conditions, the blended environments do not transition into the unstable, purely brittle fracture regimes typically observed in high-pressure pure hydrogen scenarios. Instead, the material retains robust, stable crack growth capabilities throughout the deformation process.
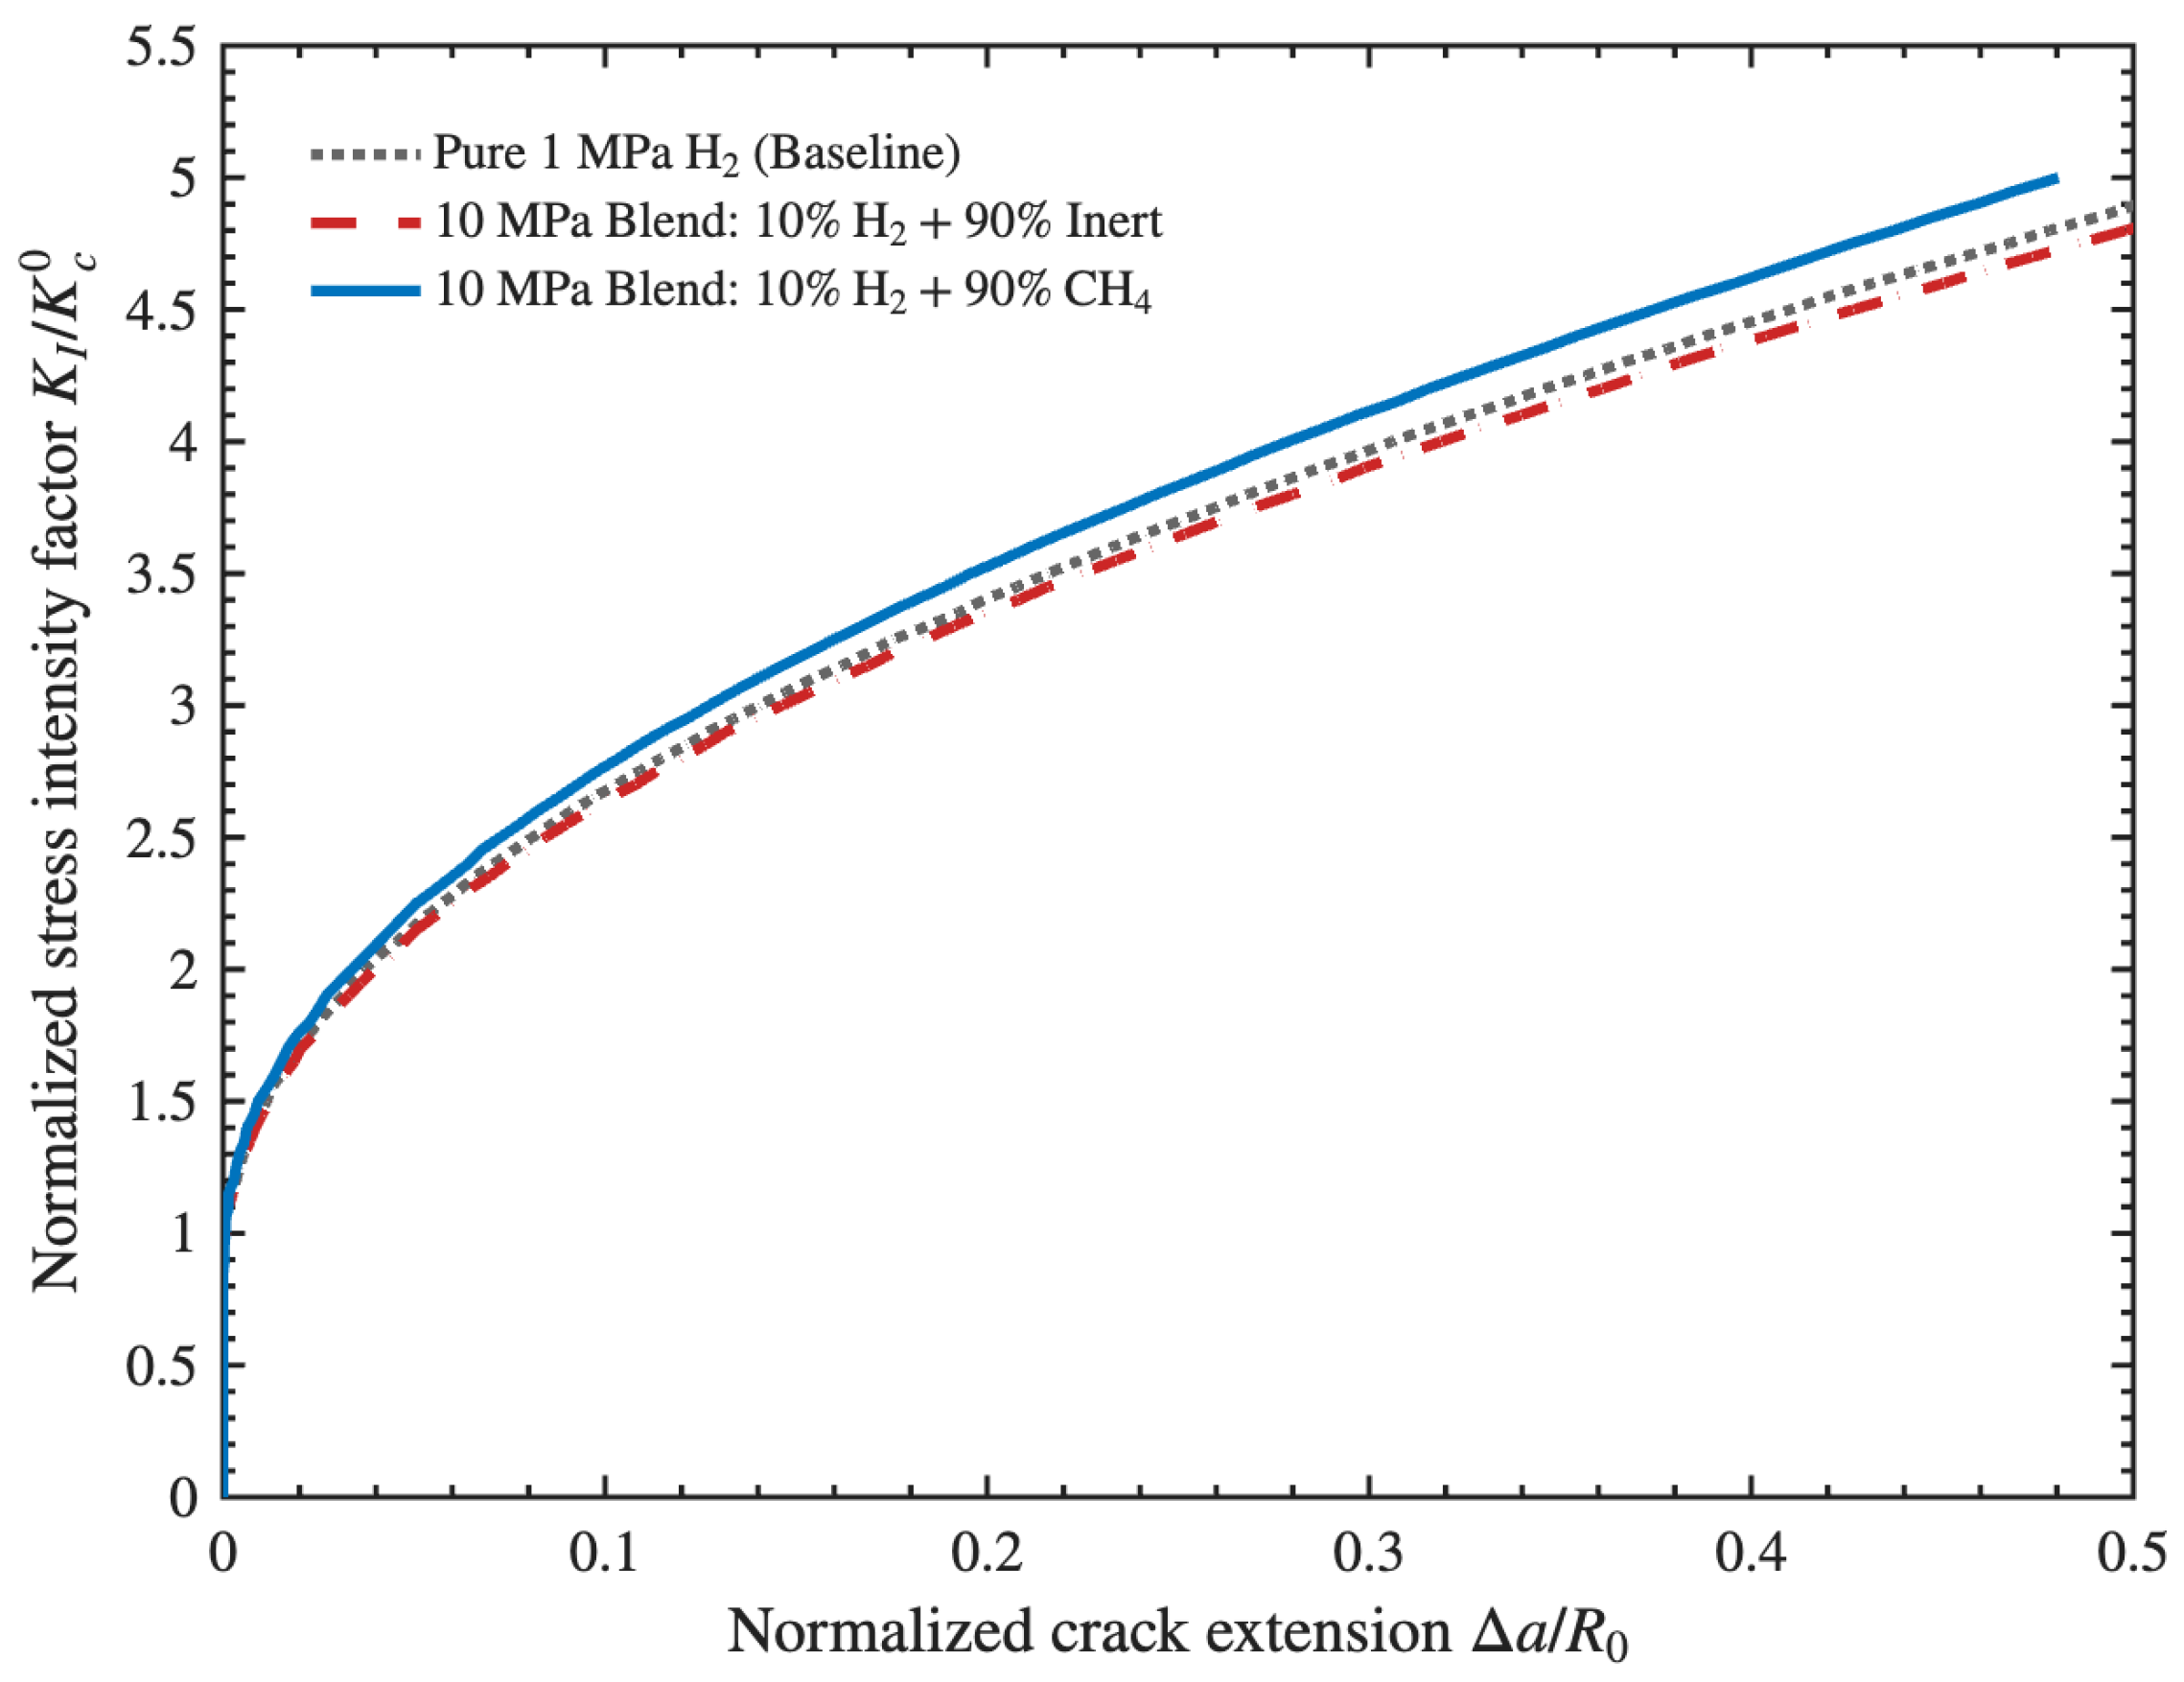
To show the effects of partial pressure from the adsorption of methane, a numerical experiment was conducted on the elastoplastic model ( G c 0 = 25 k J / m 2 ). Figure 10 presents the crack growth resistance of a 10% H2 mixture at 10 MPa under two distinct mixtures comprising inert and methane gases, compared against a pure 1.0 MPa H 2 baseline represented by the dotted gray line. When the inert gas constitutes 90% of the gaseous mixture, providing a mechanical pressure of 9.0 MPa without participating in surface binding, the resulting R-curve (red dashed line) drops and almost coincides with the baseline 1.0 MPa, demonstrating that without competitive adsorption, the material remains vulnerable. The inert gas has a negligible effect on hydrogen adsorption or transport, allowing hydrogen associated with the 1.0 MPa partial pressure to diffuse and accumulate within the crack-tip fracture process zone. Conversely, when the multi-component Langmuir isotherm is activated, allowing the 90% methane fraction to physically compete for surface adsorption sites, the hydrogen–methane blend (solid blue line) exhibits delayed crack initiation ( K I 0.90   K c 0 ) and a steeper tearing trajectory. The difference between the inert blend (red) and the methane blend (blue) quantifies the magnitude of the site-blocking effect, confirming that the preservation of ductility in a high-pressure environment is not a byproduct of reduced hydrogen amount. Rather, methane occupies trapping sites in the crack-tip region, reducing hydrogen accumulation and consequently decreasing susceptibility to hydrogen-assisted fracture.
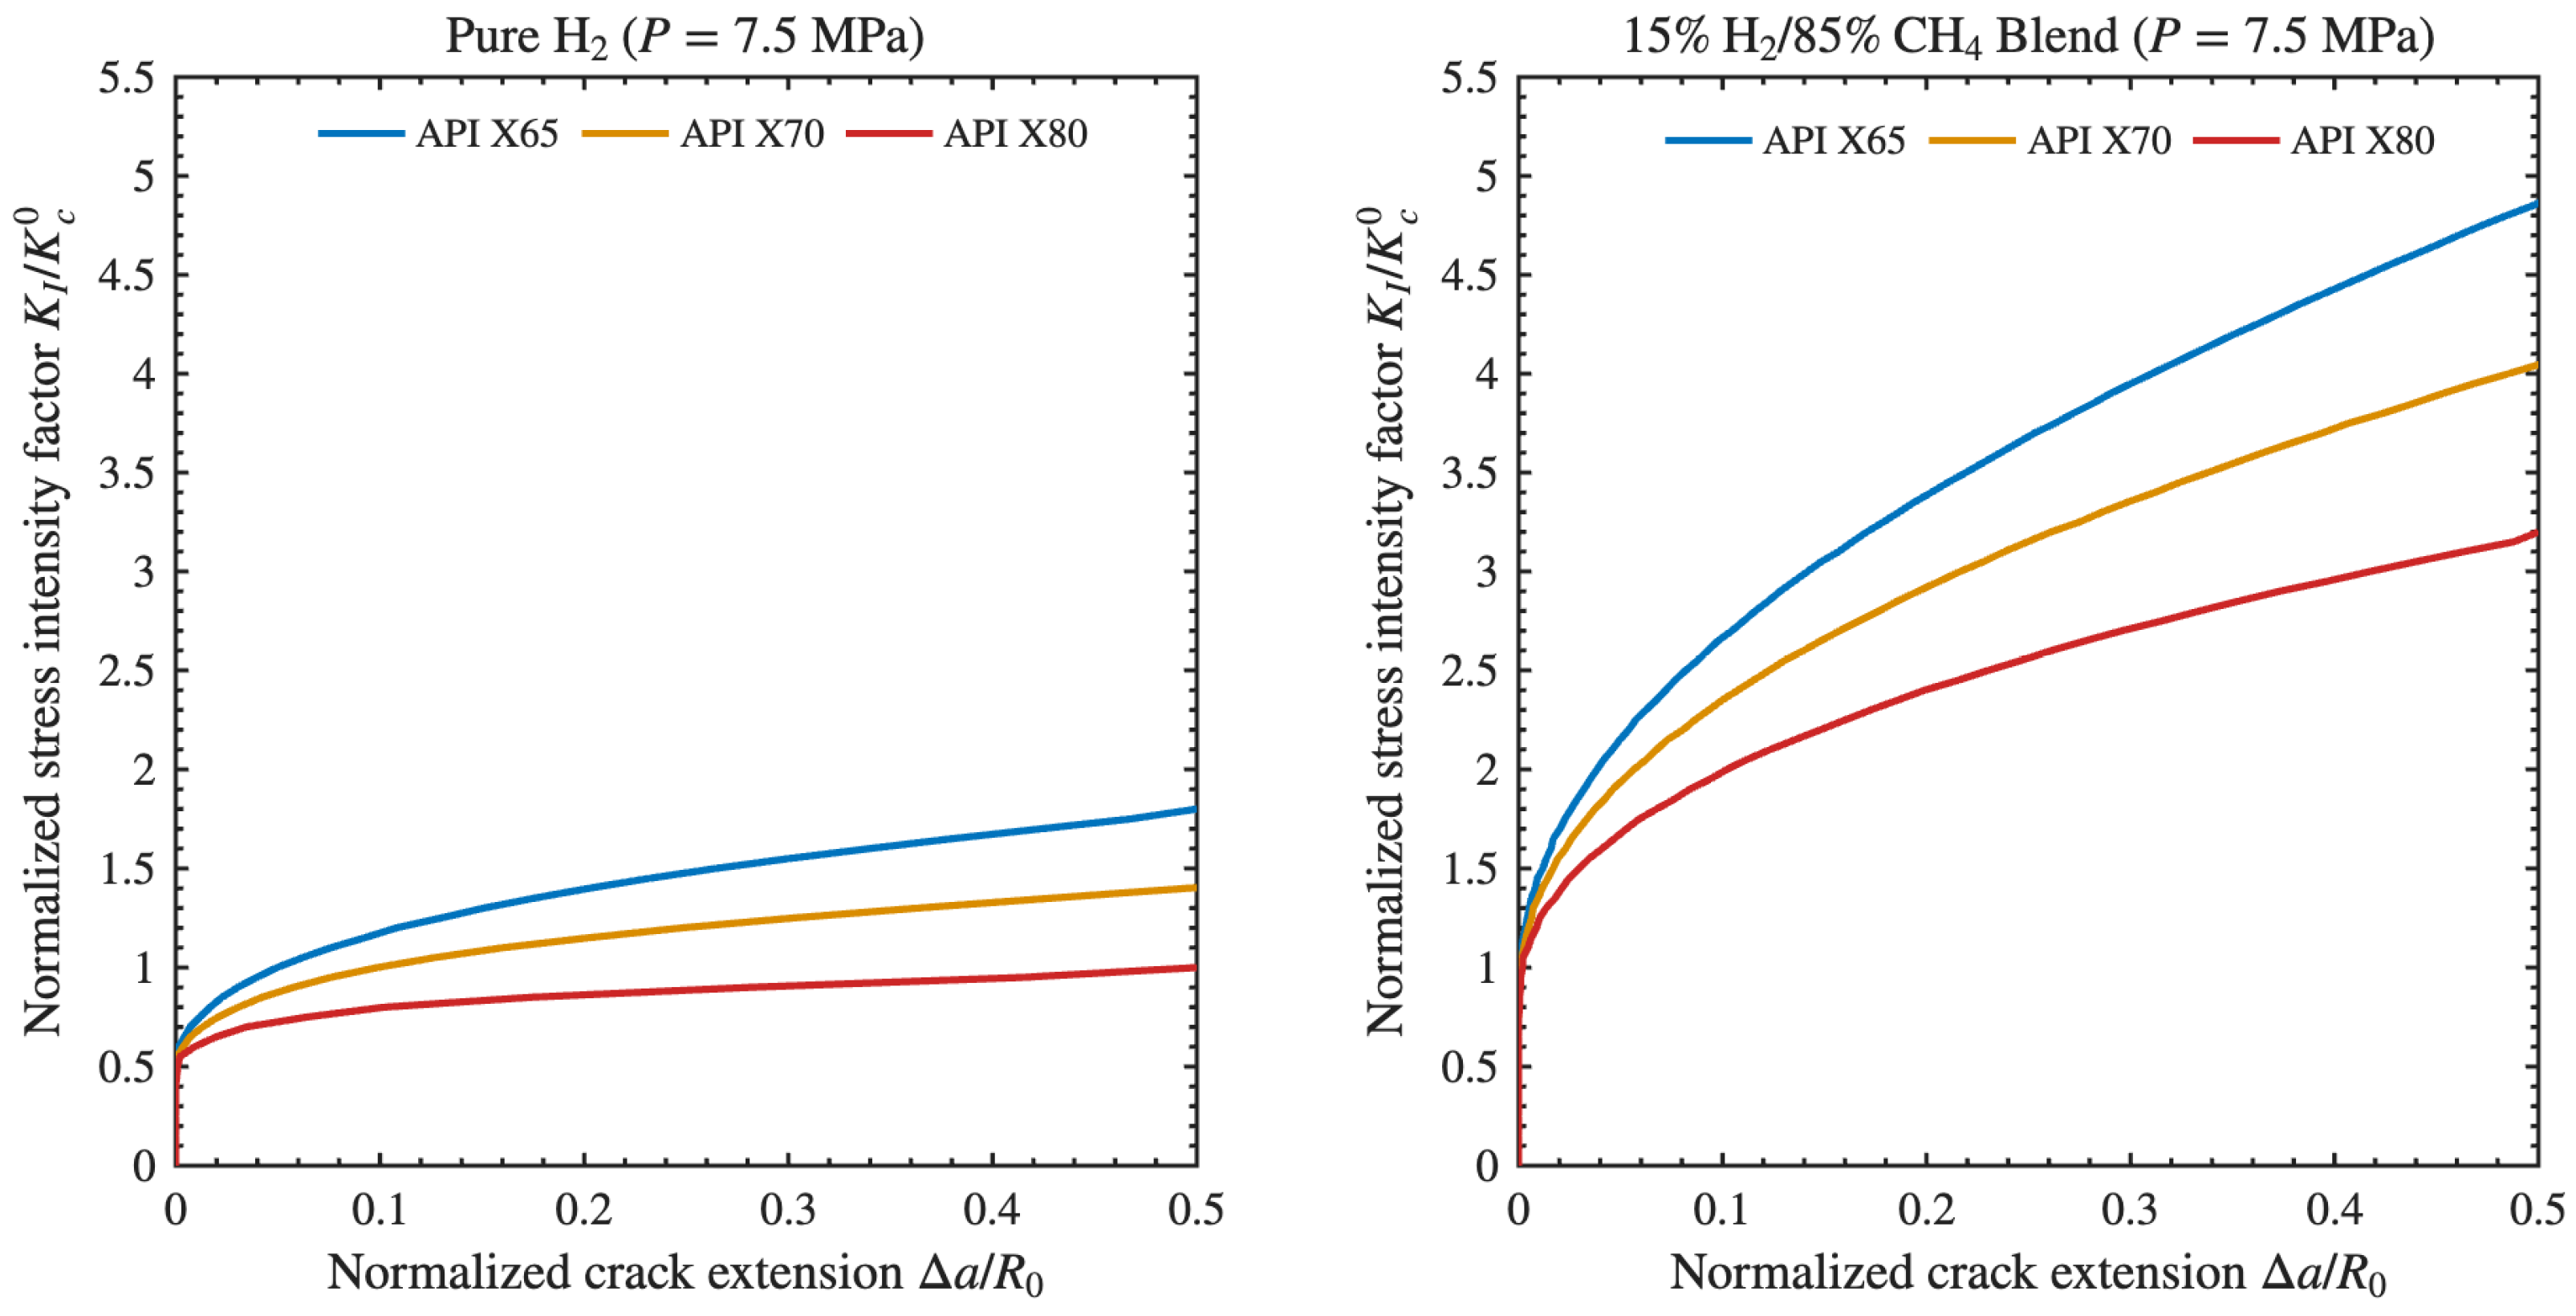
To investigate the behavior of the crack growth resistance curves in both pure hydrogen and hydrogen–methane blended environments, numerical experiments were conducted at a constant operating pressure of 7.5 MPa. According to the literature, carbon steels are highly susceptible to hydrogen embrittlement due to their higher density of microstructural trapping sites, which enhance localized hydrogen accumulation. This, combined with stress-driven diffusion toward the crack tip, results in hydrogen accumulation in the fracture process zone and elevated local concentrations ahead of the crack tip. To numerically capture this effect, the crack growth resistance of three carbon steels, namely API 5L X65, X70, and X80, is shown. The materials are assessed under a total pressure of 7.5 MPa in two distinct environments: pure hydrogen and a 15/85 vol% H2/CH4 blend. Figure 11 illustrates the vulnerability of the higher-grade steels in the pure hydrogen case. The X65 and X70 grades initiate crack propagation at a threshold of K I 0.50   K c 0 , exhibiting minimal plastic toughening. However, the X80 grade experiences the most degradation, initiating fracture earlier at K I 0.45   K c 0 and demonstrating a virtually flat, purely brittle trajectory. This high embrittlement is consistent with elastoplastic physics: the higher yield strength of the X80 steel induces a stronger hydrostatic stress field ( σ h ) ahead of the blunting crack tip, exponentially amplifying the stress-assisted diffusion of lattice hydrogen ( C L ) into the fracture process zone, thereby accelerating the degradation of local fracture energy. Crucially, however, the introduction of methane gas mitigates this high-strength vulnerability. As depicted in the blended 7.5 MPa environment (Figure 11, right), all three pipeline grades exhibit considerable ductility. The crack initiation thresholds shift massively upward, reaching K I 0.90   K c 0 for X65, K I 0.85   K c 0 for X70, and K I 0.80   K c 0 for X80. Furthermore, the curves for all three materials transition from a flat, unstable trajectory to a steep, stable rising curve characteristic of substantial inelastic dissipation. While the X80 steel is the most susceptible grade among these, initiating slightly earlier than X65 and exhibiting a modestly lower maximum plateau, the adsorption of methane prevents its transition into the catastrophic brittle regime. By occupying structural trap sites at the metal surface, the methane gas starves the crack tip of hydrogen, overpowering the hydrostatic effect generated by the plastic zone.

4. Conclusions

A Multiphysics phase-field model was employed to predict elastoplastic failures in pipeline steels subjected to high-pressure hydrogen–methane blends by considering the transient effects of hydrogen diffusion and trapping by integrating mechanical deformation, stress-assisted hydrogen diffusion, and damage evolution. This variational framework for chemo-mechanical fracture is numerically implemented via the finite element method to evaluate the structural integrity of API 5L X65, X70, and X80 pipeline steels. The key findings are:
  • Virtual experiments revealed that methane acts as a surface barrier and competitively limits the fractional hydrogen coverage ( θ H ) at the steel surface, thereby preserving the critical fracture energy of the material.
  • The sensitivity of peak load to hydrogen content is mapped, illustrating that as methane is added to the mixture, the material’s load-bearing capacity ( F m a x ) recovers because the hydrogen-induced load reduction scales directly with the square root of the hydrogen fraction ( y H 2 ), proving that mechanical degradation in these environments is governed by hydrogen diffusion.
  • The model quantifies the effect of hydrogen–methane blending on the crack growth resistance (R-curve). While pure 10 MPa hydrogen causes high embrittlement, which is characterized by a suppressed initiation threshold and a flat R-curve indicative of brittle failure, adding a 15/85 vol% H2/CH4 mixture enables the steel to retain 80–90% of its fracture toughness and exhibit ductile failure.
  • Numerical results reveal that while all assessed materials suffer from embrittlement in pure hydrogen environments, higher-strength steels such as X80 are the most susceptible. In these grades, high hydrostatic stress leads to significant accumulation of hydrogen at the fracture process zone. However, hydrogen–methane blending restores the crack initiation thresholds for all three grades ( K I 0.80   t o   90   K c 0 ), resulting in ductile failure.
Ultimately, these findings provide preliminary insights into material selection and operational thresholds for the hydrogen–methane transition. While pipeline assessments will require incorporating features such as weld joints, heat-affected zones and cyclic loading effects, the present framework establishes a method for evaluating safe blending ratios considering only the steel grade.

Author Contributions

Conceptualization, M.F.M., E.P. (Elpida Piperopoulos) and E.P. (Edoardo Proverbio); Methodology, H.M.; Software, H.M.; Validation, H.M.; Formal analysis, E.P. (Edoardo Proverbio); Investigation, H.M., M.F.M., E.P. (Elpida Piperopoulos) and E.P. (Edoardo Proverbio); Data curation, H.M., M.F.M., E.P. (Elpida Piperopoulos) and E.P. (Edoardo Proverbio); Writing—original draft, H.M. and E.P. (Edoardo Proverbio); Writing—review & editing, H.M.; Supervision, M.F.M., E.P. (Elpida Piperopoulos) and E.P. (Edoardo Proverbio); Funding acquisition, M.F.M. All authors have read and agreed to the published version of the manuscript.

Funding

The authors acknowledge financial support from INAIL within the project BRIC 2022–ID02 framework “Resilience Engineering for Safe Energy Transition (RE-SET)”.

Data Availability Statement

The original contributions presented in this study are included in the article. Further inquiries can be directed to the corresponding author.

Conflicts of Interest

The authors declare no conflicts of interest.

References

  1. Paglini, R.; Minuto, F.D.; Lanzini, A. Estimating Greenhouse Gas Emissions from Hydrogen-Blended Natural Gas Networks. Energies 2024, 17, 6369. [Google Scholar] [CrossRef] [Scilit]
  2. Arent, D.J.; Green, P.; Abdullah, Z.; Barnes, T.; Bauer, S.; Bernstein, A.; Berry, D.; Berry, J.; Burrell, T.; Carpenter, B.; et al. Challenges and Opportunities in Decarbonizing the U.S. Energy System. Renew. Sustain. Energy Rev. 2022, 169, 112939. [Google Scholar] [CrossRef] [Scilit]
  3. Dincer, I.; Aydin, M.I. New Paradigms in Sustainable Energy Systems with Hydrogen. Energy Convers. Manag. 2023, 283, 116950. [Google Scholar] [CrossRef] [Scilit]
  4. Mahajan, D.; Tan, K.; Venkatesh, T.; Kileti, P.; Clayton, C.R. Hydrogen Blending in Gas Pipeline Networks—A Review. Energies 2022, 15, 3582. [Google Scholar] [CrossRef] [Scilit]
  5. Khaing, M.M.; Yin, S. Lifecycle Management of Hydrogen Pipelines: Design, Maintenance, and Rehabilitation Strategies for Canada’s Clean Energy Transition. Energies 2025, 18, 240. [Google Scholar] [CrossRef] [Scilit]
  6. Valente, R.; Costa, J.M.; Domingues, N.S. Natural Gas–Hydrogen Blends to Power: Equipment Adaptation and Experimental Study. Energies 2025, 18, 1922. [Google Scholar] [CrossRef] [Scilit]
  7. Abdin, Z. Bridging the Energy Future: The Role and Potential of Hydrogen Co-Firing with Natural Gas. J. Clean. Prod. 2024, 436, 140724. [Google Scholar] [CrossRef] [Scilit]
  8. Zhou, H.; Xue, J.; Gao, H.; Ma, N. Hydrogen-Fueled Gas Turbines in Future Energy System. Int. J. Hydrogen Energy 2024, 64, 569–582. [Google Scholar] [CrossRef] [Scilit]
  9. Boretti, A. Combined Cycle Gas Turbine (CCGT) Plants Utilizing Methane-Hydrogen Blends Represent a Significant Element in Australia’s Journey toward Achieving Net-Zero Emissions. Fuel 2025, 381, 133339. [Google Scholar] [CrossRef] [Scilit]
  10. Martin, P.; Ocko, I.B.; Esquivel-Elizondo, S.; Kupers, R.; Cebon, D.; Baxter, T.; Hamburg, S.P. A Review of Challenges with Using the Natural Gas System for Hydrogen. Energy Sci. Eng. 2024, 12, 3995–4009. [Google Scholar] [CrossRef] [Scilit]
  11. Lipiäinen, S.; Lipiäinen, K.; Ahola, A.; Vakkilainen, E. Use of Existing Gas Infrastructure in European Hydrogen Economy. Int. J. Hydrogen Energy 2023, 48, 31317–31329. [Google Scholar] [CrossRef] [Scilit]
  12. Hancock, L.; Ralph, N. A Framework for Assessing Fossil Fuel ‘Retrofit’ Hydrogen Exports: Security-Justice Implications of Australia’s Coal-Generated Hydrogen Exports to Japan. Energy 2021, 223, 119938. [Google Scholar] [CrossRef] [Scilit]
  13. Ahad, M.T.; Bhuiyan, M.M.; Sakib, A.N.; Becerril Corral, A.; Siddique, Z. An Overview of Challenges for the Future of Hydrogen. Materials 2023, 16, 6680. [Google Scholar] [CrossRef] [Scilit] [PubMed]
  14. Li, H.; Yazdi, M.; Moradi, R.; Pirbalouti, R.G.; Nedjati, A. Synergistic Integration of Hydrogen Energy Economy with UK’s Sustainable Development Goals: A Holistic Approach to Enhancing Safety and Risk Mitigation. Fire 2023, 6, 391. [Google Scholar] [CrossRef] [Scilit]
  15. Kościelniak, B.; Chmiela, B.; Sozańska, M.; Swadźba, R.; Drajewicz, M. Oxidation Behavior of Inconel 740H Nickel Superalloy in Steam Atmosphere at 750 °C. Materials 2021, 14, 4536. [Google Scholar] [CrossRef] [Scilit] [PubMed]
  16. Dwivedi, S.K.; Vishwakarma, M. Hydrogen Embrittlement in Different Materials: A Review. Int. J. Hydrogen Energy 2018, 43, 21603–21616. [Google Scholar] [CrossRef] [Scilit]
  17. Li, X.; Yin, J.; Zhang, J.; Wang, Y.; Song, X.; Zhang, Y.; Ren, X. Hydrogen Embrittlement and Failure Mechanisms of Multi-Principal Element Alloys: A Review. J. Mater. Sci. Technol. 2022, 122, 20–32. [Google Scholar] [CrossRef] [Scilit]
  18. Wasim, M.; Djukic, M.B.; Ngo, T.D. Influence of Hydrogen-Enhanced Plasticity and Decohesion Mechanisms of Hydrogen Embrittlement on the Fracture Resistance of Steel. Eng. Fail. Anal. 2021, 123, 105312. [Google Scholar] [CrossRef] [Scilit]
  19. Mento, A.; Dreano, A.; Christien, F.; Proverbio, E. Investigating Temperature Effects on Short- and Long-Term Hydrogen Permeation in API 5L X65Q Steel. Int. J. Hydrogen Energy 2025, 159, 150514. [Google Scholar] [CrossRef] [Scilit]
  20. Nazar, S.; Lipiec, S.; Proverbio, E. FEM Modelling of Hydrogen Embrittlement in API 5L X65 Steel for Safe Hydrogen Transportation. J. Mater. Sci. Mater. Eng. 2025, 20, 9. [Google Scholar] [CrossRef] [Scilit]
  21. Piperopoulos, E.; Milazzo, M.F.; Rahimi, S.; Bruzzaniti, P.; Proverbio, E. Definition of an Experimental Set-up for Studying the Safety of Hydrogen Transport Systems. Chem. Eng. Trans. 2023, 105, 109–114. [Google Scholar] [CrossRef]
  22. Nazar, S.; Proverbio, E. Modeling of Hydrogen-Assisted Fatigue Crack Growth in Carbon Steel Pipelines. Int. J. Hydrogen Energy 2025, 138, 548–558. [Google Scholar] [CrossRef] [Scilit]
  23. San Marchi, C.; Somerday, B. SANDIA REPORT Technical Reference for Hydrogen Compatibility of Materials; SAND2012-7321; Sandia National Laboratories: Albuquerque, NM, USA, 2012.
  24. Makaryan, I.A.; Sedov, I.V.; Salgansky, E.A.; Arutyunov, A.V.; Arutyunov, V.S. A Comprehensive Review on the Prospects of Using Hydrogen–Methane Blends: Challenges and Opportunities. Energies 2022, 15, 2265. [Google Scholar] [CrossRef] [Scilit]
  25. Fan, X.; Cheng, Y.F. Hydrogen Pipelines and Embrittlement in Gaseous Environments: An up-to-Date Review. Appl. Energy 2025, 387, 125636. [Google Scholar] [CrossRef] [Scilit]
  26. Sun, Y.; Ren, Y.; Cheng, Y.F. Dissociative Adsorption of Hydrogen and Methane Molecules at High-Angle Grain Boundaries of Pipeline Steel Studied by Density Functional Theory Modeling. Int. J. Hydrogen Energy 2022, 47, 41069–41086. [Google Scholar] [CrossRef] [Scilit]
  27. Martínez-Pañeda, E.; Golahmar, A.; Niordson, C.F. A Phase Field Formulation for Hydrogen Assisted Cracking. Comput. Methods Appl. Mech. Eng. 2018, 342, 742–761. [Google Scholar] [CrossRef] [Scilit]
  28. Duda, F.P.; Ciarbonetti, A.; Toro, S.; Huespe, A.E. A Phase-Field Model for Solute-Assisted Brittle Fracture in Elastic-Plastic Solids. Int. J. Plast. 2018, 102, 16–40. [Google Scholar] [CrossRef] [Scilit]
  29. Branco, R.; Antunes, F.V.; Costa, J.D. A Review on 3D-FE Adaptive Remeshing Techniques for Crack Growth Modelling. Eng. Fract. Mech. 2015, 141, 170–195. [Google Scholar] [CrossRef] [Scilit]
  30. Rege, K.; Lemu, H.G. A Review of Fatigue Crack Propagation Modelling Techniques Using FEM and XFEM. IOP Conf. Ser. Mater. Sci. Eng. 2017, 276, 012027. [Google Scholar] [CrossRef] [Scilit]
  31. Kristensen, P.K.; Niordson, C.F.; Martínez-Pañeda, E. Applications of Phase Field Fracture in Modelling Hydrogen Assisted Failures. Theor. Appl. Fract. Mech. 2020, 110, 102837. [Google Scholar] [CrossRef] [Scilit]
  32. Mandal, T.K.; Parker, J.; Gagliano, M.; Martínez-Pañeda, E. Computational Predictions of Weld Structural Integrity in Hydrogen Transport Pipelines. Int. J. Hydrogen Energy 2025, 136, 923–937. [Google Scholar] [CrossRef] [Scilit]
  33. Yang, S.; Darabi, R.; Reis, A.; de Jesus, A.; Meng, D.; Zhu, S.-P. Hydrogen-Assisted Fatigue Crack Growth of Pipeline Steels under Gaseous Hydrogen Pressure: A Unified Anisotropic Phase-Field Model. Eur. J. Mech.—A/Solids 2026, 118, 106106. [Google Scholar] [CrossRef] [Scilit]
  34. Díaz, A.; Alegre, J.M.; Cuesta, I.I.; Martínez-Pañeda, E. A COMSOL Framework for Predicting Hydrogen Embrittlement, Part II: Phase Field Fracture. Eng. Fract. Mech. 2025, 319, 111008. [Google Scholar] [CrossRef] [Scilit]
  35. Griffith, A.A. VI. The Phenomena of Rupture and Flow in Solids. Philos. Trans. R. Soc. Lond. Ser. A 1921, 221, 163–198. [Google Scholar] [CrossRef] [Scilit]
  36. Francfort, G.A.; Marigo, J.-J. Revisiting Brittle Fracture as an Energy Minimization Problem. J. Mech. Phys. Solids 1998, 46, 1319–1342. [Google Scholar] [CrossRef] [Scilit]
  37. Bourdin, B.; Francfort, G.A.; Marigo, J.-J. Numerical Experiments in Revisited Brittle Fracture. J. Mech. Phys. Solids 2000, 48, 797–826. [Google Scholar] [CrossRef] [Scilit]
  38. Moradi, H.; Grifò, G.; Milazzo, M.F.; Proverbio, E.; Consolo, G. Modeling Localized Corrosion in Biofuel Storage Tanks. Math. Biosci. Eng. 2025, 22, 677–699. [Google Scholar] [CrossRef] [Scilit] [PubMed]
  39. Martínez-Pañeda, E. Phase-Field Simulations Opening New Horizons in Corrosion Research. MRS Bull. 2024, 49, 603–612. [Google Scholar] [CrossRef] [Scilit]
  40. Ambrosio, L.; Tortorelli, V.M. Approximation of Functional Depending on Jumps by Elliptic Functional via T-Convergence. Commun. Pure Appl. Math. 1990, 43, 999–1036. [Google Scholar] [CrossRef] [Scilit]
  41. Ambati, M.; Gerasimov, T.; De Lorenzis, L. A Review on Phase-Field Models of Brittle Fracture and a New Fast Hybrid Formulation. Comput. Mech. 2015, 55, 383–405. [Google Scholar] [CrossRef] [Scilit]
  42. Amor, H.; Marigo, J.-J.; Maurini, C. Regularized Formulation of the Variational Brittle Fracture with Unilateral Contact: Numerical Experiments. J. Mech. Phys. Solids 2009, 57, 1209–1229. [Google Scholar] [CrossRef] [Scilit]
  43. Kristensen, P.K.; Niordson, C.F.; Martínez-Pañeda, E. An Assessment of Phase Field Fracture: Crack Initiation and Growth. Philos. Trans. R. Soc. A Math. Phys. Eng. Sci. 2021, 379, 20210021. [Google Scholar] [CrossRef] [Scilit] [PubMed]
  44. Oriani, R.A. The Diffusion and Trapping of Hydrogen in Steel. Acta Metall. 1970, 18, 147–157. [Google Scholar] [CrossRef] [Scilit]
  45. Gilman, J.J. Micromechanics of Flow in Solids; McGraw Hill Publishing Company: New York, NY, USA, 1969. [Google Scholar]
  46. Marchi, C.S.; Somerday, B.P.; Robinson, S.L. Permeability, Solubility and Diffusivity of Hydrogen Isotopes in Stainless Steels at High Gas Pressures. Int. J. Hydrogen Energy 2007, 32, 100–116. [Google Scholar] [CrossRef] [Scilit]
  47. Kristensen, P.K.; Niordson, C.F.; Martínez-Pañeda, E. A Phase Field Model for Elastic-Gradient-Plastic Solids Undergoing Hydrogen Embrittlement. J. Mech. Phys. Solids 2020, 143, 104093. [Google Scholar] [CrossRef] [Scilit]
  48. Martínez-Pañeda, E.; Harris, Z.D.; Fuentes-Alonso, S.; Scully, J.R.; Burns, J.T. On the Suitability of Slow Strain Rate Tensile Testing for Assessing Hydrogen Embrittlement Susceptibility. Corros. Sci. 2020, 163, 108291. [Google Scholar] [CrossRef] [Scilit]
  49. Renard, Y.; Poulios, K. GetFEM: Automated FE Modeling of Multiphysics Problems Based on a Generic Weak Form Language. ACM Trans. Math. Softw. 2020, 47, 4. [Google Scholar] [CrossRef] [Scilit]
  50. Jiang, D.E.; Carter, E.A. First Principles Assessment of Ideal Fracture Energies of Materials with Mobile Impurities: Implications for Hydrogen Embrittlement of Metals. Acta Mater. 2004, 52, 4801–4807. [Google Scholar] [CrossRef] [Scilit]
  51. Díaz, A.; Alegre, J.M.; Cuesta, I.I.; Martínez-Pañeda, E. A COMSOL Framework for Predicting Hydrogen Embrittlement, Part I: Coupled Hydrogen Transport. Eng. Fract. Mech. 2025, 319, 111007. [Google Scholar] [CrossRef] [Scilit]
  52. Golahmar, A.; Kristensen, P.K.; Niordson, C.F.; Martínez-Pañeda, E. A Phase Field Model for Hydrogen-Assisted Fatigue. Int. J. Fatigue 2022, 154, 106521. [Google Scholar] [CrossRef] [Scilit]
  53. Miehe, C.; Hofacker, M.; Welschinger, F. A Phase Field Model for Rate-Independent Crack Propagation: Robust Algorithmic Implementation Based on Operator Splits. Comput. Methods Appl. Mech. Eng. 2010, 199, 2765–2778. [Google Scholar] [CrossRef] [Scilit]
  54. Cui, C.; Ma, R.; Martínez-Pañeda, E. A Generalised, Multi-Phase-Field Theory for Dissolution-Driven Stress Corrosion Cracking and Hydrogen Embrittlement. J. Mech. Phys. Solids 2022, 166, 104951. [Google Scholar] [CrossRef] [Scilit]
  55. Carrara, P.; Ambati, M.; Alessi, R.; De Lorenzis, L. A Framework to Model the Fatigue Behavior of Brittle Materials Based on a Variational Phase-Field Approach. Comput. Methods Appl. Mech. Eng. 2020, 361, 112731. [Google Scholar] [CrossRef] [Scilit]
  56. Wu, J.-Y.; Nguyen, V.P. A Length Scale Insensitive Phase-Field Damage Model for Brittle Fracture. J. Mech. Phys. Solids 2018, 119, 20–42. [Google Scholar] [CrossRef] [Scilit]
  57. Williams, M.L. On the Stress Distribution at the Base of a Stationary Crack. J. Appl. Mech. 2021, 24, 109–114. [Google Scholar] [CrossRef] [Scilit]
  58. Sofronis, P.; McMeeking, R.M. Numerical Analysis of Hydrogen Transport near a Blunting Crack Tip. J. Mech. Phys. Solids 1989, 37, 317–350. [Google Scholar] [CrossRef] [Scilit]
  59. Krom, A.H.M.; Koers, R.W.J.; Bakker, A. Hydrogen Transport near a Blunting Crack Tip. J. Mech. Phys. Solids 1999, 47, 971–992. [Google Scholar] [CrossRef] [Scilit]
  60. Tvergaard, V.; Hutchinson, J.W. The Relation between Crack Growth Resistance and Fracture Process Parameters in Elastic-Plastic Solids. J. Mech. Phys. Solids 1992, 40, 1377–1397. [Google Scholar] [CrossRef] [Scilit]
  61. American Petroleum Institute | API | API Specification 5L, 46th Edition. Available online: https://www.api.org/products-and-services/standards/important-standards-announcements/standard-5l (accessed on 29 March 2026).
Figure 1. Single-Edge Notched Tension (SENT) specimen (with dimensions in mm) and boundary conditions. Blue indicates the mechanical boundary conditions, whereas orange denotes hydrogen-related initial and boundary conditions.
Energies 19 03449 g001
Figure 2. Comparison of the force–displacement response on the SENT specimen under four distinct environments, including an inert condition and hydrogen pressures of 0.1 MPa, 1.0 MPa, and 10 MPa [34].
Energies 19 03449 g002
Figure 3. Influence of moving chemical boundary conditions on a SENT specimen. The contours depict the evolution of phase-field damage ( ϕ , top row) and normalized hydrogen concentration ( C L / C 0 ). Results are shown for an environmental concentration at three applied displacements: (a) u = 0.00413 mm, (b) u = 0.00427 mm, and (c) u = 0.00448 mm.
Energies 19 03449 g003
Figure 4. Geometry of the cylindrical tensile specimen: (a) 3D visualization of the domain; (b) 2D axisymmetric cross-section detailing the specimen dimensions (in mm). A sharp circumferential pre-crack (a0 = 0.5 mm) is introduced at the outer radius (R = 5.0 mm).
Energies 19 03449 g004
Figure 5. Comparison of load–displacement curves for the API 5L X65 specimen subjected to various hydrogen–methane blending ratios (5%, 10%, and 15% H 2 ), pure H 2 and inert condition at a constant total pressure of P = 7.5 MPa.
Energies 19 03449 g005
Figure 6. The peak load ( F m a x ) vs. hydrogen volume fraction at 7.5 MPa and 10 MPa.
Energies 19 03449 g006
Figure 7. Numerical experiments on a boundary layer geometry where a remote K I is imposed. Blue indicates the mechanical boundary conditions, whereas orange denotes hydrogen-related initial and boundary conditions.
Energies 19 03449 g007
Figure 8. Influence of hydrogen pressure on the crack growth resistance (R-curves) of API 5L X65 steel at 1, 5, 7.5, and 10 MPa compared to the inert.
Energies 19 03449 g008
Figure 9. Normalized R-curves for X65 pipeline steel under 7.5 MPa and 10 MPa hydrogen–methane blends.
Energies 19 03449 g009
Figure 10. Comparison of crack growth resistance for 10% H2 blends at 10 MPa utilizing inert versus methane.
Energies 19 03449 g010
Figure 11. Influence of steel grade on fracture resistance. The comparison between API 5L X65, X70, and X80.
Energies 19 03449 g011
Table 1. Mechanical and thermodynamic parameters for the phase-field fracture simulations.
ParameterSymbolValueUnitRef
Young’s modulus E 210GPa-
Poisson’s ratio ν 0.3--
Damage coefficient χ 0.89-[27,50]
Lattice diffusion coefficient D L 1.27 × 10 8 m2/s[34,51]
Partial molar volume V ¯ H 2 × 10 6 m3/ m o l [27,52]
Co-volume (Noble-Abel) b 1.584 × 10 5 m3/ m o l [46]
Hydrogen adsorption constant K H 2.9301 × 10 3 Pa−0.5-
Methane adsorption constant K C H 4 3 × 10 8 Pa−1-
Universal gas constant R g 8.314 J / ( m o l . K ) -
Temperature T 293.15K-
Table 2. Elastoplastic constitutive properties and hydrogen trapping parameters [34,51].
ParameterSymbolValueUnit
Lattice site density N L 5.1 × 10 29 1/m3
Binding energy (Trap 1, Dislocations) E b 1 50 k J / m o l
Trap density (Trap 1) N T 1 10 4   N L 1/m3
Binding energy (Trap 2, Grain Boundaries) E b 2 30 k J / m o l
Trap density (Trap 2) N T 2 10 2   N L 1/m3
Lattice parameter a 2.866 × 10 10 m
Dislocation generation coefficient γ 1 × 10 16 1/m2
Initial dislocation density ρ 0 1 × 10 10 1/m2
Disclaimer/Publisher’s Note: The statements, opinions and data contained in all publications are solely those of the individual author(s) and contributor(s) and not of MDPI and/or the editor(s). MDPI and/or the editor(s) disclaim responsibility for any injury to people or property resulting from any ideas, methods, instructions or products referred to in the content.