Article

Exergy-Based Techno-Economic and Environmental Assessment of Pumped Thermal Energy Storage Systems for Sustainable Rural Agriculture

Department of Mechanical Engineering, Federal University of Petroleum Resources, P.M.B. 1221, Effurun 330102, Delta State, Nigeria
*
Author to whom correspondence should be addressed.
Energies 2026, 19(14), 3379; https://doi.org/10.3390/en19143379
Submission received: 23 March 2026 / Revised: 28 May 2026 / Accepted: 8 July 2026 / Published: 17 July 2026
(This article belongs to the Section A: Sustainable Energy)

Abstract

Reliable and sustainable access to energy continues to pose a significant challenge for rural farms in African underprivileged areas, where traditional diesel generators are both economically and environmentally unfeasible. This research explores the potential of pumped thermal energy storage (PTES) systems utilizing a Rankine cycle for the preservation of farm produce, analyzing four configurations of reversible heat pump–organic Rankine cycle (HP–ORC) systems that employ R1234ze(E) as the working fluid: hot-storage cooled HP mode, air-cooled HP mode, basic ORC mode, and ORC mode with integrated electrical heaters. Despite the exploration of hybrid HP–ORC and reversible PTES configurations in the existing literature, there remains a significant lack of research focusing on their feasibility for energy services in rural agriculture, and the literature data remains insufficient for comprehensive decision-making on deployment for small-scale applications in rural settings. To bridge this gap, the thermodynamic performance was evaluated for the PTES configurations through exergy analysis, to measure system irreversibility and component losses. Also, an exergoeconomic assessment was conducted using the Specific Exergy Costing (SPECO) method, while environmental impacts were examined with Eco-Indicator 99, aimed primarily at decision-making for real-life application. The results indicate that the ORC mode with electric heater achieved the highest exergy efficiency at 31.7%, surpassing the hot-storage cooled HP mode by approximately 11 percentage points. The air-cooled ORC with electric heaters exhibited a thermal efficiency of 26.6% and reduced economic losses, while also demonstrating significantly lower environmental degradation compared to the hot-storage HP mode (1327 mpts/s). These results suggest that air-cooled HP-ORC configurations provide an optimal balance of technical, economic, and environmental performance, thereby promoting sustainable, localized energy solutions for rural agricultural practices.

1. Introduction

Energy serves as the foundation for human advancement and economic endeavors, supporting nearly every sector of contemporary society [1]. In the field of agriculture, energy is crucial not only for mechanized tasks but also for supplementary services such as the heating, cooling, and drying of agricultural products. While developed nations have increasingly utilized renewable resources like solar, wind, and hydrogen for energy services on farms, numerous developing areas encounter restricted or nonexistent access to grid electricity and lack the means to implement affordable off-grid alternatives, including storage due to the transient nature of several renewable energy resources [2]. This study is motivated by the socio-economic context of rural areas in Nigeria, where agricultural activities are predominantly smallholder-based and often located in off-grid or weak-grid regions. In such settings, access to reliable electricity is limited, and energy supply is commonly dependent on diesel generators, which are costly and environmentally unsustainable. The economic model is therefore characterized by low-income, energy-constrained users who require affordable, decentralized, and low-maintenance energy solutions. Consequently, this study focuses on renewable-energy-driven, self-sustained systems that can enhance agricultural productivity, reduce post-harvest losses, and support local energy autonomy.
The global necessity to decrease greenhouse gas emissions and address climate change highlights the urgent requirement for sustainable, locally applicable energy systems designed for rural agricultural use.
Pumped thermal energy storage (PTES) has surfaced as a viable method for storing thermal energy for later use, whether as electricity or heat. PTES systems have been executed utilizing Brayton and Rankine cycles for electricity generation and heat pumps for thermal purposes, contingent on operational needs [3]. PTES systems based on the Rankine cycle frequently utilize organic Rankine cycles (ORCs) with organic fluids for low-temperature scenarios, presenting benefits over traditional water-based cycles [4]. Recent developments in the design of thermodynamic components, such as reversible turbo machines and scroll expanders/compressors, allow PTES systems to function in dual or multi-purpose modes operating as either heat engines or heat pumps, although performance is highly dependent on specific cases and necessitates comprehensive design and off-design evaluations.
Also, PTES systems have relatively low geographic constraints and compatibility with renewable energy systems, making them a viable option for improving energy system flexibility and reliability [5,6]. Recent studies have explored the integration of heat pump–organic Rankine cycle (HP-ORC) configurations within PTES systems to enhance energy storage and recovery performance. These hybrid systems exploit the heat pump to upgrade thermal energy during the charging phase while the ORC converts stored heat back to electricity during discharge. Thermodynamic investigations indicate that such systems can achieve competitive performance with improved round-trip and exergy efficiencies when optimized operating parameters and heat storage conditions are employed [7,8]. Several researchers have also performed thermo-economic assessments of PTES technologies, focusing on system design optimization, working fluid selection, and thermal storage temperatures. Comparative studies have demonstrated that PTES configurations using ORCs can achieve relatively low levelized costs of storage while maintaining acceptable energy and exergy efficiencies, making them attractive for integrating intermittent renewable energy sources [9,10].
Recent studies have further emphasized the importance of exergy-based analysis in identifying system inefficiencies. For instance, Madhi et al. (2025) [11] conducted an experimental investigation on a graphene-based nanofluid-enhanced photovoltaic/thermal (PV/T) system, demonstrating that exergy analysis provides deeper insight into irreversibility sources compared to conventional energy analysis. Their results showed that major exergy destruction occurs due to thermal gradients and heat transfer limitations within system components. This highlights the relevance of incorporating detailed exergy assessments when evaluating advanced thermal systems [11].
Furthermore, more recent studies have begun incorporating performance metrics and energy, exergy, economic, and environmental indicators to evaluate the sustainability of ORC-based PTES technologies [12]. Exergy analysis, rooted in the Second Law of Thermodynamics, has become a prevalent method for assessing heat pump and ORC systems, offering valuable insights into irreversibility and energy quality losses that extend beyond conventional first-law evaluations [13]. Exergoeconomic techniques, especially the Specific Exergy Costing (SPECO) method, merge cost analysis with exergy loss to pinpoint economically inefficient elements. In addition, exergoenvironmental assessment, frequently employing the Eco-Indicator 99 framework, measures environmental repercussions such as greenhouse gas emissions and resource consumption [14].
These analyses highlight the potential of PTES systems to integrate low-grade heat sources and renewable energy resources, thereby improving energy dispatchability and reducing environmental impacts. However, despite the exploration of hybrid HP–ORC and reversible PTES configurations in the existing literature, there remains a significant lack of research focusing on their feasibility for energy services in rural agriculture. Additionally, the literature data is insufficient on comprehensive exergy-based, exergoeconomic, and exergoenvironmental evaluations of PTES systems at the component level, which tends to limit deployment for small-scale applications in rural areas. To bridge this gap, this study aims to systematically analyze four reversible HP–ORC PTES configurations designed for off-grid farm-scale applications, with an emphasis on decision-making centered on the most cost-effective and environmentally sustainable options that could be deployed for real-life preservation of agricultural products in a rural farm settlement in Nigeria.

2. Materials and Methods

2.1. System Configuration

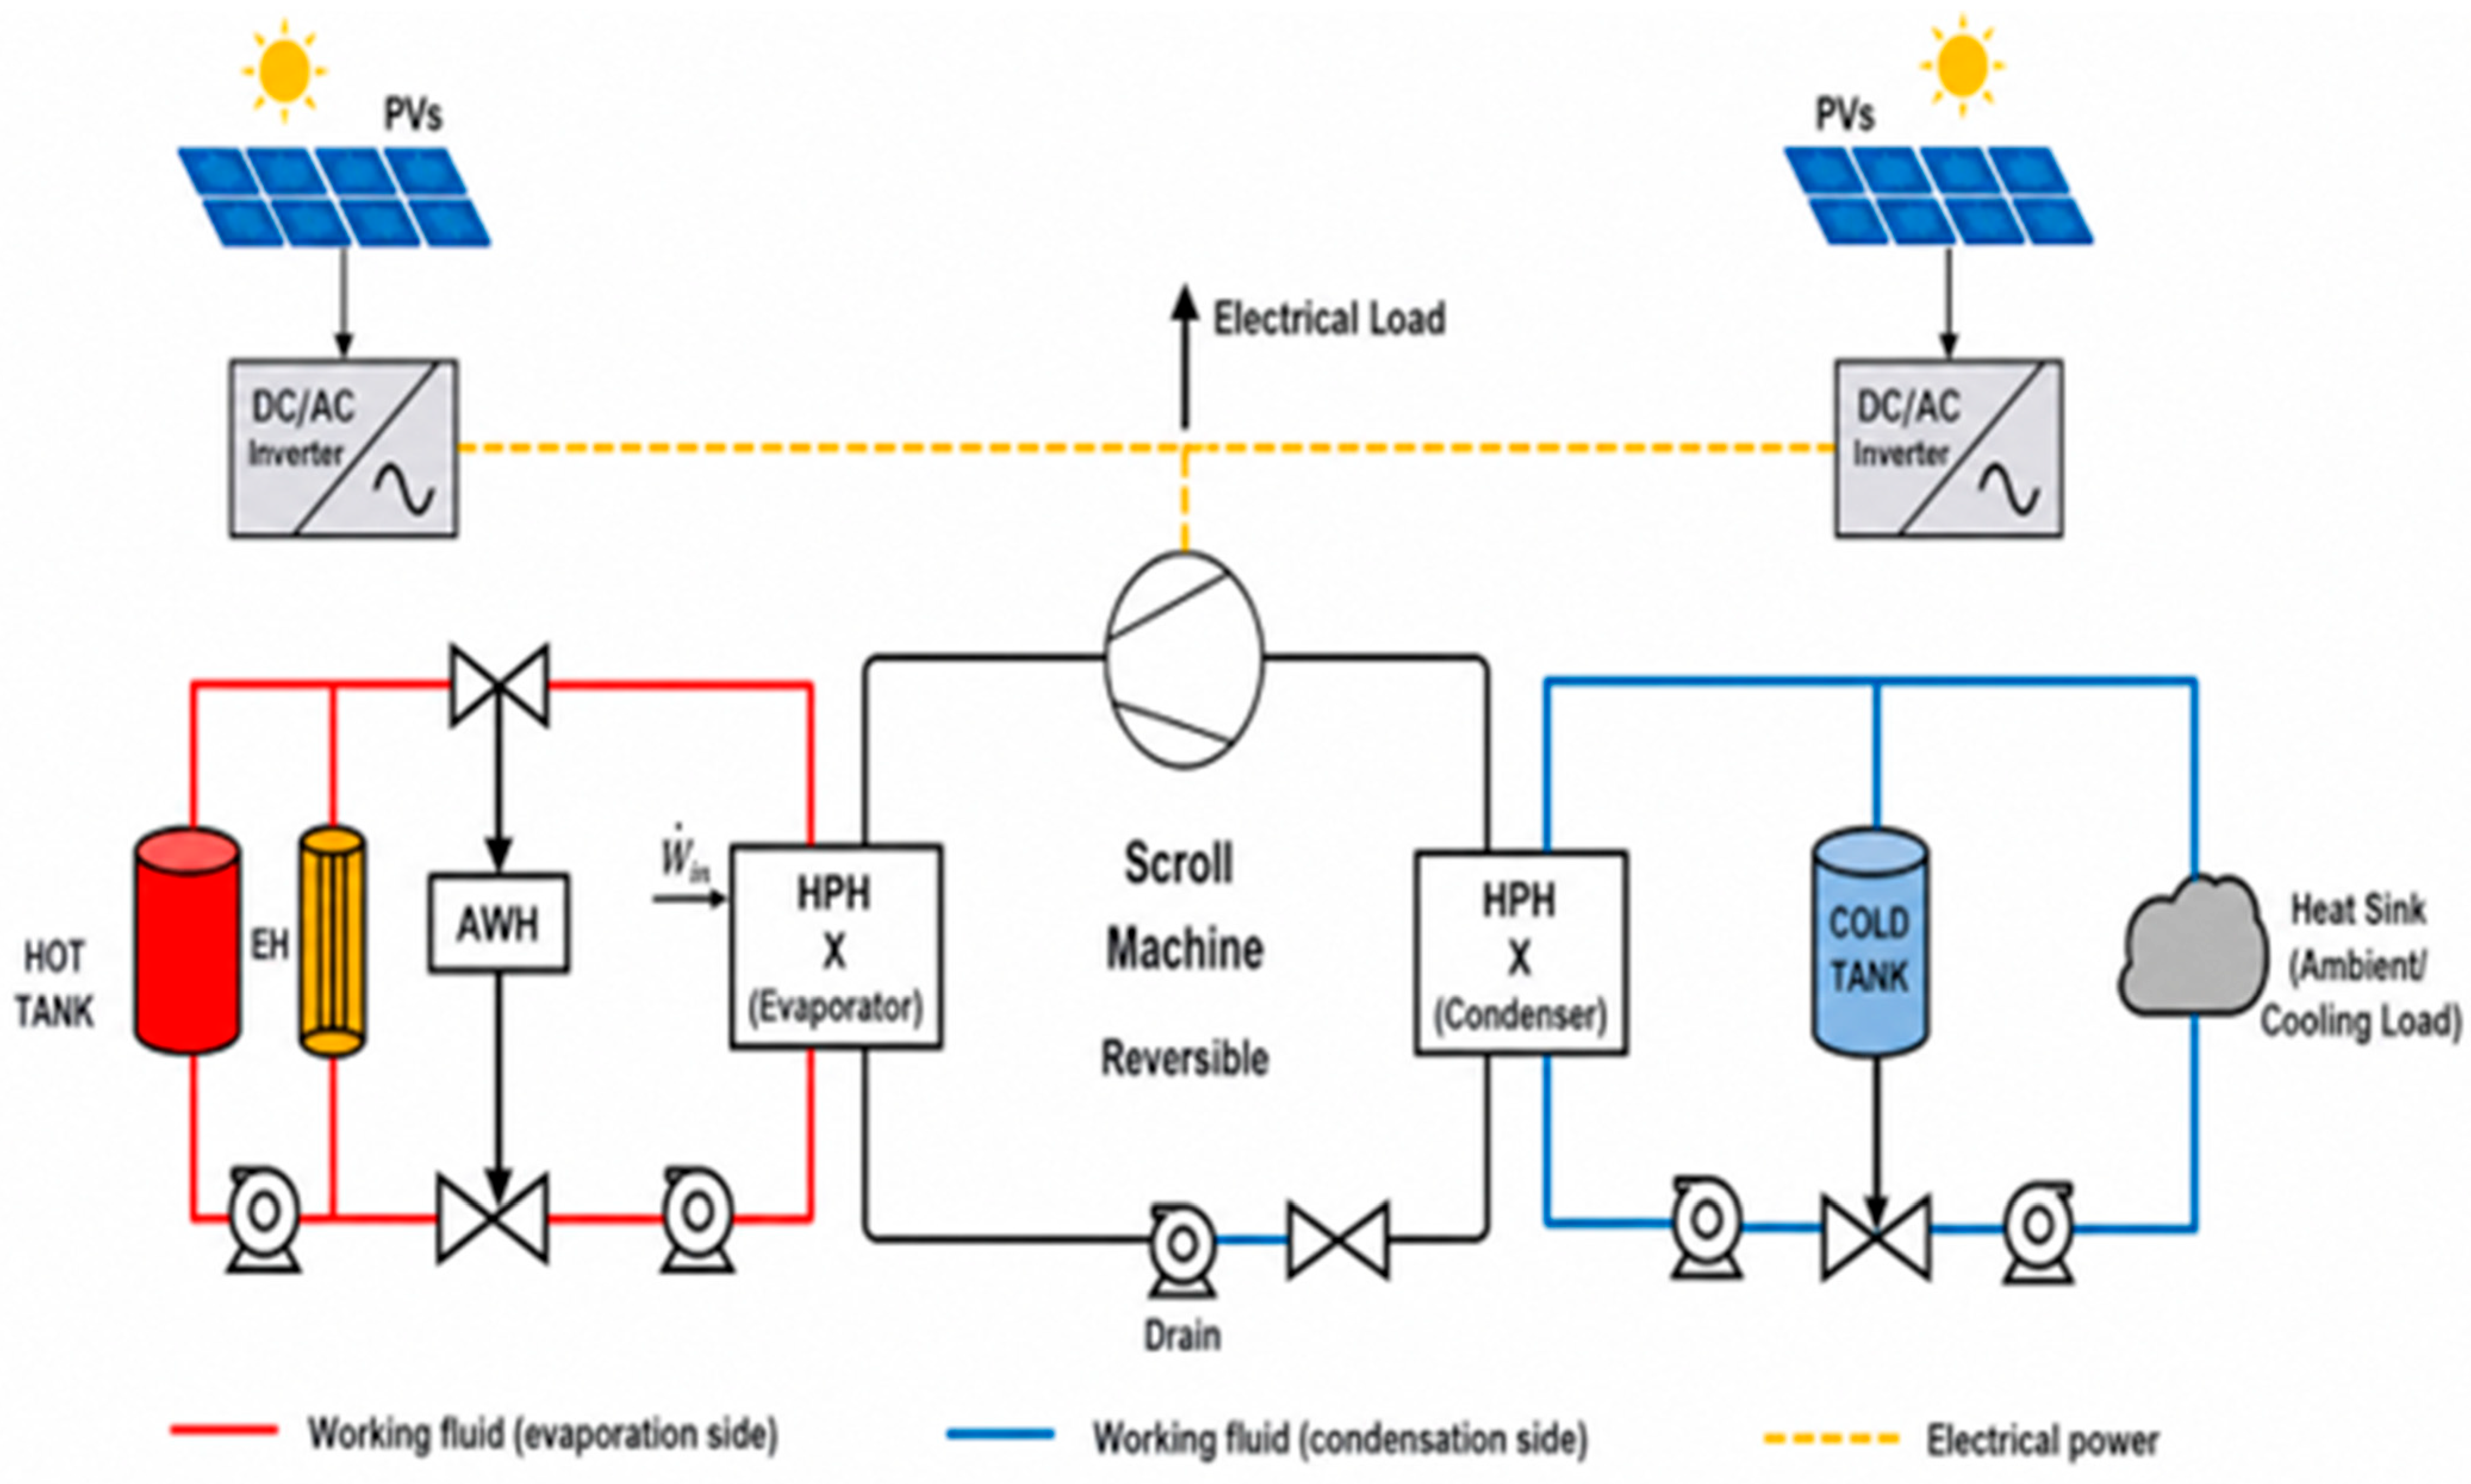
This study investigates a reversible heat pump (HP)–organic Rankine cycle (ORC) system integrated with pumped thermal energy storage (PTES) for sustainable rural agricultural applications. The system consists of three interconnected hydraulic loops: the reversible HP/ORC loop containing the organic working fluid, a hot thermal storage loop, and an ice storage loop. The hot-storage loop is shared between HP and ORC operating modes to enhance operational flexibility and energy utilization.
During HP operation, the high-pressure heat exchanger (HPHX) functions as a condenser, enabling simultaneous thermal energy storage and electricity management. When sufficient thermal energy is available in the hot-storage tank and the battery is not fully charged, the ORC mode utilizes both the hot and ice storage loops to maximize energy recovery and power generation.
To improve heat transfer effectiveness, the air–water heat exchanger (AWHX) operates in a clockwise arrangement, while the ORC loop functions in a counterclockwise direction. The reversible scroll machine requires directional control of the hot water and brine flow paths, which is achieved using two electrically actuated four-way valves. In HP mode, the system rejects heat to the ambient environment during air-cooled operation.
The system is powered by an associated rooftop photovoltaic (PV) array with a rated peak capacity of 5 kW. The PV panels convert solar irradiance into direct current (DC) electricity, which is subsequently conditioned through inverter-based ancillary electronics to provide grid-compatible alternating current (AC) power at the required voltage and frequency. The generated electricity supplies the compressor, pumps, control units, and auxiliary components of the HP–ORC system, while excess electrical energy is stored in the battery through a bidirectional battery management system. In ORC operation, the electrical heater can additionally utilize PV-generated electricity to support thermal input requirements.
The ice storage unit performs a dual thermodynamic role within the system. In HP mode, it acts as an evaporator by absorbing heat from the brine loop and enabling cold energy storage through ice formation. In ORC mode, the same unit functions as a condenser to facilitate heat rejection from the working fluid. Consequently, the cooling capacity of the reversible HP/ORC system depends on both the available PV power input, which varies with solar irradiance, and the selected operating mode (air-cooled or hot-storage cooled).
Reversible plate heat exchangers and the low-pressure heat exchanger (LPHX) also play significant roles in improving system thermal performance and operational efficiency [15]. A recent study by Bentao Guo et al. demonstrated that integrating reversible HP/ORC systems with thermal and electrical energy storage can substantially improve renewable energy utilization and operational flexibility under varying conditions [16]. The study further showed that optimized hybrid energy storage configurations can reduce dependence on grid- or diesel-based electricity while enhancing techno-economic performance for decentralized applications. This previous study provides the foundational framework for the present work, which extends the investigation toward an exergy-based techno-economic and environmental assessment of PTES systems for sustainable rural agricultural applications in Delta State, Nigeria.
The complete system schematic, shown in Figure 1, comprises the evaporator, reversible scroll machine, expansion valve, pump, high-temperature heat exchanger (HTHX), and low-temperature heat exchanger (LTHX).

2.2. Mathematical Formulation of the System

2.2.1. Energy Modeling

The mass conservation and first law of thermodynamics establish the mass and energy balance for the reversible HP–ORC system, respectively, equating, based on steady-state assumptions, total mass and energy in and out of each component and, thus, the system.
M i n = M o u t ; E i n = E o u t

2.2.2. Exergy Modeling

Exergy analysis, based on the Second Law of Thermodynamics, evaluates the quality of energy and quantifies system irreversibilities. The conventional exergy balance model was applied in the study, as shown in Equation (2).
m ˙ i e i + Q ˙ 1 T a T c = m ˙ o e o + W ˙ + I ˙ ,
where m ˙ represents the mass flow rate (kg/s); Q ˙ is heat flow through component boundary; T a is the temperature of the environment; T c is the temperature at component boundary, at which heat is exchanged with the environment; e is the specific exergy of the stream; W ˙ is work rate of the component; and I ˙ is the rate of exergy destroyed in the component (irreversibility). Subscripts i and o represent inlet and exit to and from the component, respectively. Here, specific exergy coincides with the physical component of exergy, as follows:
e = ( h h o ) + T o ( s s o )
where h and s are the specific enthalpy and entropy at a state, and h0, s0, and T0 are reference environmental conditions. Component-level exergy analysis methods are reported in Table 1.

2.2.3. Exergoeconomic Modeling

The conventional Specific Exergy Costing (SPECO) approach was applied for exergoeconomic analysis in this study. The exergoeconomic balance equations (Equation (4)) consist of the cost balance equation provided, and the auxiliary equations written according to the F (fuel) rule and P (product) rule [17]. The capital and operational costs of the HP-ORC systems are analyzed. Costs are associated with equipment, installation, operation and maintenance using levelized cost methods.
ċ e + ċ w = ċ Q + ċ i + ż
with c, E ˙   and E ˙ q representing stream cost per unit exergy, stream total exergy rate, and exergy rate due to heat transfer with a component, respectively; c q and c w are cost per unit exergy of heat and work exchange with a component, respectively; and Z ˙ is the cost rate due to investment, operation and maintenance of a component, calculated as:
ż k =   ż K C I +   ż K O M =   C R F × r   ×   365   ×   24   ×   Z k     N
with the capital recovery factor (CRF) defined as in Equation (6).
CRF = K ( 1 + K ) n ( 1 + K ) n 1
where K is the interest rate, n is the lifespan, N represents the number of operation hours for the unit (N is 7000 h), maintenance factor ( r   = 1.06 ), and the CRF defines how much money need to be invested now in order to receive a fixed amount of money every year for a certain period. The main parameters considered for purchase equipment cost are reported in Table 2.
For exergoeconomic performance, the component relative cost ( r k ), which shows which equipment is the most expensive, and the exergoeconomic factor ( f k ), which compares the rate of investment cost ( Z , k ) with the rate of cost of irreversibility, were employed, as defined respectively in Equations (7) and (8).
r k = C p , k C f , k C f , k
f k = Z , k Z K + C p , k
The exergy cost equations defined for the different system components, and the corresponding auxiliary equations, are reported in Table 3.

2.2.4. Exergoenvironmental Modeling

In this analysis, the environmental impact balances are written for the system component as shown below:
p =   f + ( ý )
b p Ė p = b f Ė f + ( ý )
where p and f are the environmental impact rates associated with product and fuel, and b p   and   b f   are the corresponding environmental impacts per unit of exergy for product and fuel.
The component-related environmental impact ý, which considers the entire life cycle of the component, consists of the following contributions:
ý   =   ý C O +   ý O M +   ý D I
where ý C O is the environmental impact associated with construction, manufacturing, transport, and installation; ý O M is associated with operation and maintenance; and ý D I refers to environmental impact associated with disposal [18].
Environmental impact rate associated with the exergy destruction within the component ( D ) and the exergoenvironmental factor ( f b ) are then defined as in Equations (12) and (13), respectively.
D = b f Ė D
f b = ý ý + D
The total environmental impact associated with a component would be the sum: (ý + D ). The weight functions employed for the components are as follows:
Compressor: b w c o m = 6.106 (mpts/MJ)
Condenser: W c o n d e n s e r = 0.073 ( Ǭ   0.99 ).MW
Evaporator: W e v a p o r a t o r = 13.91 ( Ǭ   0.99 ).MW
The environmental impacts of air and water emissions are considered negligible and are therefore assigned to be zero value. The assessment focuses on two key metrics: the environmental impact rate (B), which represents the total environmental impact per unit of time (Pts/s or mPts/s), and the specific environmental impact (b), which denotes the average environmental impact per unit of exergy. The refrigerant R1234ze(E) is used as the fuel in this study. Its environmental impact will be quantified using the Eco-Indicator 99 methodology, allowing for a comprehensive evaluation of the system’s environmental effects. By adopting the Eco-Indicator 99 methodology, this study aligns with international standards, particularly ISO 14004, ensuring a robust and widely accepted framework for environmental impact assessment [19]. The data for different system components considered are reported in Table 4.

3. Model Validation and Simulation

The thermodynamic model was validated against published experimental data for similar HP and ORC systems. The R1234ze(E) HP model’s performance was compared to the experimental results of Belman-Flores et al. [20], in their experimental evaluation of system modifications to increase R1234ze(E) cooling capacity. Furthermore, the overall HP-ORC system model was validated against the experimental results for an R1234ze(E) ORC-VCC system [21], with an ORC thermal efficiency of 7.7%; this is consistent with the values obtained in this case: 6.8–9.23%. A satisfactory agreement between the simulation results and the experimental data was observed; the calculated COP of 2.88 for the air-cooled HP mode aligns well with the experimental range of 2.1–3.2 [22]. In their experimental investigation of a gas engine-driven heat pump for cooling and heating operation, the COP of 1.65–1.88 for the hot-storage cooled HP mode is consistent with performance levels reported for thermal storage [23,24,25]. In their experimental evaluation of a simple ice storage system for use in cooling greenhouses. This close agreement provides confidence in the accuracy and reliability of the simulation results.

4. Results and Discussion

4.1. Exergy Analysis Results

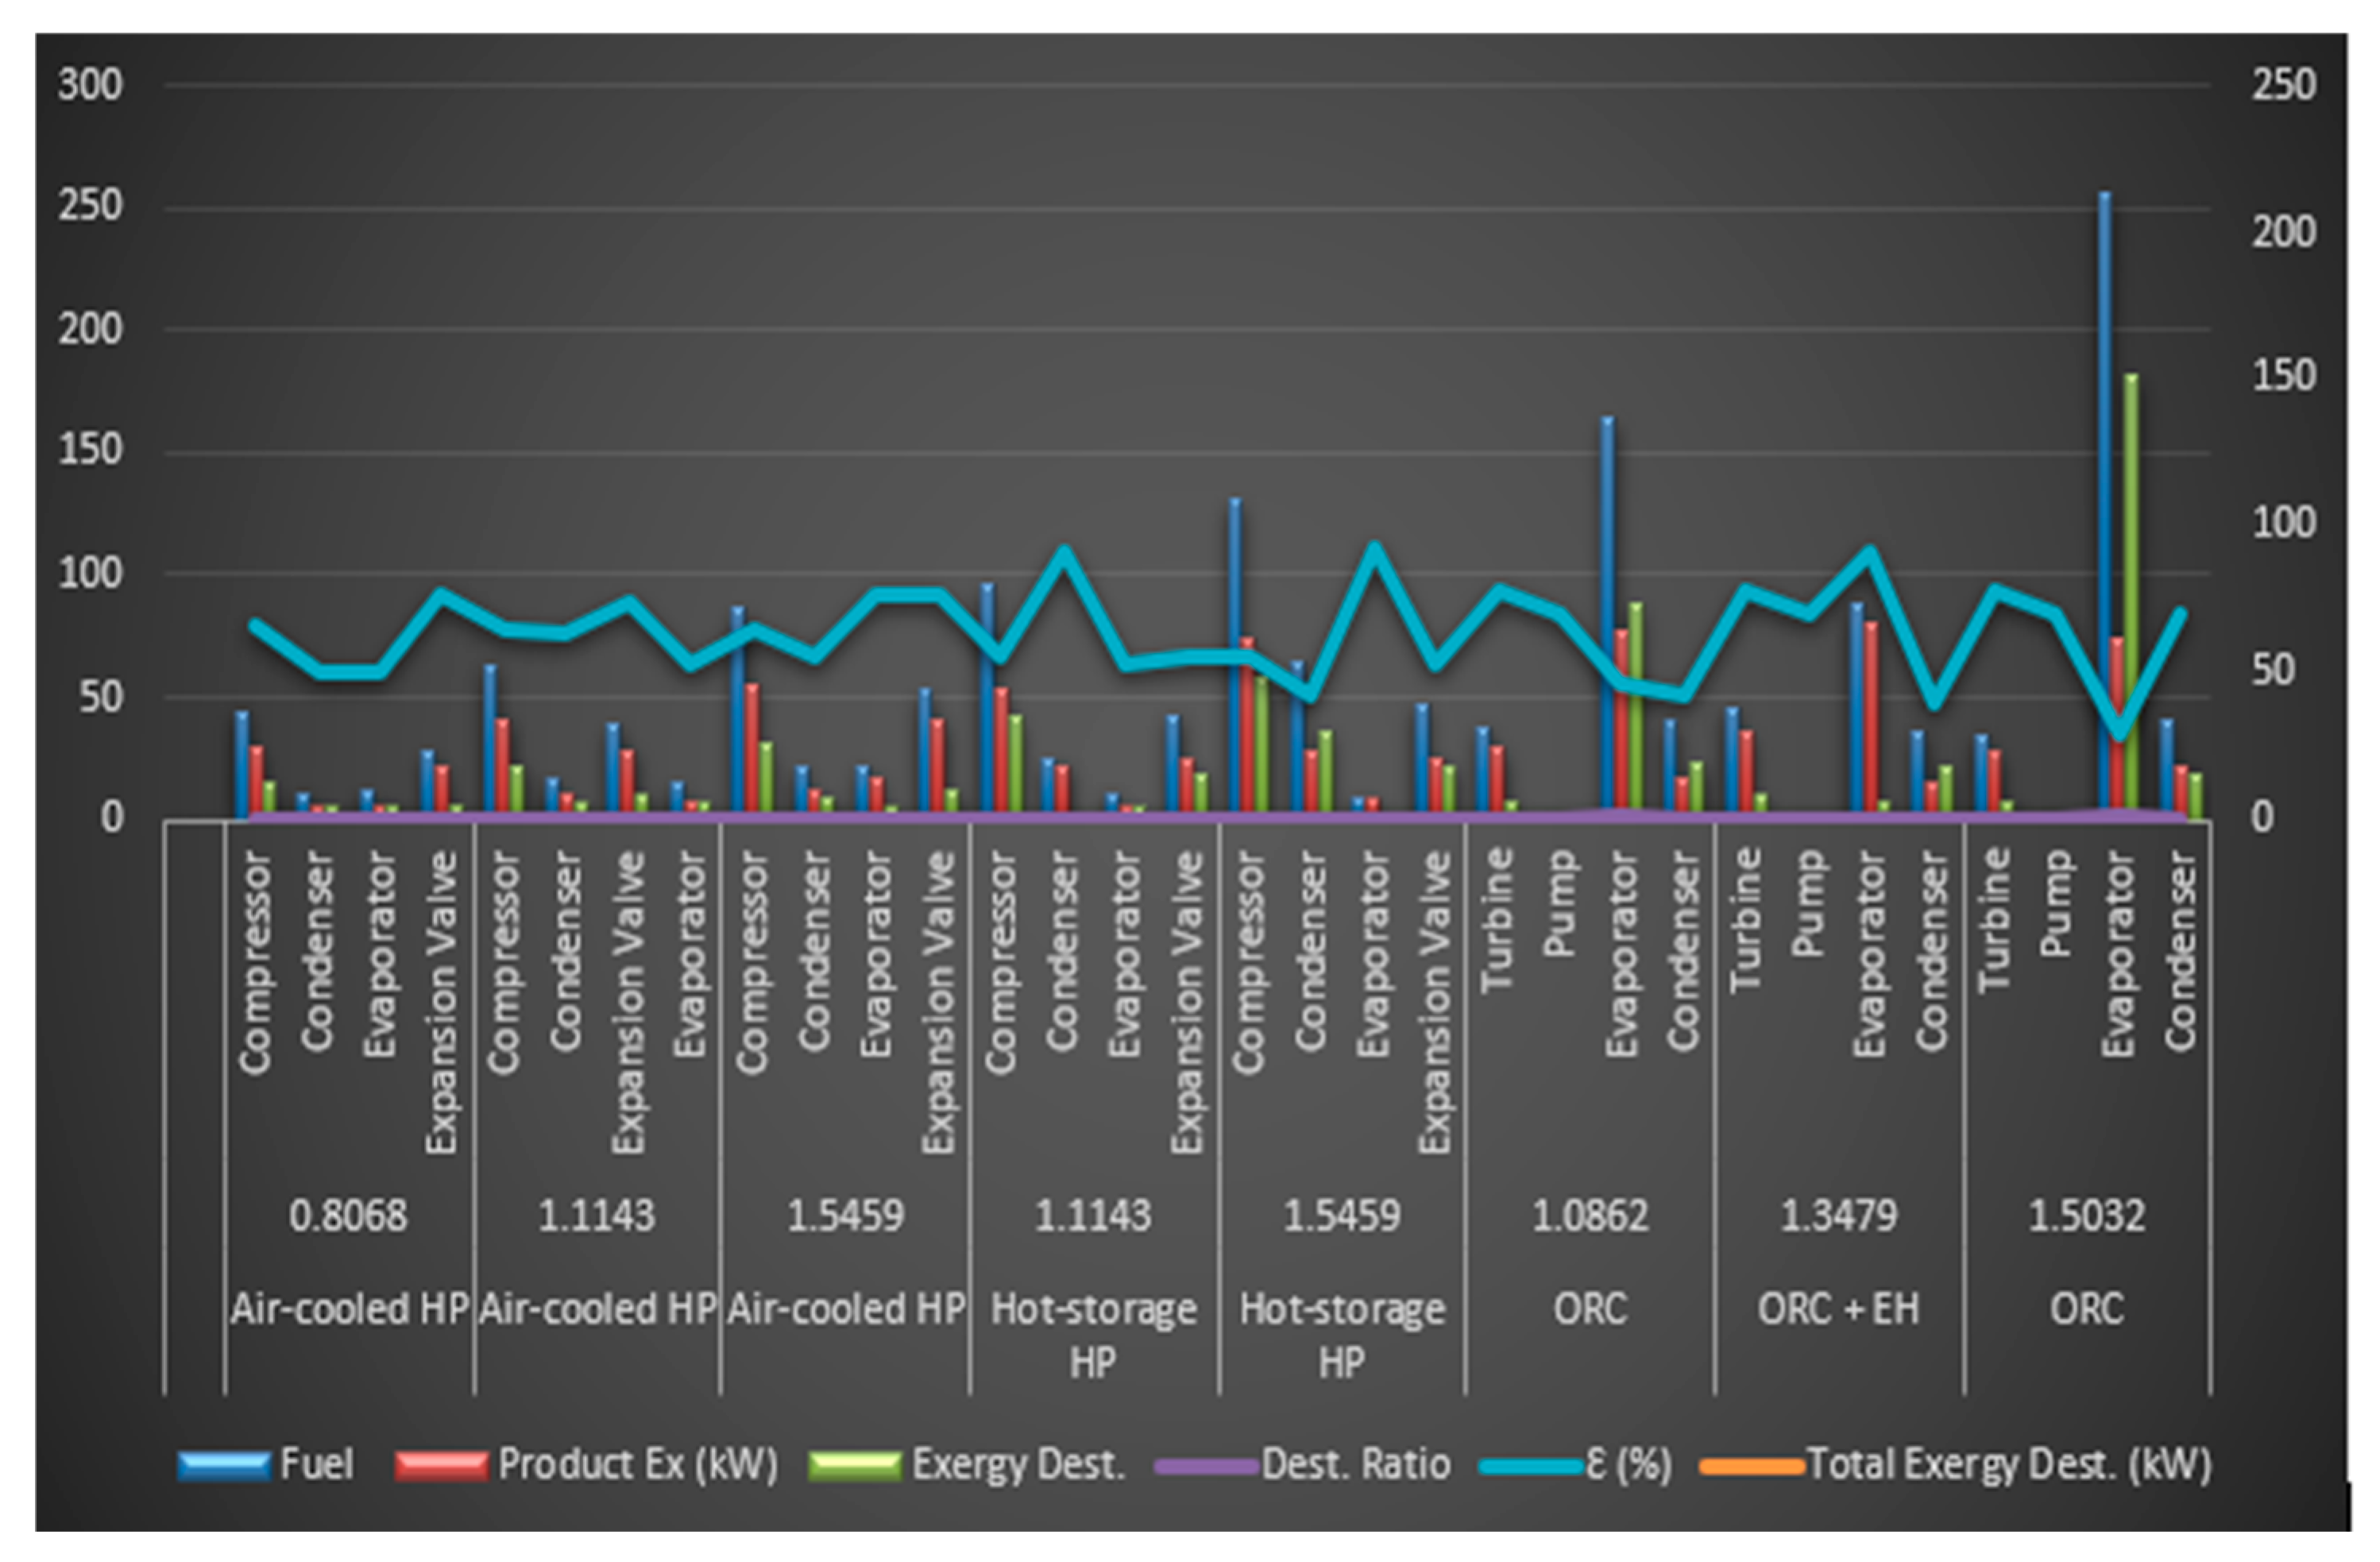
Figure 2 represents consolidated information for the evaluation of component-level and system-level irreversibility for the investigated pumped thermal energy storage (PTES) system operating in: air-cooled heat pump (HP) mode; hot-storage cooled HP mode; organic Rankine cycle (ORC) mode; and ORC integrated with electrical heater (ORC+EH) mode. The unified table presents, for each component and operating mass flow rate: fuel exergy rate (kW), product exergy rate (kW), exergy destruction rate (kW), exergy destruction ratio, component exergetic efficiency (%) and total system exergy destruction (kW). This structure enables direct comparison of irreversibility distribution across operational strategies.

Sensitivity Analysis

The refrigerant mass flow rates considered in this study (0.8068 kg/s, 1.1143 kg/s, and 1.5459 kg/s) were selected as a representative operating range of the reversible HP–ORC system. These values correspond to the minimum stable operating condition, a nominal design point, and the maximum feasible operating condition obtained from preliminary simulations and model convergence limits. This range was chosen to ensure numerical stability while capturing the system performance trends under low, medium, and high mass flow rate conditions for comprehensive thermodynamic and thermoeconomic analysis. Across all the mass flow rates investigated, the following trends are observed:
(i)
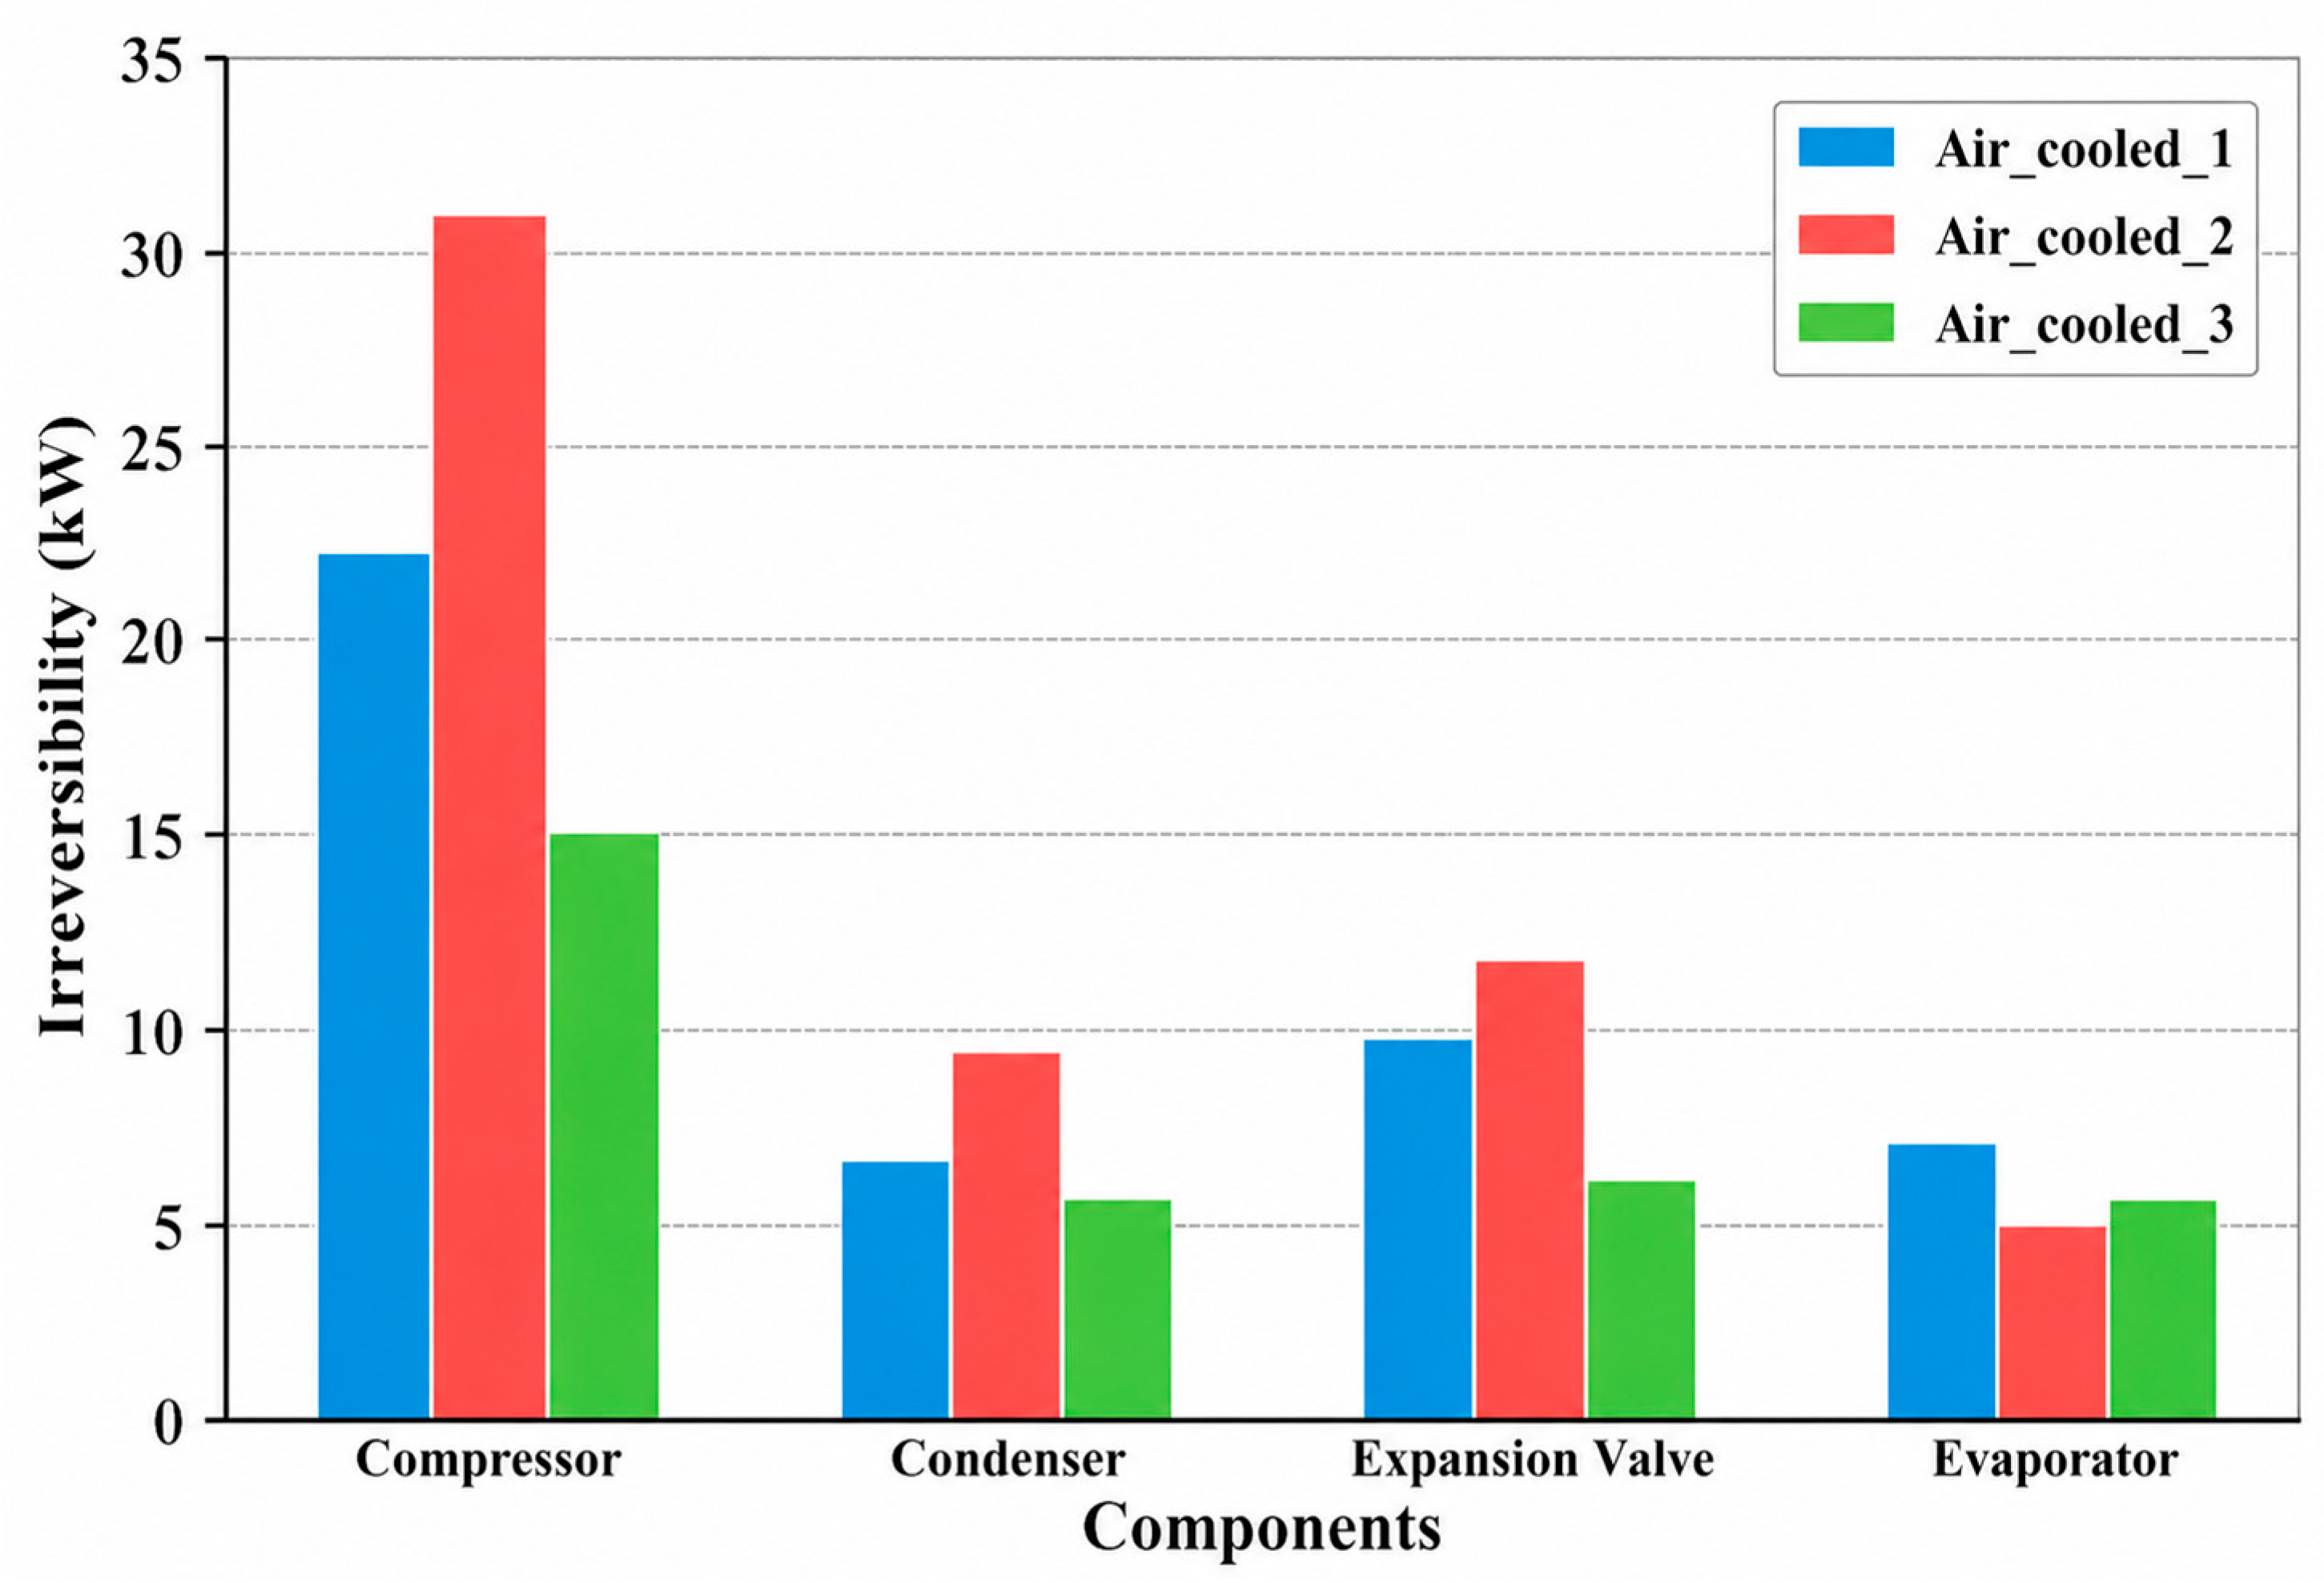
Dominant Source of Irreversibility: The compressor consistently exhibits the highest exergy destruction among the HP components. Exergy destruction increases with mass flow rate: 15.12 kW at 0.8068 kg/s; 22.36 kW at 1.1143 kg/s; and 30.82 kW at 1.5459 kg/s. This increase is attributed to greater mechanical work input and associated entropy generation at higher refrigerant circulation rates.
(ii)
Heat Exchanger Performance: The condenser and evaporator show moderate and relatively balanced irreversibility, reflecting thermal mismatch and finite temperature differences. Their destruction ratios remain significantly lower than that of the compressor.
(iii)
Expansion Valve: The expansion valve shows increasing destruction with mass flow rate, confirming throttling irreversibility as a non-negligible contributor in HP operation. In summary, the air-cooled HP mode demonstrates relatively distributed irreversibility, with no single component exceeding extreme dominance, contributing to its moderate exergetic efficiency.
The graph in Figure 3 compares the irreversibility (kW) of four components—compressor, condenser, expansion valve, and evaporator—in three air-cooled system cases (air-cooled 1 to 3). The compressor exhibits the highest irreversibility in all cases, with the largest value occurring in air-cooled 2, indicating the greatest energy losses in this component. The condenser and expansion valve show moderate irreversibility, while the evaporator has the lowest losses among the components. In summary, air-cooled 2 generally has higher irreversibility, whereas air-cooled 3 shows comparatively lower values, suggesting relatively better performance in terms of reduced energy losses.
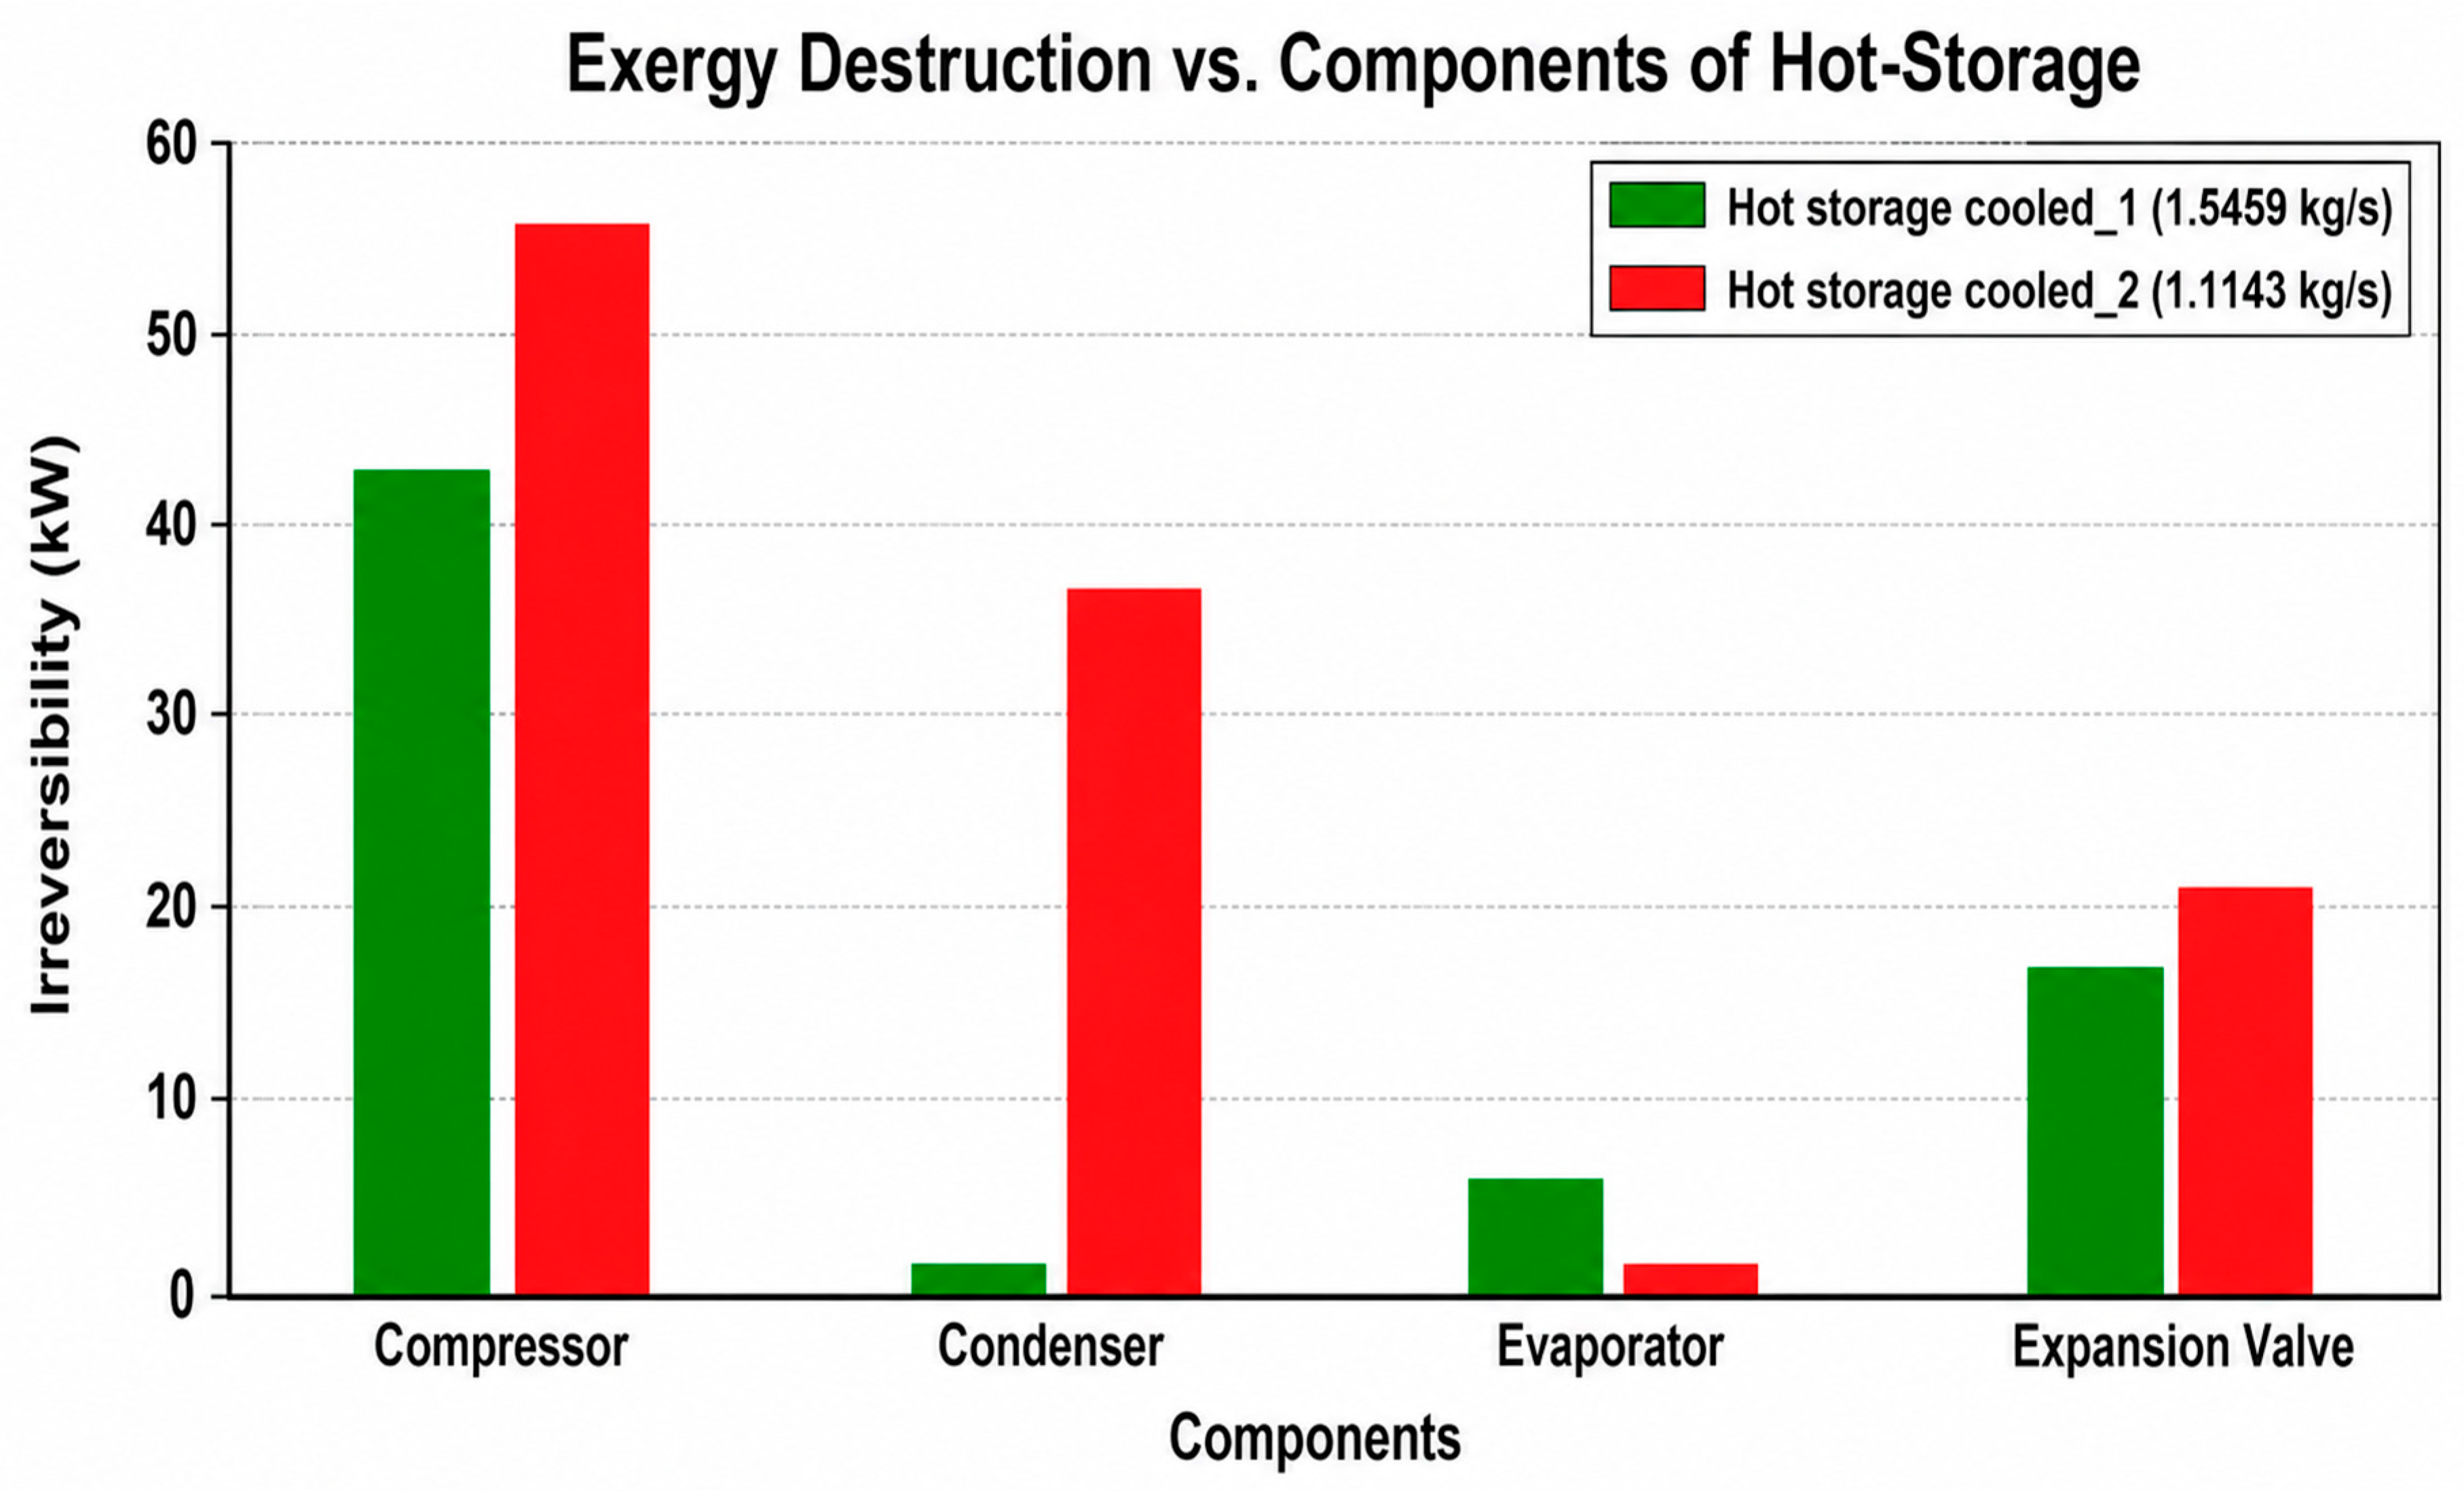
Figure 4 illustrates the exergy destruction (irreversibility in kW) across the main components of a heat pump compressor, condenser, evaporator, and expansion valve for two operating cases: hot-storage cooled 1 and hot-storage cooled 2. In both cases, the compressor shows the highest exergy destruction, with hot-storage cooled 2 having a significantly higher value than hot-storage cooled 1, indicating greater energy losses. The condenser also exhibits a substantial increase in irreversibility in hot-storage cooled 2, while it remains very low in hot-storage cooled 1. The expansion valve contributes moderate exergy destruction in both cases, slightly higher in hot-storage cooled 2. In contrast, the evaporator shows relatively low irreversibility, particularly in hot-storage cooled 2. Summarily, hot-storage cooled 2 experiences higher total exergy destruction, suggesting lower thermodynamic efficiency compared to hot-storage cooled 1.
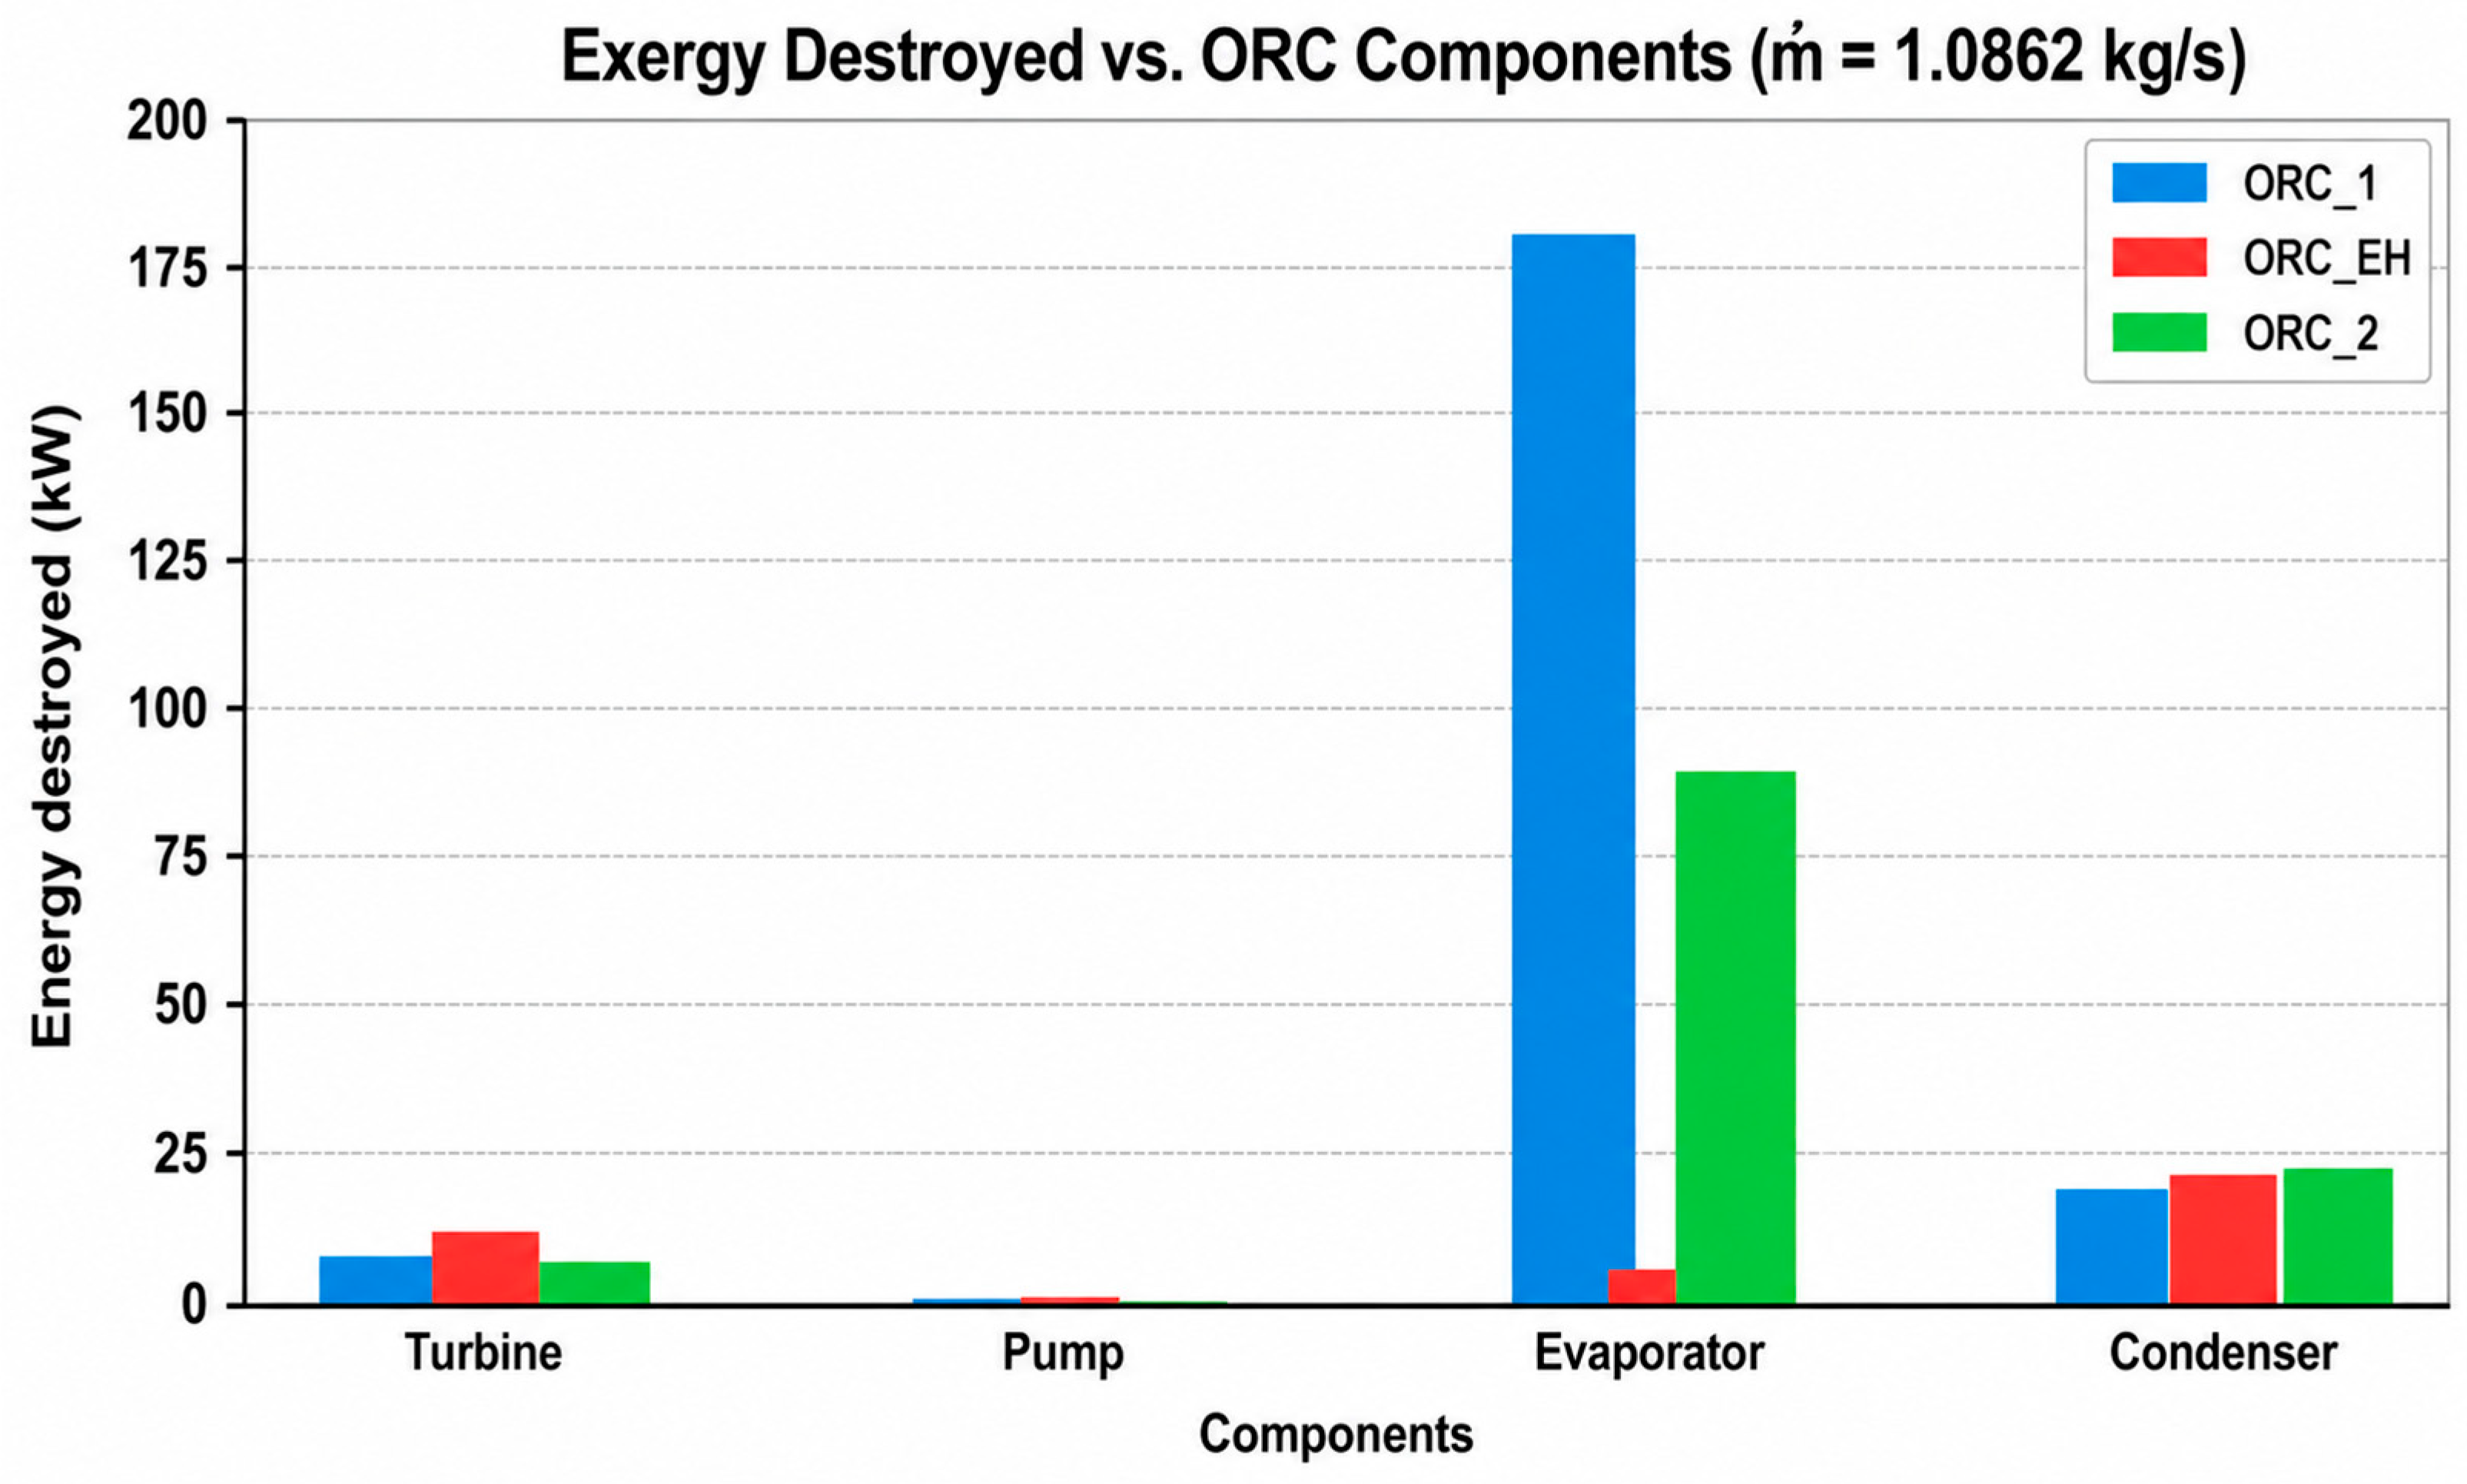
The exergy destruction in the main components of an organic Rankine cycle (ORC) turbine, pump, evaporator, and condenser for three configurations, ORC 1, ORC EH, and ORC 2, is presented in Figure 5. The evaporator exhibits the highest exergy destruction, particularly in ORC 1, indicating significant thermodynamic losses during the heat transfer process. In contrast, ORC EH shows a much lower evaporator exergy loss, suggesting improved heat utilization. The condenser contributes moderate exergy destruction in all three cases, with slightly higher values in ORC EH and ORC 2. The turbine shows relatively small losses, while the pump has the lowest exergy destruction, indicating minimal inefficiencies in that component. In summary, the results highlight that the evaporator is the main source of irreversibility in the ORC system, and reducing losses in this component would significantly improve system efficiency.

4.2. Exergoeconomic Analysis Results

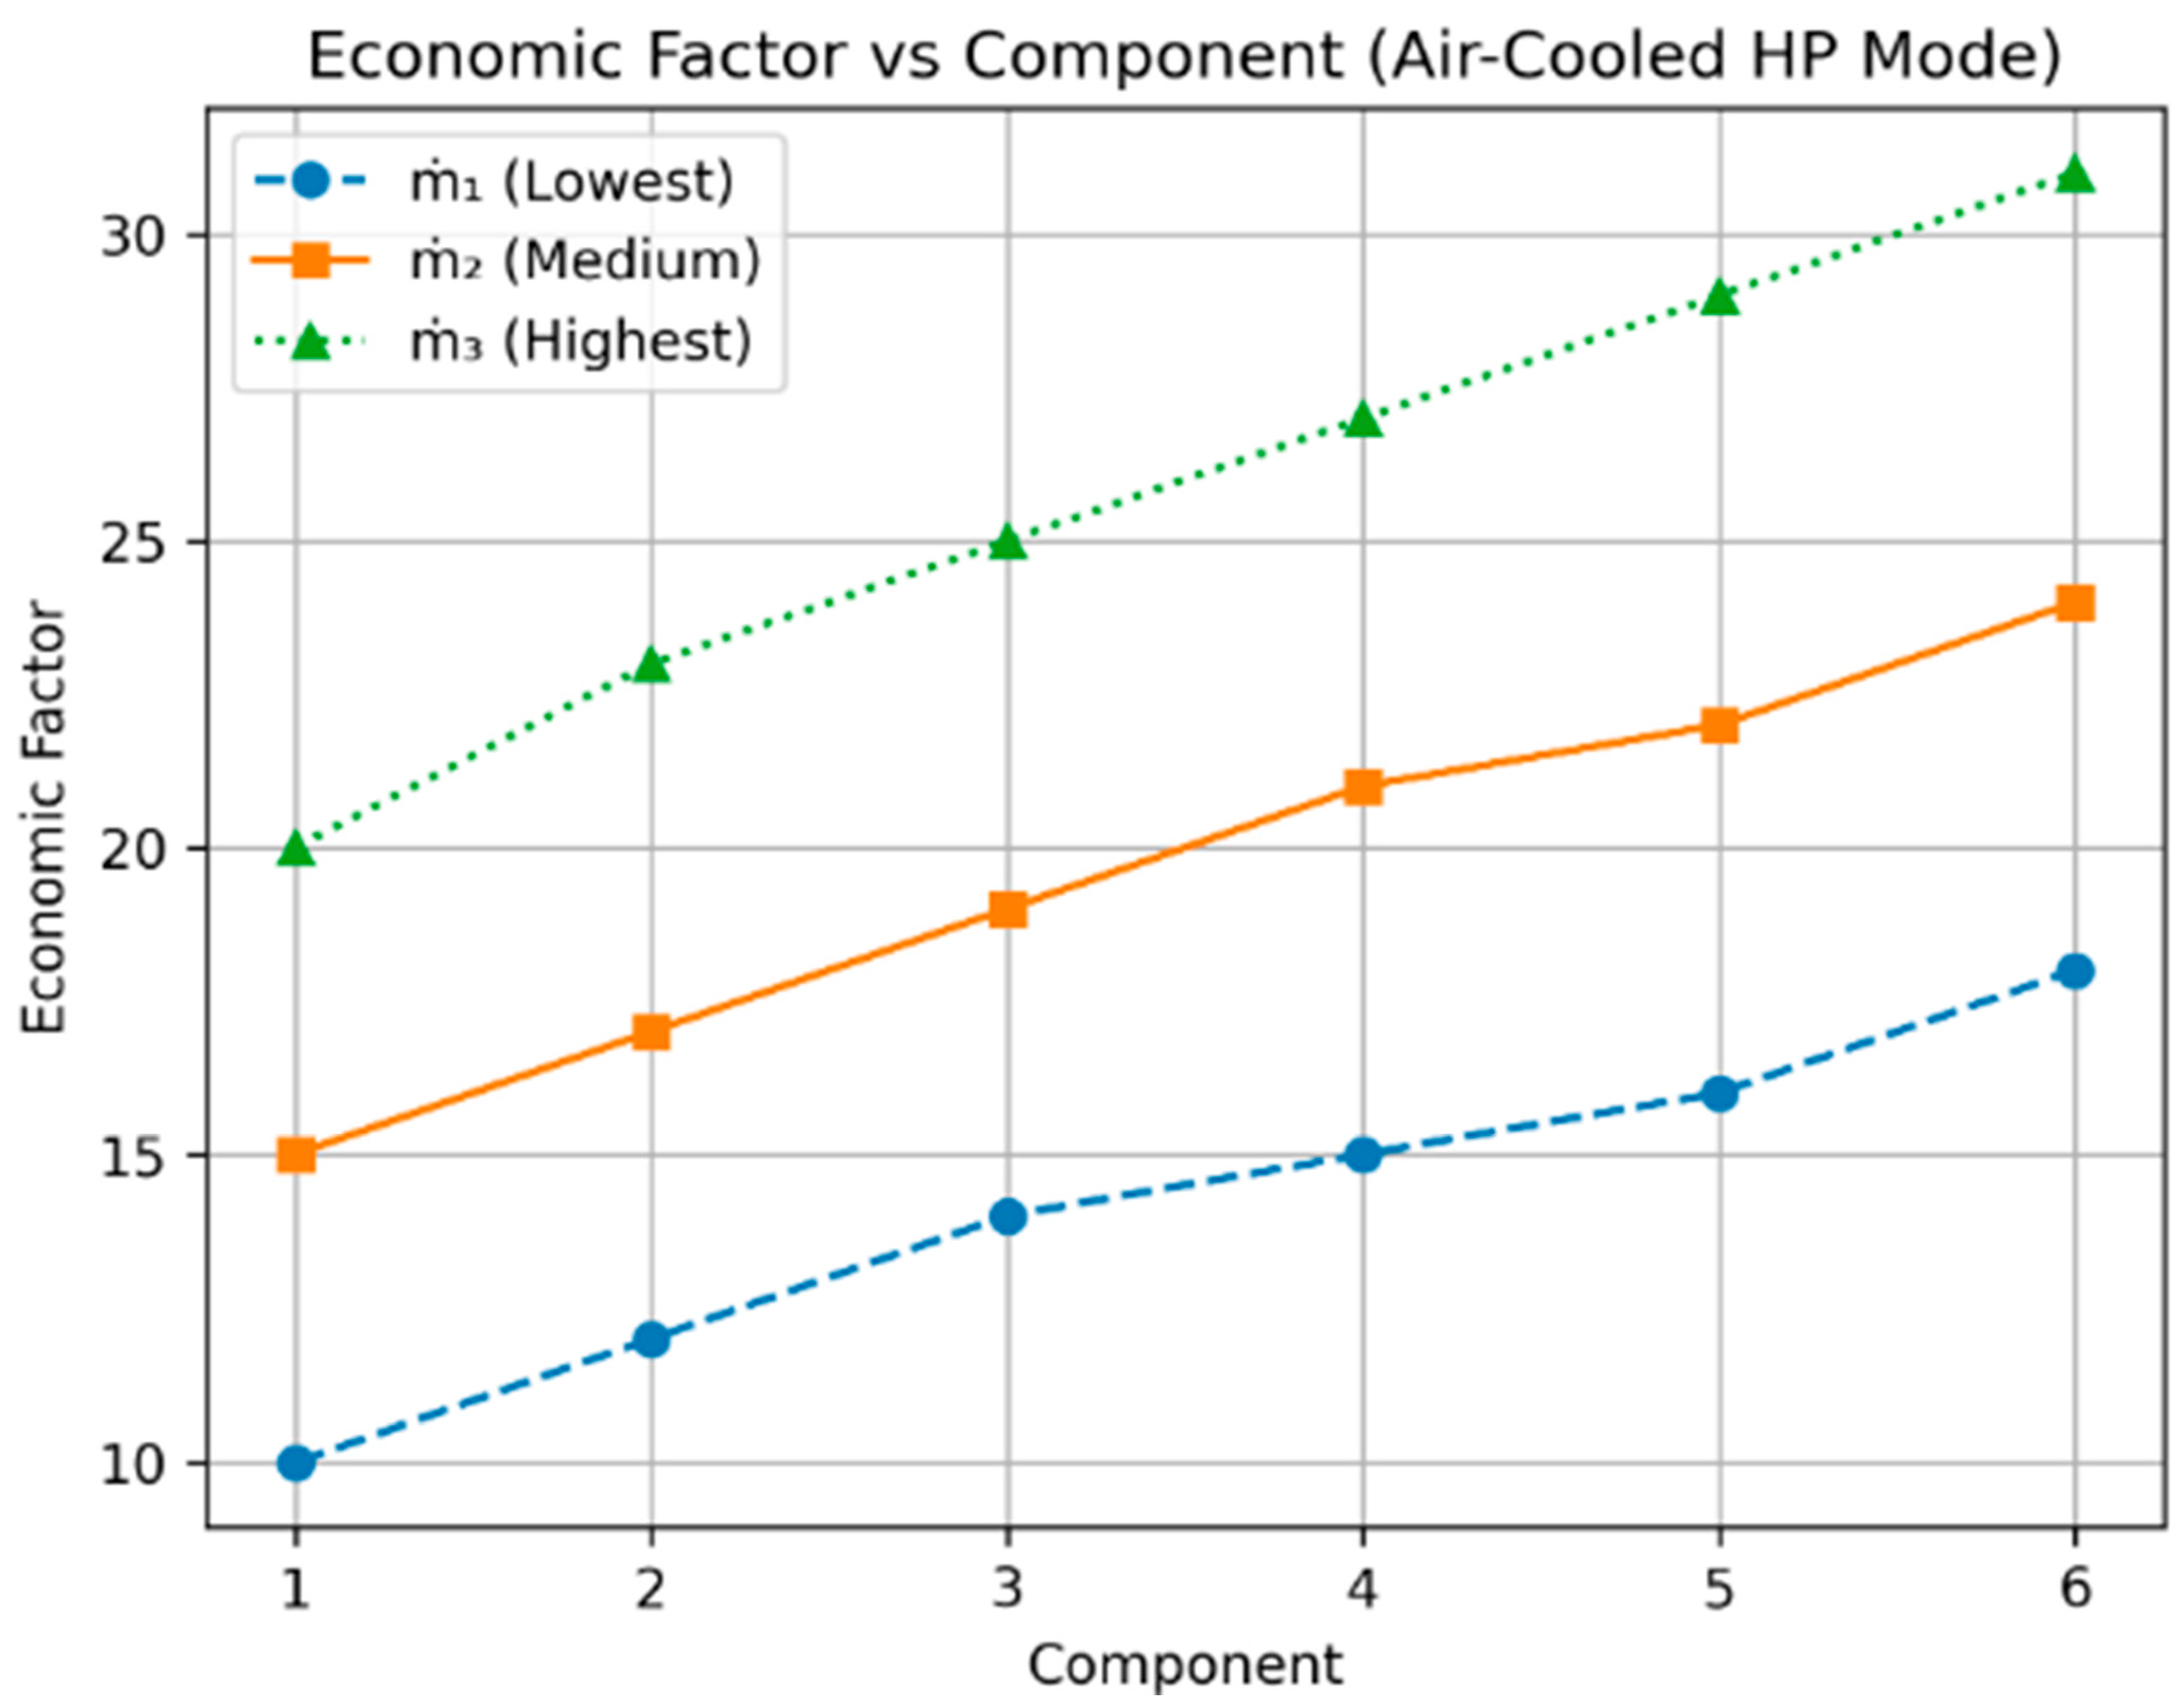
Figure 6 illustrates the distribution of the economic factor among the major components of the system across the three tested mass flow rates. The compressor clearly emerges as the primary contributor to the overall economic impact, followed by the evaporator and then the condenser, while the expansion valve contributes only a negligible share. The relative ordering of components remains consistent across the investigated mass flow rates, suggesting that variations within the tested range affect the magnitude of the economic factor without altering the relative economic significance of the system components.
The dominant contribution of the compressor can be attributed to its inherently high capital cost, substantial energy consumption, and potential maintenance requirements compared with other components in the system. The evaporator’s higher economic contribution relative to the condenser may reflect differences in heat transfer design requirements, surface area sizing, or refrigerant-side losses associated with the heat absorption process. In contrast, the minimal contribution of the expansion valve is expected, as it is typically a relatively simple and inexpensive component with low maintenance demands and limited influence on the overall economic distribution within the system.
From a practical standpoint, these findings indicate that optimization strategies should primarily focus on the compressor to achieve the greatest economic benefit. Improvements such as enhancing compressor efficiency, optimizing operating conditions, or implementing lifecycle cost optimization strategies could significantly reduce overall system costs. Secondary attention may be directed toward the evaporator through measures such as improved heat transfer surfaces and fouling mitigation strategies. Conversely, costly upgrades to the expansion valve are unlikely to yield significant economic benefits unless other operational or performance-related issues are identified. For more precise decision-making, further analysis using detailed percentage contributions and sensitivity or cost–benefit evaluations would help quantify the potential savings associated with targeted component improvements.
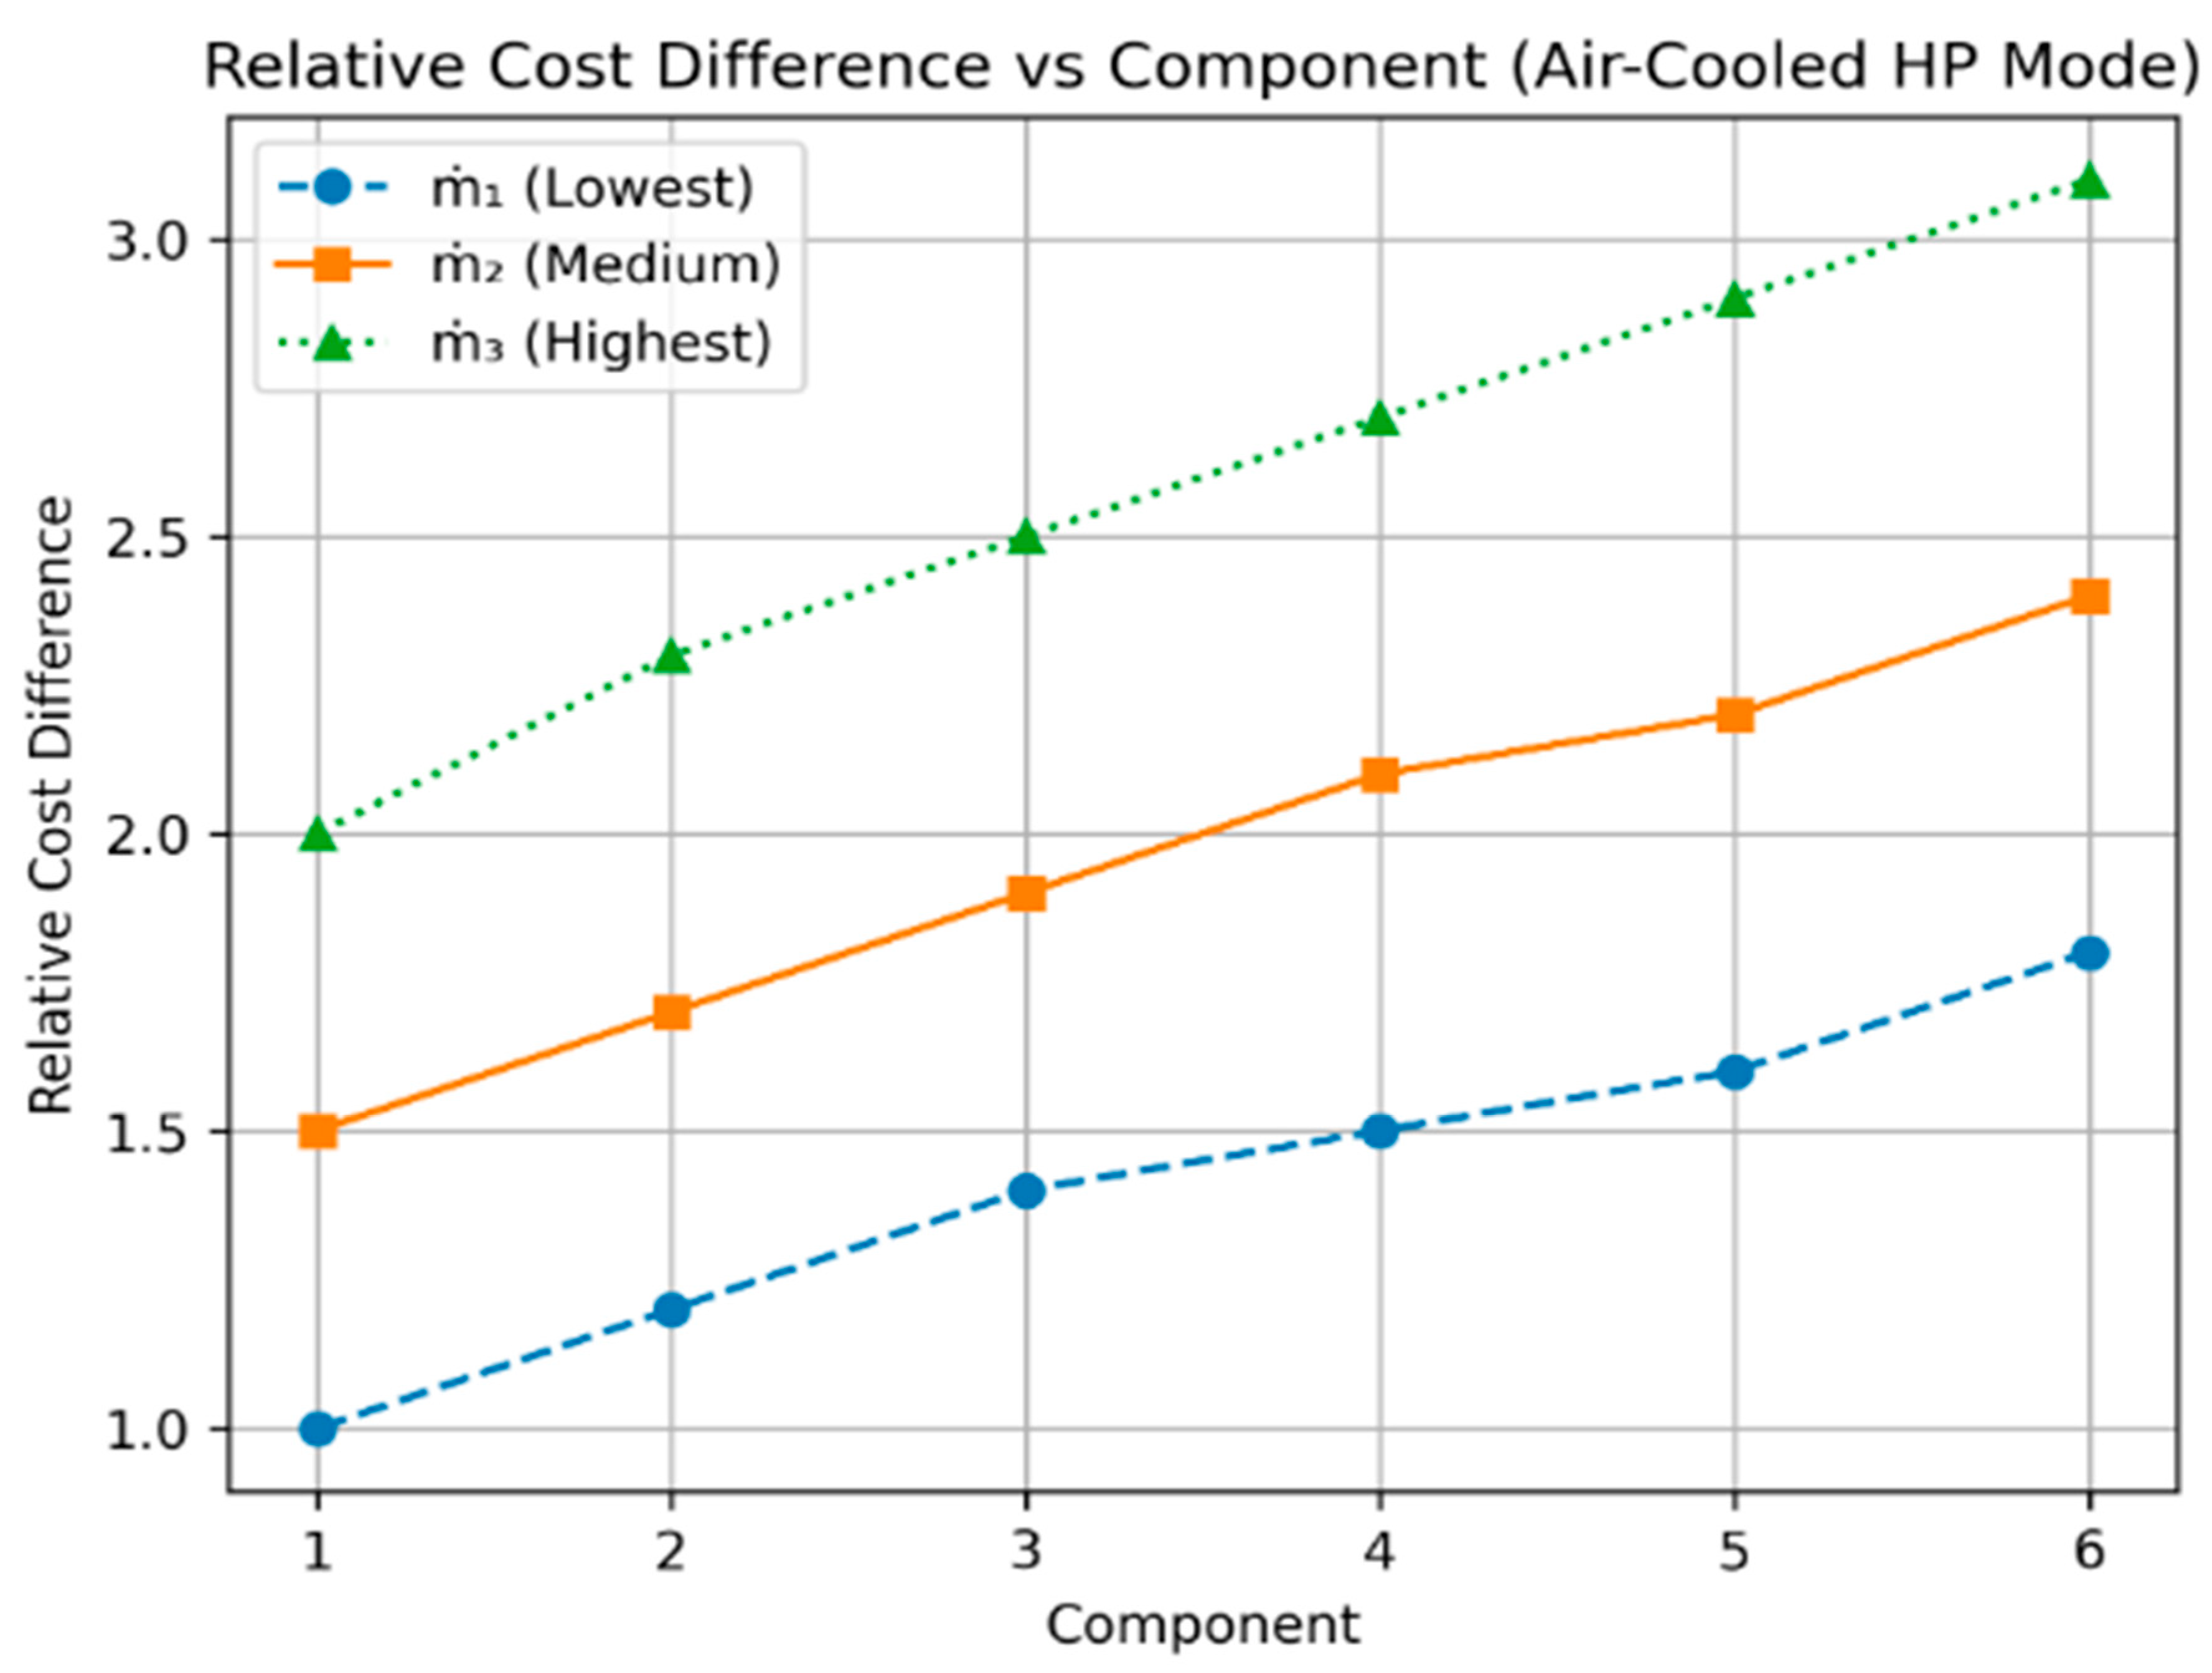
Figure 7 presents the variation in the relative cost contribution of the major system components at different refrigerant mass flow rates. The compressor consistently accounts for the largest share of the total system cost across all operating conditions; however, its relative contribution remains nearly constant over the investigated range of mass flow rates. This indicates that, while the compressor dominates the overall cost structure, its thermoeconomic performance is relatively insensitive to changes in flow rate.
In contrast, the condenser and evaporator exhibit smaller but more noticeable variations in their relative cost contributions with changing mass flow rate. This suggests that their thermoeconomic performance is more dependent on operating conditions, even though their overall impact on total system cost is less significant than that of the compressor.
A notable anomaly is observed in the expansion valve, which displays a significant increase in relative cost difference at the intermediate flow rate of 1.1143 kg/s, while remaining nearly negligible at the other flow conditions. This behavior may indicate a non-linear operational response within the system. One possible explanation is that the compressor operates away from its optimal design point at lower flow rates, leading to reduced efficiency and increased exergy-related costs. Similarly, the spike observed in the expansion valve may be associated with control instability, partial choking, or a mismatch between valve sizing and system operating conditions that become particularly relevant near the intermediate flow rate.
From a practical perspective, these results highlight the compressor as the component with the greatest potential for economic improvement. Enhancing compressor efficiency through design optimization, improved operating strategies, or the implementation of variable-speed drives could significantly reduce system costs. In addition, the unexpected increase in the expansion valve cost at 1.1143 kg/s warrants further investigation, including evaluation of valve sizing, pressure drop characteristics, and control settings. Conducting a detailed sensitivity analysis and collecting operational data across a finer range of mass flow rates would help confirm whether the observed spike is a consistent system behavior or the result of measurement or cost allocation uncertainties.
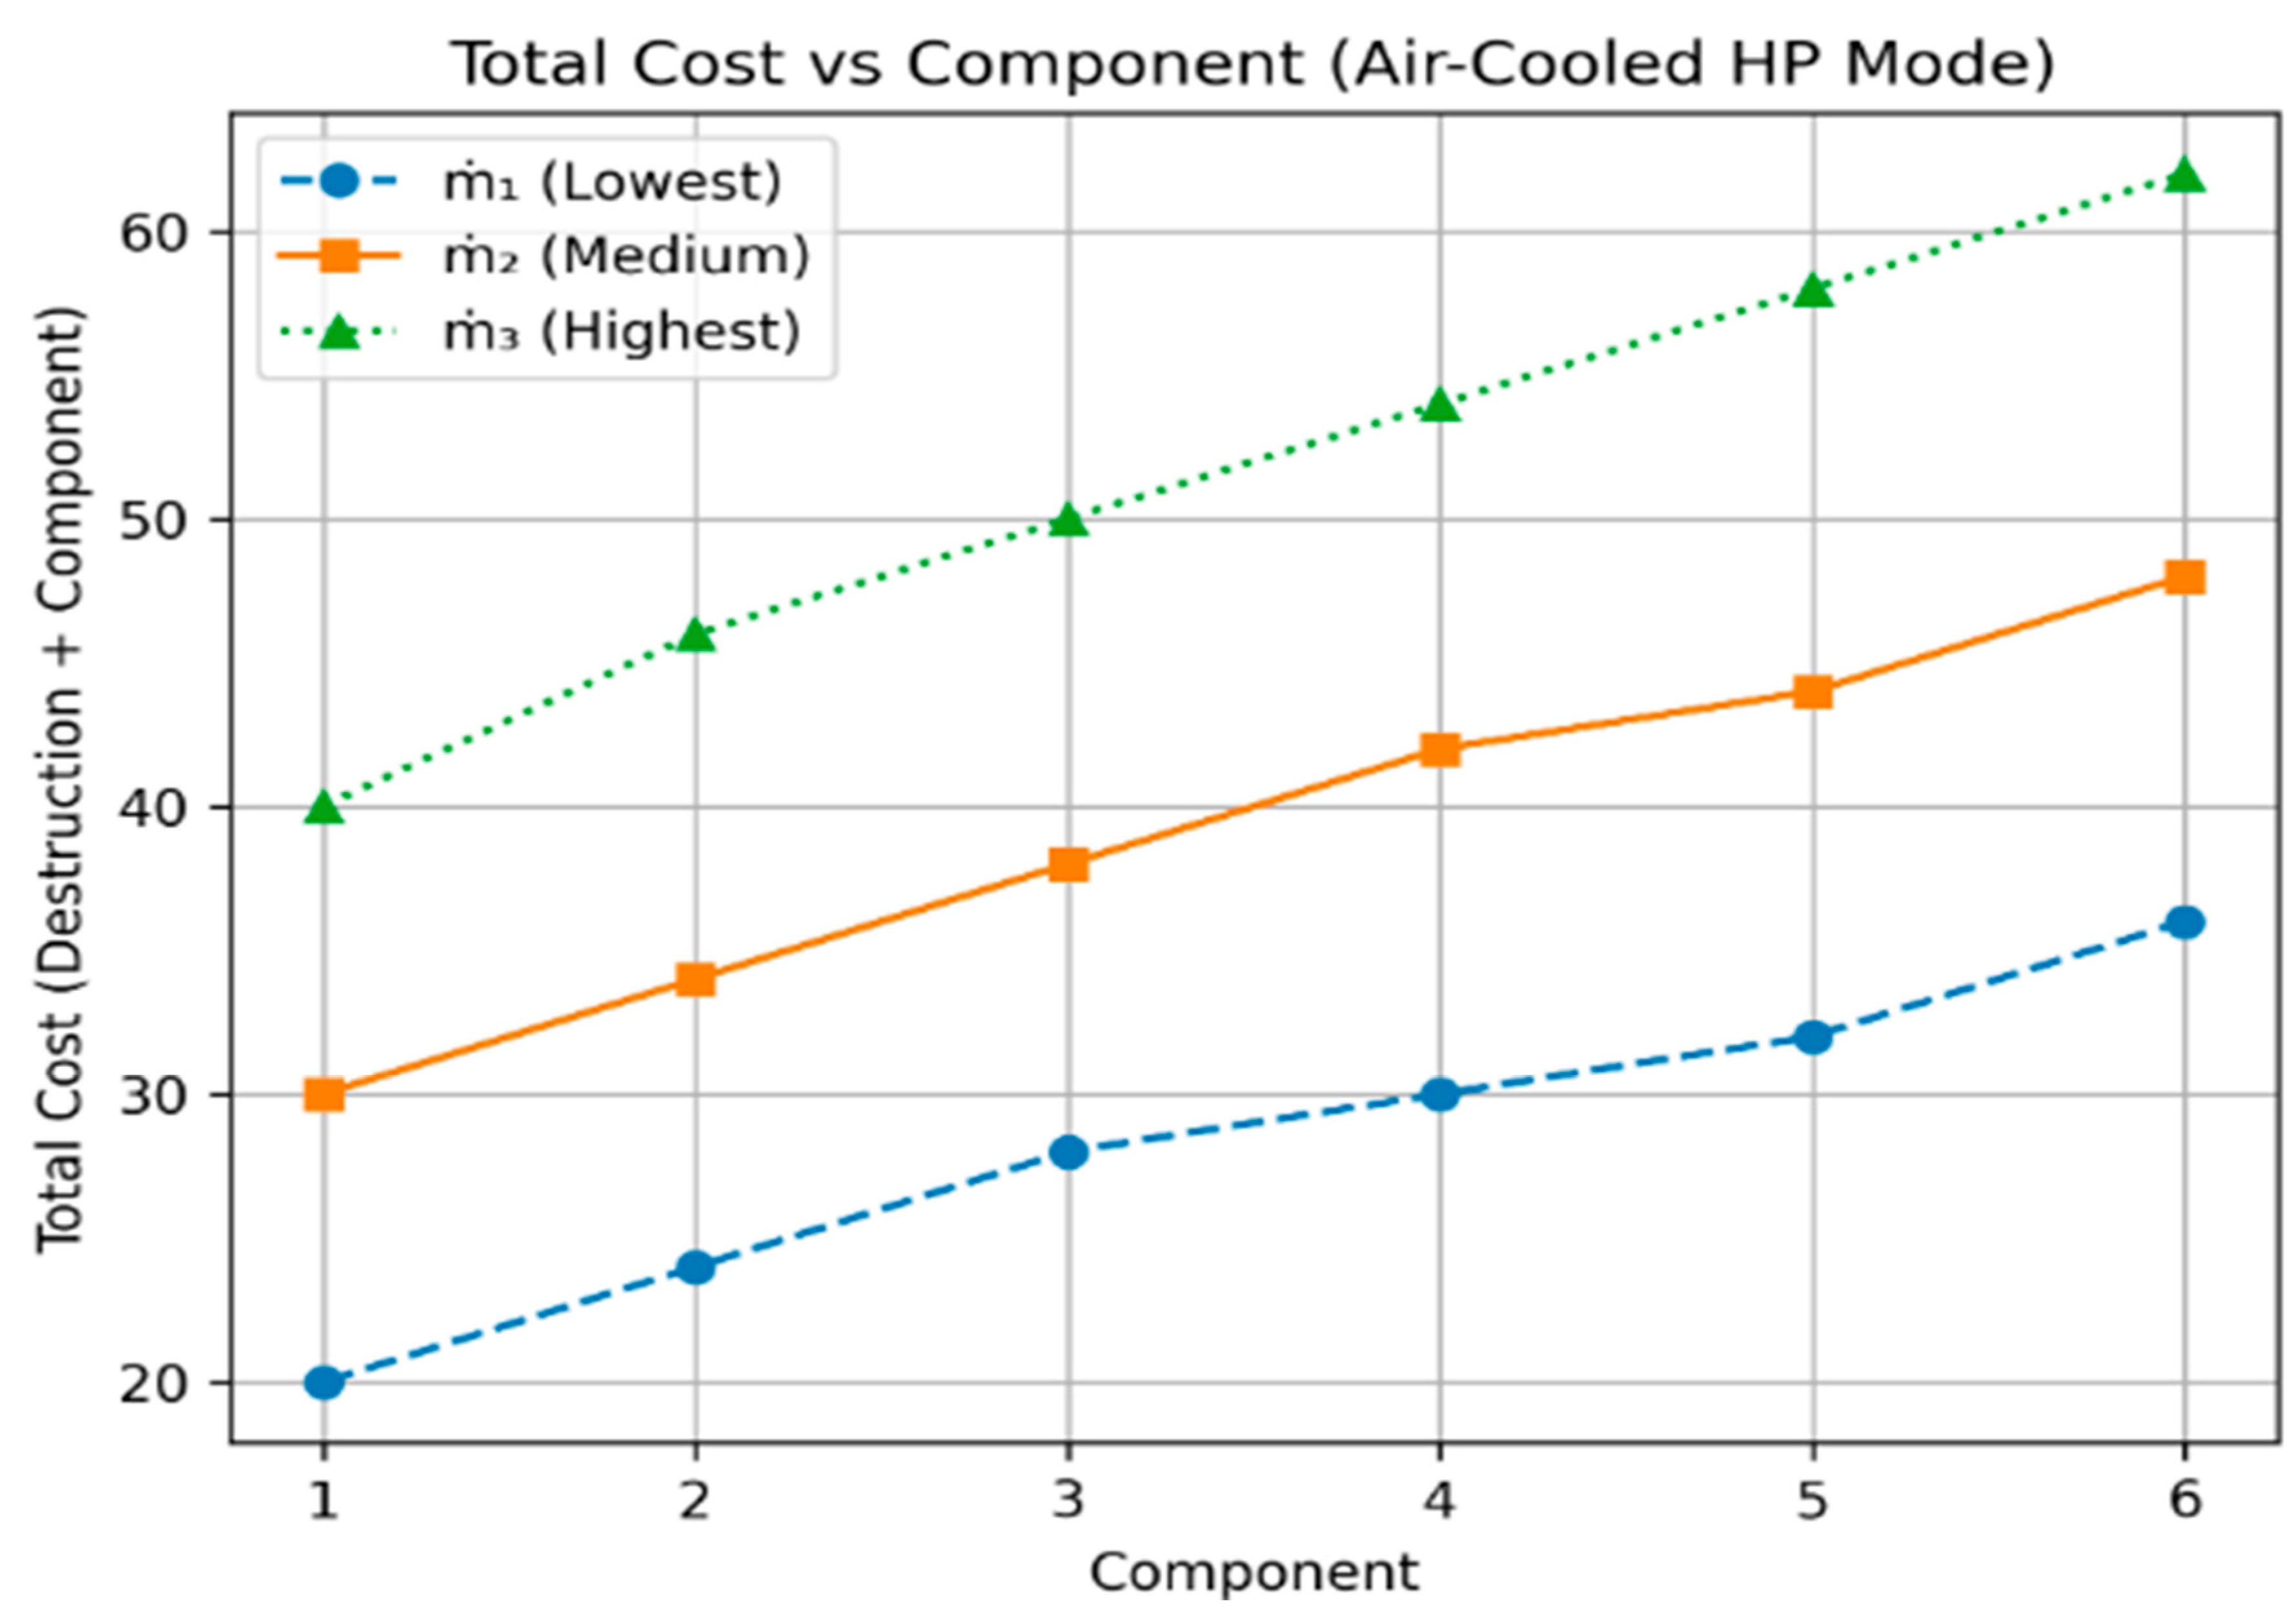
Figure 8 illustrates the variation in the combined exergy destruction cost and component cost of the heat pump components with respect to refrigerant mass flow rate. The compressor consistently exhibits the largest total cost contribution across all tested conditions, with the effect being most pronounced at the highest mass flow rate of 1.5459 kg/s. In general, the compressor, condenser, and expansion valve show a similar trend in which the sum of destruction cost and component cost increases as the mass flow rate increases and decreases as the flow rate reduces. This behavior can be attributed to the higher refrigerant circulation at increased flow rates, which leads to greater compressor work input, increased heat rejection in the condenser, and higher throttling losses in the expansion valve, thereby increasing thermodynamic irreversibilities and associated costs.
In contrast, the evaporator demonstrates a different behavior, where the highest combined cost occurs at the intermediate flow rate of 1.1143 kg/s rather than at the maximum flow rate. Additionally, the variation in the combined cost across the investigated flow rates is relatively small for the evaporator. This anomaly may be attributed to the fact that evaporator performance and cost are generally less sensitive to moderate changes in refrigerant flow rate compared with compression and condensation processes. Since evaporator design is primarily influenced by heat transfer surface area and heat source conditions, variations in mass flow rate may not significantly affect its thermoeconomic performance, resulting in a relatively stable cost profile.
In summary, the results emphasize the dominant thermoeconomic role of the compressor within the system. Its consistently high contribution to the total cost across all flow rates indicates that improvements in compressor performance could have the greatest impact on reducing overall system cost. Consequently, optimization efforts should prioritize compressor-related enhancements such as improving compressor efficiency, implementing variable-speed drives, and optimizing operating conditions. These strategies could significantly reduce exergy destruction and improve the overall economic and energetic performance of the heat pump system.
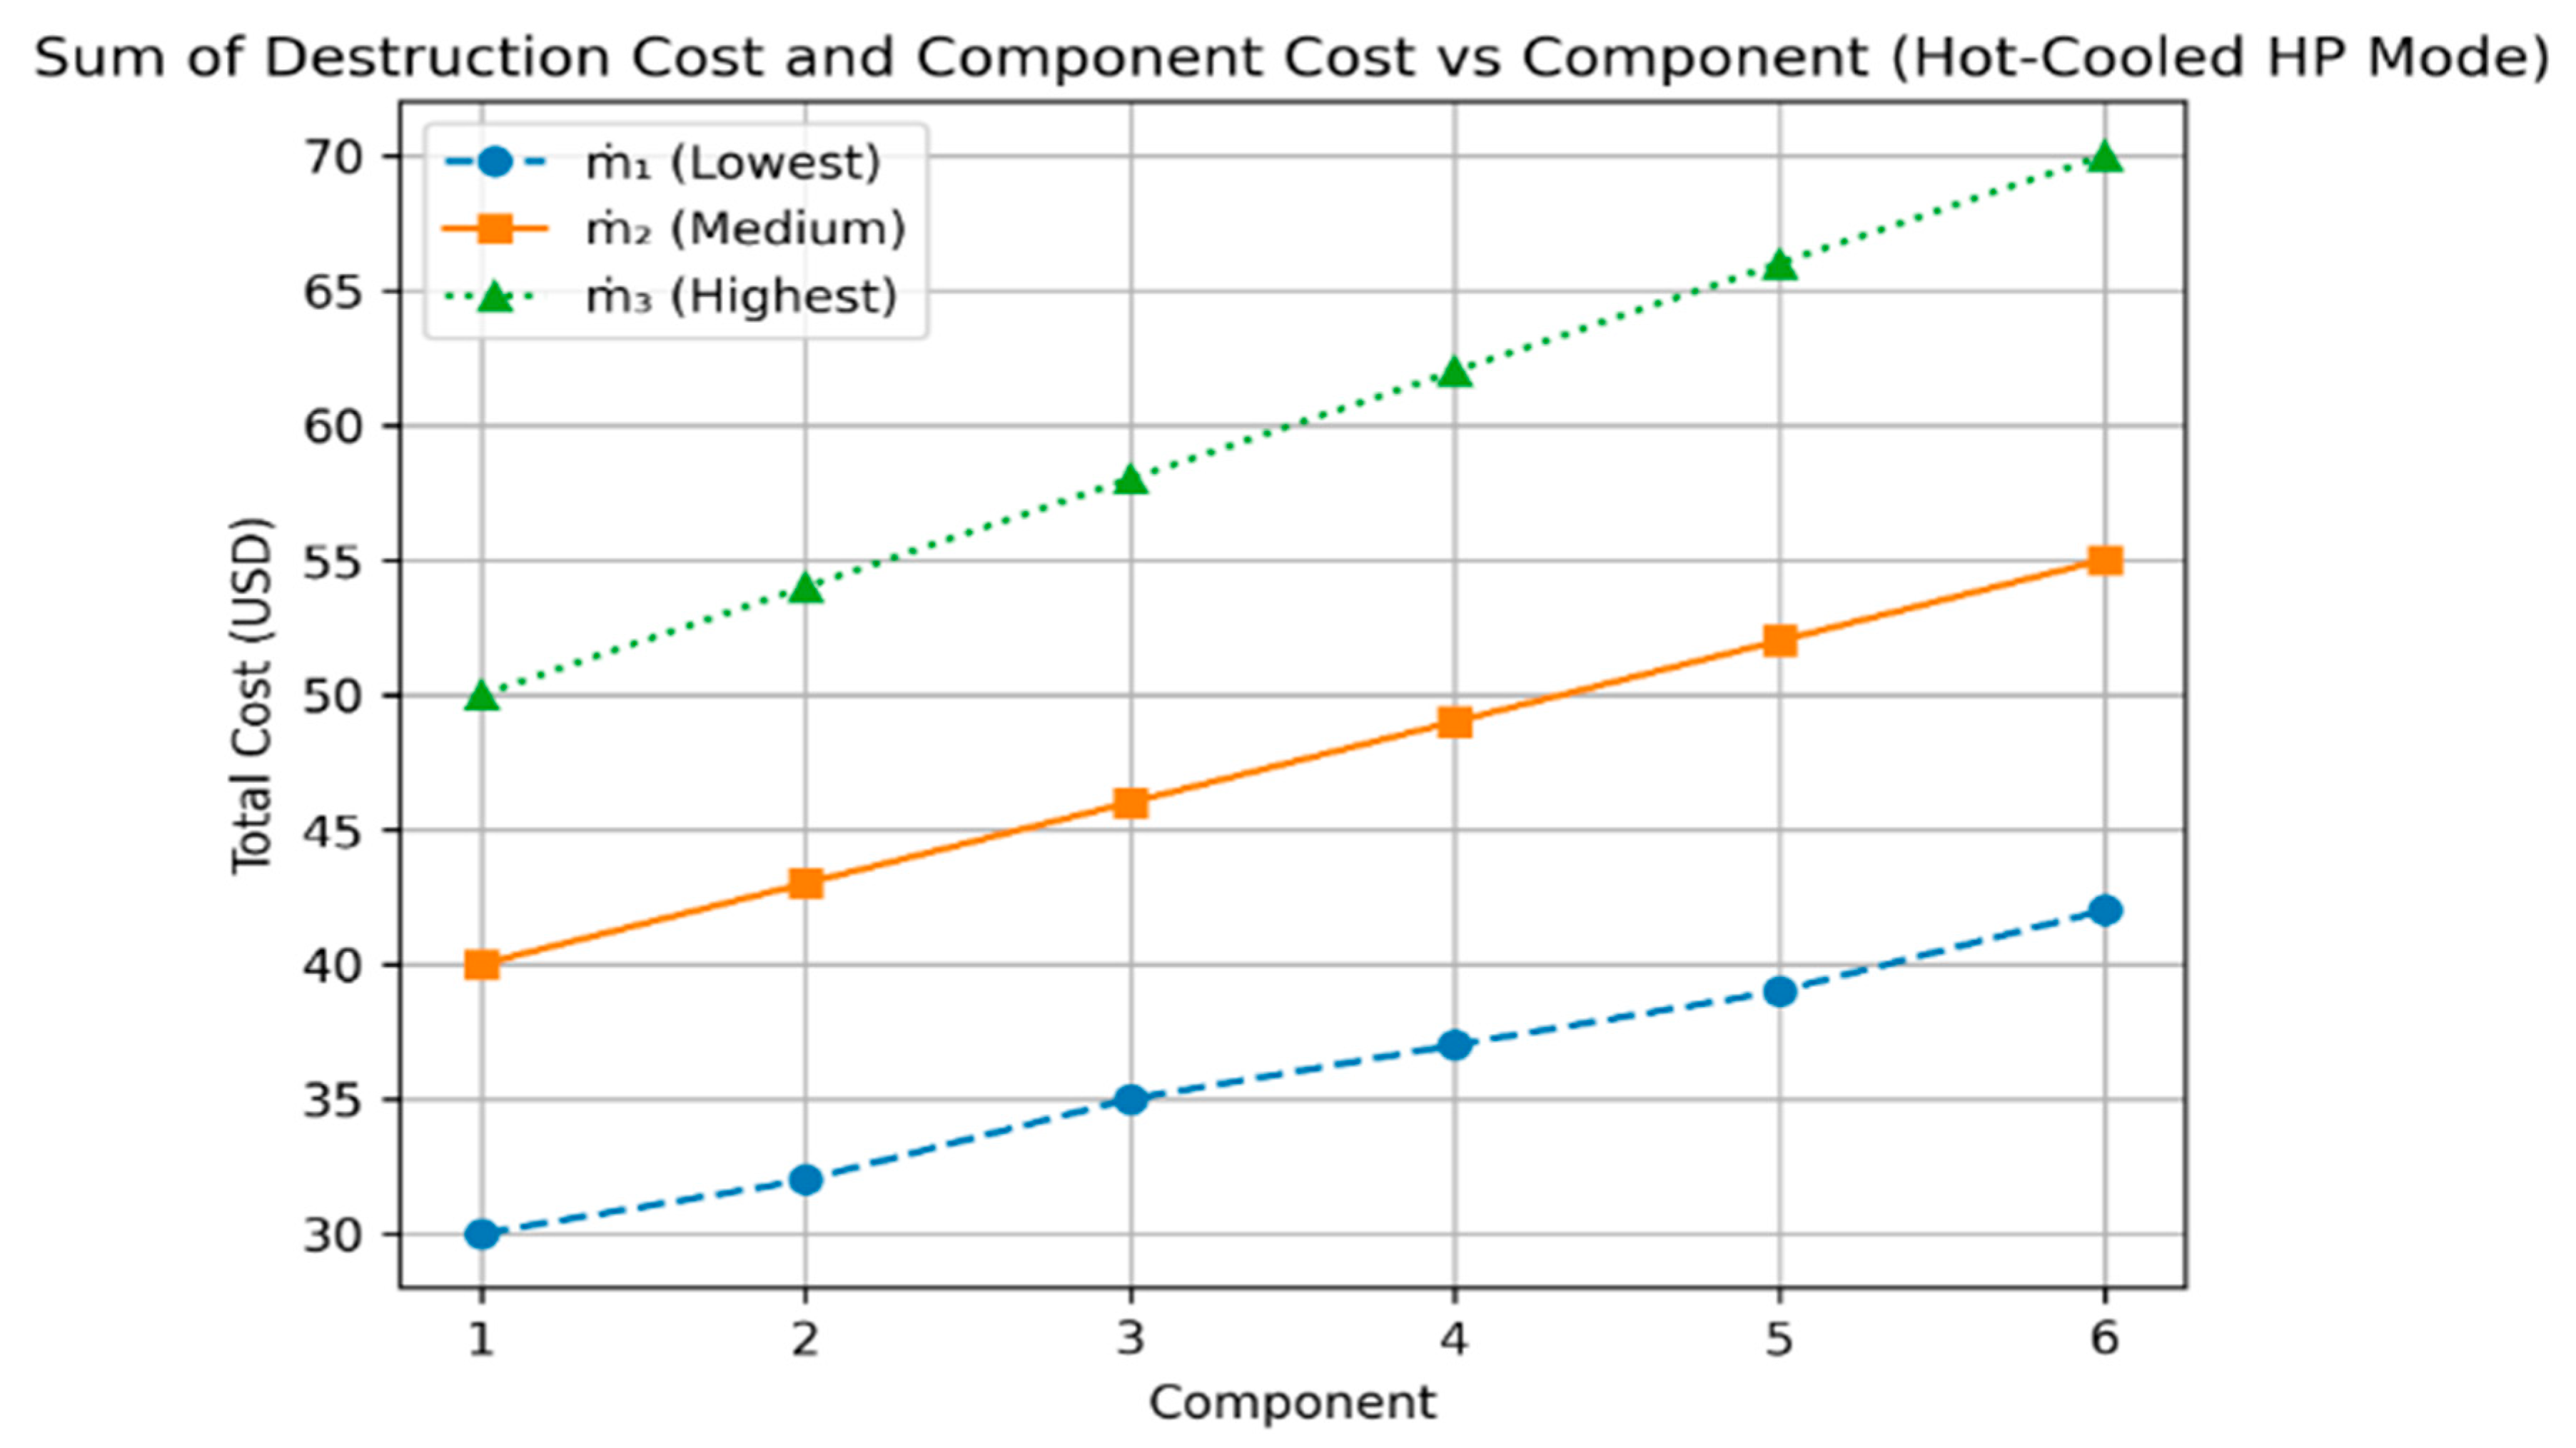
Figure 9 illustrates the variation in the sum of exergy destruction cost and component cost for the major components of the heat pump system operating in hot-cooled HP mode at different refrigerant mass flow rates. The lowest flow rate (0.8068 kg/s) was excluded from the analysis because the system does not operate in hot-cooled heat pump mode under that condition. In general, the results show that the compressor contributes the largest share of the combined destruction and component costs across most of the operating conditions. This behavior is expected because the compressor is the primary work-consuming device in the vapor compression cycle, and therefore it experiences significant thermodynamic irreversibilities during the compression process. These irreversibilities, combined with the relatively high capital cost of the compressor, lead to a dominant contribution to the overall thermoeconomic cost of the system.
As the mass flow rate increases, the combined destruction and component costs for the compressor, condenser, and expansion valve increase correspondingly. This trend can be attributed to the increased refrigerant circulation within the system, which leads to higher compressor work input and greater heat rejection in the condenser. The higher refrigerant throughput also intensifies pressure drops and thermal gradients within the system components, thereby increasing exergy destruction. At the highest mass flow rate (1.5459 kg/s), the condenser exhibits the largest total cost contribution, slightly exceeding that of the compressor. This indicates that the condenser becomes a major source of thermodynamic inefficiency at high flow rates, likely due to reduced heat transfer effectiveness and increased temperature differences between the refrigerant and the cooling medium.
In contrast, the evaporator displays a different trend compared to the other components. The highest combined destruction and component cost for the evaporator occurs at a lower mass flow rate of 1.1143 kg/s rather than at the highest flow rate. This anomaly may be attributed to suboptimal heat transfer conditions or mismatched thermal capacity between the heat source and the refrigerant flow. At certain operating conditions, lower refrigerant velocities can increase temperature differences and reduce heat transfer efficiency, thereby increasing exergy destruction in the evaporator. Additionally, the expansion valve shows only minimal variation in the combined cost across the flow rates considered. This behavior is expected since the expansion valve is a passive throttling device with relatively low capital cost and limited sensitivity to moderate variations in refrigerant flow rate.
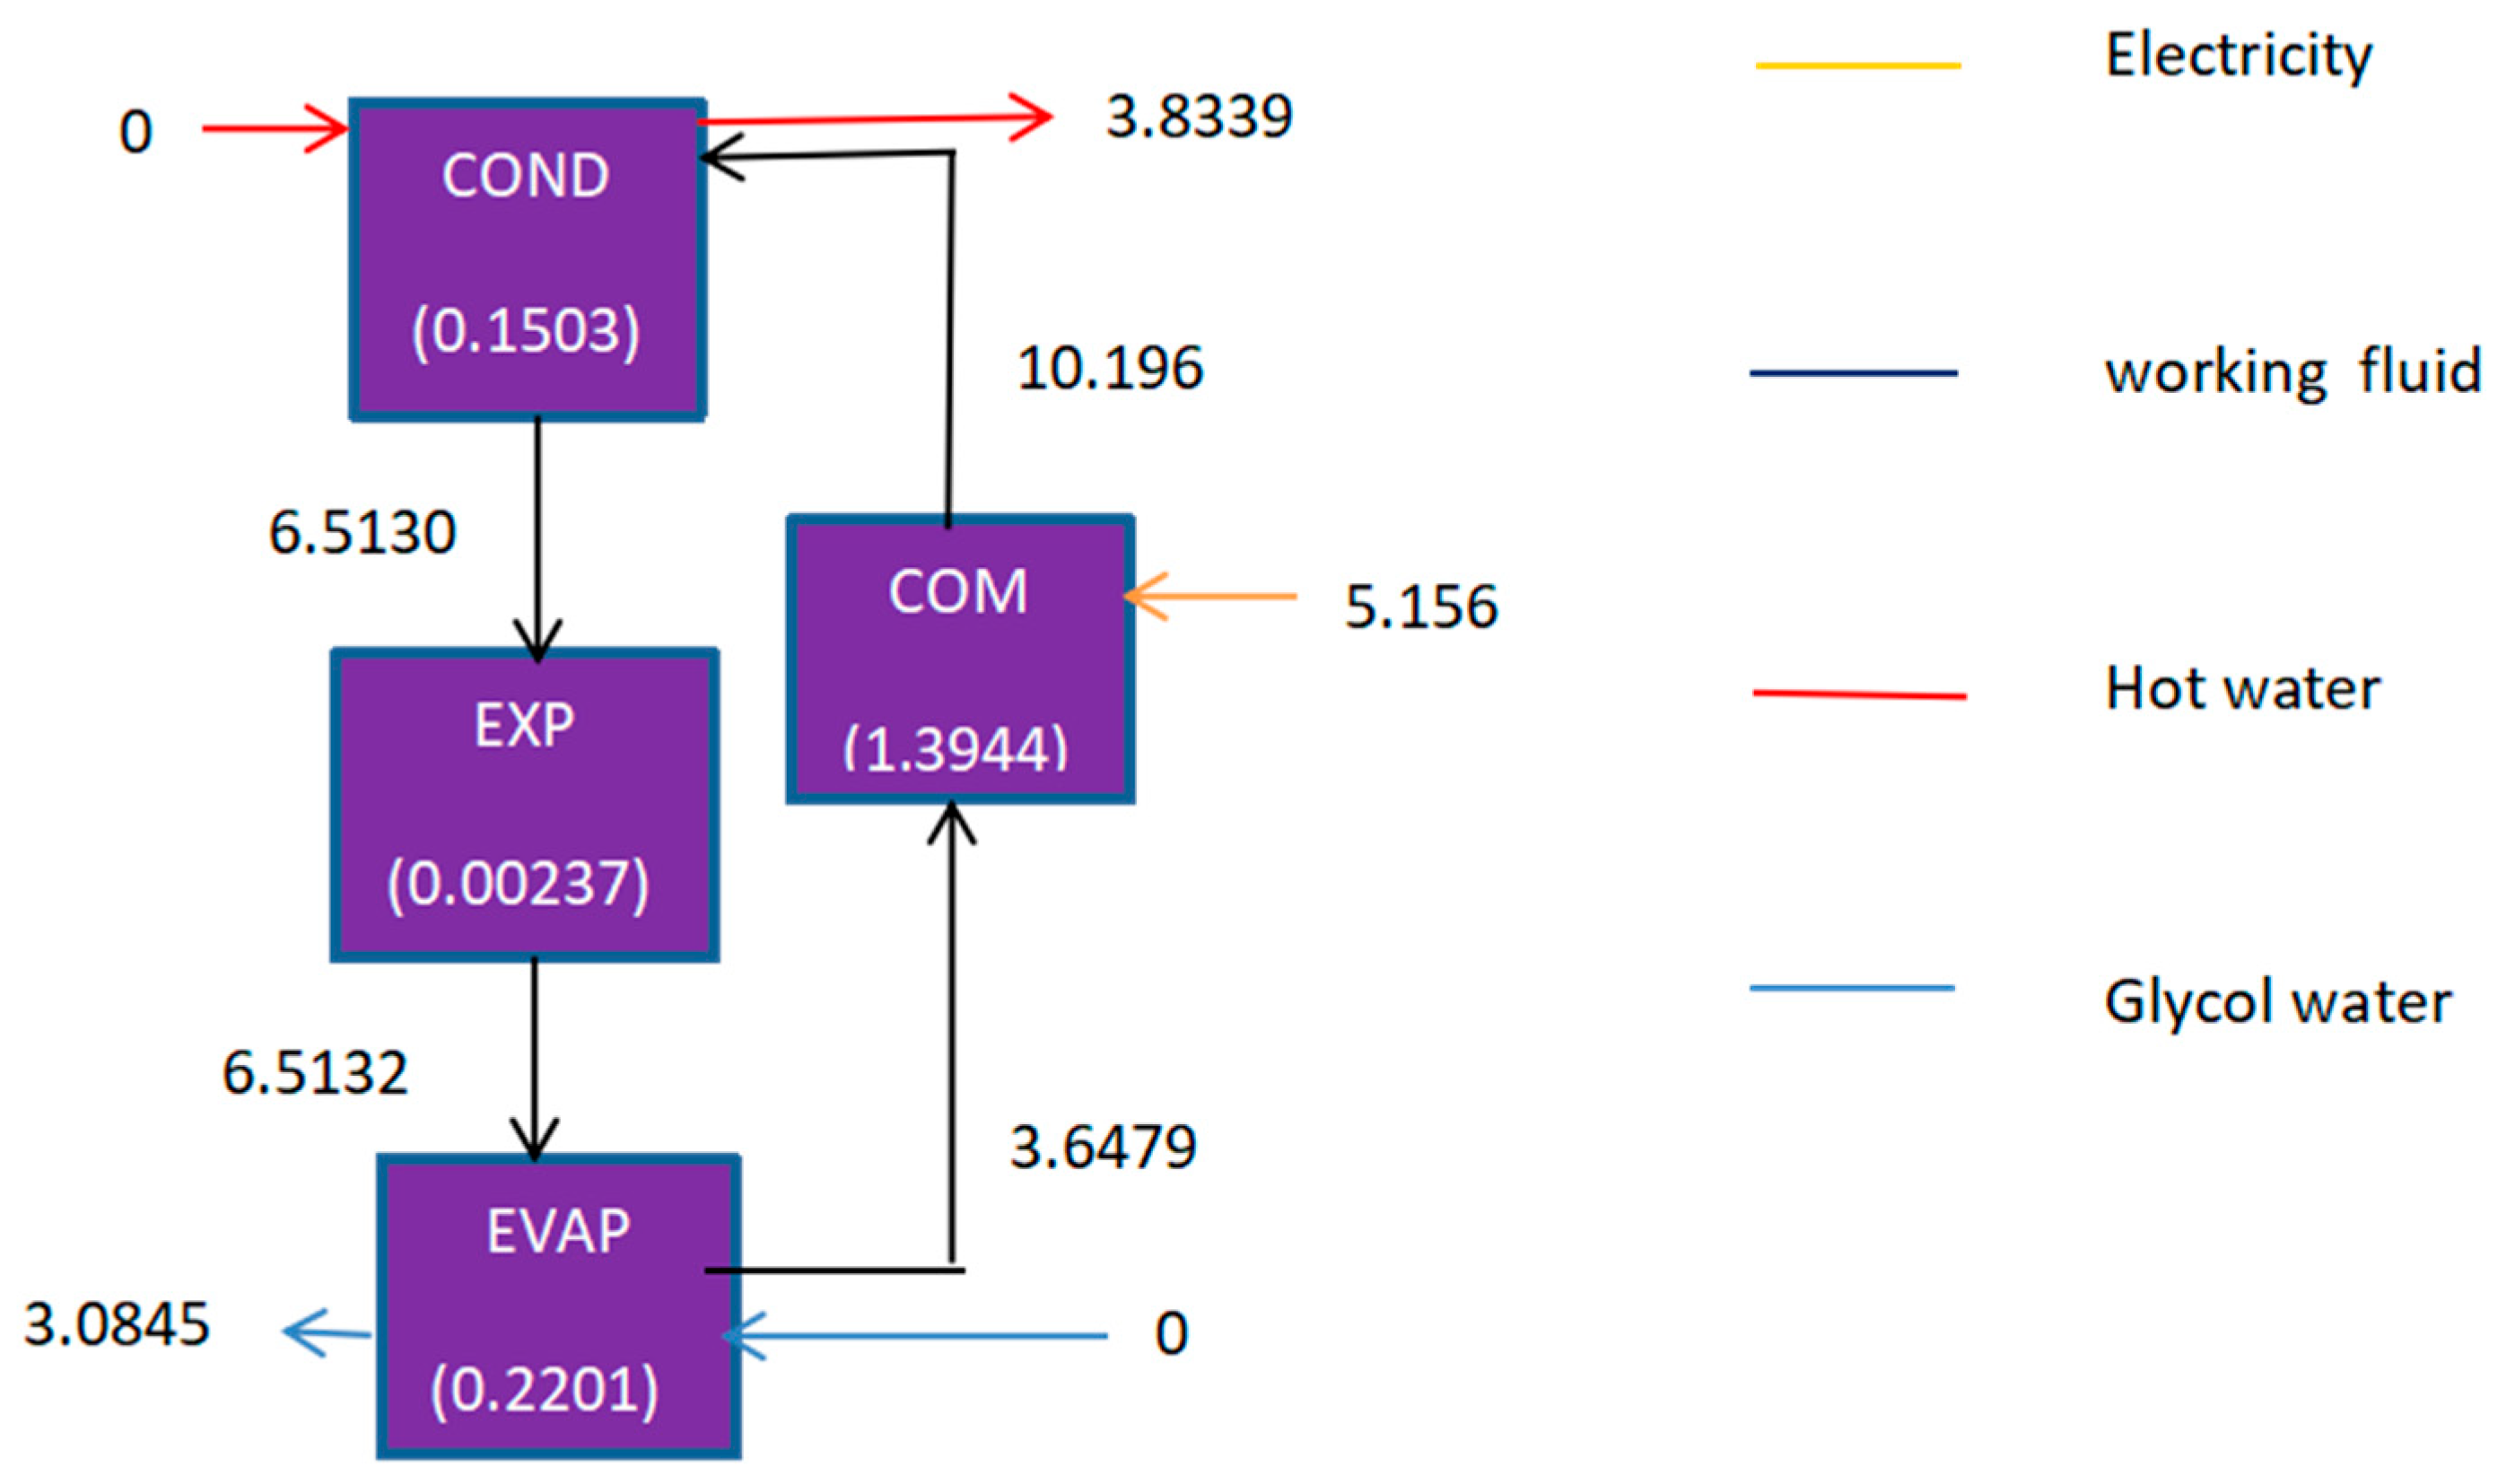
Figure 10 presents the cost rate distribution in a hot-storage heat pump operating at a working fluid mass flow of 1.1143 kg/s. The compressor is identified as the dominant cost source, with electricity input at 5.156 $/b and an internal cost rate of 1.3944 $/b. This confirms that compression is the most economically intensive stage of the cycle, reflecting both high exergy demand and significant irreversibility. By contrast, the condenser demonstrates efficient performance, producing hot water at 3.8339 $/b while incurring only 0.1503 $/b in internal costs. The expander contributes negligibly (0.00237 $/b), while the evaporator consumes glycol water cost (3.0845 $/b to 0) and adds moderate irreversibility (0.2201 $/b). The results highlight a clear redistribution of costs across the cycle. Electricity injected at the compressor is absorbed by the working fluid and ultimately manifested as hot water cost at the condenser, which serves as the system’s economic output node. The evaporator functions as a cost sink, consuming the heat source cost, while the expander’s role is marginal under the given operating conditions. This mapping of cost flows demonstrates how thermo-economic analysis translates physical irreversibilities into monetary terms, enabling a deeper understanding of component-level economic performance.
From a design perspective, the findings emphasize that optimization efforts should prioritize compressor efficiency and condenser effectiveness, as these components exert the greatest influence on the overall cost rate per unit of hot water delivered. Reducing compressor irreversibility or enhancing condenser heat transfer would directly lower the system’s cost burden while improving product value. The negligible expander cost suggests limited economic benefit from further refinement at this stage, whereas the evaporator’s role as a cost absorber underscores its importance in balancing input and output streams. In summary, the figure provides a robust framework for linking thermodynamic performance with economic outcomes in hot-storage heat pump systems.
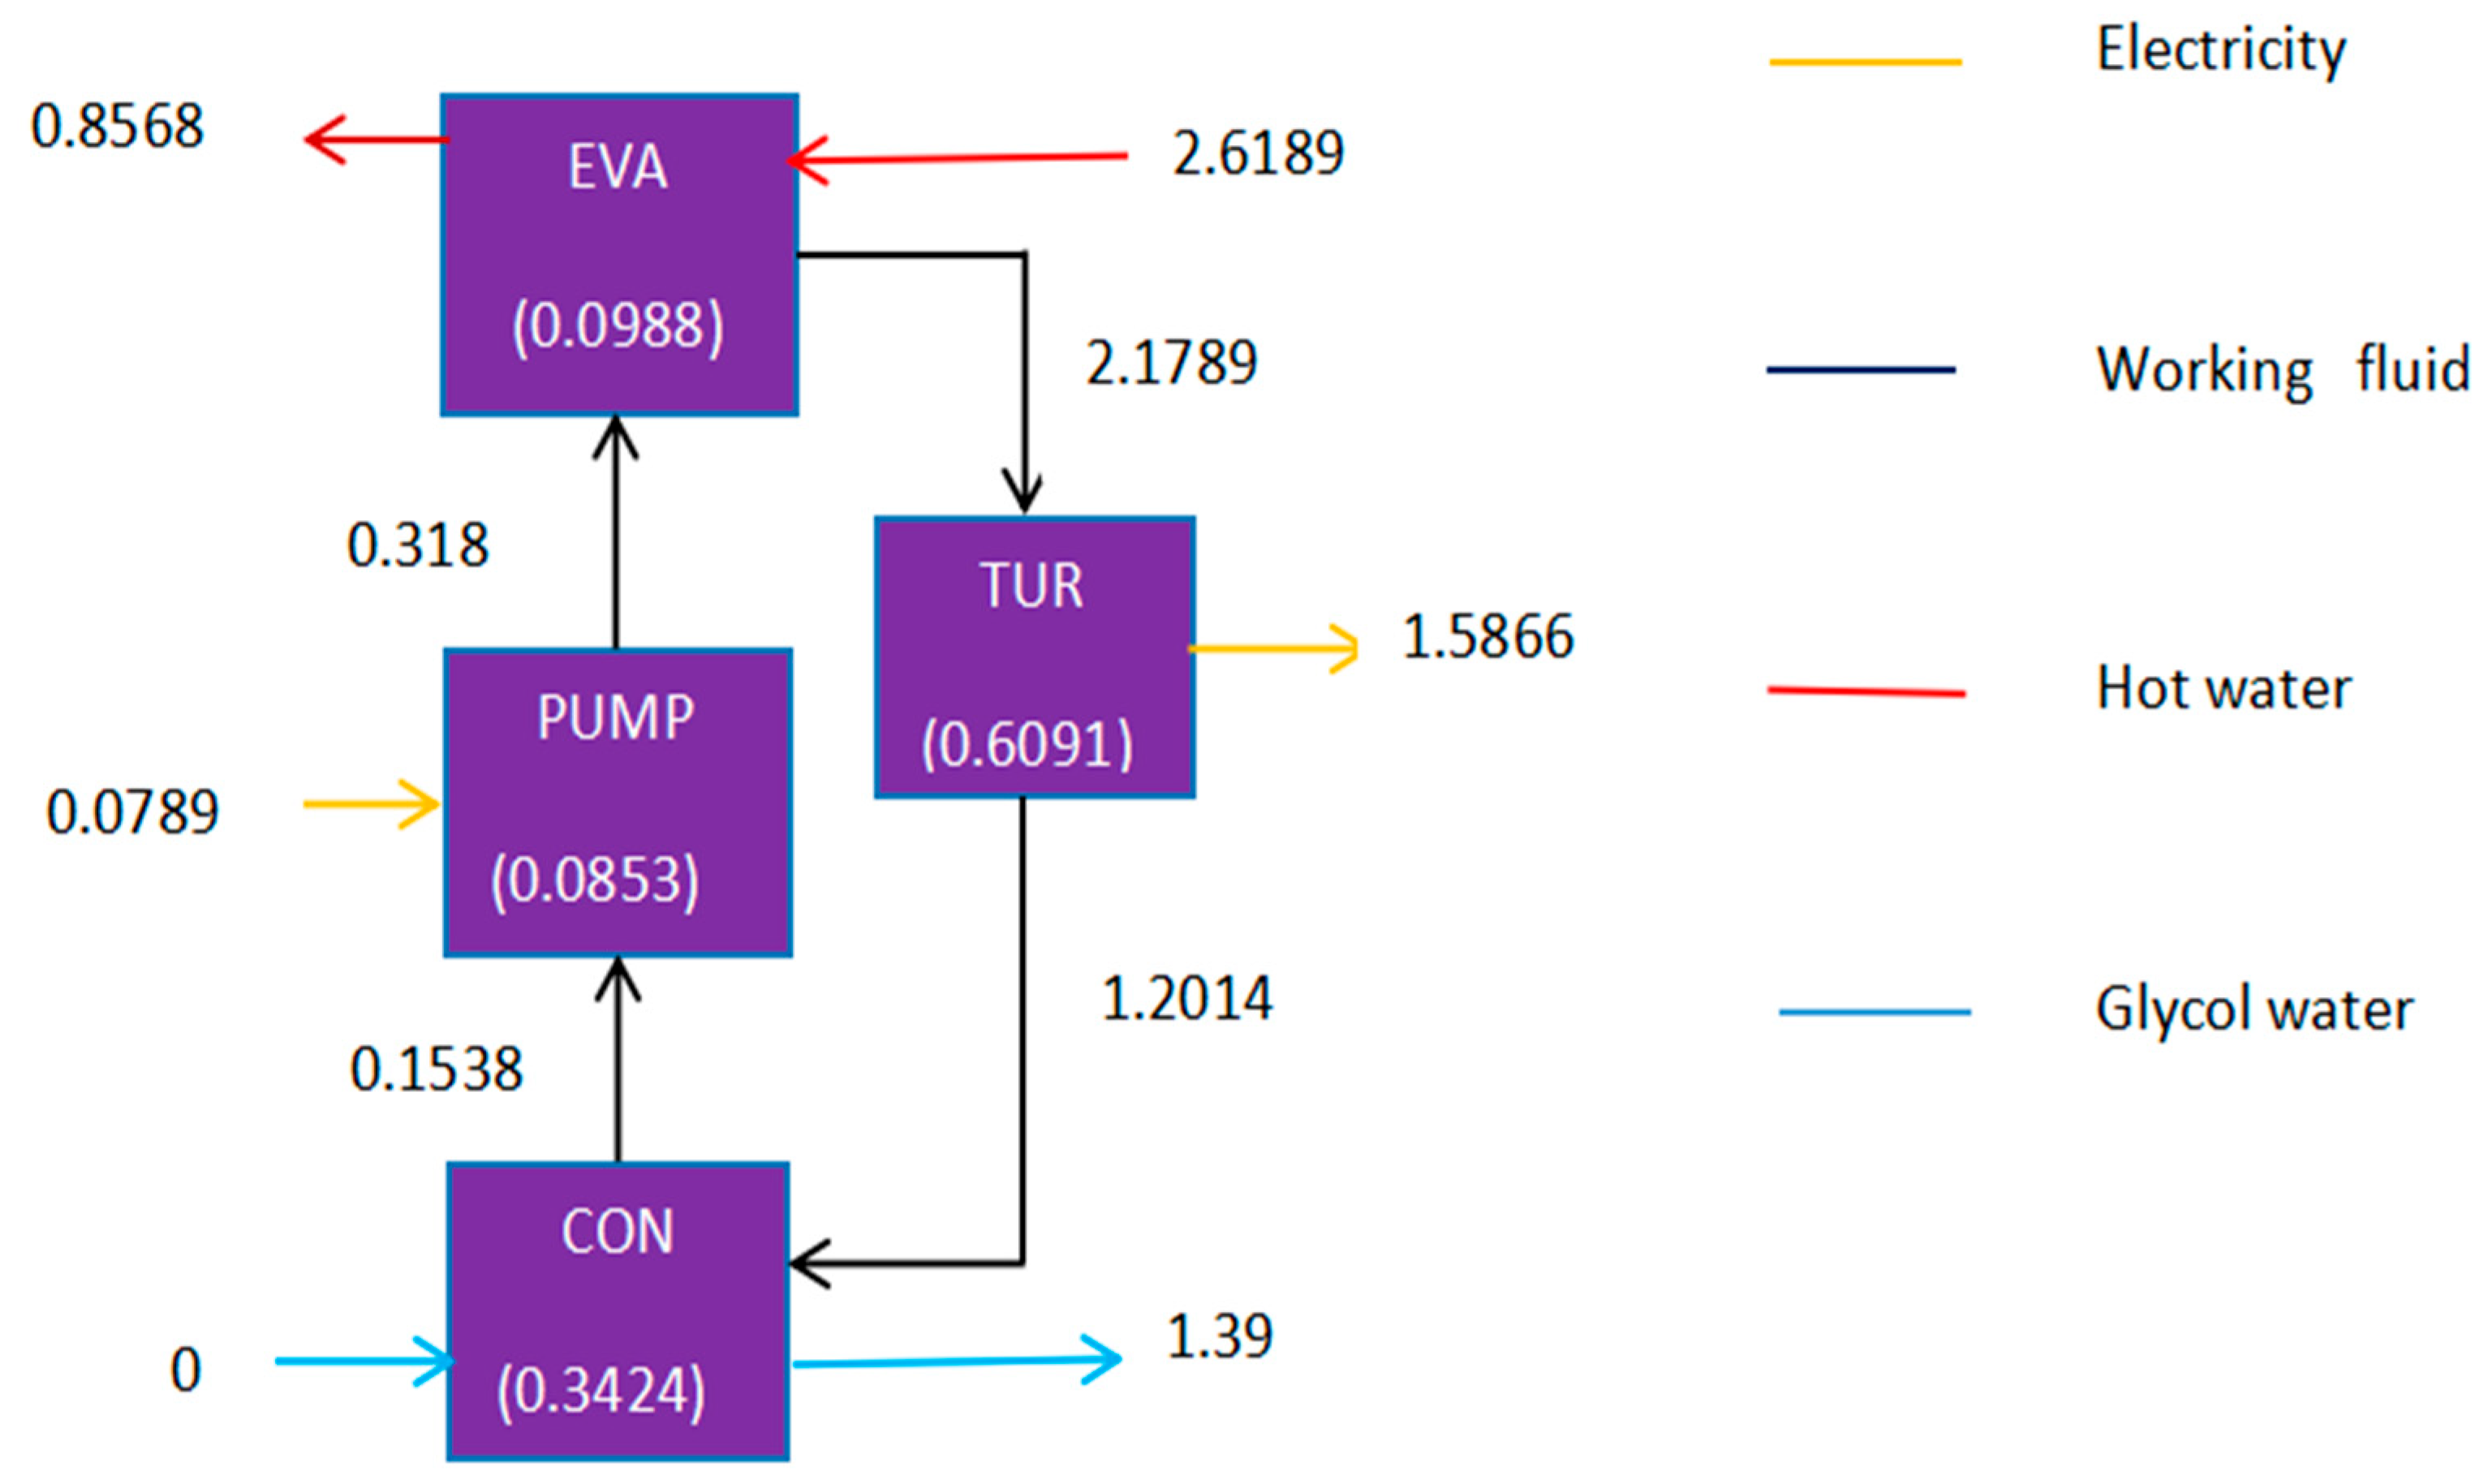
The cost rate flows through the main components of the organic Rankine cycle (ORC) system at a refrigerant mass flow rate of 1.0862 kg/s and is presented in Figure 11. The diagram quantifies the distribution of economic costs, expressed in dollars per unit time ($/b), associated with each component and the flow of working fluid, electricity, hot water, and glycol water within the system.
The turbine (TUR) stands out as the largest cost contributor, with an internal cost rate of 0.6091 $/b. It receives the working fluid flow at a cost rate of 2.1789 $/b and generates electricity associated with an economic value of 1.5866 $/b. This highlights the turbine as a critical component in the ORC, where mechanical work extraction is both economically significant and potentially a major source of system cost due to capital investment and operational factors.
The evaporator (EVA) receives the hot water stream with a cost rate of 2.6189 $/b and exhibits an internal cost rate of 0.0988 $/b. The working fluid exiting the evaporator carries a cost rate of 0.8568 $/b, indicating that the evaporator plays a key role in transferring thermal energy into the cycle and contributes moderately to the overall system cost. The condenser (CON), with an internal cost rate of 0.3424 $/b, handles glycol water input at 1.39 $/b and outputs working fluid at 0.1538 $/b. This component contributes to heat rejection and represents a moderate share of the economic burden within the cycle.
The pump (PUMP) has a relatively low internal cost rate of 0.0853 $/b and receives electrical input costing 0.0789 $/b. It delivers the working fluid at 0.318 $/b to the evaporator, reflecting its role in circulating the working fluid at a comparatively minor economic cost. The cost flow arrows between components reflect energy and economic value transfer, demonstrating how costs accumulate and distribute through the cycle. In summary, the block diagram highlights the turbine as the key driver of economic impact in the ORC, with the condenser and evaporator also contributing significantly. The pump and other auxiliary components contribute less to the total system cost. These insights emphasize the importance of optimizing turbine efficiency and reliability to reduce overall operational costs, while also considering heat exchange performance for economic improvements in the cycle.
In summary, the exergoeconomic results highlight the compressor and condenser as the most critical components influencing the thermoeconomic performance of the system. While the compressor dominates the cost contribution across most flow conditions, the condenser becomes increasingly significant at higher mass flow rates. These findings suggest that optimization strategies aimed at improving compressor efficiency and enhancing condenser heat transfer performance could substantially reduce the overall system cost and improve operational efficiency.

4.3. Exergoenvironmental Analysis Results

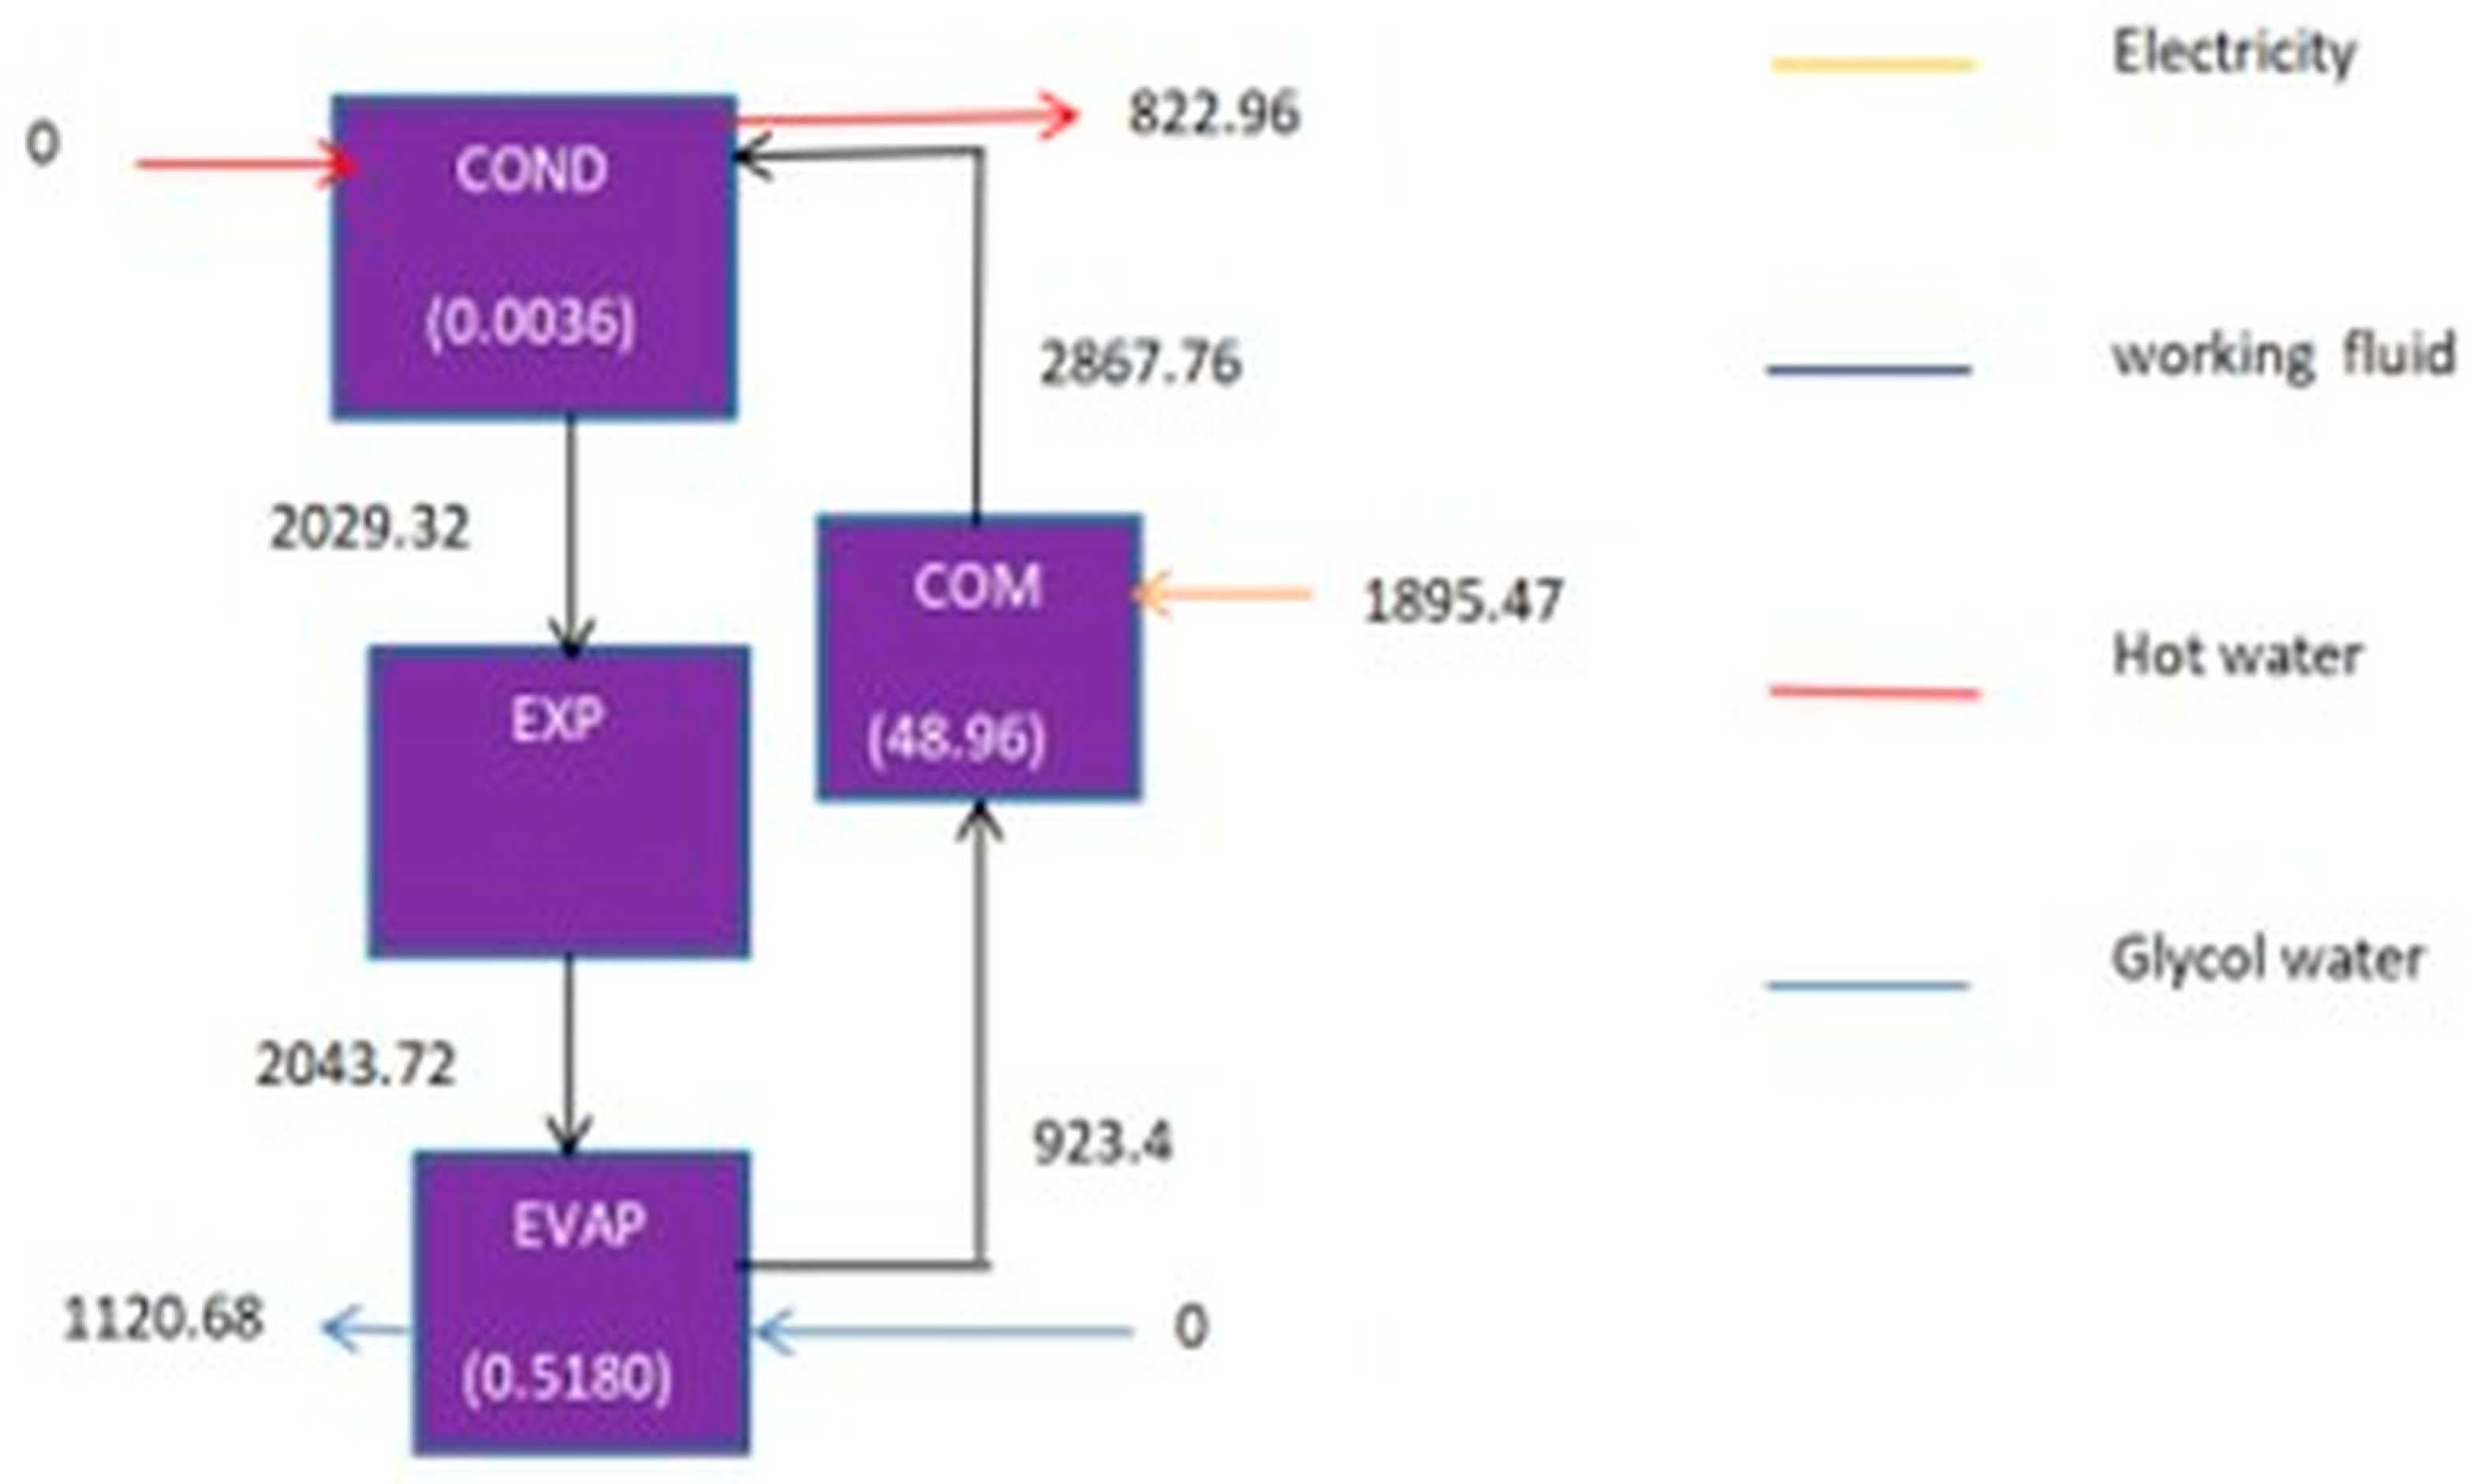
Figure 12 presents the block diagram of the exergoenvironmental impact rate flow within the air-cooled heat pump system operating at a refrigerant mass flow rate of 1.5459 kg/s. This diagram quantifies the distribution of environmental impacts associated with exergy destruction and energy consumption throughout the main components of the system: compressor (COM), condenser (COND), expansion valve (EXP), and evaporator (EVAP). The compressor emerges as the dominant source of exergoenvironmental impact, receiving an electricity input with a high associated impact rate of 1895.47 units and exhibiting a substantial internal contribution of 48.96 units. This highlights the significant environmental burden linked to the mechanical work required for compression and the inefficiencies inherent in this process. The compressor increases the exergoenvironmental impact of the working fluid from 1895.47 to 2867.76 units, reflecting the combined effect of energy input and exergy destruction.
In contrast, the condenser demonstrates relatively low exergoenvironmental inefficiencies, with an internal impact contribution of only 0.0036 units. The working fluid transitions through the condenser, reducing its impact to 822.96 units via heat rejection to the hot water stream. Similarly, the expansion valve exhibits minimal exergoenvironmental impact, with negligible internal losses, consistent with its passive throttling function. The evaporator contributes a moderate impact of 0.5180 units, reflecting thermodynamic irreversibilities associated with heat absorption from the glycol water stream. In summary, the block diagram underscores the compressor as the critical component for exergoenvironmental optimization in the air-cooled heat pump. Targeted improvements in compressor efficiency and reductions in electricity consumption represent the most effective strategies for minimizing the system’s environmental footprint. Meanwhile, enhancements in heat exchanger design may yield smaller but still valuable reductions in exergoenvironmental losses. This comprehensive visualization of impact distribution provides a foundation for focused interventions aimed at improving the sustainability of heat pump technology.
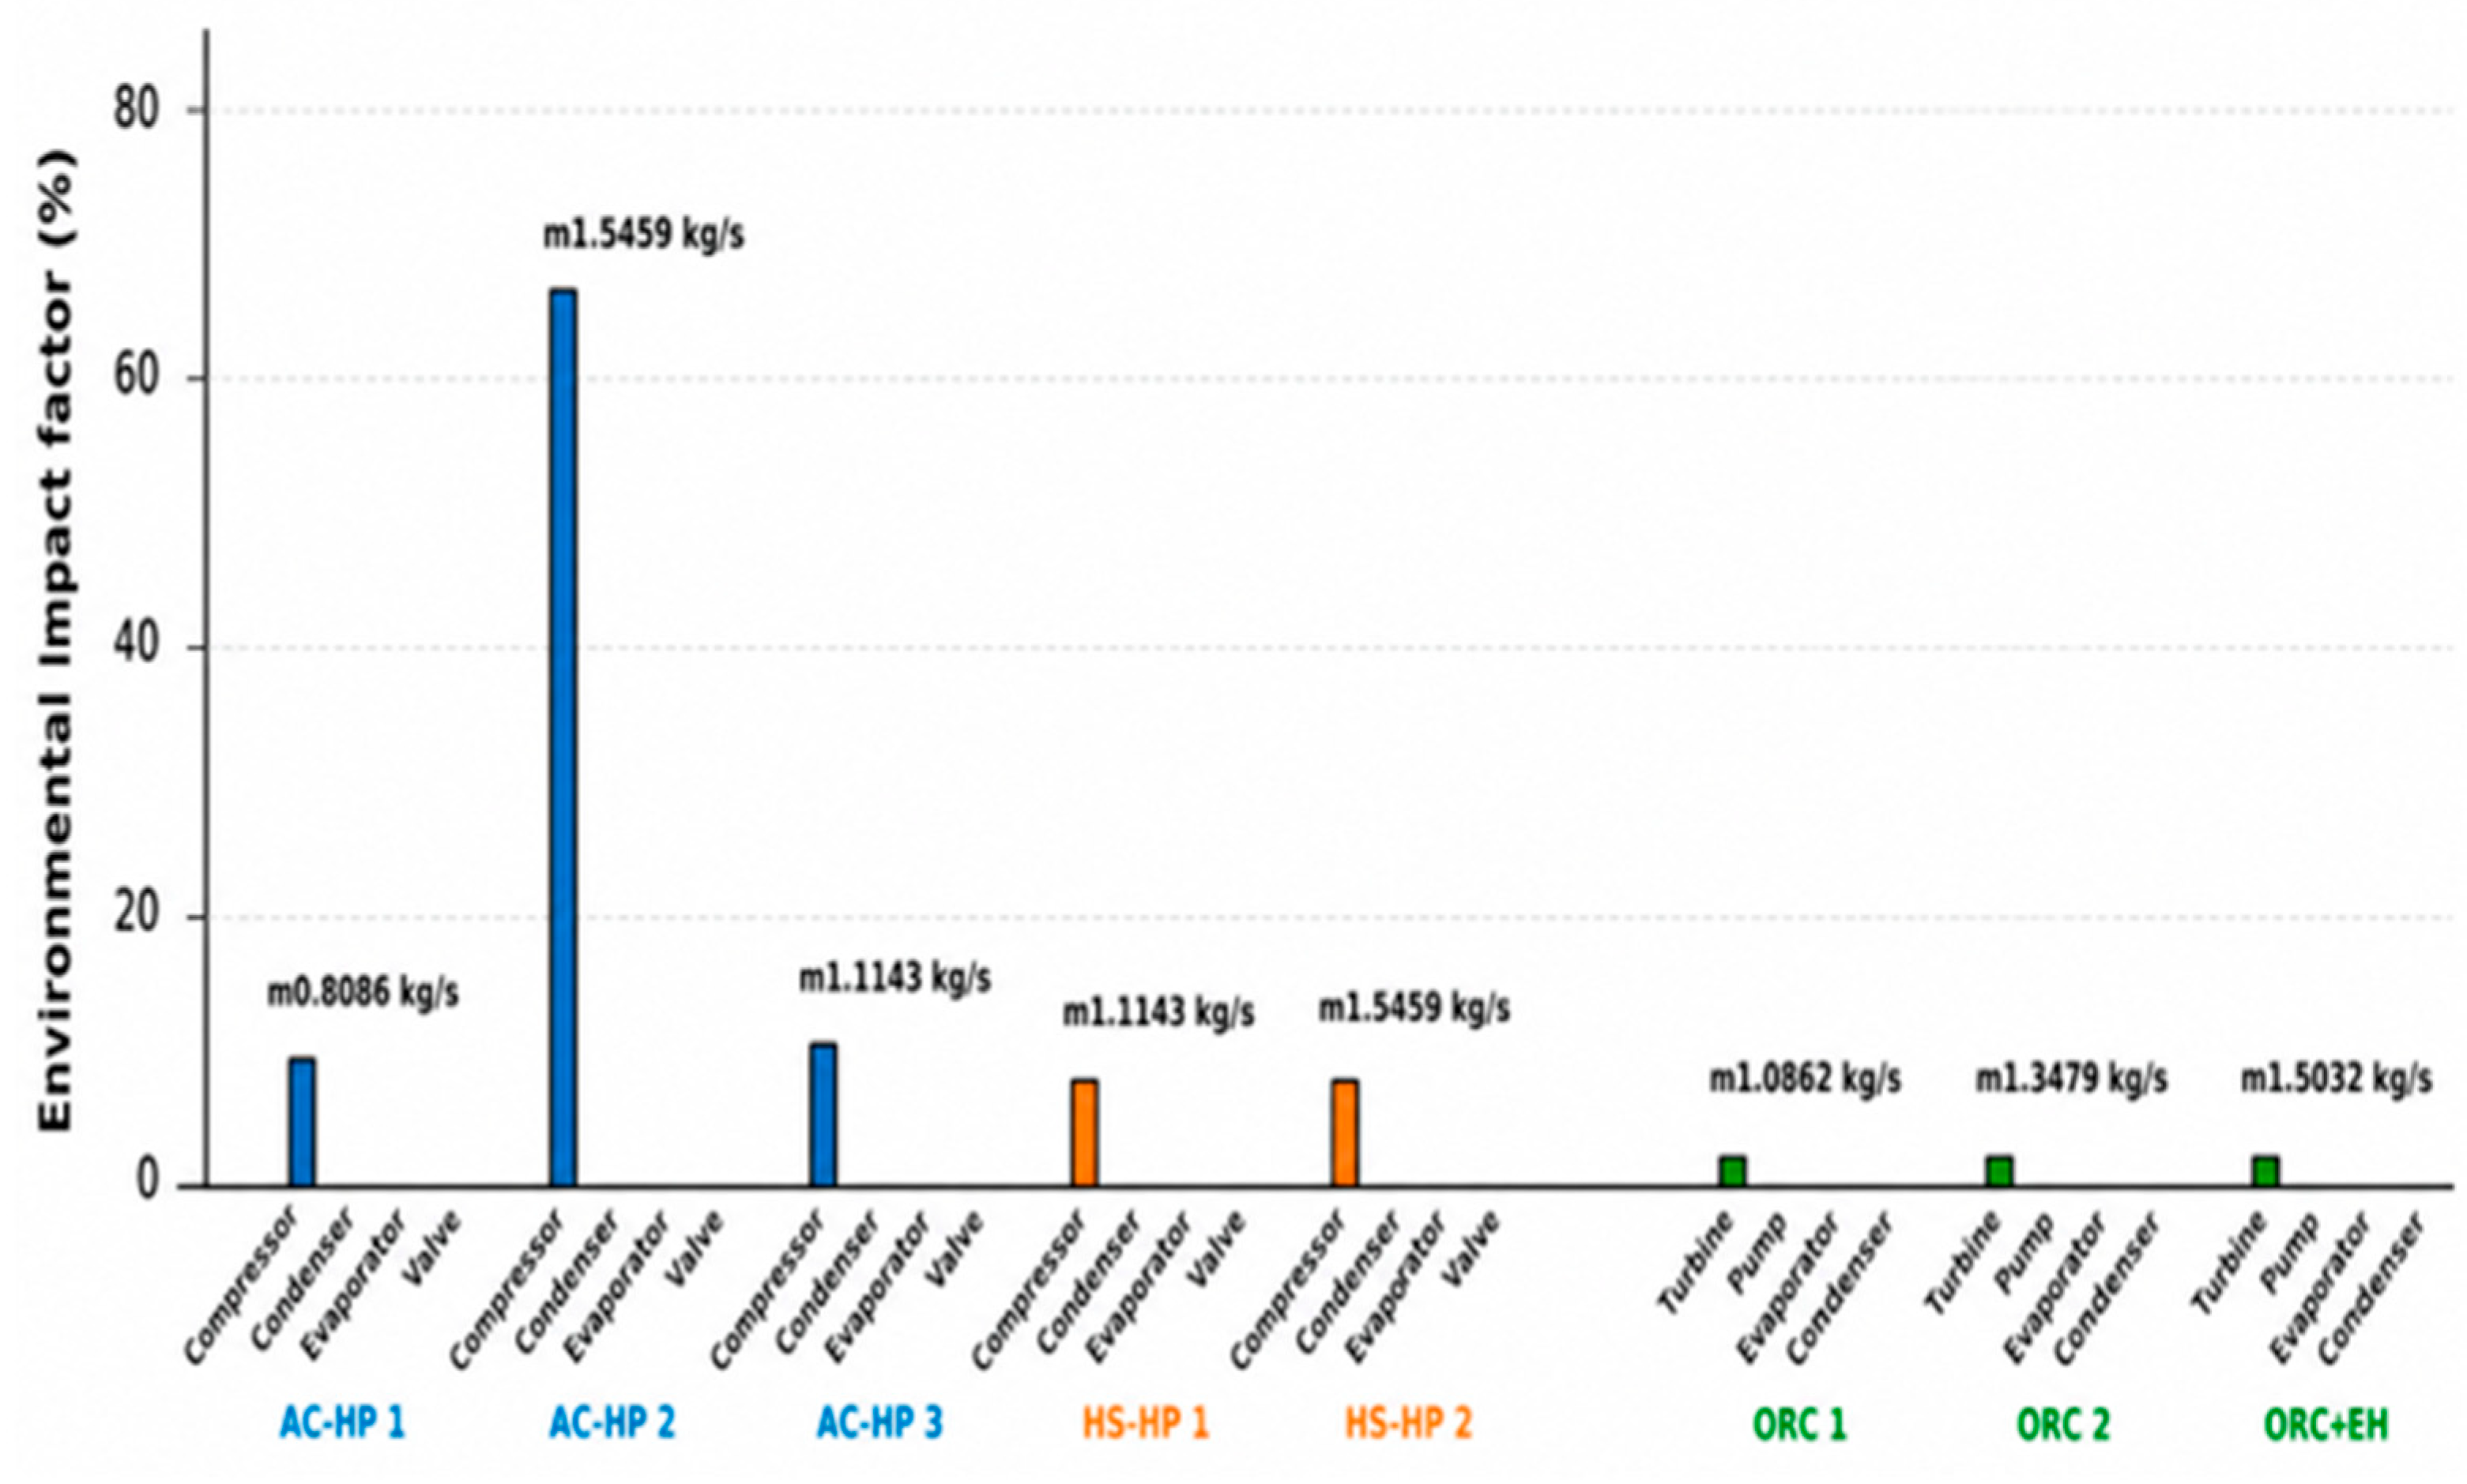
The comprehensive exergoenvironmental results for all four configurations, illustrating the relationship between environmental impact factor across the primary components, are presented in Figure 13.
For the hot-storage cooled heat pump systems, the condenser and compressor consistently demonstrate the highest environmental impact factor overall, confirming that its environmental footprint is heavily weighted toward its material intensity and construction.
In the ORC systems, the evaporator represents the most critical diagnostic point. The high environmental impact factor here, coupled with high exergy destruction from the electric heater, suggests that while component is large, the thermal mismatch between the heat source and the working fluid is a significant penalty that must be addressed through thermodynamic optimization.
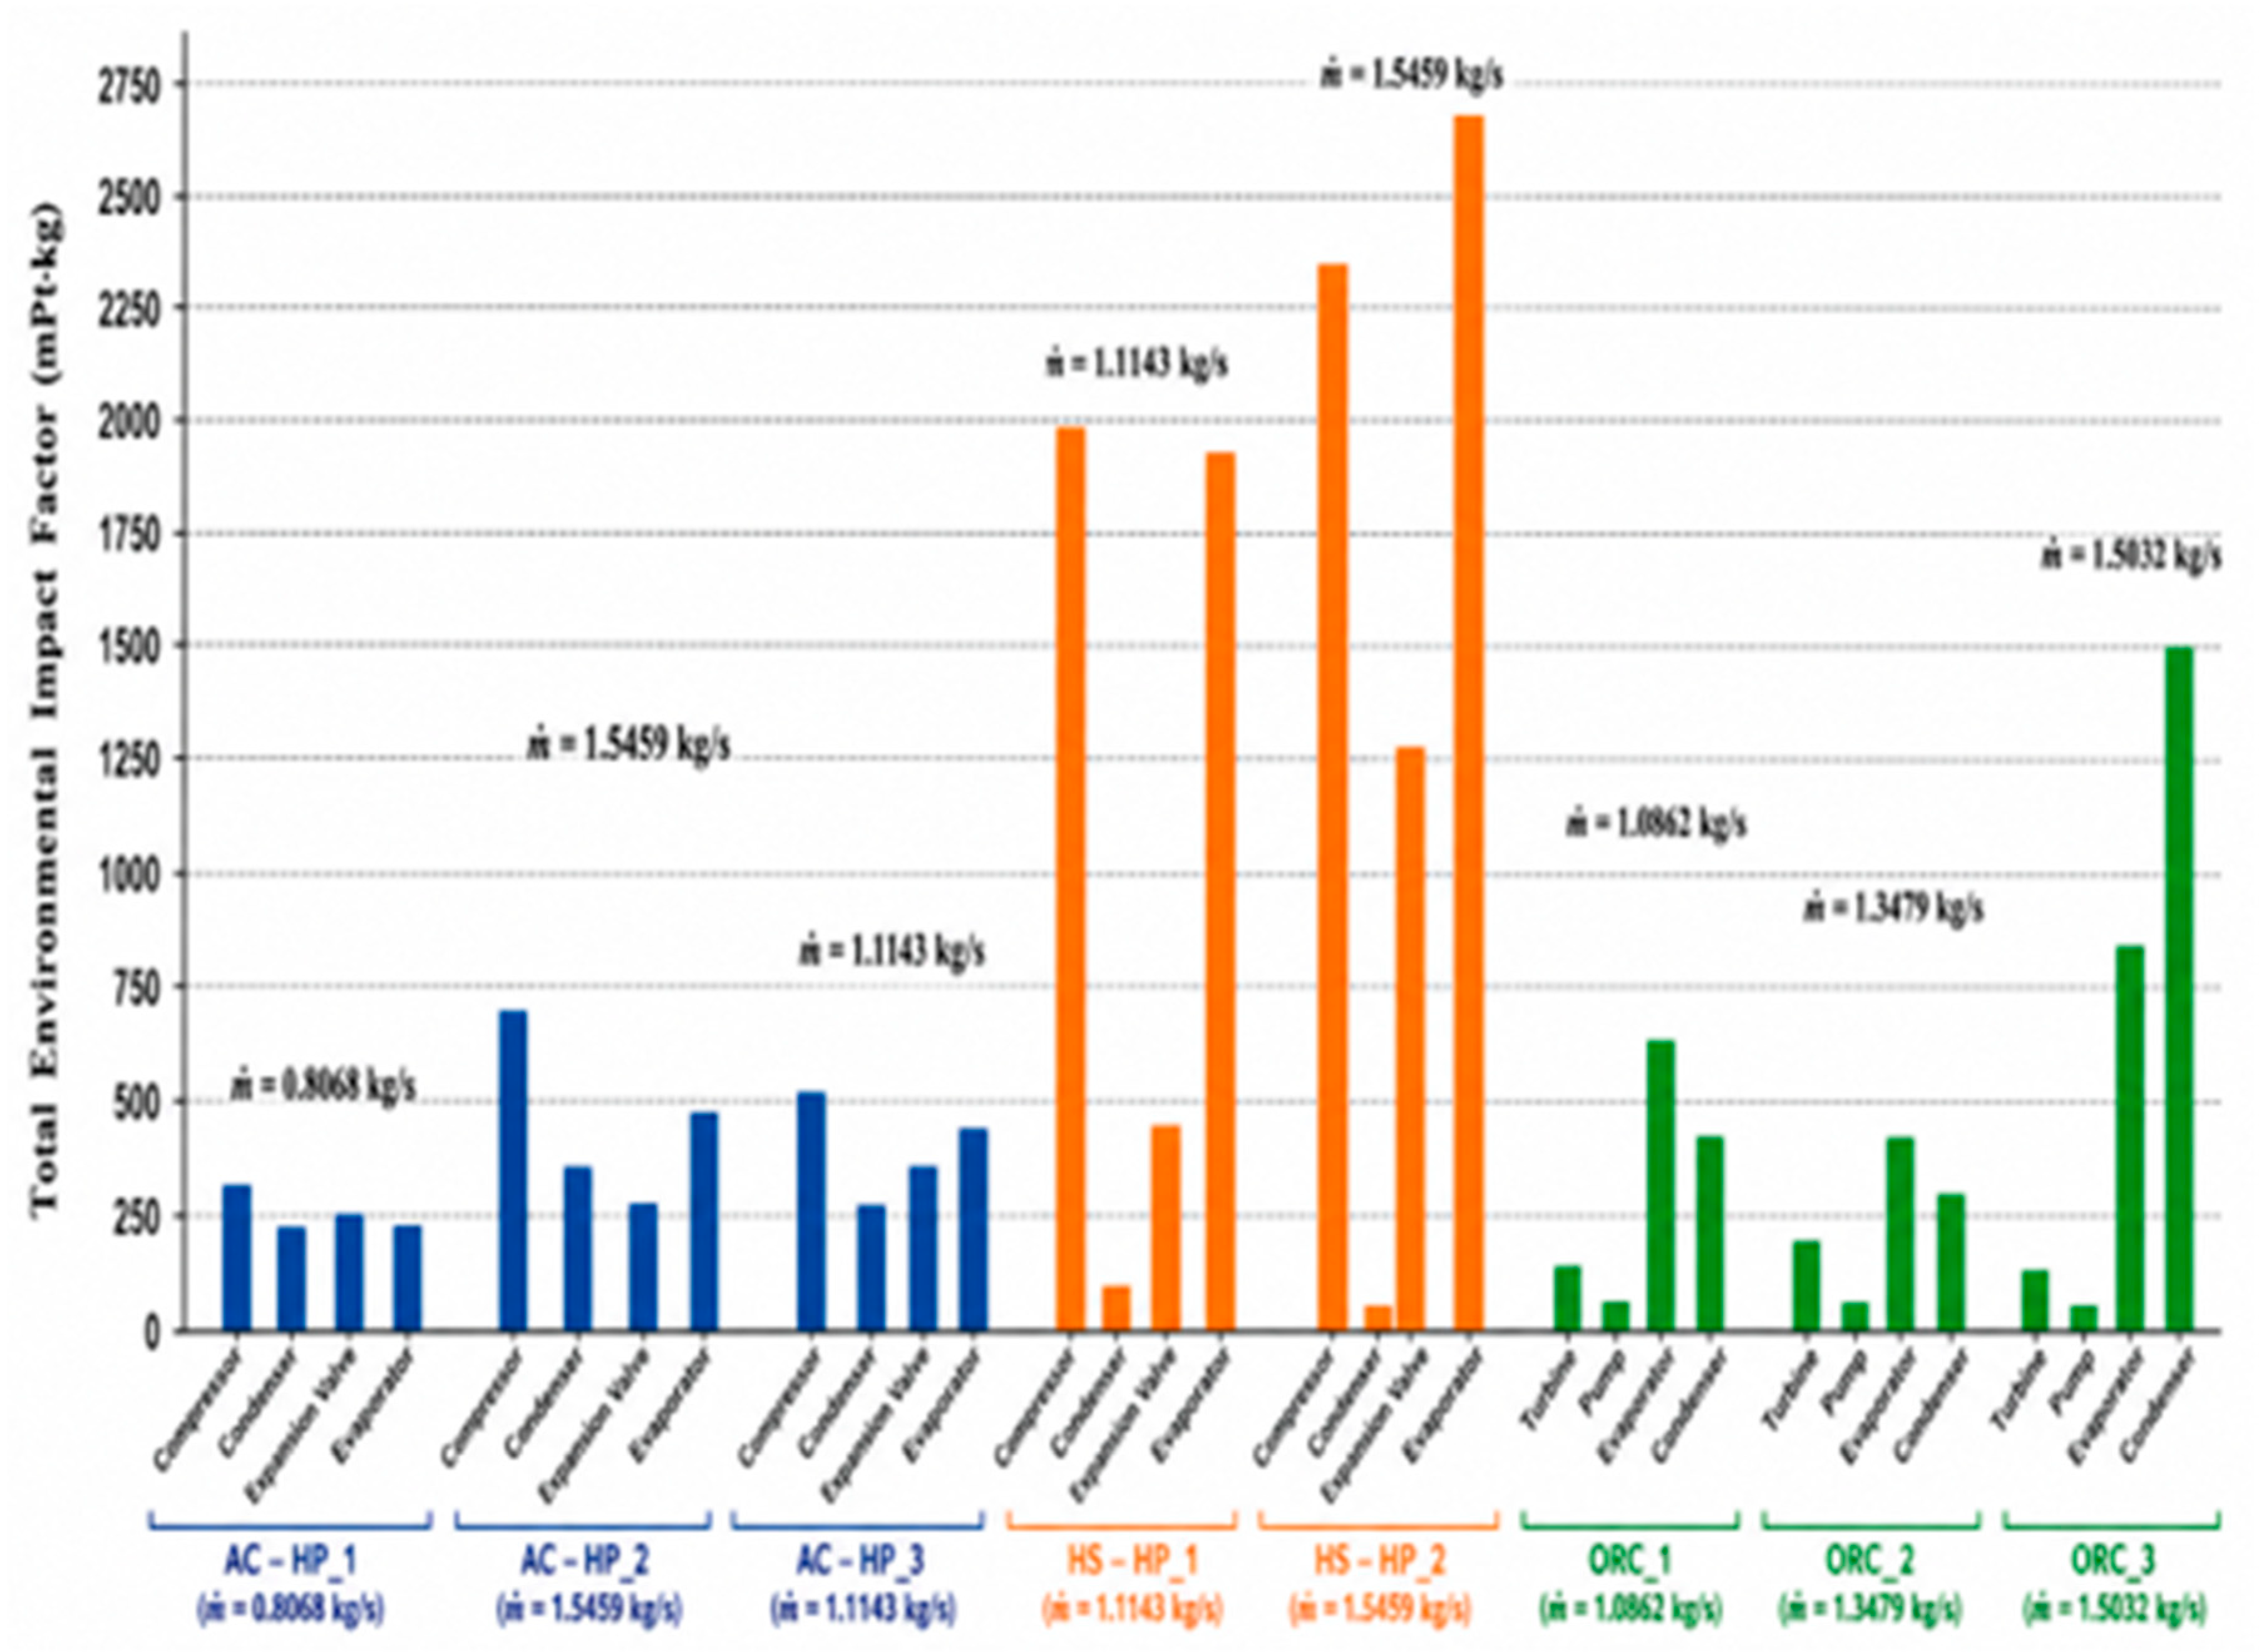
The total environmental impact rate results for all four configurations, detailing the strategic source of each components’ footprint, are presented in Figure 14. The chart displays the total environmental impact rate while visually representing the operating mass flow rate through the varying widths of the bars and specific data labels for each configuration.
In the hot-storage cooled heat pump configurations, the condenser and compressor emerge as the most environmentally critical components. While both show elevated values at high mass flow rates, the condenser exhibits the highest total impact across the entire cycle. This indicates that the thermal rejection process to hot-storage is the primary driver of environmental pressure in these configurations.
For the ORC configurations which operate at the highest mass flow rates in this study, the evaporator represents the peak environment impact. Because these systems utilize an electric heater, the high impact rate in the evaporator is driven by the massive exergy destruction occurring during the conversion of high-grade electricity into thermal energy for the organic fluid.
Comparing the heat pump and ORC modes requires a clear delineation between their energy requirements and services. Essentially, it is noted that heat pump modes are compressor-dominated, ORC modes are evaporator-dominated, and thus the environmental burden in HP mode is mainly electricity-driven, while that in ORC mode is heat-exchange-driven.
The results show that increasing the mass flow rate leads to a proportional increase in environmental impact rate, with marginal change in exergoenvironmental factors and higher dominance of primary energy conversion components. Across all modes, the components with the highest environmental sensitivity are the compressor (HP modes), evaporator (ORC modes) and condenser (hot-storage HP at high flow rate).
Based on the relative environmental difference (r_env) values: compressor efficiency improvement offers the largest environmental mitigation in HP mode; evaporator heat-transfer enhancement is critical in ORC mode; and expansion valve redesign (e.g., replacing with expander) may reduce structural environmental burden in hot-storage HP. Additionally, reducing electricity carbon intensity would dramatically improve overall PTES environmental performance, particularly for compression-driven configurations.
For rural agricultural deployment, ORC mode offers better environmental balance when waste heat or renewable heat is available; air-cooled HP is environmentally preferable to hot-storage HP at equivalent mass flow; and ORC+EH may be suitable when grid electricity is renewable. Thus, configuration selection should depend on local electricity carbon factors, thermal storage source, required operating mass flow rate and crop drying or irrigation load demand pattern.
The analysis demonstrates that environmental impact is primarily governed by exergy throughput rather than destruction. Thermal components dominate environmental burden in power generation mode, mechanical compression dominates environmental burden in storage mode, increasing mass flow increases environmental load but does not significantly alter exergoenvironmental factors. This integrated exergy–environment framework therefore provides a more robust sustainability assessment than standalone thermodynamic analysis (LCA).

5. Conclusions

This study successfully developed and evaluated an integrated heat pump (HP) and organic Rankine cycle (ORC) system using thermodynamic, exergoeconomic, and exergoenvironmental assessment approaches. The findings demonstrate the technical viability and sustainability potential of the proposed system for rural agricultural and off-grid energy applications. The results further highlight the importance of optimal configuration selection, intelligent energy management, and component-level optimization in improving overall system efficiency, economic performance, and environmental sustainability.

5.1. Key Findings and Numerical Outcomes

  • The ORC configuration integrated with an electrical heater (ORC_EH) achieved the highest system exergy efficiency of 31.7%.
  • The hot-storage cooled HP mode recorded a maximum exergy efficiency of approximately 21%.
  • The ORC subsystem independently exhibited a lower exergetic efficiency of 9.93%.
  • The air-cooled HP mode achieved a COP of 2.88 and an exergy efficiency of approximately 20%.
  • The compressor and evaporator were identified as the major contributors to exergy destruction.
  • The air-cooled HP–ORC configuration provided the best balance between efficiency, cost, and environmental sustainability for rural agricultural applications.

5.2. Limitations and Future Work

This study is based on a steady-state thermodynamic model with simplified component assumptions, which may not fully capture transient behavior and real-world operating conditions such as variable solar input and fluctuating cooling demand. The analysis is limited to a specific working fluid and selected operating conditions, while economic and environmental assessments rely on generalized cost data and impact factors. In addition, the integration of the photovoltaic system and ancillary electronics was treated in a simplified manner without detailed modeling of control strategies or power electronics. Future work should focus on dynamic modeling, experimental validation, and the evaluation of alternative working fluids and system configurations. Further improvements could be achieved through the detailed modeling of PV–battery–inverter interactions, incorporation of region-specific economic and environmental data, and investigation of system scalability and real-world deployment for rural agricultural applications.

Author Contributions

Conceptualization, J.O.; Methodology, E.O., J.O. and M.O.; Software, J.O.; Validation, J.O.; Formal analysis, M.O.; Investigation, E.O.; Data curation, M.O.; Writing—original draft, E.O.; Writing—review & editing, M.O. and J.O. All authors have read and agreed to the published version of the manuscript.

Funding

The authors gratefully acknowledge the support received from the project titled “REPTES—Renewable Plants Integrated with Pumped Thermal Energy Storage for Sustainable Satisfaction of Energy and Agricultural Needs of African Communities”, funded under the LEAP-RE program. This project has been supported by the European Union’s Horizon 2020 Research and Innovation Programme under Grant Agreement No. 963530.

Data Availability Statement

The original contributions presented in this study are included in the article. Further inquiries can be directed to the corresponding author.

Conflicts of Interest

The authors declare no conflict of interest.

Nomenclature

Ė x Exergy rate, kW
Mass flow rate, kg/s
ǬHeat rate, KW
Greek letters
ƐExergetic efficiency (-)
ŋEnergetic efficiency (-)
Abbreviations
COPCoefficient of performance
ORCOrganic Rankine cycle
HPHeat pump
AC-HPAir-cooled heat pump
HS-HPHot-storage cooled heat pump
Environmental impact rate (mPt/s)
bEnvironmental impact per unit of exergy (mPt/KJ)
D Environmental impact rate of the exergy destruction (mpt/s)
b f Environmental impact per unit of exergy for fuel (mPt/GJ)
b p Environmental impact per unit of exergy for product (mPt/GJ)
ĊCost rate of streams ($/s)
Ċ D Cost rate of the exergy destruction ($/s)
c f Average cost per unit exergy of fuel ($/kJ)
c p Average cost per unit exergy of product ($/kJ)
f b Exergoenvironmental factor (%)
f b Exergoeconomic factor (%)
ÝComponent-related environmental impact rate (mPt/s)
ŻComponent cost rate ($/s)

References

  1. Majeed, Y.; Khan, M.U.; Waseem, M.; Zahid, U.; Mahmood, M.; Majeed, F.; Sultan, M.; Raza, A. Renewable energy as an alternative source for energy management in agriculture. Energy Rep. 2023, 10, 344–359. [Google Scholar] [CrossRef]
  2. Filho, W.; Gatto, A.; Sharifi, S.A.; Salvia, A.L.; Guevara, Z.; Awoniyi, S.; Mang-Benza, C.; Nwedu, C.N.; Surroop, D.; Teddy, K.; et al. Energy poverty in African countries: An assessment of trends and policies. Energy Res. Soc. Sci. 2024, 117, 103664. [Google Scholar] [CrossRef]
  3. Ghilardi, A.; Frate, G.F.; Kyprianidis, K.; Tucci, M.; Ferrari, L. Brayton pumped thermal energy storage: Optimal dispatchment in multi-energy districts. Energy Convers. Manag. 2024, 314, 118650. [Google Scholar] [CrossRef]
  4. Jiang, X.; Zhang, X.; Wang, R.; Wang, X. Comparative study of thermally integrated pumped thermal energy storage based on the organic Rankine cycle with different working fluid pairs. Front. Energy Res. 2023, 11, 1338391. [Google Scholar] [CrossRef]
  5. Frate, G.F.; Ferrari, L.; Desideri, U. Techno-economic comparison of Brayton pumped thermal electricity storage (PTES) systems based on solid and liquid sensible heat storage. Energies 2022, 15, 9595. [Google Scholar] [CrossRef]
  6. Rabi, A.M.; Radulovic, J.; Buick, J.M. Pumped thermal energy storage technology: A review. Thermo 2023, 3, 396–411. [Google Scholar] [CrossRef]
  7. Xue, X.J.; Zhao, Y.; Zhao, C.Y. Multi-criteria thermodynamic analysis of pumped-thermal electricity storage with thermal integration and application in electric peak shaving of coal-fired power plants. Energy Convers. Manag. 2022, 258, 115502. [Google Scholar] [CrossRef]
  8. Lykas, P.; Bellos, E.; Korres, D.; Kitsopoulou, A.; Tzivanidis, C. Energy, exergy, economic and environmental analysis of a pumped thermal energy storage system for trigeneration applications. Energy Adv. 2023, 2, 1871–1885. [Google Scholar] [CrossRef]
  9. Wang, P.; Li, Q.; Wang, S.; He, C.; Tang, J. Thermo-economic analysis and comparative study of different thermally integrated pumped thermal electricity storage systems. Renew. Energy 2023, 217, 119150. [Google Scholar] [CrossRef]
  10. Hu, S.; Yang, Z.; Li, J.; Duan, Y. Thermo-economic analysis of the pumped thermal energy storage with thermal integration in different application scenarios. Energy Convers. Manag. 2021, 236, 114072. [Google Scholar] [CrossRef]
  11. Madhi, H.; Aljabair, S.; Imran, A.A.; Omle, I. Experimental investigation of graphene-based nanofluid enhanced photovoltaic/thermal system: Energy and exergy analysis. Energy Convers. Manag. X 2025, 26, 100995. [Google Scholar] [CrossRef]
  12. Chen, L.; Wang, J.; Lou, J.; Cheng, Z.; Wang, N.; Cheng, S.; Sun, L. Thermo-economic analysis of pumped thermal energy storage combining cooling, heating and power system coupled with photovoltaic thermal collectors. J. Energy Storage 2024, 96, 112718. [Google Scholar] [CrossRef]
  13. Kotas, T.J. The Exergy Method of Thermal Plant Analysis; Butterworth-Heinemann: Oxford, UK, 2013; Available online: https://shop.elsevier.com/books/the-exergy-method-of-thermal-plant-analysis/kotas/978-0-408-01350-5?utm_source=chatgpt.com (accessed on 27 May 2026).
  14. Cavalcanti, A. Exergy analysis of refrigeration cycles: A review. Energy Convers. Manag. 2017, 112, 167–179. [Google Scholar] [CrossRef]
  15. Weitzer, M.; Reiß, S.; Steger, D.; Kolb, S.; Karl, J. Experimental characterization of a reversible heat pump–Organic Rankine cycle pilot plant as a thermally integrated Carnot battery. Appl. Therm. Eng. 2024, 250, 124872. [Google Scholar] [CrossRef]
  16. Guo, B.; Lemort, V.; Cendoya, A. Control strategy and techno-economic optimization of a small-scale hybrid energy storage system: A reversible HP/ORC-based Carnot battery and an electrical battery. Energy 2025, 329, 135608. [Google Scholar] [CrossRef]
  17. Lazzaretto, A.; Tsatsaronis, A. SPECO: A Systematic and General Methodology for Calculating Efficiencies and Costs in Thermal Systems. Energy 2006, 31, 1257–1289. [Google Scholar] [CrossRef]
  18. Meyer, L.; Tsatsaronis, G.; Buchgeister, J.; Schebek, L. Exergoenvironmental analysis for evaluation of the environmental impact of energy conversion. Energy 2009, 34, 1759–1768. [Google Scholar] [CrossRef]
  19. de Bortoli, A.; Bouhaya, L.; Feraille, A. A life cycle model for high-speed rail infrastructure: Environmental inventories and assessment of the Tours–Bordeaux railway in France. Transp. Res. Part D 2025, 140, 104532. [Google Scholar]
  20. Belman-Flores, J. Experimental evaluation of system modifications to increase R1234ze(E) cooling capacity. Appl. Therm. Eng. 2016, 108, 134–142. [Google Scholar] [CrossRef]
  21. Grauberger, A.; Young, D.; Bandhauer, T. Experimental validation of an organic Rankine–vapor compression cooling cycle using low GWP refrigerant R1234ze(E). Appl. Energy 2022, 307, 118242. [Google Scholar] [CrossRef]
  22. Nie, J.; Wang, K.; Kong, X.; Zhang, H.; Zhang, S. Theoretical Study and Experimental Validation on the Applicable Refrigerant for Space Heating Air Source Heat Pump. Sustainability 2023, 15, 9420. [Google Scholar] [CrossRef]
  23. Turnpenny, J.; Etheridge, D.W.; Reay, D.A. Novel ventilation system for reducing air conditioning in buildings. Part II: Testing of prototype. Appl. Therm. Eng. 2001, 21, 1203–1217. [Google Scholar] [CrossRef]
  24. Cavalcanti, A.; Marcondes, F. Thermodynamic analysis of organic Rankine cycle systems for waste heat recovery. Appl. Therm. Eng. 2018, 142, 511–520. [Google Scholar] [CrossRef]
  25. Nasiri, F.; Aghbashlo, M. Exergy-based sustainability analysis of food production systems. J. Clean. Prod. 2023, 404, 136803. [Google Scholar] [CrossRef]
Figure 1. Schematic diagram of reversible HP/ORC system with PVs and inverters.
Energies 19 03379 g001
Figure 2. Combined exergy analysis.
Energies 19 03379 g002
Figure 3. Exergy analysis for air-cooled HP mode at different refrigerant mass flow rates.
Energies 19 03379 g003
Figure 4. Hot-storage cooled HP mode at refrigerant mass flow rates of 1.5459 kg/s and 1.1143 kg/s.
Energies 19 03379 g004
Figure 5. A graph of ORC system using mass flow rate 1.0862 kg/s.
Energies 19 03379 g005
Figure 6. A graph of economic factor vs. component for air-cooled HP mode.
Energies 19 03379 g006
Figure 7. A graph of relative cost difference vs. component for air-cooled HP mode.
Energies 19 03379 g007
Figure 8. A graph of the sum of destruction cost and component cost vs. component for air-cooled HP mode.
Energies 19 03379 g008
Figure 9. A graph of the sum of destruction cost and component cost vs. component for hot-cooled HP mode.
Energies 19 03379 g009
Figure 10. Block diagram for cost rate flow in hot-storage HP using 1.1143 kg/s ($/b).
Energies 19 03379 g010
Figure 11. Block diagram for cost rate flow in ORC using 1.0862 kg/s ($/b).
Energies 19 03379 g011
Figure 12. Block diagram for exergoenvironmental impact rate flow in air-cooled HP using 1.5459 kg/s (mpts/h).
Energies 19 03379 g012
Figure 13. Combined environmental impact factor vs. components.
Energies 19 03379 g013
Figure 14. Combined exergoenvironmental impact rate vs. components.
Energies 19 03379 g014
Table 1. Component-level exergy modeling equations.
ComponentsExergy of FuelExergy of ProductExergy DestroyedExergy
Efficiency
HP-Evaporator E f , e   =   ( E 4     E 1 ) E p , e   =   E 6     E 5 E D , e   =   E f , e     E p , e E p , e ( E 4 E 1 )
Compressor E f , c   =   W c o m p E p , c   =   ( E 2     E 1 ) E D , c   =   E f , c     E p , c ( E 2 E 1 ) W c o m p
HP-Condenser E f , c o n   =   ( E 2     E 3 ) E p , c o n   =   ( E 8     E 7 ) E D , c o n   =   ( E f , c o n     E p , c o n ) ( E 8 E 7 ) ( E 2 E 3 )
Expansion Valve E f , e x   =   E 3 E p , e x   =   E 4 E D , e x   =   ( E f , e x     E p , e x ) E 4 E 3
Pump E f , p   =   ( E 4     E 5 ) E p , p = PW E D , p   =   ( E f , p     E p , p ) ( E 4 E 5 ) P W
Turbine E f , t u r   =   ( E 2     E 1 ) E p , t u r = TW E D , t u r   =   ( E f , t u r     E p , t u r ) T W ( E 2 E 1 )
ORC-Evaporator E f , p   =   ( E 6     E 7 ) E p , e v a p   =   ( E 1     E 5 ) E D , e v a p   =   ( E f , e v a p     E p , e v a p ) ( E 1 E 5 ) ( E 6 E 7 )
ORC-Condenser E f , c o n   =   ( E 3     E 4 ) E p , c o n   =   ( E 8     E 9 ) E D , c o n   =   ( E f , c o n     E p , c o n ) ( E 8 E 9 ) ( E 3 E 4 )
Table 2. Purchased equipment cost ($).
System ComponentCapital Cost Function ($)
Compressor Z c o m   =   9624.2   W c o m p 0.46
Heat exchanger Z H X   =   1397   A H X 0.89
Expansion valve 114.5   ( r )
Pump 3540   W p u 0.71
Turbine 4405   W t 0.46
Table 3. Exergy cost equations for different components.
System
Components
Equation of CostAuxiliary
Equation
Compressor Z c   +   C 1   +   C w   =     C 2 -
Condenser-HP Z c o n   +   C 2   +   C 7   =     C 8   +   C 3 c 3   =   c 2 ,   c 7   =   c 8
Pump Z p   +   C 4   +   C p   =     C 5 c w p u   =   0.015$/MJ
Evaporator-HP Z e v a p   +   C 4   +   C 5   =   C 1   +   C 6 c 4   =   c 1 ,   c 5   =   c 6
Evaporator-ORC Z e v a p   +   C 5   +   C 6   =   C 1   +   C 7 c 1   =   c 5 ,   c 7   =   c 6
Condenser-ORC Z c o n o r c   +   C 3   +   C 8   =   C 4   +   C 9 c 4   =   c 3 ,   c 8   =   c 9
Turbine Z t u r   +   C 1   =   C 2   +   C t u r c 2   =   c 1 ,   c w T   =   c w p u
Expansion Valve Z e x p   +   C 3   =   C 5 c 3   =   c 5
Table 4. Data used in environmental analysis.
ComponentsMaterials Composition Eco’99 (mPts/kg)Material
(mPts/kg)
Process
(mPts/kg)
Disposal
(mPts/kg)
Total
(mPts/kg)
CompressorSteel 33% 86 Steel low alloy 45% 110 Cast iron 22% 24013011.7−7071.7
CondenserSteel 100% 868612.1−7028
EvaporatorSteel 100% 868612.1−7028
Expander/TurbineSteel 25% 86 Steel high alloy 75% 24070412.1−70646
PumpCast iron 65% 240 steel 35% 8618616.9−70132.8
Disclaimer/Publisher’s Note: The statements, opinions and data contained in all publications are solely those of the individual author(s) and contributor(s) and not of MDPI and/or the editor(s). MDPI and/or the editor(s) disclaim responsibility for any injury to people or property resulting from any ideas, methods, instructions or products referred to in the content.