Review

Resilience of Microgrids to Extreme Weather Events: A Bibliometric Analysis and Review of Control Strategies (2016–2025)


by
Luis Romero-Goytendia
1,
Julio Díaz-Aliaga
1,
Dinau Velazco-Lorenzo
1,
Ernesto Loayza-Mejía
1,
Ulises Piscoya-Silva
1,
Cesar Santos-Mejía
2,
Roberto Solís-Farfán
2,
Jesús Vara-Sanchez
2,
Pablo Morcillo-Valdivia
2,
César Rodríguez-Aburto
2,
Antonio Arroyo-Paz
3 and
Luigi Bravo-Toledo
4,*
1
Faculty of Electrical and Electronic Engineering, National University of Engineering, Lima 15333, Peru
2
Center for Research on Renewable Energy and Hydrogen (CIERH), National University of Callao, Callao 07011, Peru
3
Faculty of Engineering, Universidad Tecnológica del Perú, Lima 15046, Peru
4
Faculty of Environmental Engineering and Natural Resources, Universidad Nacional del Callao, Callao 07011, Peru
*
Author to whom correspondence should be addressed.
Energies 2026, 19(14), 3241; https://doi.org/10.3390/en19143241
Submission received: 27 April 2026 / Revised: 29 May 2026 / Accepted: 31 May 2026 / Published: 9 July 2026
(This article belongs to the Section F1: Electrical Power System)

Abstract

The increasing frequency of high-impact, low-probability climate events has highlighted the limitations of conventional reliability criteria, including N-1 planning assumptions, and the need for dynamic resilience architectures in electrical systems. This article analyzes the evolution, trends, and technological challenges associated with microgrid resilience under extreme-weather disruptions. The study adopts a hybrid research design that combines quantitative bibliometric mapping of 283 Scopus-indexed article records for 2016–2025 using CiteSpace version 7 with a structured technical synthesis of the selected literature. The structural analysis identified nine thematic clusters and indicated a transition from service restoration and component-level recovery toward multi-energy energy-management systems, resilient distribution-system planning, and mobile restoration resources. The technical synthesis shows that modern resilience is increasingly associated with hierarchical control architectures: optimization and forecasting methods support tertiary-level energy management, while grid-forming inverters can provide primary-layer voltage references that support islanded operation and black-start sequences under appropriate design, protection, and validation conditions. The article concludes that future research should bridge stochastic planning and real-time physical operation through standardized interoperability frameworks, reproducible dynamic metrics, and experimentally validated control strategies for autonomous critical microgrid operation under extreme-weather conditions.

1. Introduction

The operational vulnerability of power systems stems, in part, from their legacy of deterministic planning based on “plausible” single-fault contingencies, as well as on lists of contingencies and extreme events formalized in planning standards such as TPL-001 [1,2]. In this article, N-1 refers to the conventional planning criterion according to which the system should withstand the loss of one credible component without unacceptable service interruption; by contrast, high-impact, low-probability (HILP) events can produce multiple correlated outages that violate this independence assumption. Recent evidence shows that extreme weather events impose common-mode faults and simultaneous damage to transmission and distribution assets, extending the duration and severity of outages [3,4], and requiring resilience approaches that capture impact-degradation-recovery phases [5], as well as specific metrics for HILP [6]. At the regulatory level, explicit recognition of the inadequacy of conventional frameworks in the face of concurrent failures caused by extreme heat/cold has led to requirements for performance analysis regarding severe weather events and their potential to cause cascading outages [7,8]. In operational terms, the North American Electric Reliability Corporation (NERC) reports that severe weather continues to pose the greatest threat to the Bulk Power System/Bulk Electric System (BPS/BES) and is associated with the most severe outage events observed in a recent reference year [9,10]. This mismatch between N-1 assumptions and HILP disturbances [11,12] facilitates propagation pathways where overloads, protective trips, and loss of operating margin amplify initial losses into cascading sequences.
Cases such as Superstorm Sandy in 2012 on the U.S. East Coast, which disrupted service to nearly 2 million customers in New Jersey [13]; severe snow and ice storms in the northeastern U.S. and eastern Canada in the early 2010s, causing widespread blackouts [14]; Supercyclone Phailin in India in 2013 [15]; Typhoon Haiyan in the Philippines in 2013, devastating the electrical infrastructure [16]; the extreme snowfall in Slovenia in 2014, affecting more than 100 power stations [17]; Tropical Cyclone Idai in Malawi, Mozambique, South Africa, and Zimbabwe in 2019, leaving more than one million people without electricity and triggering rolling blackouts in South Africa [17]; extreme heat in Australia in 2019, requiring forced blackouts to maintain operations; Typhoon No. 15 in Japan in 2019, causing power outages in nearly 935,000 households in the Kanto region [18]; Hurricane Elsa in Barbados and Saint Lucia in 2021, which caused power outages across the island of Barbados and in 90% of households in Saint Lucia [17]; and the intense windstorms in Europe between 2013 and 2016, causing multiple outages [19,20], illustrate how a single high-impact, low-probability weather event can induce simultaneous, large-scale degradations in generation availability, system operation, and supply, triggering emergency actions, cascading failures, and widespread service outages [21,22]. These events underscore the inadequacy of traditional N-1 planning approaches and highlight the pressing need to develop advanced resilience strategies capable of managing the complexity and uncertainty inherent in extreme weather events [23,24,25].
In this context, a microgrid is defined as a set of distributed loads and energy resources within defined electrical boundaries that functions as a controllable entity and can be connected or disconnected to operate in both grid-connected and islanded modes [26]. The shift from “service continuity” to “resilience” in microgrids depends on multi-layered hierarchical control architectures (primary, secondary, and tertiary), which simultaneously enable local stability, restoration of electrical variables, and coordination of exchanges and operational objectives with the main grid [27]. At the converter level, grid-forming (GFM) strategies implement a voltage-source behavior capable of constructing a waveform and maintaining voltage/frequency reference, enabling stable operation in weak grids and contributing to capabilities such as restarting after blackouts, with a well-documented technical roadmap for deployment in systems with high penetration of inverter-based resources [28,29]. In contrast, grid-following (GFL) strategies typically operate as current sources that synchronize against an external reference, so their ability to sustain islanded operation depends on the existence of a firm voltage source, a limitation highlighted in the anti-islanding and interconnection literature [29]. At the supervisory level, the energy management system (EMS) dispatches resources, balances power and energy, and coordinates constraints for autonomous or grid-connected operation, including seamless transitions between operating modes [30,31]. Microgrid controllers also include transition functions for planned and unplanned islanding, reconnection, and black-start, while black-start is defined as the ability to initiate self-generation and sequentially re-energize the microgrid as an island in the absence of a grid connection, relying on an auxiliary start-up source [29].
Existing reviews provide important but partial coverage of power-system resilience under extreme weather events. One strand characterizes meteorological impacts on transmission and distribution components, stochastic modeling challenges, and infrastructure-scale mitigation measures [32,33,34,35,36]. A second strand focuses on EMS-oriented optimization and decision-making in microgrids [37,38], whereas a third examines hierarchical control by comparing primary, secondary, and tertiary layers and their objectives [39]. However, these bodies of literature are often weakly connected: reviews on extreme events do not always address the control functions required for islanding, black-start, and service continuity, while EMS/control reviews frequently treat resilience as an operational objective without explicitly connecting it to HILP-induced correlated failures [40,41]. Therefore, a critical gap remains at the intersection of HILP threats, bibliometric evolution, and control strategies that enable microgrids to maintain or recover critical services after severe weather disruptions.
In rapidly expanding fields, bibliometric analysis offers a quantitative mechanism for mapping intellectual structure, identifying emerging clusters, evolutionary trajectories, and burst nodes through co-citation, bibliographic-linkage, and keyword co-occurrence analyses, thereby reducing selection biases and enhancing methodological traceability [42]. CiteSpace is used in this study as a specialized bibliometric analysis and visualization tool, rather than as a methodology by itself, because it operationalizes science mapping through dynamic visualizations of bibliometric networks, thematic clusters, and evolutionary timelines derived from large databases [43]. The hybrid design of this article lies in the combination of bibliometric quantification with a structured technical synthesis, an approach recently adopted in studies of electrical-system and microgrid resilience to extreme weather events [44,45]. This design addresses the nexus between HILP threats and control topologies for islanding, black-start, and seamless recovery, while identifying critical gaps in operational resilience capabilities.
Therefore, this article presents a hybrid study that integrates quantitative bibliometric analysis using CiteSpace with a structured technical synthesis of the literature. The study is guided by three research questions: RQ1: How has scientific production on microgrid resilience under extreme weather evolved between 2016 and 2025? RQ2: Which institutions, countries, journals, keywords, and co-citation clusters structure the field? RQ3: How do the dominant bibliometric clusters relate to technical control strategies—EMS, stochastic planning, mobile restoration resources, reinforcement learning, and grid-forming/grid-following control—that enable islanding, black-start, and seamless recovery? By answering these questions, the article explicitly links HILP climate threats with hierarchical control topologies and operational functions that determine dynamic resilience and service continuity in microgrids.

2. Theoretical Framework

2.1. From Service Continuity to Dynamic Resilience

The conceptual transition from traditional reliability—focused on high-probability, low-impact events and evaluated under the N-1 criterion that assumes independent and statistically treatable failures in a quasi-stationary regime [46,47]—toward dynamic resilience in electrical systems and microgrids responds to the urgent need to address high-impact, low-probability weather events [46]. Dynamic resilience refers to the system’s ability to resist, absorb, adapt, and recover rapidly from correlated and simultaneous failures caused by hurricanes, heat waves, severe winter storms, or massive floods [48,49].
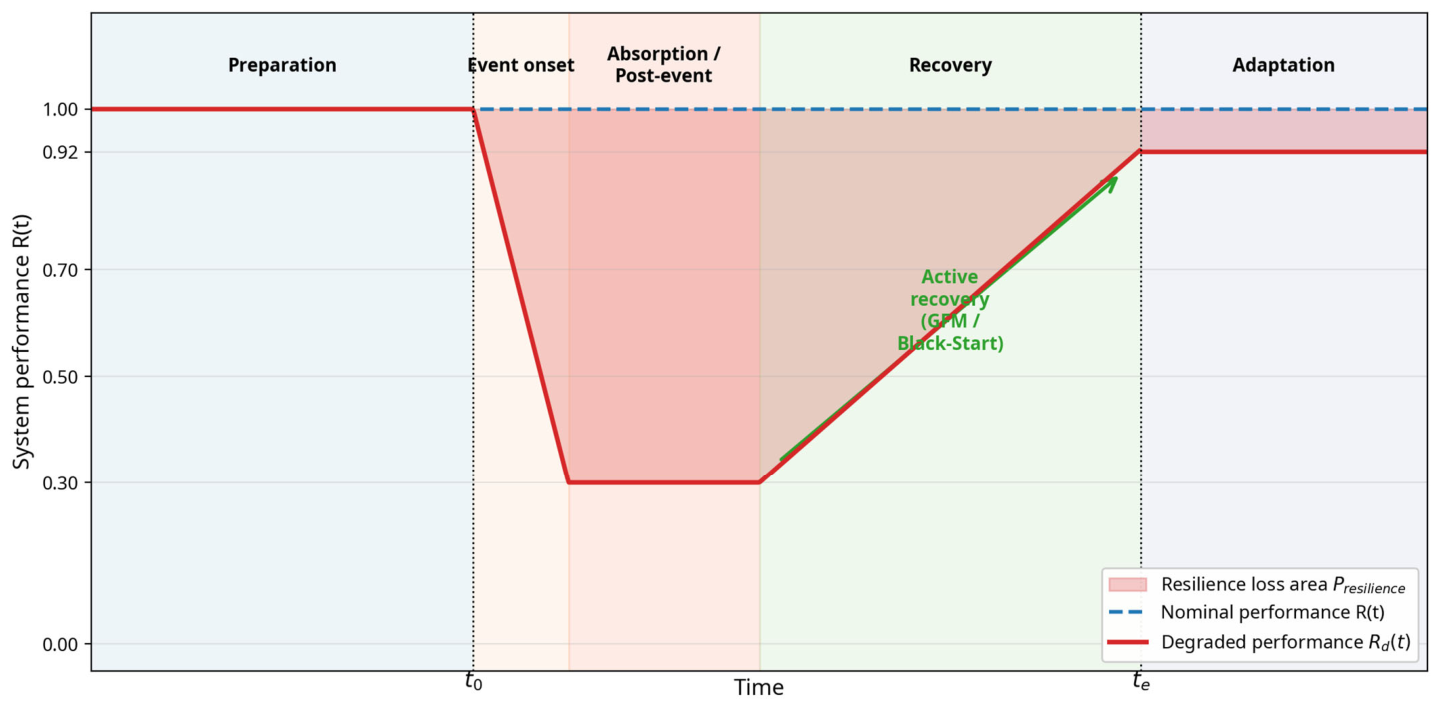
This difference is not merely semantic: N-1 assumptions of independent failures prove insufficient when HILP disturbances produce multiple correlated losses and cascade trajectories [24,47,50]. Critical events such as the extreme cold in Texas in February 2021 [51,52,53] and the annual Bulk Power System performance reports published by NERC show that a single severe weather event can induce simultaneous large-scale degradations in generation availability including common exposure failures triggering protective trips and loss of operating margin that amplify the initial contingencies [54]. To capture this phenomenon, recent studies propose multi-criteria metrics based on the Choquet integral and graph theory, which overcome the limitations of conventional static indices [55,56,57]. In this context, resilience can be mathematically formalized through the system-performance trajectory during the time window of the disruptive event, expressed as:
P resilience = t 0 t e [ R ( t ) R d ( t ) ] d t
This formulation, commonly associated with the resilience trapezoid, quantifies the area of performance loss rather than resilience as a positive stock. By subtracting the degraded performance Rd(t) from the nominal performance R(t), the integral evaluates both the magnitude and duration of the impact of the extreme event between the onset of the disturbance (t0) and full recovery (te) [58,59]. Consequently, a smaller integral indicates lower service degradation or faster restoration, whereas a larger integral indicates deeper or longer performance loss.
Figure 1 illustrates the resilience trapezoid through the temporal evolution of a normalized performance function P(t) [5,60]. The initial degradation phase represents robustness and absorption capacity; a less steep decline indicates a better capacity to preserve service after the disturbance, whereas the minimum point represents the severity of operational degradation. The shaded area should be interpreted as loss of performance, calculated by integrating the difference between nominal and degraded performance. The recovery phase captures the speed with which the microgrid restores operating conditions, a process in which black-start capabilities of grid-forming inverters and control algorithms aligned with IEEE 2030.7 can reduce outage duration under suitable design and protection conditions [61]. Finally, the adaptation stage represents the possibility of reaching a more robust post-event state, moving beyond the static view of traditional reliability.

2.2. Hierarchical Control Architecture in Resilient Microgrids

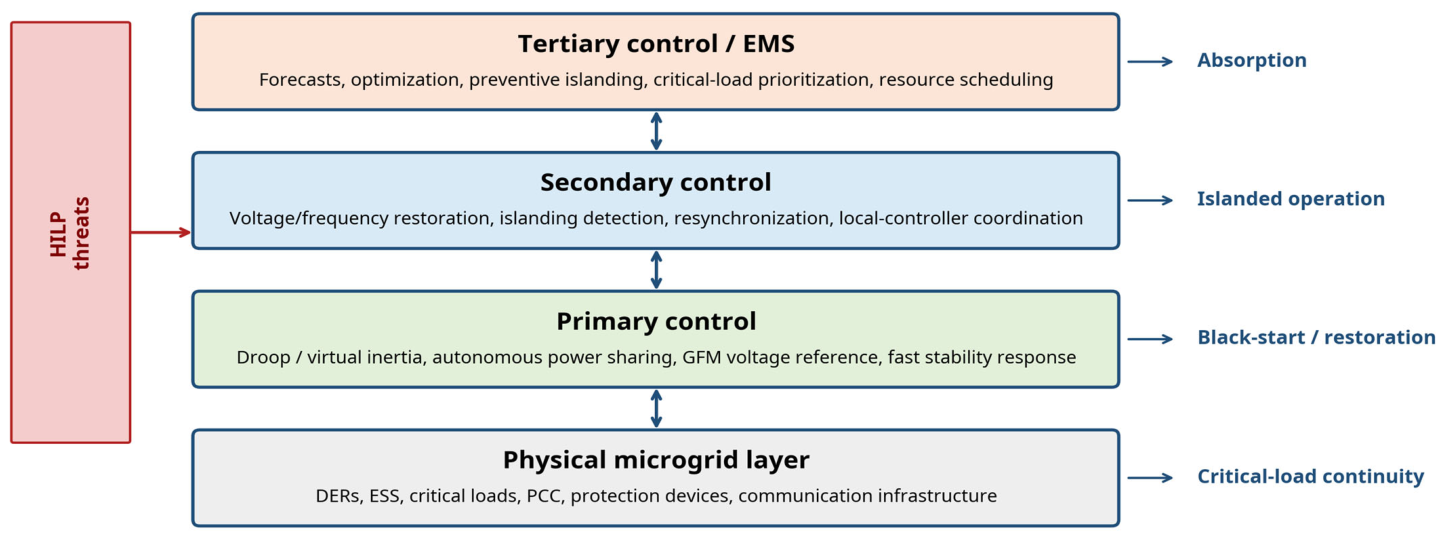
The hierarchical architecture in Figure 2 organizes microgrid control into levels to support continuity in the face of extreme weather events [32,40]. At the tertiary level, the EMS manages proactive dispatch using optimization models that integrate forecasts to preserve critical energy reserves [31,62]. Under the Under the IEEE 2030.7 standard this level can support preventive isolation and logical reconfiguration of the grid in the face of severe disturbances [63,64,65].
The secondary level acts as a technical link to correct frequency and voltage deviations, ensuring accurate islanding detection following disconnection from the main grid [40,66]. Its role is vital for resilience by managing safe transitions and preventing unnecessary tripping of protection systems during the event’s impact [63,67,68]. Likewise, this level coordinates the resynchronization necessary for a safe return to normal operation once the environment has stabilized [63].
At the primary level, fast stability support is provided through inertial response emulation, local voltage/frequency regulation, and autonomous power sharing [66,69]. Here, GFM inverters are important because they can establish voltage and frequency references that support islanded operation and black-start sequences when protection, synchronization, and resource-adequacy requirements are satisfied [29,70]. This hierarchical structure can reduce initial performance loss, accelerate restoration, and support post-event adaptation, although the magnitude of these benefits depends on system design and validation context [71].
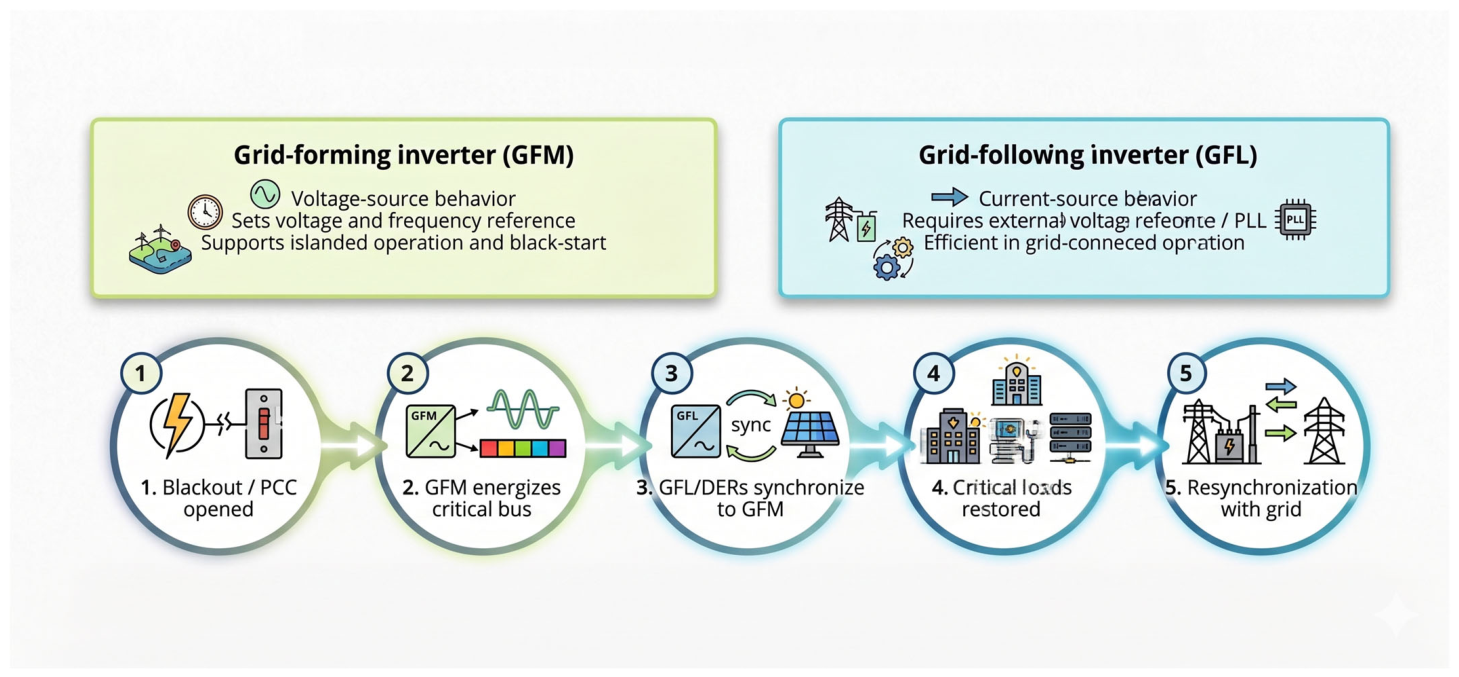
For post-disaster resilience, the feasibility of recovery depends partly on the inverter-control taxonomy in the primary layer, particularly the distinction between GFM and GFL strategies introduced above [72,73]. Figure 3 summarizes their functional differences and their relationship with a black-start sequence. GFM strategies emulate voltage-source behavior and can impose voltage and frequency references [29,74]. These characteristic supports operation in weak grids, autonomous supply of critical loads, and the initial energization of a critical bus after a blackout. By contrast, GFL strategies operate as controlled current sources that generally require a phase-locked loop to synchronize with an external voltage reference, either the main grid or a GFM unit. Consequently, GFL inverters are suitable for grid-connected operation but cannot normally sustain an islanded system without a firm voltage reference [29,74].
Taken together, Figure 3 establish the theoretical link between resilience metrics and control implementation. The trapezoid defines the performance loss that the system seeks to minimize, while the hierarchical architecture and the GFM/GFL taxonomy identify the technical mechanisms that affect each phase of the curve: tertiary EMS and stochastic scheduling reduce pre-event exposure, secondary control supports safe transitions and resynchronization, and primary GFM control enables voltage-reference formation and black-start during islanded restoration. This link is used in Section 4 and Section 5 to interpret the bibliometric clusters as operational resilience capabilities rather than only as publication topics.

3. Materials and Methods

3.1. Database

Data were collected from the Scopus database using the following search string: TITLE-ABS-KEY (microgrid* OR “micro grid” OR microrred*) AND TITLE-ABS-KEY (resilien* OR “grid resilience” OR “power system resilience”) AND TITLE-ABS-KEY (“extreme weather” OR “severe weather” OR hurricane* OR typhoon* OR cyclone* OR storm* OR flood* OR wildfire* OR heatwave* OR “heat wave” OR “cold snap” OR blizzard* OR blackout* OR outage*) AND TITLE-ABS-KEY (“hierarchical control” OR “distributed control” OR “multi-agent” OR “inverter control” OR “grid-forming” OR “droop control” OR “virtual inertia” OR EMS OR dispatch* OR schedul* OR MPC OR island* OR “adaptive protection” OR reconfigur* OR “self-healing” OR “black start” OR “load shedding”) AND NOT TITLE-ABS-KEY (“public policy” OR “energy policy” OR “policy framework” OR “regulatory framework” OR “market design” OR tariff*) AND PUBYEAR > 2015 AND PUBYEAR < 2026 AND SUBJAREA (ENER OR ENGI OR COMP OR MATH) AND DOCTYPE (ar). The final corpus consisted of 283 article records retrieved from Scopus on 25 February 2026 after topical relevance screening, duplicate removal, and exclusion of the three records indexed in 2015. Therefore, all bibliometric analyses, figures, annual counts, and interpretations are aligned with the January 2016–December 2025 study window.
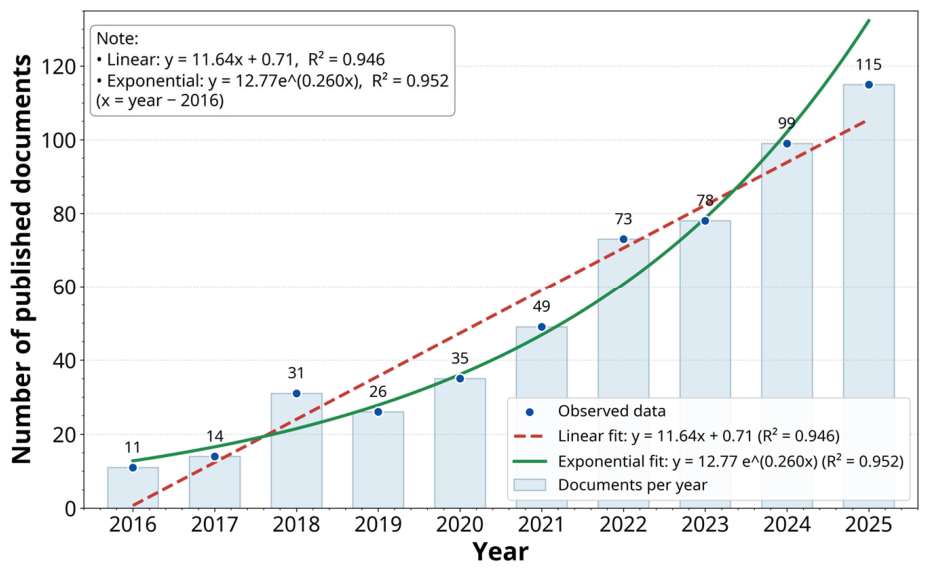
Figure 4 shows a sustained upward trend in publication output during 2016–2025, increasing from 11 records in 2016 to 115 records in 2025. After excluding the three 2015 records to align the analysis with the stated decade, the descriptive linear fit is y = 11.64x + 0.71 (R2 = 0.946) and the exponential fit is y = 12.77e0.260x (R2 = 0.952), where x = year − 2016. These curves are used only as descriptive summaries of past publication behavior rather than as forecasts, because 2025 indexing may still be incomplete and future growth can be affected by database coverage and publication delays.

3.2. CiteSpace Analysis Parameters and Techniques

Bibliometric analysis encompasses a set of quantitative methods for measuring, tracking, and analyzing scientific literature using statistical and computational techniques [75]. Knowledge maps generated through bibliometric analysis allow researchers to gain an intuitive and in-depth understanding of the current landscape of a disciplinary field, while rigorously capturing emerging trends [76]. CiteSpace was selected as the bibliometric analysis and visualization tool because it supports multivariate, temporal, and dynamic visualizations of citation networks [77]. Developed by Professor Chaomei Chen [78], the application offers advantages for cluster detection, research-frontier identification, burst analysis, and workflow reproducibility [79,80].
Unlike traditional literature reviews limited to descriptive syntheses of topics, publication volumes, and thematic domains, the bibliometric approach is useful for datasets such as this one (283 documents), as it enables metric mapping of knowledge and tracks the dynamic evolution of the field. Various bibliometric visualization platforms coexist, including VOSviewer version 1.6.20 [81], and Bibliometrix version 5.4.0. [82]; CiteSpace was selected because of its suitability for multivariate, temporal, and dynamic literature maps and its ability to detect focal points, turning points, and burst terms [43,82]. The study adopted CiteSpace version 6.2.R4. The workflow (Figure 5) consisted of: (i) exporting Scopus records in a format compatible with CiteSpace; (ii) screening the records for topical relevance to microgrid resilience, HILP weather disturbances, and control or restoration functions; (iii) importing and deduplicating the final corpus of 283 records; (iv) setting the time frame from January 2016 to December 2025 with annual time slices; (v) using title, abstract, author keywords, and indexed terms as terminology sources; (vi) prioritizing the top 50 items per slice; (vii) applying pruning to improve network readability; and (viii) constructing collaboration, co-occurrence, co-citation, timeline, and burst networks. These steps are reported to make the bibliometric analysis reproducible and to clarify that CiteSpace is the analytical tool within a broader hybrid design rather than the full methodology. Table 1 summarizes the protocol parameters that support reproducibility of the bibliometric corpus and CiteSpace configuration.
In the Table 1 reports the database source, screening decisions, search fields, time slicing, and CiteSpace settings used to construct the analytical corpus, it is placed in the methodology rather than in the results. Its function is to document the reproducibility protocol and to distinguish the bibliometric mapping procedure from the subsequent interpretation of collaboration, co-occurrence, co-citation, timeline, and burst results.

4. Results

4.1. Institutional Analysis

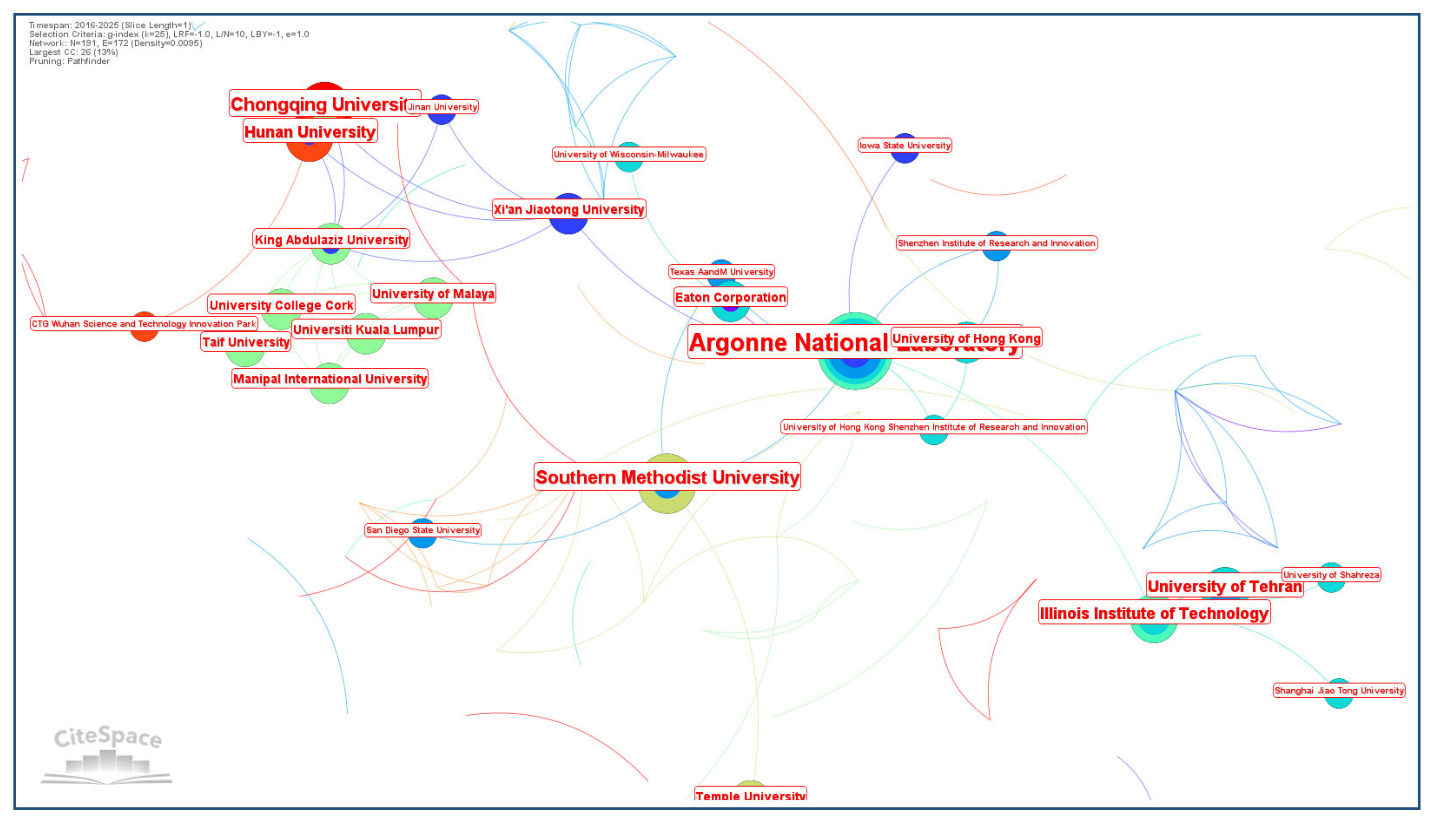
The institutional collaboration network suggests a field structured around a limited number of bridging institutions and several productive but less connected clusters. Argonne National Laboratory has the highest betweenness centrality among the listed institutions (0.03), which indicates a comparatively important bridging position in the mapped collaboration network since 2016 (Table 2). Islamic Azad University has the highest publication count in the table (12 records) but lower centrality (0.01), suggesting that publication volume and network brokerage do not necessarily coincide. The visualization also indicates a geographically distributed but fragmented network, with visible institutional groups in the United States, China, and Iran. These results should be interpreted as bibliometric patterns of collaboration rather than direct measures of institutional research quality or operational influence (Figure 6).

4.2. Author Analysis

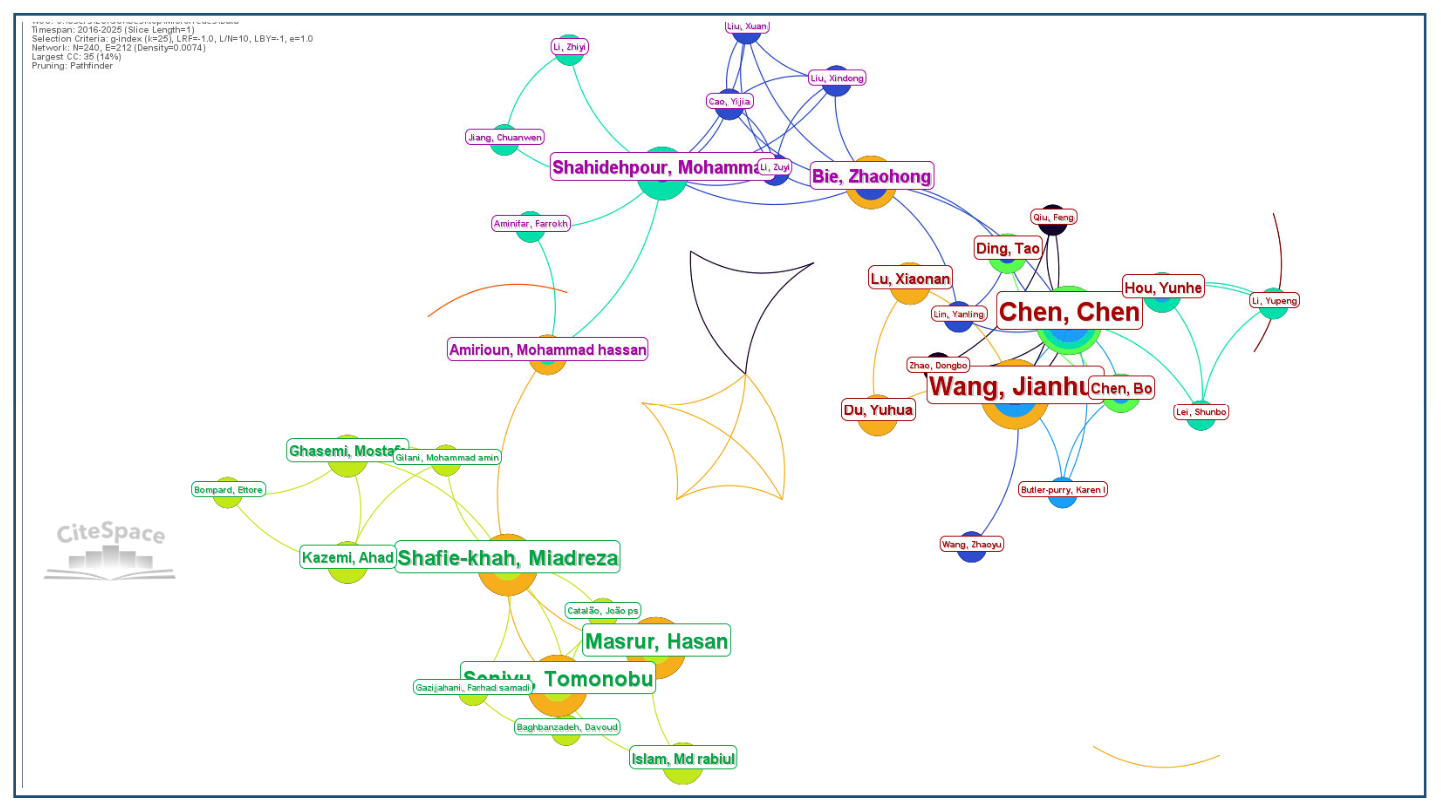
The co-authorship network and productivity indicators show that structural connectivity is not always proportional to publication volume. Chen, Chen appears as one of the most connected authors in the mapped network, with betweenness centrality of 0.02 since 2016, while other authors with larger publication counts, such as Cai, Sheng, have lower centrality (Table 3). This pattern indicates a distinction between authors who function as bridges among subcommunities and authors whose output is concentrated within narrower collaboration groups. The interpretation remains bibliometric: the results identify collaboration structure and potential integration opportunities rather than ranking individual scientific quality (Figure 7).

4.3. Keyword Co-Occurrence Analysis

The keyword co-occurrence analysis indicates an intellectual structure that has evolved from operational response and restoration topics toward a broader design framework centered on microgrid resilience (Table 4). Although the term “Microgrid” dominates publication volume, the centrality of “Outages” (0.20) suggests that service-interruption mitigation connects several research lines in the corpus. Chronologically, the map points to a transition from technical and methodological foundations, such as distribution systems and integer programming, toward integrative resilience-oriented research. This pattern should be interpreted as evidence of thematic consolidation in the literature, not as direct proof that all proposed technologies have reached operational maturity [83].

4.4. Country-Based Analysis

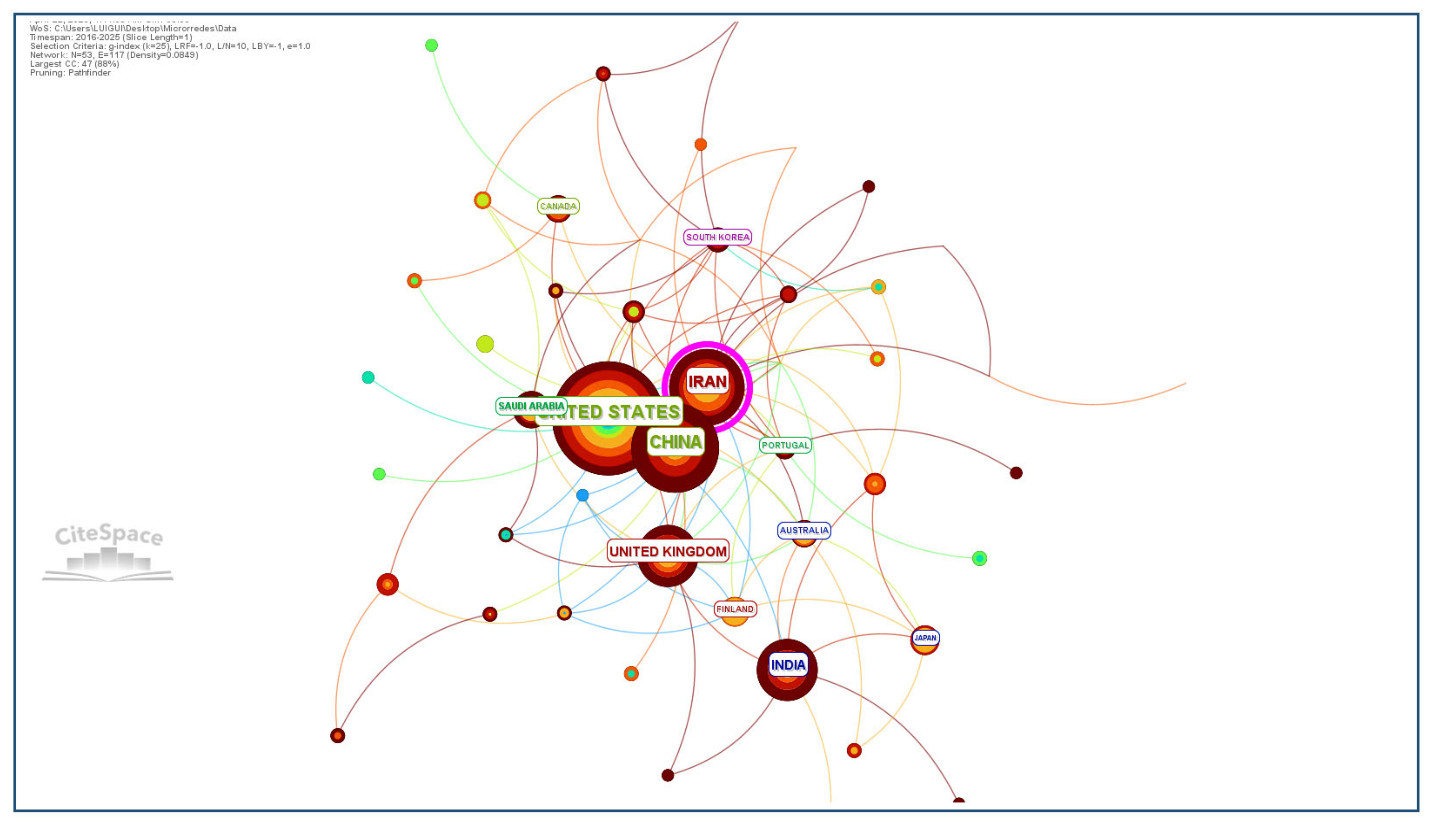
The international collaboration network indicates a global structure in which the United States, Iran, and China occupy prominent but different roles. The United States contributes the largest number of records in the corpus, while Iran has the highest betweenness centrality (0.60), indicating a strong brokerage position in the mapped country network (Table 5). China ranks highly in publication volume but has comparatively lower centrality (0.12), suggesting a more concentrated collaboration pattern in this dataset. The presence of India, the United Kingdom, Australia, and Canada also points to geographic diversification. These findings should be read as bibliometric evidence of collaboration patterns rather than as direct measures of national technological capability (Figure 8).

4.5. Journal Analysis

The journal co-citation analysis reveals a specialized intellectual base concentrated in power-engineering, smart-grid, energy, and storage outlets. IEEE Transactions on Smart Grid has the highest citation count and betweenness centrality in the mapped set, indicating that it is a major source connecting research on smart microgrids and resilience. IEEE Access and Energy also have substantial centrality values, suggesting that they function as important dissemination channels for technical, economic, and energy-management studies (Table 6). The emergence of Sustainability and the Journal of Energy Storage around 2021 suggests an expansion of the field toward storage solutions and sustainability-oriented frameworks. These findings describe the citation structure of the corpus and should not be interpreted as journal rankings beyond this dataset.

4.6. Cluster Identification and Analysis (Knowledge Domain)

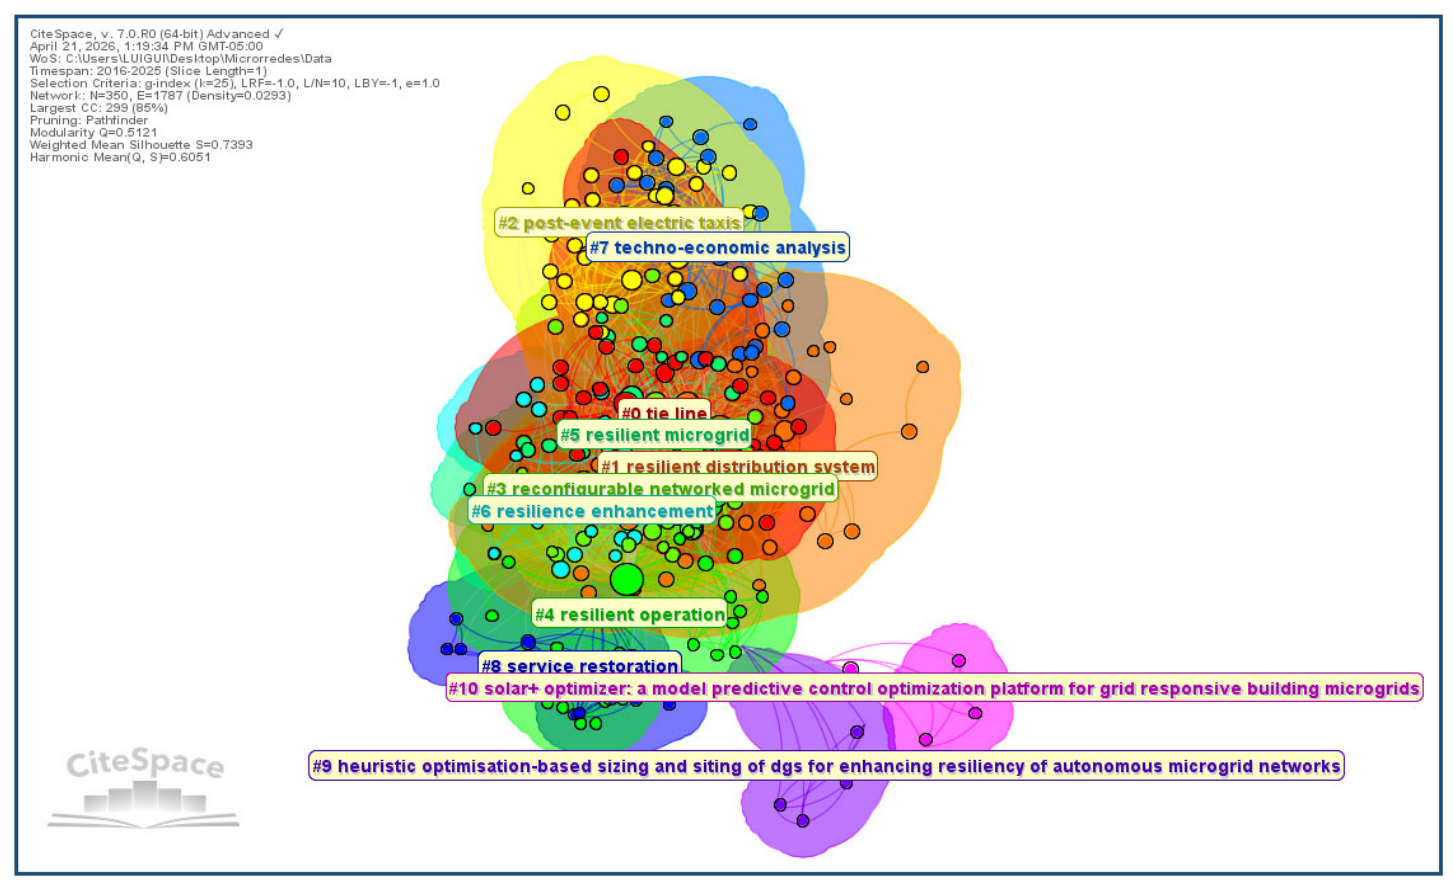
The document co-citation map and cluster metrics reveal a differentiated scientific structure, supported by Q-modularity of 0.5121 and an average silhouette of 0.7393, indicating an interpretable division of knowledge areas. The dominant cluster (#0), with 43 records and a median year of 2017, focuses on outage-resilient energy-management frameworks and represents one of the dense cores of the mapped field. The cluster structure suggests an evolution from service-restoration topics toward networked microgrids, mobile resources, and techno-economic resilience analyses. Overall, these results indicate a thematic transition in the literature; they do not by themselves demonstrate field deployment or operational effectiveness (Figure 9).
Figure 9. Visualization map of clusters in the document co-citation network. Source: authors’ own CiteSpace visualization from the corrected Scopus corpus. The colored regions represent algorithmically detected co-citation clusters; the figure supports the identification of thematic groupings, while the detailed interpretation relies on cluster metrics reported in Table 7.
Energies 19 03241 g009
Table 7. Statistical characteristics and thematic tags of the main identified clusters.
NSizeSilhouetteMeanLabel (LSI/LLR)
0430.6532017Tie Line; Outage-Resilient Energy Management Framework; Extreme Event; Economic Performance
1410.7732012Resilient Distribution System; Supply Resilience; Distribution System Restoration; Resilience Enhancement
2400.8242013Post-Event Electric Taxis; Hierarchical Scheduling Framework; Resilience Enhancement; Renewable-Based Microgrid
3400.6292007Reconfigurable Networked Microgrid; Hierarchical Outage Management; Enhancing Power System Resilience
4290.7922002Resilient Operation; Critical Infrastructure; Distribution System; Networked Microgrid Scheduling
5280.5842011Resilient Microgrid; Stochastic Extreme Event; Backup Generator; Islanded Mode; Proactive Management
6250.6642015Resilience Enhancement; Robust Planning Model; Distribution Grid Resilience; Natural Disaster
7250.8172016Techno-Economic Analysis; Movable Energy Resource; Enhanced Resilience; Robust MPC-Based Microgrid
8130.9261991Service Restoration; Extreme Weather Event; Self-Healing Resilient Operation; Active Distribution Network

4.7. Analysis of the Evolutionary Trajectory of Research

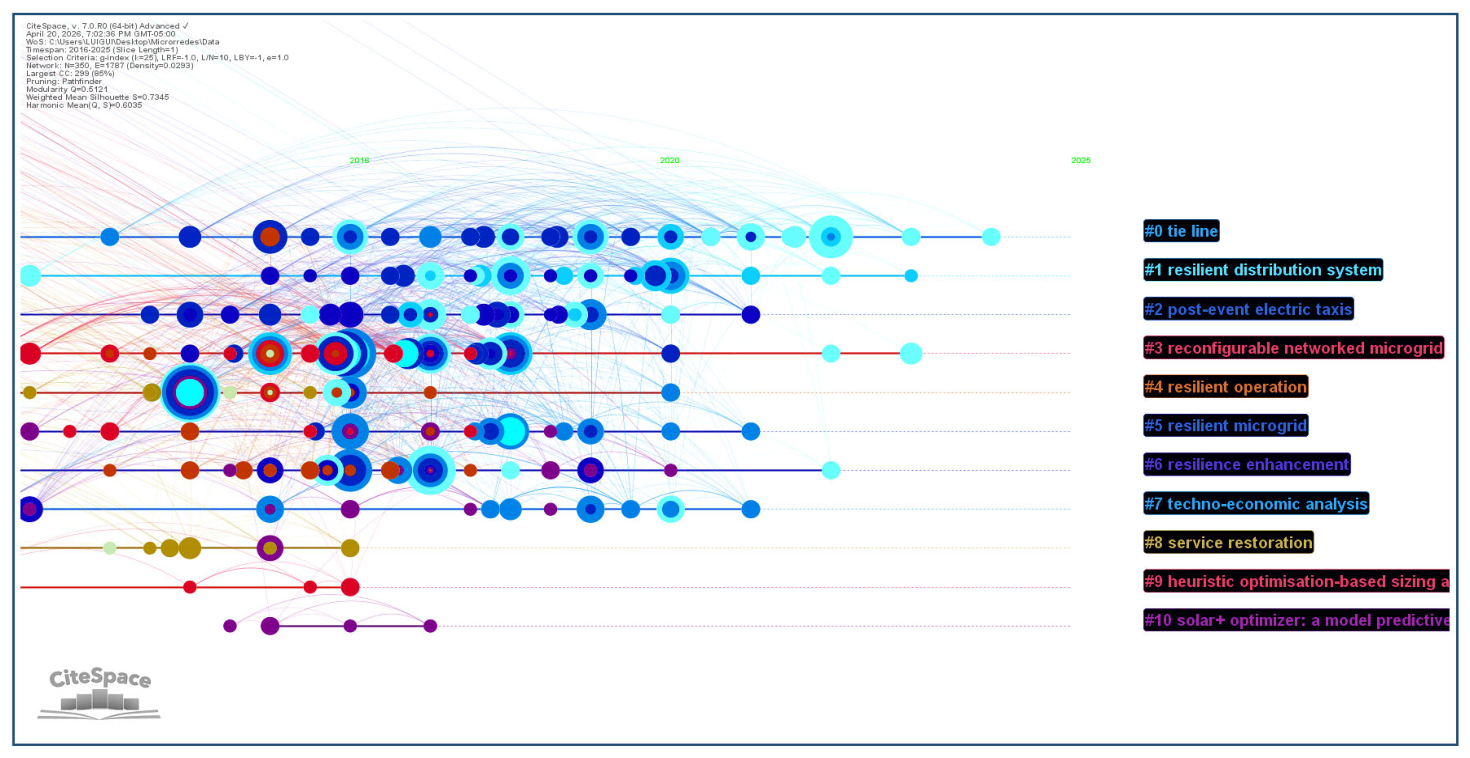
The visualization of the cluster timeline suggests an intellectual evolution from service-restoration fundamentals toward more interconnected and proactive resilience themes. Clusters #8 (service restoration) and #3 (reconfigurable networked microgrid) show concentrated activity between 2016 and 2018, whereas clusters #0 (tie line) and #1 (resilient distribution system) remain visible in later time slices and include recent nodes toward 2024–2025. Cluster #2 (post-event electric taxis/mobile resources) indicates growing attention to mobile and flexible resources for disaster recovery. This longitudinal pattern supports a literature-based interpretation of thematic shift; it should not be read as causal evidence that the corresponding technologies are already deployed at scale.
Figure 10 should be read from left to right as a temporal map of thematic persistence. Each horizontal line corresponds to a co-citation cluster, nodes indicate cited documents positioned by year, and larger or warmer-colored nodes represent stronger citation influence or burst behavior. Therefore, the figure is not a causal diagram; it is a bibliometric visualization that helps identify when each topic became active and how long it remained relevant within the corpus.
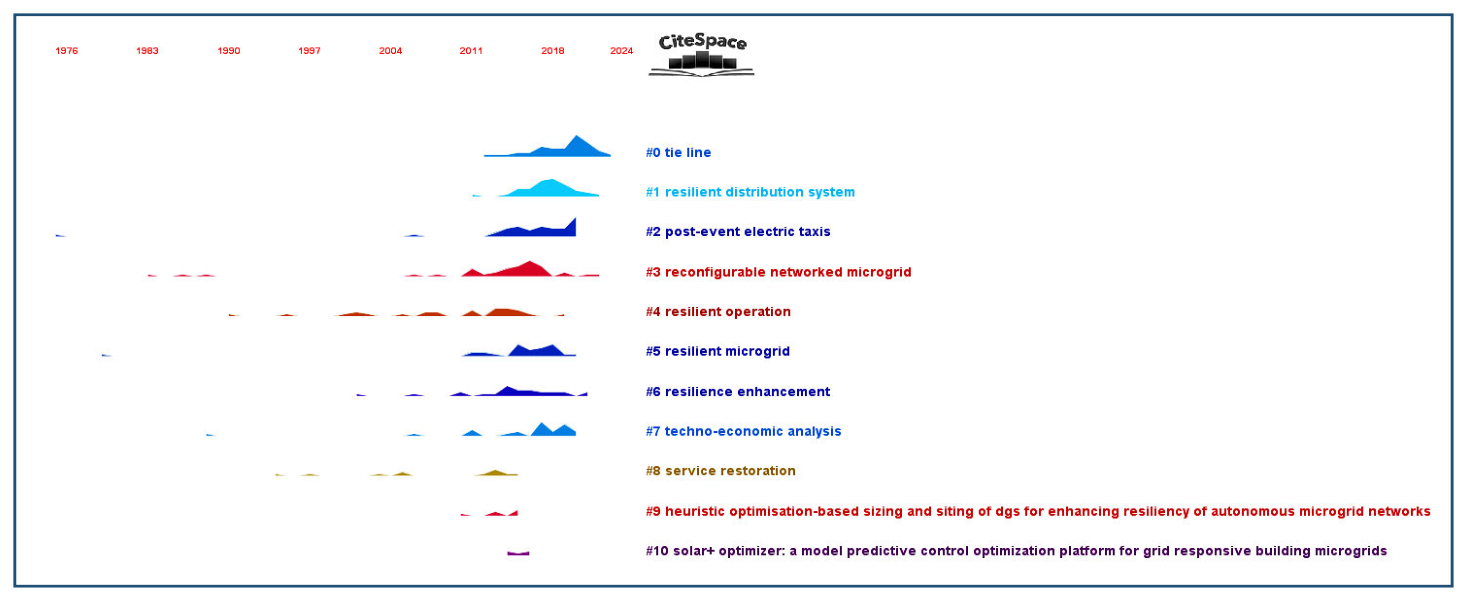
The temporal distribution of research intensity by clusters complements the previous timeline by summarizing how strongly each cluster appears across the study period. Brighter or denser regions indicate periods in which publications and citations are concentrated within a given thematic line, whereas faded regions represent declining activity. Foundational clusters such as #8 (service restoration) and #9 (heuristic optimization) have lower recent intensity after their historical peaks, while clusters #0 (tie line) and #1 (resilient distribution system) maintain substantial activity during the most recent decade. Cluster #2 (post-event electric taxis/mobile resources) exhibits a recent increase, suggesting growing interest in mobile and flexible resources for disaster recovery. Thus, Figure 11 should be interpreted as complementary evidence of a shift from isolated restoration techniques toward resilient and interconnected distribution systems.
In Figure 11, the vertical ordering follows the cluster labels produced by CiteSpace, while the horizontal dimension represents time. The intensity bands indicate the relative concentration of activity within each cluster. This visualization supports the interpretation that resilient distribution systems, tie-line/interconnection topics, and mobile post-event resources have become more visible in the recent literature, whereas earlier service-restoration topics are less dominant in the latest slices. Because this figure is visually dense, it should be read together with Table 7 and Figure 10 rather than as a stand-alone evidentiary source.

4.8. Analysis of Resilience to Bursts

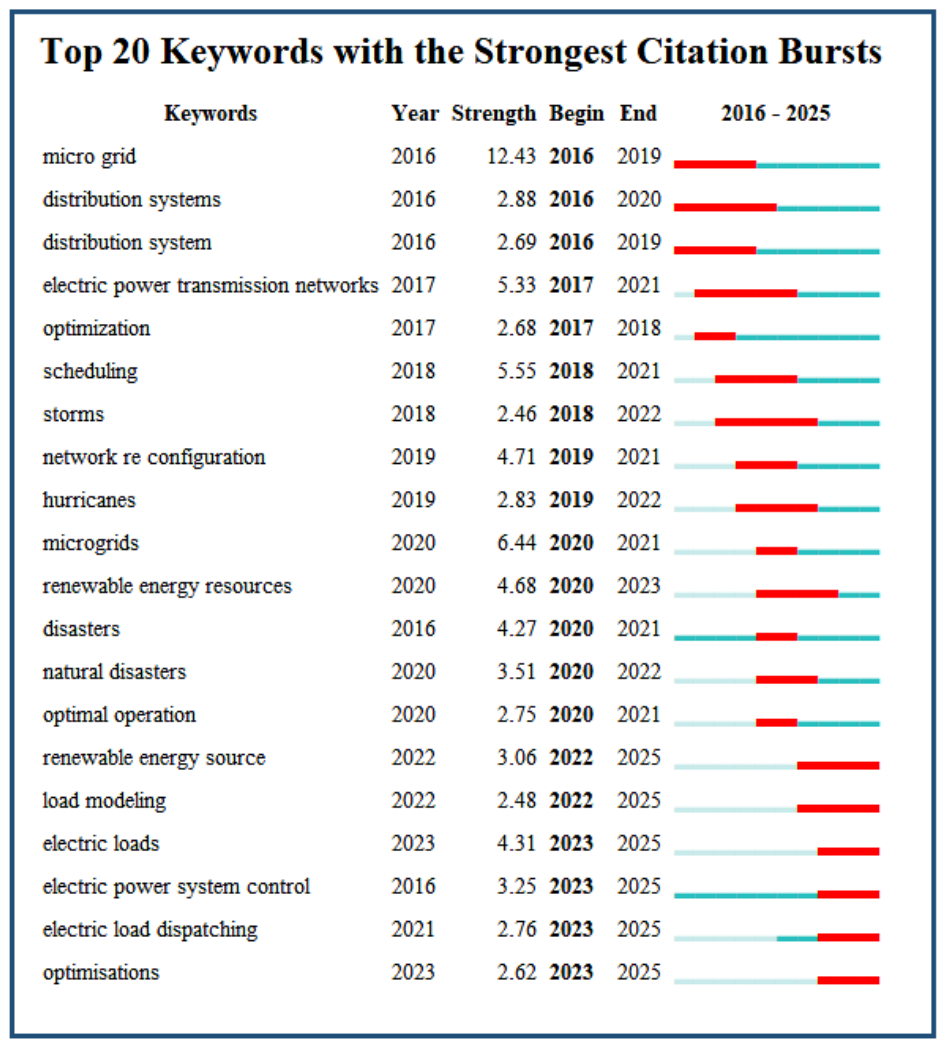
The citation-burst analysis for keywords indicates a shift in research attention from technical and structural foundations toward advanced operational management and dynamic system control. Initially, the field was strongly associated with the concept of the microgrid and related distribution-system foundations. Between 2018 and 2022, bursts in terms such as “storms,” “hurricanes,” and “natural disasters” indicate increased attention to resilience under climate threats [18,84]. In the most recent period (2023–2025), terms such as “electric loads,” “load modeling,” and “electric power system control” [85,86] suggest a growing focus on smart control and load dispatch. These burst patterns identify changes in research emphasis within the literature; they do not directly validate operational performance (Figure 12).

5. Discussion

The evolution of microgrids has shifted from static planning and restoration models toward dynamic systems supported by optimization, artificial intelligence, flexible resources, and hierarchical control. This discussion critically connects the bibliometric clusters identified in Section 4 with the technical mechanisms reviewed in the literature, emphasizing where evidence is mature, where claims remain mainly simulation-based, and where experimental validation is still limited.

5.1. Energy Management Systems (EMS) and Multi-Energy Optimization

This thematic area corresponds to Cluster #0. It represents a technical evolution from Clusters #5 and #1, focused on the integration of multiple energy vectors to improve the system’s overall efficiency and resilience to uncertainties. Systems based on fuzzy logic have demonstrated significant improvements, achieving an 80% reduction in electricity grid consumption, along with decreases of 7.4% in gas boiler consumption and 5.4% in electric boiler consumption [87], an 11.4% decrease in the maximum power drawn from the grid, and notable reductions in the ramp rates of the power profile in electro-thermal microgrids [88]. These results confirm the superiority of low-complexity fuzzy controllers over traditional methods, minimizing fluctuations without requiring extensive forecasts or precise models of the system dynamics [89]. These advances are complemented by energy management platforms that incorporate forecasting, human–machine interfaces, and data analysis, validated in real-world test environments such as the UCLA Smart Grid Energy Research Center and the Korea Institute of Energy Research [90], and extended to multi-objective approaches with hybrid storage (batteries and hydrogen) to balance demand, costs, and component lifespan [91].
Recent literature has expanded the scope of energy management systems toward multi-energy architectures that integrate thermal, electrical, and gas vectors [87]. The implementation of two-level energy management systems—advanced daily scheduling and real-time scheduling—has made it possible to maintain load consumption while improving the demand-side management mechanism based on load shifting techniques [92,93,94] implemented with low-complexity fuzzy logic controllers that achieve reductions of 80% in electricity grid consumption, 7.4% in gas boilers, and 5.4% in electric boilers, along with an 11.4% decrease in peak power consumption [88,89,95]. The implementation of model predictive control and rolling horizon predictive control has made it possible to compensate for changes in load and generation throughout the day, achieving an 18.7% reduction in operating costs compared to conventional dispatch methods, with additional improvements in efficiency and uncertainty management [37].
The integration of artificial intelligence into energy management systems represents an emerging frontier of research. Methodologies that combine multiple renewable energy systems with AI have reported reductions in carbon emissions while optimizing distributed-resource use [96]. The implementation of energy management systems based on high-performance embedded processors has enabled real-time optimization via hybrid Modbus-TCP/IP communication, providing a centralized management solution for distributed energy resources and storage [97]. Nevertheless, the reviewed evidence also shows an important limitation: many AI-based EMS approaches remain validated through simulation or laboratory prototypes, so their scalability, cybersecurity, and behavior under communication degradation during HILP events require further validation.

5.2. Robust and Stochastic Planning Under Uncertainty

This thematic area corresponds to Cluster #5 and Cluster #6. The literature distinguishes between stochastic approaches, which use probability distributions and scenarios to model uncertain variables such as load and renewable generation, minimizing the expected cost of current and future decisions [98], and robust or chance-constrained approaches, which guarantee operability under the worst-case scenario or within specific confidence limits, controlling operational risks without requiring precise distributions [38,99,100]. Although traditional robust optimization generates conservative and costly solutions by hedging against all possible uncertain realizations [101], methods such as robust programming with well-defined uncertainty sets have emerged as promising for analyzing multiple worst-case scenarios, providing feasible solutions that are less computationally intensive than stochastic methods [98].
Joint distributed robust programming with opportunity constraints has made it possible to directly control system reliability at a predefined level and determine the optimal cost, overcoming the limitations of traditional robust optimization, which generates excessively conservative and costly solutions by considering the worst-case scenario [99]. Robust optimization has received significant attention as a modeling framework for optimization under parameter uncertainty, seeking the allocation and dispatch of generation resources to immunize against all possible uncertain situations [101].
Stochastic programming models uncertainty using scenarios and probabilities, minimizing the current cost plus the expected future cost, which generates less conservative and computationally more intensive solutions than traditional robust optimization, which is less computationally intensive and immunizes against the worst-case scenario [98,101]. Opportunity-constrained programming, a stochastic branch, enables multi-objective models in isolated or reconfigurable microgrids with renewables, integrating storage, demand response, and user experience through stochastic scenarios and joint constraints that control risks at predefined levels [99,100,102].

5.3. Restoration, Reconfiguration, and Mobile Resources

This thematic area corresponds to Cluster #2 and Cluster #3. The main innovation in this field is the transition from static restoration strategies to the use of mobile resources, such as transportable energy storage systems and mobile energy resources, which allow for greater resilience compared to fixed storage due to their spatio-temporal flexibility. These systems, when coordinated with grid reconfigurations and microgrid scheduling, minimize load shedding during extended outages [103]. A spatio-temporal model of TESS, related to transmission networks and distribution systems, has been proposed to represent the difference between TESS and fixed ESS in terms of flexibility and cost reduction [104]. Two-stage optimization models have optimized investments in mobile units and their rerouting to form dynamic microgrids, avoiding load shedding expected due to disasters [103]. Furthermore, rolling optimization of mobile storage fleets coordinates local stationary resources for integrated restoration [105], while adaptive formation of multi-microgrids incorporates optimally positioned MERs in the face of extreme risks such as natural disasters [106], and coordination with dynamic reconfiguration enhances seismic resilience [107].
Mobile energy resources, such as mobile emergency generators, transportable energy storage systems, and electric vehicles, represent a significant advance in the resilient restoration of distribution service, offering greater spatiotemporal flexibility than fixed resources to support dispersed critical loads during extensive outages caused by disasters [108]. These flexible and transportable resources can be quickly and easily integrated into distribution systems in the face of sustained damage, causing prolonged outages, moving from staging locations to failure sites via trucks or transport routes [107]. Two-stage optimization models, solved using progressive algorithms such as progressive hedging, optimize investments in mobile units in the first stage and their redeployment in the second to form dynamic microgrids, coordinated with network reconfiguration, avoiding expected load shedding and significantly reducing outages and total costs in extreme seismic or climatic scenarios [109].
The adaptive formation of multi-microgrids as part of the critical service restoration strategy has emerged as a promising approach for extreme conditions such as natural disasters and physical and cyberattacks [106]. This strategy comprises microgrid formation steps and load switching sequences, where the MF forms multiple microgrids with minimal overall scale and radial or loop topologies, including mobile emergency resources optimally positioned to address potential risks under extreme conditions, verified on the IEEE 132-node system via simulation in MATLAB Simulink [106]. Rolling optimization of mobile energy storage fleets coordinates local stationary resources for an integrated restoration of the distribution system, minimizing total costs (outage, generation, and operation) through two-stage stochastic programming that accounts for damage to transmission and distribution networks, demonstrating the effectiveness of MESS mobility in tests with Sioux Falls and Singapore systems connected to 33-node networks [105]. Similar two-stage models optimize the pre-positioning and re-routing of mobile units to form dynamic microgrids, avoiding expected load shedding and reducing outages in IEEE 33/123 systems [110]. These advances represent a fundamental transition from static restoration approaches to dynamic and adaptive strategies, overcoming the limitations of fixed ESS through spatio-temporal flexibility and cost reduction through sharing among microgrids [104].

5.4. Reinforcement Learning and Multi-Agent Control

This thematic area corresponds to Cluster #3. The rise in reinforcement learning addresses the need to manage the complexity, renewable uncertainties, and real-time dynamics of modern microgrid systems, overcoming the limitations of exponential computation time, reliance on accurate forecasts, and the conservatism of traditional mixed-integer linear programming methods [111,112]. These results, validated in seasonal simulations under uncertainty, confirm the superior resilience, operational adaptability, and economic efficiency of PPO and RL compared to conventional approaches [113,114].
Deep reinforcement learning has become a prominent research direction for microgrid control and management, offering potential advantages over traditional methods in adaptive decision-making. A recent systematic review categorizes selected articles and summarizes the main findings, methodologies, and contributions in this area [115]. DRL algorithms, including off-policy reinforcement learning, inverse reinforcement learning, goal-conditioned reinforcement learning, and multi-agent reinforcement learning, are used to address selected control and management challenges in microgrids [115]. Multi-agent systems based on deep reinforcement learning can allow intelligent agents to learn from the microgrid environment and select actions that maximize cumulative rewards, although these results remain strongly dependent on model assumptions, training data, and validation settings [116].
Multi-agent reinforcement learning has emerged as a promising framework for power-system control tasks involving coordination among multiple agents. In frequency regulation, each generator can be treated as an individual agent making its own generation decisions, while the frequency dynamics are determined jointly by all power injections [117]. The PPO algorithm simplifies policy optimization by using a clipped objective function that prevents large parameter updates and eliminates the incentive to move the probability ratio outside the interval [1 − ε, 1 + ε] [118]. These advances suggest that reinforcement learning may support reliability-centered energy management in microgrids, but challenges related to computational constraints, generalization, explainability, safety guarantees, and cyber-physical vulnerabilities remain significant [119].

5.5. Black-Start, GFM Control, and Self-Healing

This thematic area corresponds to Cluster #8 (black-start, 13 documents, median year 1991, silhouette 0.926). Although the topic has deep historical roots, it has been renewed through its connection to Cluster #4 and the literature on GFM inverters for self-healing functions. GFM inverters are increasingly discussed as resources for future energy systems, particularly for establishing and restarting microgrids following blackouts [120]. Under suitable design conditions, GFM inverters can allow microgrids to operate independently of grid power and can provide fast startup, voltage reference, and frequency support for critical loads [120].
Autonomous control architectures for grid-interactive inverters can allow devices to detect reconnection to the utility grid without relying exclusively on communications and to transition from grid-forming mode to grid-following mode [121]. When a microgrid is ready to reconnect to the utility grid, a synchronization relay verifies synchronization, assuming that the inverters have restored voltage and frequency to nominal levels [121]. Prior to reconnection, a transformer with an automatic tap changer can correct minor voltage discrepancies on both sides of the relay [121]. These advances are promising for self-healing distribution networks, but their practical impact depends on protection coordination, interoperability, and field or hardware-in-the-loop validation.
The concept of island identification extends traditional island detection for distribution networks with fleets of GFM inverters [122]. When part of a distribution system forms an island, GFM inverters may remain online to form a microgrid and maintain local frequency and voltage without a complete blackout phase [122]. For this to happen, the inverters must identify island boundaries and establish secondary control with the correct set of devices located in the same island [122]. Recent work on autonomous restoration of interconnected microgrids using distributed and inverter-based resources indicates substantial potential, but demonstrated operational capability still requires robust validation under degraded communications and realistic damage scenarios [123].

5.6. Control Strategies and Climate Challenges

This thematic area corresponds to the synthesis of Clusters #0, #1, and #4, reflecting the need for integrated hierarchical control to address extreme weather events. Coordination between the tertiary layer, which manages economic and logistical decisions for mobile resources, and the primary and secondary layers, which maintain voltage/frequency stability and resynchronization, is central to resilience-oriented operation. The main unresolved challenge is coordination under degraded communication conditions, where future microgrids should be able to preserve critical functions with limited external support rather than assuming uninterrupted communications.
The growing penetration of weather-dependent renewable energy sources introduces new challenges regarding system security, reliability, flexibility, and sustainability [124]. Microgrids, as decentralized energy systems, offer resilience and flexibility but require intelligent control strategies to balance variable generation and demand [115,125]. The inherent stochastic nature of wind and solar generation creates significant challenges for the reliability of modern energy systems, requiring control frameworks that can adapt in real time to changing conditions [126]. These challenges have been exacerbated by the increase in extreme weather events that can cause extensive physical damage to distribution infrastructure, requiring restoration strategies that consider both repair logistics and the coordination of mobile resources [127,128].
The integration of multiple control layers—from tertiary energy management to primary inverter control—represents an important research frontier in microgrid control. Two-layer EMS designs, with an upper energy-management layer and a lower control layer, can minimize daily operating costs while improving local self-consumption of renewable energy resources [129]. Model predictive control and rolling-horizon predictive control can compensate for changes in load and generation throughout the day [129], while complementary fuzzy-logic and decentralized EMS approaches support demand-side coordination and renewable self-consumption [130,131]. However, persistent gaps remain in coordinating these layers under degraded communication conditions, and further decentralized control strategies are required for autonomous operation during disasters.
The expanded synthesis also incorporates recent contributions on mobile restoration resources [132] and reinforcement-learning applications in power systems [133], which align the reference list with the representative evidence base summarized in Table 8.

6. Conclusions

This review identifies a progressively consolidating research framework on microgrid resilience, based on the combined evidence from bibliometric mapping and structured technical synthesis. The results indicate a literature-level transition from predominantly reactive restoration approaches toward more proactive control, planning, and coordination architectures under high uncertainty. Because the methodology combines bibliometric patterns with literature-based interpretation, the conclusions below distinguish between mapped research trends, simulation-based evidence, laboratory or hardware-in-the-loop validation, and demonstrate operational capability.
First, the reviewed literature suggests that resilience to HILP events cannot be addressed only through passive physical redundancy. The dominant clusters point to growing interest in the orchestration of distributed energy resources as flexible operational assets. Studies on V2G-enabled electric vehicle fleets, transportable energy storage systems (TESS), mobile energy storage systems (MESS), and emergency generators indicate potential spatiotemporal flexibility for critical-load restoration. However, the evidence is still heterogeneous and often simulation-based; therefore, these resources should be described as promising enablers of dynamic microgrid formation rather than as universally demonstrated solutions.
Second, the operational viability of dynamic microgrids is strongly linked to modernization of the primary control layer. The reviewed technical literature indicates that GFM inverter technology can support self-healing functions by establishing voltage and frequency references for islanded operation and black-start sequences. Nevertheless, GFM control should be regarded as a key enabling technology rather than an automatically sufficient solution, because practical deployment also requires protection coordination, synchronization procedures, resource adequacy, interoperability, and validation under realistic disturbance conditions.
Third, the computational complexity of managing reconfigurable topologies has encouraged research on deep reinforcement learning and multi-agent reinforcement learning in the EMS layer. The literature indicates that these techniques can support adaptive scheduling, distributed decision-making, and selected real-time control tasks. However, claims of superiority over conventional mathematical programming remain context-dependent, and wider deployment requires stability guarantees, explainability, cyber-security assessment, and transfer from simulation to real-time or field operation.
Despite these advances, the study identifies limitations that define a research agenda for 2026–2030. Future work should develop standardized interoperability frameworks that enable coordinated operation among multi-owner microgrids during climate emergencies. Empirical validation using commercial-scale hardware-in-the-loop platforms, real-time digital simulation, and field demonstrations is needed to test seamless transitions between grid-connected, islanded, black-start, and reconnection modes. Finally, resilience modeling should integrate dynamic metrics that capture cyber-physical interdependence and equity-relevant service continuity, ensuring that algorithmic robustness is connected to measurable protection of critical social services.

Author Contributions

Conceptualization, L.R.-G., C.R.-A. and L.B.-T.; methodology, J.D.-A., A.A.-P. and C.S.-M.; software, L.R.-G. and J.D.-A.; validation, D.V.-L., E.L.-M. and U.P.-S.; formal analysis, R.S.-F., J.V.-S. and P.M.-V.; investigation, L.R.-G., J.D.-A., D.V.-L., E.L.-M., U.P.-S., C.S.-M., R.S.-F., J.V.-S. and P.M.-V.; resources, C.R.-A. and L.B.-T.; data curation, J.D.-A. and P.M.-V.; writing—original draft preparation, L.R.-G., J.D.-A. and C.S.-M.; writing—review and editing, C.R.-A., A.A.-P. and L.B.-T.; visualization, U.P.-S. and P.M.-V.; supervision, C.R.-A. and L.B.-T.; project administration, L.B.-T. All authors have read and agreed to the published version of the manuscript.

Funding

This research received no external funding.

Institutional Review Board Statement

Not applicable.

Informed Consent Statement

Not applicable.

Data Availability Statement

The original contributions presented in this study are included in the article. Further inquiries can be directed to the corresponding author.

Conflicts of Interest

The authors declare no conflicts of interest.

References

  1. Wangdee, W. Deterministic-Based Power Grid Planning Enhancement Using System Well-Being Analysis. J. Mod. Power Syst. Clean. Energy 2018, 6, 438. [Google Scholar] [CrossRef]
  2. Chen, R.L.-Y.; Cohn, A.; Fan, N.; Pınar, A. Contingency-Risk Informed Power System Design. IEEE Trans. Power Syst. 2014, 29, 2087. [Google Scholar] [CrossRef]
  3. Duffey, R.B. Predicting Power System Reliability and Outage Duration Including Emergency Response. Dependability 2020, 20, 3. [Google Scholar] [CrossRef]
  4. Gunda, T.; Moore, A.; Jackson, N.; Dhulipala, S.C.; Awara, S. A Resource Adequacy Assessment of Correlated Wide-Area Outages in the Power Grid. Environ. Res. Energy 2025, 2, 25009. [Google Scholar] [CrossRef]
  5. Mishra, D.K.; Ghadi, M.J.; Azizivahed, A.; Li, L.; Zhang, J. A Review on Resilience Studies in Active Distribution Systems. Renew. Sustain. Energy Rev. 2020, 135, 110201. [Google Scholar]
  6. Raoufi, H.; Vahidinasab, V.; Mehran, K. Power Systems Resilience Metrics: A Comprehensive Review of Challenges and Outlook. Sustainability 2020, 12, 9698. [Google Scholar] [CrossRef]
  7. Wu, Y.; Yang, S.; Wu, J.; Hu, F. An Interacting Negative Feedback Mechanism in a Coupled Extreme Weather–Humans–Infrastructure System: A Case Study of the 2021 Winter Storm in Texas. Front. Phys. 2022, 10, 912569. [Google Scholar] [CrossRef]
  8. Khazeiynasab, S.R.; Qi, J. Resilience Analysis and Cascading Failure Modeling of Power Systems Under Extreme Temperatures. J. Mod. Power Syst. Clean. Energy 2021, 9, 1446. [Google Scholar] [CrossRef]
  9. Shuai, H.; Li, F.; Zhu, J.; Tingen, W.; Mukherjee, S. Hydroclimate-Coupled Framework for Assessing Power System Resilience under Summer Drought and Climate Change. Renew. Sustain. Energy Rev. 2025, 213, 115397. [Google Scholar] [CrossRef]
  10. Chen, H.; Bresler, F.S.; Bryson, M.E.; Seiler, K.; Monken, J. Toward Bulk Power System Resilience: Approaches for Regional Transmission Operators. IEEE Power Energy Mag. 2020, 18, 20. [Google Scholar] [CrossRef]
  11. Papic, M.; Ekisheva, S.; Cotilla-Sanchez, E. A Risk-Based Approach to Assess the Operational Resilience of Transmission Grids. Appl. Sci. 2020, 10, 4761. [Google Scholar] [CrossRef]
  12. Yang, Y.; Zhang, H.; Cheng, H.; Wang, Z. Resilience-Oriented Transmission Expansion Planning with Optimal Transmission Switching Under Typhoon Weather. CSEE J. Power Energy Syst. 2024, 10, 129–138. [Google Scholar] [CrossRef]
  13. Wei, Y.; Ji, C.; Galvan, F.; Couvillon, S.; Orellana, G.; Momoh, J.A. Learning Geo-Temporal Non-Stationary Failure and Recovery of Power Distribution. arXiv 2022. [Google Scholar] [CrossRef]
  14. Jeong, D.I.; Cannon, A.J.; Zhang, X. Projected Changes to Extreme Freezing Precipitation and Design Ice Loads over North America Based on a Large Ensemble of Canadian Regional Climate Model Simulations. Nat. Hazards Earth Syst. Sci. 2019, 19, 857. [Google Scholar] [CrossRef]
  15. Mohanty, U.C.; Osuri, K.K.; Tallapragada, V.; Marks, F.D.; Pattanayak, S.; Mohapatra, M.; Rathore, L.S.; Gopalakrishnan, S.; Niyogi, D. A Great Escape from the Bay of Bengal “Super Sapphire–Phailin” Tropical Cyclone: A Case of Improved Weather Forecast and Societal Response for Disaster Mitigation. Earth Interact. 2015, 19, 1. [Google Scholar] [CrossRef]
  16. Abi-Samra, N.; McConnach, J.; Mukhopadhyay, S.; Wojszczyk, B. When the Bough Breaks: Managing Extreme Weather Events Affecting Electrical Power Grids. IEEE Power Energy Mag. 2014, 12, 61. [Google Scholar] [CrossRef]
  17. Lonergan, K.E.; Greco, S.F.; Sansavini, G. Ensuring/Insuring Resilient Energy System Infrastructure. Environ. Syst. Decis. 2023, 43, 625. [Google Scholar] [CrossRef]
  18. Xia, J.; Xu, F.; Huang, G. Research on Power Grid Resilience and Power Supply Restoration during Disasters—A Review. In IntechOpen eBooks; IntechOpen: London, UK, 2020. [Google Scholar]
  19. Kettle, A.J. Storm Xaver over Europe in December 2013: Overview of Energy Impacts and North Sea Events. Adv. Geosci. 2020, 54, 137. [Google Scholar] [CrossRef]
  20. Priestley, M.D.K.; Dacre, H.; Shaffrey, L.; Hodges, K.I.; Pinto, J.G. The Role of Serial European Windstorm Clustering for Extreme Seasonal Losses as Determined from Multi-Centennial Simulations of High-Resolution Global Climate Model Data. Nat. Hazards Earth Syst. Sci. 2018, 18, 2991. [Google Scholar] [CrossRef]
  21. Gonçalves, A.; Costoya, X.; Nieto, R.; Liberato, M.L.R. Extreme Weather Events on Energy Systems: A Comprehensive Review on Impacts, Mitigation, and Adaptation Measures. Sustain. Energy Res. 2024, 11, 4. [Google Scholar] [CrossRef]
  22. Panteli, M.; Mancarella, P. Modeling and Evaluating the Resilience of Critical Electrical Power Infrastructure to Extreme Weather Events. IEEE Syst. J. 2015, 11, 1733. [Google Scholar] [CrossRef]
  23. Daeli, A.; Mohagheghi, S. Power Grid Infrastructural Resilience against Extreme Events. Energies 2022, 16, 64. [Google Scholar] [CrossRef]
  24. Stürmer, J.; Plietzsch, A.; Vogt, T.; Hellmann, F.; Kurths, J.; Otto, C.; Frieler, K.; Anvari, M. Increasing the Resilience of the Texas Power Grid against Extreme Storms by Hardening Critical Lines. Nat. Energy 2024, 9, 526. [Google Scholar] [CrossRef]
  25. Flores, W.C.; Barrionuevo, J.; Torres, S.P. Remedial Action Scheme to Improve Resiliency under Failures in the Central American Power Grid. In Elsevier eBooks; Elsevier BV: Amsterdam, The Netherlands, 2022; p. 71. [Google Scholar]
  26. García-García, J.; Rey, J.M.; Osma-Pinto, G. Evaluation of Microgrid Performance: A Review. TecnoLógicas 2023, 26, e2656. [Google Scholar] [CrossRef]
  27. Bakare, M.S.; Abdulkarim, A.; Shuaibu, A.N.; Muhamad, M.M. Energy Management Controllers: Strategies, Coordination, and Applications. Energy Inform. 2024, 7, 57. [Google Scholar] [CrossRef]
  28. Leon, J.D.V.; Tarrasó, A.; Candela, J.I.; Rocabert, J.; Rodríguez, P. Grid-Forming Controller Based on Virtual Admittance for Power Converters Working in Weak Grids. IEEE J. Emerg. Sel. Top. Ind. Electron. 2023, 4, 791. [Google Scholar] [CrossRef]
  29. Zeng, Z.; Bhagwat, P.; Saeedifard, M.; Groß, D. Black Start Operation of Grid-Forming Converters Based on Generalized Three-Phase Droop Control Under Unbalanced Conditions. arXiv 2024. [Google Scholar] [CrossRef]
  30. Hernández, E.D.G.; Díaz, N.L.; Luna, A.C. Energy Management Electronic Device for Islanded Microgrids Based on Renewable Energy Sources and Battery-Based Energy Storage. Ing. Investig. 2021, 41, e83905. [Google Scholar] [CrossRef]
  31. Lagouir, M.; Badri, A.; Sayouti, Y. Multi-Objective Optimization Dispatch-Based Energy Management of a Microgrid Operating in Grid-Connected and Standalone Modes. Int. J. Renew. Energy Dev. 2021, 10, 333. [Google Scholar] [CrossRef]
  32. Mohamed, M.A.; Chen, T.; Su, W.; Jin, T. Proactive Resilience of Power Systems Against Natural Disasters: A Literature Review. IEEE Access 2019, 7, 163778. [Google Scholar] [CrossRef]
  33. Kasimalla, S.R.; Park, K.; Zaboli, A.; Hong, Y.; Choi, S.L.; Hong, J. An Evaluation of Sustainable Power System Resilience in the Face of Severe Weather Conditions and Climate Change: A Comprehensive Review of Current Advances. Sustainability 2024, 16, 3047. [Google Scholar] [CrossRef]
  34. Loni, A.; Asadi, S. Power System Resilience: The Role of Electric Vehicles and Social Disparities in Mitigating U.S. Power Outages. Smart Grids Sustain. Energy 2024, 9, 23. [Google Scholar] [CrossRef]
  35. Palau-Mayo, A.; Gil, M.d.P.; Domínguez-García, J.L. Towards More Resilient Electrical Networks in Urban Areas. E3S Web Conf. 2018, 61, 15. [Google Scholar] [CrossRef]
  36. Bhusal, N.; Gautam, M.; Abdelmalak, M.; Benidris, M. Modeling of Natural Disasters and Extreme Events for Power System Resilience Enhancement and Evaluation Methods. In 2020 International Conference on Probabilistic Methods Applied to Power Systems (PMAPS); IEEE: New York, NY, USA, 2020; p. 1. [Google Scholar] [CrossRef]
  37. Raya-Armenta, J.M.; Bazmohammadi, N.; Avina–Cervantes, J.G.; Sáez, D.; Vásquez, J.C.; Guerrero, J.M. Energy Management System Optimization in Islanded Microgrids: An Overview and Future Trends. Renew. Sustain. Energy Rev. 2021, 149, 111327. [Google Scholar] [CrossRef]
  38. Cabrera-Tobar, A.; Pavan, A.; Petrone, G.; Spagnuolo, G. A Review of the Optimization and Control Techniques in the Presence of Uncertainties for the Energy Management of Microgrids. Energies 2022, 15, 9114. [Google Scholar] [CrossRef]
  39. Dehghanian, P.; Aslan, S.; Dehghanian, P. Maintaining Electric System Safety Through An Enhanced Network Resilience. IEEE Trans. Ind. Appl. 2018, 54, 4927. [Google Scholar] [CrossRef]
  40. Vu, T.; Nguyen, B.L.-H.; Cheng, Z.; Chow, M.; Zhang, B. Cyber-Physical Microgrids: Toward Future Resilient Communities. IEEE Ind. Electron. Mag. 2020, 14, 4. [Google Scholar] [CrossRef]
  41. Panteli, M.; Trakas, D.N.; Mancarella, P.; Hatziargyriou, N. Boosting the Power Grid Resilience to Extreme Weather Events Using Defensive Islanding. IEEE Trans. Smart Grid 2016, 7, 2913. [Google Scholar] [CrossRef]
  42. Manta, E.M.; Davidescu, A.A.; Geambaşu, M.C.; Florescu, M.S. Exploring the Research Area of Direct Taxation. An Empirical Analysis Based on Bibliometric Analysis Results. Manag. Mark. 2023, 18, 355. [Google Scholar] [CrossRef]
  43. Dong, B.; Guo, Z.; Mulat, A.; Tian, Y.; Lu, M.; Yuan, Y.; Liu, X.J. Leveraging Heterogeneous Networks to Analyze Energy Storage Systems in Power Systems and Renewable Energy Research: A Scientometric Study. Front. Energy Res. 2024, 12, 1424928. [Google Scholar] [CrossRef]
  44. Wang, F.; Tian, J.; Xu, Z. The Development of Resilience Research in Critical Infrastructure Systems: A Bibliometric Perspective. Risk Anal. 2024, 45, 1072. [Google Scholar] [CrossRef] [PubMed]
  45. Tofigh, M.A.; Selvaraj, J.; Rahim, N.A. Bibliometric Analysis of Extreme Weather Research: Patterns and Partnerships in Power Grid Resilience Studies. Sustainability 2025, 17, 5658. [Google Scholar] [CrossRef]
  46. Mazza, A.; Chicco, G.; Borges, C.L.T. Investigation on the Impact of Heat Waves on Distribution System Failures. arXiv 2023. [Google Scholar] [CrossRef]
  47. Faghihi, F.; Labeau, P.; Henneaux, P.; Panteli, M. An Efficient Probabilistic Approach to Dynamic Resilience Assessment of Power Systems; HAL (Le Centre pour la Communication Scientifique Directe): Villeurbanne, France, 2020. [Google Scholar]
  48. Sharifi Hamidreza, M.; Reza, D.; Abolfazl, A. Managing HILP Consequences Using Dynamic Distribution System Asset Assessment. arXiv 2022. [Google Scholar] [CrossRef]
  49. Mahzarnia, M.; Moghaddam, M.P.; Baboli, P.T.; Siano, P. A Review of the Measures to Enhance Power Systems Resilience. IEEE Syst. J. 2020, 14, 4059. [Google Scholar] [CrossRef]
  50. Noebels, M.; Quirós-Tortós, J.; Panteli, M. Decision-Making Under Uncertainty on Preventive Actions Boosting Power Grid Resilience. IEEE Syst. J. 2021, 16, 2614. [Google Scholar] [CrossRef]
  51. Pan, W.; Li, Y. Improving Power Grid Resilience Under Extreme Weather Conditions With Proper Regulation and Management of DERs—Experiences Learned From the 2021 Texas Power Crisis. Front. Energy Res. 2022, 10, 921335. [Google Scholar] [CrossRef]
  52. Busby, J.W.; Baker, K.; Bazilian, M.; Gilbert, A.Q.; Grubert, E.; Rai, V.; Rhodes, J.D.; Shidore, S.; Smith, C.A.; Webber, M.E. Cascading Risks: Understanding the 2021 Winter Blackout in Texas. Energy Res. Soc. Sci. 2021, 77, 102106. [Google Scholar] [CrossRef]
  53. Popik, T.S.; Humphreys, R.G. The 2021 Texas Blackouts: Causes, Consequences, and Cures. J. Crit. Infrastruct. Policy 2021, 2, 47. [Google Scholar] [CrossRef]
  54. Kiel, E.S.; Kjølle, G. Transmission Line Unavailability Due to Correlated Threat Exposure. In 2019 IEEE Milan PowerTech; IEEE: New York, NY, USA, 2019; p. 1. [Google Scholar] [CrossRef]
  55. Ranjbar, S. Online Evaluation of the Distribution System Resiliency Criteria Using Choquet-based Graph Technique. IET Gener. Transm. Distrib. 2023, 17, 4592. [Google Scholar] [CrossRef]
  56. Venkataramanan, V.; Hahn, A.; Srivastava, A.K. CP-SAM: Cyber-Physical Security Assessment Metric for Monitoring Microgrid Resiliency. IEEE Trans. Smart Grid 2019, 11, 1055. [Google Scholar] [CrossRef]
  57. Poudyal, A.; Dubey, A.; Poudel, S. A Risk-Driven Probabilistic Approach to Quantify Resilience in Power Distribution Systems. In 2022 17th International Conference on Probabilistic Methods Applied to Power Systems (PMAPS); IEEE: New York, NY, USA, 2022; p. 1. [Google Scholar] [CrossRef]
  58. Wu, Y.-S.; Liao, J.; Yang, H. Three-Stage Resilience Enhancement via Optimal Dispatch and Reconfiguration for a Microgrid. Front. Energy Res. 2024, 12, 1461383. [Google Scholar] [CrossRef]
  59. Schardong, A.; Simonović, S.P.; Tong, H. Use of Quantitative Resilience in Managing Urban Infrastructure Response to Natural Hazards. Int. J. Saf. Secur. Eng. 2019, 9, 13. [Google Scholar] [CrossRef]
  60. Panteli, M.; Trakas, D.N.; Mancarella, P.; Hatziargyriou, N. Power Systems Resilience Assessment: Hardening and Smart Operational Enhancement Strategies. Proc. IEEE 2017, 105, 1202. [Google Scholar] [CrossRef]
  61. Du, Y.; Tu, H.; Lu, X.; Wang, J.; Lukic, S. Black-Start and Service Restoration in Resilient Distribution Systems With Dynamic Microgrids. IEEE J. Emerg. Sel. Top. Power Electron. 2021, 10, 3975. [Google Scholar] [CrossRef]
  62. Puech, A.; Rigaut, T.; Franc, A.L.; Templier, W.; Alais, J.-C.; Tournoud, M.; Bossard, V.; Yousef, A.; Stolyarova, E. Controlling Microgrids Without External Data: A Benchmark of Stochastic Programming Methods. arXiv 2023. [Google Scholar] [CrossRef]
  63. Umenza, E.L.R.; Sáenz, E.M.; Gómez-Luna, E. Requirements and Tests of the Microgrid Control System, in Accordance with IEEE Std 2030-7-2017 and IEEE Std 2030.8-2018. Ing. Compet. 2022, 24, 1–21. [Google Scholar] [CrossRef]
  64. Pouraltafi-kheljan, S.; Uğur, M.; Bozulu, E.; Çalışkan, B.C.; Keysan, O.; Göl, M. Centralized Microgrid Control System in Compliance with IEEE 2030.7 Standard Based on an Advanced Field Unit. Energies 2021, 14, 7381. [Google Scholar] [CrossRef]
  65. Ghasemi, A.; Gitizadeh, M.; Kamwa, I.; Ghareghani, O. Resiliency Constraint Proactive Scheduling against Hurricanes in a Multi-Energy Carrier Microgrid. IET Gener. Transm. Distrib. 2022, 16, 4096–4114. [Google Scholar] [CrossRef]
  66. Zhang, Z.; Babayomi, O.; Dragičević, T.; Heydari, R.; García, C.; Rodríguez, J.; Kennel, R. Advances and Opportunities in the Model Predictive Control of Microgrids: Part I–Primary Layer. Int. J. Electr. Power Energy Syst. 2021, 134, 107411. [Google Scholar] [CrossRef]
  67. Memon, A.A.; Laaksonen, H.; Kauhaniemi, K. Microgrid Protection with Conventional and Adaptive Protection Schemes. In Microgrids; Springer International Publishing: Cham, Switzerland, 2021. [Google Scholar]
  68. Elshrief, Y.A.; Asham, A.D.; Abozalam, B.; Abd-Elhaleem, S. A New Passive Islanding Detection Technique for Different Zones in Utility Grid. J. Eng. Res. 2021, 9, 131–143. [Google Scholar] [CrossRef]
  69. Abubakr, H.; Mohamed, T.H.; Hussein, M.M.; Guerrero, J.M.; Tinajero, G.D.A. Adaptive Frequency Regulation Strategy in Multi-Area Microgrids Including Renewable Energy and Electric Vehicles Supported by Virtual Inertia. Int. J. Electr. Power Energy Syst. 2021, 129, 106814. [Google Scholar] [CrossRef]
  70. Alassi, A.; Feng, Z.; Ahmed, K.H.; Syed, M.; Egea-Àlvarez, A.; Foote, C. Grid-Forming VSM Control for Black-Start Applications with Experimental PHiL Validation. Int. J. Electr. Power Energy Syst. 2023, 151, 109119. [Google Scholar] [CrossRef]
  71. Mishra, S.; Kwasnik, T.; Anderson, K. Microgrid Resilience: A Holistic and Context-Aware Resilience Metric. Energy Syst. 2022, 14, 1081–1105. [Google Scholar] [CrossRef]
  72. D’silva, S.; Zare, A.; Shadmand, M.B.; Bayhan, S.; Abu-Rub, H. Towards Resiliency Enhancement of Network of Grid-Forming and Grid-Following Inverters. IEEE Trans. Ind. Electron. 2023, 71, 1547. [Google Scholar] [CrossRef]
  73. Mukherjee, S.; Hossain, R.R.; Mohiuddin, S.M.; Liu, Y.; Du, W.; Adetola, V.; Jinsiwale, R.; Huang, Q.; Yin, T.; Singhal, A. Resilient Control of Networked Microgrids Using Vertical Federated Reinforcement Learning: Designs and Real-Time Test-Bed Validations. arXiv 2023. [Google Scholar] [CrossRef]
  74. Yan, W.; Gevorgian, V.; Koralewicz, P.; Alam, S.; Mendiola, E. Regional Power System Black Start with Run-of-River Hydropower Plant and Battery Energy Storage. J. Mod. Power Syst. Clean. Energy 2024, 12, 1596. [Google Scholar] [CrossRef]
  75. Jimeno, T.A.; Soria, A.; Đorđević, J. Research on Hate Speech. A Proposal for Bibliometric Analysis in Spain and Latin America Between 2021 and 2022. ICONO14 2024, 22, e2128. [Google Scholar] [CrossRef]
  76. Gutiérrez, A.R.I.; Espinosa, J.C.M. Building and Sustainability Information Modeling: An Analysis of Its Thematic Structure. Iberoam. J. Sci. Meas. Commun. 2024, 4, 1–15. [Google Scholar] [CrossRef]
  77. Jin, Y.; Jia, W. Mapping Hotspots and Emerging Trends of Business Model Innovation under Networking in the Internet of Things. EURASIP J. Wirel. Commun. Netw. 2018, 2018, 96. [Google Scholar] [CrossRef]
  78. Zhang, Y.; Zhao, D.; Liu, H.; Xin-rong, H.; Deng, J.; Jia, R.; He, X.; Tahir, M.N.; Lan, Y. Research Hotspots and Frontiers in Agricultural Multispectral Technology: Bibliometrics and Scientometrics Analysis of the Web of Science. Front. Plant Sci. 2022, 13, 955340. [Google Scholar] [CrossRef] [PubMed]
  79. Kunosić, S.; Zerem, E. Scientometrics: Recent Advances; IntechOpen: London, UK, 2019. [Google Scholar]
  80. Li, W.; Cheng, S. CiteSpace-Based Visualization and Analysis of Digital Media Arts Research. Appl. Math. Nonlinear Sci. 2024, 9, 1–16. [Google Scholar] [CrossRef]
  81. Tambunan, H.B.; Priambodo, N.W.; Hartono, J.; Aditya, I.A.; Triani, M.; Rasgianti, R. Research Trends on Microgrid Systems: A Bibliometric Network Analysis. Int. J. Power Electron. Drive Syst./Int. J. Electr. Comput. Eng. 2023, 13, 2529. [Google Scholar] [CrossRef]
  82. Zhang, W.; Li, B.; Xue, R.; Wang, C.; Cao, W. A Systematic Bibliometric Review of Clean Energy Transition: Implications for Low-Carbon Development. PLoS ONE 2021, 16, e0261091. [Google Scholar] [CrossRef] [PubMed]
  83. Gómez, V.A.V.; Hernández, G.; Rivas, E. The Influence of Distributed Generation Penetration Levels on Energy Markets. Technol. Inf. 2018, 29, 117. [Google Scholar] [CrossRef]
  84. Ge, Y.; Du, L.; Ye, H. Co-Optimization Approach to Post-Storm Recovery for Interdependent Power and Transportation Systems. J. Mod. Power Syst. Clean Energy 2019, 7, 688. [Google Scholar] [CrossRef]
  85. Wu, Y.; Cui, J.; Liu, C. State-of-the-Art Review on Energy Management Systems, Challenges and Top Trends of Renewable Energy-Based Microgrids. EAI Endorsed Trans. Energy Web 2024, 10, 1–19. [Google Scholar] [CrossRef]
  86. Jha, S.K.; Abdelaziz, A.Y.; Kumar, D.; Subudhi, B. Editorial: Demand Side Management in Microgrids. Front. Energy Res. 2025, 13, 1567808. [Google Scholar] [CrossRef]
  87. Horrillo–Quintero, P.; García–Triviño, P.; Hosseini, E.S.; García–Vázquez, C.A.; Sánchez–Sainz, H.; Ugalde-Loo, C.E.; Perić, V.S.; Fernández-Ramírez, L.M. Dynamic Fuzzy Logic Energy Management System for a Multi-Energy Microgrid. IEEE Access 2024, 12, 93221. [Google Scholar] [CrossRef]
  88. Arcos-Avilés, D.; Pascual, J.; Guinjoan, F.; Marroyo, L.; García-Gutiérrez, G.; Gordillo, R.; Llanos-Proano, J.; Sanchis, P.; Motoasca, E. An Energy Management System Design Using Fuzzy Logic Control: Smoothing the Grid Power Profile of a Residential Electro-Thermal Microgrid. IEEE Access 2021, 9, 25172. [Google Scholar] [CrossRef]
  89. Arcos-Avilés, D.; Pascual, J.; Marroyo, L.; Sanchis, P.; Guinjoan, F. Fuzzy Logic-Based Energy Management System Design for Residential Grid-Connected Microgrids. IEEE Trans. Smart Grid 2016, 9, 530. [Google Scholar] [CrossRef]
  90. Lee, E.; Shi, W.; Gadh, R.; Kim, W. Design and Implementation of a Microgrid Energy Management System. Sustainability 2016, 8, 1143. [Google Scholar] [CrossRef]
  91. Vivas, F.J.; Segura, F.; Andújar, J.M.; Palacio, A.; Saenz, J.; Isorna, F.; López, E. Multi-Objective Fuzzy Logic-Based Energy Management System for Microgrids with Battery and Hydrogen Energy Storage System. Electronics 2020, 9, 1074. [Google Scholar] [CrossRef]
  92. Hecht, C.; Sprake, D.; Vagapov, Y.; Anuchin, A. Domestic Demand-Side Management: Analysis of Microgrids with Renewable Energy Sources Using Historical Load Data. Electr. Eng. 2021, 103, 1791. [Google Scholar] [CrossRef]
  93. Alhasnawi, B.N.; Almutoki, S.M.M.; Hussain, F.F.K.; Harrison, A.; Bazooyar, B.; Zanker, M.; Bureš, V. A New Methodology for Reducing Carbon Emissions Using Multi-Renewable Energy Systems and Artificial Intelligence. Sustain. Cities Soc. 2024, 114, 105721. [Google Scholar] [CrossRef]
  94. Saeed, M.A.; Sedhom, B.E.; Elbaghdadi, A.S.; Fadl, A.W.; Abdelwahab, M.; Elden, M.H.; Alhasnawi, B.N.; Eladl, A.A. Practical Prototype for Energy Management System in Smart Microgrid Considering Uncertainties and Energy Theft. Sci. Rep. 2023, 13, 20812. [Google Scholar] [CrossRef] [PubMed]
  95. Arcos–Aviles, D.; Pascual, J.; Guinjoan, F.; Marroyo, L.; Sanchis, P.; Marietta, M.P. Low Complexity Energy Management Strategy for Grid Profile Smoothing of a Residential Grid-Connected Microgrid Using Generation and Demand Forecasting. Appl. Energy 2017, 205, 69. [Google Scholar] [CrossRef]
  96. Ojuekaiye, O.S. AI Innovation for Renewable Energy and Environmental Sustainability. OALib 2025, 12, e12844. [Google Scholar] [CrossRef]
  97. Ferst, M.K.; Denardin, G.W.; Stein, C.M.d.O.; Carati, E.G.; da Costa, J.P.; Cardoso, R. Implementation and Analysis of a Secure Communication Using SunSpec Modbus and Transport Layer Security Protocols for Short-Term Energy Management Systems. IEEE Access 2025, 13, 105183. [Google Scholar] [CrossRef]
  98. Valibeygi, A.; Habib, A.H.; Callafon, R.A. de Robust Power Scheduling for Microgrids with Uncertainty in Renewable Energy Generation. In 2019 IEEE Power & Energy Society Innovative Smart Grid Technologies Conference (ISGT); IEEE: New York, NY, USA, 2019; p. 1. [Google Scholar] [CrossRef]
  99. Ding, Y.; Morstyn, T.; McCulloch, M. Distributionally Robust Joint Chance-Constrained Optimization for Networked Microgrids Considering Contingencies and Renewable Uncertainty. IEEE Trans. Smart Grid 2022, 13, 2467. [Google Scholar] [CrossRef]
  100. Hemmati, M.; Mohammadi-Ivatloo, B.; Abapour, M.; Anvari-Moghaddam, A. Optimal Chance-Constrained Scheduling of Reconfigurable Microgrids Considering Islanding Operation Constraints. IEEE Syst. J. 2020, 14, 5340. [Google Scholar] [CrossRef]
  101. Li, Y.; Li, K.; Yang, Z.; Yu, Y.; Xu, R.; Yang, M. Stochastic Optimal Scheduling of Demand Response-Enabled Microgrids with Renewable Generations: An Analytical-Heuristic Approach. J. Clean. Prod. 2021, 330, 129840. [Google Scholar] [CrossRef]
  102. Bazmohammadi, N.; Tahsiri, A.; Anvari-Moghaddam, A.; Guerrero, J.M. A Hierarchical Energy Management Strategy for Interconnected Microgrids Considering Uncertainty. Int. J. Electr. Power Energy Syst. 2019, 109, 597. [Google Scholar] [CrossRef]
  103. Kim, J.; Dvorkin, Y. Enhancing Distribution System Resilience With Mobile Energy Storage and Microgrids. IEEE Trans. Smart Grid 2018, 10, 4996. [Google Scholar] [CrossRef]
  104. Yao, S.; Wang, P.; Zhao, T. Transportable Energy Storage for More Resilient Distribution Systems With Multiple Microgrids. IEEE Trans. Smart Grid 2018, 10, 3331. [Google Scholar] [CrossRef]
  105. Yao, S.; Wang, P.; Liu, X.; Zhang, H.; Zhao, T. Rolling Optimization of Mobile Energy Storage Fleets for Resilient Service Restoration. IEEE Trans. Smart Grid 2019, 11, 1030. [Google Scholar] [CrossRef]
  106. Che, L.; Shahidehpour, M. Adaptive Formation of Microgrids With Mobile Emergency Resources for Critical Service Restoration in Extreme Conditions. IEEE Trans. Power Syst. 2018, 34, 742. [Google Scholar] [CrossRef]
  107. Yang, Z.; Dehghanian, P.; Nazemi, M. Seismic-Resilient Electric Power Distribution Systems: Harnessing the Mobility of Power Sources. IEEE Trans. Ind. Appl. 2020, 56, 2304. [Google Scholar] [CrossRef]
  108. Dugan, J.; Mohagheghi, S.; Kroposki, B. Application of Mobile Energy Storage for Enhancing Power Grid Resilience: A Review. Energies 2021, 14, 6476. [Google Scholar] [CrossRef]
  109. Lei, S.; Chen, C.; Zhou, H.; Hou, Y. Routing and Scheduling of Mobile Power Sources for Distribution System Resilience Enhancement. IEEE Trans. Smart Grid 2018, 10, 5650. [Google Scholar] [CrossRef]
  110. Lei, H.; Jiang, B.; Liu, Y.; Zhu, C.; Zhang, T. Two-Stage Optimization of Mobile Energy Storage Sizing, Pre-Positioning, and Re-Allocation for Resilient Networked Microgrids with Dynamic Boundaries. Appl. Sci. 2024, 14, 10367. [Google Scholar] [CrossRef]
  111. Tao, L.; Wang, Y.; Li, C.; Chen, Z.; Lin, D.; Xia, S.; Wang, P.; Jing, J.; Wang, R. A Two-Stage Optimal Operation Strategy of Distribution Networks Considering Mobile Energy Storage Flexibility. IEEE Trans. Ind. Appl. 2025, 61, 8650. [Google Scholar] [CrossRef]
  112. Zhao, Y.; Zhang, W.; Xiang, C.; Du, H.; Niyato, D.; Gao, S. Diffusion-Modeled Reinforcement Learning for Carbon and Risk-Aware Microgrid Optimization. arXiv 2025. [Google Scholar] [CrossRef]
  113. Ioannou, I.; Javaid, S.; Tan, Y.; Vassiliou, V. Autonomous Reinforcement Learning for Intelligent and Sustainable Autonomous Microgrid Energy Management. Electronics 2025, 14, 2691. [Google Scholar] [CrossRef]
  114. Hasheminasab, S.; Lotfy, A.; Alzayed, M.; Chaoui, H. A Proximal Policy Optimization-Based Controller for Enhanced Power Sharing in Microgrids. IEEE Access 2025, 13, 162391. [Google Scholar] [CrossRef]
  115. Dinata, N.F.P.; Ramli, M.A.M.; Jambak, M.I.; Sidik, M.A.B.; Alqahtani, M. Designing an Optimal Microgrid Control System Using Deep Reinforcement Learning: A Systematic Review. Eng. Sci. Technol. Int. J. 2024, 51, 101651. [Google Scholar] [CrossRef]
  116. Suryadevara, R.; Idowu, P.A. Intelligent Operation and Control of Microgrids Using Multiple Reinforcement Learning Agents. Master’s Thesis, The Pennsylvania State University, University Park, PA, USA, 2022; pp. 1–73. Available online: https://etda.libraries.psu.edu/catalog/18900rss5336 (accessed on 1 May 2026).
  117. Jain, A.P.; Sridevi, J.; Dabral, U.; Malhotra, A.; Kapila, I. Multi-Agent Reinforcement Learning for Power System Operation and Control. E3S Web Conf. 2024, 511, 1021. [Google Scholar] [CrossRef]
  118. Junwei, Z.; Zhang, H.H.; Han, S.D.; Lü, S. Proximal Policy Optimization via Enhanced Exploration Efficiency. Inf. Sci. 2022, 609, 750. [Google Scholar] [CrossRef]
  119. Aliyeva, O.; Babazade, I. Reliability-Oriented Microgrid Control Using Reinforcement Learning. Reliab. Theory Appl. 2025, 20, 339–345. [Google Scholar]
  120. Seo, G.; Wang, W.; Mirafzal, B. Microgrid Black Start Challenges: The Role of Grid-Forming Inverters. IEEE Access 2025, 13, 198087. [Google Scholar] [CrossRef]
  121. Sadeque, F.; Gursoy, M.; Mirafzal, B. Grid-Forming Inverters in a Microgrid: Maintaining Power During an Outage and Restoring Connection to the Utility Grid Without Communication. IEEE Trans. Ind. Electron. 2024, 71, 11796. [Google Scholar] [CrossRef]
  122. Huang, H.; Kumar, A.; Lin, Y. From Islanding Detection to Islanding Identification: A Critical Step Towards Self-Healing Distribution Networks with Grid-Forming Inverter Fleets. IEEE Trans. Smart Grid 2026, 17, 3194–3206. [Google Scholar] [CrossRef]
  123. Banerjee, A.; Pawaskar, V.U.; Seo, G.; Pandey, A.; Pailla, U.R.; Wu, X.; Muenz, U. Autonomous Restoration of Networked Microgrids Using Communication-Free Smart Sensing and Protection Units. IEEE Trans. Sustain. Energy 2023, 14, 1076. [Google Scholar] [CrossRef]
  124. Khan, A.; Khattak, A.U.; Khan, B.; Ali, S.M.; Ullah, Z.; Mehmood, F. Intelligent Renewable Energy Agent-Based Distributed Control Design for Frequency Regulation and Economic Dispatch. Int. Trans. Electr. Energy Syst. 2024, 2024, 5851912. [Google Scholar] [CrossRef]
  125. Amjad, M.H.H.; Shovon, M.S.S.; Zubair, K.M.; Rimon, R.H. Multi-Agent AI System for Coordinated Dispatch of Renewable Energy and Storage in Islanded Microgrids. J. Comput. Sci. Technol. Stud. 2020, 2, 53. [Google Scholar] [CrossRef]
  126. Ji, Y.; Wang, J.; Xu, J.; Fang, X.; Zhang, H. Real-Time Energy Management of a Microgrid Using Deep Reinforcement Learning. Energies 2019, 12, 2291. [Google Scholar] [CrossRef]
  127. Jalilian, A.; Taheri, B.; Molzahn, D.K. Co-Optimization of Damage Assessment and Restoration: A Resilience-Driven Dynamic Crew Allocation for Power Distribution Systems. IEEE Trans. Power Syst. 2024, 40, 676–688. [Google Scholar] [CrossRef]
  128. Liu, W.; Xu, Q.; Qin, M.; Yang, Y. A Post-Disaster Fault Recovery Model for Distribution Networks Considering Road Damage and Dual Repair Teams. Energies 2024, 17, 5020. [Google Scholar] [CrossRef]
  129. Elkazaz, M.; Sumner, M.; Thomas, D. Energy Management System for Hybrid PV-Wind-Battery Microgrid Using Convex Programming, Model Predictive and Rolling Horizon Predictive Control with Experimental Validation. Int. J. Electr. Power Energy Syst. 2019, 115, 105483. [Google Scholar] [CrossRef]
  130. Chen, Y.; Hashimoto, S.; Jiang, W.; Qian, X.-Y. Research on Design and Implementation of Microgrid Energy Management System. In 2025 8th International Conference on Electrical Engineering and Green Energy (CEEGE); IEEE: New York, NY, USA, 2025; p. 362. [Google Scholar] [CrossRef]
  131. Luo, Z.; Gu, W.; Wu, Z.; Wang, Z.; Tang, Y. A Robust Optimization Method for Energy Management of CCHP Microgrid. J. Mod. Power Syst. Clean. Energy 2017, 6, 132. [Google Scholar] [CrossRef]
  132. Bhusal, N.; Gautam, M.; Benidris, M. Sizing of Movable Energy Resources for Service Restoration and Reliability Enhancement. In Proceedings of the 2021 IEEE Power & Energy Society General Meeting (PESGM), Washington, DC, USA, 2 August 2020; p. 1. [Google Scholar]
  133. Chen, X.; Qu, G.; Tang, Y.; Low, S.H.; Li, N. Reinforcement Learning for Selective Key Applications in Power Systems: Recent Advances and Future Challenges. IEEE Trans. Smart Grid 2022, 13, 2935. [Google Scholar] [CrossRef]
Figure 1. Conceptual curve of dynamic resilience to high-impact low-probability events. Source: authors’ own elaboration based on the resilience-performance trajectory concepts discussed in [5,60]. The shaded area represents accumulated performance loss, while the recovery slope indicates the speed at which service is restored after the disturbance.
Energies 19 03241 g001
Figure 2. Resilience-oriented hierarchical control architecture in microgrids. Source: authors’ own elaboration based on the hierarchical-control functions reported in [32,40,63,64,65,66]. The figure links tertiary scheduling, secondary restoration/resynchronization, and primary converter response to the resilience phases shown in Figure 1.
Energies 19 03241 g002
Figure 3. GFM vs. GFL functional taxonomy and black-start sequence according to IEEE 2030.7. Source: authors’ own redrawn schematic based on the functional requirements and control concepts discussed in [29,72,73,74]; no third-party figure is reproduced. The sequence should be interpreted as a conceptual representation of voltage-reference formation, synchronization, critical-load restoration, and grid reconnection.
Energies 19 03241 g003
Figure 4. Annual evolution of scientific output on microgrid resilience (2016–2025). Source: authors’ own elaboration from the corrected Scopus corpus after excluding 2015 records. The fitted curves summarize observed publication behavior only and should not be interpreted as predictive models.
Energies 19 03241 g004
Figure 5. Bibliometric mapping workflow implemented in CiteSpace. Source: authors’ own workflow diagram based on the Scopus export, screening, deduplication, and CiteSpace configuration used in this study. The figure documents the corrected 283-record corpus and clarifies that CiteSpace is the visualization and mapping tool within the broader hybrid review design.
Energies 19 03241 g005
Figure 6. Institutional collaboration network of major research institutions. Source: authors’ own CiteSpace visualization from the corrected Scopus corpus. Node size reflects publication volume, purple rings indicate betweenness centrality, and links represent co-authorship/collaboration relationships; the figure supports the claim that productivity and brokerage are not always concentrated in the same institutions.
Energies 19 03241 g006
Figure 7. Co-authorship network and scientific collaboration clusters among researchers. Source: authors’ own CiteSpace visualization from the corrected Scopus corpus. The figure should be read by comparing node size, link density, and centrality rings; it supports the interpretation that some productive authors are embedded in relatively closed clusters while a smaller set of authors connects otherwise separate communities.
Energies 19 03241 g007
Figure 8. International scientific collaboration network and co-occurrence maps by country. Source: authors’ own CiteSpace visualization from the corrected Scopus corpus. Node size represents publication volume, link patterns indicate international collaboration, and centrality rings identify countries that connect otherwise separate collaboration groups.
Energies 19 03241 g008
Figure 10. Timeline visualization of thematic clusters in the document co-citation network. Source: authors’ own CiteSpace visualization from the corrected Scopus corpus. Each horizontal line corresponds to a co-citation cluster, nodes indicate cited documents positioned by year, and larger or warmer-colored nodes represent stronger citation influence or burst behavior.
Energies 19 03241 g010
Figure 11. Temporal distribution of research intensity by clusters. Source: authors’ own CiteSpace visualization from the corrected Scopus corpus. Brighter or denser bands indicate periods in which a cluster receives stronger bibliometric attention; the figure is retained to complement Figure 10 by showing relative temporal intensity rather than causal relationships.
Energies 19 03241 g011
Figure 12. Top 20 keywords with the strongest citation bursts in the 2016–2025 period. Source: authors’ own CiteSpace visualization from the corrected Scopus corpus. Red bars indicate the years in which a keyword experienced a statistically detected citation burst; the figure supports the interpretation of changing research attention over time.
Energies 19 03241 g012
Table 1. Bibliometric screening and CiteSpace configuration used for reproducibility.
ComponentConfiguration or DecisionPurpose
DatabaseScopus; final corpus of 283 article records retrieved on 25 February 2026 after topical screening, duplicate removal, and exclusion of 2015 records.Clarifies the database source and removes the Scopus/Web of Science inconsistency
Time slicingJanuary 2016–December 2025; one-year slicesEnsures complete annual intervals for trend and cluster interpretation
Text fieldsTitle, abstract, author keywords, and indexed keywordsDefines the terminology sources used for co-occurrence and cluster labels
Selection criterionTop 50 items per sliceKeeps networks comparable across years while controlling density
Networks generatedInstitutions, authors, countries, journals, keywords, co-citations, timeline clusters, and burstsConnects the bibliometric outputs with the research questions
Table 2. Co-occurrence and centrality analysis of the main research institutions.
CentralityCountYearInstitutions
0.0372016Argonne National Laboratory
0.0222017Xi’an Jiaotong University
0.01122022Islamic Azad University
0.0142021University of the Ryukyus
0.0142021University of Vaasa
0.0142018Southern Methodist University
0.0132019Illinois Institute of Technology
0.0122022University of Isfahan
0.0122017King Abdulaziz University
0.0092020Nanjing University of Science and Technology
0.0062023Department of Electrical and Electronics Engineering
0.0062017Pacific Northwest National Laboratory
0.0062021University of Tabriz
0.0062016Washington State University
0.0052019Aalborg University
0.0052020Hohai University
0.0052016Sharif University of Technology
0.0052016Idaho National Laboratory
0.0052023Tsinghua University
Table 3. Analysis of publication frequency and centrality of the most influential authors.
CentralityCountYearAuthors
0.0262016Chen, Chen
0.0242021Shafie-khah, Miadreza
0.0232017Shahidehpour, Mohammad
0.0232017Bie, Zhaohong
0.0222019Amirioun, Mohammad Hassan
0.0162016Wang, Jianhui
0.0092020Cai, Sheng
0.0072023Xie, Yunyun
0.0062020Wu, Qiuwei
0.0052016Farzin, Hossein
0.0042022Hemmati, Reza
0.0042021Masrur, Hasan
0.0042021Senjyu, Tomonobu
0.0032023Strbac, Goran
Table 4. Top 10 Keyword Co-occurrence.
Rank Keyword Count Centrality Year
1Microgrid1600.162021
2Microgrids1070.142020
3Resilience790.122018
4Outages690.202016
5Disasters530.072016
6Distribution Systems530.092016
7Restoration500.062017
8Integer Programming440.052016
9Optimization440.082017
10Electric Power Transmission Networks390.062017
Table 5. Co-occurrence analysis of countries by document volume and intermediation centrality.
Serial No. Documents Centrality Year Keywords
1970.402016U.S.
2660.122017China
3580.602016Iran
4250.162018India
5250.162018United Kingdom
6110.142017Saudi Arabia
790.112019Denmark
880.032018Finland
980.102020Australia
1080.082020Canada
1180.142019South Korea
Table 6. Co-citation analysis of journals.
CountCentralityYearCited Journals
1590.282016IEEE Transactions on Smart Grid
1400.232019IEEE ACCESS
1080.212018ENERGY
900.112017ENERGY APPLICATIONS
810.182016ENERGIES
690.042018IEEE Transactions on Sustainable Energy
620.052018IEEE Transactions on Smart Grid
530.042016IEEE PROC.
520.022017APPL ENERGY
510.022018IEEE Trans. Power Syst.
460.042017IEEE Trans. Power Syst.
410.012020Int. J. Electr. Power Energy
390.082017IEEE Power & Energy Magazine
330.042021SUSTAINABILITY
320.012021J. ENERGY STORAGE
Table 8. Systematic Table of Findings and Gaps.
Thematic AreaCluster(s)Representative Reviewed WorksMain FindingCritical Gap
Multi-energy EMS and demand-side management#0, #1, #5[87,88,89,90,91,92,93,94,95,129,130,131]Fuzzy logic, MPC, rolling-horizon scheduling, and multi-vector EMS reduce grid dependence and smooth electro-thermal demand profiles.Real-time scalability, cyber-secure communication, and validation during degraded communication conditions.
Robust, stochastic, and chance-constrained planning#5, #6, #1[38,98,99,100,101,102]Robust and stochastic formulations manage renewable/load uncertainty and define resilience-aware operating margins.Conservatism, scenario dependence, and limited coupling with physical damage models for HILP events.
Mobile restoration resources and post-event flexibility#2, #3, #7[103,104,105,106,107,108,109,110,111,132]TESS, MESS, mobile emergency generators, and electric vehicles provide spatio-temporal flexibility for critical-load restoration.Integration with transportation damage, road accessibility, repair logistics, and crew dispatch.
Reconfiguration and dynamic microgrid formation#1, #3, #4[61,103,106,107,123,127,128]Adaptive formation and reconfiguration support islanded service areas and reduce load shedding after disturbances.Protection coordination, radial/loop topology constraints, and validation under cascading multi-asset damage.
Reinforcement learning and multi-agent control#0, #3, #4[73,112,113,114,115,116,117,118,119,126,133]RL and multi-agent methods support adaptive EMS, selective power-system applications, and distributed decision-making.Operational stability guarantees, explainability, safety constraints, and transfer from simulation to real-time operation.
Grid-forming/GFL control and black-start#8, #4[28,29,70,72,74,120,121,122,123]GFM inverters can establish voltage/frequency references and support islanded black-start sequences, while GFL units require an external reference.Commercial-scale hardware-in-the-loop validation, protection coordination, and interoperability among heterogeneous inverter fleets.
Hierarchical control and interoperability standards#0, #1, #4, #6[40,63,64,65,66,129]Primary, secondary, and tertiary control layers link stability, restoration, EMS optimization, and resynchronization functions.Standardized data exchange, degraded-network coordination, and unified metrics across control layers.
Resilience metrics and HILP quantification#6, #8[5,55,56,57,58,59,60,71]Performance-loss metrics, trapezoids, graph approaches, and dynamic resilience criteria quantify degradation and recovery.Consistent normalization, comparability across studies, and integration with control-oriented performance indicators.
Disclaimer/Publisher’s Note: The statements, opinions and data contained in all publications are solely those of the individual author(s) and contributor(s) and not of MDPI and/or the editor(s). MDPI and/or the editor(s) disclaim responsibility for any injury to people or property resulting from any ideas, methods, instructions or products referred to in the content.