Article

Optimal Voltage Regulator Placement in the Guayacanes Feeder of the Buena Fe Substation: A Multi-Criteria Exhaustive Search Framework for an Ecuadorian Distribution System

by
Iván Ramírez Pazmiño
,
Kevin Pantaleón
and
Alexander Aguila Téllez
*
GIREI Research Group, Electrical Engineering Department, Universidad Politécnica Salesiana, Guayaquil 090101, Ecuador
*
Author to whom correspondence should be addressed.
Energies 2026, 19(12), 2792; https://doi.org/10.3390/en19122792
Submission received: 27 April 2026 / Revised: 14 May 2026 / Accepted: 25 May 2026 / Published: 10 June 2026
(This article belongs to the Section F1: Electrical Power System)

Abstract

This study proposes a rigorous methodology for the optimal placement of voltage regulators in the Guayacanes feeder of the Buena Fe substation, Ecuador, by integrating electrical feeder modeling, exhaustive search, and multi-criteria decision-making. The feeder was modeled in detail by incorporating its radial topology, nodal electrical parameters, and representative operating conditions under minimum- and maximum-load scenarios. Based on this model, a set of technical evaluation criteria was established to quantify the impact of regulator installation, including active power losses, reactive power losses, global voltage deviation, average voltage variation, and voltage imbalance. An exhaustive search strategy was then implemented to evaluate all feasible regulator-location alternatives over the candidate nodes, thereby ensuring a complete exploration of the solution space. The resulting alternatives were ranked using the Weighted Sum Method (WSM) and the Technique for Order Preference by Similarity to Ideal Solution (TOPSIS), allowing the comparison of candidate locations from a multi-criteria perspective. The results indicate that node MTS 108932 provides the most technically favorable overall solution, achieving the greatest improvement in voltage profile quality and the most significant reduction in electrical losses. In addition, a sensitivity analysis was conducted by varying the weighting structure of the decision criteria, confirming the robustness of the selected alternative under different decision-maker preference scenarios. The proposed framework provides a technically sound decision-support methodology for voltage regulation planning in real radial distribution systems.

1. Introduction

Electrical distribution systems constitute the final stage of the power supply chain before electricity reaches end users, and their main function is to transfer power from substations to residential, commercial, and industrial load centers [1,2]. At this stage of energy delivery, problems such as voltage drops, technical losses, and unstable voltage profiles occur more frequently due to the intrinsic characteristics of radial networks, the high resistance-to-reactance ratio ( R / X ), and the temporal variability of demand [3,4]. These operating conditions require technically sound solutions capable of preserving both operational stability and service quality, particularly in long feeders or in systems subjected to high loading levels [5].
A representative case is the Guayacanes feeder, which belongs to the Buena Fe substation. Historical operating records have shown the existence of significant voltage drops, mainly along its main trunk, which directly affect the continuity and reliability of the electrical service. The presence of loads distributed over long distances from the feeder source, together with the total line impedance, has resulted in a progressive deterioration of the voltage profile that becomes critical during peak-demand periods. This problem leads to deficiencies in supply quality, increased power losses, and negative impacts on residential, commercial, and industrial users [6]. In addition, the topological characteristics of the Guayacanes feeder correspond to a typical radial scheme, in which energy flows in only one direction from the substation toward consumers. Although this topology facilitates protection coordination and simplifies operation, it also limits the system’s capability to redistribute loads and mitigate voltage drops unless auxiliary devices or advanced control strategies are incorporated [7].
Among the technical solutions that have demonstrated the greatest usefulness in recent years for improving the performance of distribution systems, voltage regulators stand out [8,9]. In this work, the analyzed voltage regulator corresponds to a step-voltage regulator based on an autotransformer with tap-changing capability, which is commonly employed in medium-voltage radial distribution feeders for steady-state voltage-profile correction. This type of regulator adjusts the effective transformation ratio through discrete tap positions in order to compensate for voltage drops associated with feeder impedance and downstream loading conditions [10]. Their proper placement within the feeder is essential to guarantee service efficiency and to comply with the limits established by Ecuadorian regulations as well as international standards such as IEEE and IEC [11]. However, the optimal placement of these elements requires a detailed analysis of feeder behavior under different loading scenarios, taking into account nodal voltages, technical losses, power flows, network topology, and the impedance of each line section [12,13]. Although the present study focuses on a conventional step-voltage regulator, the proposed exhaustive-search and multi-criteria framework can also be extended to other voltage-regulation technologies, such as on-load tap-changing transformers, smart inverters, distributed reactive compensation devices, or electronically controlled voltage-support systems, provided that the corresponding technical performance indicators are incorporated into the evaluation stage.
Because of this complexity, regulator-placement studies increasingly rely on electrical simulation, optimization, and multi-criteria decision-making instead of empirical or purely heuristic procedures. Simulation tools and optimization techniques allow feeder behavior to be assessed under alternative configurations and support systematic planning decisions in distribution networks [14,15,16,17,18,19]. Recent developments also show that exhaustive-search methods, multi-criteria models, linear mathematical formulations, adaptive control strategies, voltage-support devices, and smart-inverter-based resources are increasingly used to improve voltage profiles, reduce losses, and support service-quality compliance in radial distribution systems [20,21,22,23,24,25,26,27,28,29,30,31].
Recent studies have integrated exact optimization techniques, metaheuristics, hybrid models, and multi-criteria decision-making methods with electrical simulations to solve combinatorial problems in distribution systems. These works show that voltage-regulation planning is no longer limited to loss minimization, but also considers service quality, regulatory compliance, stakeholder-based planning, voltage stability, and coordination with distributed voltage-support technologies [3,15,25,26,27,31]. Related studies have also addressed voltage-profile improvement and regulator or compensation-device placement using exhaustive search, genetic algorithms, fuzzy clustering, fuzzy logic, MILP formulations, and nodal-ordering heuristics, demonstrating the relevance of structured optimization tools for real distribution networks [6,11,12,14,18,20,24]. Overall, the literature confirms that simulation-based optimization and multi-criteria decision-making provide a technically justified basis for voltage-regulator placement, while also revealing the need for transparent and auditable frameworks applicable to real radial feeders.
Accordingly, the main objective of this research is to identify the optimal placement of a voltage regulator in the Guayacanes feeder of the Buena Fe substation through a methodology that combines detailed electrical feeder modeling, exhaustive search, and multi-criteria decision-making. The proposed framework is intended to support distribution-planning decisions by explicitly evaluating the technical effect of each feasible regulator location on voltage profile improvement, active and reactive loss reduction, and voltage-quality indicators under representative operating conditions.
The main contribution of this work is threefold. First, unlike studies that rely only on heuristic or metaheuristic search procedures, the proposed approach performs a complete enumeration of the feasible candidate locations, which guarantees that the selected solution corresponds to the global optimum within the defined planning search space and is not affected by initialization, convergence, or parameter-tuning issues. Second, the study integrates exhaustive search with two independent multi-criteria ranking procedures, the WSM and TOPSIS, allowing the regulator-placement decision to be evaluated from complementary aggregation perspectives rather than from a single-objective loss-minimization criterion. Third, the framework is applied to a real Ecuadorian radial distribution feeder with practical operating constraints and two demand scenarios, thereby providing a structured case-based methodology for utility-oriented voltage-regulation planning.
Compared with previous works focused on either isolated voltage-profile correction, metaheuristic optimization, or single-criterion technical assessment [11,12,16,24,25], this research contributes a transparent planning framework in which the candidate-location space, the technical evaluation criteria, the weighting structure, and the final ranking process are explicitly formulated. This makes the proposed method especially useful for distribution utilities that require traceable and auditable decision-support tools for regulator installation in real radial feeders, where practical implementation depends not only on minimizing losses but also on maintaining voltage quality, reducing voltage deviation, preserving phase balance, and supporting regulatory compliance.
The remainder of this paper is organized as follows. Section 2 describes the methodological framework, including feeder modeling, definition of the evaluation criteria, and the formulation of the exhaustive-search and multi-criteria decision procedures. Section 3 presents the results obtained under maximum- and minimum-load conditions, together with the comparative and sensitivity analyses. Finally, Section 4 summarizes the main findings and the principal conclusions derived from the study.

2. Methodology

This section presents the methodological framework adopted to determine the optimal placement of a voltage regulator in the Guayacanes feeder of the Buena Fe substation. Since the problem addressed in this study is a planning problem rather than a real-time operational control problem, the priority is not to minimize computational time but to guarantee the global optimality of the selected solution within the feasible search space. For this reason, an exhaustive-search strategy was adopted, allowing the complete evaluation of all candidate locations and thus ensuring that the final decision is not affected by initialization conditions, local optima, or stochastic convergence issues typically associated with heuristic and metaheuristic methods.
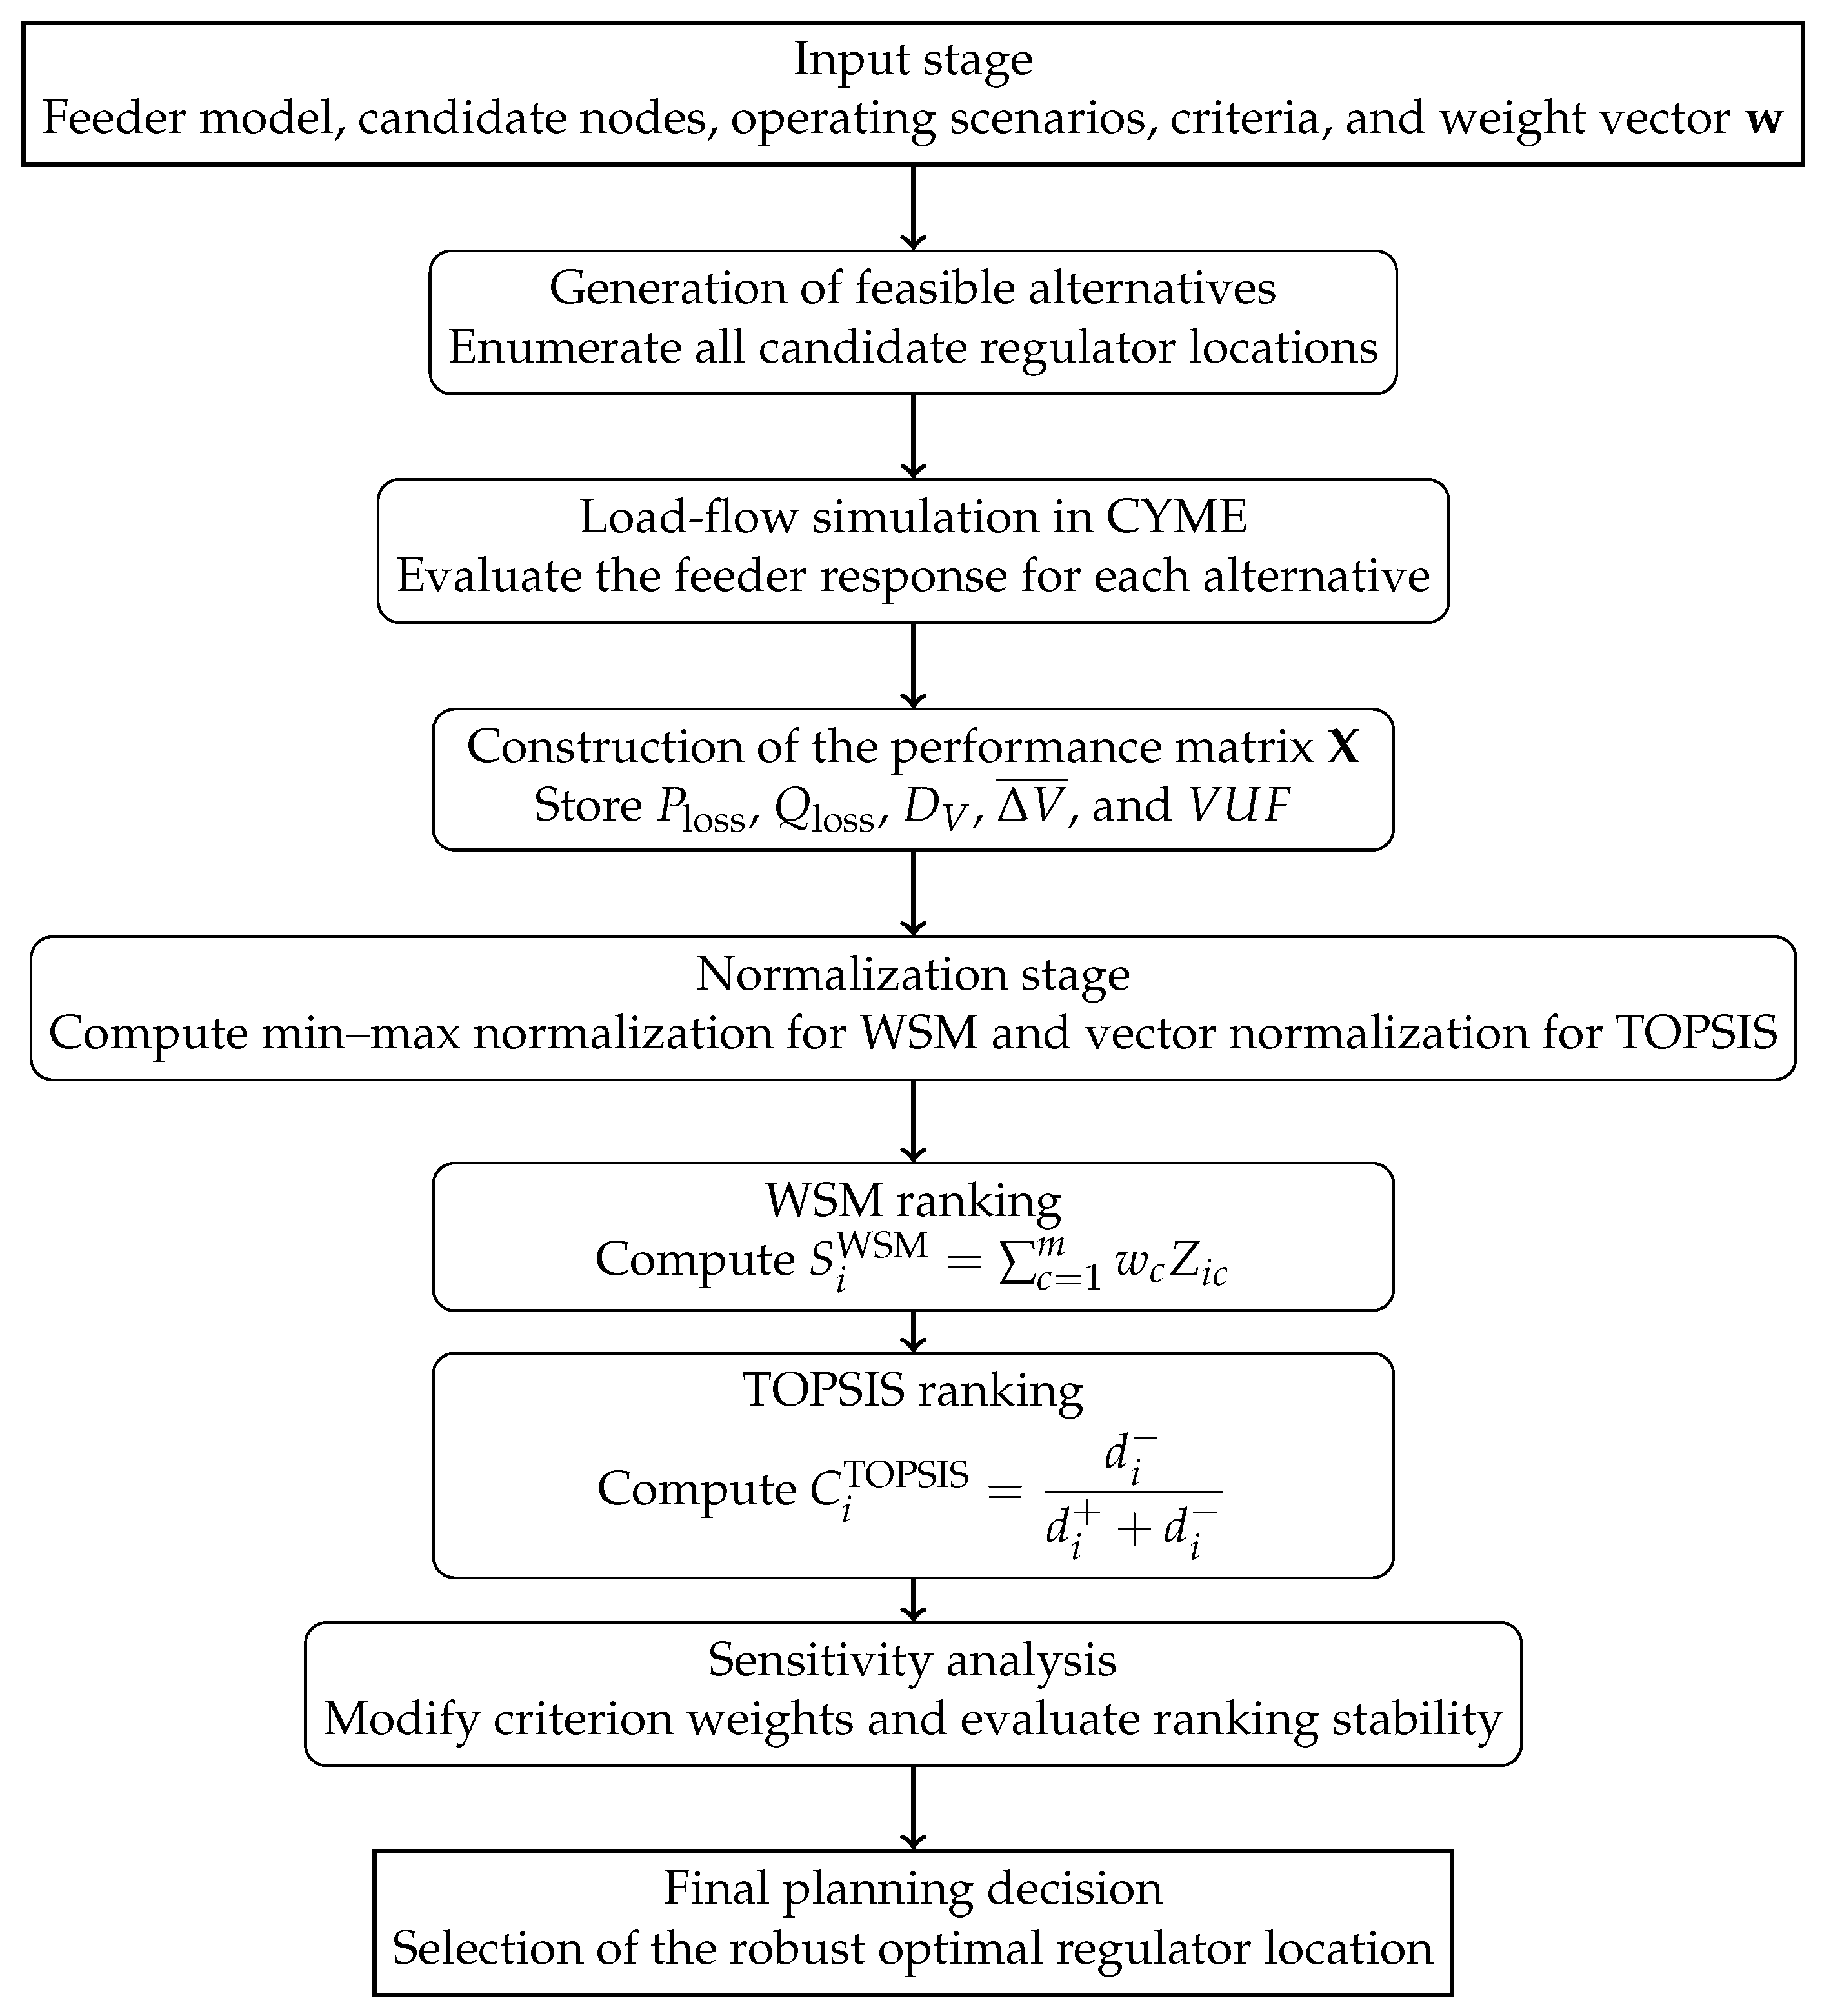
The proposed methodology integrates four main stages: (i) mathematical formulation of the regulator-placement problem; (ii) definition of the technical evaluation criteria and multi-criteria ranking framework; (iii) exhaustive exploration of all feasible placement alternatives; and (iv) application to the real Guayacanes feeder under minimum- and maximum-load operating conditions. The methodological workflow is summarized at the end of this section through the flowchart shown in Figure 1.
Table 1, Table 2 and Table 3 summarize the main sets, indices, variables, parameters, and acronyms used throughout the methodological development. This nomenclature is included to ensure notation consistency, avoid ambiguity in the mathematical formulation, and facilitate the interpretation of the proposed exhaustive-search and multi-criteria decision framework.

2.1. Problem Formulation

The regulator-placement problem was formulated over a finite set of candidate nodes belonging to the main trunk of the feeder. Let
N = { 1 , 2 , , k }
denote the set of candidate nodes where a voltage regulator can potentially be installed. Since this study evaluates the placement of a single regulator, each feasible alternative corresponds to the selection of one node from N . The set of feasible alternatives is therefore defined as
A = { 1 , 2 , , N } ,
where each alternative i A represents one specific regulator-location configuration and, in the present case, N = k .
For formal completeness, the decision variable associated with regulator placement can be expressed as
y n = 1 , if the regulator is installed at candidate node n , 0 , otherwise , n N ,
subject to the single-location constraint
n N y n = 1 .
This constraint guarantees that only one regulator is installed in each evaluated configuration. Accordingly, each alternative i is uniquely associated with one feasible binary placement vector.
For every alternative, a load-flow simulation is performed and a set of technical performance indicators is extracted. Let
C = { 1 , 2 , , m }
be the set of evaluation criteria. In this study, the decision model considers
m = 5
main criteria, namely:
  • c = 1 : total downstream active power losses, P loss ;
  • c = 2 : total downstream reactive power losses, Q loss ;
  • c = 3 : global voltage deviation, D V ;
  • c = 4 : average voltage variation, Δ V ¯ ;
  • c = 5 : voltage unbalance factor, V U F .
These quantities are organized into the performance matrix
X = [ X i c ] R N × m ,
where X i c is the value of criterion c obtained for alternative i.
Thus, the optimization problem is transformed into a finite multi-criteria decision problem in which all feasible regulator-placement alternatives are explicitly evaluated and ranked.

2.2. Technical Evaluation Criteria

The technical criteria were selected because they directly quantify feeder performance in terms of voltage regulation, energy efficiency, and operating quality. Active and reactive power losses were included because they represent the electrical inefficiency associated with current circulation through feeder impedances and are therefore directly related to operating cost, thermal loading, and energy efficiency. Voltage magnitude, global voltage deviation, and average voltage variation were selected because they measure the ability of the regulator to maintain nodal voltages close to nominal values and within acceptable service-quality limits. The voltage unbalance factor was included because excessive phase asymmetry can deteriorate the operation of three-phase loads, increase losses, and reduce power quality. Therefore, the selected criteria jointly represent the main technical effects expected from voltage-regulator placement: loss reduction, voltage-profile improvement, service-quality compliance, and preservation of three-phase operating balance [11,12,22,24].
The line-to-line voltage magnitude and its per-unit representation were used as primary indicators of service quality. For each observation node n, the per-unit voltage is defined as
V n pu = V n V n , base ,
where V n is the simulated nodal voltage magnitude and V n , base is the corresponding base voltage. This normalized form allows the comparison of nodal voltages across the feeder independently of their absolute voltage level and is particularly useful for evaluating whether the regulator maintains the voltage profile within acceptable operating limits.
To quantify the cumulative departure of nodal voltages from the nominal value, the global voltage deviation was defined as
D V = n N obs V n pu 1 2 ,
where N obs denotes the set of observation nodes considered in the feeder. This index penalizes deviations from the nominal condition and provides a global scalar measure of voltage-profile deterioration.
In addition to the global quadratic deviation, the study considered the average voltage variation expressed as a percentage:
Δ V n ( % ) = V n V n , ref V n , ref × 100 ,
where V n , ref denotes the reference voltage at node n. The average voltage variation over the observation set is then given by
Δ V ¯ = 1 | N obs | n N obs Δ V n ( % ) .
This criterion provides a direct measure of the average voltage degradation along the feeder and is useful for assessing the extent to which the regulator mitigates downstream voltage drop.
Power losses were included because they are directly associated with feeder efficiency. In branch-based form, active and reactive losses can be expressed as
P loss = L R | I | 2 , Q loss = L X | I | 2 ,
where L is the set of feeder branches, R and X are the resistance and reactance of branch , and I is the current flowing through that branch. These indices quantify the real and reactive power dissipated in the feeder and therefore reflect the electrical efficiency of each placement alternative.
The voltage unbalance factor was considered in order to ensure that regulator placement does not improve the voltage profile at the expense of deteriorating three-phase symmetry. In general form, this indicator can be written as
V U F ( % ) = | V 2 | | V 1 | × 100 ,
where V 1 and V 2 are the positive- and negative-sequence voltage components, respectively. Lower values of V U F indicate better phase balance and, consequently, more stable operating conditions.

2.3. Weighting Structure and Multi-Criteria Aggregation

Because the selected criteria are expressed in different units and scales, a normalized multi-criteria framework was required. Let
w = [ w 1 , w 2 , , w m ]
be the vector of criterion weights, subject to
w c 0 , c = 1 m w c = 1 .
The baseline weighting coefficients adopted in this study were established according to engineering judgment and the relative operational importance of each technical indicator in radial distribution-system planning. Active and reactive losses were assigned the highest combined importance because they directly affect feeder efficiency, operating cost, and thermal loading. Global voltage deviation and average voltage variation received intermediate weights because they quantify service-quality compliance and voltage-profile improvement. The voltage unbalance factor was assigned a lower, but nonzero, weight because the preliminary diagnosis did not reveal severe phase-asymmetry conditions; nevertheless, it was retained to avoid selecting a solution that improves losses or voltage magnitude while degrading three-phase balance.
Accordingly, the baseline weighting vector used in the main ranking analysis was defined as
w = 0.30 , 0.25 , 0.20 , 0.15 , 0.10 ,
corresponding respectively to active power losses, reactive power losses, global voltage deviation, average voltage variation, and voltage unbalance factor. These coefficients satisfy the normalization condition c = 1 m w c = 1 and were subsequently varied in the sensitivity analysis to evaluate whether the selected regulator location remained stable under different decision-maker preference structures.

2.4. Criterion Normalization

Since all criteria were treated as cost-type indicators, i.e., lower values indicate better technical performance, the min–max normalization adopted for the Weighted Sum Method was defined as follows. For each criterion c,
x c min = min i A X i c , x c max = max i A X i c .
The normalized matrix is defined as
Z = [ Z i c ] [ 0 , 1 ] N × m .
Each normalized entry was then obtained through
Z i c = X i c x c min x c max x c min , i A , c C .
Under this transformation, lower values of Z i c correspond to more favorable technical performance.

2.5. Weighted Sum Method

The first ranking technique employed in this work was the Weighted Sum Method (WSM), which is widely used in multi-criteria decision-making problems because of its simplicity and interpretability [32]. For each alternative i, the weighted score was computed as
S i WSM = c = 1 m w c Z i c .
Since all criteria are to be minimized, the preferred alternative corresponds to the minimum WSM score:
i WSM = arg min i A S i WSM .

2.6. TOPSIS Formulation

To complement the WSM, the Technique for Order Preference by Similarity to Ideal Solution (TOPSIS) was also adopted. TOPSIS is a well-established multi-criteria decision-making method that ranks alternatives according to their distances from the ideal and anti-ideal solutions in the weighted criteria space [32,33]. First, the original performance matrix was vector-normalized as
R i c = X i c j = 1 N X j c 2 , i A , c C ,
yielding the normalized matrix
R = [ R i c ] R N × m .
The weighted normalized matrix was then obtained as
V i c = w c R i c .
Because all criteria are of minimization type, the positive and negative ideal solutions were defined as
v c + = min i A V i c , v c = max i A V i c .
The Euclidean distances from each alternative to the ideal and anti-ideal solutions were then computed as
d i + = c = 1 m V i c v c + 2 , d i = c = 1 m V i c v c 2 .
Finally, the closeness coefficient was calculated as
C i TOPSIS = d i d i + + d i , 0 C i TOPSIS 1 .
The best TOPSIS alternative is the one with the highest closeness coefficient:
i TOPSIS = arg max i A C i TOPSIS .

2.7. Exhaustive-Search Strategy

The exhaustive-search stage consisted of generating and evaluating all feasible regulator-placement alternatives over the candidate-node set. If k candidate nodes are available and one regulator is installed per evaluation, then the total number of feasible alternatives is
N = k 1 = k .
For each alternative i A , the following steps were performed:
  • The regulator was assigned to the corresponding candidate node;
  • A load-flow simulation was executed in CYME;
  • The technical criteria were extracted and stored in the performance matrix X ;
  • The alternatives were ranked using the WSM and TOPSIS.
The main advantage of this strategy is that it guarantees the identification of the global optimum within the finite set of candidate locations. This characteristic is particularly relevant in planning studies, where the objective is to obtain a technically defensible and reproducible solution rather than a rapid online decision. Although exhaustive search may require more computation than reduced-space or heuristic approaches, it avoids the risk of missing the best feasible configuration and therefore provides a stronger basis for technical planning decisions.
From a computational standpoint, the feasibility of the exhaustive-search approach depends primarily on the number of candidate nodes and the dimensionality of the decision space. In the present study, the optimization problem involved a single voltage regulator and a finite set of feasible candidate locations over the main feeder trunk. Consequently, the search space remained computationally manageable and all feasible alternatives could be evaluated without convergence difficulties. The implemented framework processed 6241 simulation records for each operating scenario, including the extraction, normalization, and ranking stages, while maintaining a transparent and traceable evaluation procedure.
Compared with metaheuristic approaches such as Genetic Algorithms (GAs) and Particle Swarm Optimization (PSO), the proposed exhaustive-search methodology offers the advantage of guaranteeing the globally optimal solution within the evaluated search space, whereas heuristic and evolutionary methods may converge to locally optimal solutions depending on initialization conditions, stopping criteria, and parameter tuning [12,16]. In contrast, mathematical-programming approaches such as Mixed-Integer Linear Programming (MILP) can also provide exact solutions with lower computational burden for some formulations; however, they generally require additional linearization procedures and stricter mathematical assumptions that may reduce modeling transparency in real radial distribution feeders [25]. Therefore, for planning problems with a moderate number of candidate locations, exhaustive search constitutes a technically robust alternative because it combines methodological transparency, deterministic reproducibility, and guaranteed global optimality.

2.8. Sensitivity Analysis

To evaluate the robustness of the selected solution, a sensitivity analysis was incorporated into the methodology. This analysis consisted of varying the criterion weights and recomputing the WSM and TOPSIS rankings. In this way, it was possible to verify whether the preferred regulator location remained stable under changes in the relative importance assigned to the technical indicators. This stage is particularly relevant in multi-criteria planning because the final ranking can be affected by the decision-maker’s preference structure.
Although the present sensitivity analysis focused on variations in the weighting structure of the multi-criteria framework, the robustness of the obtained regulator location is also expected to depend on load uncertainty and parameter variability. In practical distribution systems, feeder loading conditions, demand growth, and phase imbalance may vary throughout the day and across seasonal operating conditions. For this reason, future extensions of the proposed methodology should incorporate probabilistic or scenario-based analyses considering stochastic load behavior, parameter uncertainty, and time-varying operating conditions. Nevertheless, the evaluated heavy-load and light-load operating scenarios already provide an initial assessment of the stability of the obtained solution under different demand conditions, which partially supports the robustness of the selected regulator location.

2.9. Methodological Workflow

Before presenting the real feeder under study, it is convenient to summarize the complete computational sequence adopted in this work. The flowchart in Figure 1 synthesizes the proposed framework, including the generation of alternatives, load-flow simulation, construction of the performance matrix, normalization, WSM and TOPSIS ranking, and sensitivity assessment.

2.10. Study Case: Guayacanes Feeder of the Buena Fe Substation

After establishing the mathematical and algorithmic framework, the methodology was applied to the Guayacanes feeder of the Buena Fe substation. The study considered two representative operating conditions: minimum load, corresponding to 10% of the installed power, and maximum load, corresponding to 100% of the installed power. These two operating scenarios were selected in order to capture the feeder response under markedly different demand levels and to evaluate the consistency of the selected regulator location.
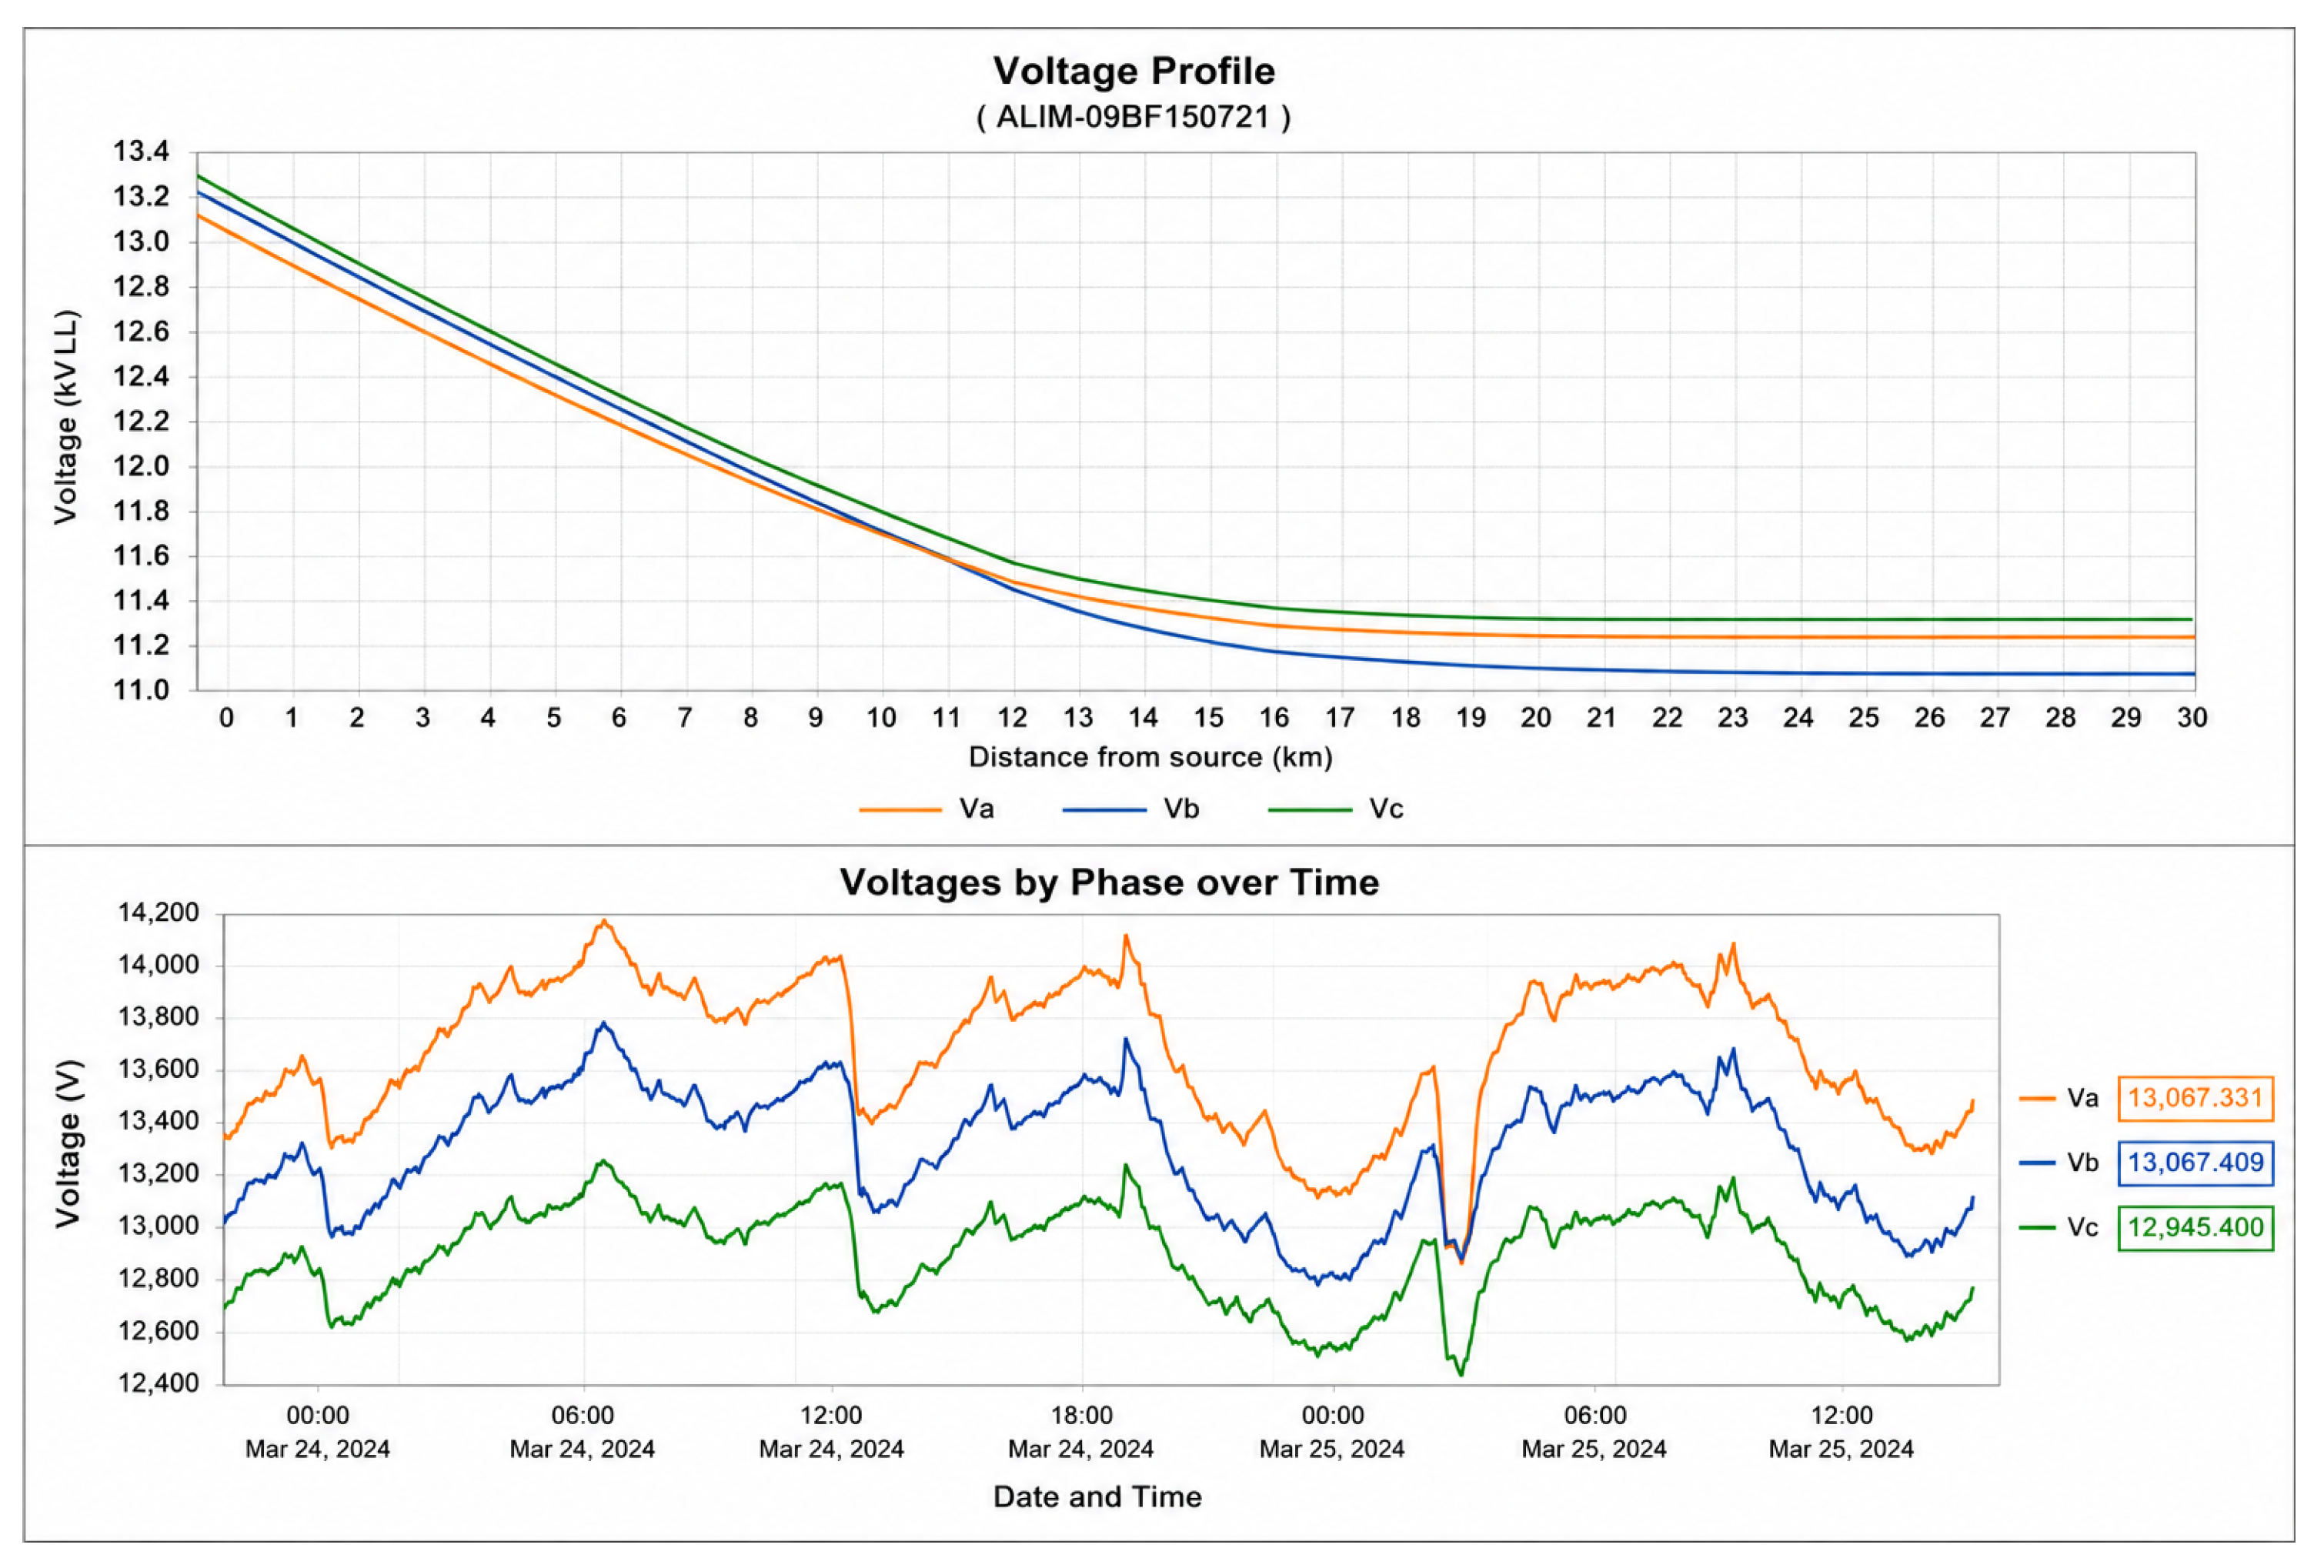
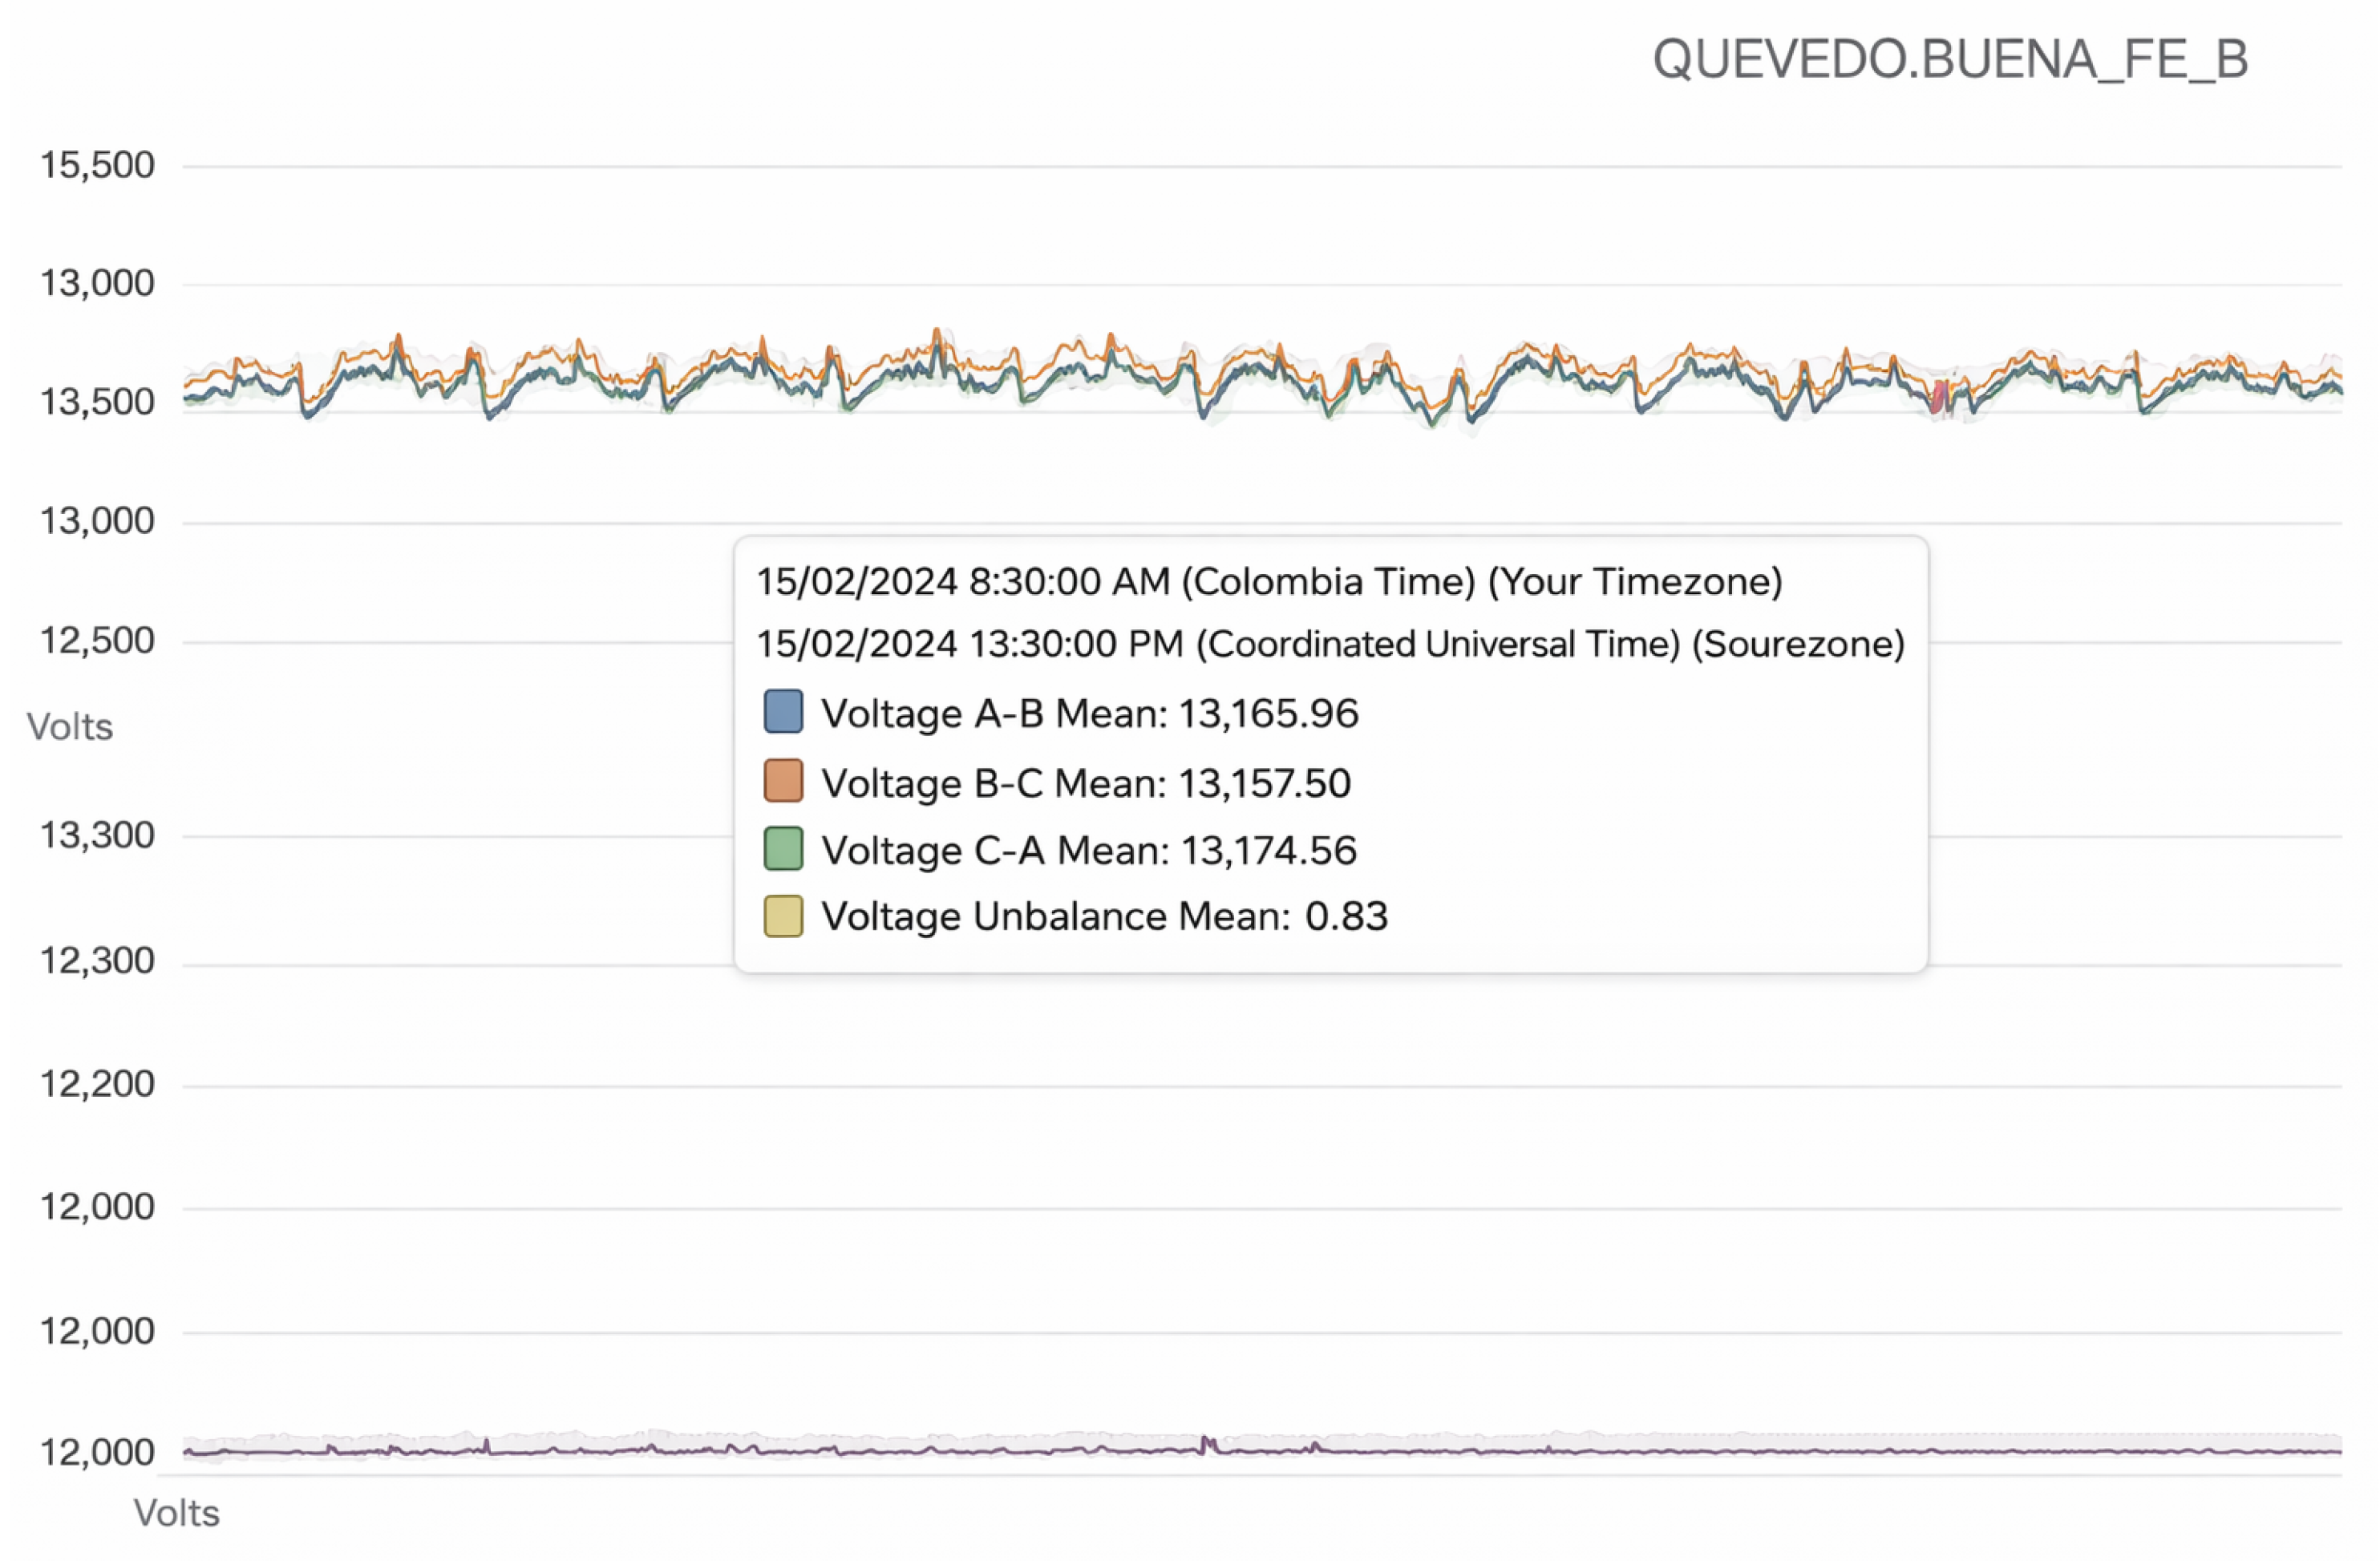
As an initial diagnostic step, historical feeder data from 2024 were analyzed. The historical voltage-drop behavior is presented in Figure 2. This figure shows that the feeder has experienced relevant voltage variations over time, whose most common causes include line impedance, unbalanced loading, and the electrical distance from the supply source. This initial evidence supported the need for a formal technical study of voltage-regulator placement.
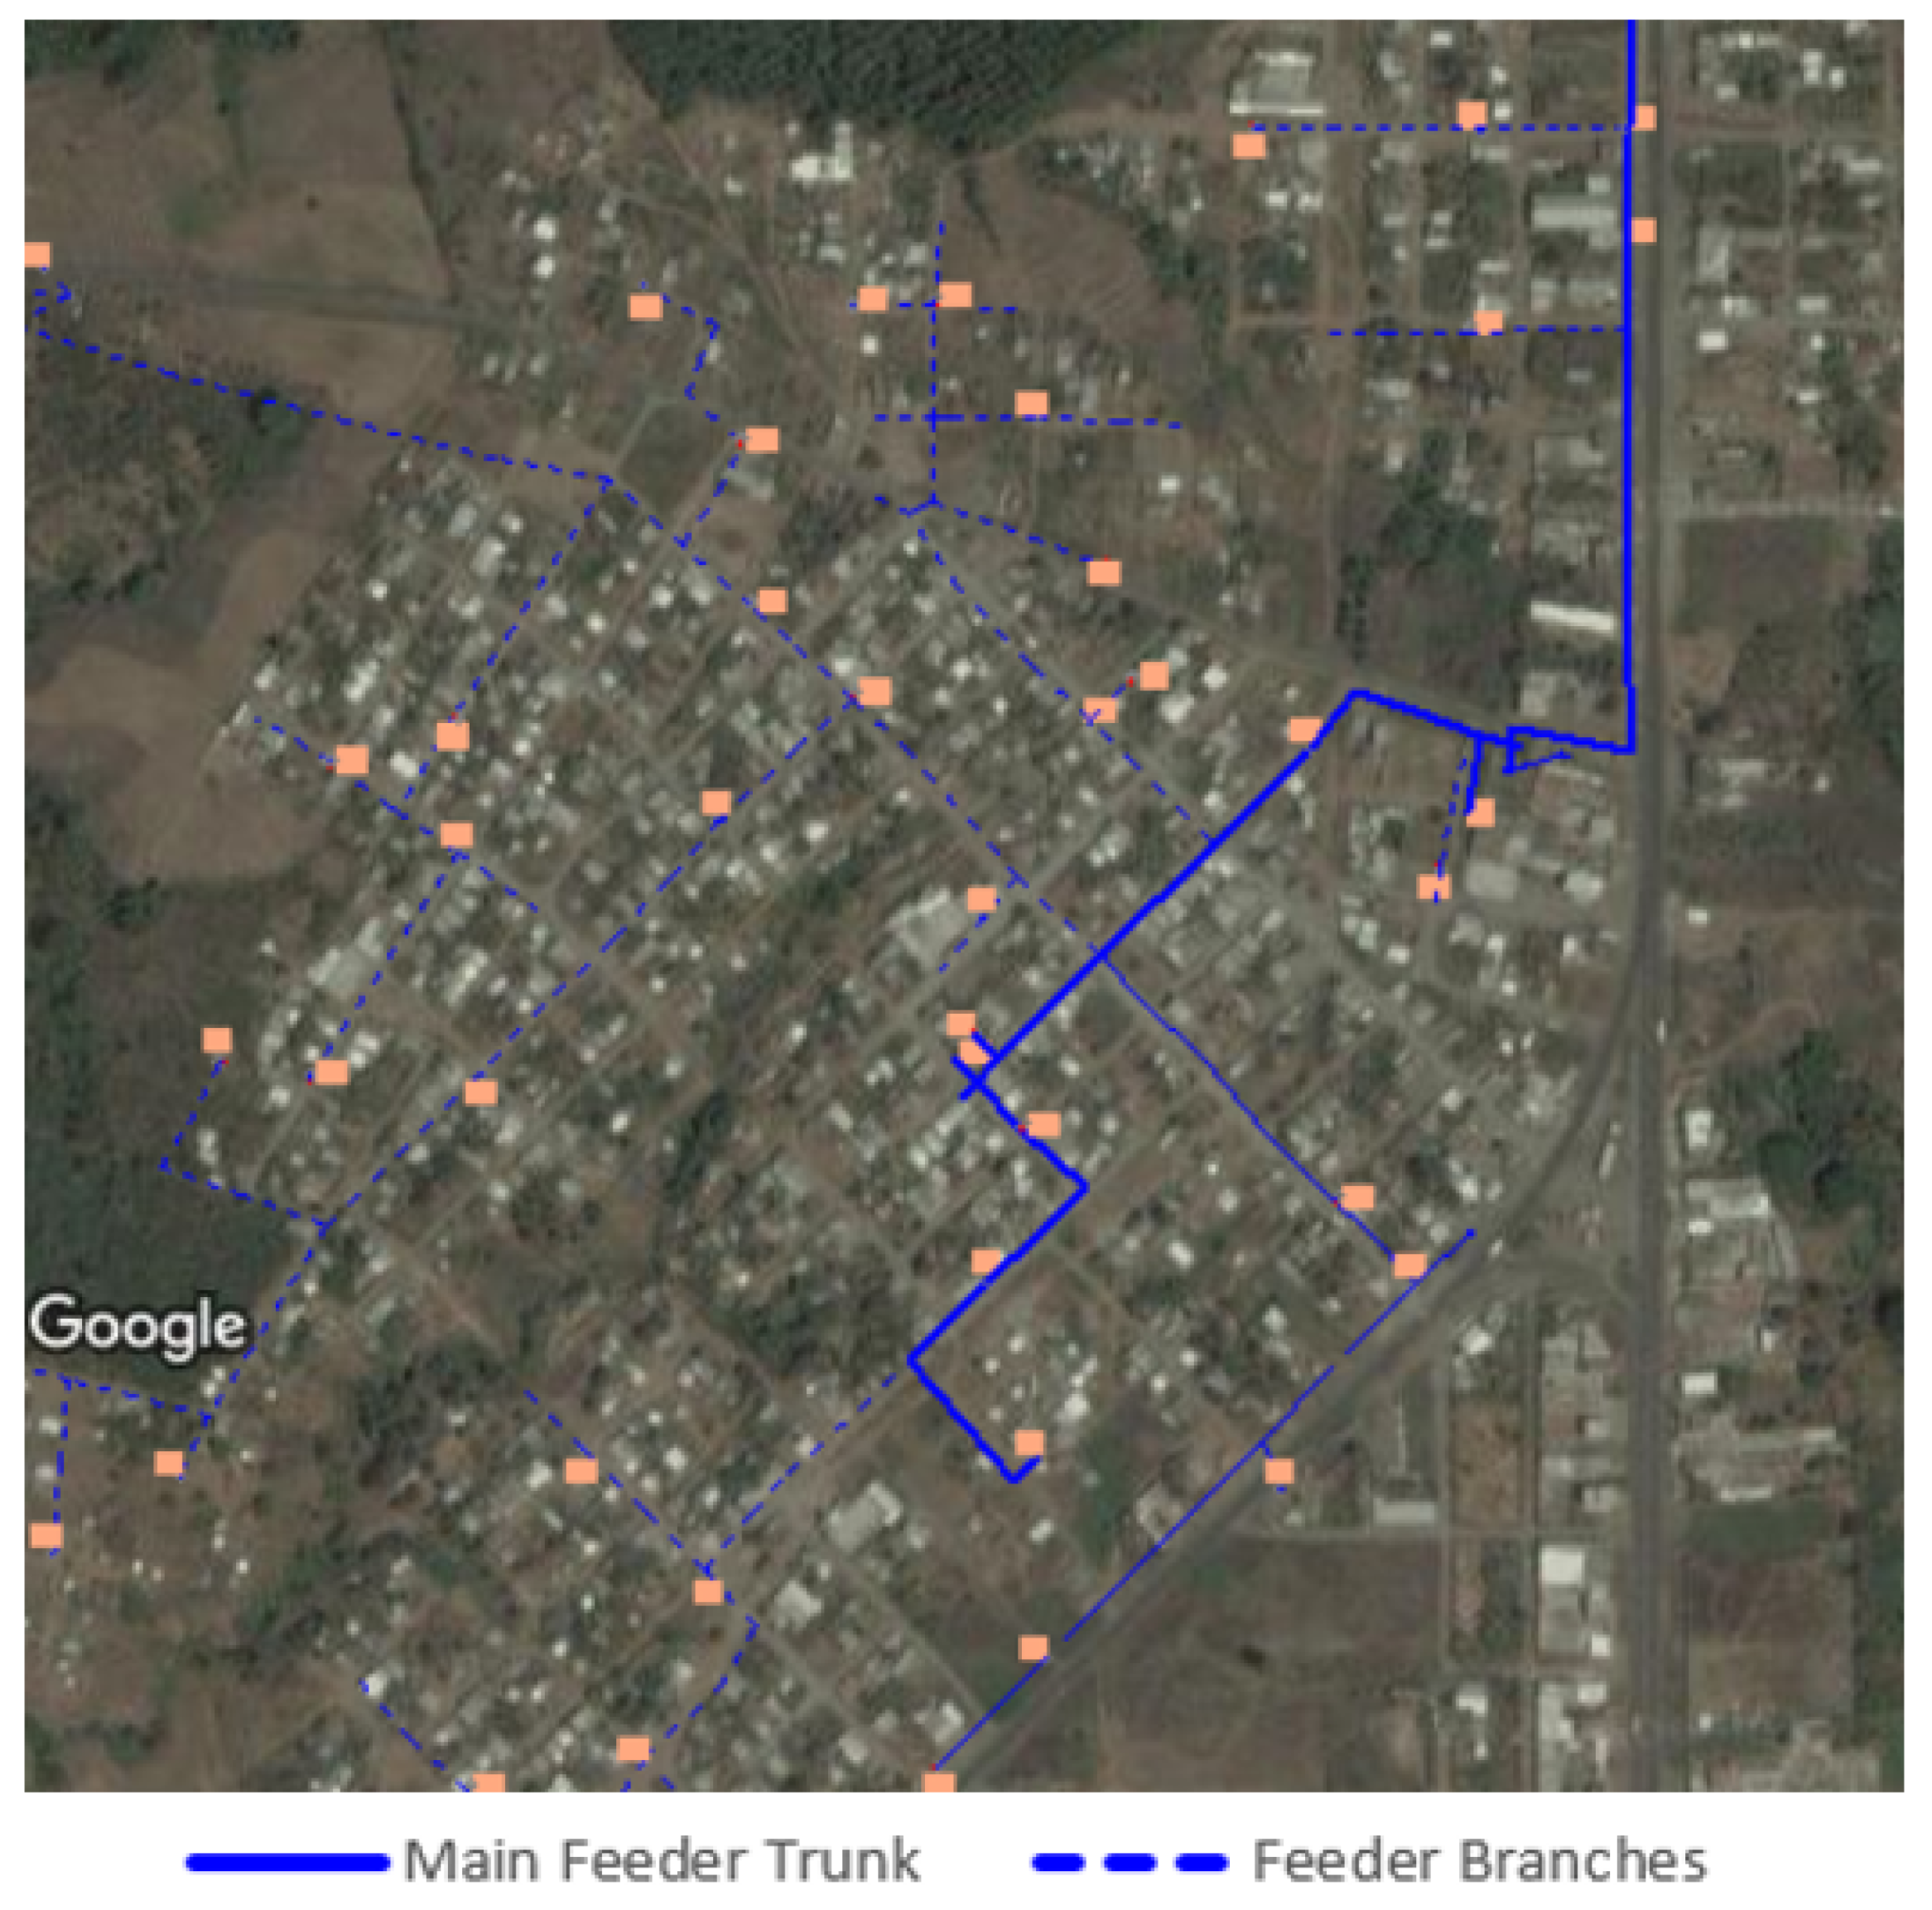
Once the need for voltage regulation had been identified, the Guayacanes feeder was modeled in CYME 9.0 by considering the actual radial topology, three-phase and single-phase loads, transformers, protective devices, and the remaining relevant electrical components. The topological structure of the feeder is shown in Figure 3. Although the network contains several branches, the present study focused on the main trunk, which comprises 79 nodes and concentrates the most critical voltage-drop behavior.
After the feeder model had been assembled, a base-case load-flow simulation was performed in CYME in order to verify the operating condition of the network prior to regulator installation. The resulting voltage-drop behavior along the main feeder trunk is shown in Figure 4. This figure confirms the presence of voltage deterioration in the downstream sections and therefore justifies the subsequent optimization stage.
To complement the graphical assessment, the principal load-flow outputs obtained in the base case are summarized in Table 4. This table provides representative nodal values of base voltage, per-unit voltage, voltage angle, and total losses, thereby establishing the technical reference condition against which all candidate regulator placements were compared.
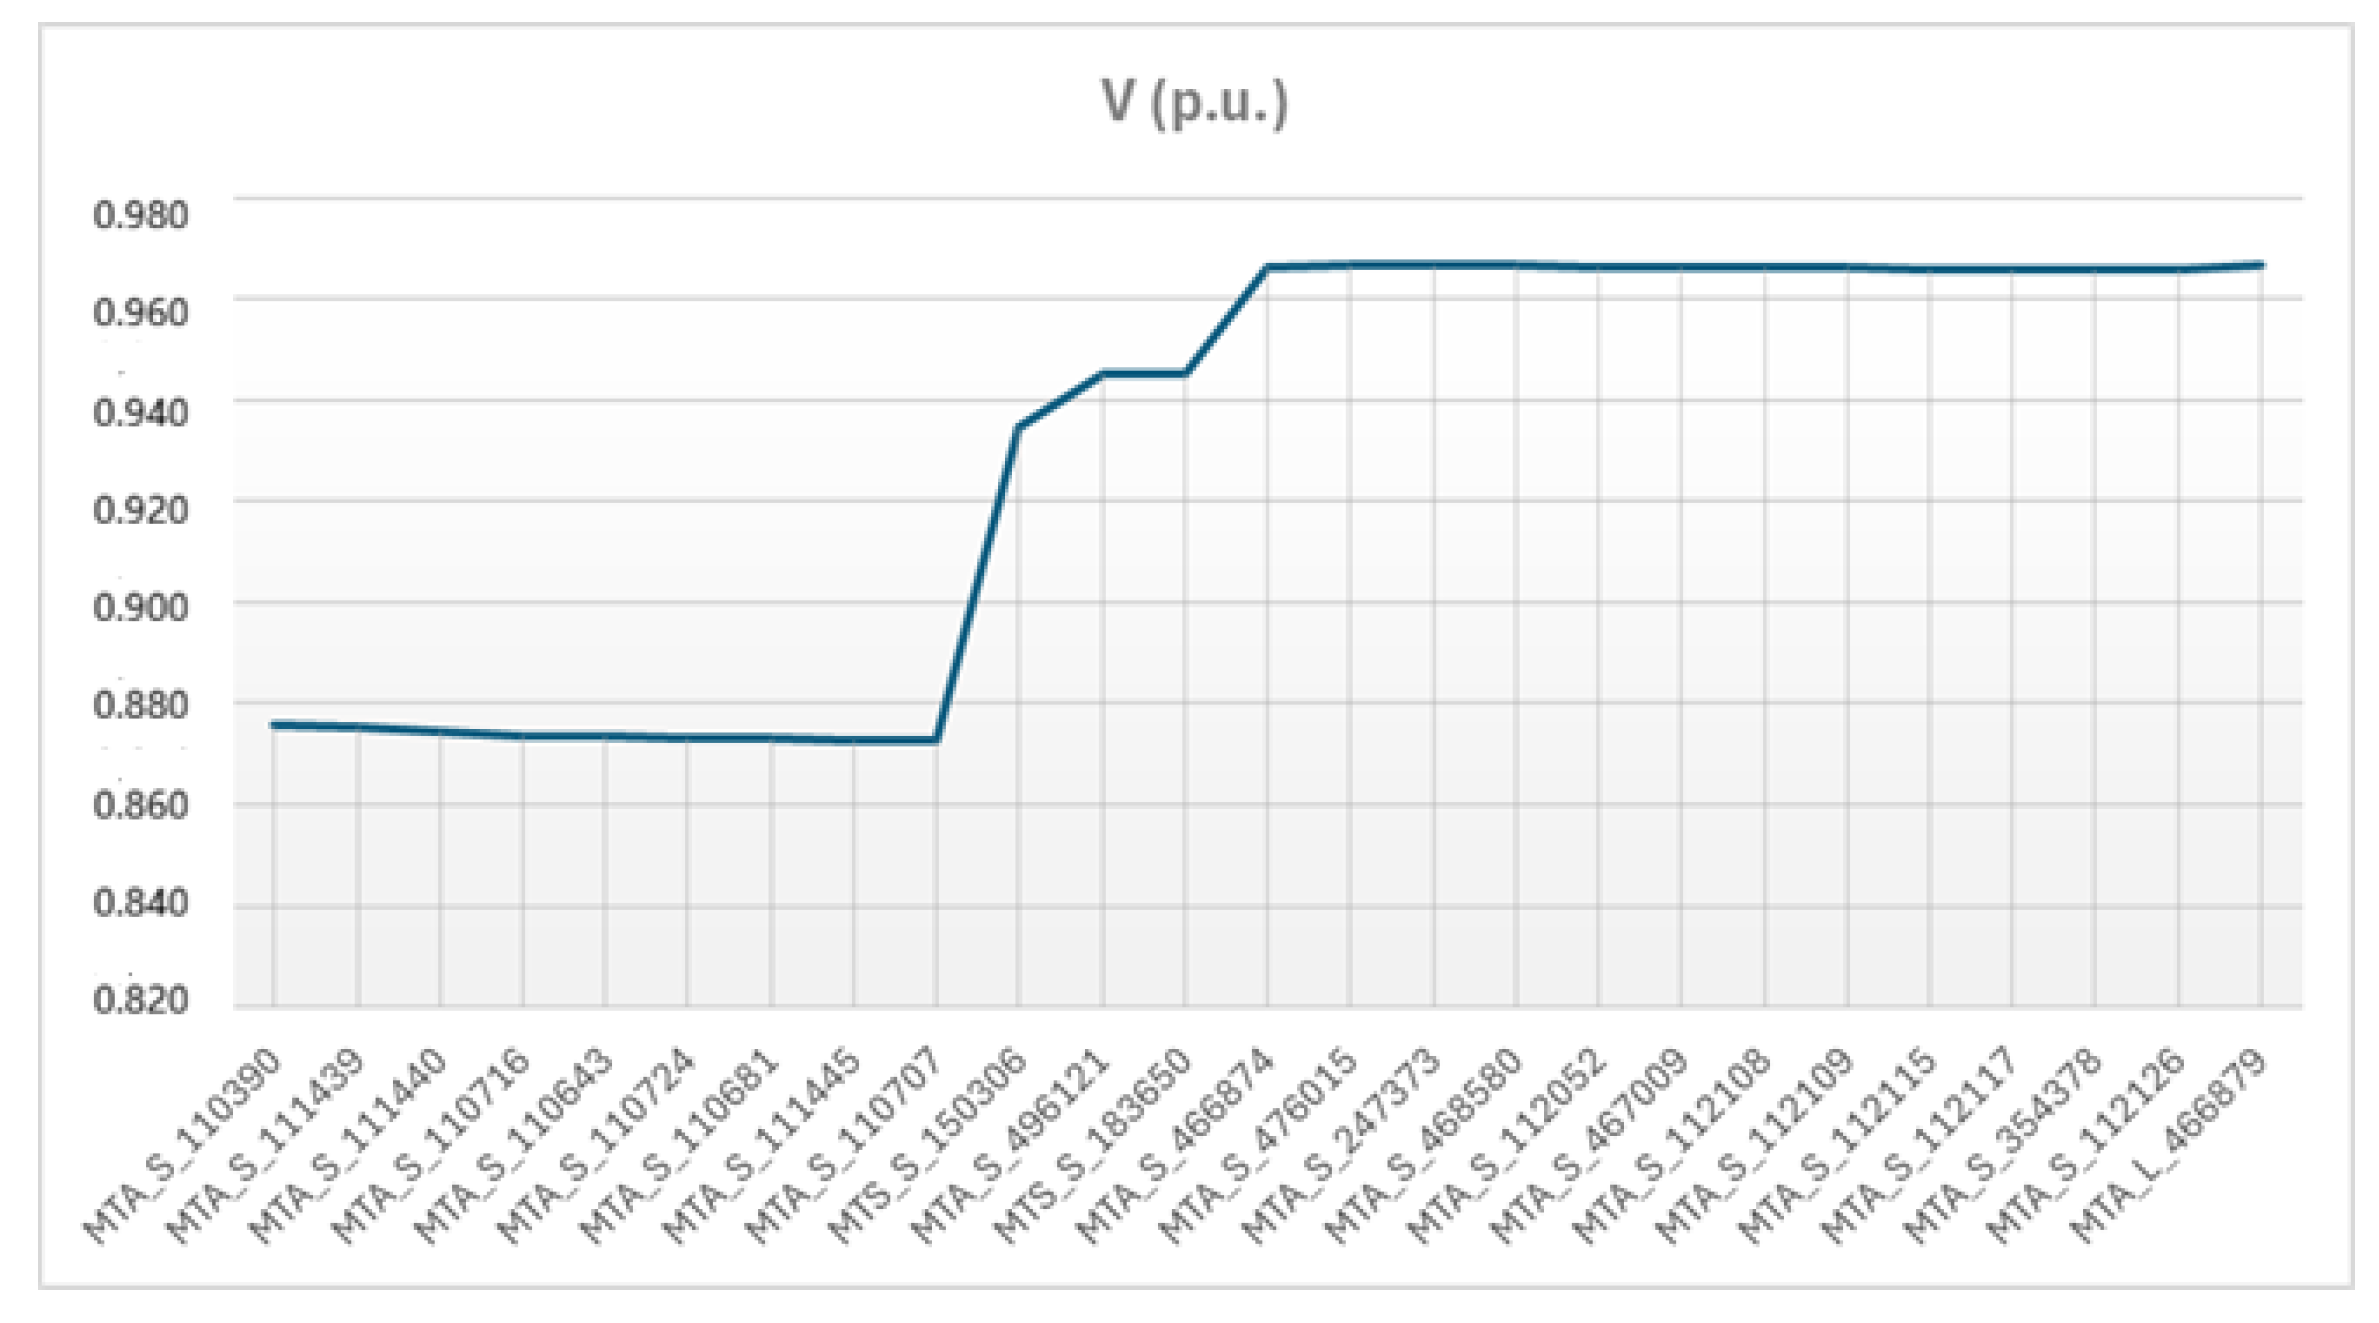
After characterizing the base operating condition, the variables selected as evaluation criteria were graphically examined in order to highlight the initial technical problem faced by the feeder. First, the per-unit voltage distribution along the analyzed nodes is presented in Figure 5. This representation is useful because it reveals the spatial degradation of the normalized voltage profile along the feeder.
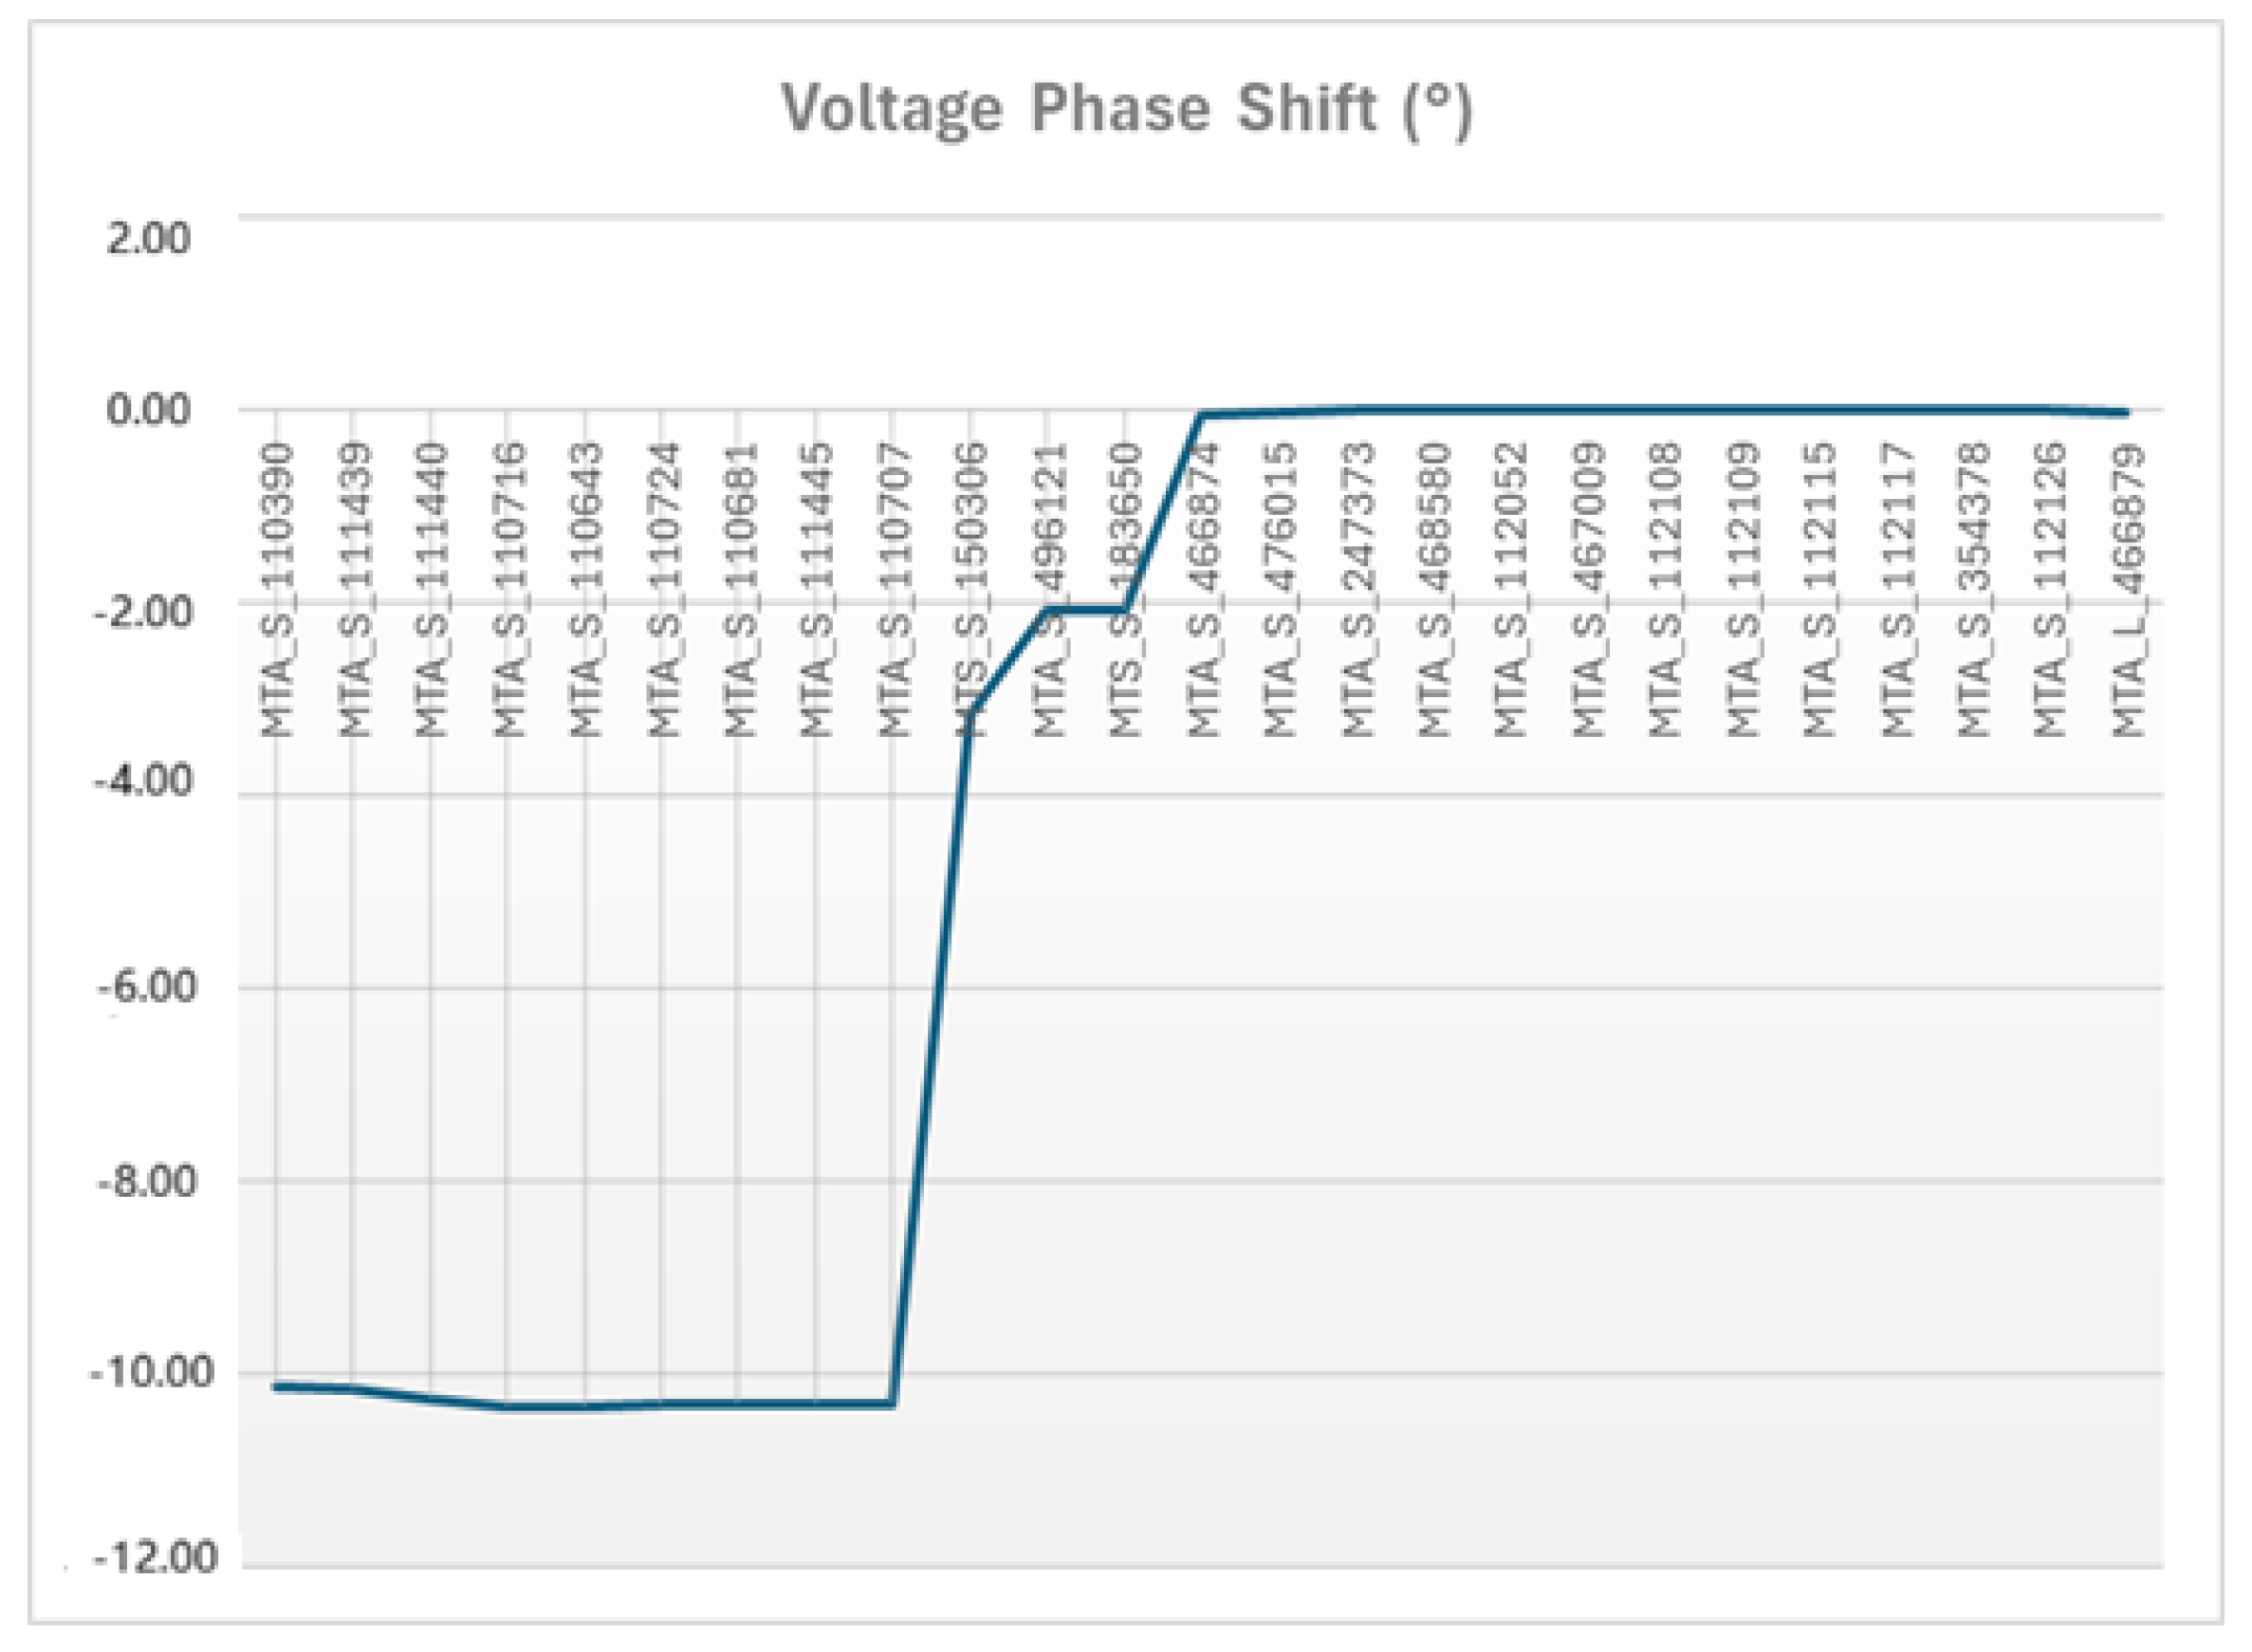
Second, the angular behavior of the nodal voltages is shown in Figure 6. This plot provides complementary information regarding the electrical behavior of the feeder and the variation in phase displacement along the main trunk.
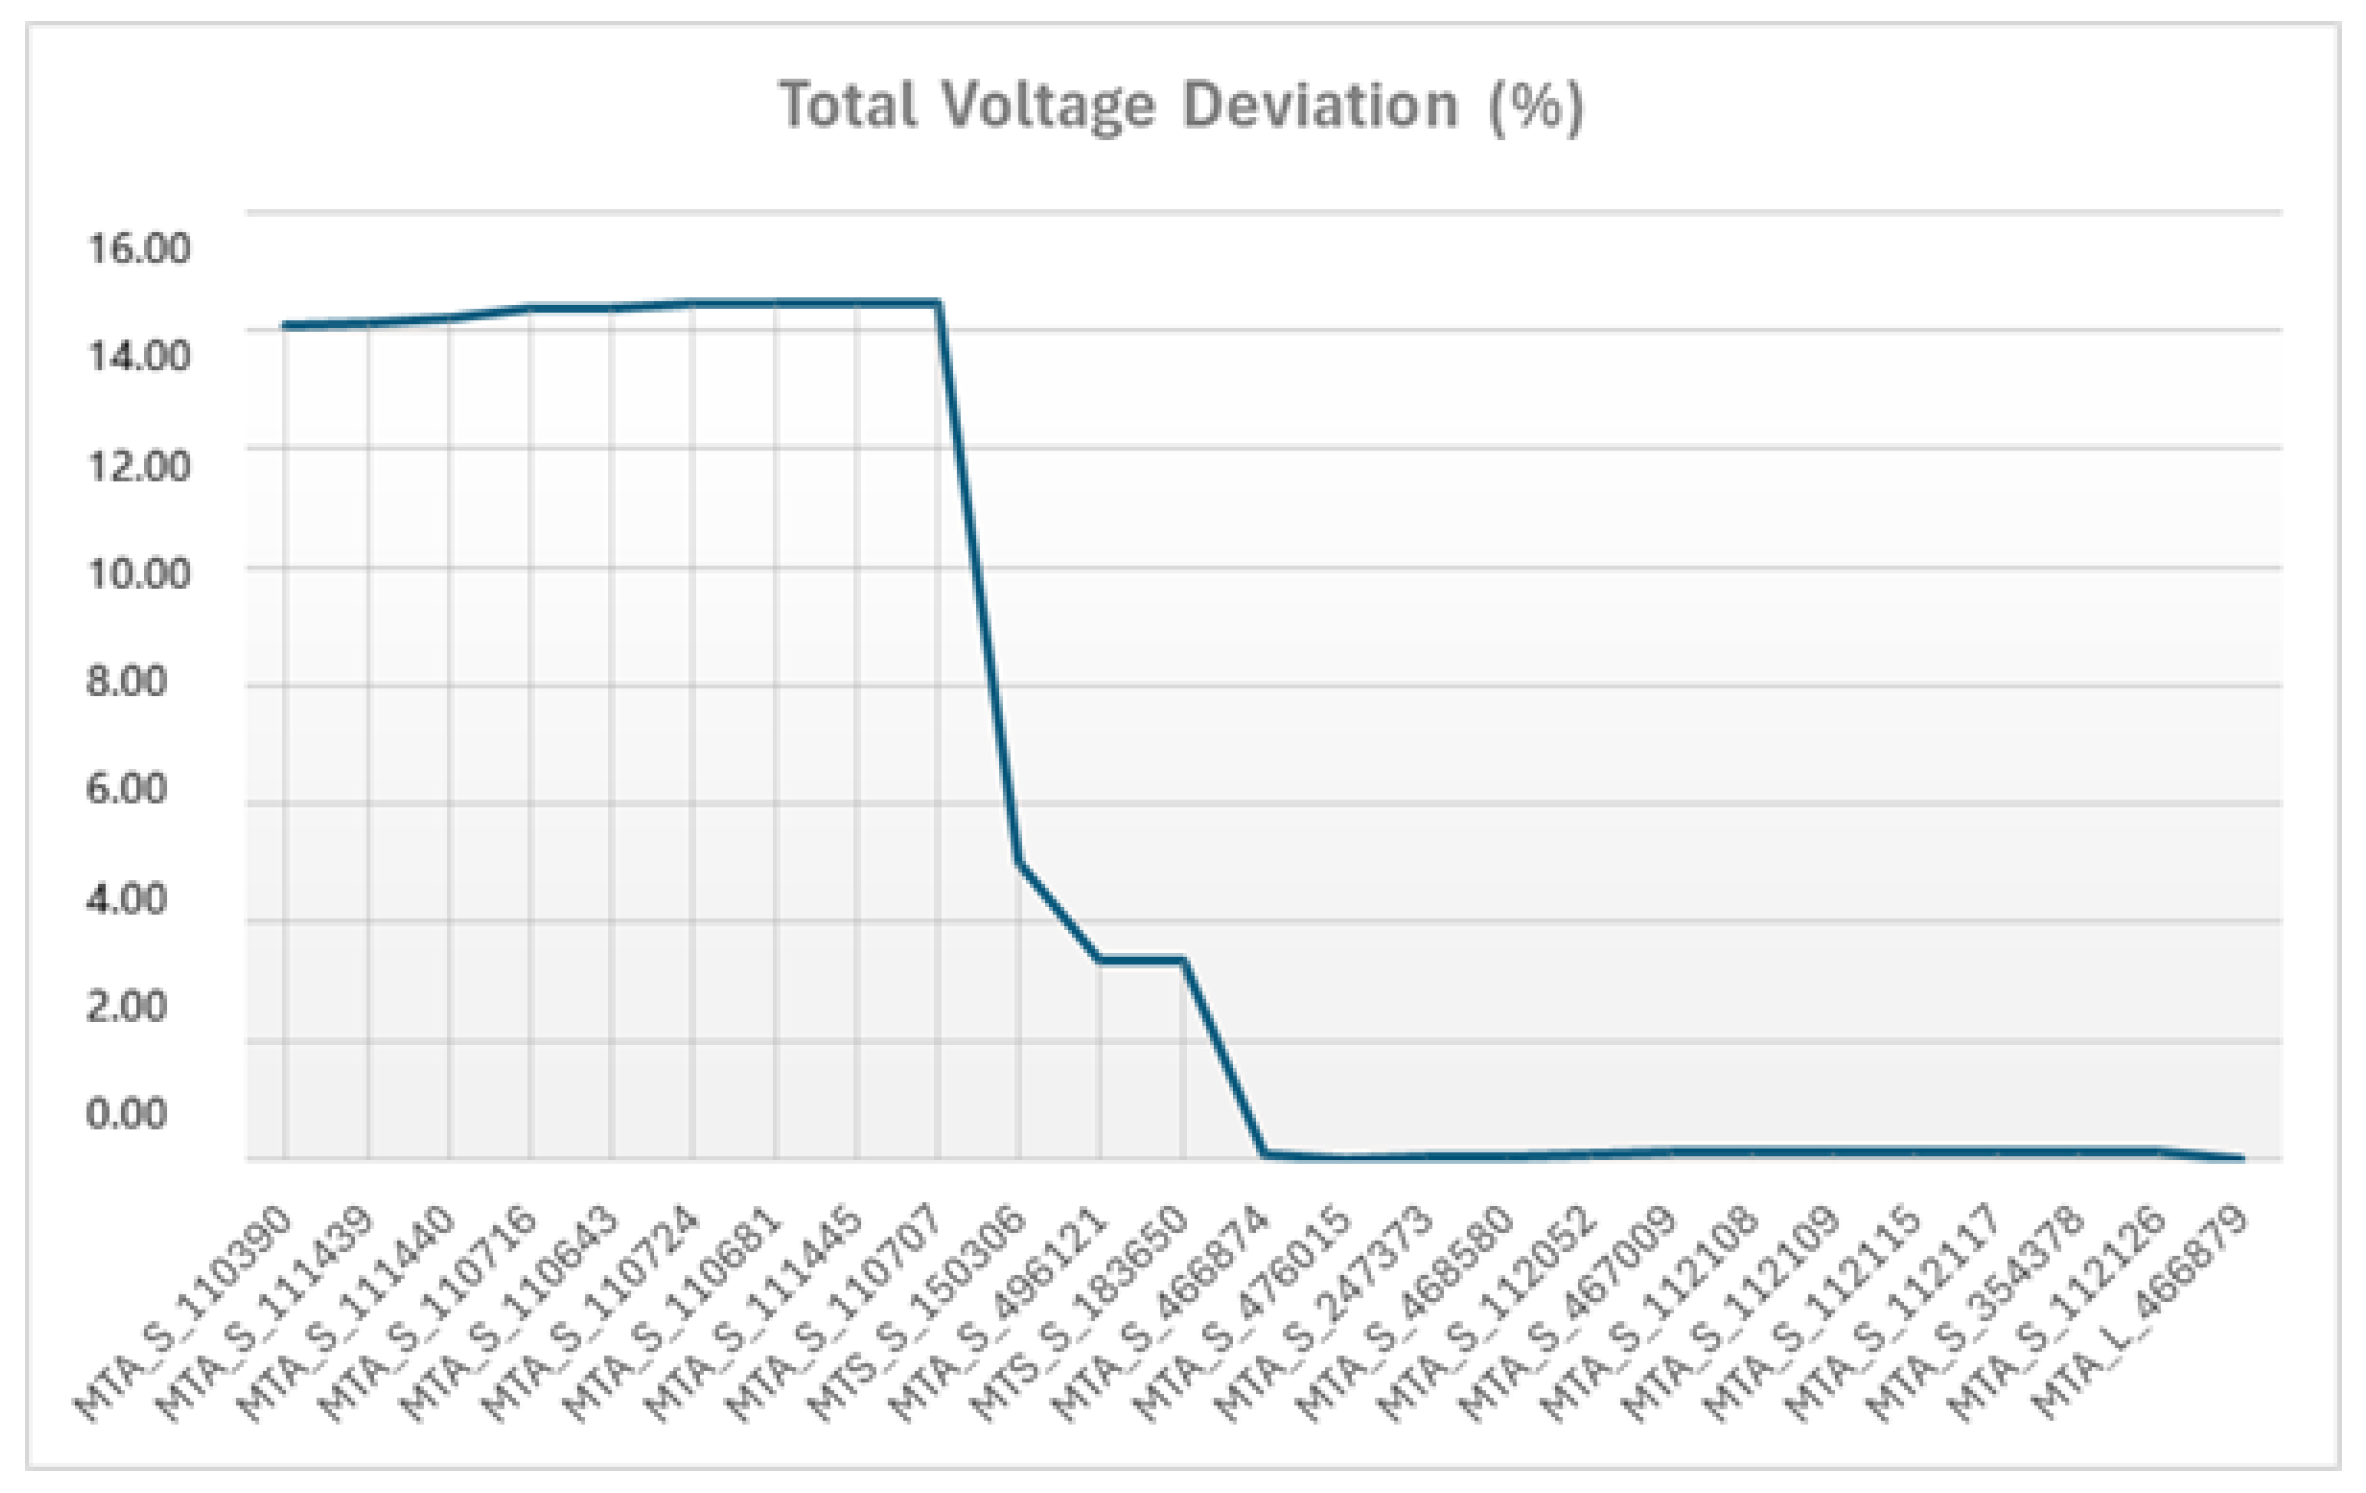
Third, the percentage voltage deviation associated with the base-case operating condition is presented in Figure 7. This figure highlights the magnitude of voltage deterioration that must be mitigated through the regulator-placement strategy.
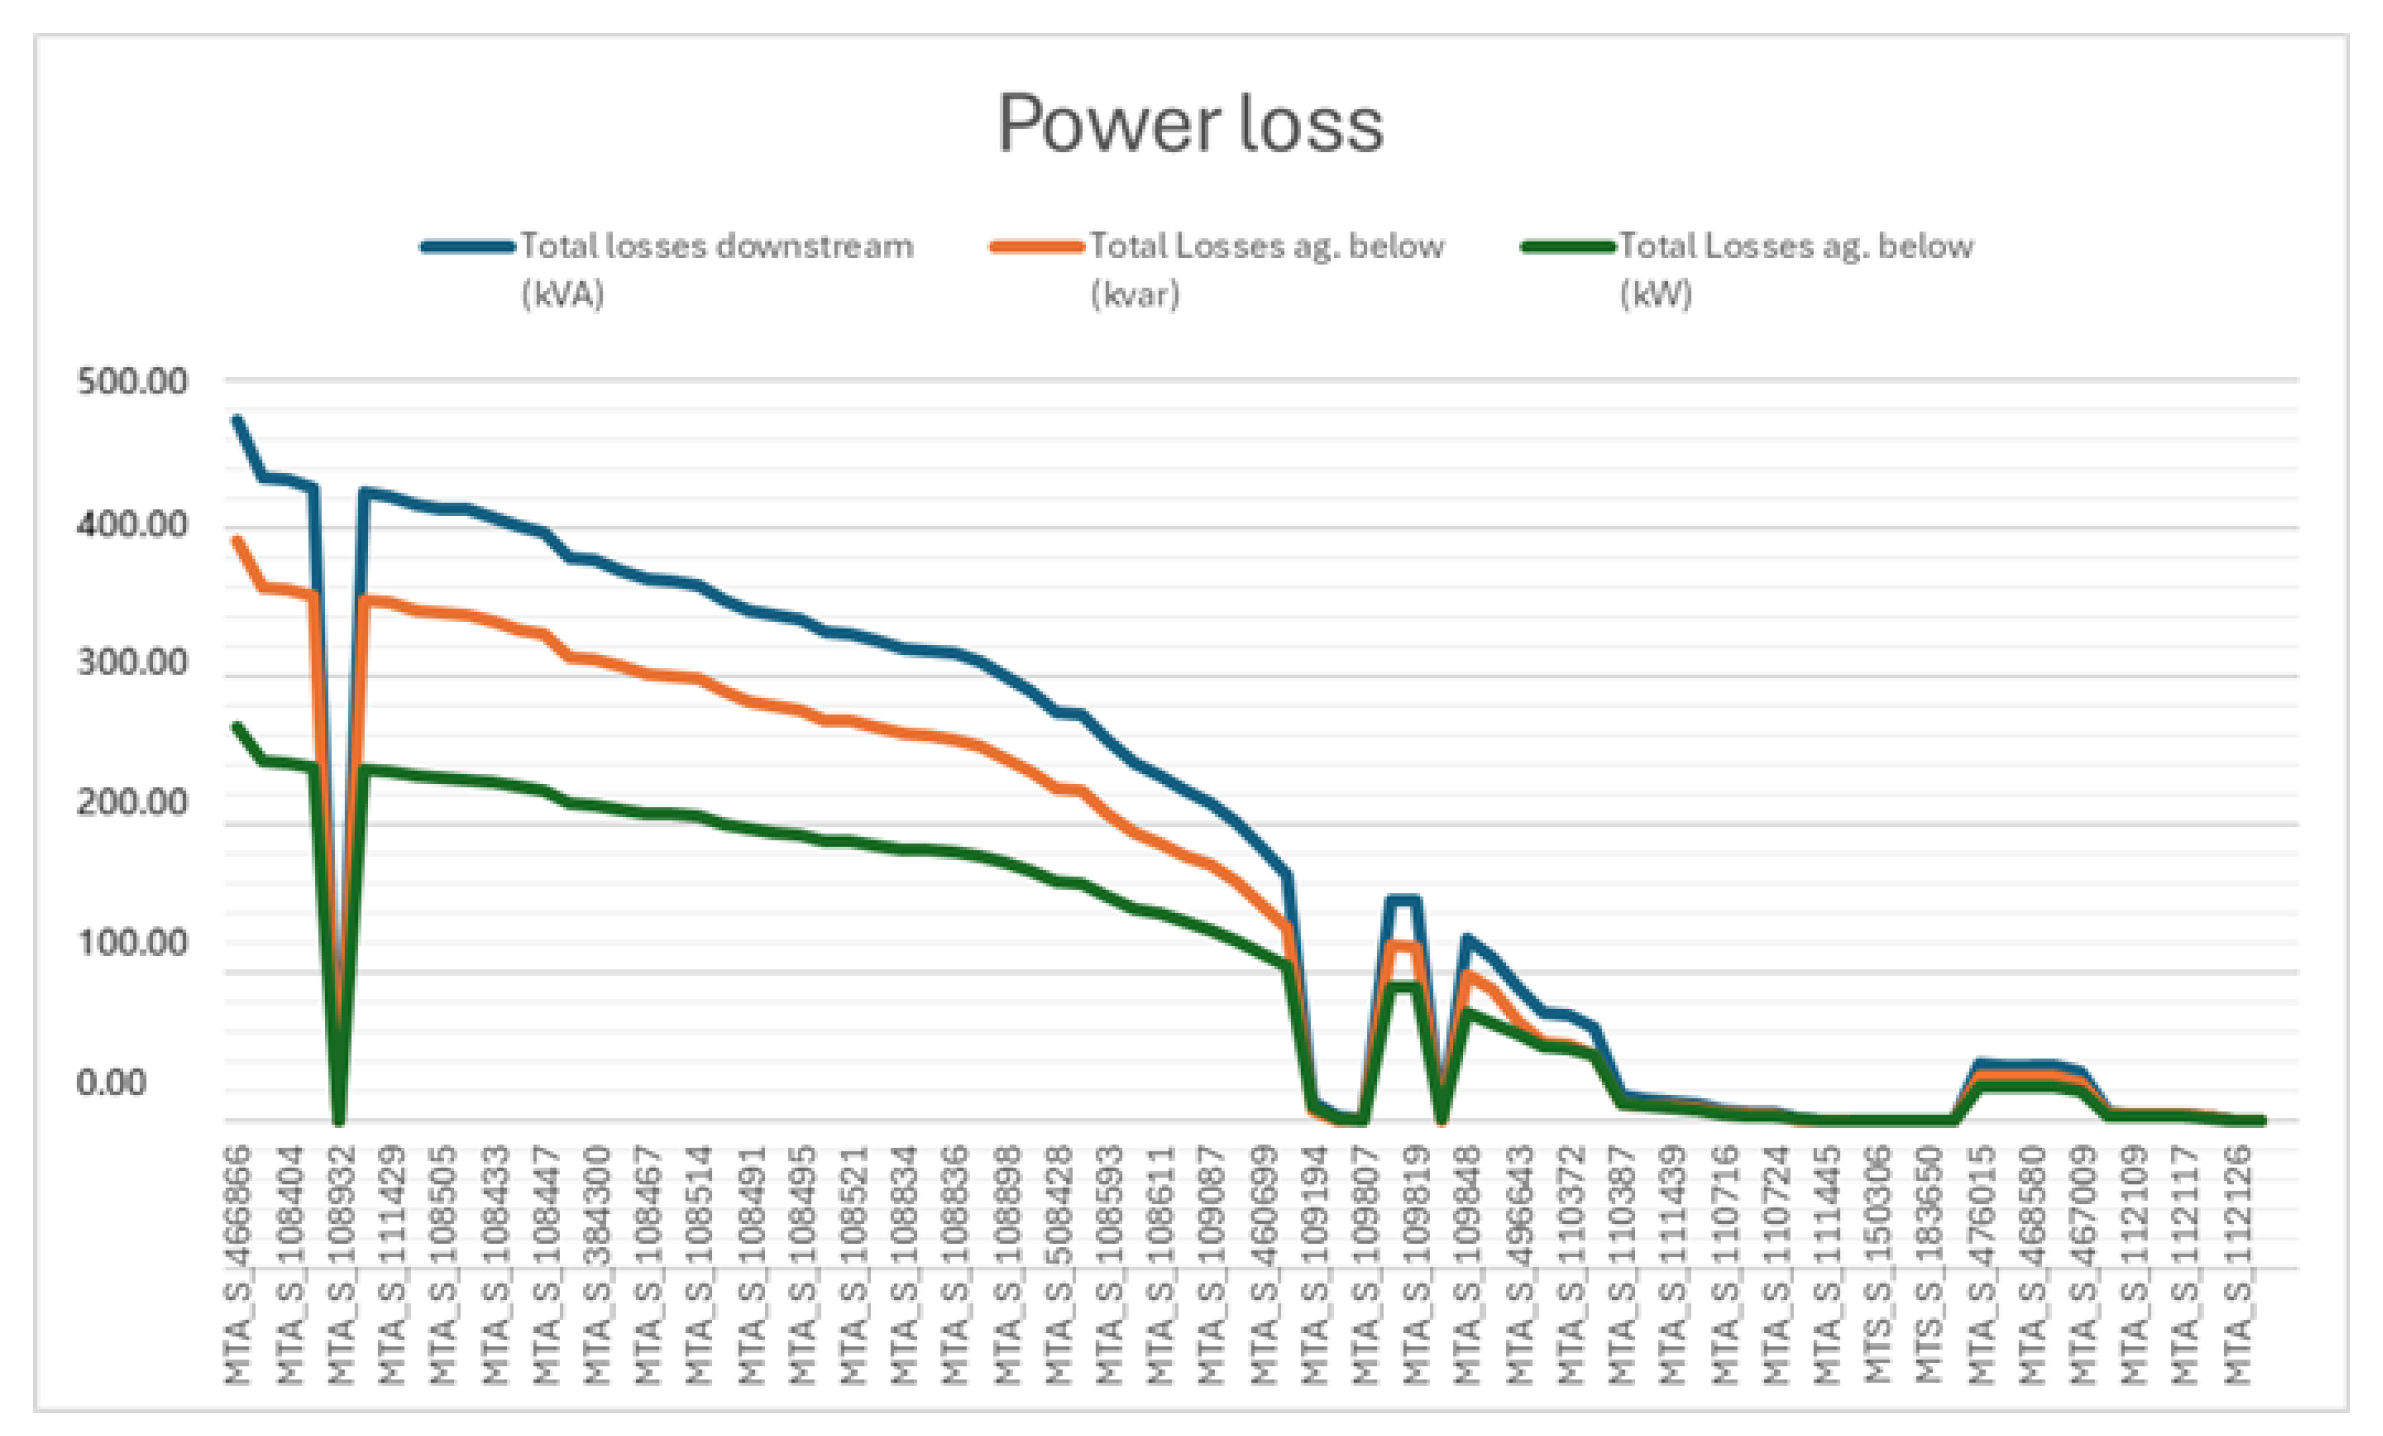
Fourth, the active, reactive, and apparent power losses corresponding to the base case are shown in Figure 8. These variables are directly related to feeder efficiency and therefore constitute essential indicators in the optimization stage.
Finally, the selected criteria, their physical meaning, units, expected operating ranges, and baseline weighting coefficients are summarized in Table 5. This table consolidates the technical indicators employed in the multi-criteria ranking stage and provides the reference interpretation framework used in the subsequent analysis.
From a practical utility-planning perspective, the selected regulator location should also be interpreted together with implementation-related constraints that are not explicitly optimized in the present technical model. These include installation cost, equipment availability, maintenance accessibility, protection coordination, right-of-way conditions, regulatory voltage limits, and the integration of the selected alternative into the utility’s medium-voltage planning process. Although the proposed framework focuses on electrical performance indicators, the resulting ranked alternatives provide a technical screening stage that can support subsequent techno-economic and regulatory evaluations before field implementation.

3. Results

After implementing the proposed exhaustive-search and multi-criteria decision framework, the algorithm was executed using a database obtained from CYME simulations. These simulations were carried out under two representative operating scenarios, namely, maximum load (100%) and minimum load (10%). For each feasible regulator-location alternative, the selected technical criteria were computed and stored for subsequent ranking using the WSM and TOPSIS. This section presents the main results obtained for each operating condition, beginning with the maximum-load scenario.

3.1. Maximum-Load Scenario

The first assessment was conducted under the maximum-load condition, which represents the most critical operating state of the feeder from the standpoint of voltage deterioration and technical losses. For this scenario, the simulation outputs associated with all feasible regulator-placement alternatives were stored in a database and used as input to the ranking algorithm. A representative excerpt of these data is presented in Table 6, where the variables corresponding to several candidate nodes are shown. In total, 6241 data records were processed by the developed script for this scenario.
Once the database had been processed, the five best alternatives according to the Weighted Sum Method were identified. The corresponding ranking is summarized in Table 7. These results show that node 5 achieved the best overall WSM score for the maximum-load scenario. In practical terms, this indicates that the regulator placement associated with this node provides the most favorable combined performance when all weighted technical criteria are considered simultaneously.
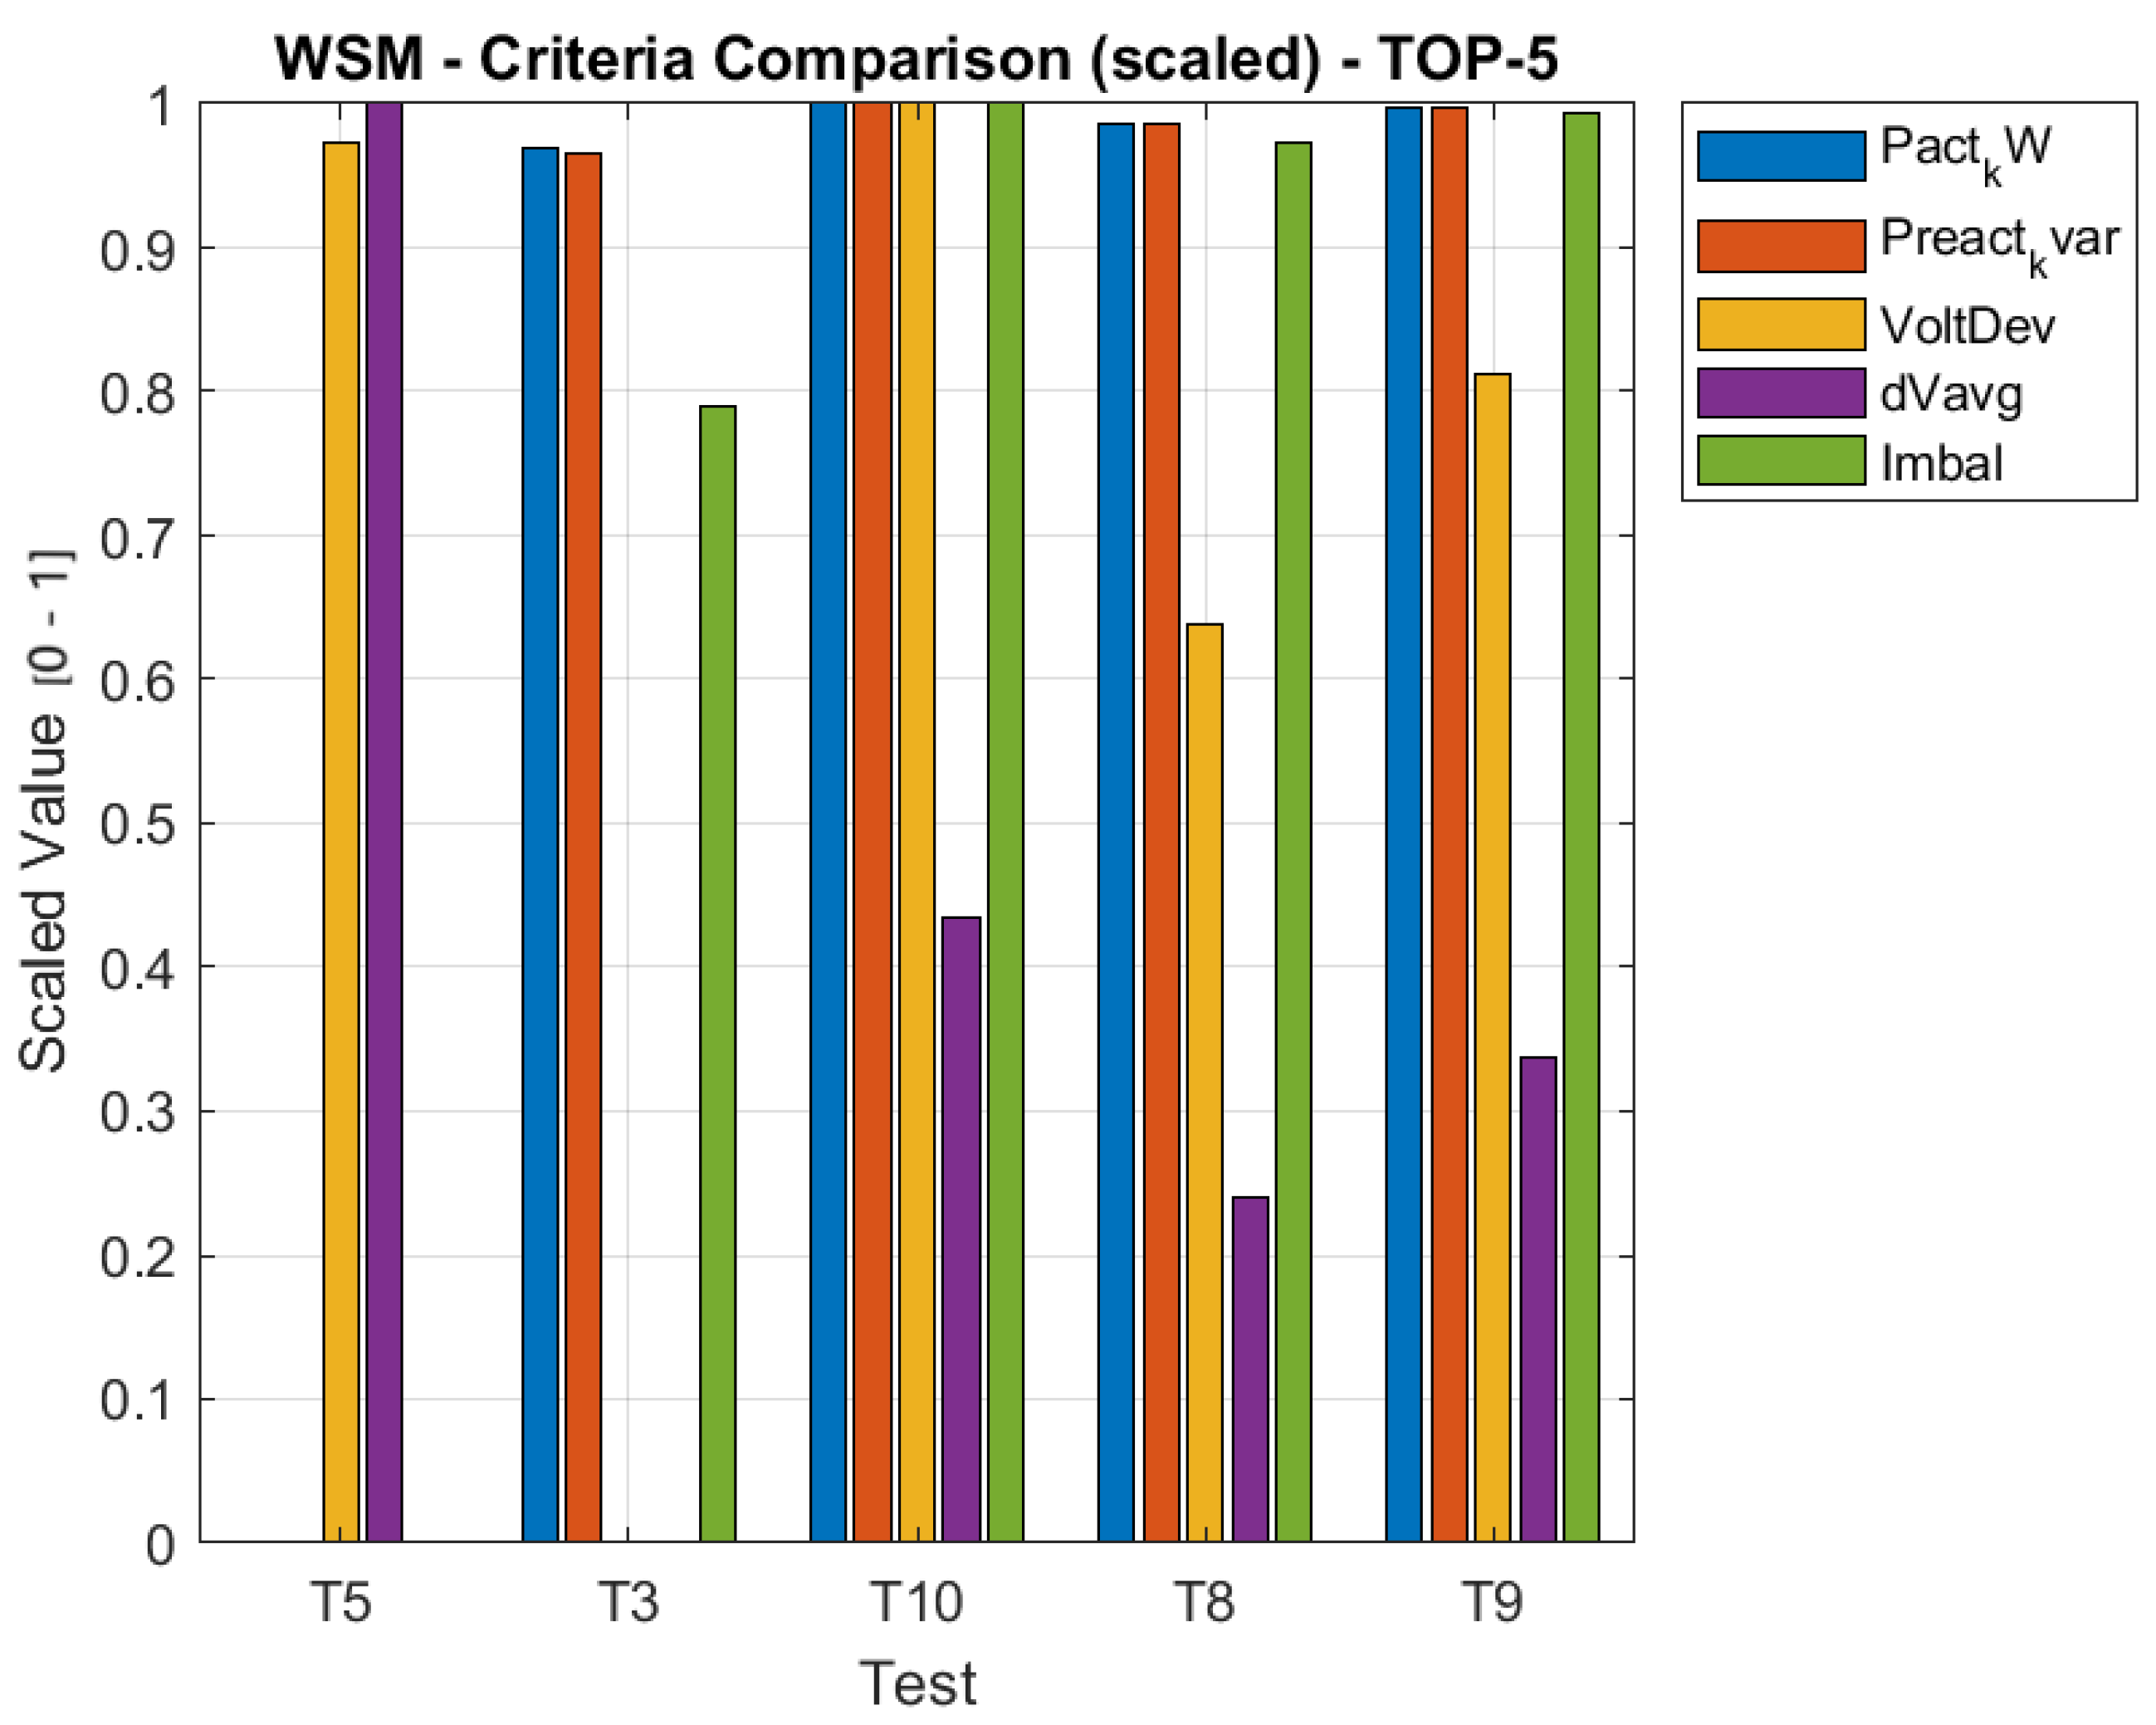
To better visualize the relative performance of the five best WSM alternatives, Figure 9 presents a bar chart comparing the normalized criteria. This figure shows that, when the regulator is placed at node 5, the criteria associated with active power losses, reactive power losses, and voltage-unbalance percentage tend toward the lowest values among the top-ranked alternatives, which explains its leading position in the WSM ranking.
A complementary view of the same ranking is provided by the heatmap shown in Figure 10. This representation allows a more direct visual identification of the relative magnitude of each normalized criterion across the best-performing alternatives. In particular, it can be observed that alternatives associated with nodes 3 to 9 exhibit comparatively larger normalized values for active and reactive power losses, whereas node 5 consistently exhibits the most favorable overall criterion distribution.
After the ranking stage, the best overall alternative identified by the WSM for the maximum-load scenario was examined in detail in order to summarize its main technical indicators. Table 8 reports the performance metrics associated with the winning configuration. The results confirm that the preferred solution corresponds to test 5, i.e., the regulator placement at node 5 (MTS 108932). This alternative yielded the lowest overall weighted score under the adopted WSM formulation and simultaneously achieved favorable values in the principal decision criteria, including active losses, reactive losses, global voltage deviation, average voltage variation, and voltage unbalance. Particularly relevant is the fact that no nodes remained outside the admissible operating range, which further supports the technical suitability of this location under the most critical loading condition of the feeder.
Once the winning WSM alternative had been identified, the resulting nodal behavior of the evaluated criteria was analyzed in greater detail. Figure 11 presents the criterion profiles along the feeder nodes for the selected solution. The figure shows that the voltage regulator improves the feeder response throughout the analyzed nodes, reducing the severity of the critical variables and contributing to a better technical operating condition under peak demand.
In parallel with the WSM analysis, the TOPSIS method was applied to the same maximum-load dataset in order to evaluate the consistency of the final decision under an alternative multi-criteria ranking perspective. The five best TOPSIS-ranked alternatives are listed in Table 9. These results show that the best candidate locations according to TOPSIS are nodes 5, 10, 9, 7, and 8, respectively. Most importantly, the best-ranked alternative is again node 5, which indicates agreement between both decision methods regarding the optimal regulator location.
The comparative bar plot shown in Figure 12 provides a visual interpretation of the TOPSIS ranking. As in the WSM case, the variables associated with active losses, reactive losses, and voltage-unbalance percentage exhibit their most favorable values when the regulator is assigned to node 5. This result reinforces the robustness of the selected solution under the maximum-load operating condition.
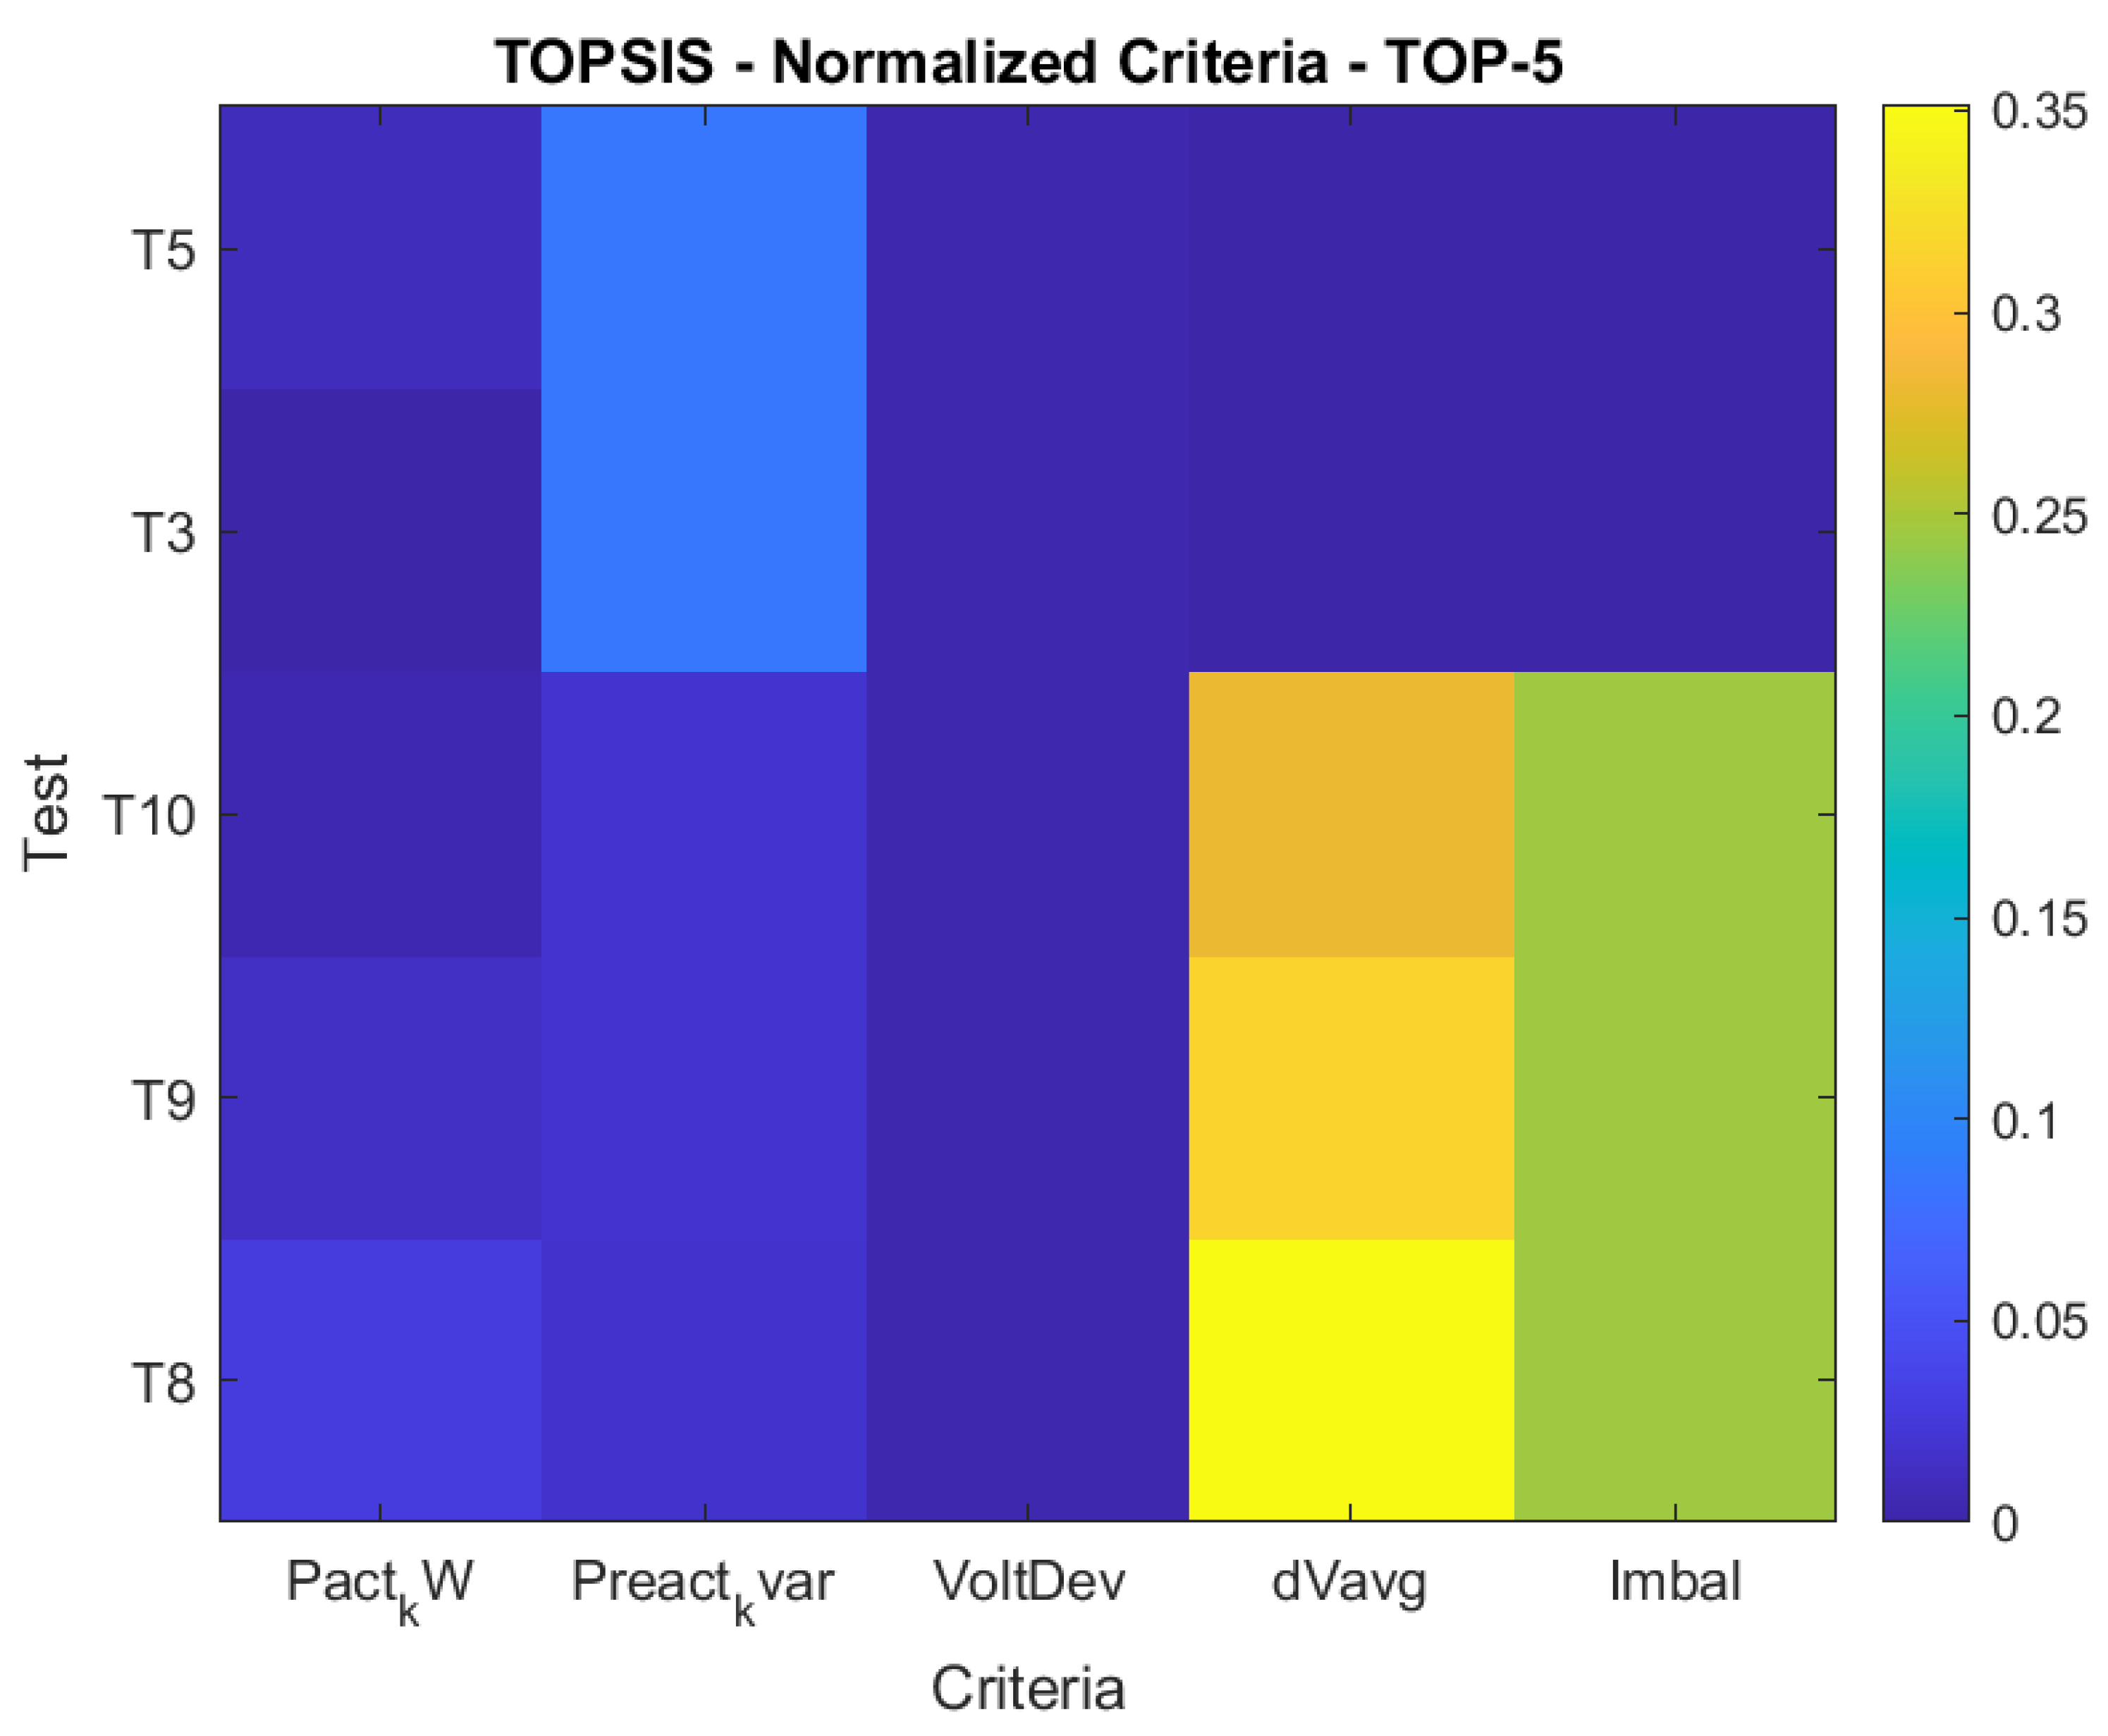
The corresponding TOPSIS heatmap is presented in Figure 13. This figure shows that the alternative associated with node 5 minimizes most of the evaluated criteria, while the voltage-deviation criterion remains consistently low for all top-ranked scenarios. Consequently, the heatmap confirms that node 5 achieves the most balanced overall behavior in the TOPSIS decision space.
The final TOPSIS solution for the maximum-load scenario was examined in detail in order to verify the consistency of the multi-criteria decision process. Table 10 summarizes the main technical indicators associated with the winning alternative identified by TOPSIS. The results confirm that the preferred solution again corresponds to test 5, i.e., regulator placement at node 5 (MTS 108932). This result is particularly significant because it reproduces the same winning alternative previously obtained with the WSM under the most critical loading condition. Therefore, the convergence of both ranking methods toward the same node should be interpreted as strong evidence that the selected location is not dependent on a single aggregation scheme, but instead represents a technically dominant and methodologically robust solution within the feasible decision space. In addition, the reported indicators show favorable values for all major decision criteria, including active losses, reactive losses, total voltage deviation, average voltage variation, and voltage unbalance, while also maintaining zero nodes outside the admissible operating range.
Because the WSM and TOPSIS selected the same winning alternative under the maximum-load scenario, namely node 5 (MTS 108932), the TOPSIS result confirms the nodal behavior previously observed for the WSM-based winning solution. The numerical indicators in Table 10 show that this alternative achieves reduced active and reactive losses, limited voltage deviation, low voltage unbalance, and no nodes outside the admissible operating range.

3.2. Minimum-Load Scenario

The second operating condition considered in this study corresponds to the minimum-load scenario, defined as 10% of the installed demand. Although this condition is electrically less severe than the maximum-load case in terms of current magnitude and total losses, it remains relevant for regulator-placement analysis because the relative ranking of alternatives may change when the feeder operates far from peak demand. Therefore, the same exhaustive-search and multi-criteria evaluation procedure was applied in order to assess the consistency of the optimal regulator location under light-load conditions.
As in the previous case, the values of the selected variables were computed and stored in an Excel-based dataset for all feasible placement alternatives. A representative excerpt of these data is summarized in Table 11. For this scenario, the developed script also processed a total of 6241 data records, thereby ensuring a complete evaluation of the feasible search space under minimum-load operation.
After processing the simulation database, the five best alternatives according to the Weighted Sum Method were identified. The resulting ranking is presented in Table 12. Under minimum-load conditions, the best-ranked WSM alternative corresponds to node 3, followed by nodes 5, 10, 9, and 8. This result is technically important because it indicates that, unlike the maximum-load scenario, the WSM ranking under light-load operation favors node 3 as the best compromise among the selected criteria.
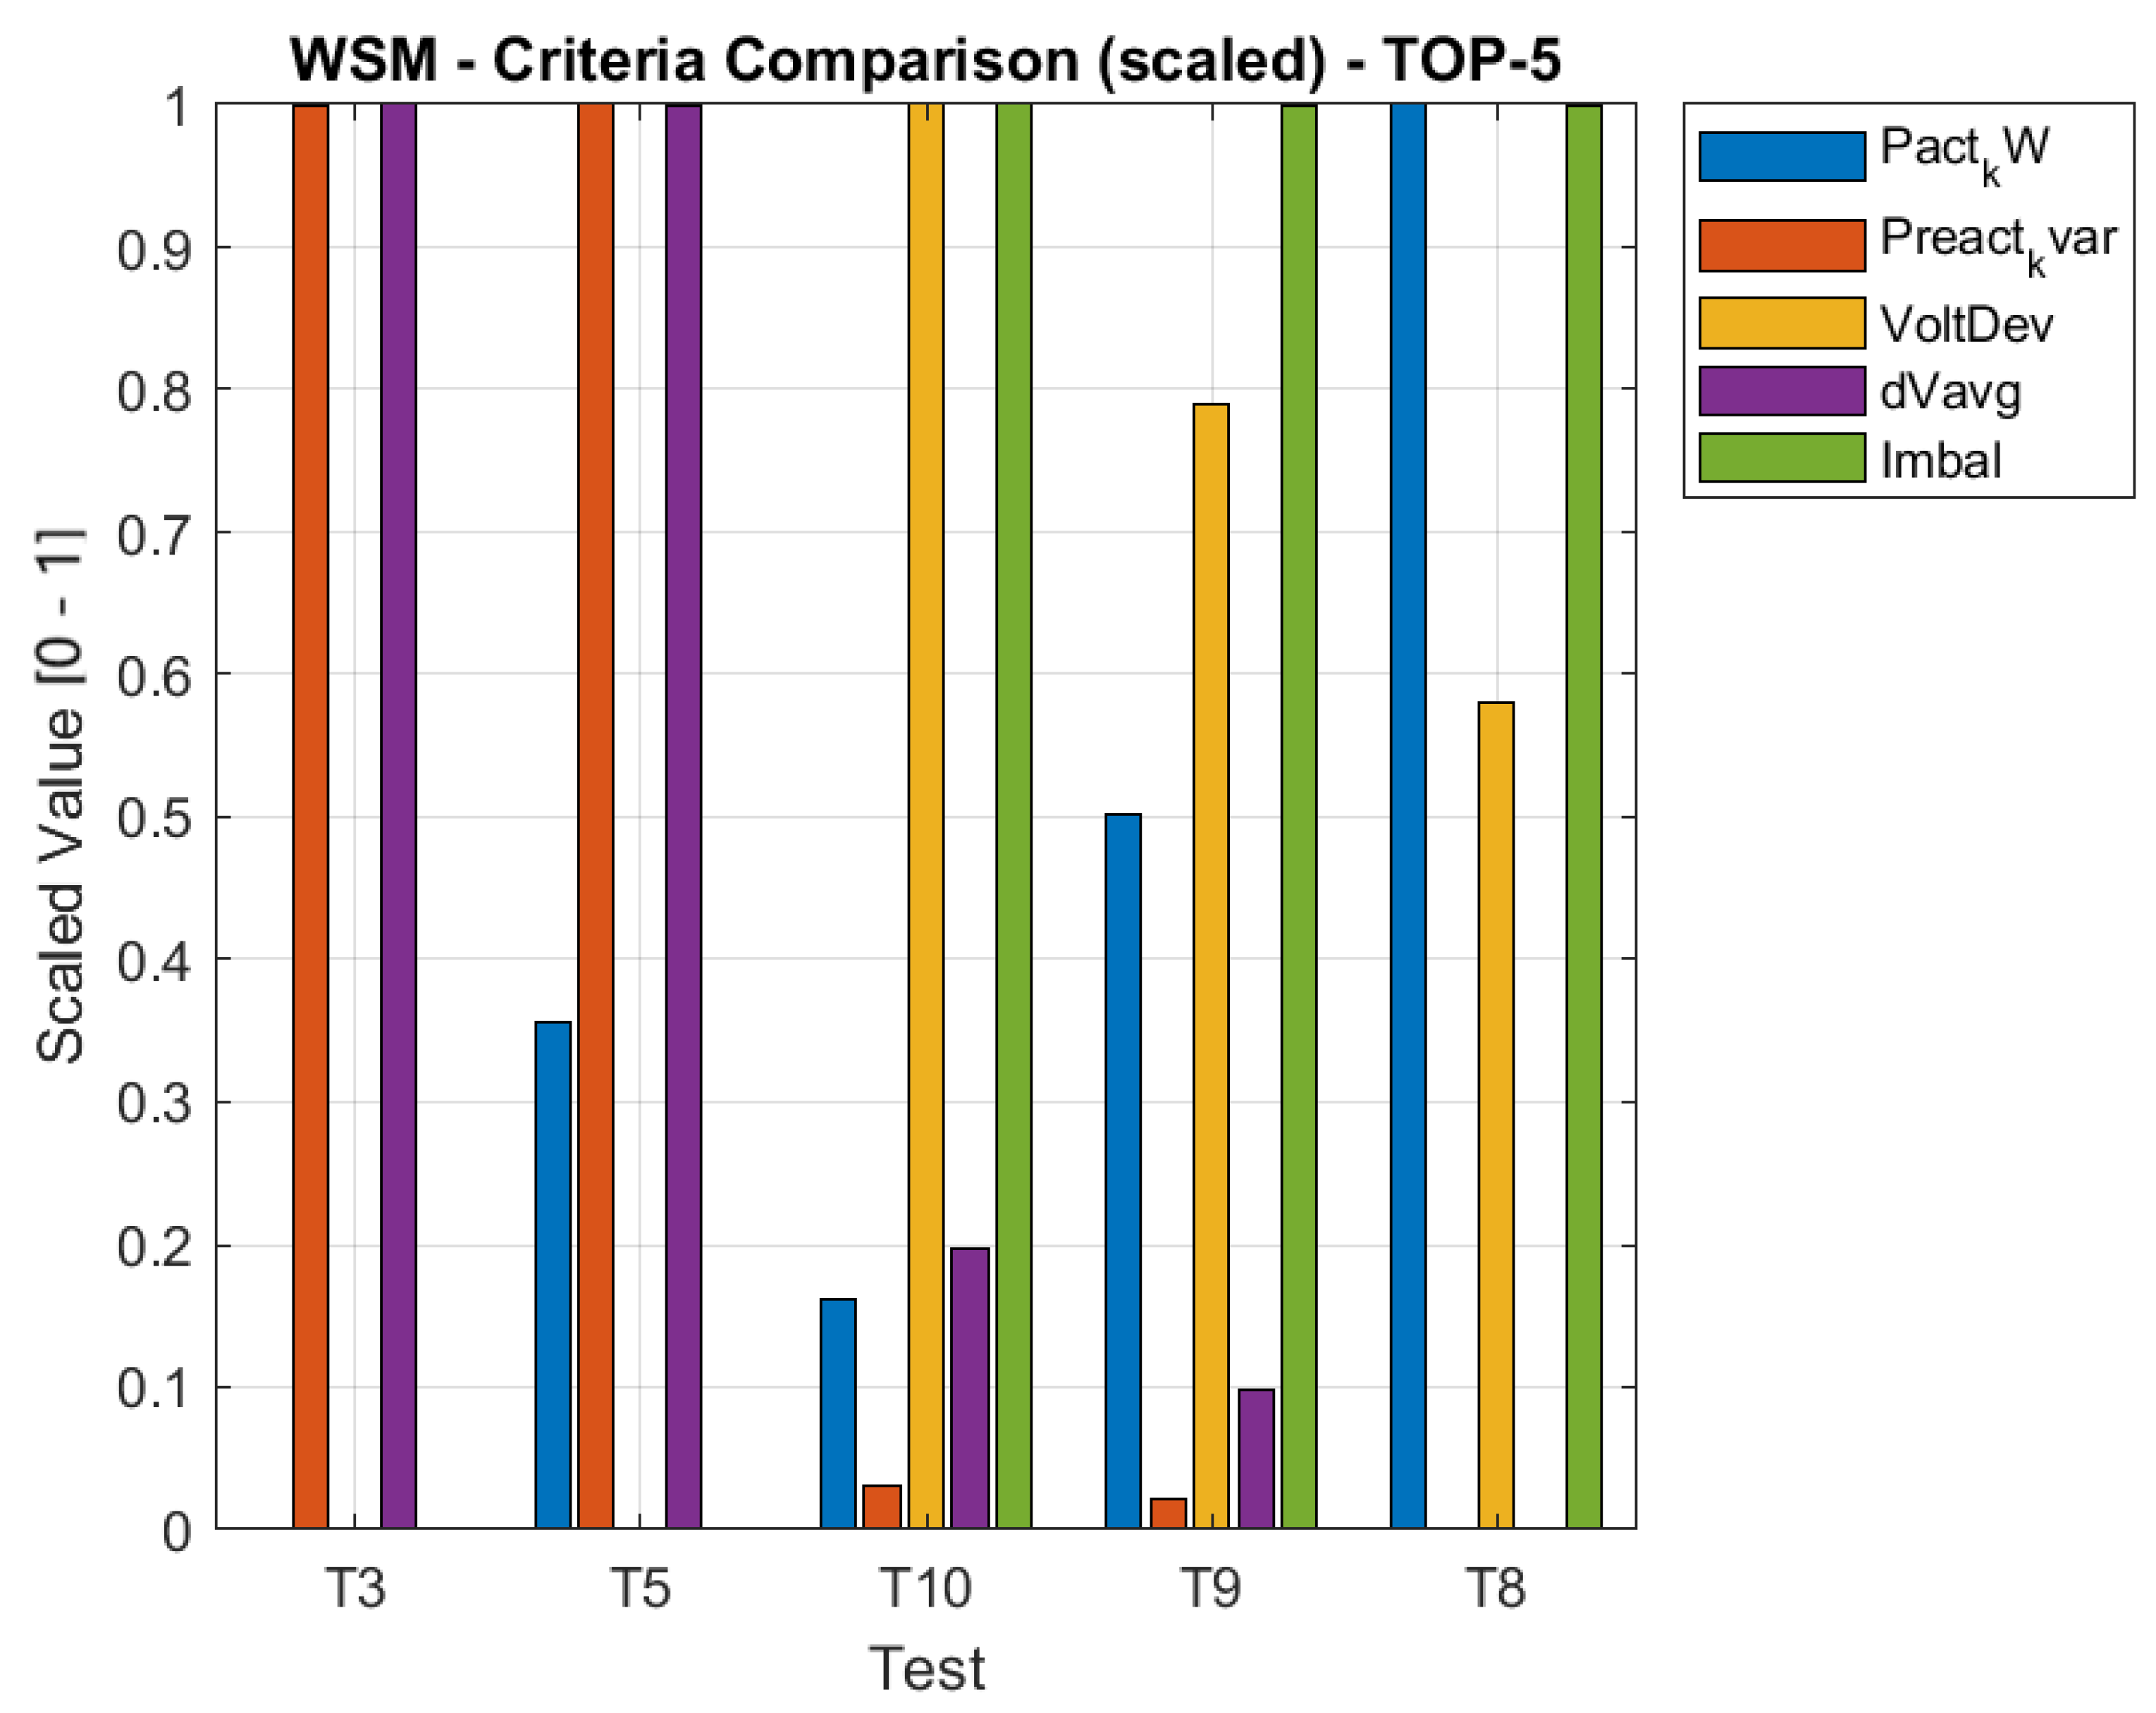
To facilitate the comparison among the best WSM alternatives, Figure 14 presents the corresponding bar chart of normalized criteria. This figure shows that the alternatives associated with the smallest values of voltage deviation, active losses, and reactive losses exhibit the best overall WSM behavior. In particular, although several alternatives remain close to one another, the graphical comparison confirms that the regulator placement associated with node 3 provides the most favorable aggregate performance according to the WSM metric.
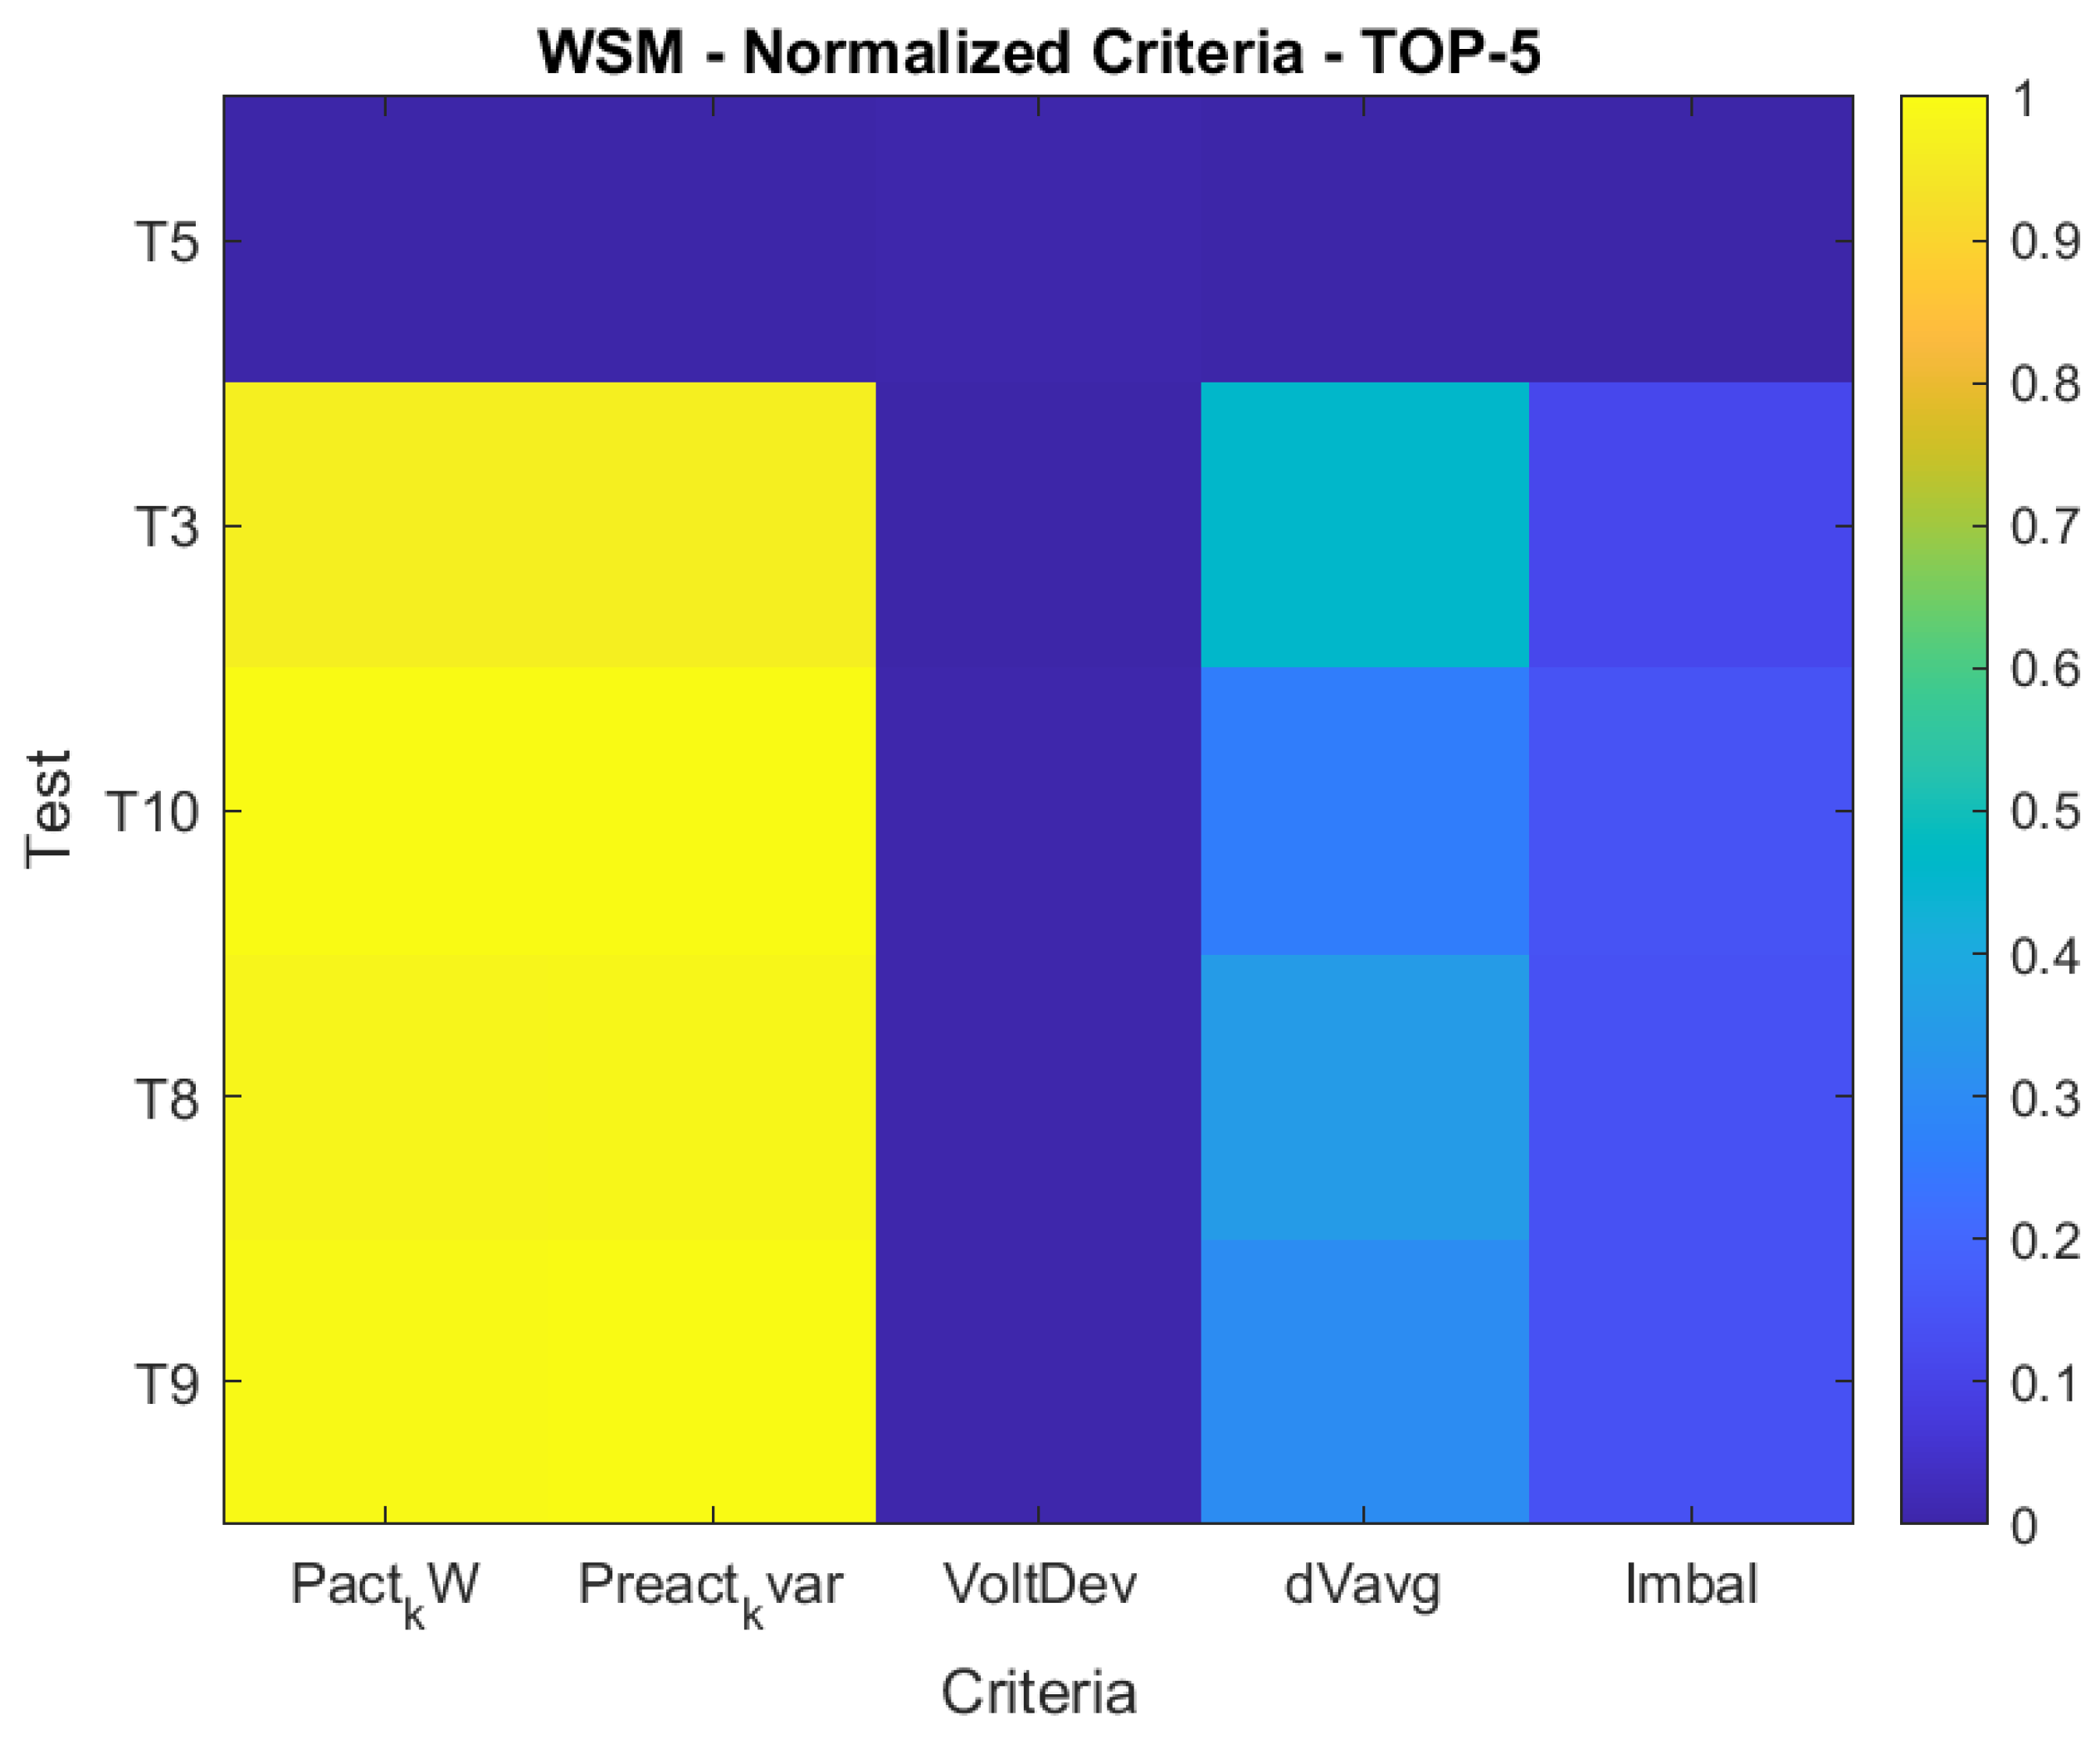
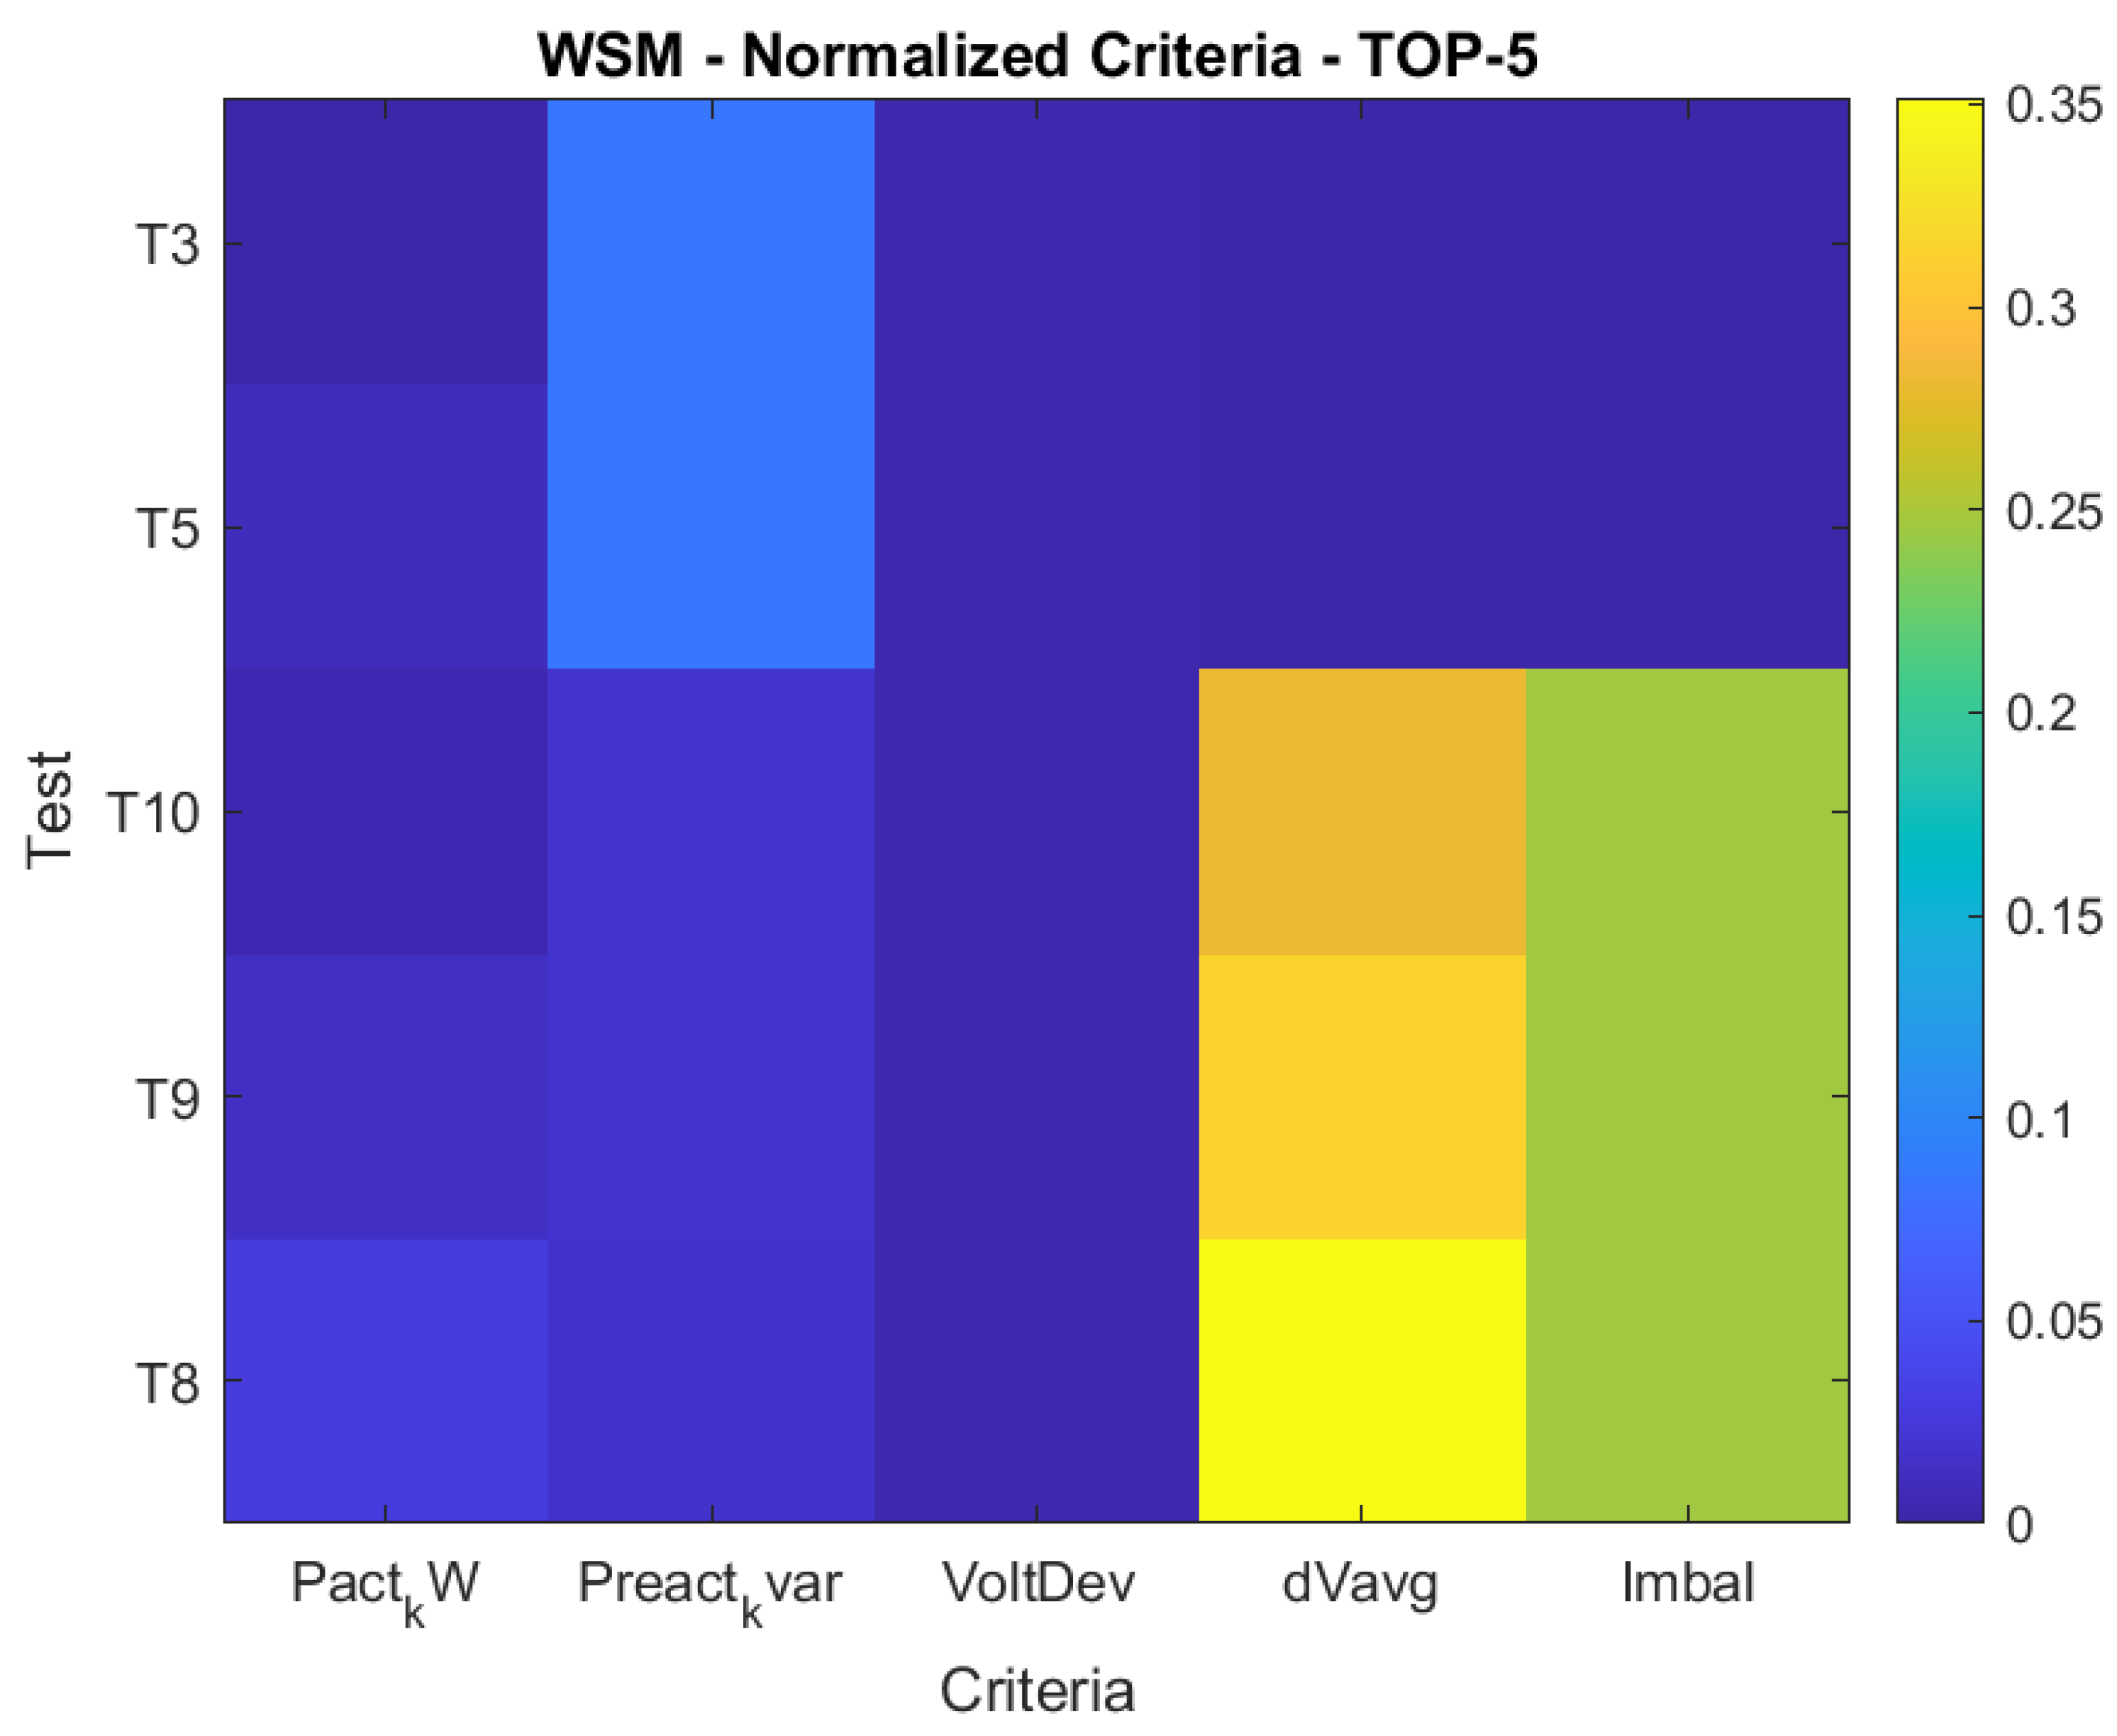
A complementary criterion-level interpretation is provided in the heatmap shown in Figure 15. This figure shows that, for most of the top-ranked alternatives, the normalized values associated with active losses, reactive losses, and voltage deviation remain below 0.1, which confirms that the best candidate locations under minimum load exhibit relatively similar and favorable technical behavior. Nevertheless, the WSM aggregation still selects node 3 as the best overall alternative.
Once the WSM ranking for the minimum-load scenario had been completed, the winning alternative was examined in detail in order to identify the specific technical indicators associated with the selected solution. Table 13 summarizes the main performance metrics of the best-ranked configuration. According to the WSM formulation, the preferred alternative under minimum load corresponds to test 3, i.e., regulator placement at node 3 (MTS 108404). This result differs from the one obtained under maximum-load conditions and therefore provides relevant evidence that the ranking is influenced by the feeder operating state when a weighted-sum aggregation is employed. Nevertheless, the selected solution remains technically sound, since it exhibits low active and reactive losses, a reduced global voltage deviation, a limited voltage-unbalance level, and zero nodes outside the admissible operating range. Consequently, this table formalizes the best WSM solution for the light-load regime and supports the subsequent analysis of its nodal behavior.
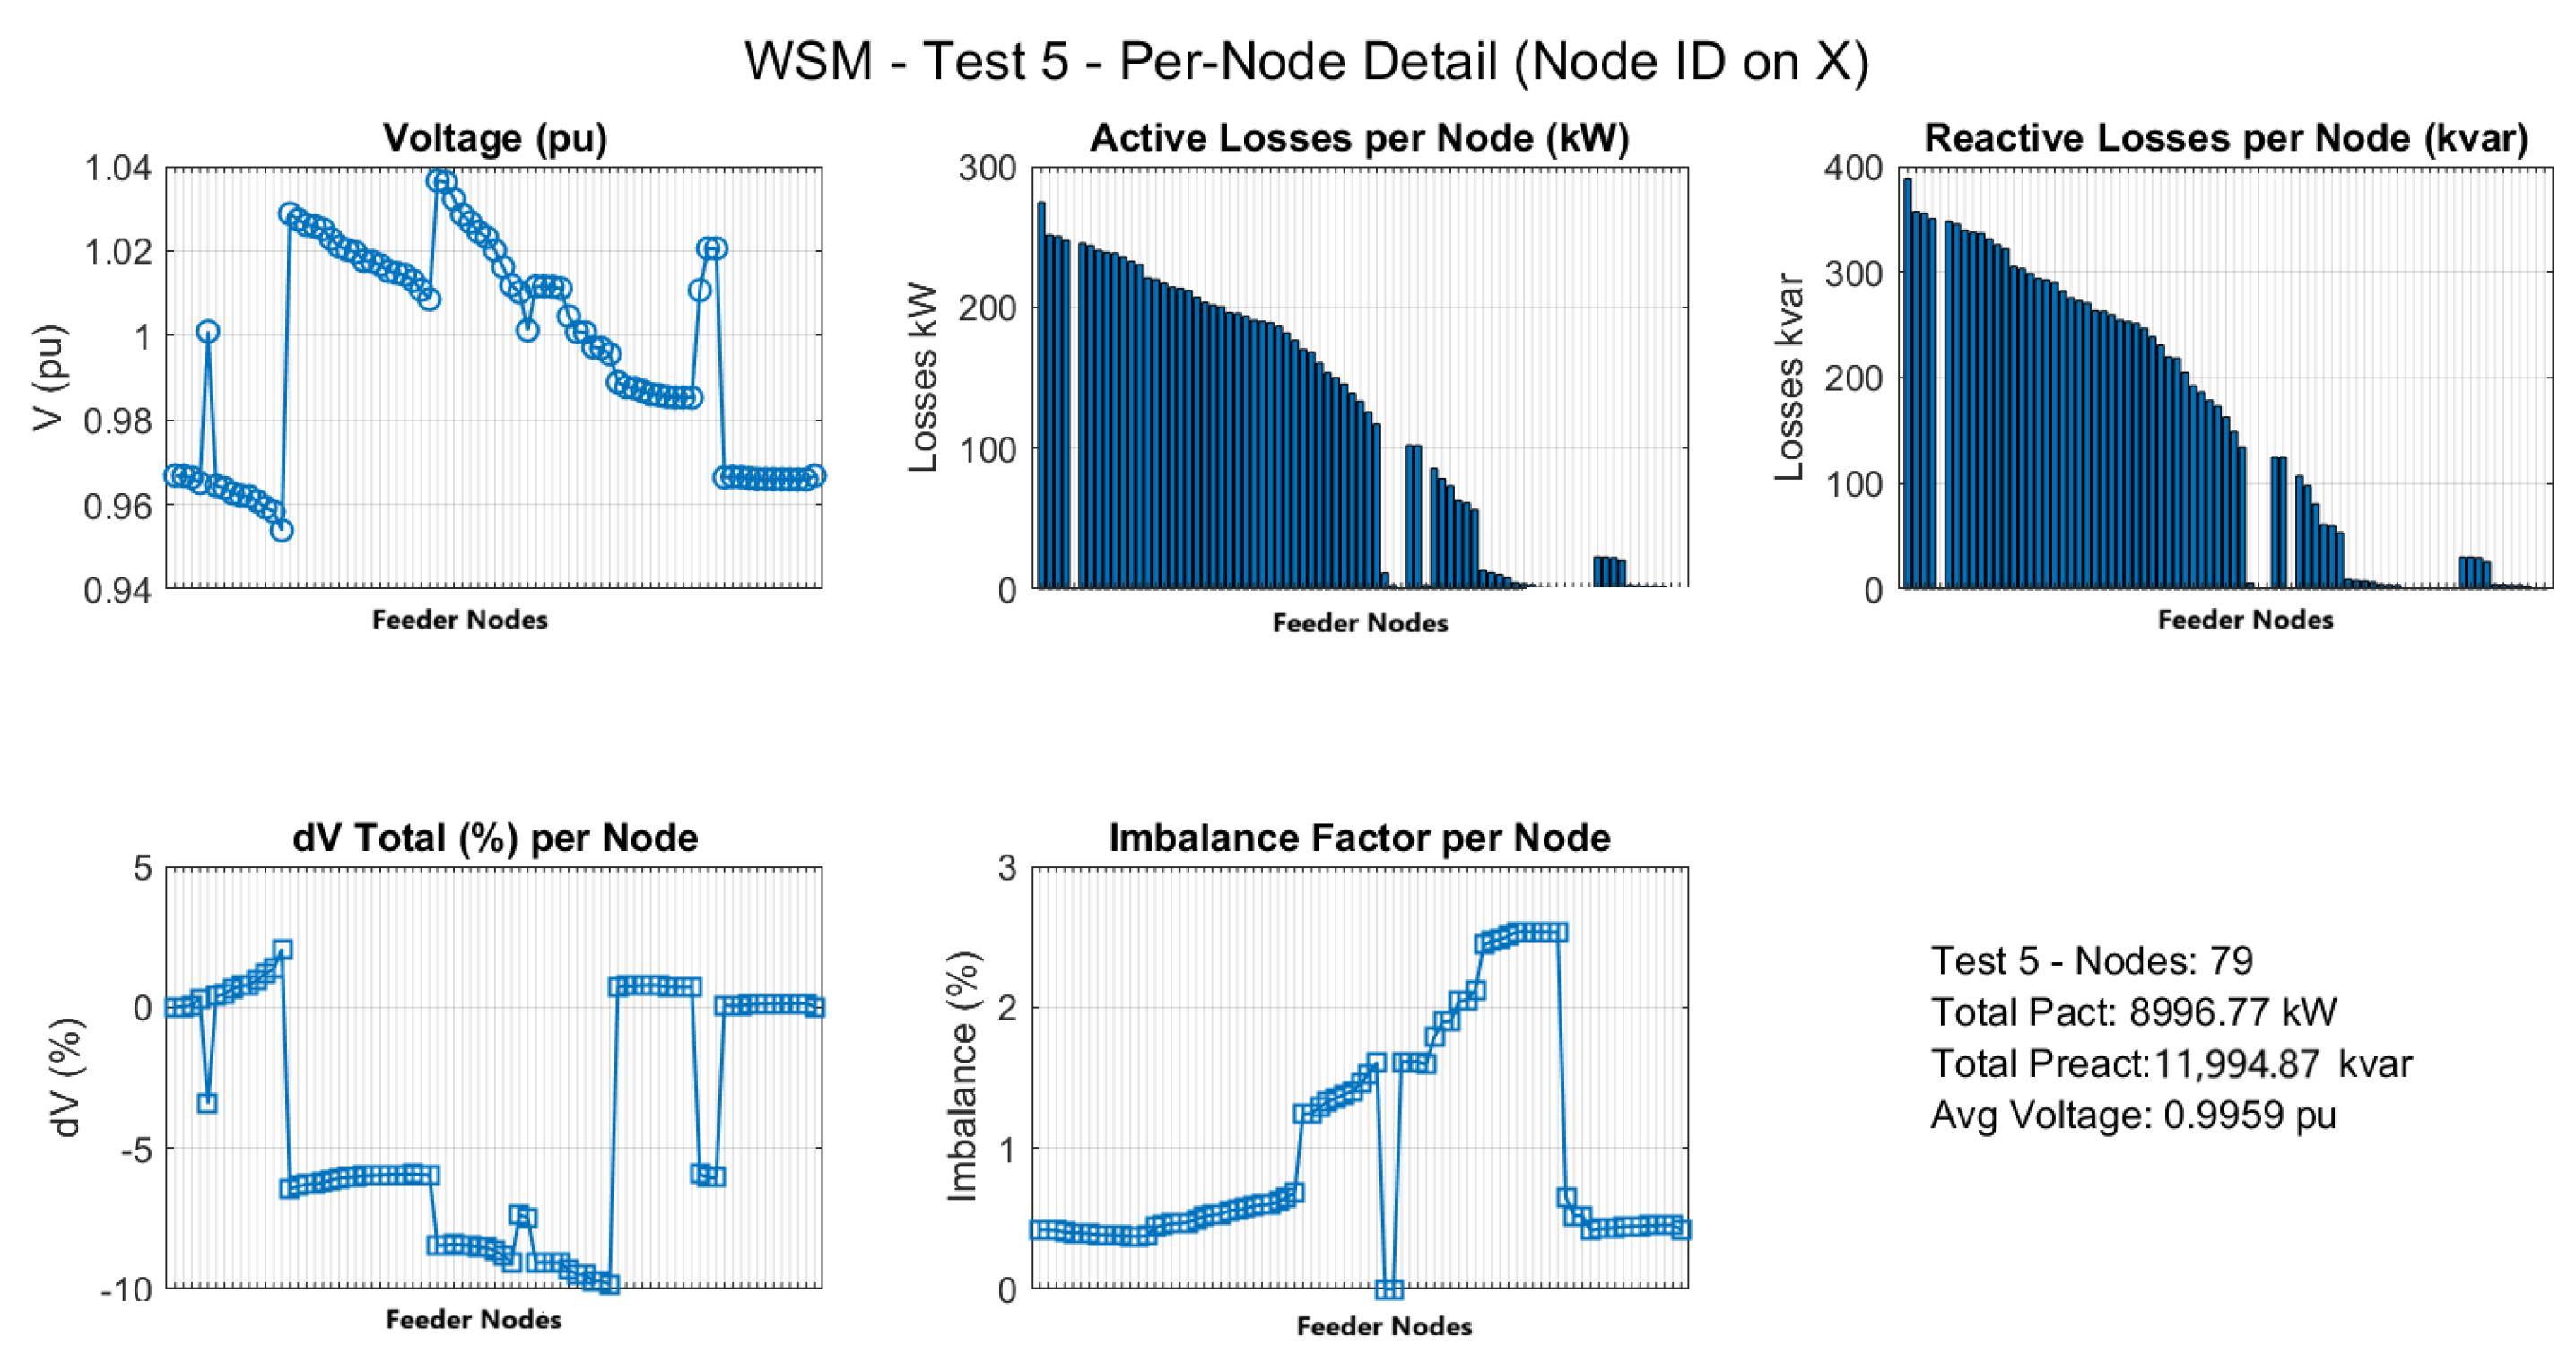
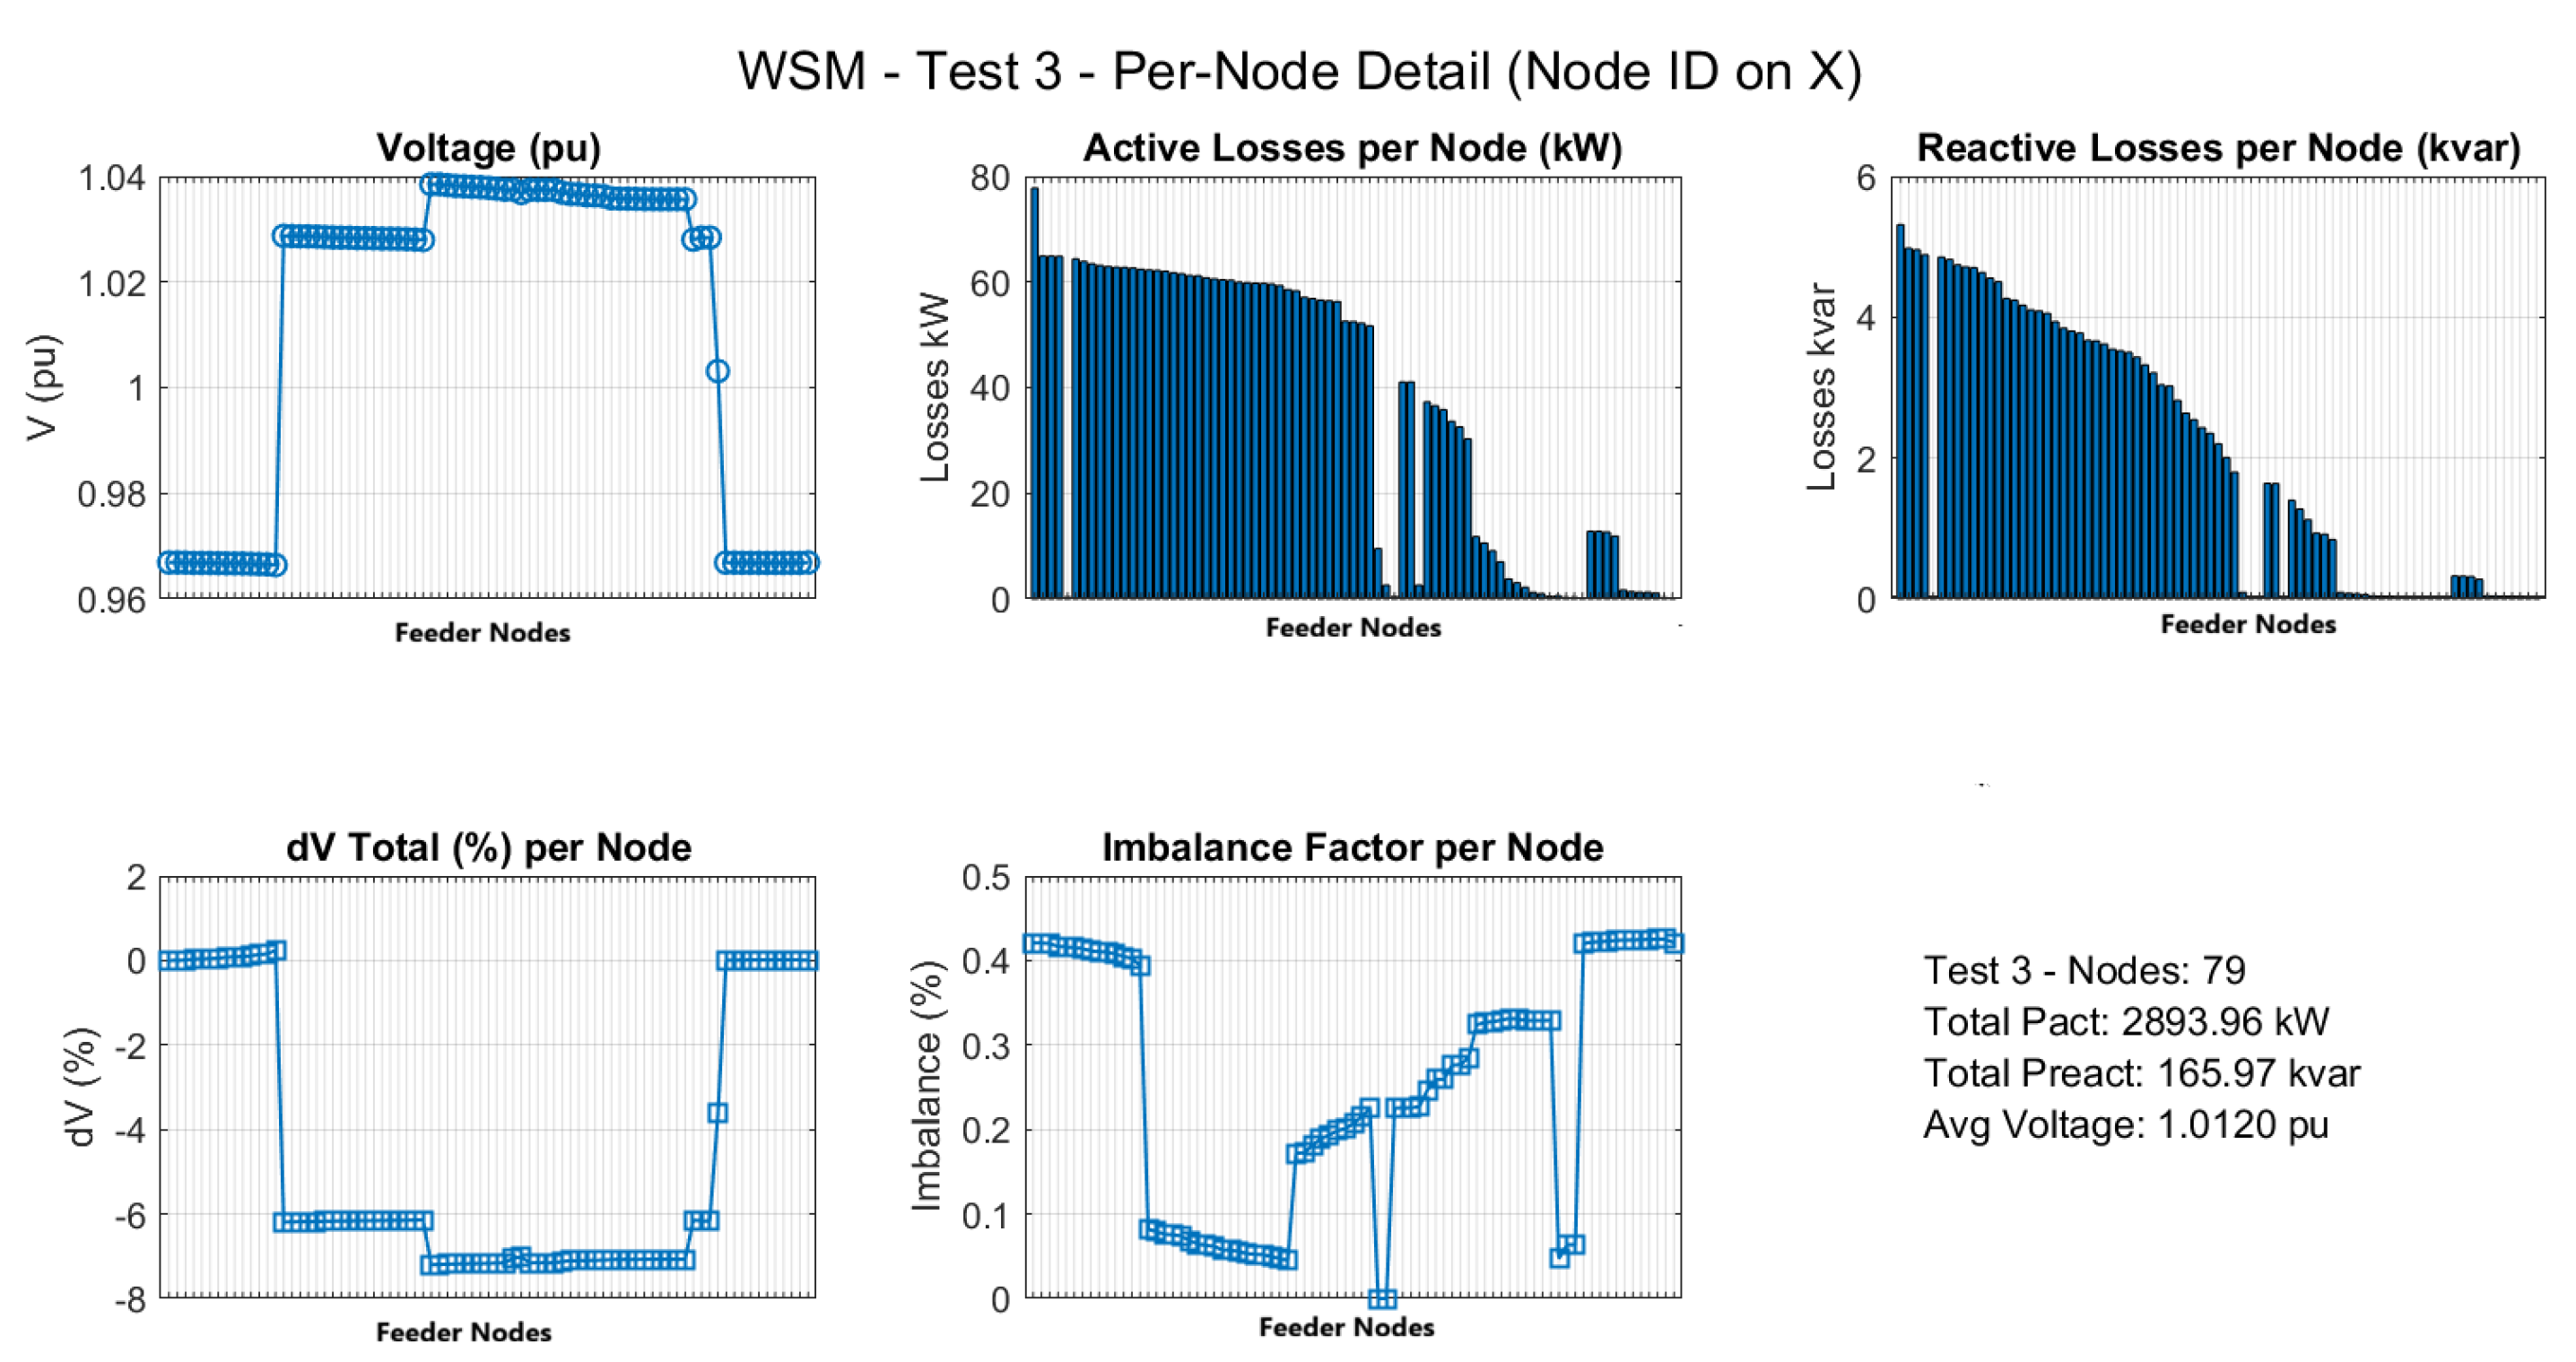
After identifying the winning WSM alternative, the nodal behavior of the selected criteria was analyzed in detail. Figure 16 presents the criterion profiles for the selected solution along the feeder nodes. The obtained curves confirm a general reduction in the evaluated variables throughout the feeder, thereby indicating that the selected regulator location improves the operating condition even under light-load operation.
The same minimum-load dataset was subsequently processed using TOPSIS in order to compare the ranking behavior obtained from a different multi-criteria decision formulation. The five best alternatives according to TOPSIS are presented in Table 14. In this case, the best-ranked alternative corresponds to node 5, followed by nodes 3, 10, 9, and 8. Therefore, under minimum-load conditions, the WSM and TOPSIS do not select the same best alternative, even though they identify a very similar group of top-performing candidate nodes.
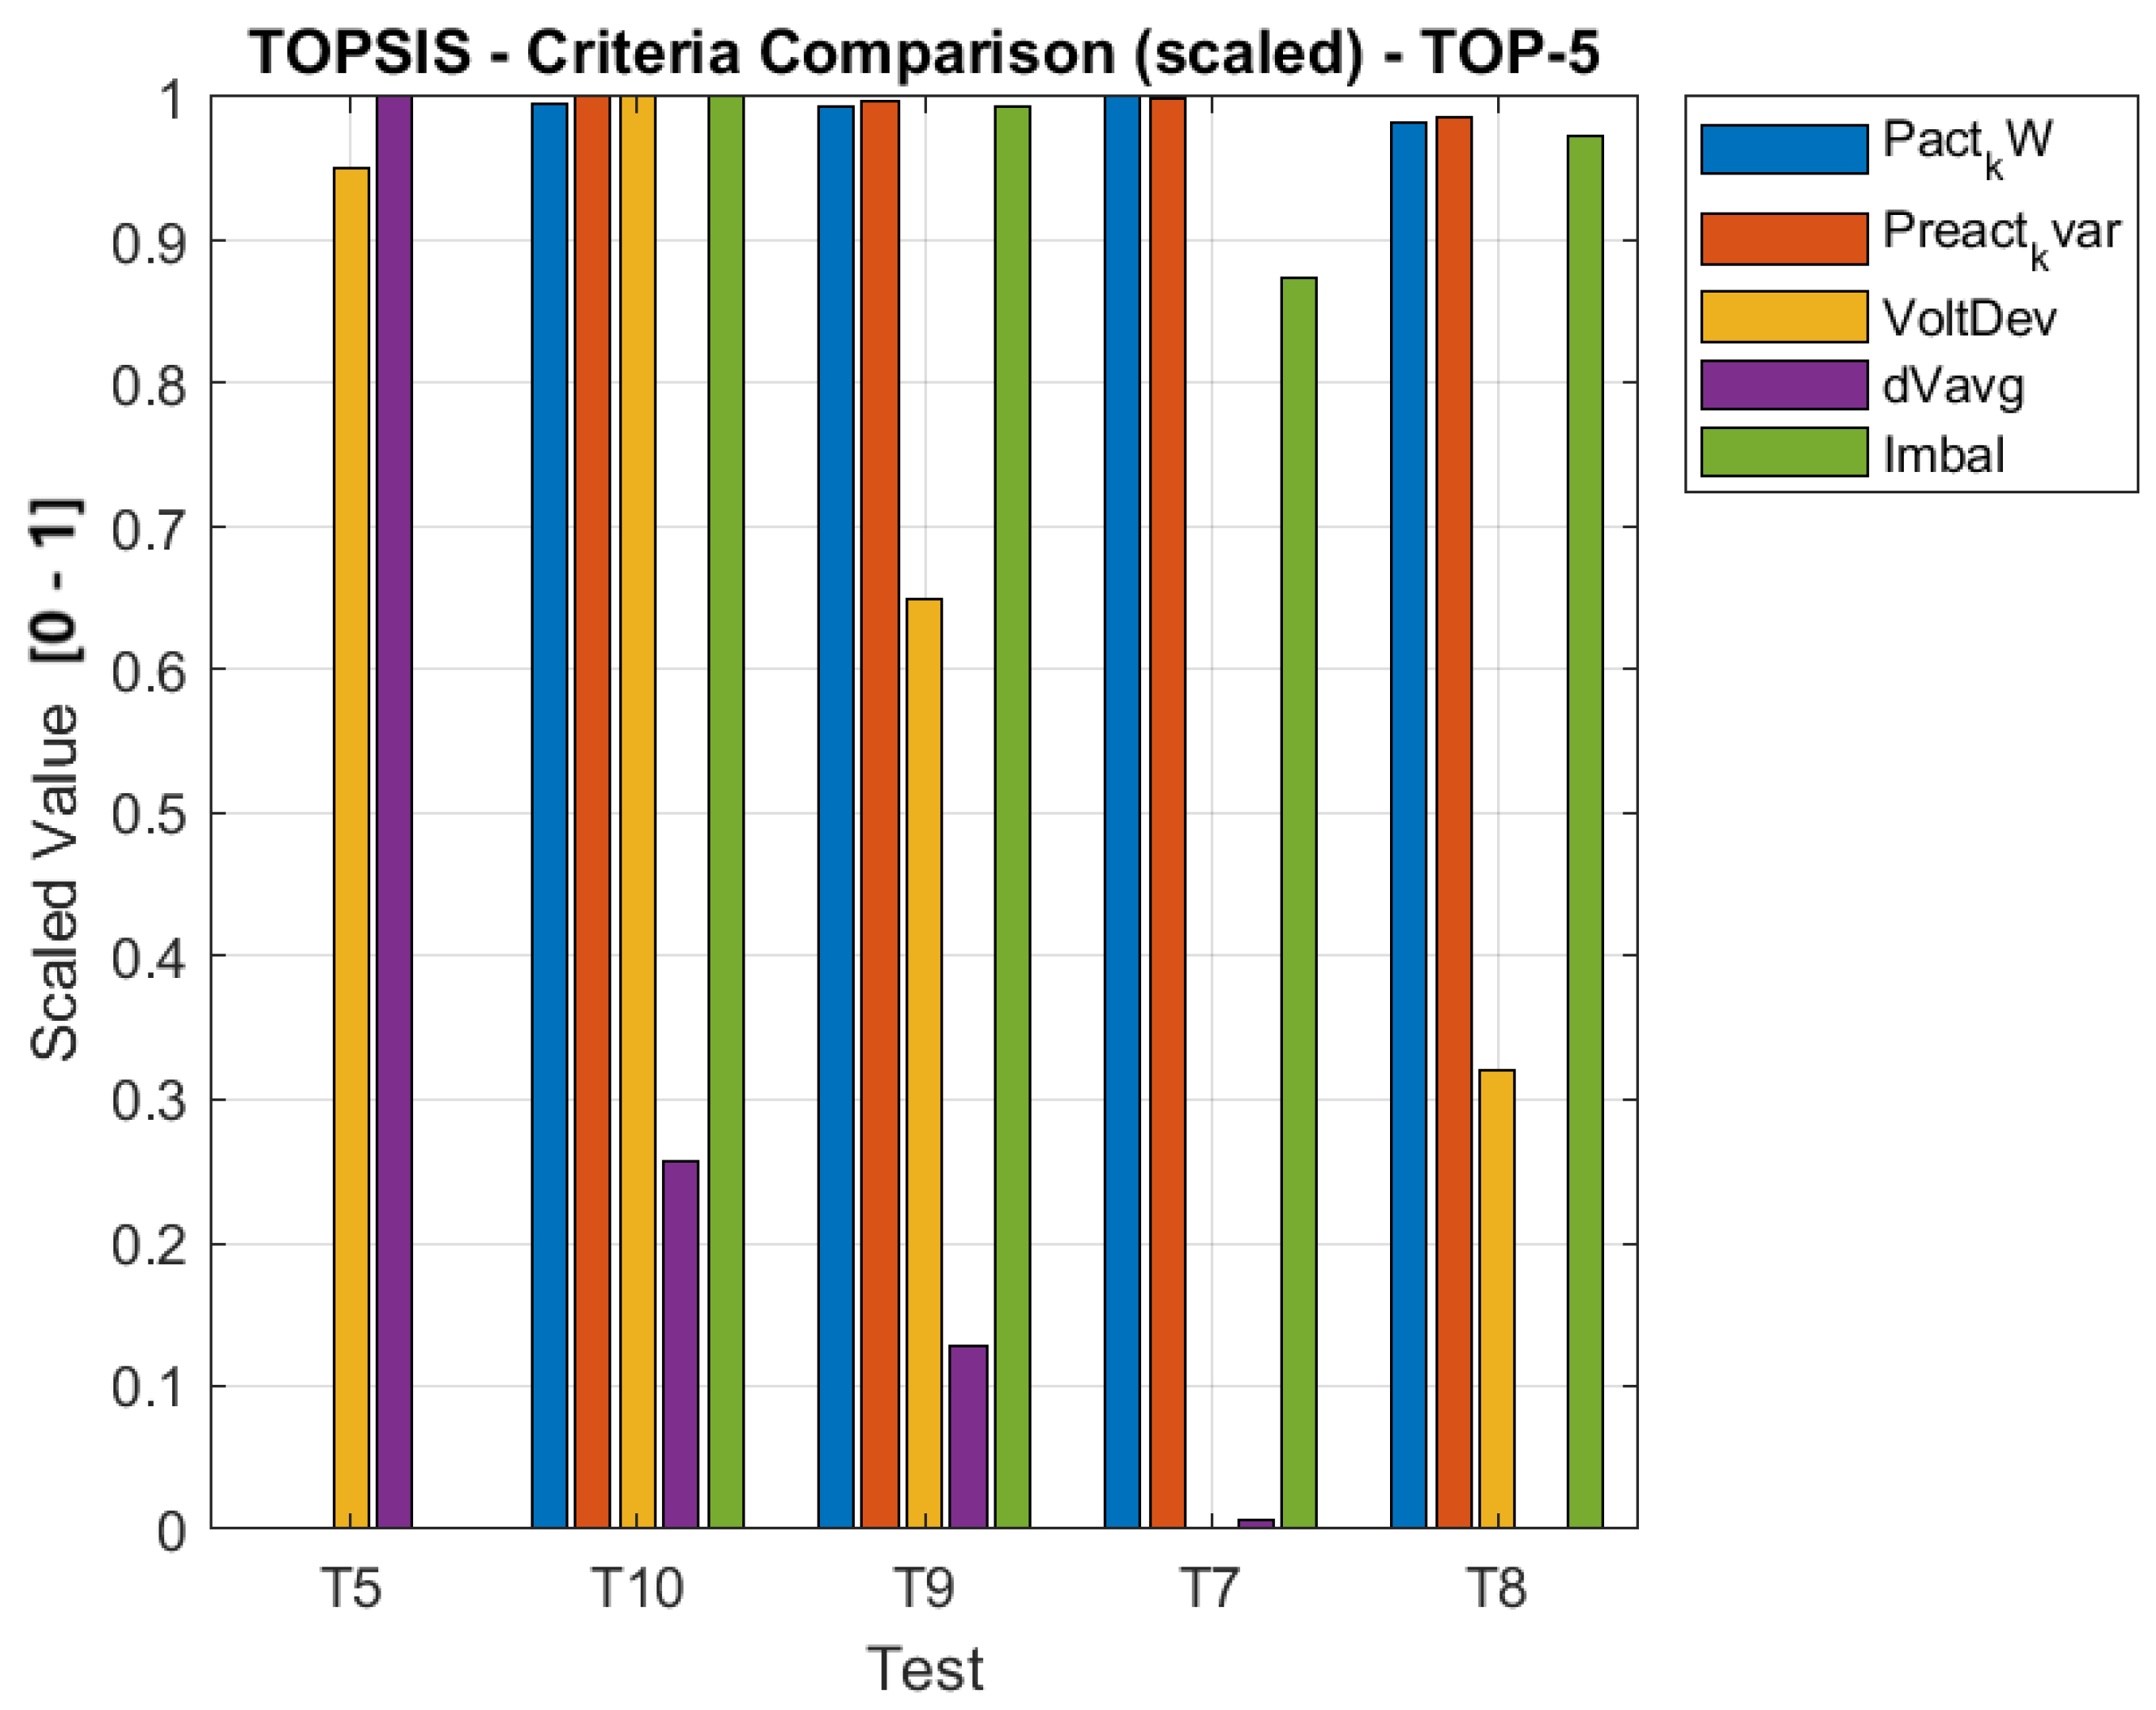
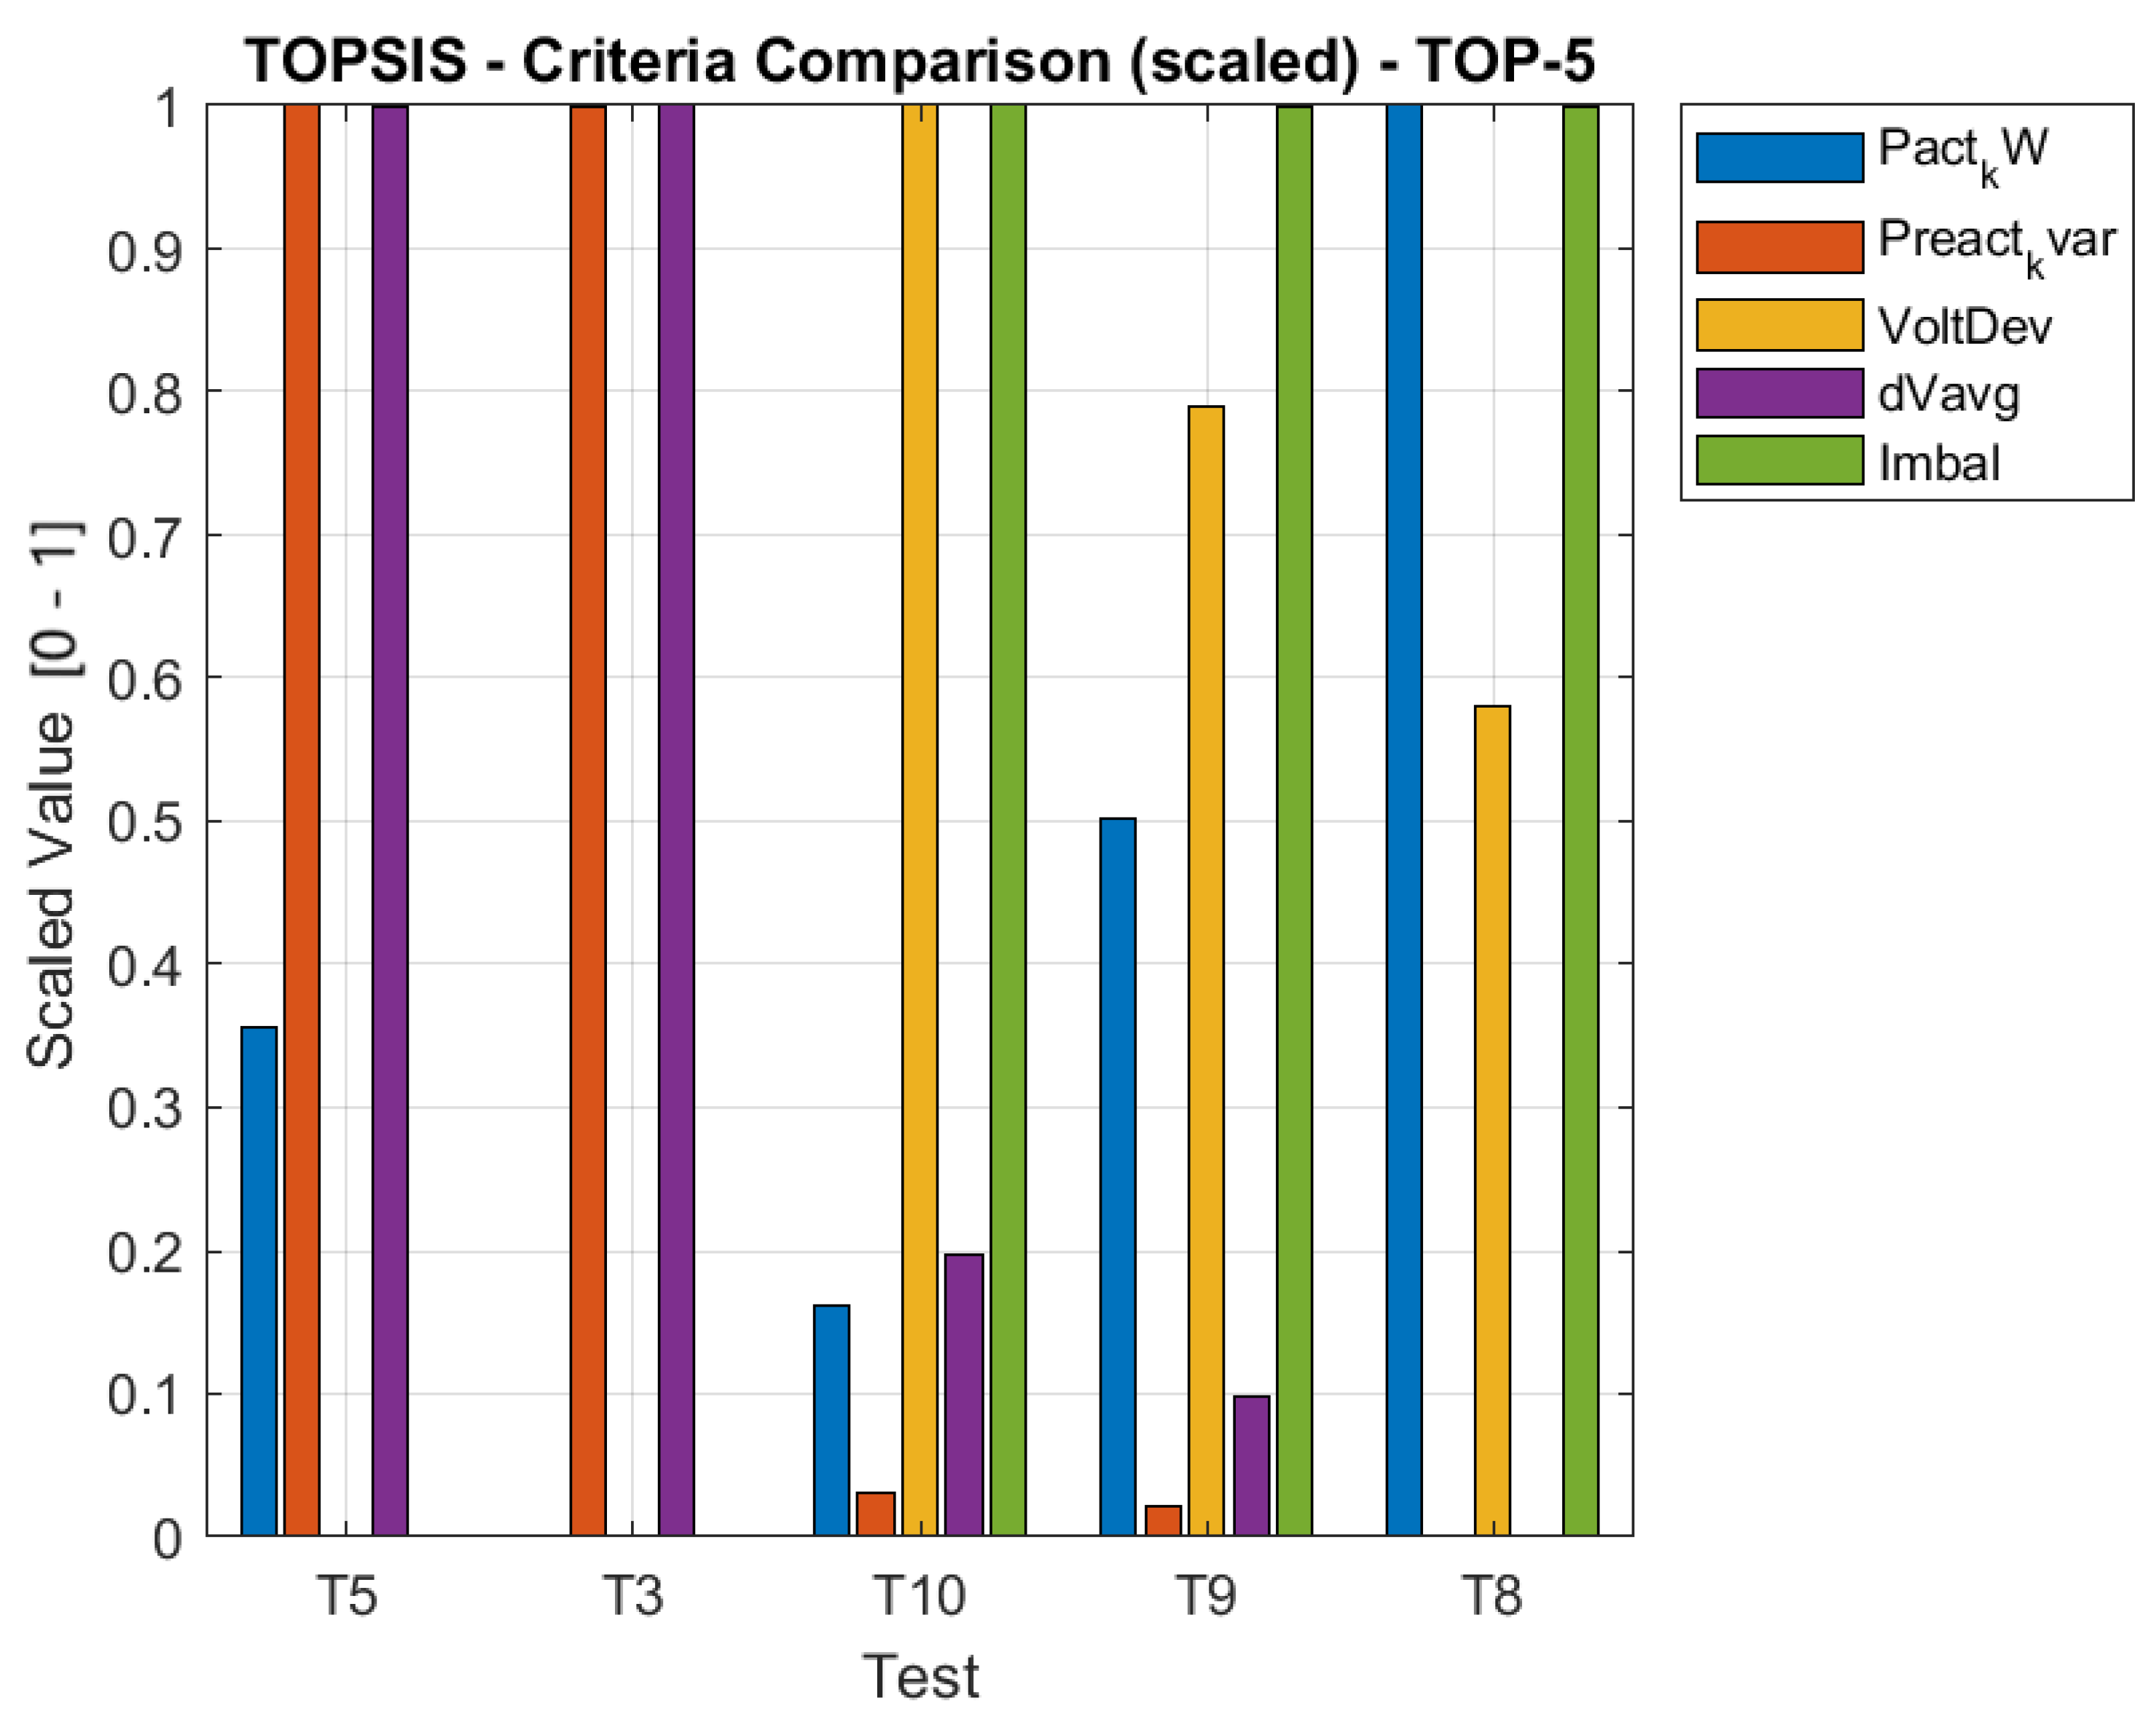
The relative performance of the best TOPSIS alternatives is illustrated in Figure 17. The bar chart shows that the voltage-deviation and voltage-unbalance indicators attain very low values for the best-ranked alternatives, while node 5 provides the most favorable overall balance in the weighted TOPSIS space. This explains why TOPSIS identifies node 5 as the preferred solution, even though the WSM ranking places node 3 first.
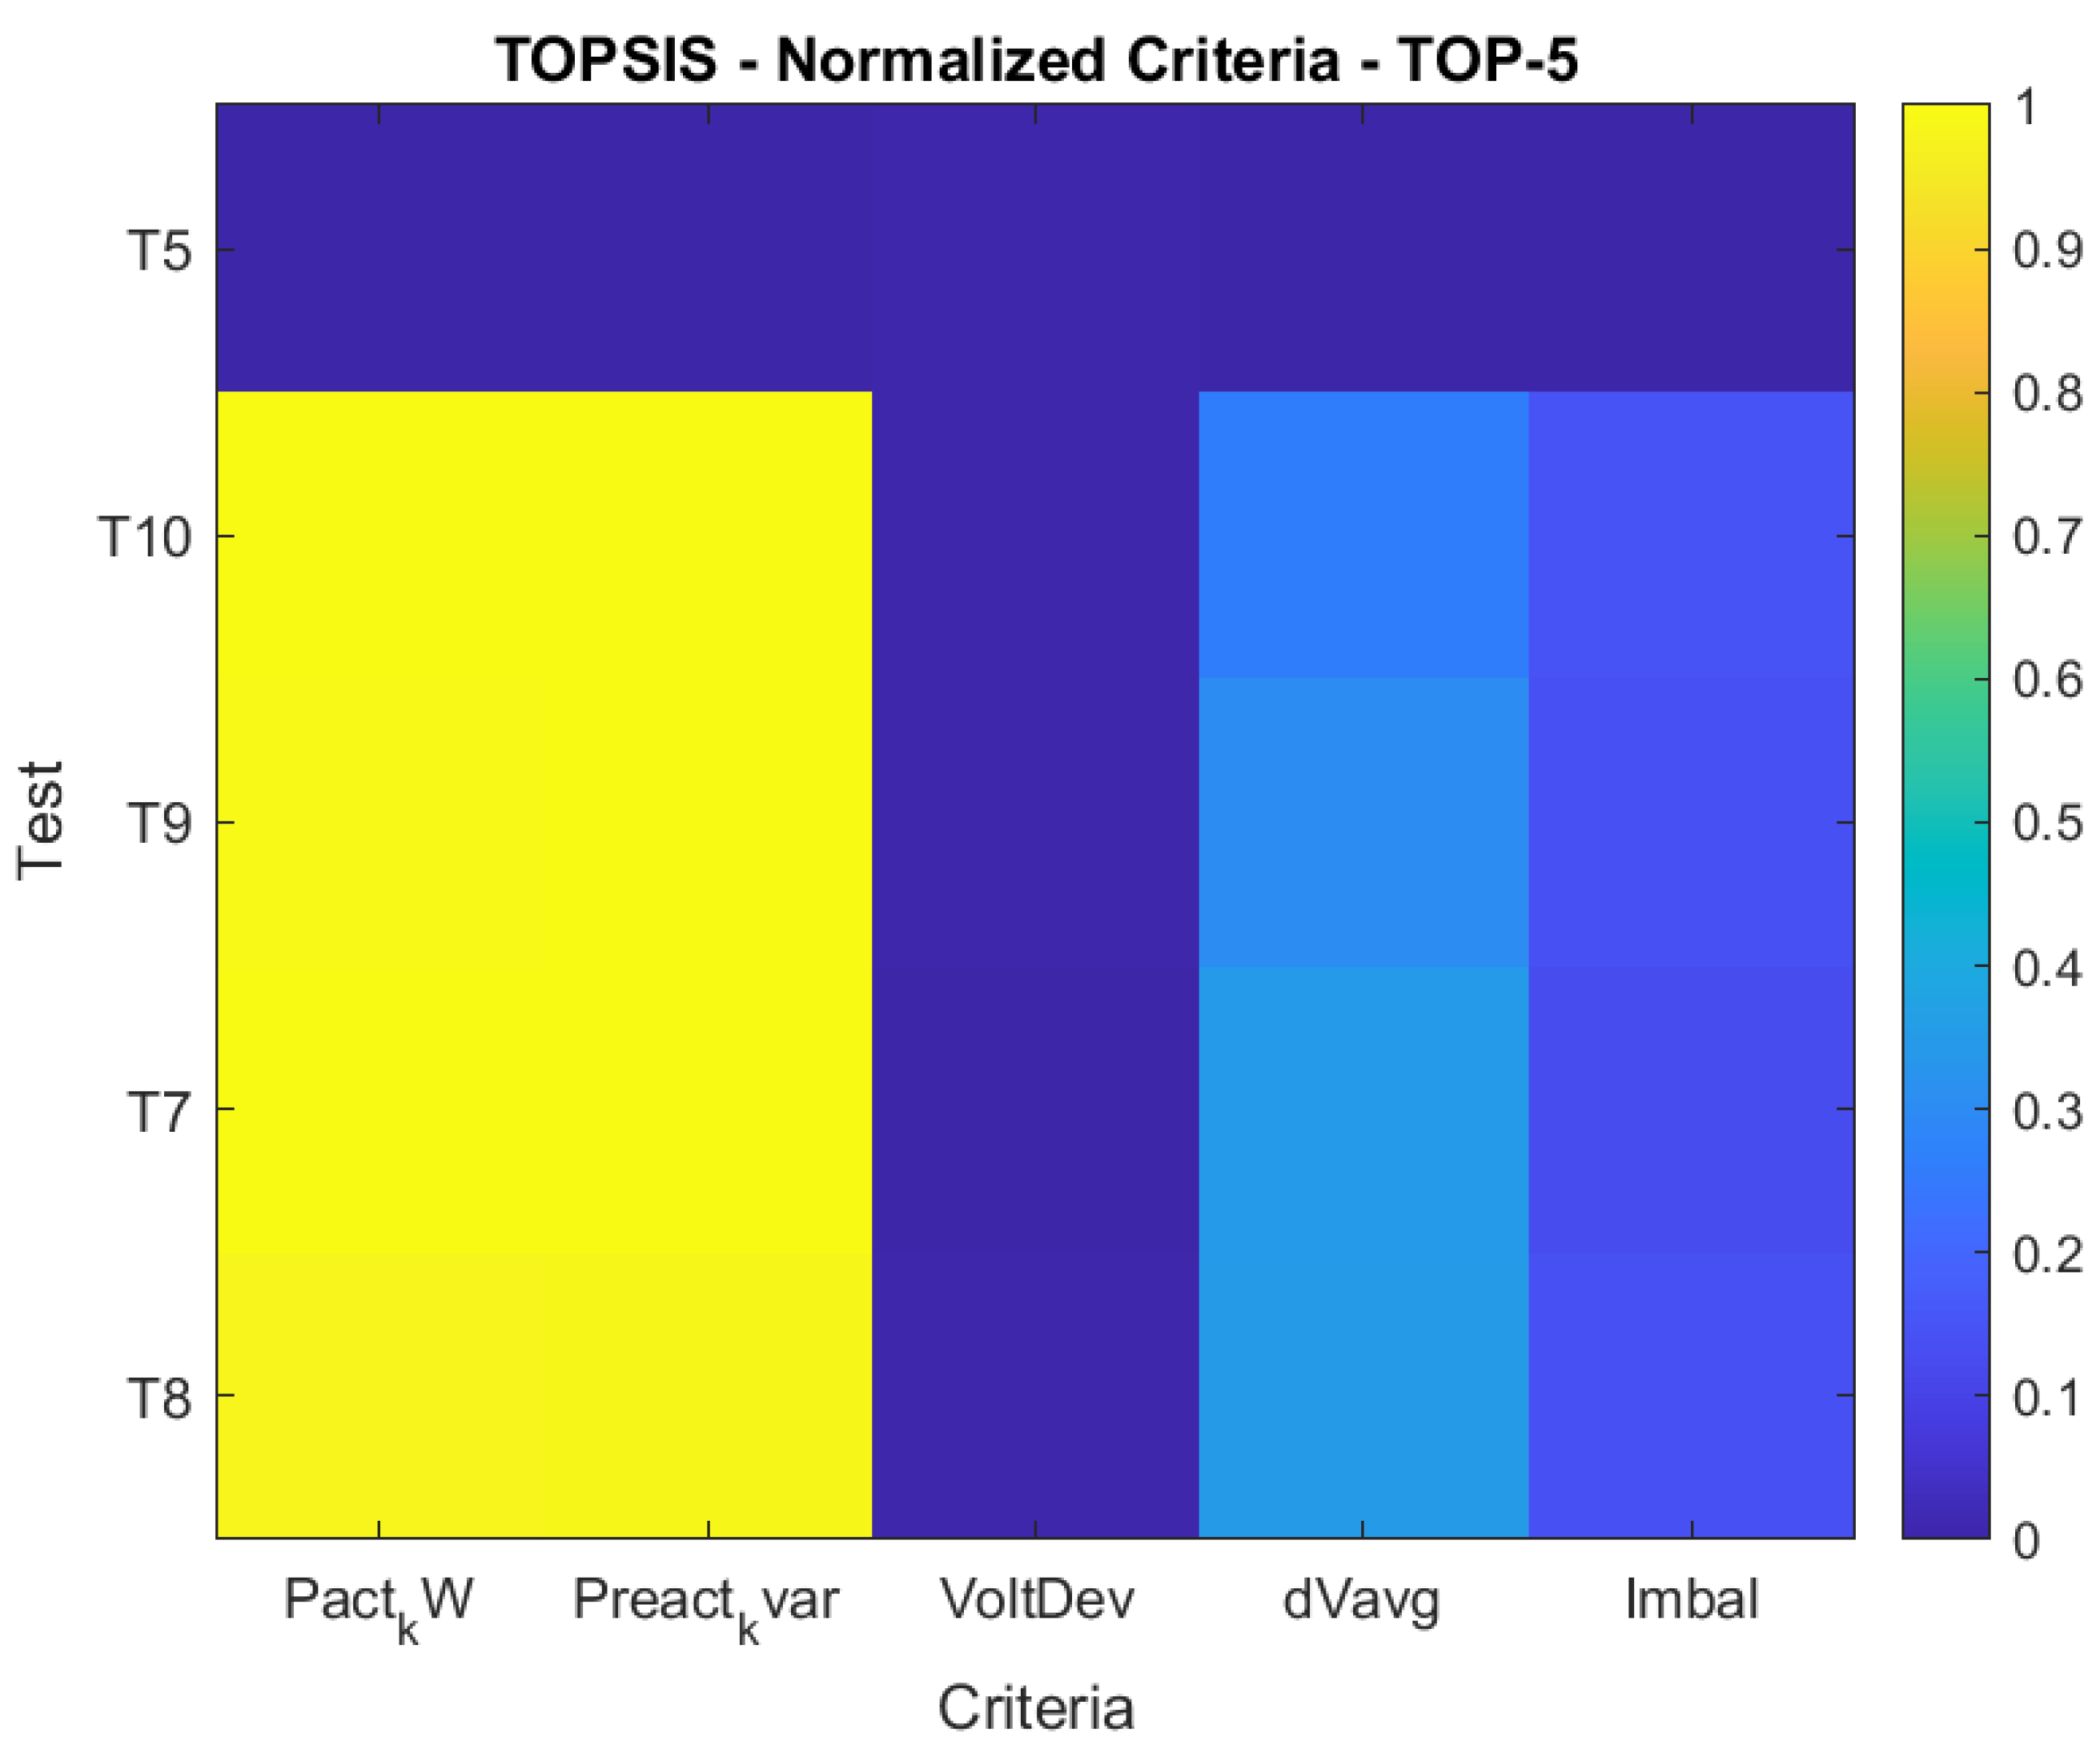
This behavior is further clarified by the heatmap shown in Figure 18. As in the WSM case, the majority of the best-ranked alternatives exhibit normalized active-loss, reactive-loss, and voltage-deviation values below 0.1. However, the visual distribution of the criteria indicates that alternative 5 achieves the most favorable overall compromise according to the TOPSIS closeness criterion.
The winning TOPSIS alternative for the minimum-load scenario was also examined in detail in order to characterize the technical performance of the selected solution under light-load operation. Table 15 summarizes the main indicators associated with the best-ranked configuration. According to the TOPSIS formulation, the preferred alternative corresponds to test 5, i.e., regulator placement at node 5 (MTS 108932). This result is technically significant because it shows that, even under minimum-load conditions, node 5 remains one of the strongest candidate locations in the feeder. In contrast with the WSM result obtained for the same operating scenario, the TOPSIS ranking preserves node 5 as the best solution, which reinforces its relevance as a robust placement alternative when the feeder is analyzed under different loading conditions and under different multi-criteria aggregation logics. Moreover, the reported indicators confirm that this solution maintains low active and reactive losses, a reduced total voltage deviation, limited voltage unbalance, and zero nodes outside the admissible operating range.
Under minimum-load conditions, the TOPSIS solution exhibits a nodal behavior that is technically close to the WSM-based assessment, with low active and reactive losses, limited voltage deviation, reduced voltage unbalance, and no nodes outside the admissible operating range. The detailed numerical indicators of the TOPSIS winning alternative are summarized in Table 15.

3.3. Comparative Analysis and Sensitivity Assessment

After evaluating the maximum- and minimum-load operating conditions independently, a comparative analysis was conducted in order to quantify the improvement achieved by the winning regulator-placement alternatives with respect to the base-case condition and to assess the consistency of the proposed decision framework. This comparison was performed for both the WSM and TOPSIS, considering the most relevant technical indicators, namely, active power losses, reactive power losses, average voltage variation, and average per-unit voltage magnitude.
For the maximum-load scenario, the comparison between the base case and the winning alternatives obtained by the WSM and TOPSIS is summarized in Table 16. These results show a clear technical improvement after regulator installation. In particular, both methods converge to the same winning solution and therefore produce identical performance values. Relative to the base case, the selected regulator placement reduces active and reactive losses, decreases the average voltage variation from 0.29% to 0.05%, and improves the average voltage magnitude from 0.985 p.u. to 1.00 p.u. This result confirms that, under the most critical operating condition, the proposed methodology yields a technically consistent and clearly beneficial solution.
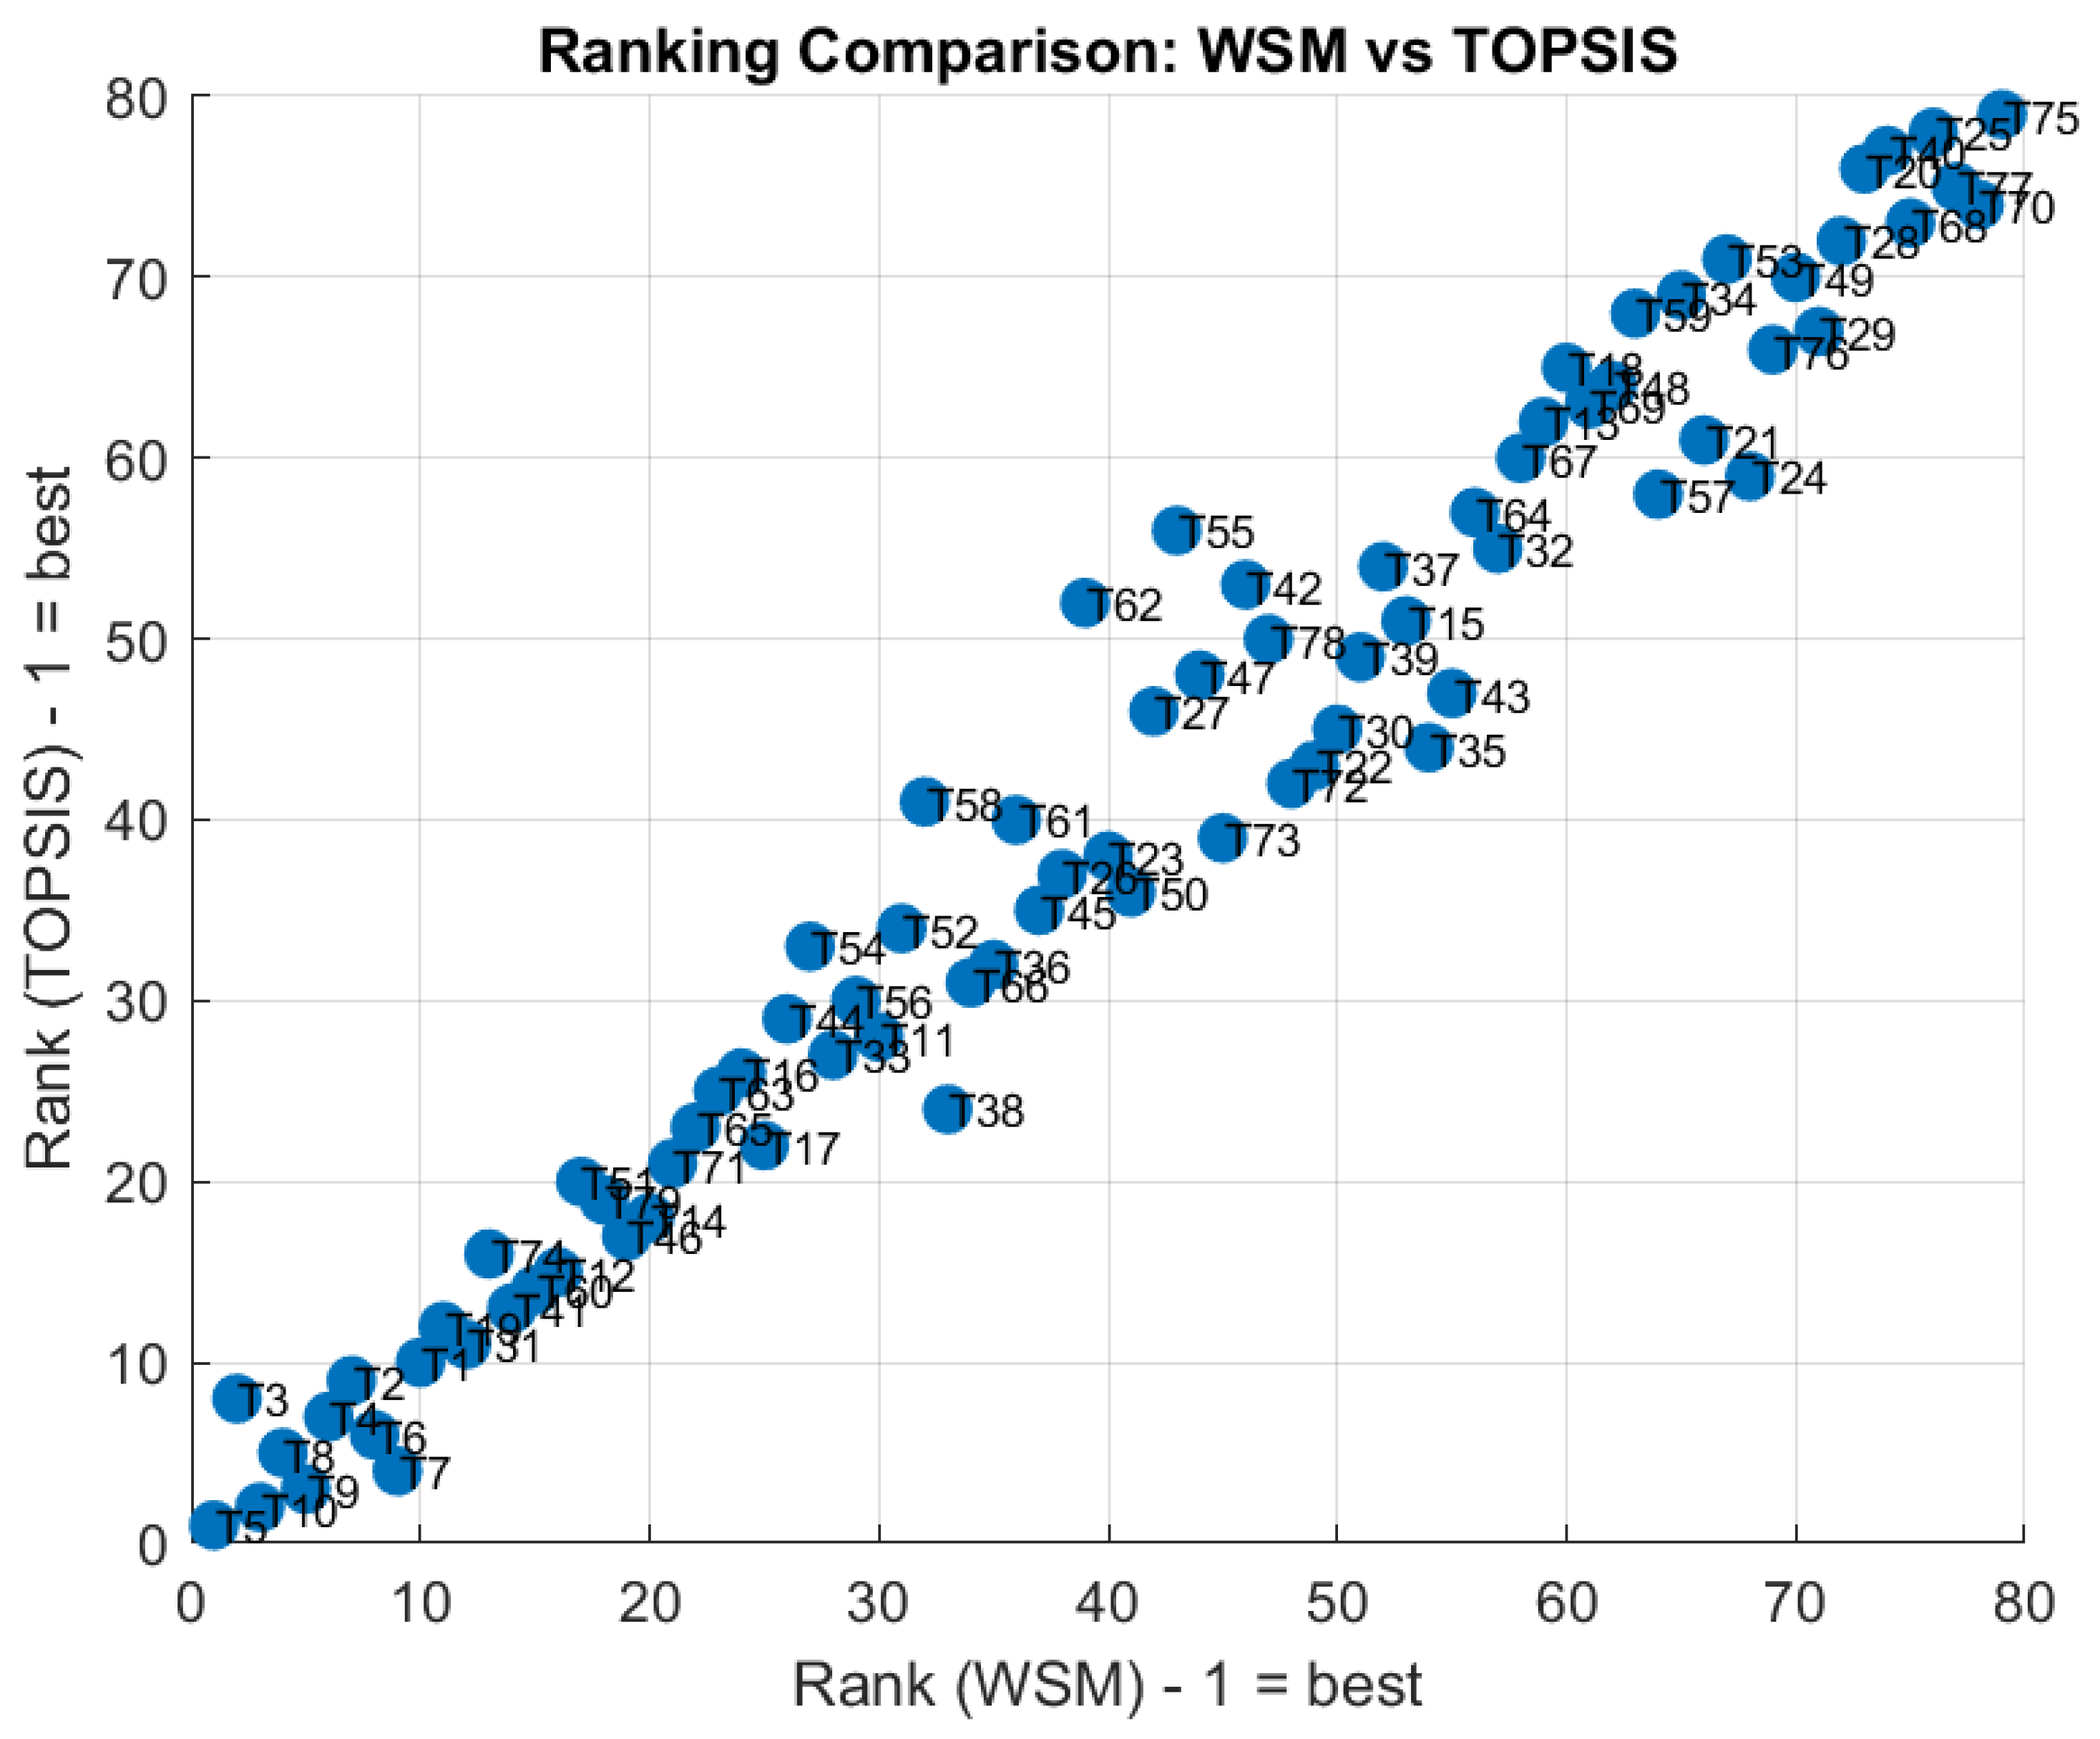
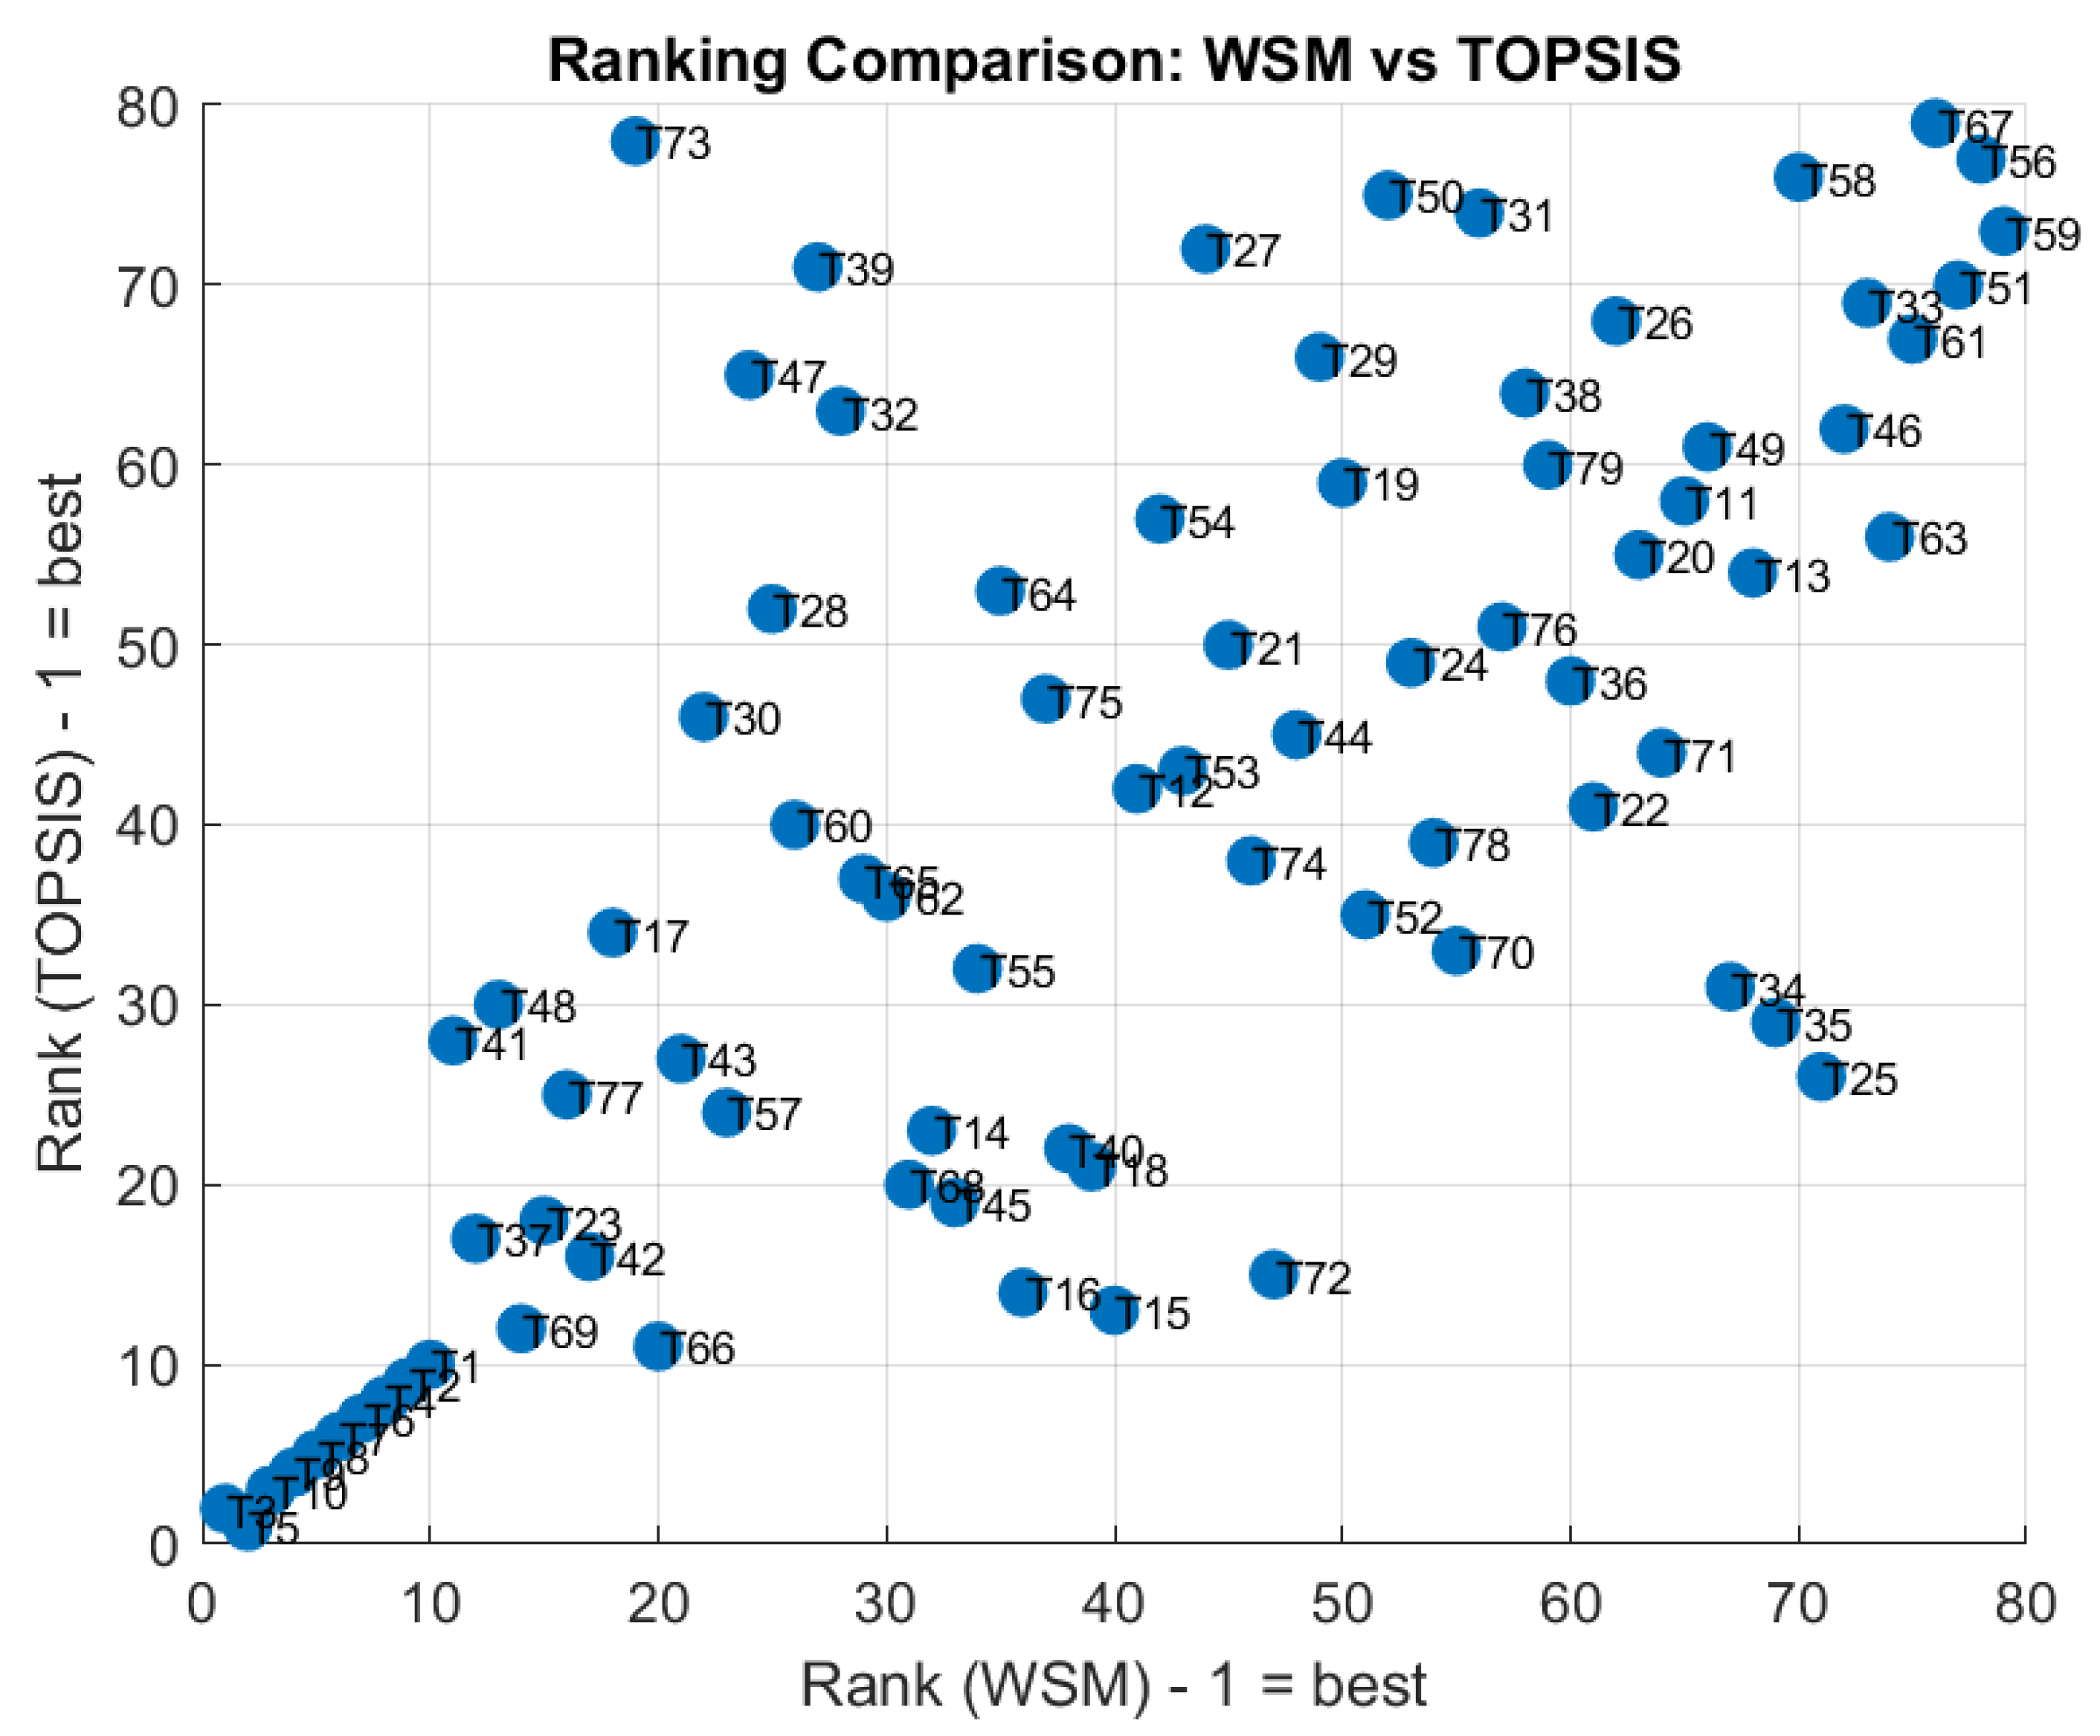
In addition to the direct numerical comparison, it is relevant to examine the degree of agreement between the full WSM and TOPSIS rankings. This comparison is illustrated in Figure 19, which presents a scatter plot of the rankings obtained under maximum load. The close concentration of the points around the main diagonal indicates a high degree of consistency between both methods over the set of evaluated alternatives. This behavior supports the robustness of the ranking process and explains why both methods identify the same best regulator location under maximum-load conditions.
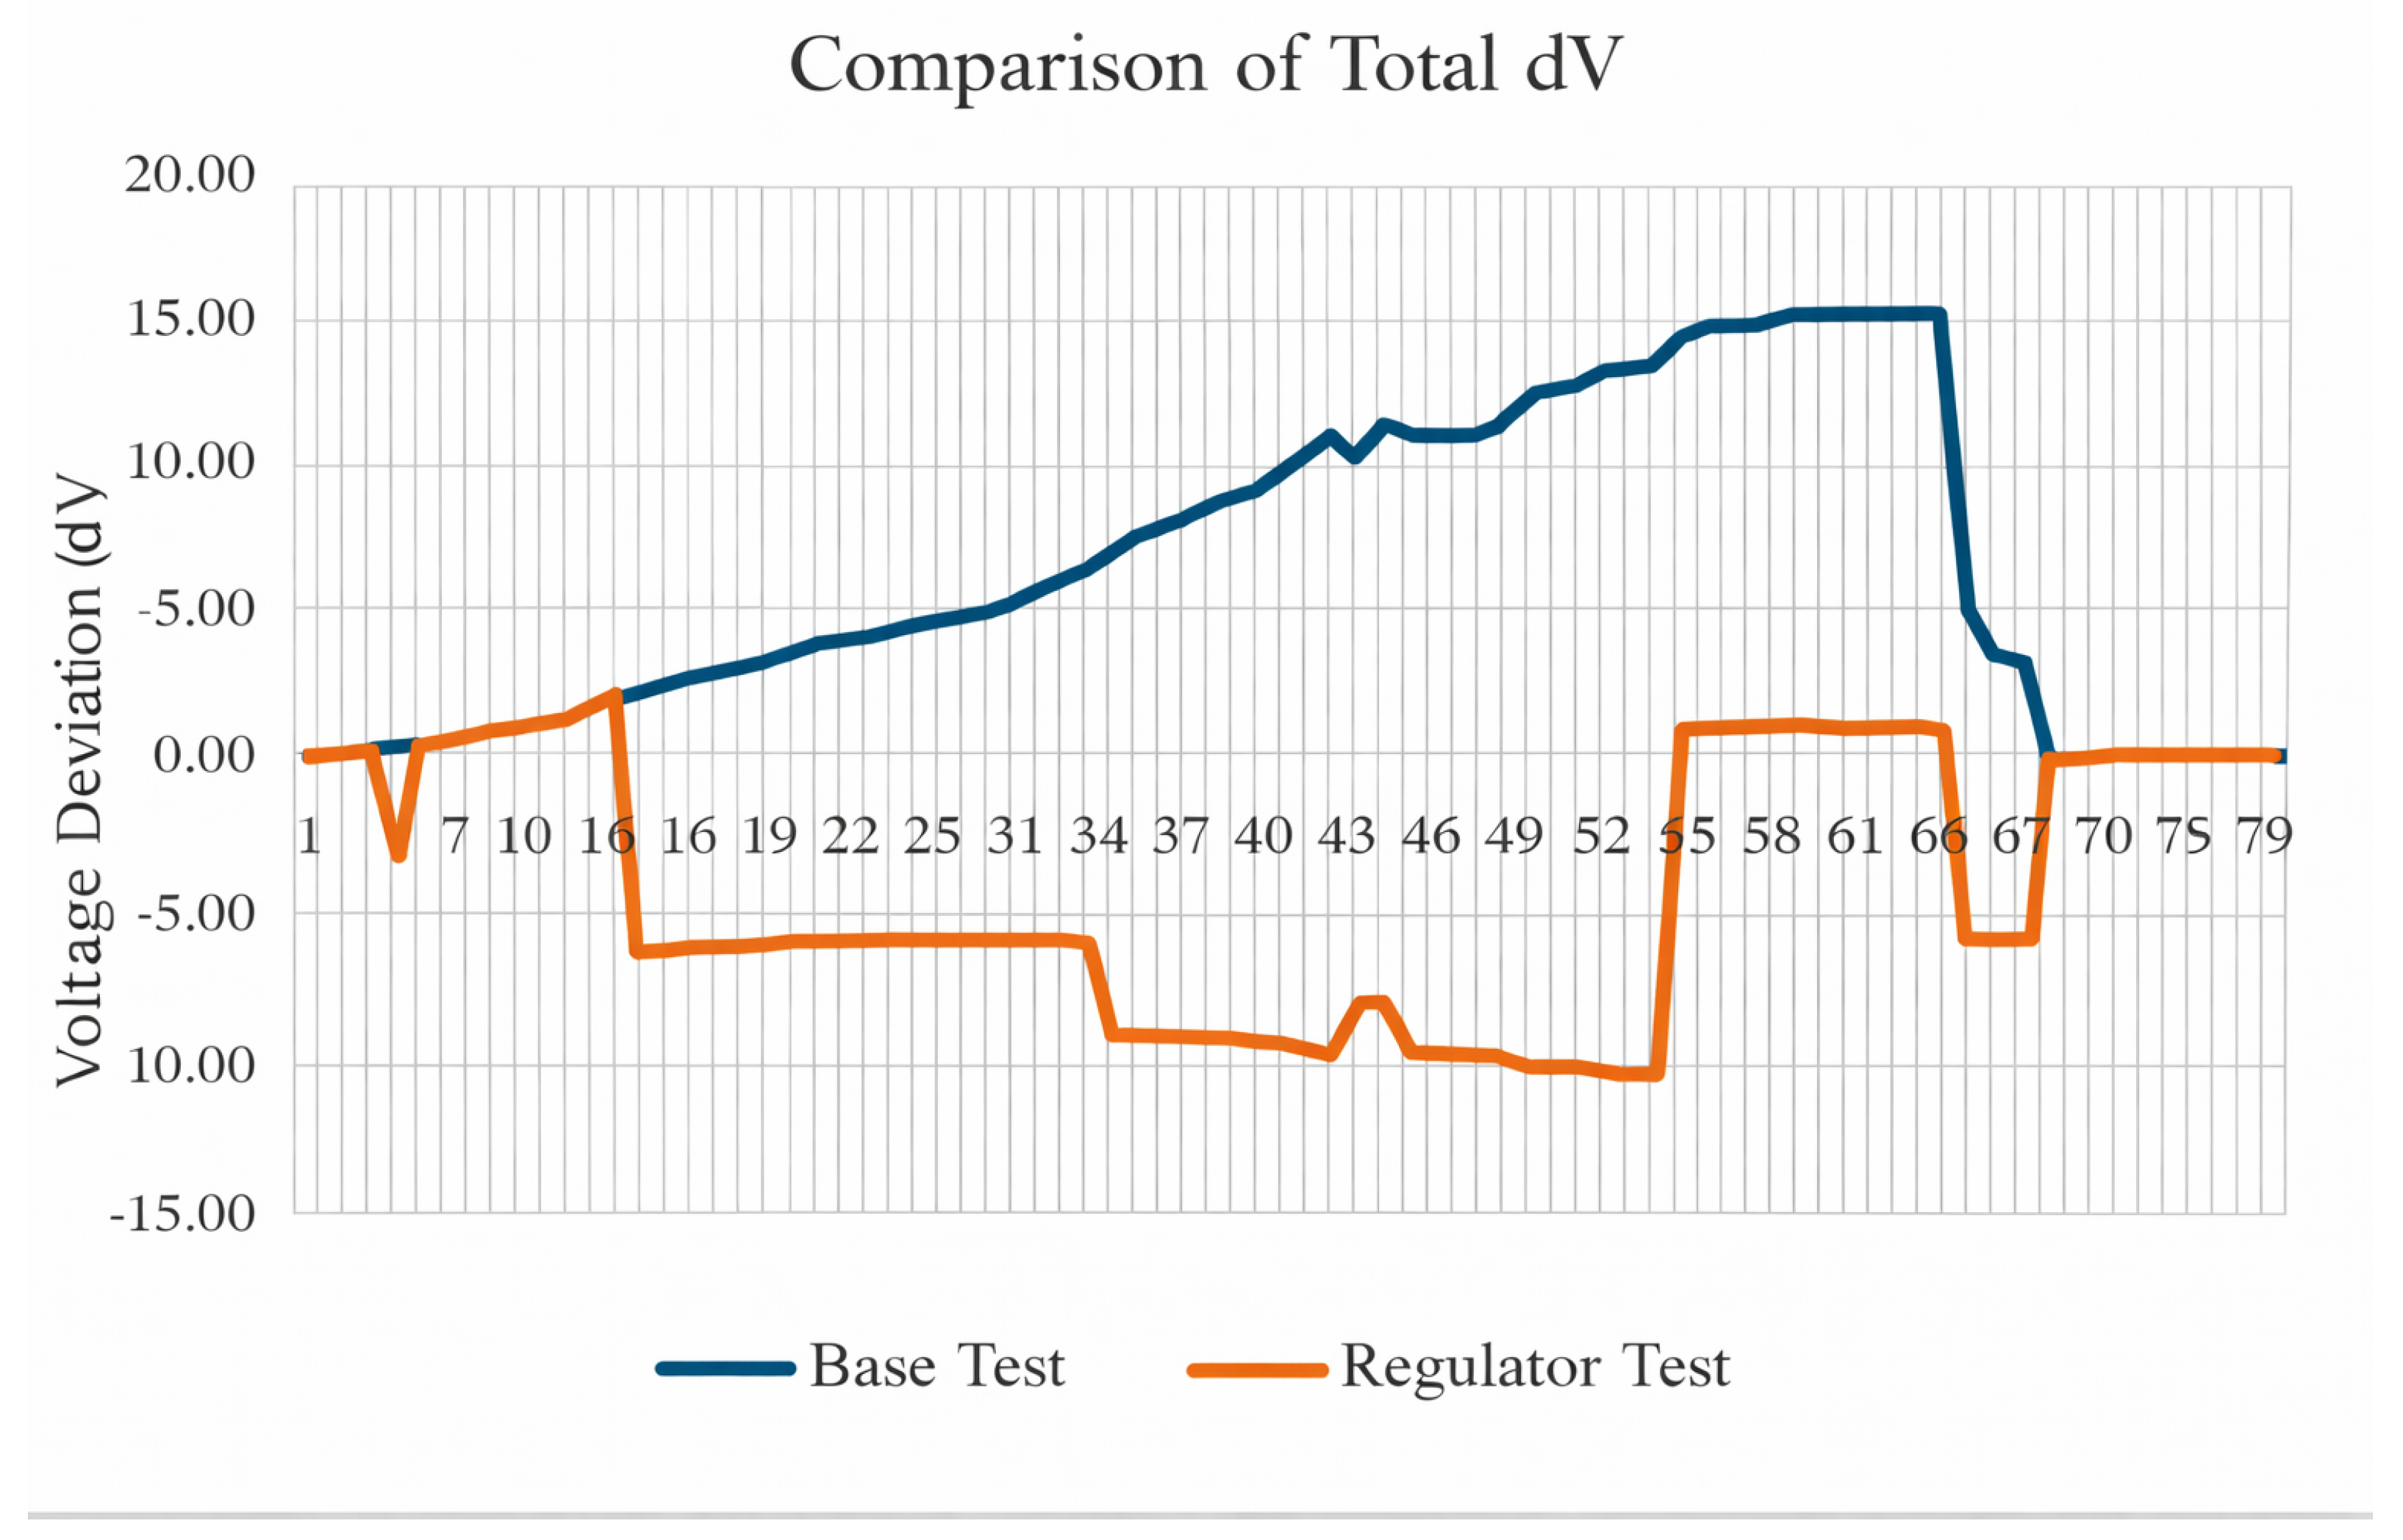
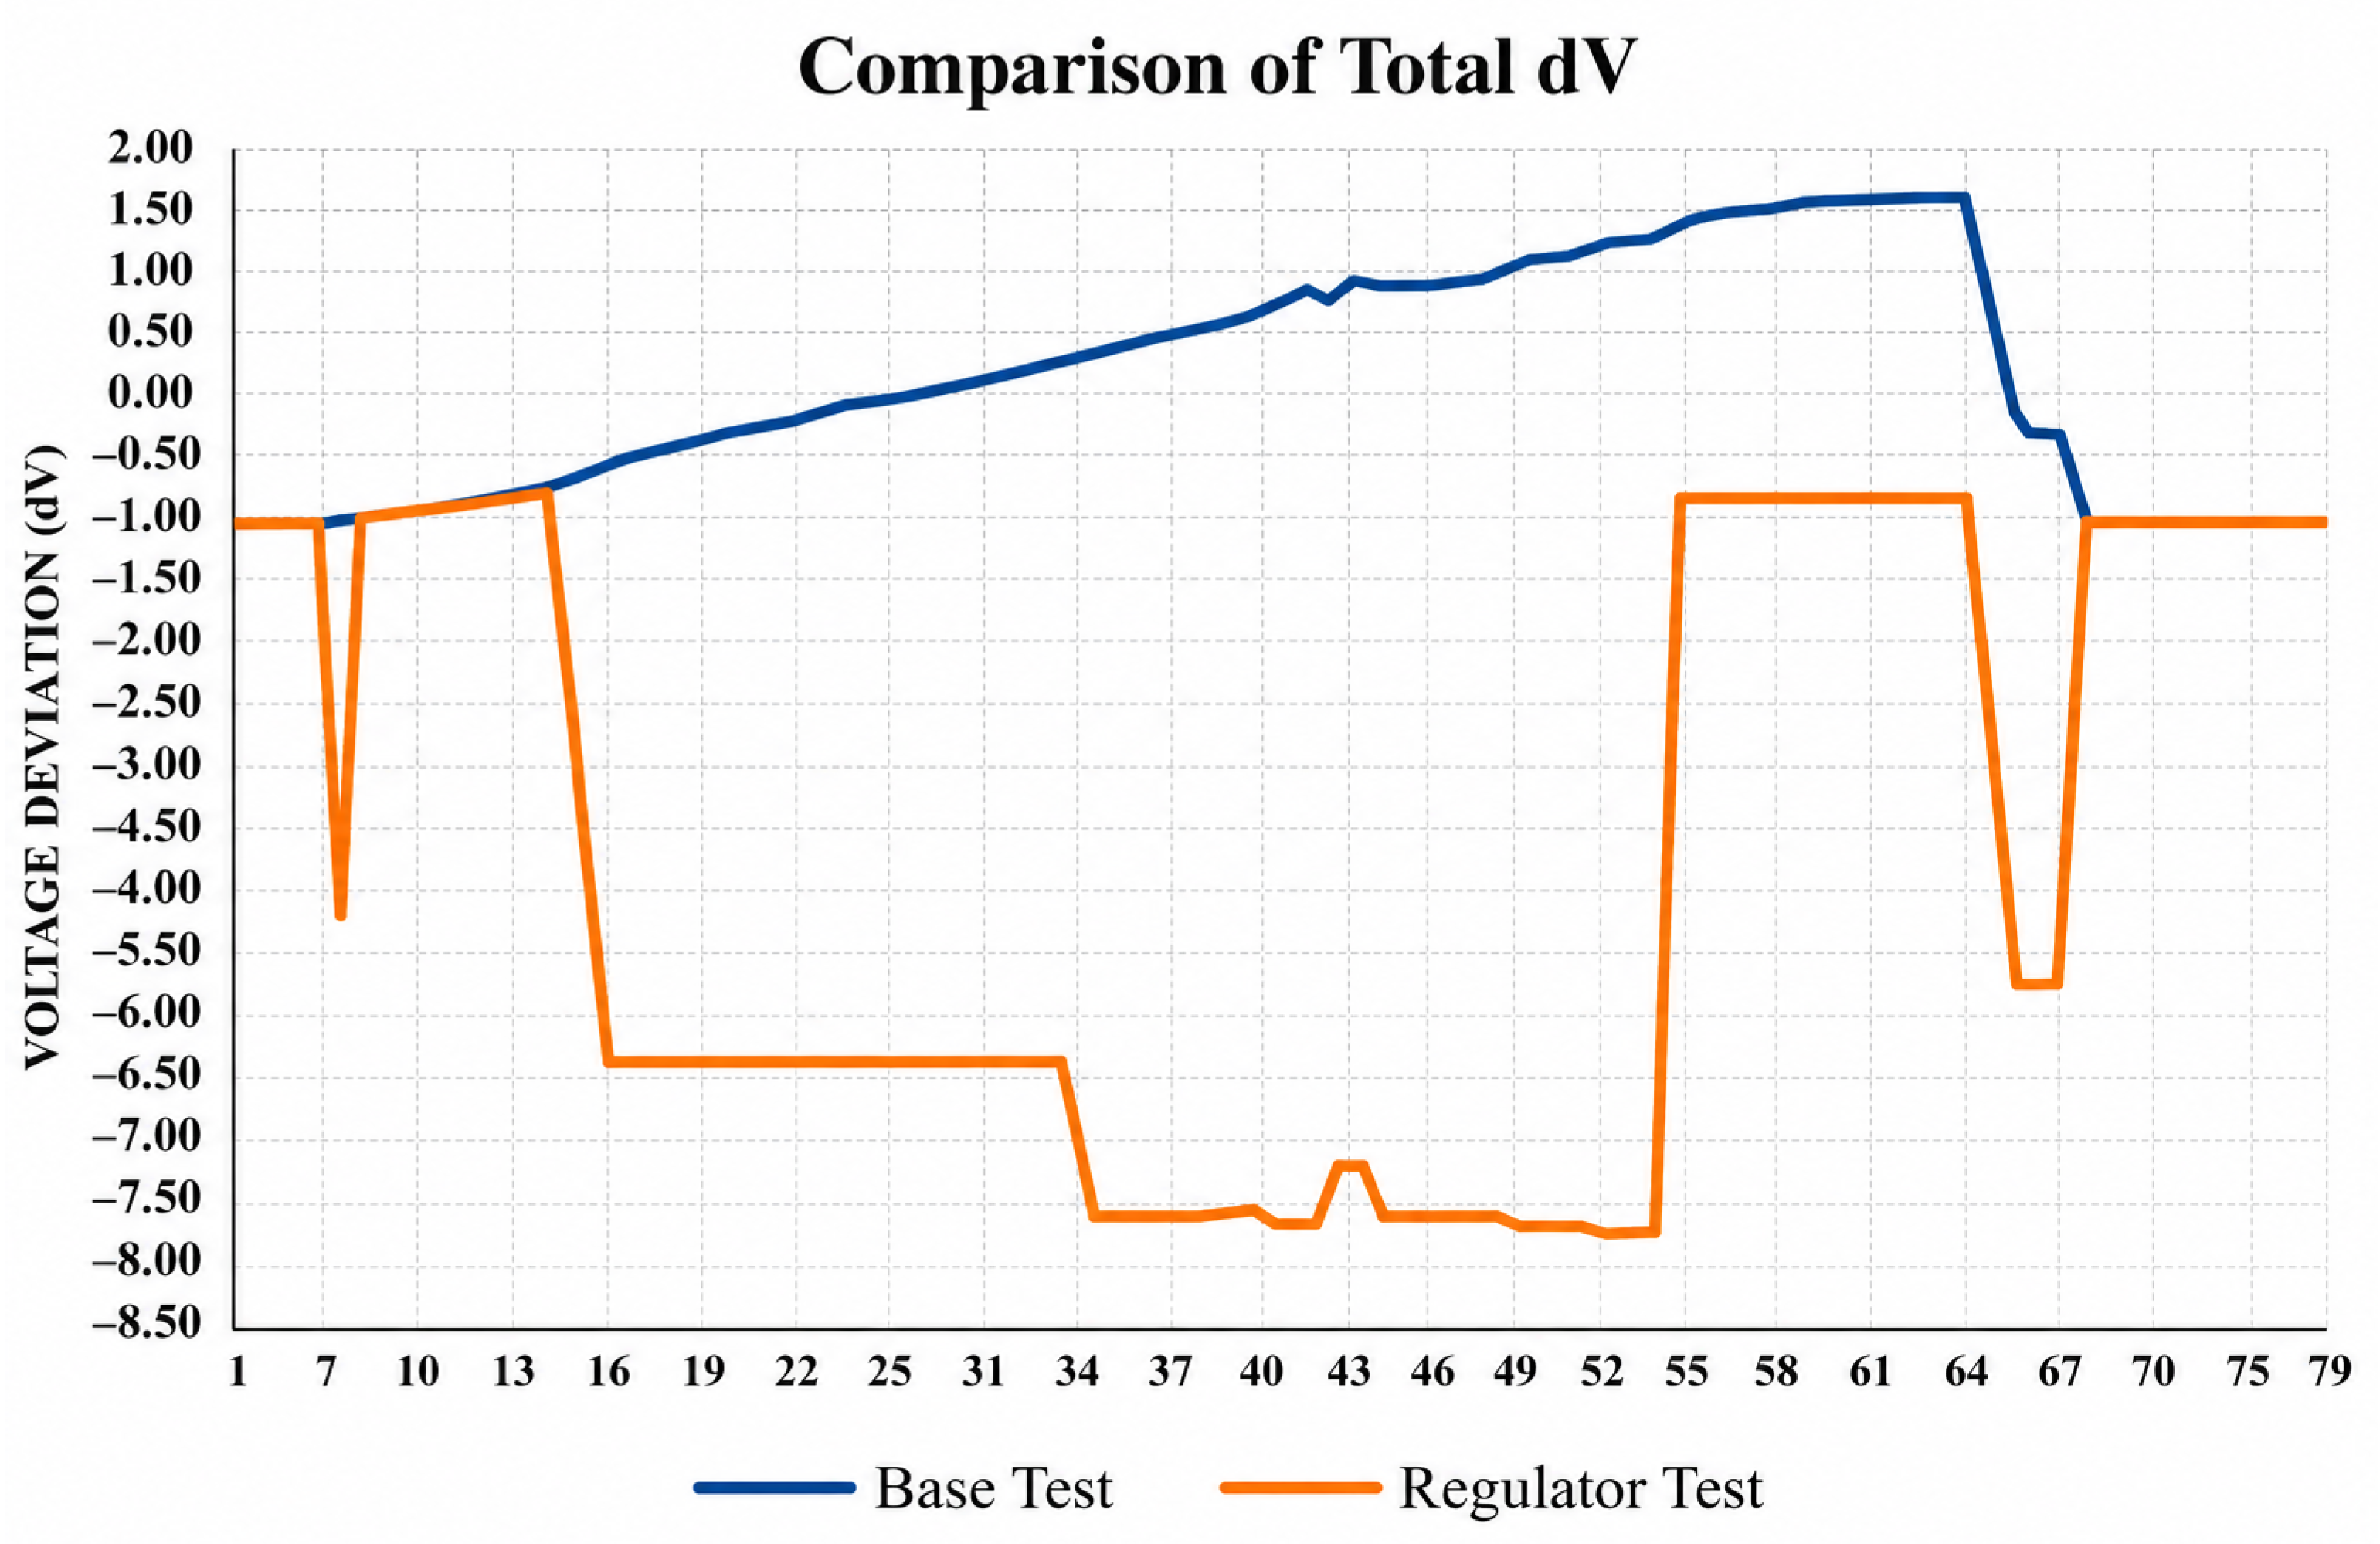
To further interpret the improvement introduced by the selected regulator placement, the behavior of the total voltage variation was compared between the base case and the regulated case. Figure 20 shows this comparison for the maximum-load scenario. The figure demonstrates that the regulator substantially attenuates the voltage-deviation profile along the feeder, especially in the downstream sections where the base case exhibits the most pronounced deterioration.
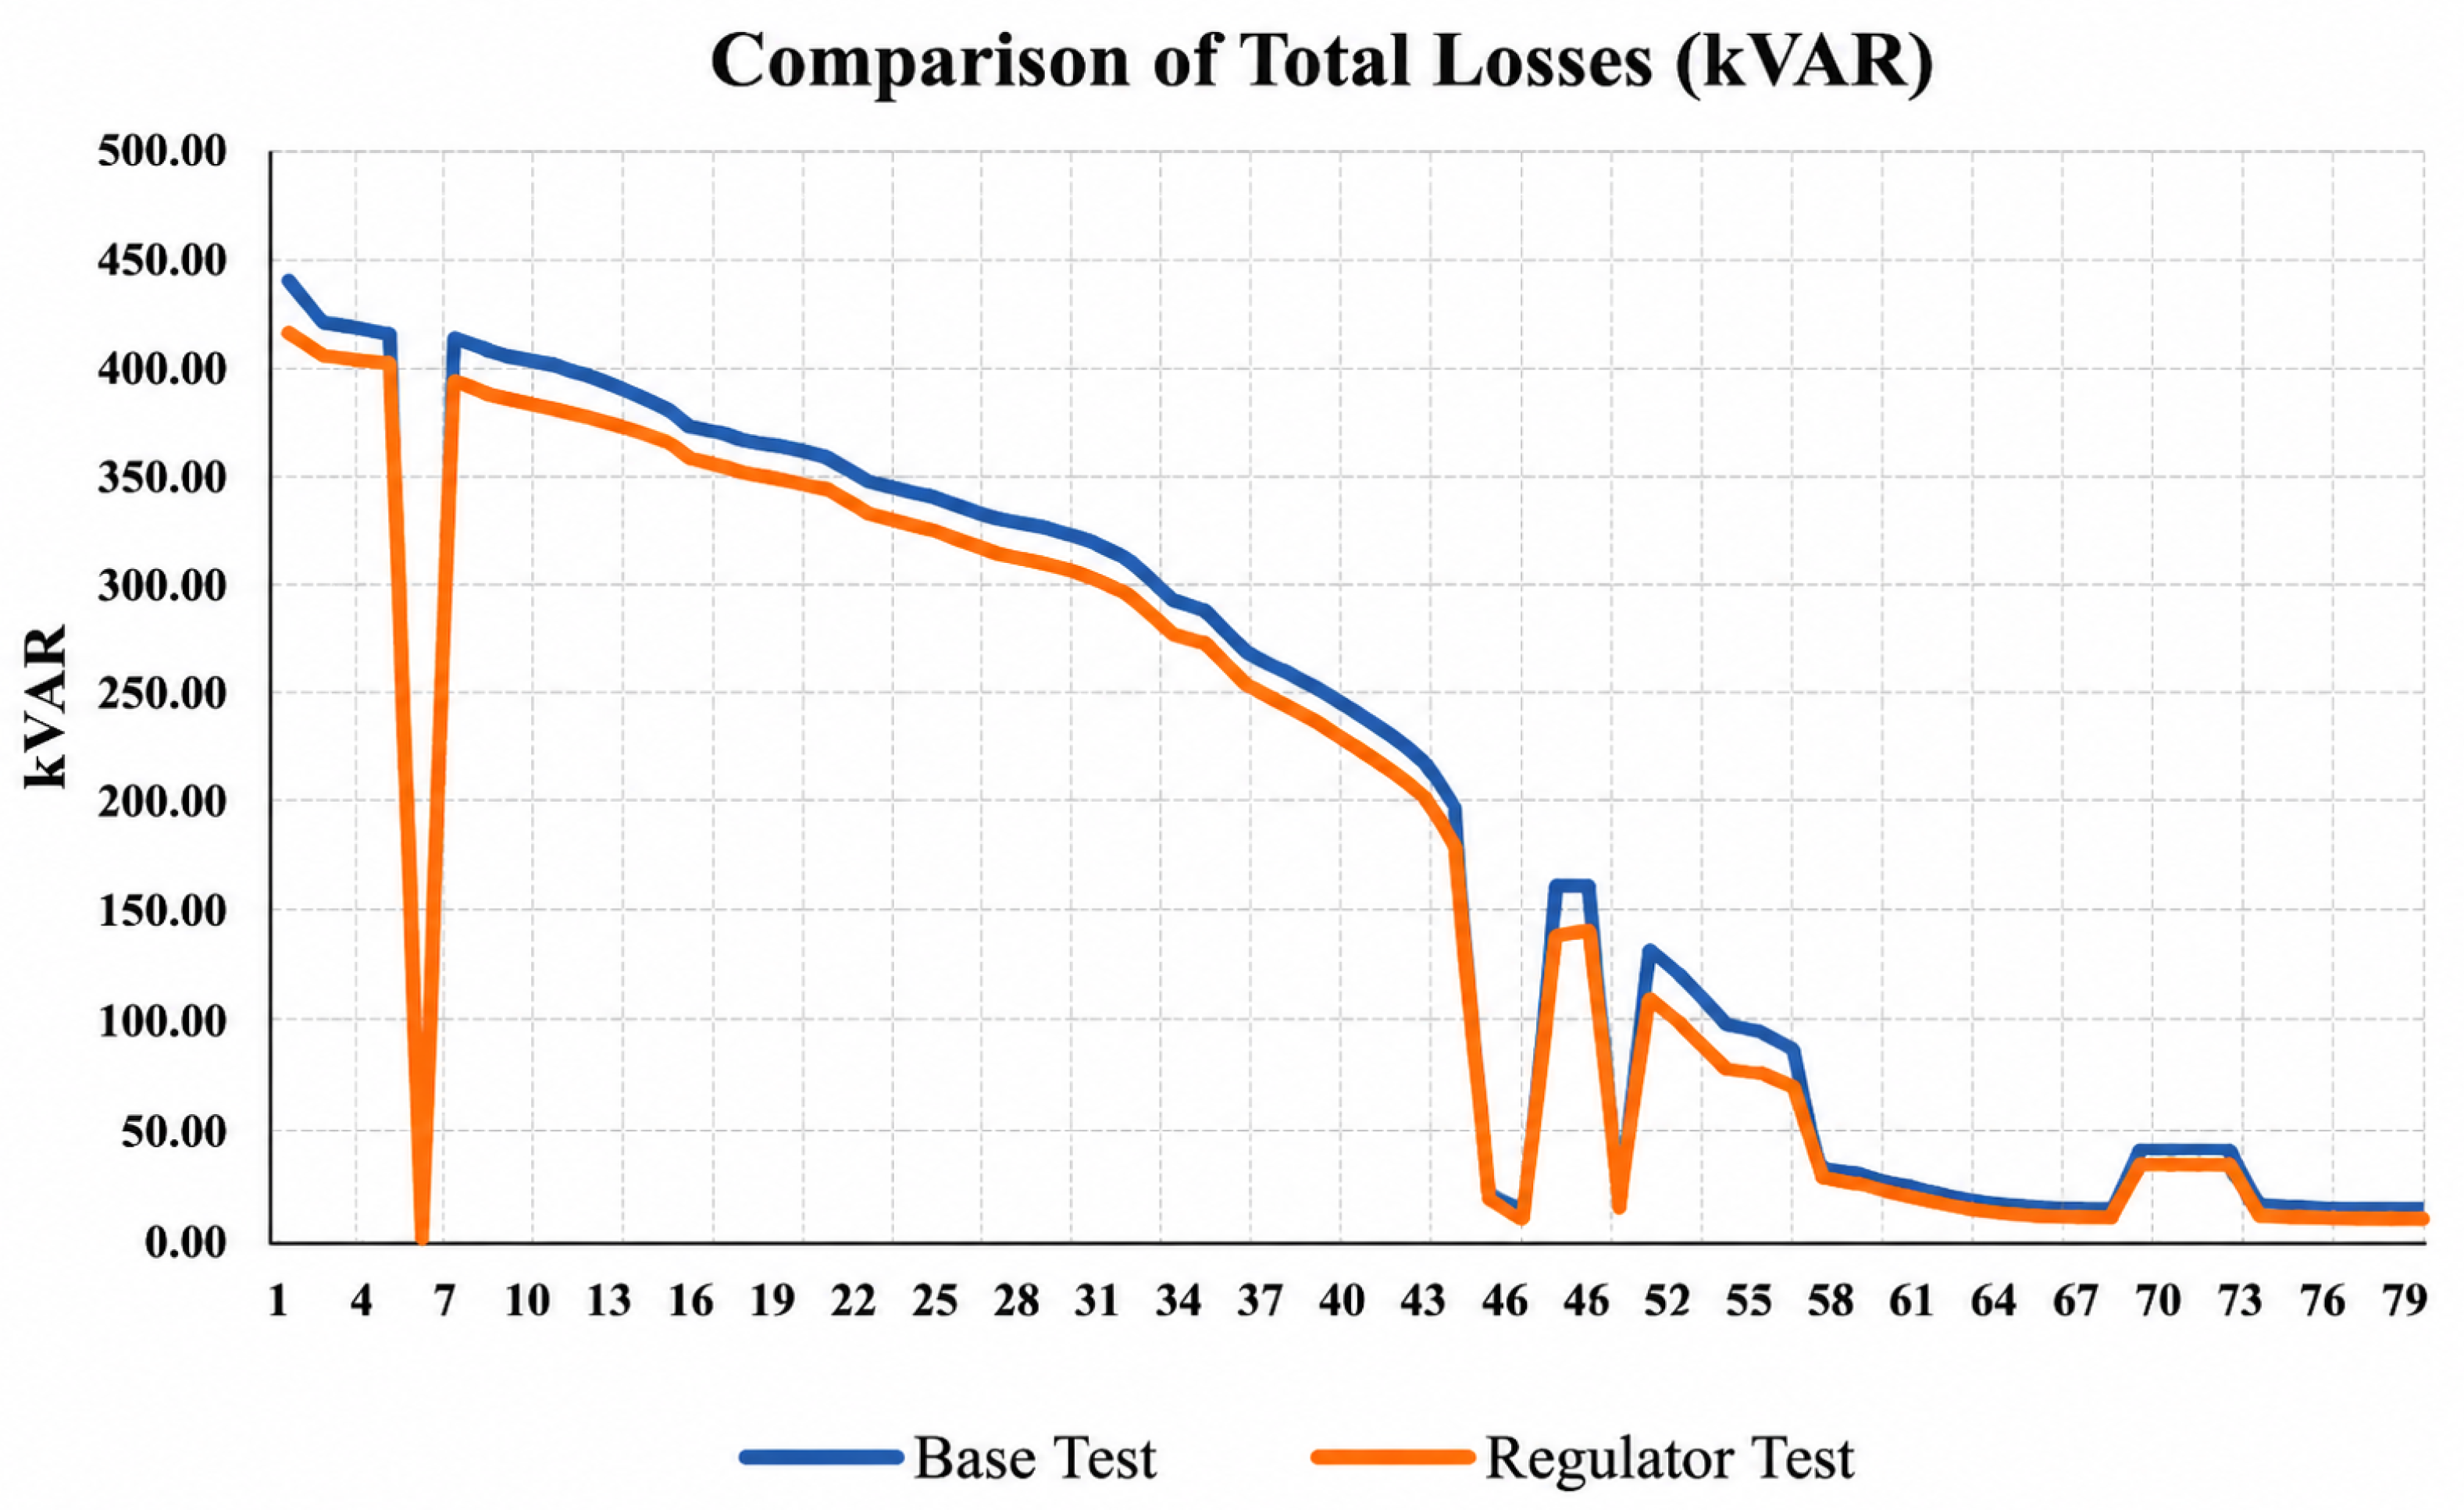
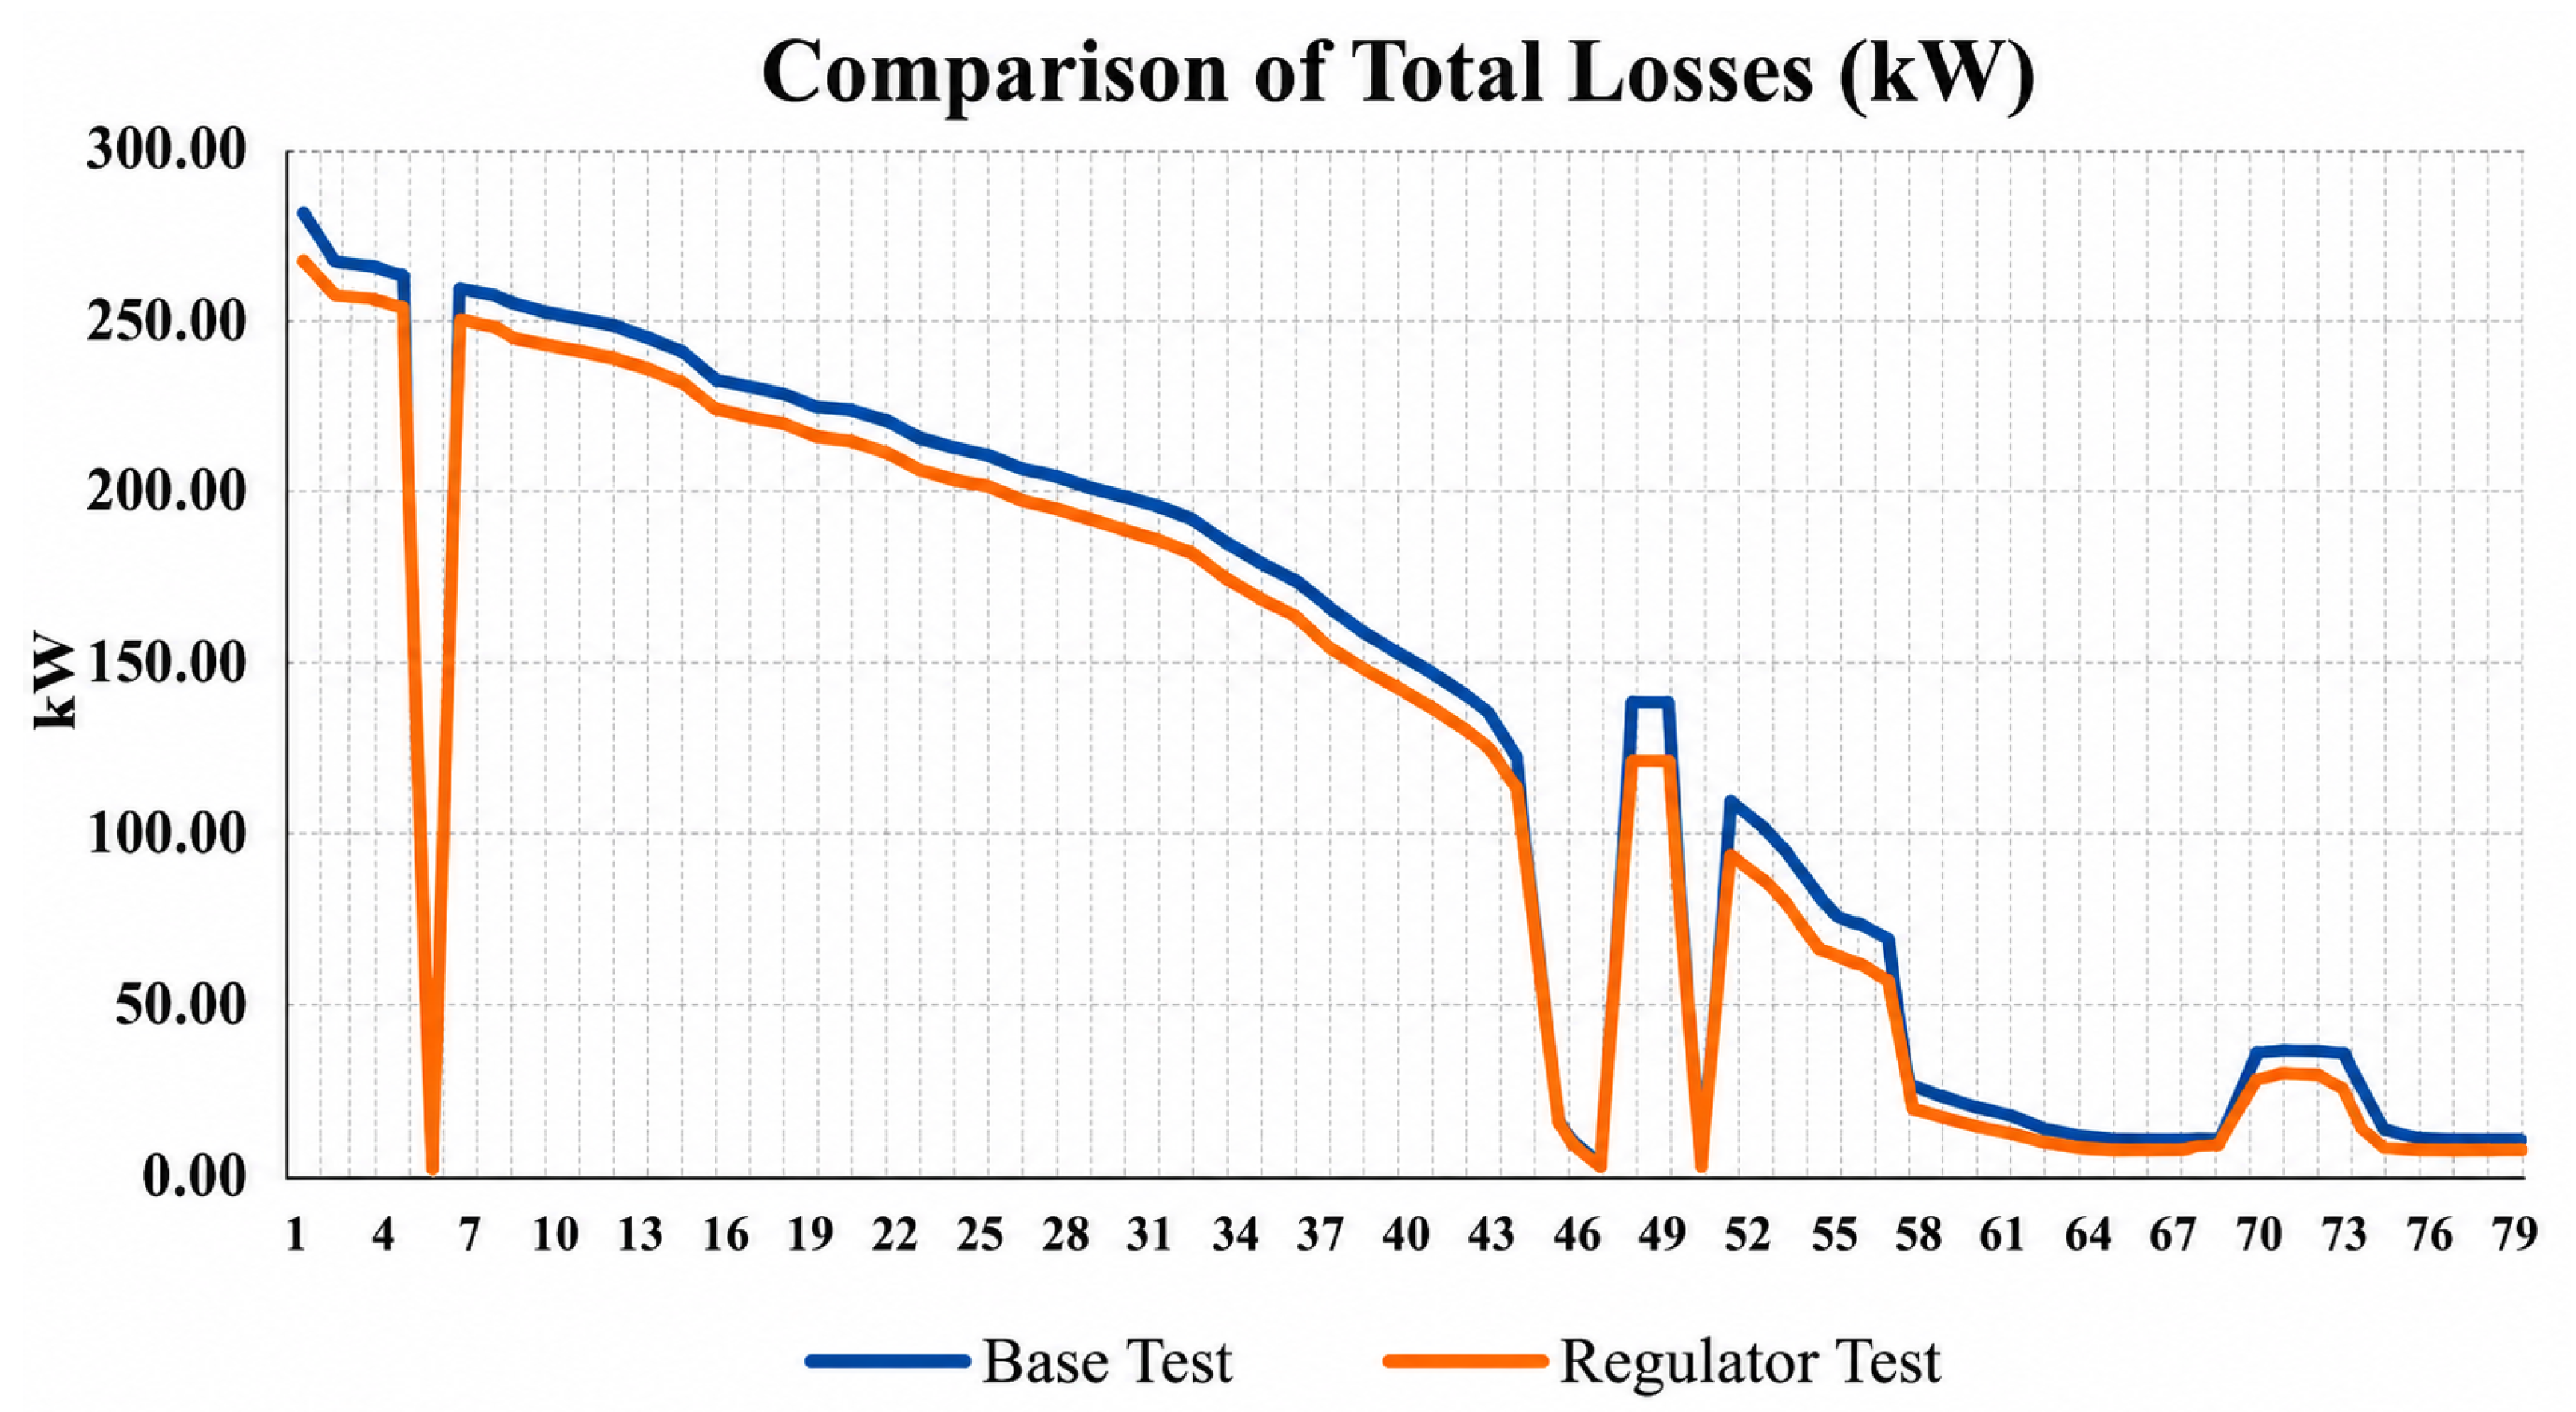
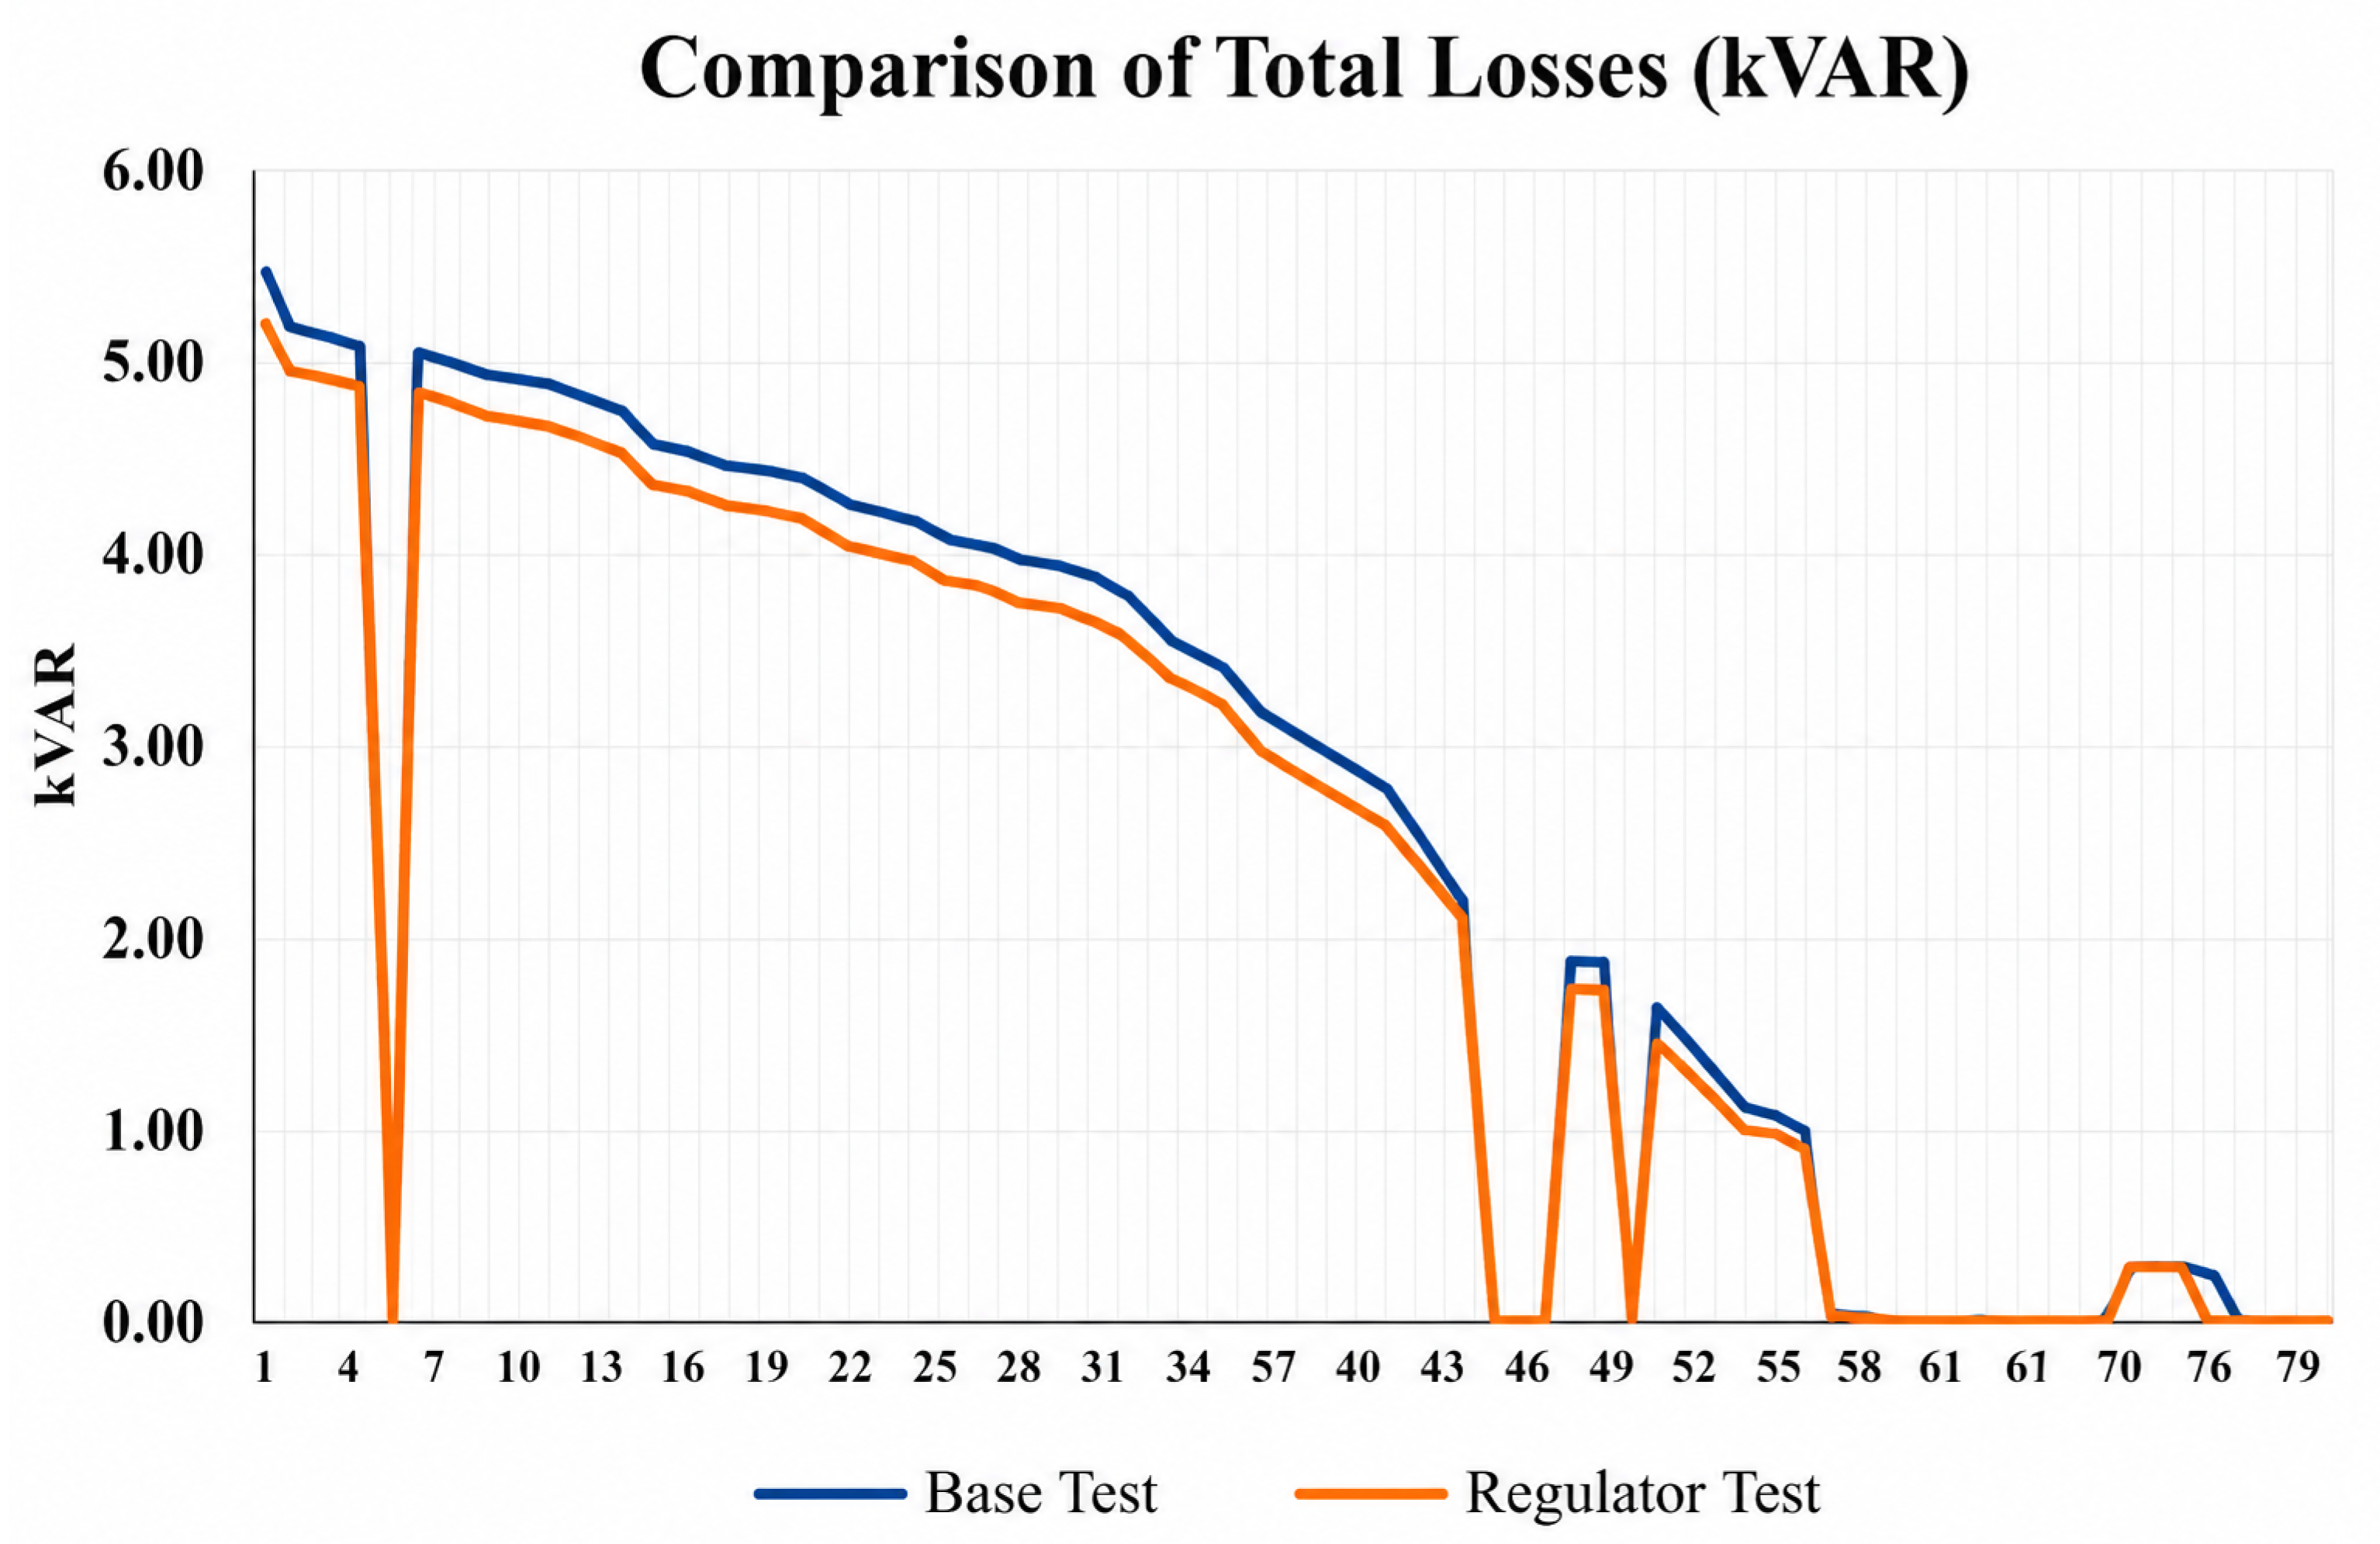
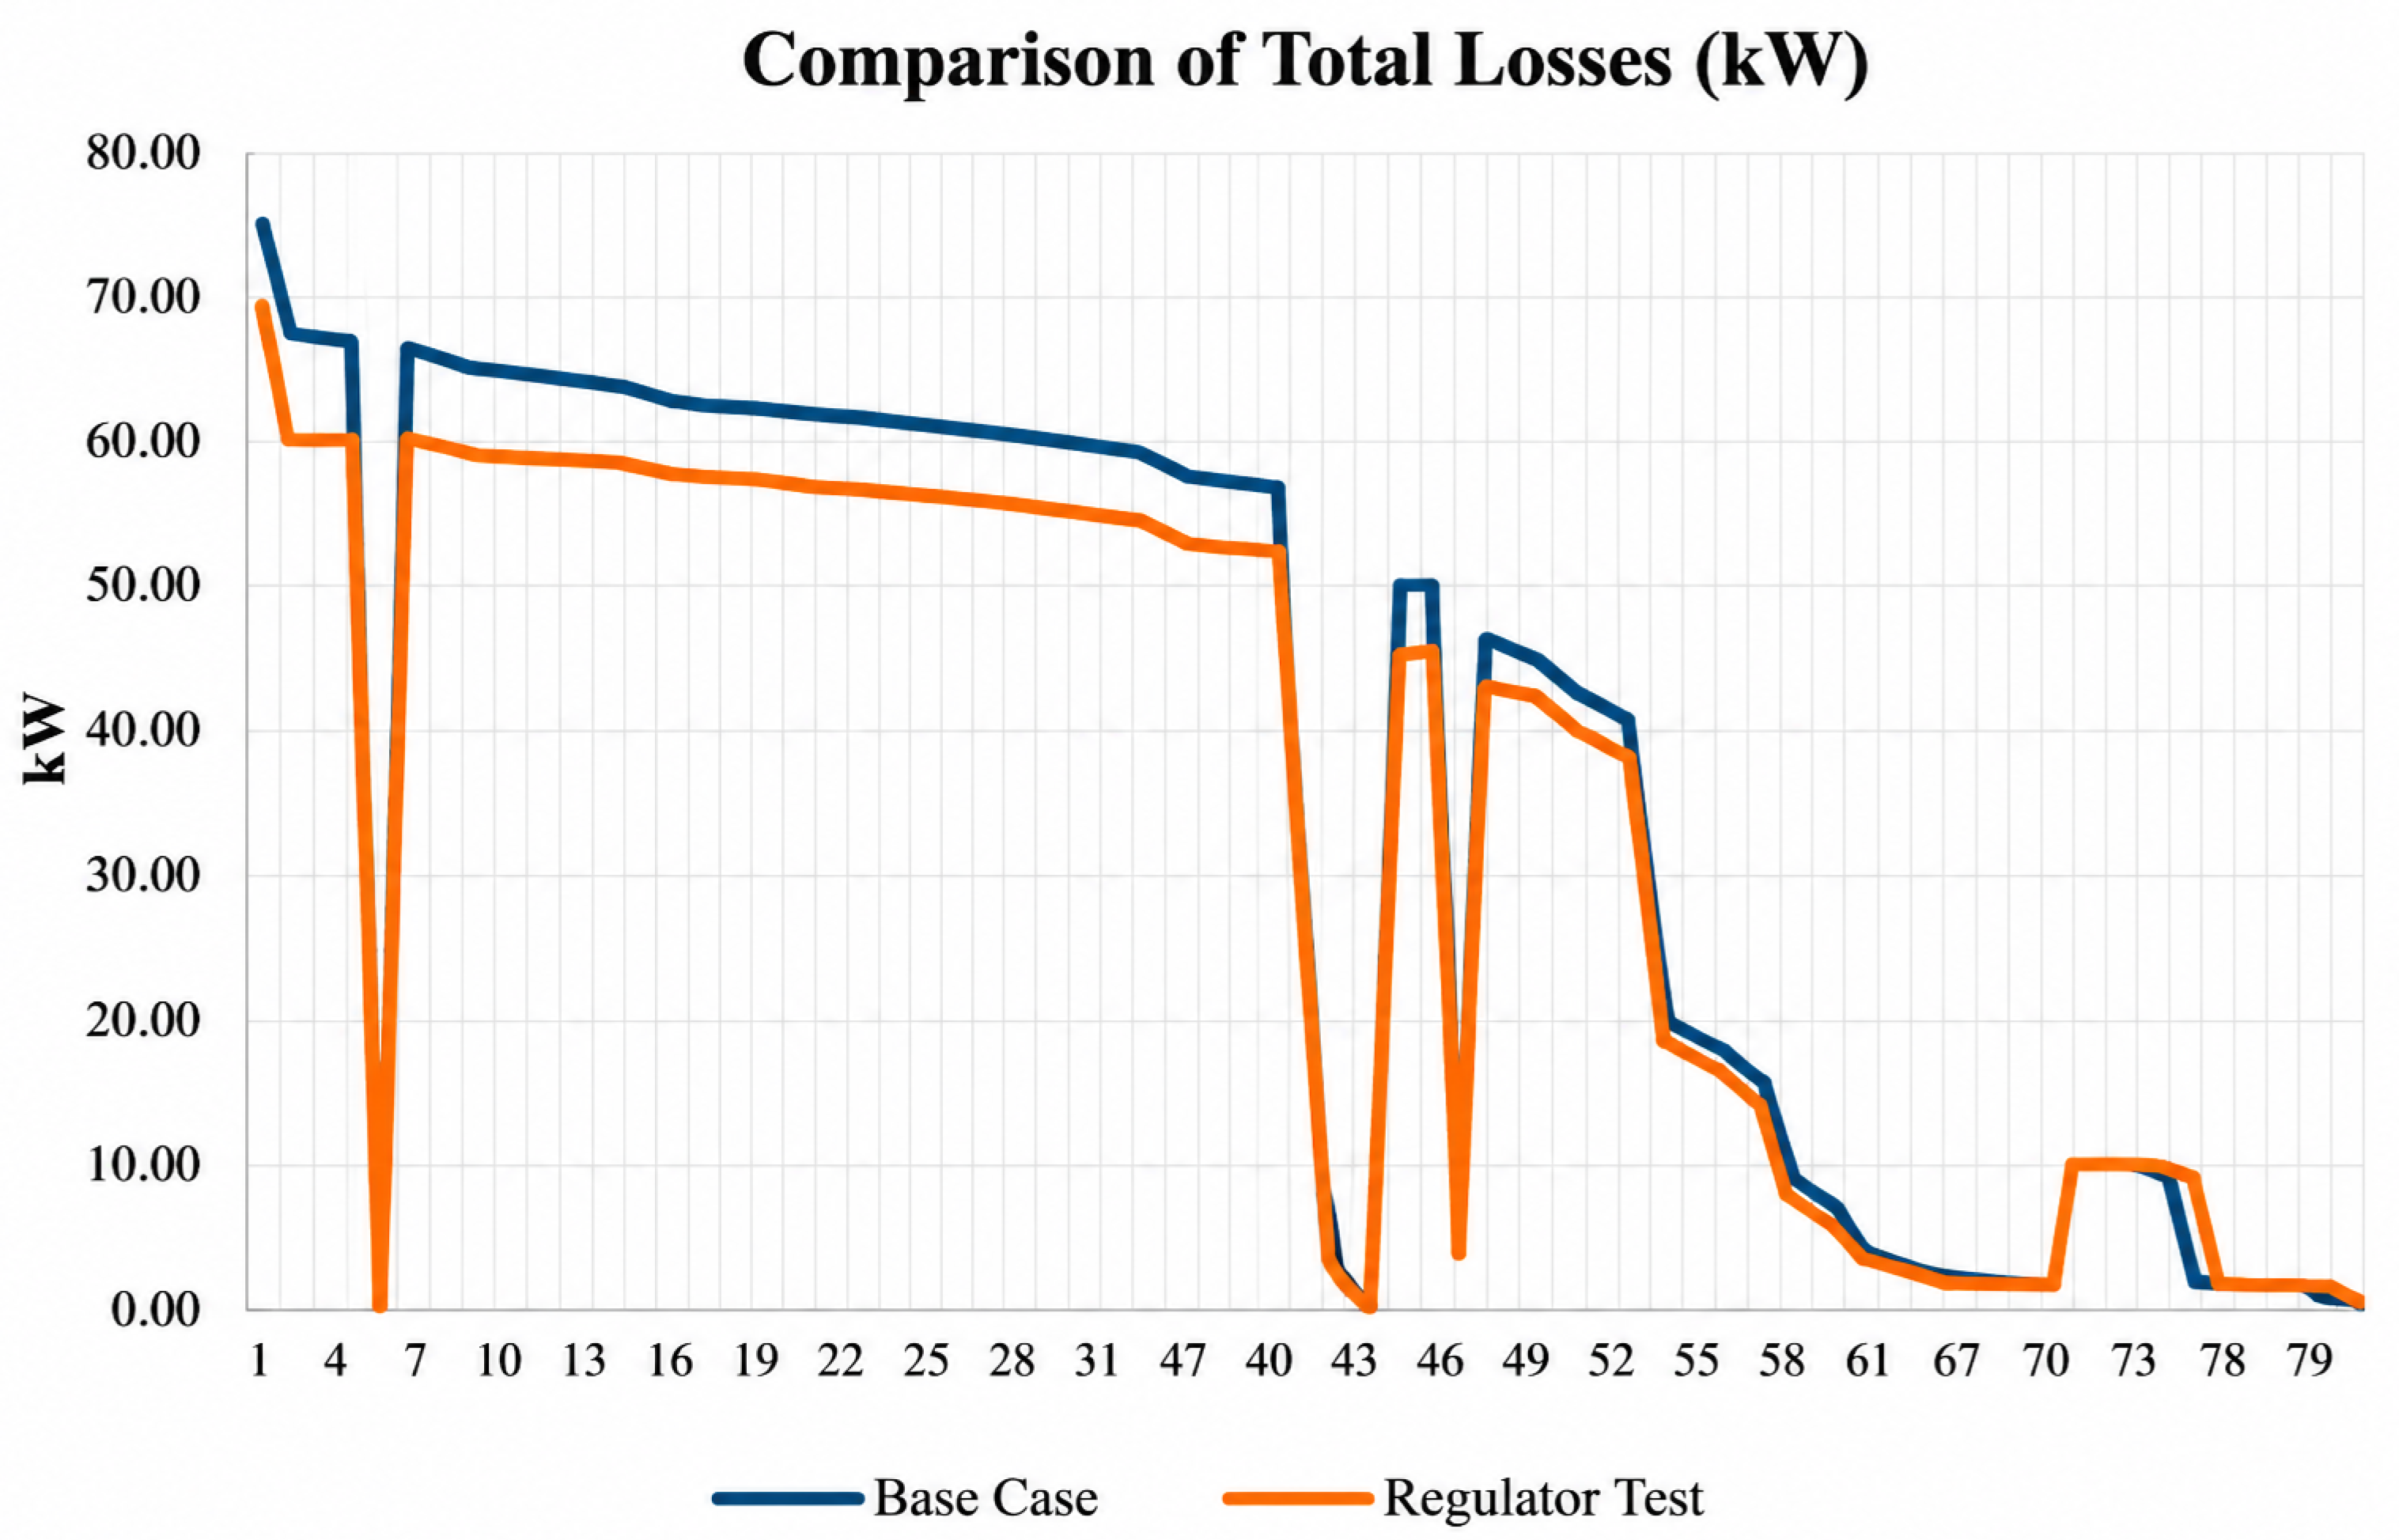
A similar comparison was performed for the main loss-related variables. Figure 21 and Figure 22 compare the reactive and active loss profiles, respectively, between the base case and the solution obtained with the regulator. In both figures, the regulated case exhibits systematically lower values than the base case over a significant portion of the feeder, which confirms that the selected regulator location not only improves voltage conditions but also contributes to a more efficient electrical operation.
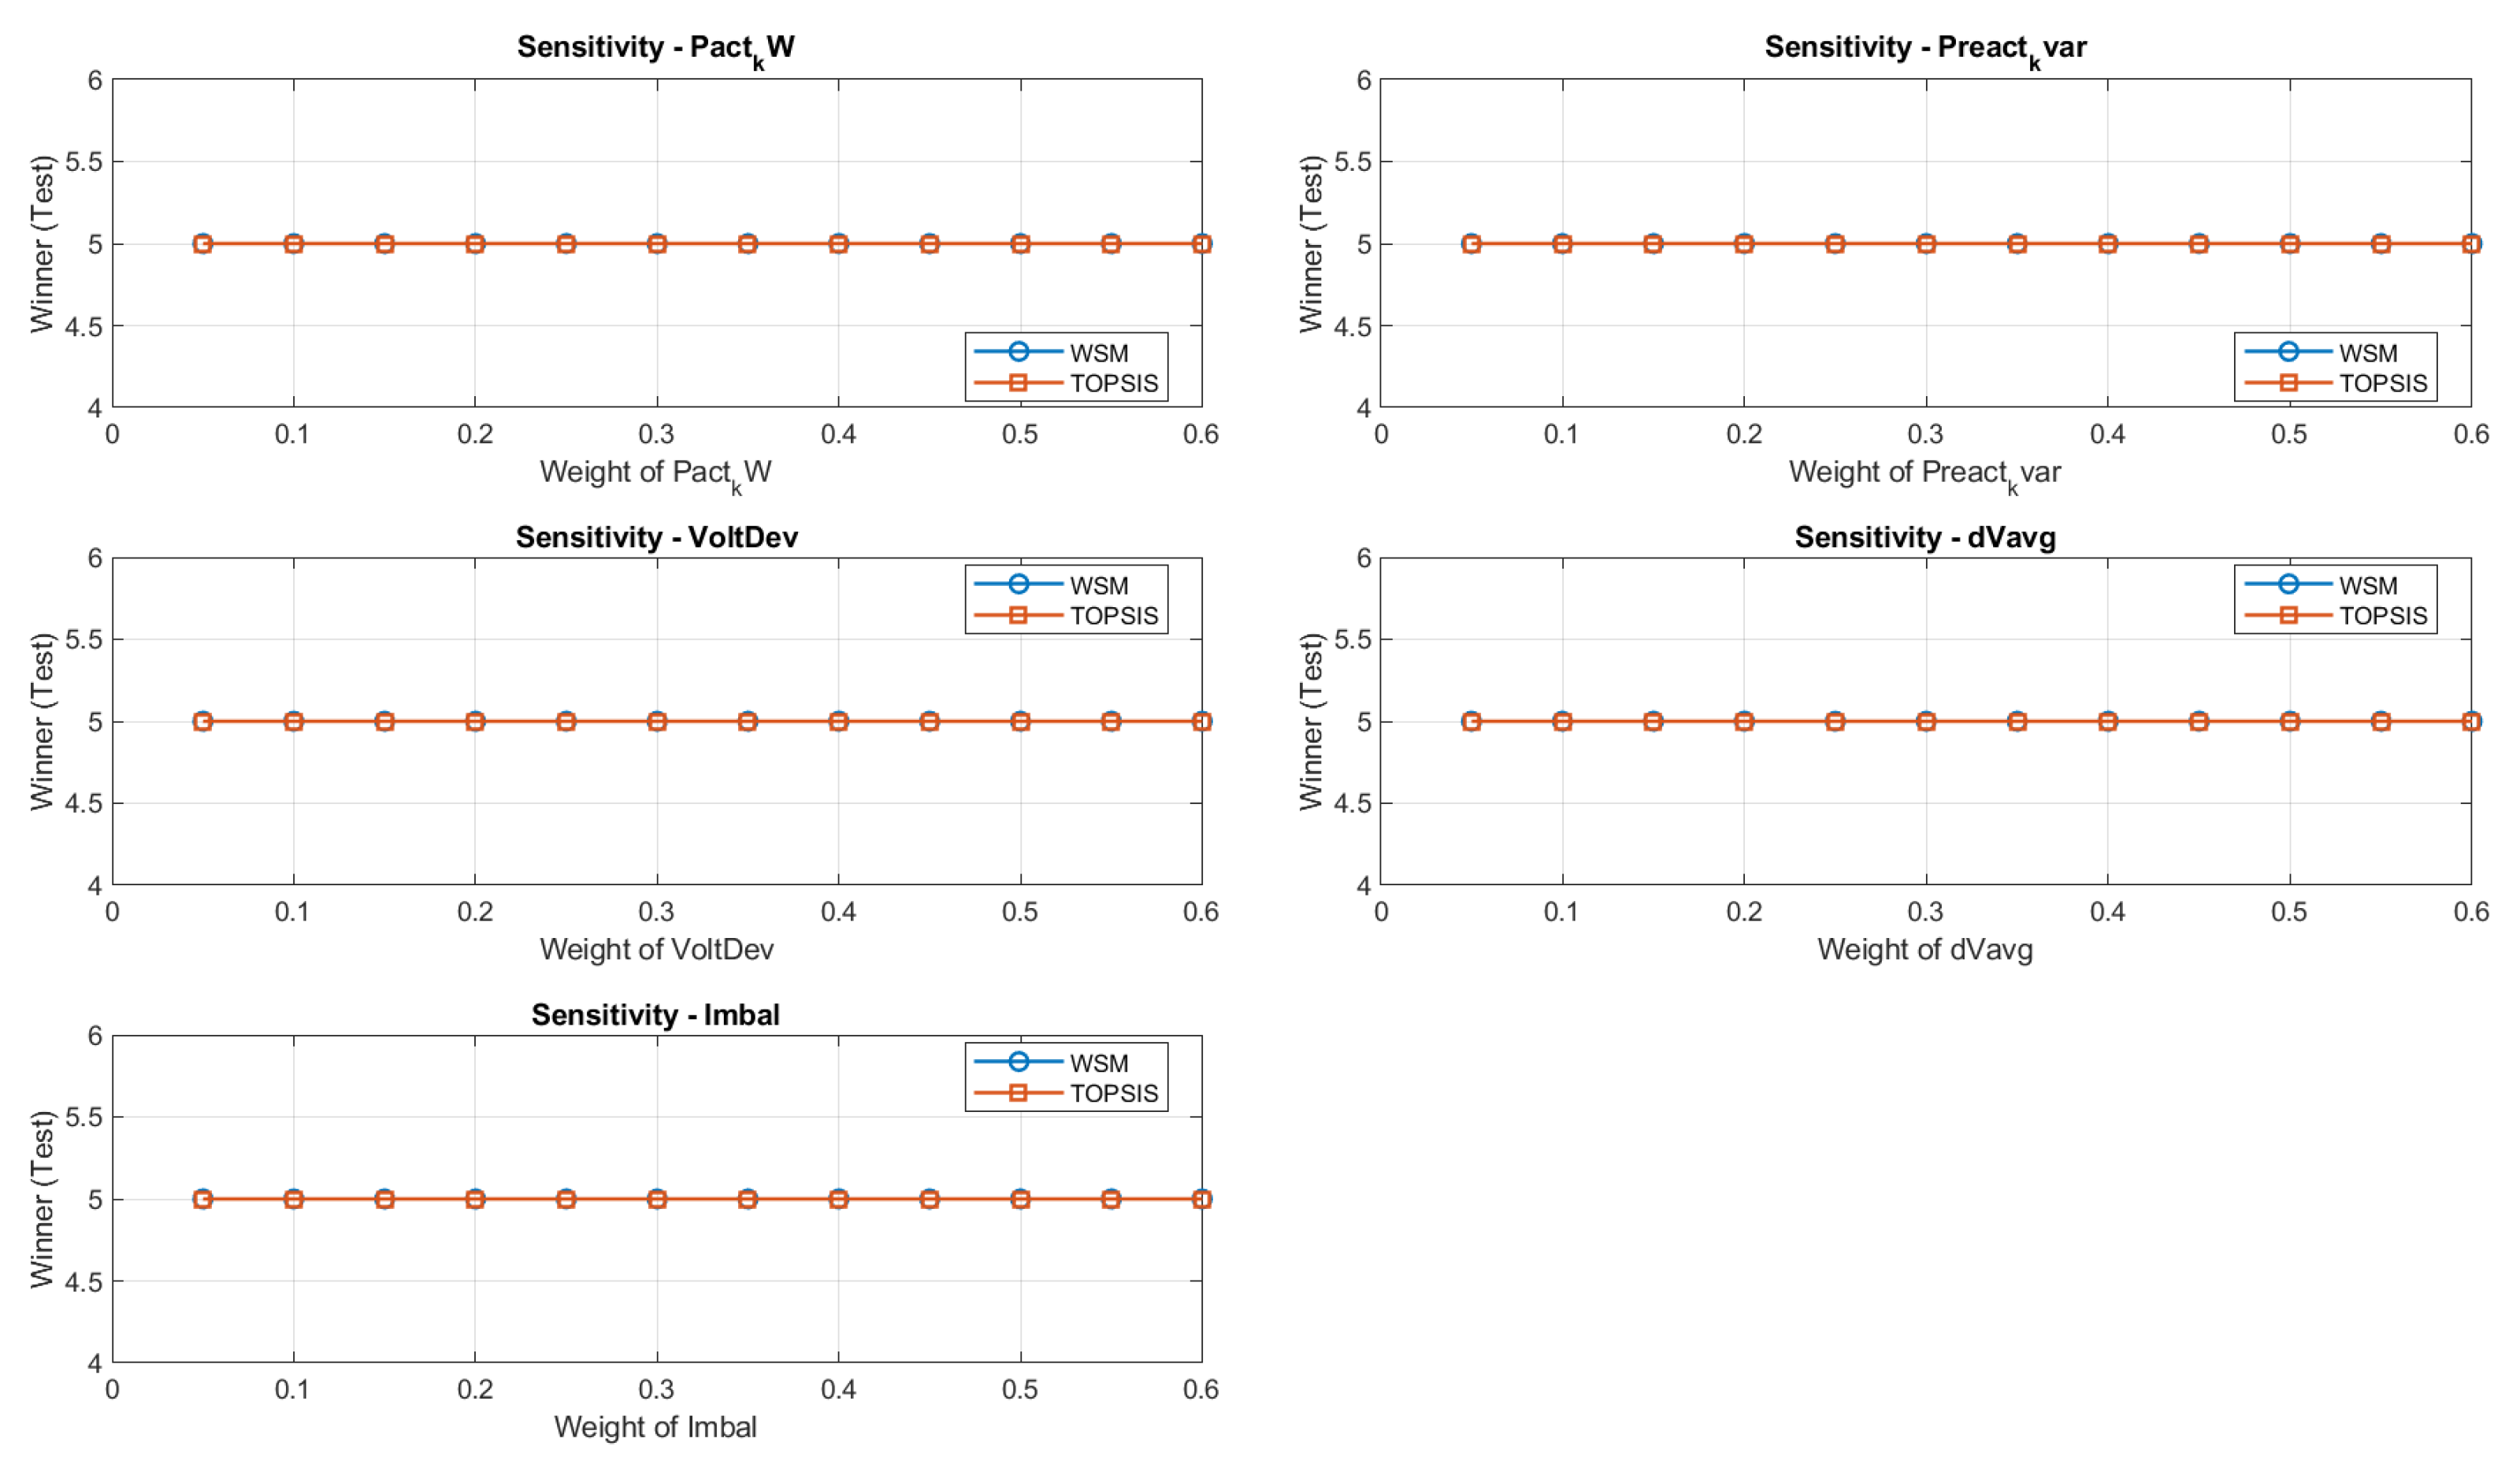
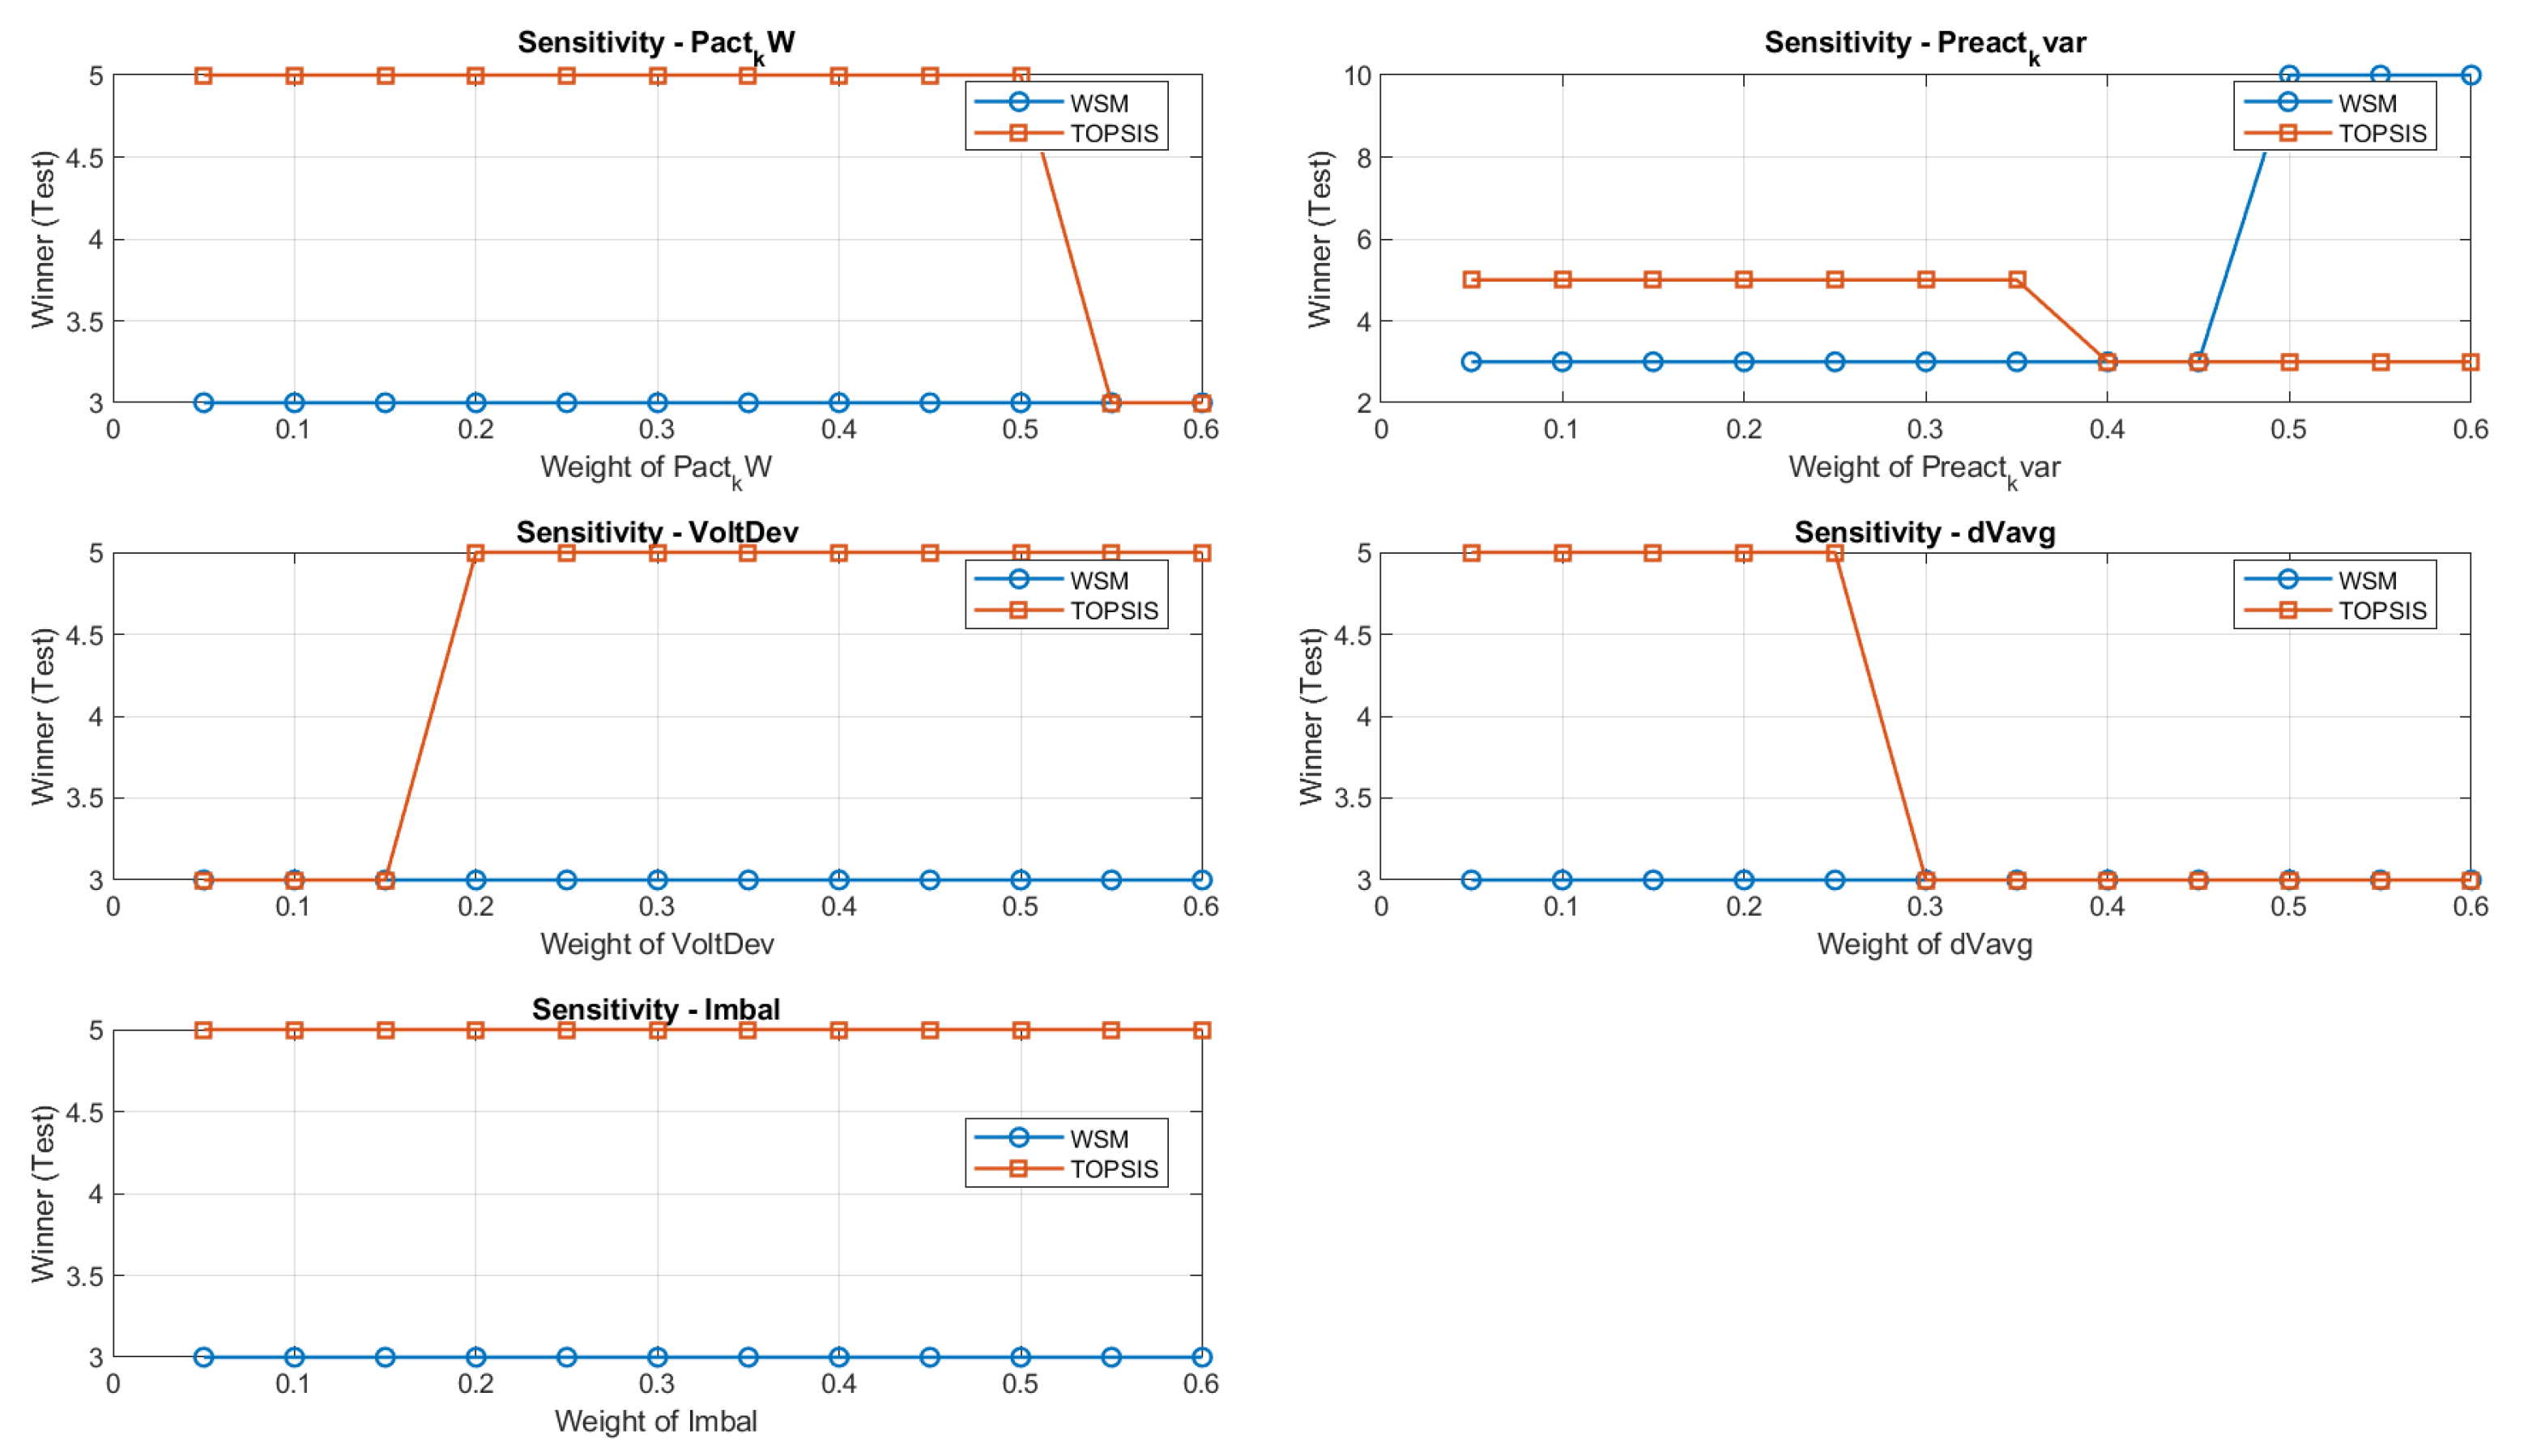
The robustness of the maximum-load solution was further assessed through a sensitivity analysis based on systematic variations in the criterion weights. The resulting behavior is presented in Figure 23. It is important to emphasize that, for the maximum-demand scenario, both the WSM and TOPSIS converged consistently to the same winning alternative throughout the entire range of weight perturbations considered in the analysis. Specifically, the preferred solution remained permanently associated with node 5 for all tested weighting configurations and for all evaluated criteria. Consequently, the graphical concentration of the results at node 5 should not be interpreted as a trivial or uninformative outcome; rather, it constitutes strong evidence that the selected location is structurally stable within the decision space. From a methodological standpoint, this means that the optimal placement identified under maximum load is not sensitive to moderate changes in decision-maker preferences and does not depend on a particular weighting arrangement. Instead, the persistent convergence of both multi-criteria methods to node 5 demonstrates that this alternative dominates the remaining candidates under the most critical operating condition of the feeder, thereby reinforcing its technical validity as the most robust regulator location.
A corresponding comparison was also performed for the minimum-load scenario. The numerical results are summarized in Table 17, which compares the base case against the winning alternatives obtained from the WSM and TOPSIS. In this case, both methods again improve the feeder performance relative to the base case, although they do not select the same winning alternative. Specifically, the base-case average voltage variation decreases from 0.42% to 0.02%, while the average per-unit voltage magnitude increases from 0.965 p.u. to 1.012 p.u. The active and reactive losses are also reduced in both winning scenarios, showing that both regulator placements are technically beneficial under minimum-load operation.
The degree of agreement between the WSM and TOPSIS rankings for the minimum-load scenario is illustrated in Figure 24. Unlike the maximum-load case, the scatter plot reveals a noticeably larger dispersion among the ranked alternatives, with only the first few positions showing strong similarity. This behavior explains why the WSM and TOPSIS identify different winning nodes under light-load operation and indicates that, in this operating regime, the ranking is more sensitive to the specific aggregation logic of each decision method.
The effect of regulator installation on the voltage profile under minimum load is shown in Figure 25. The figure compares the total voltage variation in the base case and the regulated case, confirming that the selected regulator placement substantially improves the voltage profile even when the feeder is operating far below peak demand.
The corresponding comparisons for reactive and active losses are shown in Figure 26 and Figure 27, respectively. These figures indicate that the regulator also improves feeder efficiency under light-load conditions, although the relative differences between the base and regulated cases are smaller than those observed under maximum load, which is consistent with the lower current levels and reduced loss magnitude of the minimum-load operating condition.
The sensitivity analysis for the minimum-load scenario is presented in Figure 28. In contrast to the maximum-load condition, the minimum-load case exhibits a more differentiated behavior between methods. The WSM consistently converges to solution 3 under all tested weighting variations, indicating a stable preference for that alternative. TOPSIS, however, exhibits variations in the preferred solution when the weights of active losses, reactive losses, voltage deviation, and percentage voltage variation are modified, alternating in some cases between solutions 5 and 3. This result indicates that, under minimum load, the relative ranking is more sensitive to the criterion-weight configuration, especially for TOPSIS.
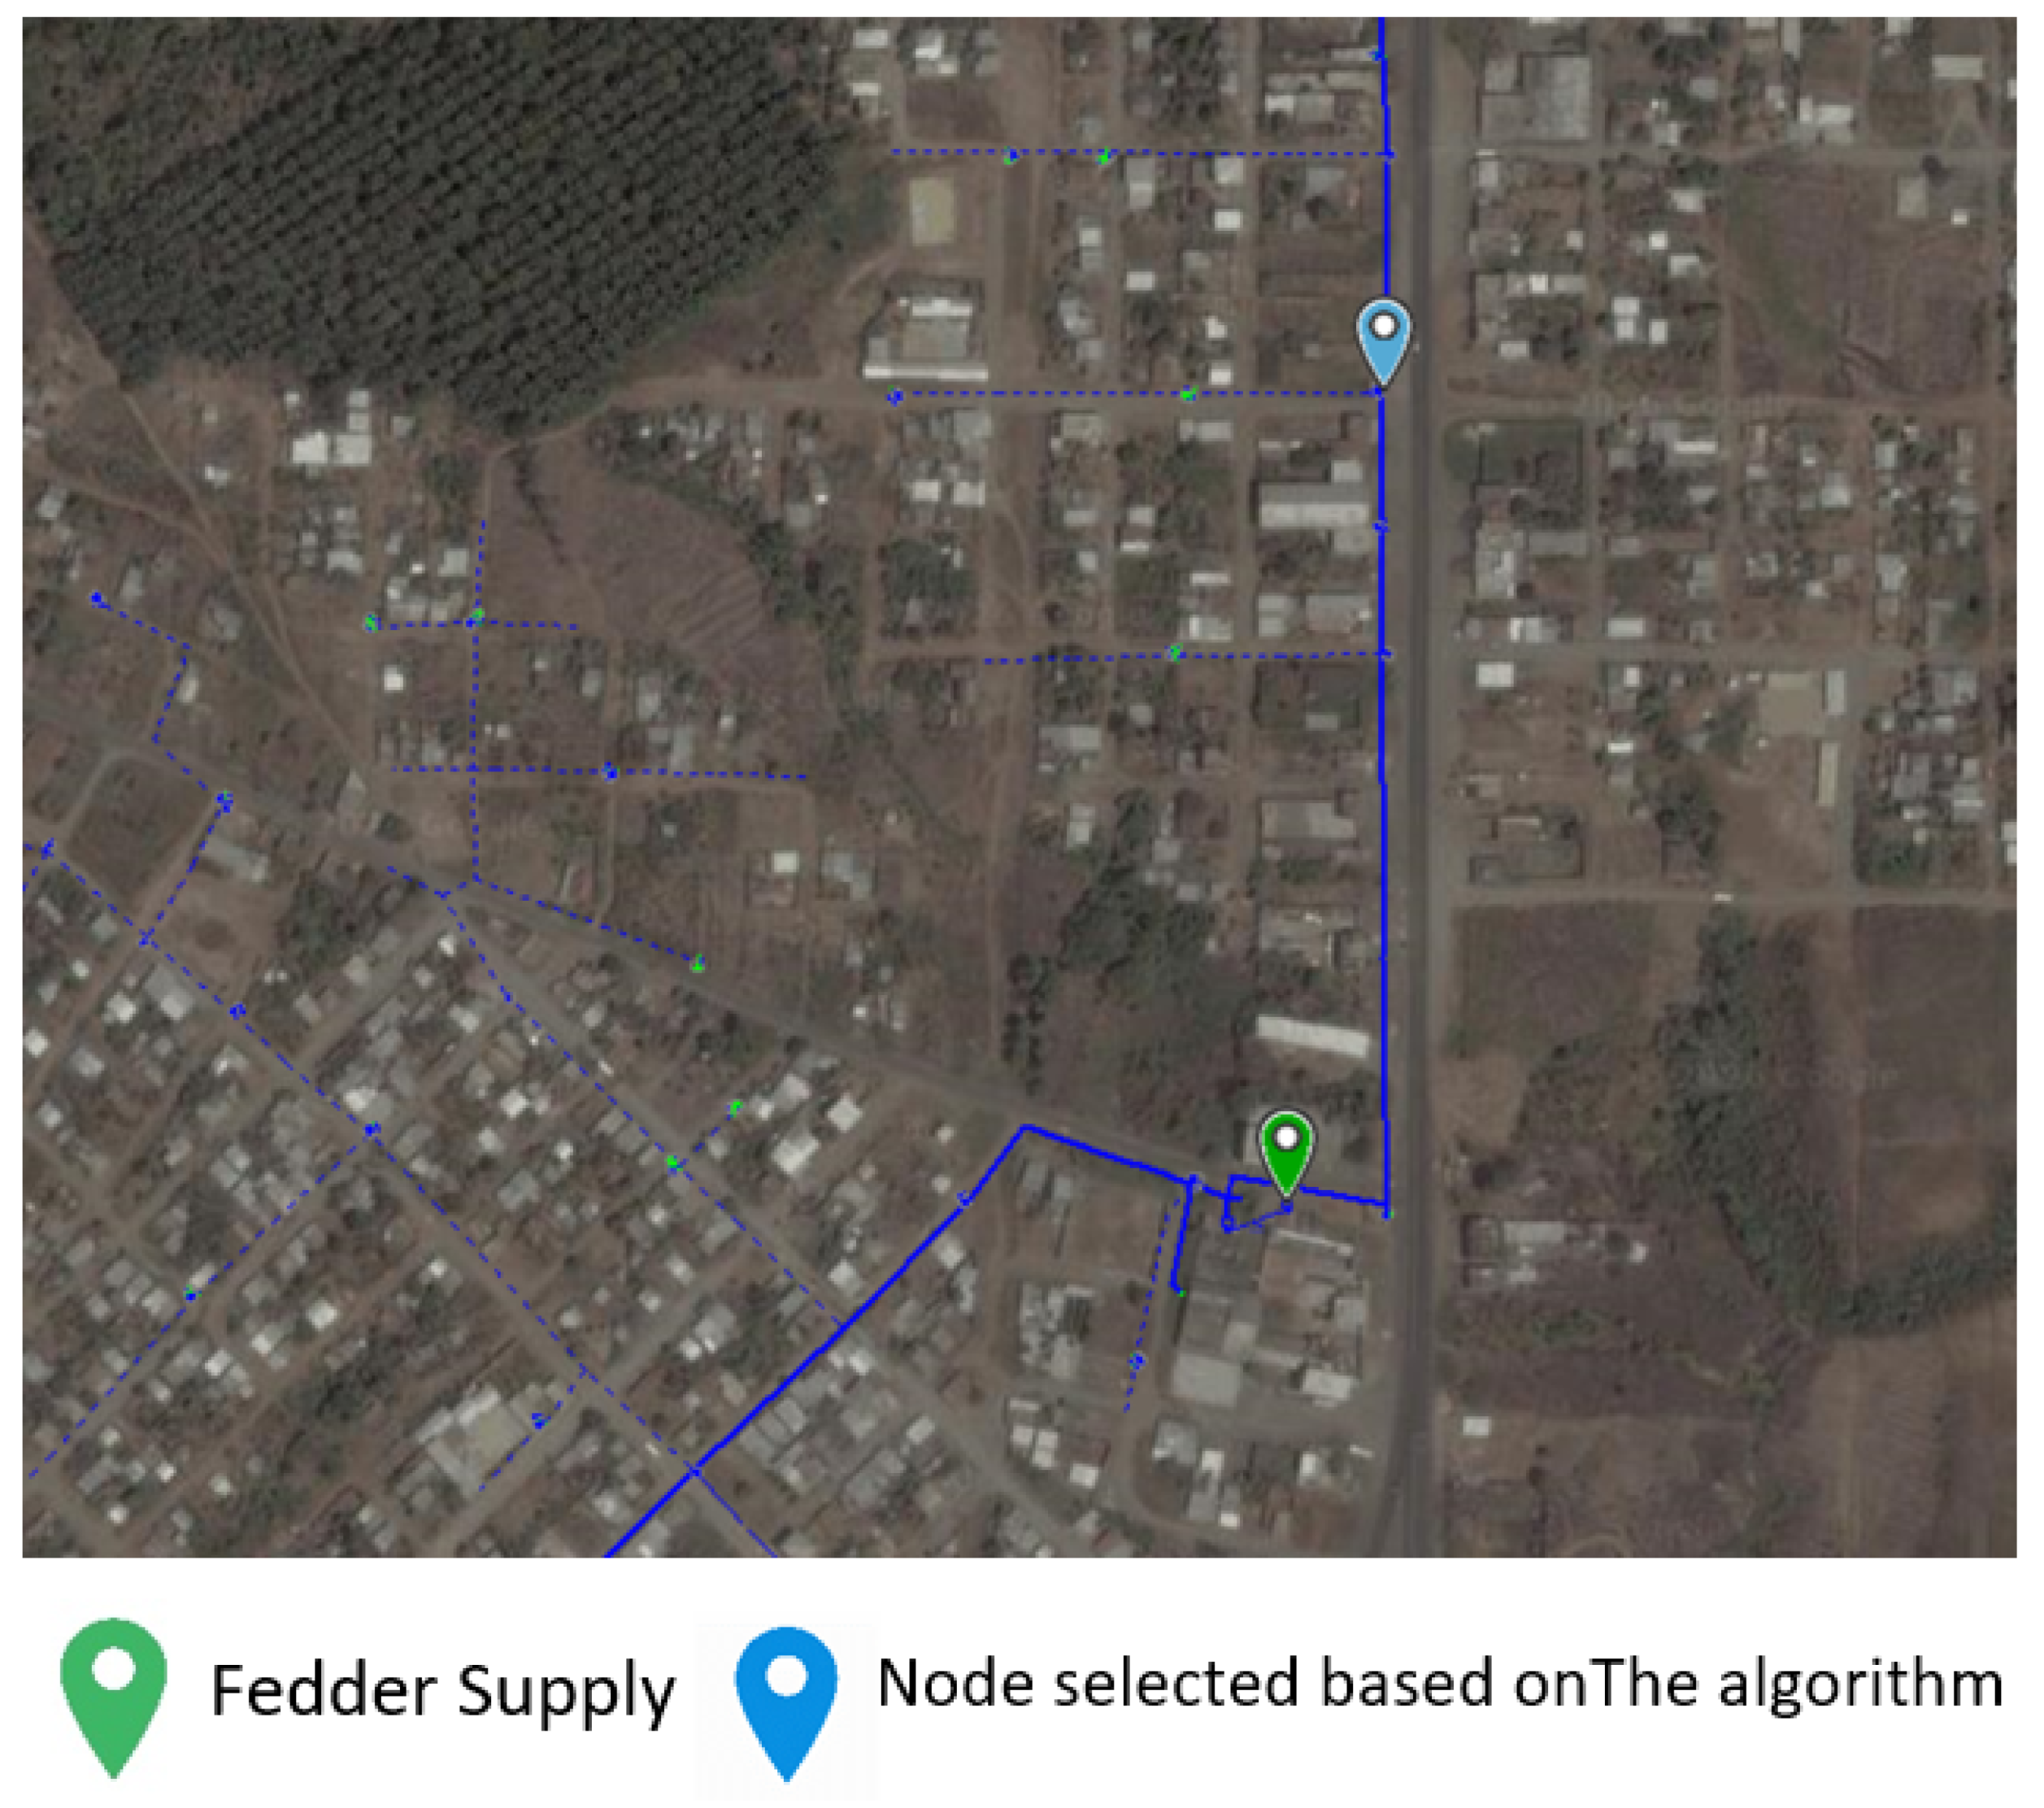
Finally, after jointly examining the two operating conditions, the comparative rankings, and the sensitivity analyses, the regulator location associated with node 5 emerges as the most robust overall solution for the analyzed feeder. Although alternative solutions may appear under specific weighting configurations and under minimum-load operation, the majority of the evaluated cases, particularly those corresponding to the most critical operating condition, converge to node 5 as the preferred location. This final result is illustrated in Figure 29, which identifies the optimal voltage-regulator placement derived from the proposed methodology.

3.4. Discussion of Results

The results obtained under maximum- and minimum-load operating conditions make it possible to identify consistent electrical behavior patterns in the analyzed feeder and, at the same time, validate the technical soundness of the implemented model. From a system-level perspective, the proposed framework proved capable of capturing the most relevant variations in feeder performance associated with demand level, regulator placement, and the weighting structure of the multi-criteria decision process. This is particularly important because the regulator-placement problem cannot be interpreted solely as a local voltage-correction task; rather, it must be understood as a planning problem involving simultaneous trade-offs among voltage quality, electrical efficiency, and operating robustness.
Under maximum-load conditions, the feeder exhibited the most critical electrical behavior, as expected. In this scenario, active and reactive power losses increased substantially, and the most severe conditions were concentrated around node MTA S 466866, which carries the highest current levels due to its position within the feeder and the amount of downstream demand it must supply. This behavior is physically coherent with the structure of radial distribution networks, where upstream sections tend to concentrate the cumulative current demanded by downstream loads and therefore experience the highest loss levels. Although the installation of a voltage regulator at or near such critical regions improves the downstream voltage profile, it does not necessarily eliminate total losses at the point of connection, since losses are fundamentally related to current magnitude and branch impedance distribution throughout the feeder.
By contrast, the minimum-load scenario exhibited a significant reduction in electrical losses, reaching values notably lower than those observed at maximum demand. Under these conditions, the feeder voltage profile remained closer to acceptable operating limits, and the electrical stress imposed on the network was considerably smaller. Consequently, the relative differences among candidate alternatives became less pronounced, which explains why the ranking dispersion between methods increased in the low-demand scenario. Even in this operating regime, however, node MTA S 466866 remained the location associated with the highest loss magnitude, confirming its dominant role in the feeder energy transfer process and reinforcing the validity of the simulated load-flow behavior.
A particularly relevant outcome of the comparative analysis is that the regulator placement at node MTS 108932, which emerged as the most robust overall alternative, is technically justified because it maximizes corrective capability precisely under the most demanding operating condition. This is a crucial planning criterion. In maximum-load operation, voltage regulation is substantially more challenging because the larger current flow causes more severe voltage drops and higher losses. Therefore, the value of a candidate regulator location should not be assessed only by its behavior under light-load conditions, but by its capacity to ensure technically reliable operation under the most stressed feeder state. From this perspective, node MTS 108932 provides the strongest overall response, especially when system performance under peak demand is prioritized, while still preserving satisfactory performance under minimum load.
The multi-criteria formulation adopted in this study was essential for reaching this conclusion. The regulator-placement problem is intrinsically multi-objective, since improvements in one indicator do not necessarily imply proportional improvements in all others. By jointly considering voltage deviation, voltage unbalance, active losses, and reactive losses, the proposed framework avoids the oversimplification that would arise from a single-criterion selection. In this context, the combined use of the WSM and TOPSIS strengthens the technical credibility of the decision process, because both methods evaluate the same solution space from different aggregation logics. The WSM performs a direct weighted aggregation of normalized criteria, whereas TOPSIS evaluates the proximity of each alternative to the ideal and anti-ideal solutions. The agreement between both methods in the maximum-load scenario therefore constitutes strong evidence that the selected solution is not an artifact of a specific ranking formulation.
The divergence observed under minimum-load conditions, where the WSM favored node 3 and TOPSIS favored node 5, should not be interpreted as a weakness of the methodology. On the contrary, it reflects the physical and decision-theoretic reality of the problem. When the feeder operates under light load, the technical differences among the best alternatives become smaller, and the relative ranking becomes more sensitive to the mathematical structure of the multi-criteria method and to the adopted weighting scheme. In such cases, it is reasonable for two robust decision methods to produce different, yet technically close, winning alternatives. What is relevant is that both methods consistently identified a very similar subset of top-performing nodes, which indicates that the feasible decision space is well characterized and that the final recommendation is not arbitrary.
This observation connects directly with the justification for using exhaustive search. In many optimization studies on distribution systems, computational efficiency is treated as a primary objective, which motivates the use of heuristics or metaheuristics. However, the present study addresses a planning problem, not an online operational-control problem. Consequently, computational time is not the dominant constraint. In planning applications, the primary requirement is to guarantee that the adopted solution is globally optimal within the feasible search space and that no technically superior alternative has been omitted due to stochastic convergence, premature stopping, or local-optimum trapping. Under this rationale, exhaustive search is particularly appropriate, because it evaluates all feasible alternatives explicitly and therefore guarantees the optimal solution over the candidate set. This advantage is especially meaningful when the number of feasible alternatives remains computationally manageable, as in the present case.
From a methodological standpoint, this exact-search strategy provides a stronger basis for technical decision-making than reduced-space or purely heuristic approaches when the objective is long-term planning. In other words, for problems such as voltage regulator placement in a real feeder, the relevant question is not whether the optimal solution can be obtained a few seconds faster, but whether the selected location can be defended as the best possible technical decision under the adopted assumptions and available network information. The present results support precisely that type of conclusion. The exhaustive-search framework guaranteed full exploration of the feasible regulator-location space, while the multi-criteria stage ensured that the final selection accounted simultaneously for voltage quality, loss reduction, and operating balance.
The sensitivity analysis further reinforces this interpretation. Under maximum load, both the WSM and TOPSIS converged repeatedly to node 5 despite changes in the criterion weights, demonstrating that the preferred solution is structurally stable under variations in decision-maker preference. This is a strong indicator of robustness, because it shows that the selected location is not the result of a narrowly tuned weighting configuration. Under minimum load, the WSM remained stable at solution 3, whereas TOPSIS alternated mainly between solutions 5 and 3 as the weights of active losses, reactive losses, voltage deviation, and percentage voltage variation were modified. Even in this case, however, the analysis remains favorable to node 5 from a planning standpoint, because it continues to appear among the dominant solutions and is the most consistently strong alternative when both loading extremes are considered together.
Therefore, the final selection should not be based solely on the isolated outcome of a single low-demand ranking, but rather on the overall robustness of the candidate solution across the full range of relevant operating conditions. This is the key argument that supports the final decision of selecting node MTS 108932 as the optimal regulator location for the analyzed feeder. Although node 3 performs competitively under minimum load and is even ranked first by the WSM in that specific scenario, node 5 presents the strongest and most defensible global behavior when the feeder is evaluated under both demand extremes, when both decision methods are considered jointly, and when ranking stability under weight perturbations is taken into account. In planning terms, this makes node 5 the most technically reliable alternative.
The obtained results are also consistent with previous studies reported in the literature. The work presented in [6], which analyzes a real feeder in DIgSILENT for optimal voltage-regulator placement, likewise shows that strategically located nodes along the main feeder trunk exert the greatest influence on downstream voltage improvement and loss reduction. Similarly, the study in [11], which combines on-load tap-changing transformers and exhaustive search in an IEEE test system, confirms that complete exploration of the search space allows the identification of configurations that produce global performance improvements. This is fully consistent with the robustness observed here for node MTS 108932 under the WSM and TOPSIS.
In turn, the work reported in [12], where genetic algorithms are applied to mitigate low-voltage problems in medium-voltage networks in Ecuador, demonstrates that optimization-based approaches are capable of satisfying regulatory and technical requirements in real distribution environments. Although that study uses a metaheuristic approach and the present work employs exhaustive search, both contributions support the same fundamental conclusion: systematic optimization methods provide a substantially more reliable basis for decision-making than traditional heuristic selection. Likewise, the study in [25], which uses mixed-integer linear programming (MILP), highlights the importance of mathematical optimization models for obtaining technically justified solutions. In this sense, the present work contributes complementary evidence showing that exact-search methods, when computationally feasible, remain highly valuable in planning problems because of their guarantee of global optimality.
Overall, the present study demonstrates that the combination of detailed feeder simulation in CYME, exhaustive evaluation of feasible alternatives, and multi-criteria ranking provides stable and technically meaningful solutions even under variations in the decision weights. This reinforces the reliability of the adopted framework and supports its applicability to real distribution-system planning problems. More importantly, the results show that the final regulator-placement decision should be based not merely on isolated numerical superiority in a single scenario, but on the overall strength, consistency, and robustness of the alternative across different operating conditions. Under this criterion, node MTS 108932 constitutes the most technically justified and operationally robust solution for the Guayacanes feeder.


4. Conclusions

This study presented a multi-criteria exhaustive-search framework for the optimal placement of a voltage regulator in the Guayacanes feeder of the Buena Fe substation under representative operating conditions of an Ecuadorian radial distribution system. The proposed methodology combined detailed feeder modeling in CYME, exhaustive evaluation of feasible regulator locations, and two complementary multi-criteria decision-making techniques, namely the WSM and TOPSIS, in order to identify technically robust regulator-placement alternatives.
The obtained results demonstrated that the proposed framework effectively improves feeder operating conditions through the simultaneous reduction in active and reactive losses, mitigation of voltage deviations, improvement of voltage profiles, and preservation of phase balance. In contrast to metaheuristic approaches such as Genetic Algorithms (GAs) and Particle Swarm Optimization (PSO), which may converge to locally optimal solutions depending on parameter initialization and tuning, the implemented exhaustive-search strategy guarantees the identification of the globally optimal solution within the evaluated search space. Furthermore, unlike Mixed-Integer Linear Programming (MILP) formulations that may require model simplifications or linear approximations of electrical behavior, the proposed methodology preserves the nonlinear feeder representation directly through detailed CYME simulations. Consequently, the proposed framework provides a transparent, traceable, and technically interpretable alternative for voltage-regulator placement in medium-voltage radial distribution systems.
From a scientific perspective, this work addresses the research gap associated with the integration of exhaustive-search techniques and multi-criteria ranking methods for voltage-regulator placement in real medium-voltage radial distribution feeders. The study contributes a technically interpretable and utility-oriented planning methodology in which the candidate-location space, weighting structure, evaluation criteria, and ranking procedures are explicitly formulated and traceable.
The proposed methodology can also be extended to other distribution-system configurations and voltage-regulation technologies, including feeders with distributed generation, smart inverter support, reactive compensation devices, on-load tap-changing transformers, and stochastic operating scenarios. Future work should therefore incorporate probabilistic load modeling, time-varying demand conditions, techno-economic optimization, and uncertainty-aware planning frameworks in order to further strengthen the applicability of the proposed approach in modern active distribution networks.

Author Contributions

Conceptualization, I.R.P., K.P. and A.A.T.; Methodology, I.R.P., K.P. and A.A.T.; Software, I.R.P. and K.P.; Validation, A.A.T.; Formal analysis, I.R.P., K.P. and A.A.T.; Investigation, I.R.P., K.P. and A.A.T.; Resources, I.R.P. and K.P.; Data curation, I.R.P. and K.P.; Writing—original draft, I.R.P., K.P. and A.A.T.; Writing—review & editing, A.A.T.; Visualization, A.A.T.; Supervision, A.A.T.; Project administration, A.A.T. All authors have read and agreed to the published version of the manuscript.

Funding

This research received no external funding.

Data Availability Statement

The data used to support the findings of this study were obtained from the electrical modeling and simulation environment developed in CYME for the Guayacanes feeder of the Buena Fe substation. The processed datasets generated during the exhaustive-search evaluation and multi-criteria ranking stages are available from the corresponding authors upon reasonable request. The methodological framework, mathematical formulation, evaluation criteria, and optimization procedures have been fully described in the manuscript to facilitate traceability and independent methodological interpretation of the proposed approach.

Conflicts of Interest

The authors declare no conflicts of interest.

References

  1. Nivia, D.; Salazar, G.; Montoya, O. Selección óptima de conductores en redes de distribución trifásicas utilizando el algoritmo metaheurístico de Newton. Ingeniería 2022, 27, e201. [Google Scholar] [CrossRef] [Scilit]
  2. Izci, D.; Ekinci, S.; Zeynelgil, H.L. Controlling an automatic voltage regulator using a novel Harris hawks and simulated annealing optimization technique. Adv. Control Appl. 2023, 6, e121. [Google Scholar] [CrossRef] [Scilit]
  3. Zhan, S.; Paterakis, N.G.; van den Akker, W.F.; van der Molen, A.; Morren, J.; Slootweg, J.H. Stable Distributed Online Feedback Optimization for Distribution System Voltage Regulation. arXiv 2024, arXiv:2405.02487. [Google Scholar] [CrossRef] [Scilit]
  4. Liu, Z.; Ding, W.; Chen, S.; Hu, R.; Shi, S. Grid-Side Current Harmonic Suppression and Power Factor Improvement Using q–Axis Damping Current Injection for PMSM Drives Without Electrolytic Capacitor. IEEE J. Emerg. Sel. Top. Power Electron. 2023, 11, 3371–3384. [Google Scholar] [CrossRef] [Scilit]
  5. Peñuela, A.; Moncada, N. Compensación de Potencia Reactiva en Redes de Distribución de Media Voltaje con Condensadores Conmutados por Tiristores Considerando Perfiles de Demanda Variable Mediante el Algoritmo de Búsqueda del Águila Calva; Universidad Distrital Francisco José de Caldas: Bogota, Columbia, 2024. [Google Scholar]
  6. Campos, L. Ubicación Óptima de Reguladores de Voltaje en el Alimentador MUY202 de la Empresa Electro Oriente S.A. Para Mejoramiento de Calidad de Servicio Utilizando Software DIGSILENT; Universidad Nacional Pedro Ruiz Gallo: Lambayque, Peru, 2025. [Google Scholar]
  7. Al Faiya, B.; Athanasiadis, D.; Chen, M.; McArthur, S.; Kockar, I.; Lu, H.; De Leon, F. A Self-Organizing Multi-Agent System for Distributed Voltage Regulation. arXiv 2022, arXiv:2202.00170. [Google Scholar] [CrossRef] [Scilit]
  8. Li, C.; Disfani, V.R.; Haghi, H.V.; Kleiss, J. Coordination of OLTC and Smart Inverters for Optimal Voltage Regulation of Unbalanced Distribution Networks. arXiv 2020, arXiv:2006.14382. [Google Scholar] [CrossRef] [Scilit]
  9. Boukherouaa, J. Enhanced Backward/Forward Sweep Load Flow Algorithm for Radial Distribution Systems. In Proceedings of the 2024 4th International Conference on Innovative Research in Applied Science, Engineering and Technology (IRASET), Fez, Morocco, 16–17 May 2024. [Google Scholar] [CrossRef] [Scilit]
  10. Muñoz, J.; Campaña, M. Ubicación óptima de sistemas de almacenamiento de energía en redes eléctricas de distribución georreferenciadas. Rev. I+D Tecnol. 2021, 17, 14–24. [Google Scholar] [CrossRef] [Scilit]
  11. Herrera, A. Mejoramiento de los Perfiles de Voltaje en Sistemas de Distribución Mediante Óptima Ubicación de los Reguladores de Voltaje con Cambiadores de Derivación Usando Búsqueda Exhaustiva; Universidad Politécnica Salesiana: Chenca, Ecuador, 2021. [Google Scholar]
  12. Carreño, C.; Avilés, J. Localización óptima de equipos de regulación de voltaje y compensación de Reactivos para Alimentadores de Medio Voltaje, Mediante Algoritmos Evolutivos. Rev. INGENIO 2022, 5, 43–59. [Google Scholar] [CrossRef] [Scilit]
  13. Cachumuel, A. Ubicación Óptima de Dispositivos de Compensación Reactiva para la Mejora del Perfil de Voltaje y Reducción de Pérdidas en el Sistema Eléctrico de Potencia Utilizando Técnicas de Clusterización; Universidad Politécnica Salesiana: Chenca, Ecuador, 2023. [Google Scholar]
  14. Garrido, C.; Águila, A. Ubicación Óptima de Dispositivos Svc Considerando el Indicador de Estabilidad de Voltaje Lineal (Lvsi) para Mejorar el Margen de Estabilidad de Voltaje en Sistemas de Transmisión; Universidad Politécnica Salesiana: Chenca, Ecuador, 2022. [Google Scholar]
  15. Ruiz, R.; Cáceres, N.; Chaparro, E. Reconfiguración Óptima de Sistemas Eléctricos de Distribución Radiales Utilizando Algoritmo Beta-Radial Combinado con Bloques Lineales. In Proceedings of the XIV Seminario del Sector Eléctrico Paraguayo, Asunción, Paraguay, 23–24 June 2022. [Google Scholar]
  16. Crespo, G.; Pérez, I. Exploración científica de los algoritmos evolutivos en la reconfiguración óptima de redes de distribución eléctrica. Rev. Univ. Soc. 2022, 14, 303–319. [Google Scholar]
  17. Moutis, P.; Georgilakis, P.S.; Hatziargyriou, N.D. Voltage Regulation Support Along a Distribution Line by a Virtual Power Plant Based on a Center of Mass Load Modeling. arXiv 2021, arXiv:2105.06092. [Google Scholar] [CrossRef] [Scilit]
  18. Buitrago, N. Reconfiguracion Optima de Redes de Distribucion a Traves de un Algoritmo Heurstico de Busqueda Exhaustiva Implementado en el Software MATLAB; Universidad Distrital Francisco José de Caldas: Bogota, Columbia, 2022. [Google Scholar]
  19. Xu, L.; Wu, W.; Zhao, W. Airgap Magnetic Field Harmonic Synergetic Optimization Approach for Power Factor Improvement of PM Vernier Machines. IEEE Trans. Ind. Electron. 2022, 69, 12281–12291. [Google Scholar] [CrossRef] [Scilit]
  20. Hidrobo, M. Ubicación Óptima del Convertidor Modular Multinivel (Mmc) para la Mejora del Perfil de Voltaje en Líneas de Transmisión Considerando el Algoritmo de Búsqueda Exhaustiva; Universidad Politécnica Salesiana: Chenca, Ecuador, 2022. [Google Scholar]
  21. Amaya, L.; Campaña, M. Diseño óptimo de redes eléctricas de distribución mediante modelos de optimización. Ing. Compet. 2022, 25, 1. [Google Scholar] [CrossRef] [Scilit]
  22. Cárdenas, D.; Chávez, C.; Layedra, N. Estabilidad de Voltaje en Redes de Distribución Eléctrica Monofásicas de Medio Voltaje, Aplicando Reguladores Quick Drive Tap en Estado Estable. Rev. INGENIO 2021, 4, 17–26. [Google Scholar] [CrossRef] [Scilit]
  23. Legña, J. Mitigación del Desequilibrio de Voltaje en Redes Eléctricas de Distribución Mediante la Ubicación de Restauradores Dinámicos de Voltaje; Universidad Politécnica Salesiana: Chenca, Ecuador, 2025. [Google Scholar]
  24. Addisua, M.; Olalekan, A.; Takele, H. Fuzzy logic based optimal placement of voltage regulators and capacitors for distribution systems efficiency improvement. Heliyon 2024, 7, e07848. [Google Scholar] [CrossRef] [Scilit] [PubMed]
  25. Gallego Pareja, L.; López-Lezama, J.; Gómez Carmona, O. Optimal Feeder Reconfiguration and Placement of Voltage Regulators in Electrical Distribution Networks Using a Linear Mathematical Model. Sustainability 2023, 15, 854. [Google Scholar] [CrossRef] [Scilit]
  26. Godoy, J.C.; Cajo, R.; Mesa Estrada, L.; Hamacher, T. Multi-criteria analysis for energy planning in Ecuador: Enhancing decision-making through comprehensive evaluation. Renew. Energy 2025, 241, 122278. [Google Scholar] [CrossRef] [Scilit]
  27. Balogun, O.A.; Sun, Y.; Gbadega, P.A. Coordination of smart inverter-enabled distributed energy resources for optimal PV-BESS integration and voltage stability in modern power distribution networks: A systematic review and bibliometric analysis. e-Prime Adv. Electr. Eng. Electron. Energy 2024, 10, 100800. [Google Scholar] [CrossRef] [Scilit]
  28. Gavilanez, C. Mejora del Factor de Potencia en un Sistema de Distribución, Mediante la Implementación de Control Adaptativo para Filtros de Potencia Reactiva; Universidad Politécnica Salesiana: Chenca, Ecuador, 2022. [Google Scholar]
  29. Wang, J.; Cheng, S.; Liu, N.; Lu, N.; Shang, K.; Jiang, N.; Li, J.; Wu, Y. Degradation of toluene by tube-tube coaxial dielectric barrier discharge: Power characteristics and power factor optimization. Environ. Technol. 2021, 44, 897–910. [Google Scholar] [CrossRef] [Scilit] [PubMed]
  30. Yuvaraj, T.; Devabalaji, K.R.; Srinivasan, S.; Prabaharan, N.; Hariharan, R.; Alhelou, H.H.; Ashokkumar, B. Comparative analysis of various compensating devices in energy trading radial distribution system for voltage regulation and loss mitigation using Blockchain technology and Bat Algorithm. Energy Rep. 2021, 7, 8312–8321. [Google Scholar] [CrossRef] [Scilit]
  31. Liu, J.; Huang, X.; Li, Z. Multi-time Scale Optimal Power Flow Strategy for Medium-voltage DC Power Grid Considering Different Operation Modes. Mod. Power Syst. Clean Energy 2020, 8, 46–54. [Google Scholar] [CrossRef] [Scilit]
  32. Tzeng, G.H.; Huang, J.J. Multiple Attribute Decision Making: Methods and Applications; CRC Press: Boca Raton, FL, USA, 2011. [Google Scholar] [CrossRef] [Scilit]
  33. Hwang, C.L.; Yoon, K. Multiple Attribute Decision Making: Methods and Applications—A State-of-the-Art Survey; Lecture Notes in Economics and Mathematical Systems; Springer: Berlin/Heidelberg, Germany, 1981; Volume 186. [Google Scholar] [CrossRef] [Scilit]
Figure 1. Methodological workflow of the proposed exhaustive-search and multi-criteria decision framework.
Energies 19 02792 g001
Figure 2. Historical voltage-drop data of the Guayacanes feeder. The purple line represents the voltage unbalance profile along the entire analyzed section.
Energies 19 02792 g002
Figure 3. Topology of the Guayacanes feeder.
Energies 19 02792 g003
Figure 4. Voltage -drop profile of the Guayacanes feeder along the main trunk in the base-case condition.
Energies 19 02792 g004
Figure 5. Per-unit voltage magnitude at the analyzed nodes in the base-case condition.
Energies 19 02792 g005
Figure 6. Voltage-angle results for the analyzed nodes in the base-case condition.
Energies 19 02792 g006
Figure 7. Percentage voltage deviation in the base-case condition.
Energies 19 02792 g007
Figure 8. Active, reactive, and apparent power losses in the base-case condition.
Energies 19 02792 g008
Figure 9. Bar chart of the best WSM-ranked alternatives for the maximum-load scenario.
Energies 19 02792 g009
Figure 10. Heatmap of the best WSM-ranked alternatives for the maximum-load scenario.
Energies 19 02792 g010
Figure 11. Nodal criterion behavior for the winning WSM solution in the maximum-load scenario.
Energies 19 02792 g011
Figure 12. Bar chart of the best TOPSIS-ranked alternatives for the maximum-load scenario.
Energies 19 02792 g012
Figure 13. Heatmap of the best TOPSIS-ranked alternatives for the maximum-load scenario.
Energies 19 02792 g013
Figure 14. Bar chart of the best WSM-ranked alternatives for the minimum-load scenario.
Energies 19 02792 g014
Figure 15. Heatmap of the best WSM-ranked alternatives for the minimum-load scenario.
Energies 19 02792 g015
Figure 16. Nodal criterion behavior for the winning WSM solution in the minimum-load scenario.
Energies 19 02792 g016
Figure 17. Bar chart of the best TOPSIS-ranked alternatives for the minimum-load scenario.
Energies 19 02792 g017
Figure 18. Heatmap of the best TOPSIS-ranked alternatives for the minimum-load scenario.
Energies 19 02792 g018
Figure 19. Scatter comparison between the WSM and TOPSIS rankings for the maximum-load scenario.
Energies 19 02792 g019
Figure 20. Comparison of total voltage variation under maximum load between the base case and the regulated case.
Energies 19 02792 g020
Figure 21. Comparison of total reactive losses under maximum load between the base case and the regulated case.
Energies 19 02792 g021
Figure 22. Comparison of total active losses under maximum load between the base case and the regulated case.
Energies 19 02792 g022
Figure 23. Sensitivity analysis of the WSM and TOPSIS for each criterion in the maximum-load scenario.
Energies 19 02792 g023
Figure 24. Scatter comparison between the WSM and TOPSIS rankings for the minimum-load scenario.
Energies 19 02792 g024
Figure 25. Comparison of total voltage variation under minimum load between the base case and the regulated case.
Energies 19 02792 g025
Figure 26. Comparison of total reactive losses under minimum load between the base case and the regulated case.
Energies 19 02792 g026
Figure 27. Comparison of total active losses under minimum load between the base case and the regulated case.
Energies 19 02792 g027
Figure 28. Sensitivity analysis of the WSM and TOPSIS for each criterion in the minimum-load scenario.
Energies 19 02792 g028
Figure 29. Final optimal voltage-regulator location based on the comparative results.
Energies 19 02792 g029
Table 1. Nomenclature of sets, indices, and decision structures used in the methodological formulation.
SymbolDefinitionUnit/Type
                 N                 Set of candidate nodes for voltage regulator installationSet
nIndex associated with a candidate or observation nodeIndex
kTotal number of candidate nodesInteger
A Set of feasible regulator-placement alternativesSet
iIndex associated with a feasible regulator-location alternativeIndex
NTotal number of feasible alternativesInteger
C Set of technical evaluation criteriaSet
cIndex associated with an evaluation criterionIndex
mTotal number of evaluation criteriaInteger
L Set of feeder branches or line sectionsSet
Index associated with a feeder branchIndex
N obs Set of observation nodes used to evaluate feeder performanceSet
y n Binary decision variable indicating whether the regulator is installed at node nBinary variable
w = [ w 1 , w 2 , , w m ] Weight vector associated with the evaluation criteriaVector
w c Weight assigned to criterion cDimensionless
i WSM Best-ranked alternative according to WSMIndex
i TOPSIS Best-ranked alternative according to TOPSISIndex
Table 2. Nomenclature of matrices, electrical variables, and performance metrics used in the methodological formulation.
SymbolDefinitionUnit/Type
X = [ X i c ] Performance matrix containing the value of criterion c for alternative iMatrix
X i c Value of criterion c associated with alternative iVariable
x c min Minimum value of criterion c over all alternativesVariable
x c max Maximum value of criterion c over all alternativesVariable
Z = [ Z i c ] Min–max normalized performance matrix used in WSMMatrix
Z i c Min–max normalized value of criterion c for alternative iDimensionless
R = [ R i c ] Vector-normalized matrix used in TOPSISMatrix
R i c Vector-normalized value of criterion c for alternative iDimensionless
V = [ V i c ] Weighted normalized matrix used in TOPSISMatrix
V i c Weighted normalized value of criterion c for alternative iDimensionless
v c + Positive ideal value of criterion c in TOPSISDimensionless
v c Negative ideal value of criterion c in TOPSISDimensionless
d i + Euclidean distance from alternative i to the positive ideal solutionDimensionless
d i Euclidean distance from alternative i to the negative ideal solutionDimensionless
C i TOPSIS TOPSIS closeness coefficient of alternative iDimensionless
S i WSM Weighted Sum Method score of alternative iDimensionless
V n Voltage magnitude at node nkV or p.u.
V n , base Base voltage at node nkV
V n pu Per-unit voltage magnitude at node np.u.
V n , ref Reference voltage at node n used for voltage-variation calculationkV or p.u.
D V Global voltage deviation indexDimensionless
Δ V n ( % ) Percentage voltage variation at node n%
Δ V ¯ Average voltage variation over the observation nodes%
P loss Total active power losseskW
Q loss Total reactive power losseskVAr
R Resistance of branch Ω
X Reactance of branch Ω
I Current magnitude in branch A
V U F Voltage unbalance factor%
V 1 Positive-sequence voltage componentV or p.u.
V 2 Negative-sequence voltage componentV or p.u.
Table 3. Acronyms used in the methodological formulation.
AcronymDefinitionUnit/Type
kVLLLine-to-line voltage magnitudekV
p.u.Per-unit quantityDimensionless
WSMWeighted Sum MethodAcronym
TOPSISTechnique for Order Preference by Similarity to Ideal SolutionAcronym
CYMEPower system simulation software used for feeder modeling and load-flow analysisAcronym
Table 4. Base-case load-flow results.
NodeBase Voltage (kVLL)V (p.u.)Voltage Angle (deg)Total Losses (kVA)Total Losses (kVAr)Total Losses (kW)
MTA S 46686613.8000.9670.00472.79391.16265.57
MTA S 10840213.8000.967−0.01434.18360.24242.35
MTA S 10840413.8000.966−0.04432.64358.91241.59
MTA S 44476613.8000.965−0.17427.23354.18238.92
MTA S 10893213.8000.965−0.200.310.000.31
MTA S 10841613.8000.965−0.23424.35351.88237.19
MTA S 11142913.8000.964−0.28421.54349.58235.55
Table 5. Summary of selected evaluation criteria and baseline weighting coefficients.
CriterionDescriptionUnitRangeWeight
Voltage kVLLMeasured line-to-line voltage magnitudekV13.5–13.9
Voltage p.u.Normalized voltage magnitudep.u.0.95–1.05
Voltage anglePhase-angle displacementdeg 1 ° to 20 °
d V TotalTotal voltage variation% 5 % to + 5 % 0.15
Downstream losses kWTotal active losseskW0–5000.30
Downstream losses kVArTotal reactive losseskVAr0–5000.25
Downstream losses kVATotal apparent losseskVA0–800
Unbalance factorThree-phase voltage unbalance level%0–3%0.10
Global voltage deviationCumulative squared deviation from nominal voltageDimensionless≥00.20
Table 6. Input variable data for the maximum-load scenario.
RegulatorNode IDBase Voltage (kVLL)Losses (kVAr)Losses (kW)
1MTA S 46686613.800389.49275.67
0MTA S 10840213.800360.81252.23
0MTA S 10840413.800359.42251.44
0MTA S 44476613.800354.45248.69
0MTA S 10893213.8000.000.33
Table 7. Best WSM-ranked alternatives for the maximum-load scenario.
WSM RankingNodeTotal Losses (kW)Total Losses (kVAr)Average dV (%)
158996.7711,994.870.05
239108.1212,294.070.04
3109111.6312,304.840.05
489110.1012,300.710.05
599111.2512,303.690.05
Table 8. Summary of the winning WSM alternative for the maximum-load scenario.
IndicatorValue
Winning test5
Node with regulator5 (MTS 108932)
Active losses (kW)8996.769
Reactive losses (kVAr)11,994.871
Total voltage deviation0.05009
Average d V (%)−3.891
Voltage unbalance (%)1.006
Nodes out of range0
Table 9. Best TOPSIS-ranked alternatives for the maximum-load scenario.
TOPSIS RankingNodeTotal Losses (kW)Total Losses (kVAr)Average dV (%)
158996.7711,994.870.05
2109111.6312,304.840.05
399111.2512,303.690.05
479112.0712,304.840.05
589110.1012,300.710.05
Table 10. Summary of the winning TOPSIS alternative for the maximum-load scenario.
IndicatorValue
Winning test5
Node with regulator5 (MTS 108932)
Active losses (kW)8996.769
Reactive losses (kVAr)11,994.871
Total voltage deviation0.05009
Average d V (%)−3.891
Voltage unbalance (%)1.006
Nodes out of range0
Table 11. Input variable data for the minimum-load scenario.
RegulatorNode IDBase Voltage (kVLL)Losses (kVAr)Losses (kW)
1MTA S 46686613.80079.1078.92
0MTA S 10840213.80065.2565.06
0MTA S 10840413.80065.2365.05
0MTA S 44476613.80065.1965.01
0MTA S 10893213.8000.330.33
Table 12. Best WSM-ranked alternatives for the minimum-load scenario.
WSM RankingNodeTotal Losses (kW)Total Losses (kVAr)Average dV (%)
132893.96165.970.02
252894.08165.970.04
3102894.02165.350.04
492894.13165.340.02
582894.29165.330.02
Table 13. Summary of the winning WSM alternative for the minimum-load scenario.
IndicatorValue
Winning test3
Node with regulator3 (MTS 108404)
Active losses (kW)2893.963
Reactive losses (kVAr)165.974
Total voltage deviation0.08812
Average d V (%)−4.552
Voltage unbalance (%)0.252
Nodes out of range0
Table 14. Best TOPSIS-ranked alternatives for the minimum-load scenario.
TOPSIS RankingNodeTotal Losses (kW)Total Losses (kVAr)Average Voltage Angle (deg)
152894.08165.970.02
232893.96165.970.04
3102894.02165.350.04
492894.13165.340.02
582894.29165.330.02
Table 15. Summary of the winning TOPSIS alternative for the minimum-load scenario.
IndicatorValue
Winning test5
Node with regulator5 (MTS 108932)
Active losses (kW)2894.081
Reactive losses (kVAr)165.974
Total voltage deviation0.08812
Average d V (%)−4.553
Voltage unbalance (%)0.252
Nodes out of range0
Table 16. Comparison of the base case and winning alternatives for the maximum-load scenario.
Scenario Comparison (Maximum Load)Total Losses (kW)Total Losses (kVAr)Average dV (%)Average V (p.u.)
Base Case9254.3512,875.840.290.985
WSM Winner8996.7711,994.870.051.00
TOPSIS Winner8996.7711,994.870.051.00
Table 17. Comparison of the base case and winning alternatives for the minimum-load scenario.
Scenario Comparison (Minimum Load)Total Losses (kW)Total Losses (kVAr)Average dV (%)Average V (p.u.)
Base Case2933.36176.610.420.965
WSM Winner2893.96165.970.021.012
TOPSIS Winner2894.08165.970.021.012
Disclaimer/Publisher’s Note: The statements, opinions and data contained in all publications are solely those of the individual author(s) and contributor(s) and not of MDPI and/or the editor(s). MDPI and/or the editor(s) disclaim responsibility for any injury to people or property resulting from any ideas, methods, instructions or products referred to in the content.