Article

Hybrid Game-Based Optimal Operation of Multi-Energy Prosumers Under Coupled Carbon and Green Certificate Markets

by
Yuzhe Li
*,
Gaiping Sun
,
Deting Shen
and
Bin Wu
Faculty of Electrical Engineering, Shanghai University of Electric Power, Shanghai 200090, China
*
Author to whom correspondence should be addressed.
Energies 2026, 19(10), 2429; https://doi.org/10.3390/en19102429
Submission received: 9 April 2026 / Revised: 10 May 2026 / Accepted: 15 May 2026 / Published: 18 May 2026

Abstract

With the ongoing low-carbon transition of energy systems and the increasing penetration of distributed energy resources, the coordinated operation of heterogeneous prosumers has become essential for improving the economic and environmental performance of integrated energy systems. However, existing studies have not sufficiently addressed the joint coordination of electricity sharing, carbon emission trading, green certificate trading, and demand-side flexibility. To address this gap, this paper proposes a hybrid game-based optimal operation model for a multi-energy prosumer alliance coordinated by an Electricity Balance Service Provider (EBSP). The model is developed under coupled carbon emission trading (CET) and green certificate trading (GCT) markets. A piecewise linear dynamic pricing mechanism and a mutual recognition rule are introduced to describe the interaction between CET and GCT. Meanwhile, a price-based demand response model considering reducible and shiftable loads is incorporated to exploit load-side flexibility. On this basis, a Stackelberg-cooperative hybrid game is formulated to coordinate electricity pricing, integrated dispatch, electricity sharing, and benefit allocation between the EBSP and the prosumer alliance. The proposed model is solved using particle swarm optimization and the alternating direction method of multipliers. Case studies show that, compared with the corresponding benchmark scenarios, the proposed method reduces the alliance operating cost by 7.19%, the carbon trading cost by 41.35%, and total carbon emissions by 3.66%. It also decreases the peak-to-valley load difference ratio by 3.78 percentage points. These results demonstrate the effectiveness of the proposed method in improving economic performance, promoting low-carbon operation, and enhancing the peak-shaving and valley-filling capability of the prosumer alliance.

1. Introduction

With the rapid deployment of distributed energy technologies and the increasing penetration of renewable energy sources, regional integrated energy systems are evolving into multi-agent environments. In these systems, distributed generators, flexible loads, and user-side energy conversion devices interact across multiple energy carriers, such as electricity and heat [1,2,3]. Multi-energy prosumer systems refer to systems composed of users that can both produce and consume multiple forms of energy. These users actively participate in local energy coordination and market transactions [4,5].
Direct participation in electricity markets is often uneconomical for individual prosumers because of their limited capacity, dispersed distribution, and small transaction scale. These limitations reduce their bargaining power and weaken their ability to manage market risks [6,7]. As the number and heterogeneity of prosumers increase, the coordination burden on upper-level markets also becomes more pronounced. Therefore, aggregating prosumers into coordinated alliances or communities has been shown to improve coordination efficiency, enhance flexibility services, and better exploit generation–load complementarity across energy vectors [8,9].
However, effective coordination within and beyond the alliance still requires an intermediary. Such an intermediary should be able to organize transactions, balance multi-energy flows, and guide operational decisions. Recent studies have proposed aggregator and virtual power plant models to perform this role in integrated energy systems [10,11]. Related frameworks have also been developed to support prosumer integration in flexibility and transmission markets [12,13]. In this context, an Electricity Balance Service Provider (EBSP) can serve as a coordinator between the prosumer alliance and upper-level markets. It facilitates bilateral electricity transactions, flexibility services, and market integration [14].
Substantial progress has been made in the coordinated operation of multiple prosumers. Some studies have established leader–follower frameworks, where a virtual power plant operator or aggregator acts as the leader and prosumers act as followers [15,16]. Other studies have developed bi-level coordination mechanisms for multiple virtual power plants participating in electricity markets [17,18]. These studies demonstrate the value of hierarchical coordination in reducing computational complexity and preserving operational privacy. In addition, recent studies have addressed optimal power flow and reactive power dispatch in systems with high renewable energy penetration. These studies consider uncertainties in renewable generation, including geothermal power plants, as well as the participation of electric vehicles [19,20]. They provide useful insights for designing coordinated operation strategies for multi-energy prosumer alliances. However, most of them focus mainly on interactions between prosumers and upper-level entities. Intra-alliance electricity sharing among heterogeneous prosumers remains insufficiently addressed [21,22].
To address this limitation, peer-to-peer (P2P) transaction models and energy-sharing mechanisms have been introduced for aggregated prosumer systems [23,24]. Recent studies have developed P2P energy trading models for community microgrids to support decentralized energy exchange and multi-agent coordination. Review studies have also summarized recent advances in P2P energy trading strategies, market schemes, and enabling technologies, indicating the growing research interest in prosumer energy-sharing frameworks [25]. These studies confirm that electricity sharing can improve the overall economic performance of coordinated systems. However, they generally pay insufficient attention to the heterogeneity of prosumer types, renewable generation profiles, and load characteristics within the alliance. Therefore, a unified coordination and electricity-sharing framework is still needed for heterogeneous prosumer alliances [26].
At the same time, the continued development of carbon emission trading (CET) and green certificate trading (GCT) markets has made the coordinated use of multiple low-carbon market mechanisms an important direction for integrated energy system optimization. Existing studies have incorporated CET and GCT into low-carbon planning and scheduling models for integrated energy systems, virtual power plants, and community microgrids [27,28,29]. Recent research has further explored joint CET–GCT interaction mechanisms. For example, double-direction coupling mechanisms between carbon allowances and green certificates have been proposed to support low-carbon transformation and integrated pricing in integrated energy systems [30,31]. In addition, cooperative operation models have been developed by linking the carbon reduction attributes of green certificates with carbon markets. These models help enhance multi-operator complementarity and low-carbon performance in integrated systems [32].
Nevertheless, most existing studies treat CET and GCT as parallel market mechanisms or analyze their interaction under simplified pricing assumptions. Even when market coupling is considered, the dynamic price–response relationship, multi-market feedback, and influence on operational decisions are still not fully characterized. Previous studies have indicated that interactions among electricity, carbon trading, and green certificate markets can lead to complex fluctuations in prices and trading volumes [33]. However, these dynamic effects have not been fully incorporated into coordinated dispatch and strategic market participation models. Therefore, the interactions among CET, GCT, and electricity market mechanisms, as well as their impacts on prosumer operation and market participation, require further investigation.
Demand response (DR) has become an important approach for enhancing system flexibility, facilitating peak shaving and valley filling, and supporting the integration of distributed energy resources. By responding to price signals or incentive mechanisms, electricity consumers can adjust their load profiles and actively participate in system operation [34,35]. Recent studies have verified the effectiveness of both incentive-based and price-based DR models in improving operational economy and load distribution [36]. However, the coordinated integration of demand-side flexibility with prosumer electricity sharing and coupled CET–GCT market mechanisms still requires further investigation. In particular, it remains challenging to jointly coordinate upper-level electricity pricing, lower-level alliance dispatch, inter-prosumer electricity sharing, and low-carbon market participation within a unified optimization framework.
The above studies indicate that several issues remain to be addressed. First, the interaction between CET and GCT in prosumer alliances is often modeled using fixed or stepwise prices. The trading-volume-driven price response between the two markets has not been sufficiently characterized. Second, the coordination between an external electricity service provider and heterogeneous prosumers is usually studied separately from intra-alliance electricity sharing. As a result, hierarchical pricing, cooperative dispatch, and benefit allocation are difficult to capture simultaneously. Third, the integration of price-based demand response with electricity sharing and coupled CET–GCT market participation is still insufficiently explored. To address these issues, this paper proposes a hybrid game-based optimal operation model for a multi-energy prosumer alliance coordinated by an Electricity Balance Service Provider under coupled CET–GCT markets.
The main contributions of this paper are summarized as follows:
(1)
A piecewise linear dynamic CET–GCT interaction mechanism is proposed. In this mechanism, carbon and green certificate prices are adjusted according to trading volumes. The carbon-offset value of green certificates is further incorporated through a mutual recognition rule.
(2)
A Stackelberg-cooperative hybrid game model is developed for EBSP-coordinated prosumer alliances. In the proposed model, the EBSP determines electricity trading prices as the leader. Heterogeneous prosumers then conduct cooperative dispatch, electricity sharing, and benefit allocation through asymmetric Nash bargaining.
(3)
A price-based demand response model is incorporated into the proposed framework. In addition, a PSO–ADMM solution strategy is developed to coordinate electricity pricing, low-carbon market participation, intra-alliance electricity sharing, and load-side flexibility within a unified optimization process.

2. An Interactive Carbon–Green Certificate Trading Model Based on Piecewise Linear Dynamic Pricing Functions

2.1. Piecewise Linear Dynamic Carbon Trading Mechanism

The CET mechanism establishes a market for carbon emission allowances and uses cost incentives to encourage regulated entities to reduce their carbon emissions. If an entity emits less carbon than its allocated quota, the surplus allowance can be traded for profit. Conversely, if its emissions exceed the allocated quota, the entity must purchase additional allowances or adopt other measures to meet compliance requirements.
Carbon quotas are currently allocated mainly based on historical CO2 emissions or benchmarking methods. This paper adopts the benchmarking method for quota allocation. It is assumed that all electricity purchased by prosumers from the external grid is supplied by coal-fired power plants. Therefore, carbon emissions in this study originate from three sources: CHP units, electricity purchased from the external grid, and gas boilers. The carbon quota model for each prosumer is formulated as follows:
C i C O 2 , q = C C H P , i C O 2 , q + C G B , i C O 2 , q + C g r i d , i C O 2 , q ,
C C H P , i C O 2 , q = λ 1 t = 1 T ( H i , t W H B + C v 1 P i , t G T ) ,
C G B , i C O 2 , q = λ 1 t = 1 T H i , t G B ,
C g r i d , i C O 2 , q = λ 2 t = 1 T P i , t b u y ,
where C i C O 2 , q denotes the carbon emission allowance allocated to prosumer i. C C H P , i C O 2 , q , C G B , i C O 2 , q , and C g r i d , i C O 2 , q denote the allowances for the CHP system, gas boiler, and grid electricity import of prosumer i, respectively. λ 1 and λ 2 denote the carbon quota coefficients per unit thermal power output and electrical power output, respectively, and C v 1 denotes the heat-to-power ratio.
Within the carbon trading framework, each prosumer’s carbon trading profit or cost depends on the difference between its allocated carbon quota and actual emissions. The actual emissions of each prosumer are generated by CHP units, gas boilers, and electricity purchased from the external grid. The carbon emission model is formulated as follows:
C i C O 2 , p = C C H P , i C O 2 , p + C G B , i C O 2 , p + C g r i d , i C O 2 , p ,
C C H P , i C O 2 , p = χ 1 t = 1 T ( H i , t W H B + C v 1 P i , t G T ) ,
C G B , i C O 2 , p = χ 1 t = 1 T H i , t G B ,
C g r i d , i C O 2 , p = χ 2 t = 1 T P i , t b u y ,
where C i C O 2 , p denotes the actual carbon emissions of prosumer i; C C H P , i C O 2 , p , C G B , i C O 2 , p , and C g r i d , i C O 2 , p denote the carbon emissions from the CHP unit, gas boiler (GB), and grid electricity import of prosumer i, respectively. χ 1 and χ 2 denote the actual carbon emission intensities per unit thermal power and per unit electrical power, respectively.
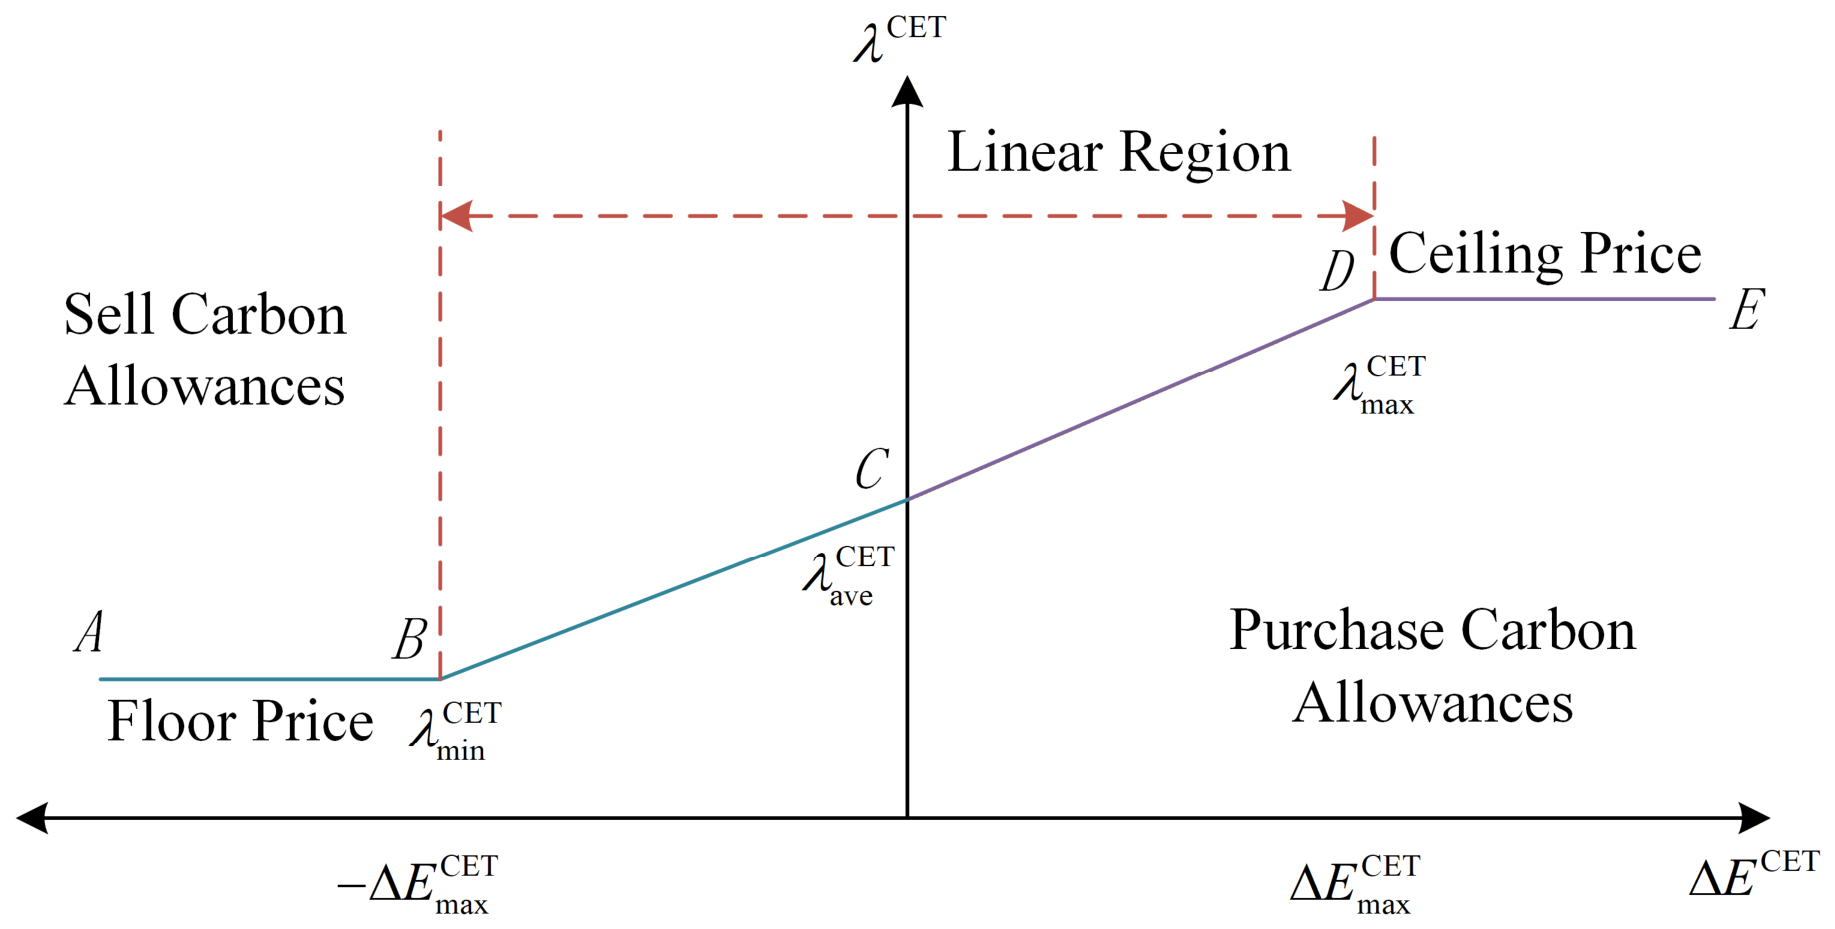
Compared with traditional fixed-price and stepwise carbon trading mechanisms, this paper develops a piecewise linear dynamic carbon pricing function. In this function, the traded carbon volume is taken as the independent variable, and the carbon price is adjusted dynamically in a piecewise linear manner over different trading intervals. When the trading volume exceeds the corresponding thresholds, the carbon price is constrained by the minimum and maximum price limits. This mechanism can more flexibly reflect the supply–demand relationship in the carbon market and guide market participants to adjust their trading behavior according to carbon allowance deficits or surpluses. A schematic diagram is shown in Figure 1.
As shown in Figure 1, the region to the left of point C represents the case in which market participants sell carbon allowances in the carbon market. As the selling volume increases, the carbon price decreases according to the piecewise linear dynamic function. Once the preset threshold is exceeded, the price reaches the minimum limit. In contrast, the region to the right of point C represents the case in which market participants purchase carbon allowances from the carbon market. As the purchasing volume increases, the carbon price rises according to the piecewise linear dynamic function until it reaches the maximum limit after the corresponding threshold is exceeded. The dynamic carbon pricing model for prosumers participating in CET is given in (9) and (10).
λ i CET = λ min C E T                                                                                                     Δ E i C E T Δ E max C E T λ a v e C E T + λ a v e C E T λ min C E T Δ E max C E T Δ E i CET               Δ E max C E T < Δ E i CET < 0 λ a v e C E T + λ max C E T λ a v e C E T Δ E max C E T Δ E i CET                         0   Δ E i CET < Δ E max C E T λ max C E T                                                                                                     Δ E max C E T   Δ E i CET ,
Δ E i CET = C i C O 2 , p C i C O 2 , q ,
where λ i C E T denotes the dynamic carbon trading price for prosumer i; λ min C E T , λ a v e C E T , and λ max C E T denote the minimum, average, and maximum carbon trading prices, respectively. Δ E i C E T denotes the carbon allowance trading volume of prosumer i in the carbon market.

2.2. Piecewise Linear Dynamic Green Certificate Trading Mechanism

The Renewable Portfolio Standard (RPS) sets renewable energy consumption obligation weights for each provincial administrative region. This policy stimulates local renewable energy consumption and promotes in situ utilization of renewable energy [37]. As certificates for renewable electricity production and consumption, Green Certificates (GCs) provide an important market-based instrument for supporting the implementation of the RPS.
According to the conversion standard, one GC is equivalent to 1 MWh of renewable electricity generation. The quantity of GCs is calculated as follows:
N i W T = t = 1 T P i , t W T / 1000 ,
N i P V = t = 1 T P i , t P V / 1000 ,
where N i W T and N i P V denote the quantities of green certificates generated by the wind turbine and photovoltaic units of prosumer i, respectively. P i , t W T and P i , t P V denote the actual output power of the wind turbine and photovoltaic units of prosumer i during time period t, respectively.
According to the RPS [38], a certain proportion of electricity generated or consumed by enterprises and end-users must be supplied by renewable energy sources. The required quantity of GCs for each prosumer is calculated as follows:
N i P R = ω g r e e n t = 1 T P i , t l o a d 1000 ,
where N i P R denotes the green certificate quota requirement of prosumer i; ω g r e e n denotes the green certificate quota coefficient; and P i , t l o a d denotes the post-demand-response load of prosumer i during time period t.
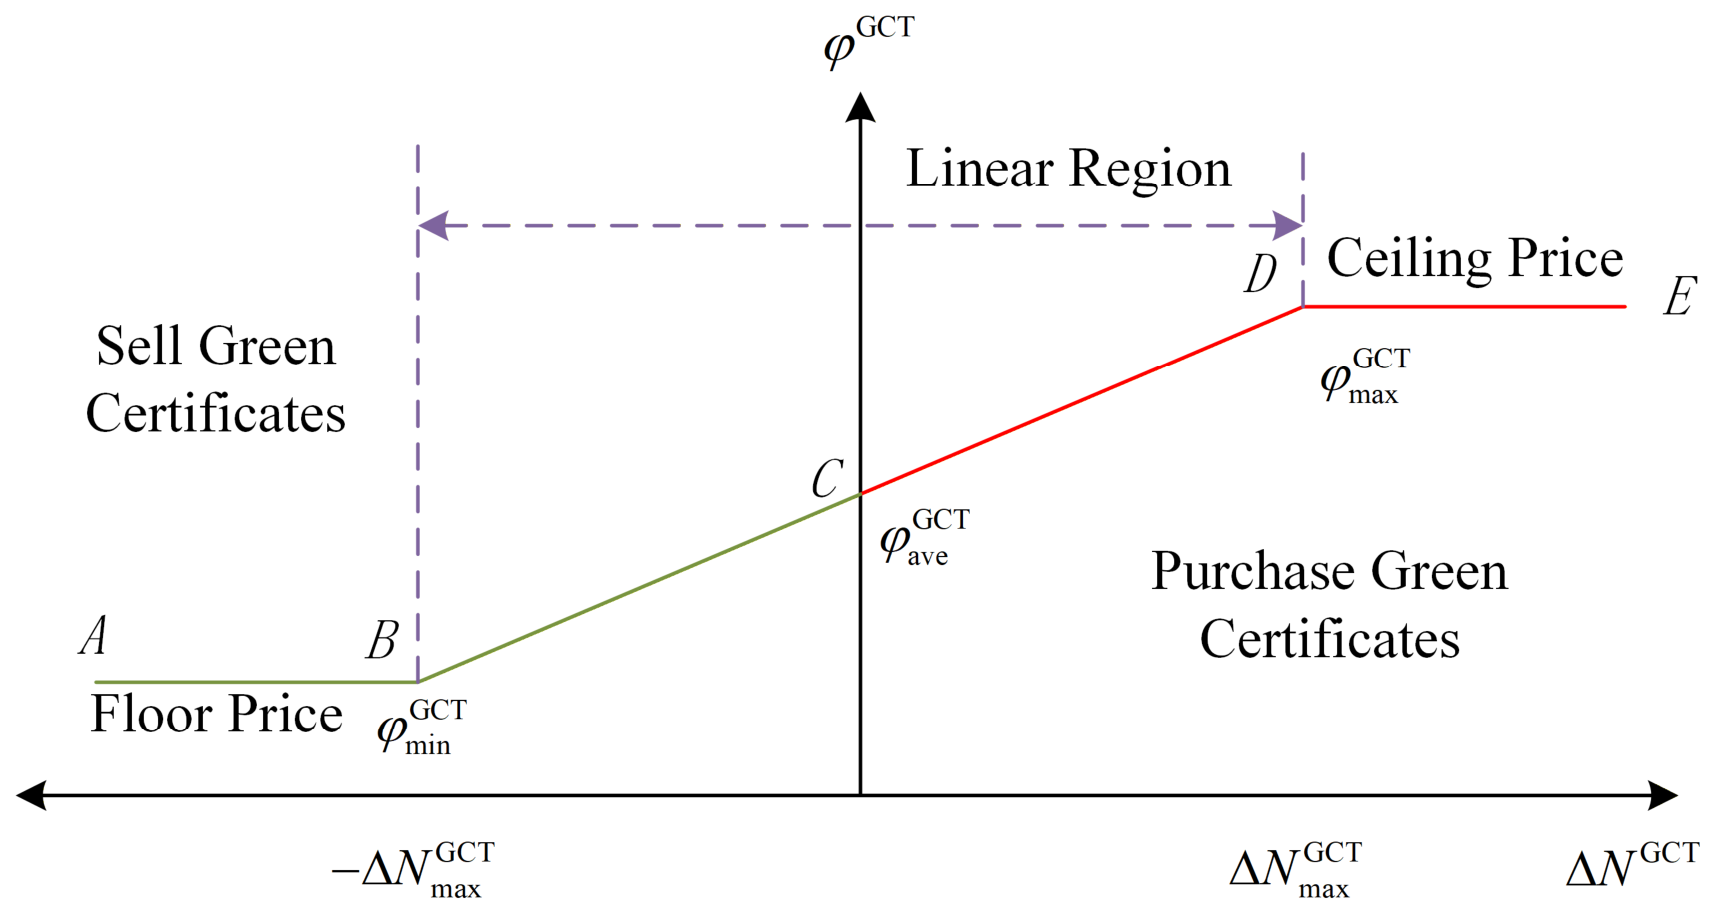
To enhance the interaction between CET and GCT, this paper proposes a piecewise linear dynamic green certificate pricing function. Similar to the carbon pricing model, the green certificate price is adjusted according to the trading volume. When the selling volume of green certificates increases, the certificate price decreases dynamically over different trading intervals and reaches the minimum price limit after the preset threshold is exceeded. Conversely, when the purchase volume increases, the certificate price rises dynamically and reaches the maximum price limit after the corresponding threshold is exceeded. The schematic diagram and the corresponding pricing model are presented in Appendix A.

2.3. Carbon–Green Certificate Mutual Recognition Mechanism

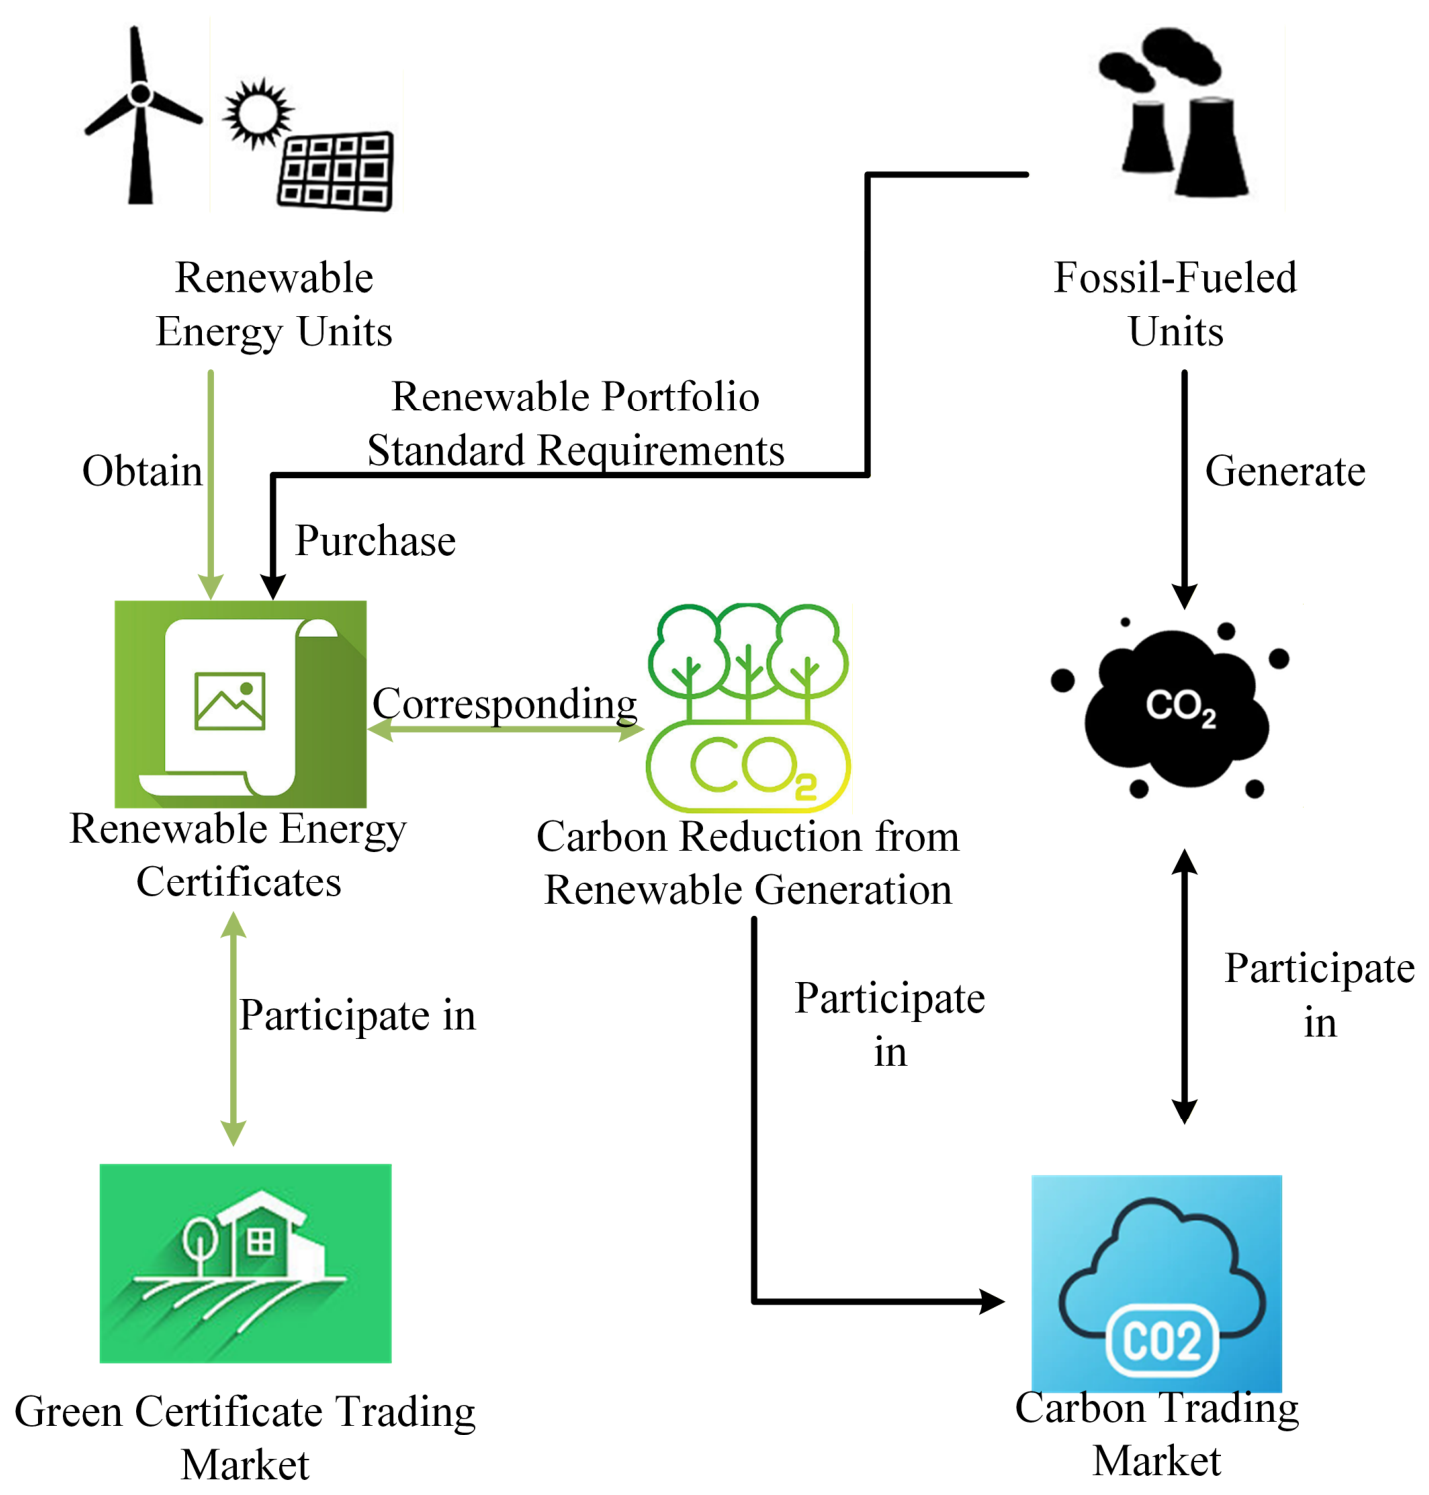
GCs contain information on renewable electricity generation and the associated carbon emission reductions. Therefore, GC holders can use these certificates to offset part of their carbon emissions during carbon allowance accounting. This offset is based on the emission reductions achieved by renewable energy generation represented by GCs in comparison with conventional energy supply. In this way, GCs enable indirect participation in the carbon market. The mutual recognition principle between GCs and carbon allowances is illustrated in Figure 2.
The carbon emission reductions represented by GCs can be determined by comparing the emissions from conventional thermal power generation with those from renewable energy generation.
D i c u t = ω c u t N i P R ,
where D i c u t denotes the carbon emission offset represented by the GCs of prosumer i, and ω c u t denotes the carbon reduction coefficient associated with GCs.
The actual carbon allowance trading volume is calculated by subtracting the freely allocated carbon allowances and the carbon emission offsets represented by GCs from the total calculated carbon emissions.
Δ E i C E T = C i C O 2 , p C i C O 2 , q D i c u t ,

3. Hybrid Game Model of Electricity Balance Service Providers and Prosumer Alliances

3.1. Hybrid Game Framework

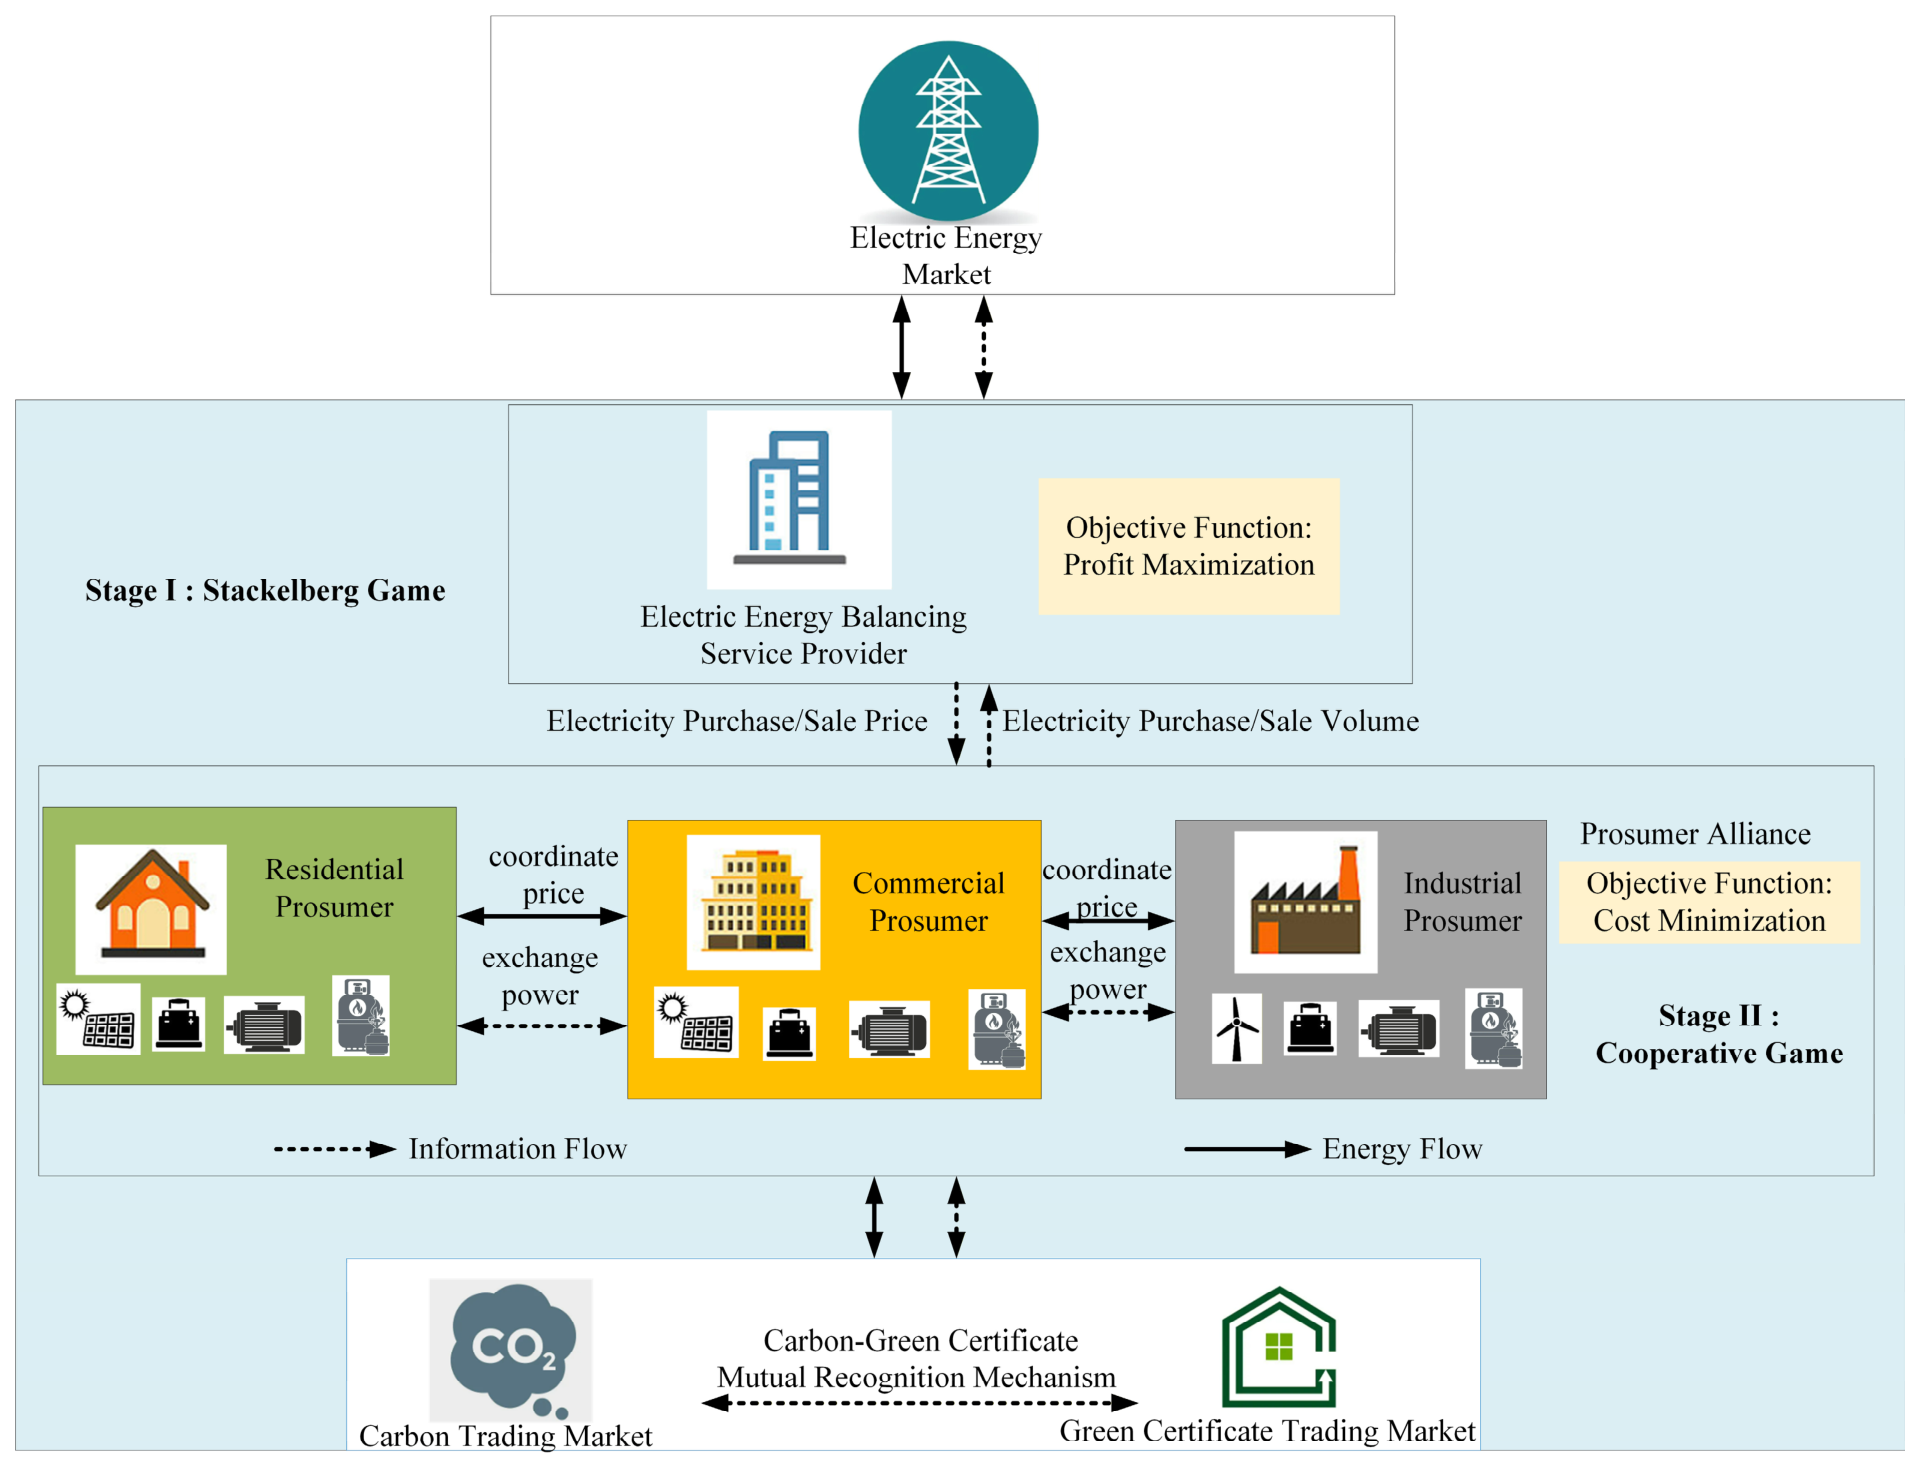
The hybrid game framework proposed in this paper is illustrated in Figure 3. It captures both the hierarchical leader–follower interaction between the Electricity Balance Service Provider (EBSP) and the prosumer alliance, and the cooperative interaction among alliance members. The framework is designed to account for the interests of both the EBSP and individual prosumers.
Conceptually, the model is organized into two stages. In the first stage, a Stackelberg game is formulated between the EBSP and the prosumer alliance. The EBSP acts as the leader and determines the electricity purchase and sale prices based on system conditions and trading requirements to maximize its own revenue. The prosumer alliance acts as the follower and optimizes its total purchased and sold electricity, as well as inter-member electricity exchanges, in response to the announced prices.
In the second stage, a cooperative game is conducted among alliance members. Based on the trading quantities obtained from the Stackelberg game, cooperative benefits are allocated among prosumers. This stage ensures that each prosumer receives a reasonable share of the alliance benefit while maintaining internal allocation efficiency.
The computation within this framework can be summarized in three steps.
  • Problem decomposition: The alliance cooperative game is formulated using Nash bargaining theory and decomposed into two subproblems. Subproblem P1, alliance cost minimization, determines electricity allocations and trading quantities during the Stackelberg interaction. Subproblem P2, prosumer profit allocation, calculates the internal distribution of cooperative benefits among prosumers.
  • Stage I: Stackelberg game: The upper-level Stackelberg game is conducted between the EBSP and the prosumer alliance. The EBSP acts as the leader and determines electricity prices to maximize its revenue. The alliance acts as the follower and optimizes electricity purchases, sales, and inter-member exchanges to maximize the collective benefit.
  • Stage II: Internal benefit allocation: Based on the inter-member electricity quantities obtained from Stage I, internal profit allocation is implemented among alliance members. The final profit distribution and internal settlement prices of each prosumer are determined using the asymmetric Nash bargaining model.
In this framework, the prosumer alliance is treated as a unified decision-making entity when interacting with the EBSP. Individual prosumers participate in the internal cooperative game. This hierarchical structure captures both the external leader–follower interaction and the internal cooperative benefit allocation, providing a clear representation of the proposed hybrid game framework.

3.2. Stackelberg Game Between Electricity Balance Service Providers and Prosumer Alliances

3.2.1. Electricity Balance Service Provider as the Game Leader

In the Stackelberg game, the EBSP acts as the leader and sets the electricity buying and selling prices for the prosumer alliance. Its objective is to maximize its own revenue. The objective function of the EBSP is formulated as follows:
max U E B S P = i N C i t r a d e C g r i d ,
where U E B S P denotes the revenue of the EBSP; C i t r a d e denotes the trading revenue with prosumer i; and C g r i d denotes the power purchase and sale cost with the grid. The grid-related cost is further expressed as follows:
C g r i d = i N P i g b c g b i N P i g s c g s ,
where c g b denotes the electricity purchase price from the grid, and c g s denotes the electricity sale price to the grid.
The electricity prices set by the EBSP are constrained within predefined bounds:
c p r , s e l l min c p r , s e l l c p r , s e l l max c p r , b u y min c p r , b u y c p r , b u y max ,
where c p r , s e l l min and c p r , s e l l max denote the lower and upper bounds of prosumer electricity selling prices, respectively; c p r , b u y min and c p r , b u y max denote the lower and upper bounds of prosumer electricity purchasing prices, respectively.
To prevent the EBSP from setting excessively high electricity prices to increase its profit, the prices must also satisfy the following average price constraint:
t = 1 24 ( c p r , b u y ( t ) ) / 24 c p r , b u y a v e t = 1 24 ( c p r , s e l l ( t ) ) / 24 c p r , s e l l a v e ,
where c p r , b u y a v e denotes the average electricity purchase price for prosumers, and c p r , s e l l a v e denotes the average electricity sale price for prosumers.

3.2.2. Price-Based Demand Response

PBDR uses electricity price signals to guide the electricity consumption behavior of prosumers. It also affects the electricity pricing decisions of the EBSP and the economic benefits of all market participants.
Considering flexible load resources on the demand side, load demand is divided into rigid loads and flexible loads. Flexible loads are further classified into reducible loads and shiftable loads. Through price-based incentives, demand-side resources can be encouraged to reduce or shift electricity consumption across different time periods. In this way, users can participate in market transactions and optimize their electricity consumption strategies.
PBDR uses a price elasticity matrix to describe the response of flexible loads to time-of-use electricity prices. In this matrix, the element η i , j in E i , j represents the elasticity coefficient of the flexible load at time i with respect to the electricity price at time j. It is defined as follows:
η i , j = Δ P i e / P i e Δ C j / C j 0 ,
where Δ P i e and P i e denote the load variation and initial load at time i, respectively; C j 0 denotes the initial electricity price at time j; and Δ C j denotes the electricity price variation at time j.
Because different types of flexible loads respond differently to electricity price signals, reducible loads and shiftable loads are modeled separately.
Δ P c u t , i e = P c u t , i e , 0 j = 1 24 E c u t i , j C j C j 0 C j 0 ,
Δ P t r a n , i e = P t r a n , i e , 0 j = 1 24 E t r a n i , j C j C j 0 C j 0 ,
where E c u t i , j denotes the price elasticity matrix for reducible loads. Δ P c u t , i e and P c u t , i e , 0 denote the load variation and initial load of reducible loads at time i, respectively, and C j denotes the electricity price at time j. Similarly, E t r a n i , j denotes the price elasticity matrix for shiftable loads, and Δ P t r a n , i e and P t r a n , i e , 0 denote the load variation and initial load of shiftable loads at time i, respectively.

3.2.3. Prosumer Alliance as the Game Follower

As the follower in the Stackelberg game, the prosumer alliance responds to the pricing scheme set by the EBSP. It optimizes electricity purchase and sale volumes, internal generator outputs, and peer-to-peer energy transactions. The optimized purchase and sale volumes are then returned to the EBSP.
To reflect the heterogeneity of prosumers in the alliance, this paper considers three representative prosumer types: industrial, commercial, and residential prosumers. These prosumers differ in geographical location, equipment resources, and load characteristics. The detailed equipment models are adopted from Zhang et al. [39].
The objective of the prosumer alliance is to minimize its total operating cost C UPRO , which is defined as the sum of the scheduling costs C i U P R O of all prosumers. Here, i = 1 , , N , and N denotes the number of prosumers in the alliance. For prosumer i, the scheduling cost C i P R O consists of equipment operation cost C i o p , transaction cost with the EBSP C i t r a d e , peer-to-peer energy sharing cost C i p 2 p , gas procurement cost C i g a s , CET market participation cost C i C E T , and GCT market participation cost C i G C T . Since the P2P settlement cost is an internal transfer payment among prosumers, it cancels out in the alliance-level objective and is used only in the subsequent benefit allocation stage. Therefore, the alliance-level optimization objective is formulated as follows:
min C UPRO = i = 1 N C i UPRO = i = 1 N ( C i o p + C i t r a d e + C i p 2 p + C i g a s + C i C E T + C i G C T ) ,
The cost components are formulated as follows:
C i o p = C i G T + C i G B + C i E S S ,
C i t r a d e = t = 1 T P i , t g b c p r , b u y , t P i , t g s c p r , s e l l , t ,
C i p 2 p = t = 1 T j = 1 , j i N τ i j , t p 2 p P i j , t E X ,
c pr , sell τ i j , t p 2 p c pr , buy ,
C i g a s = t = 1 T λ C H 4 V i , t b u y ,
C i C E T = t = 1 T λ t C E T Δ E i , t C E T ,
C i G C T = t = 1 T φ t G C T Δ N i , t G C T ,
C i G T = t T a G T P i , t G T 2 + b G T P i , t G T ,
C i G B = t T c G B H i , t G B ,
C i E S S = t T δ P i , t B c h + P i , t B d i s ,
where P i , t g b and P i , t g s denote the electricity purchase and sale quantities between prosumer i and the grid at time t; τ i j , t p 2 p denotes the peer-to-peer (P2P) electricity trading price between prosumers i and j at time t, P i j , t E X denotes the corresponding P2P electricity transaction quantity. λ C H 4 denotes the natural gas purchase price, and V i , t b u y denotes the natural gas demand of prosumer i at time t; a G T and b G T denote the operating cost coefficients of the gas turbine (GT), and P i , t G T denotes the output power of the GT at time t; c G B denotes the operation and maintenance (O&M) cost coefficient of the gas boiler (GB), and H i , t G B denotes the output power of the GB at time t; δ denotes the operational degradation cost coefficient for charging and discharging of the electrical storage device. P i , t B c h and P i , t B d i s denote the charging and discharging power of the electrical storage device at time t.
The constraints for each prosumer are given as follows:
  • Grid power purchase/sale constraints and peer-to-peer electricity transaction constraints
0 P i , t g b P i , t g b , max ,
0 P i , t g s P i , t g s , max ,
P i j , t E X , max P i j , t E X P i j , t E X , max ,
P i j , t E X + P j i , t E X = 0 ,
where P i , t g b , max and P i , t g s , max denote the upper limits for electricity purchase and sale quantities, respectively, in transactions with the grid; P i j , t E X , max denotes the maximum allowable power exchange limit between prosumers.
2.
Electrical and thermal power balance constraints
Industrial prosumers:
P i , t W T + P i , t G T + P i , t B d i s + P i , t gb = P i , t l o a d + P i , t B c h + j i M P i j , t E X + P i , t g s ,
H i , t W H B + H i , t G B = H i , t l o a d ,
Commercial and residential prosumers:
P i , t P V + P i , t G T + P i , t g b = P i , t l o a d + j i M P i j , t E X + P i , t gs ,
H i , t W H B + H i , t G B = H i , t l o a d ,
The existence and uniqueness of the Stackelberg equilibrium solution are analyzed in Appendix B.

3.3. Nash Bargaining Model for the Prosumer Alliance

Prosumers form a cooperative alliance to respond to the pricing decisions made by the EBSP, thereby reducing the overall operating cost of the alliance. However, since each prosumer is an independent and rational participant, the individual interests of all prosumers should also be protected during the cooperative game. Nash bargaining, as an important branch of cooperative game theory, can achieve overall benefit maximization while accounting for the individual benefits of all participants. In the proposed cost-optimization framework, the cooperative benefit of each prosumer is reflected by the reduction in its operating cost before and after cooperation. Therefore, the cooperative game model of the prosumer alliance based on Nash bargaining is formulated as follows:
max i = 1 , 2 , , N ( C i 0 C i ) s . t .   C i 0 C i   ,
where C i 0 denotes the operating cost of prosumer i before cooperation, namely the disagreement point, and C i denotes the operating cost of prosumer i after cooperation. Therefore, C i 0 C i represents the benefit obtained by prosumer i through cooperation, that is, the cost reduction brought by cooperative operation.
Model (42) is a non-convex nonlinear optimization problem and is difficult to solve directly. Considering that intra-alliance electricity transactions are internal transfer payments among alliance members, the corresponding settlement costs cancel out in the total alliance cost. Therefore, this problem can be decomposed into two subproblems: the alliance cost minimization subproblem and the cooperative benefit allocation subproblem. The equivalent transformation is proved in Appendix C.
  • Subproblem P1: Alliance Cost Minimization
Subproblem P1 is used to determine the optimal cooperative dispatch scheme of the alliance, including the output of each prosumer’s equipment, electricity purchase and sale quantities with the EBSP, CET–GCT market trading quantities, demand response quantities, and intra-alliance electricity transaction quantities. The objective function is given by:
min C U P R O = i N ( C i o p + C i t r a d e + C i g a s + C i C E T + C i G C T ) s . t .   24 41 ,
where C P R O denotes the cooperative dispatch cost of the prosumer alliance. The intra-alliance electricity transaction quantities are determined in P1, while the corresponding internal settlement prices and cost allocation are further determined in P2.
  • Subproblem P2: Cooperative Benefit Allocation
After solving Subproblem P1, the optimal electricity transaction quantities among prosumers P i j , t E X * can be obtained. The remaining task is to allocate the cooperative benefits among different prosumers by determining the internal transaction price τ i j , t p 2 p . The internal settlement cost of prosumer i is given by C i p 2 p = t = 1 T j = 1 , j i N τ i j , t p 2 p P i j , t E X * . Accordingly, the final cost of prosumer i after cooperation can be expressed as:
C i = C i U P R O * + C i P 2 P ,
where C i U P R O * denotes the optimal cooperative dispatch cost of prosumer i obtained from Subproblem P1.
To reflect the different contributions of prosumers to intra-alliance electricity sharing, a bargaining factor d i is introduced. The bargaining factor is calculated according to the electricity provided and received by each prosumer during the trading period:
E i g i v e = t = 1 T max ( 0 , P i j , t E X )   ,   E i r e c e i v e = t = 1 T min ( 0 , P i j , t E X )   ,
d i = e E i g i v e / E max g i v e e E i r e c e i v e / E max r e c e i v e ,
where E i g i v e and E i r e c e i v e denote the electricity provided and received by prosumer i during the trading period, respectively; E max g i v e and E max r e c e i v e denote the maximum allowable values of electricity provision and reception, respectively; and d i denotes the bargaining factor of prosumer i. Equations (45) and (46) indicate that the bargaining factor is determined by the contribution of each prosumer to energy sharing. A larger contribution leads to a higher bargaining factor. In addition, prosumers that provide electricity are assigned larger bargaining factors than those that receive electricity.
Based on the above definitions, the asymmetric Nash bargaining model can be formulated as:
max i = 1 N C i 0 ( C i U P R O * + C i P 2 P ) d i s . t .   C i 0 C i U P R O * + C i p 2 p c pr , sell * τ i j , t p 2 p c pr , buy * ,
where c pr , sell * and c pr , buy * denote the prosumer selling price and purchasing price determined by the EBSP, respectively. This constraint ensures that internal sellers can obtain higher revenue than selling electricity to the EBSP, while internal buyers can purchase electricity at a lower cost than buying electricity from the EBSP. Therefore, the proposed internal pricing rule provides economic incentives for electricity sharing within the alliance.
Since the logarithmic function is monotonically increasing over the positive domain, taking the logarithm of the objective function in (47) yields the following equivalent summation form:
max i = 1 N d i ln C i 0 ( C i U P R O * + C i P 2 P ) s . t .   C i 0 C i U P R O * + C i p 2 p c pr , sell * τ i j , t p 2 p c pr , buy * .
Equation (48) is the asymmetric Nash bargaining model used for cooperative benefit allocation. Under the condition that each prosumer obtains a positive cooperative benefit, the model determines the internal transaction prices and allocates the cooperative benefits among alliance members.

4. Hybrid Game Model Solution

The hybrid game model developed in this study consists of two stages. Stage I is a Stackelberg game with a leader–follower structure, and Stage II is a cooperative game. These two stages require different solution approaches.

4.1. Stackelberg Game Solution Based on Particle Swarm Optimization

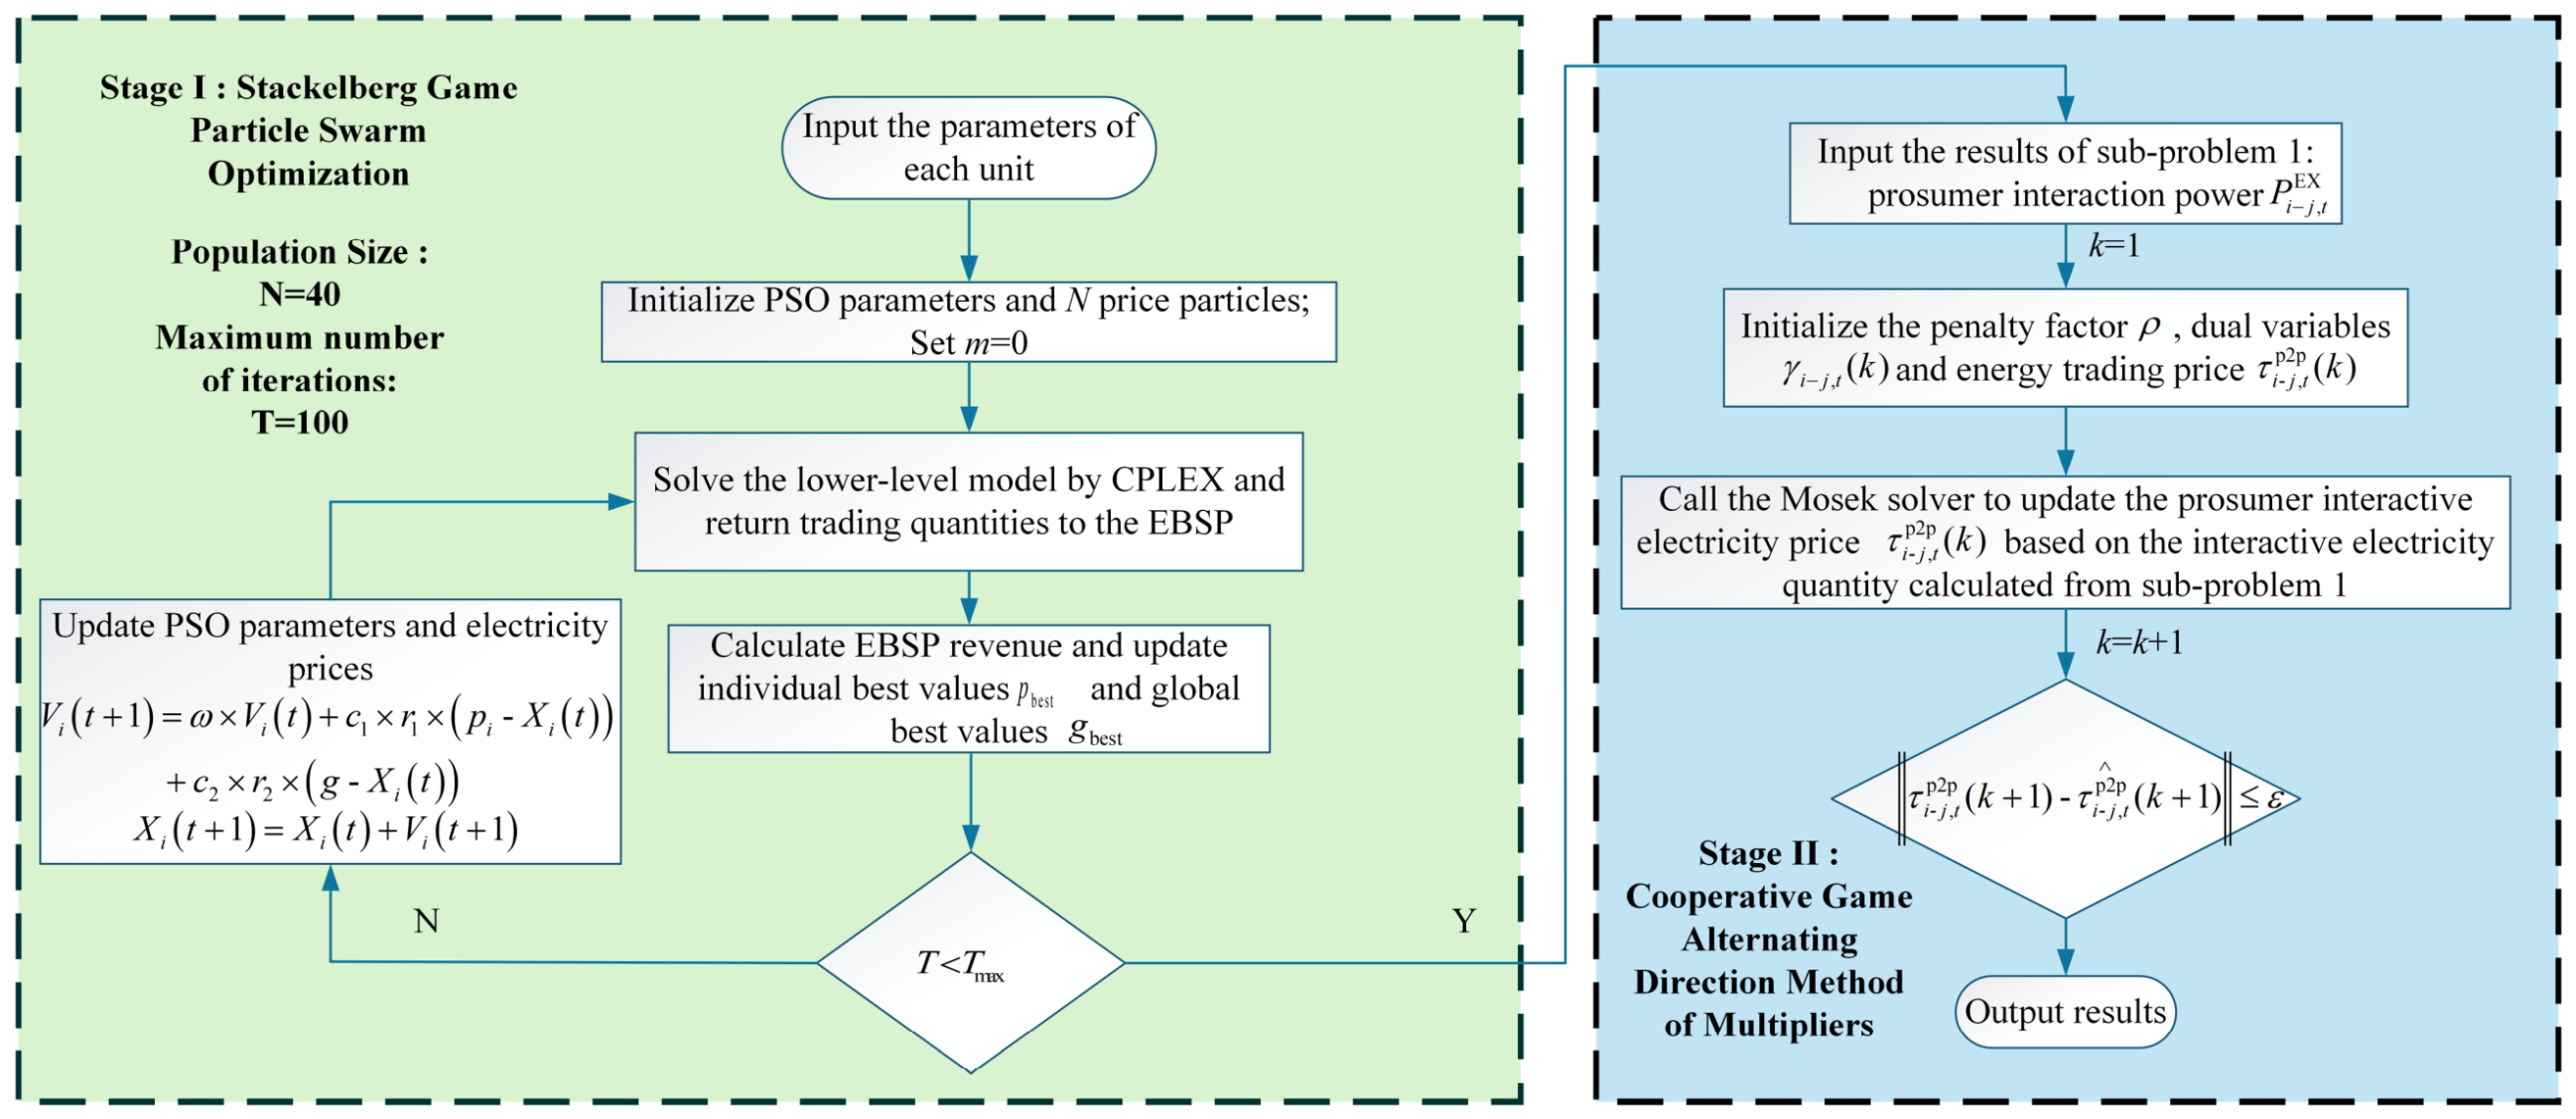
The Stackelberg game model between the EBSP and the prosumer alliance is a bi-level optimization problem. Such problems are commonly solved by reformulating the lower-level problem using the Karush–Kuhn–Tucker (KKT) conditions. However, since the lower-level model contains binary variables, the lower-level variables cannot be transformed into constraints and embedded into the upper-level model through the KKT conditions. Therefore, this paper adopts a PSO algorithm embedded with the CPLEX solver to solve the problem. The proposed model was implemented in MATLAB R2021b and solved using IBM ILOG CPLEX Optimization Studio 12.10. The main steps of the PSO algorithm are as follows:
(1)
Set the parameters of the PSO algorithm, including the swarm size N, the maximum number of iterations M, and other related parameters. The upper-level EBSP initializes N groups of electricity purchase and sale prices and transmits them to the lower-level prosumer alliance. The iteration index is set as m = 0.
(2)
Based on the electricity price information, the lower-level prosumer alliance solves its optimization problem using the CPLEX solver. The optimized electricity trading quantities between the prosumer alliance and the EBSP are then passed back to the upper-level EBSP, and the iteration index is updated as m = m + 1.
(3)
Based on the returned electricity trading quantities, the upper-level EBSP calculates the corresponding revenue. The group-best revenue and the individual-best revenue of each price particle are then obtained by comparison.
(4)
If m < M, the upper-level EBSP updates the electricity price information for the next iteration according to the price strategies corresponding to the group-best revenue and the individual-best revenue. The updated prices are then transmitted to the lower-level prosumer alliance, and the algorithm returns to Step 2.
(5)
If m ≥ M, the maximum number of iterations is reached and the solution process terminates. The electricity price strategy corresponding to the group-best revenue is regarded as the Stackelberg equilibrium solution.

4.2. Cooperative Game Solution Based on ADMM Algorithm

For prosumers i and j, the P2P energy transaction cost C i p 2 p and transaction quantity P i j , t E X are obtained from Subproblem P1. The energy transaction price τ i j , t p 2 p is treated as a coupling variable. Therefore, an auxiliary variable τ i j , t p 2 p is introduced to decouple the problem as follows:
τ i j , t p 2 p = τ j i , t p 2 p = τ i j , t p 2 p ,
where τ i j , t p 2 p denotes the energy trading price expected by prosumer i when trading with prosumer j, and the condition τ i j , t p 2 p = τ j i , t p 2 p indicates that prosumers i and j have reached consensus on the energy trading price.
To preserve the privacy of individual prosumers, the ADMM algorithm is employed to solve Subproblem P2, namely the cooperative benefit allocation problem. The augmented Lagrangian function of Subproblem P2 is formulated as follows:
L i 2 = d i ln { C i N , S C i P R O * t = 1 T [ j = 1 , j i N ( τ i j , t p 2 p P i j , t E X * ) ] } + t = 1 T j = 1 , j i N [ ρ 2 ( τ i j , t p 2 p τ i j , t p 2 p ) 2 + γ i j , t ( τ i j , t p 2 p τ i j , t p 2 p ) ]
where P i j , t E X * denotes the optimal power exchange quantity between prosumers i and j, obtained from Subproblem P1; ρ denotes the penalty factor; and γ i j , t denotes the dual variable associated with the power exchange. The variable update rules and convergence criteria for the ADMM algorithm are presented in Appendix D.
The solution procedure of the hybrid game model is illustrated in Figure 4 and consists of two stages. In Stage I, the particle swarm optimization (PSO) algorithm is used to solve the upper-level Stackelberg game. This stage determines the electricity purchase and sale prices set by the EBSP, the total purchased and sold electricity of the prosumer alliance, the inter-member electricity trading quantities, and the optimized outputs of the alliance’s internal generation units. The electricity prices and inter-prosumer electricity exchanges obtained in this stage are then used as inputs for Stage II. In Stage II, the alternating direction method of multipliers (ADMM) is employed to determine the internal settlement prices and the distribution of cooperative profits among alliance members.

5. Results and Discussion

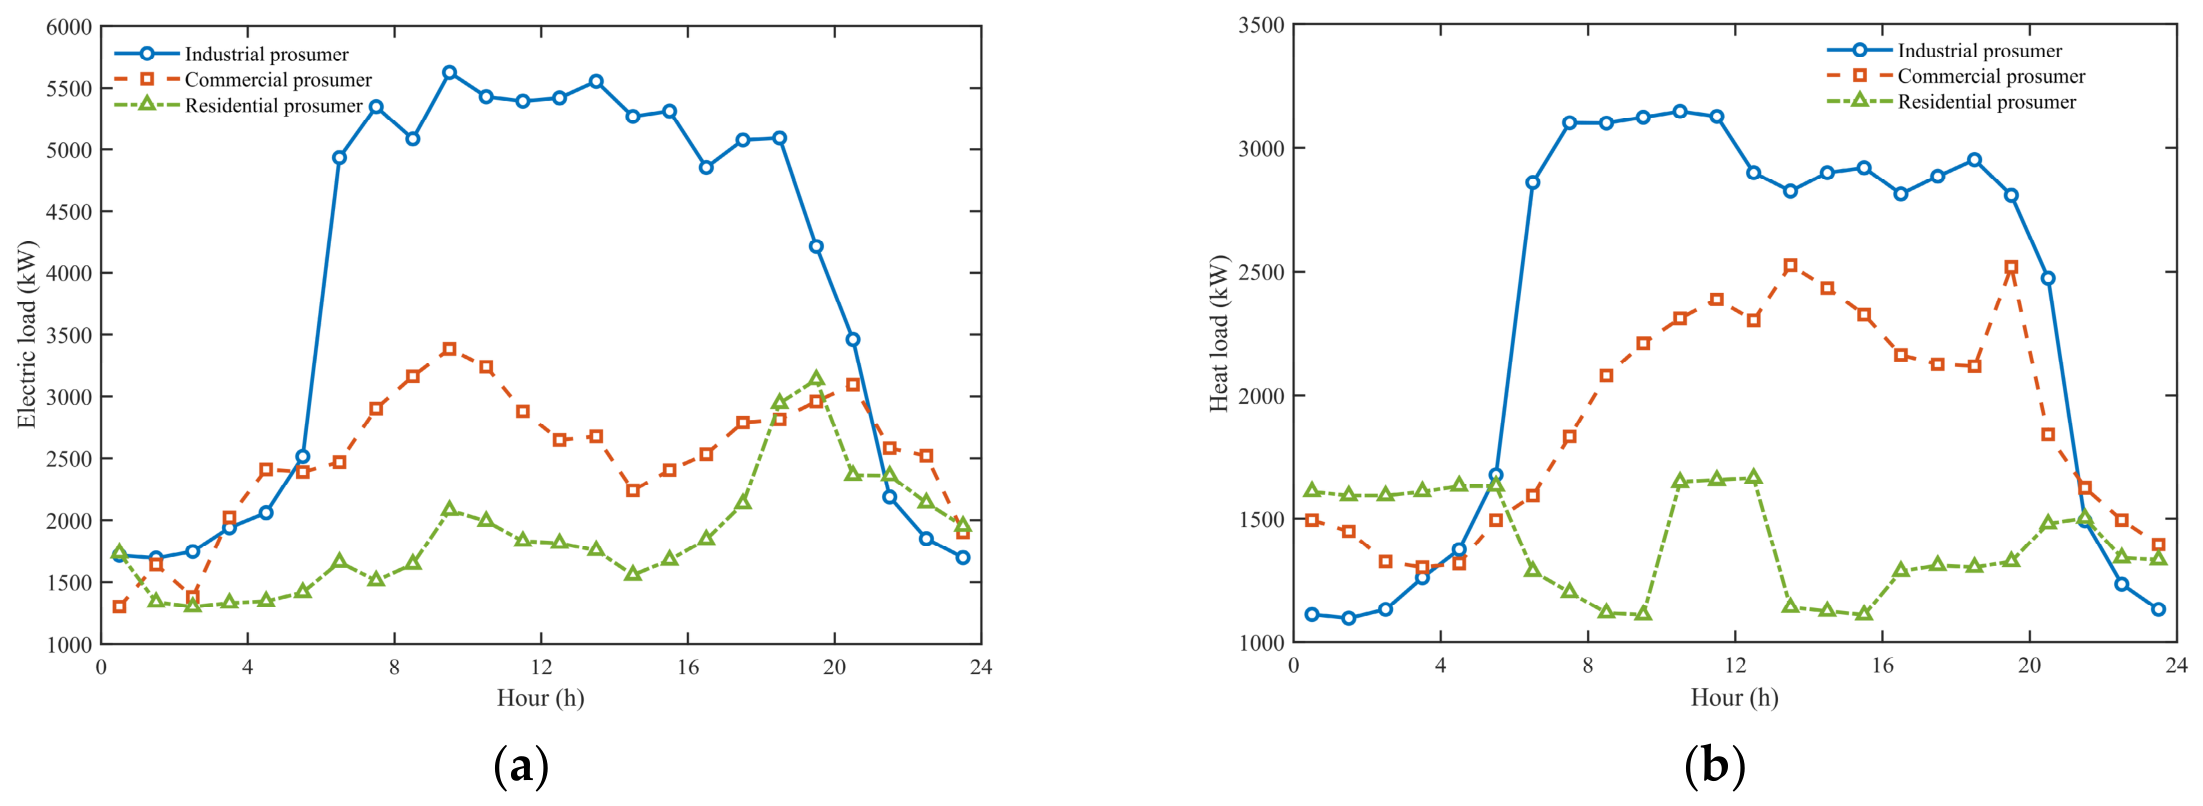
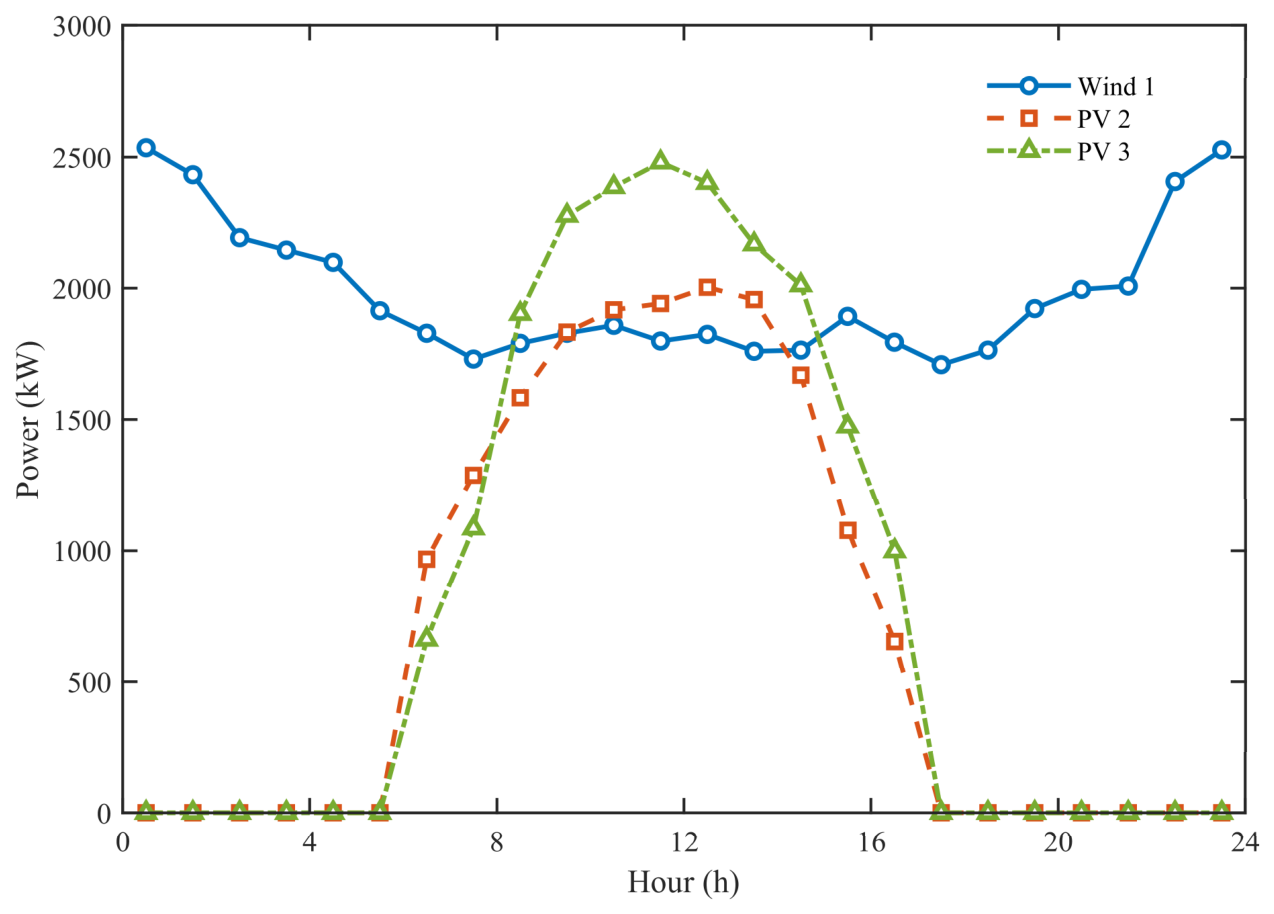
This study considers three representative prosumer types in the case analysis: industrial, commercial, and residential prosumers. The equipment parameters for each prosumer type and the remaining operational parameters are adopted from Chen et al. [40]. The grid electricity price, feed-in tariff, electrical and thermal load profiles, and renewable generation profiles used for the case study are summarized in Appendix E.
It should be noted that the case study uses representative prosumer settings and literature-based parameters, rather than a real-world empirical dataset. Therefore, the results mainly demonstrate the mechanism and effectiveness of the proposed framework under typical heterogeneous prosumer conditions, while its practical applicability will be further validated using field data in future work.

5.1. Convergence Analysis of the Algorithm

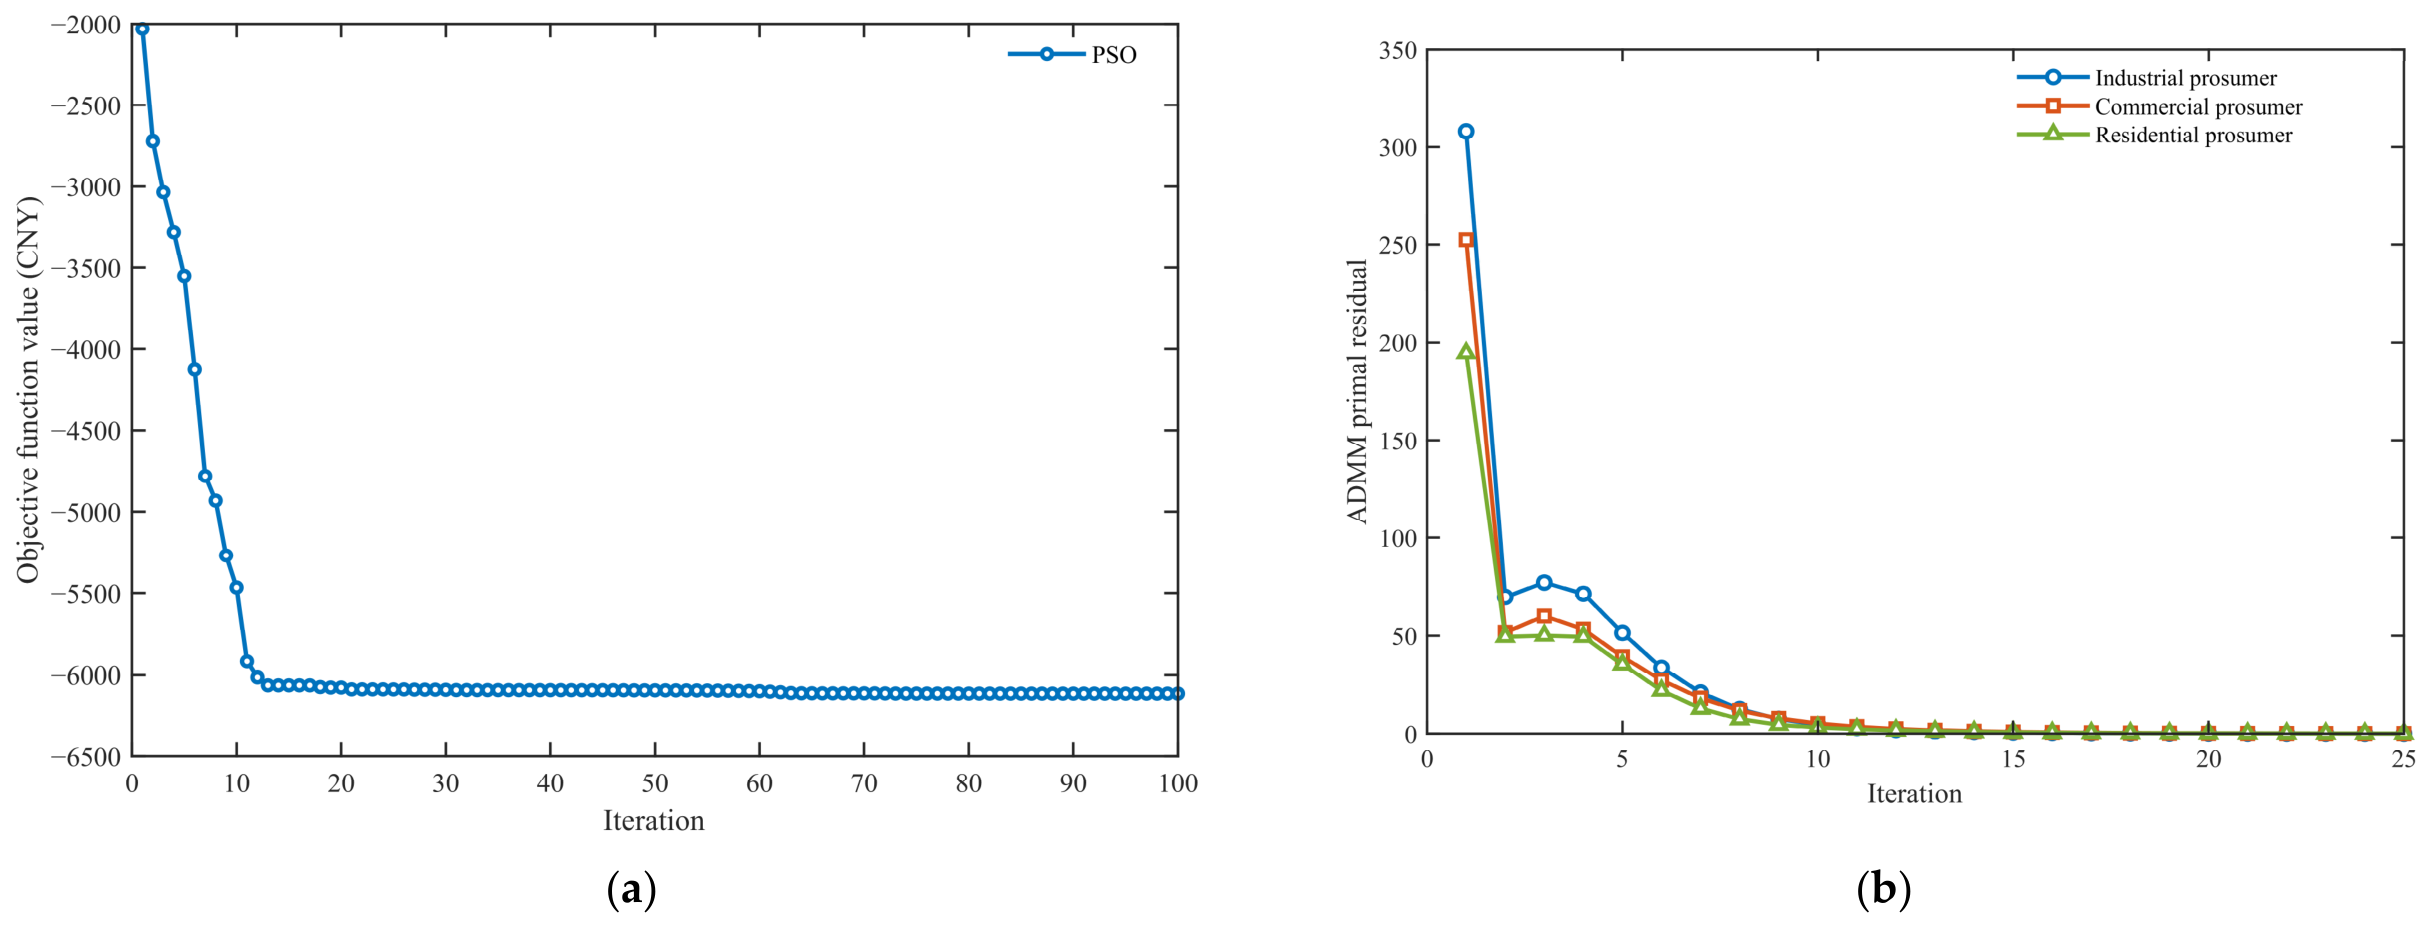
The proposed PSO–ADMM framework was implemented using the following key parameter settings. For the upper-level PSO, the swarm size was set to 40 particles, and the maximum number of iterations was set to 100. The inertia weight and learning coefficients were adaptively adjusted during the iterative process. For the lower-level ADMM, a penalty factor of 1.0 and a convergence threshold of 10−3 were adopted for the primal residuals.
Figure 5 illustrates the convergence behavior of the two solution stages. As shown in Figure 5a, the PSO objective function decreases rapidly and becomes nearly stable after about 63 iterations. This indicates that the upper-level Stackelberg pricing problem converges effectively, and the EBSP can obtain the optimal electricity purchase and sale prices for the prosumer alliance. As shown in Figure 5b, the ADMM primal residuals converge within about 25 iterations. This result confirms that, after the electricity prices and inter-prosumer trading quantities are obtained from the PSO-based Stackelberg stage, the ADMM algorithm can stably determine the internal settlement prices and cooperative benefit allocation among alliance members.
In terms of computational performance, the PSO stage required approximately 473.52 s, mainly because it solves the non-convex upper-level Stackelberg pricing problem. By contrast, the ADMM stage was completed in only 17.08 s. These results indicate that the proposed PSO–ADMM framework achieves stable convergence with reasonable computational effort, providing a reliable computational basis for the subsequent case study analysis.
It should be noted that the present case study uses three representative prosumer types to verify the mechanism and computational feasibility of the proposed PSO–ADMM framework. Although similar representative multi-prosumer settings are commonly used in related studies, the computational burden may increase for larger systems with more prosumers, devices, and decision variables. This is mainly because the upper-level PSO repeatedly calls the lower-level optimization problem during iterations. Therefore, future work will further validate the proposed framework in larger-scale practical systems and explore acceleration strategies such as parallel PSO and distributed ADMM.

5.2. Electricity Pricing and CET–GCT Market Analysis

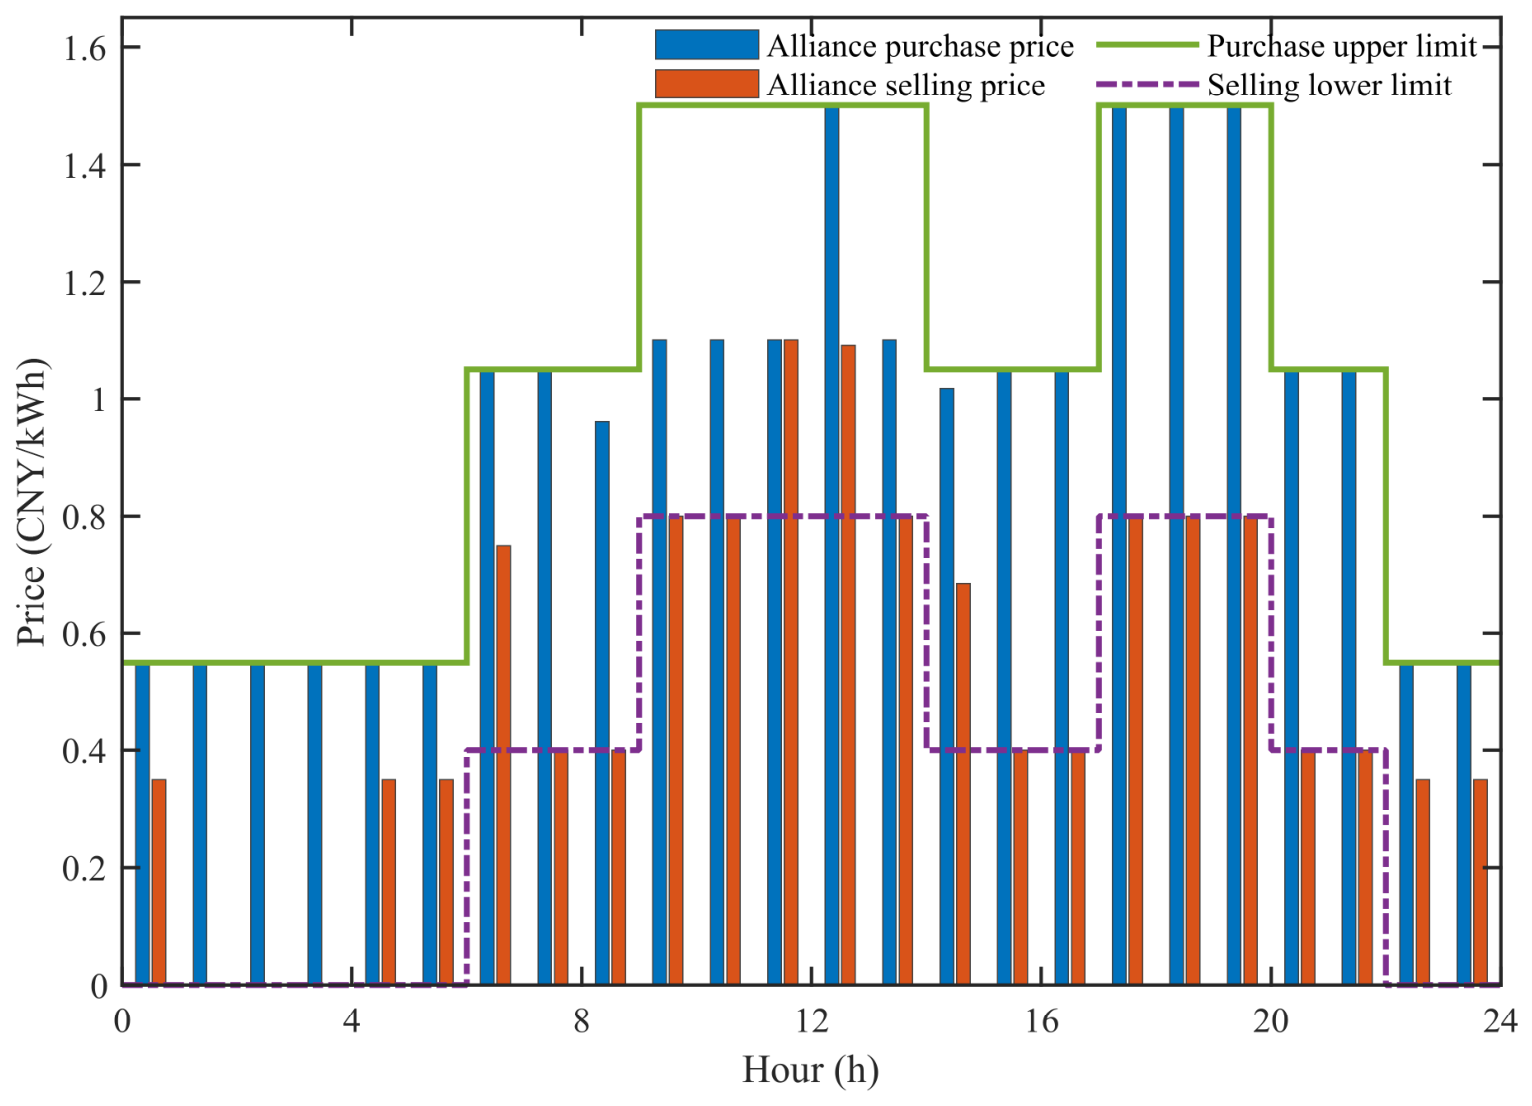
In Stage I, the EBSP acts as the leader and determines the electricity trading prices for the prosumer alliance. The optimized electricity buying and selling prices obtained under the proposed Stackelberg game framework are shown in Figure 6. These results reflect the effectiveness of the proposed pricing mechanism.
According to the optimized pricing results, the EBSP sets relatively low electricity purchase prices during the valley-load periods, namely 00:00–06:00 and 22:00–24:00. In contrast, the electricity purchase price remains relatively high during 09:00–14:00 and 17:00–20:00. It reaches the upper bound during 12:00–13:00 and 17:00–20:00. This indicates that the EBSP tends to increase the electricity trading price during high-demand periods to increase its own revenue. The electricity selling price also increases during several high-load periods, especially around 11:00–13:00 and 17:00–20:00. However, it remains within the prescribed price bounds. Therefore, the proposed Stage I Stackelberg game can determine the electricity trading prices between the EBSP and the prosumer alliance while avoiding excessive price fluctuations. It also maintains a balance between the interests of both parties.
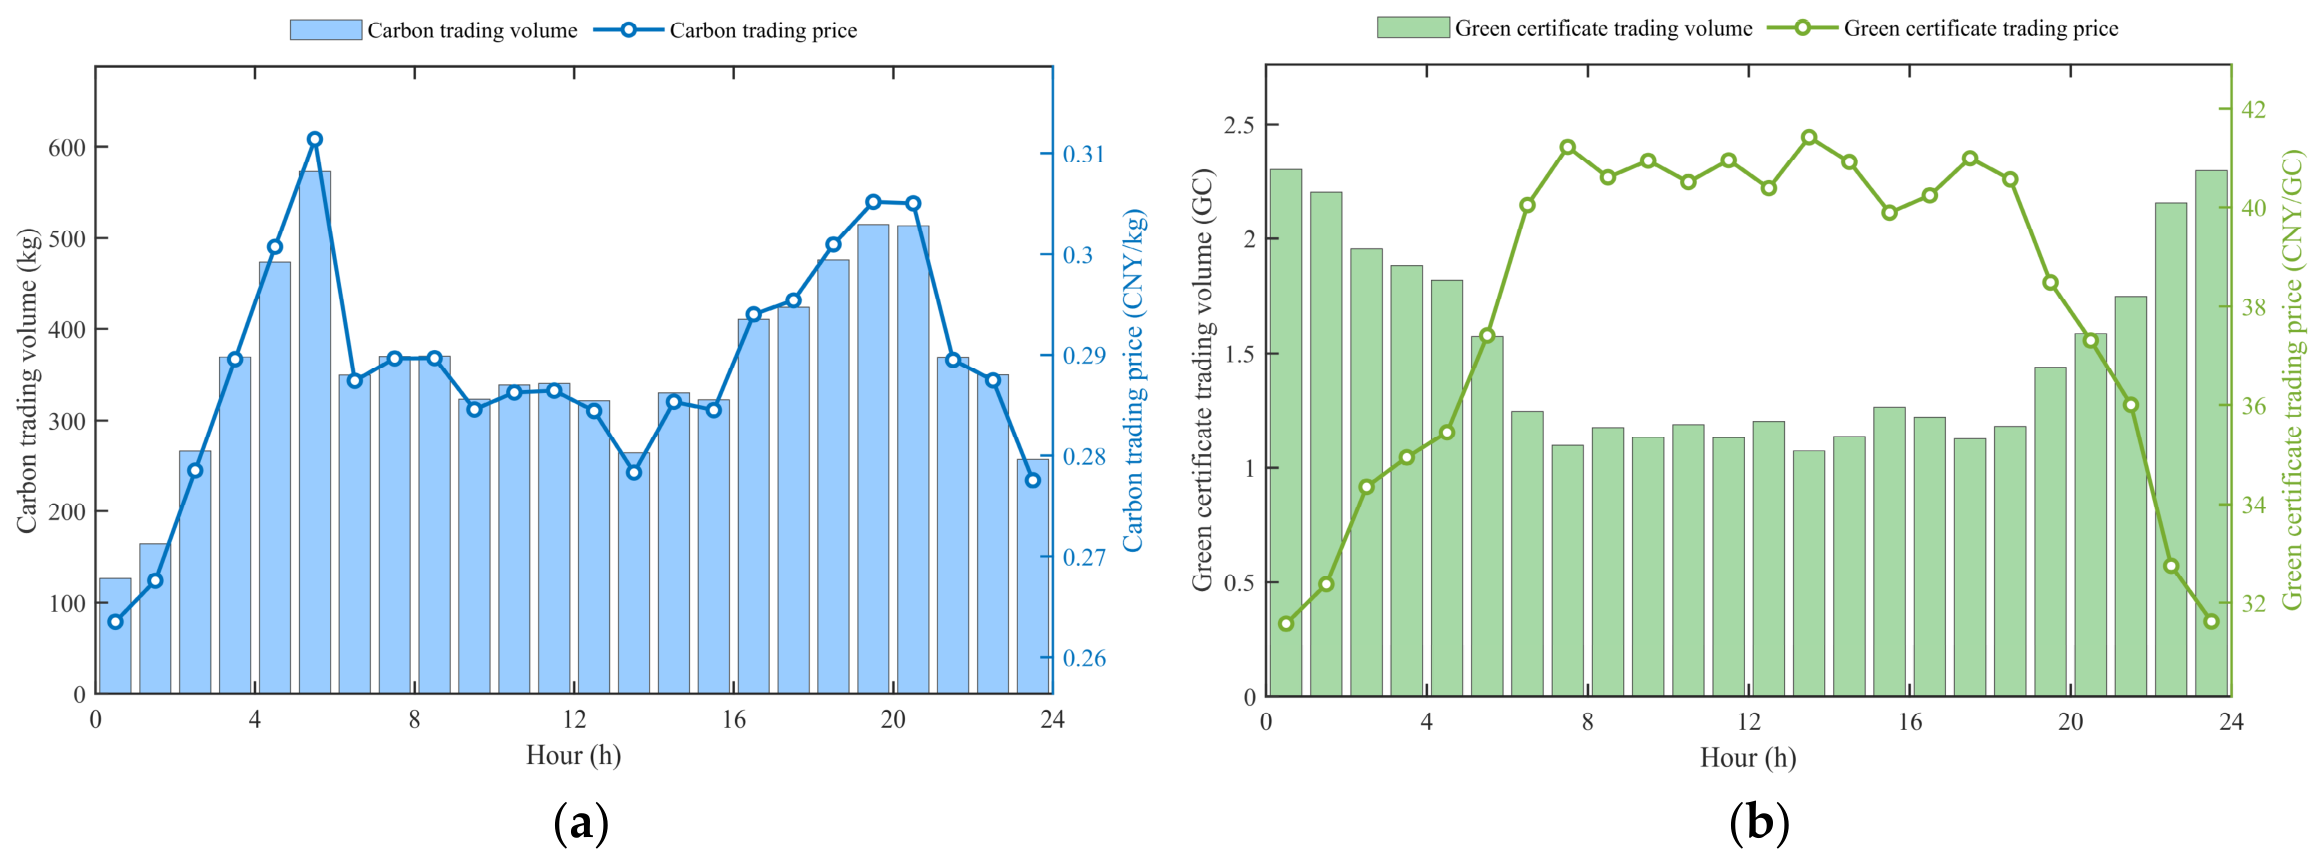
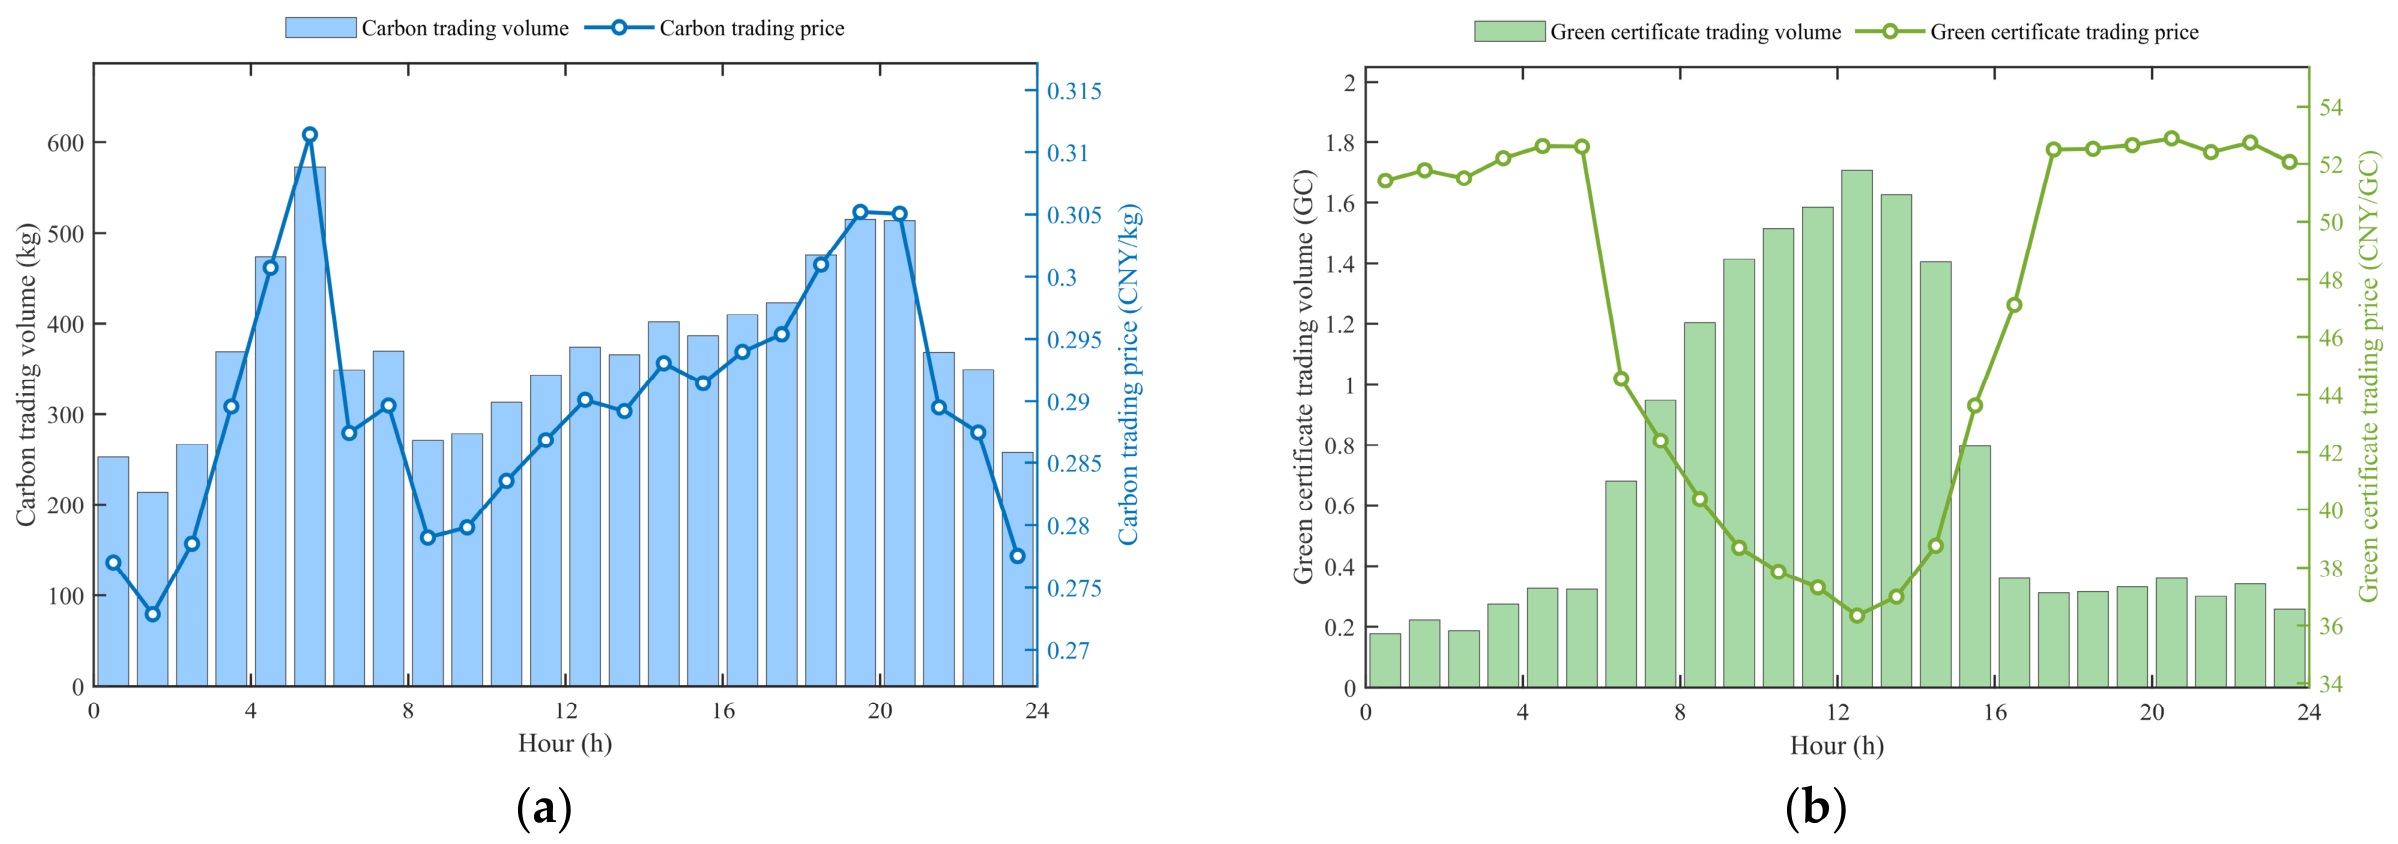
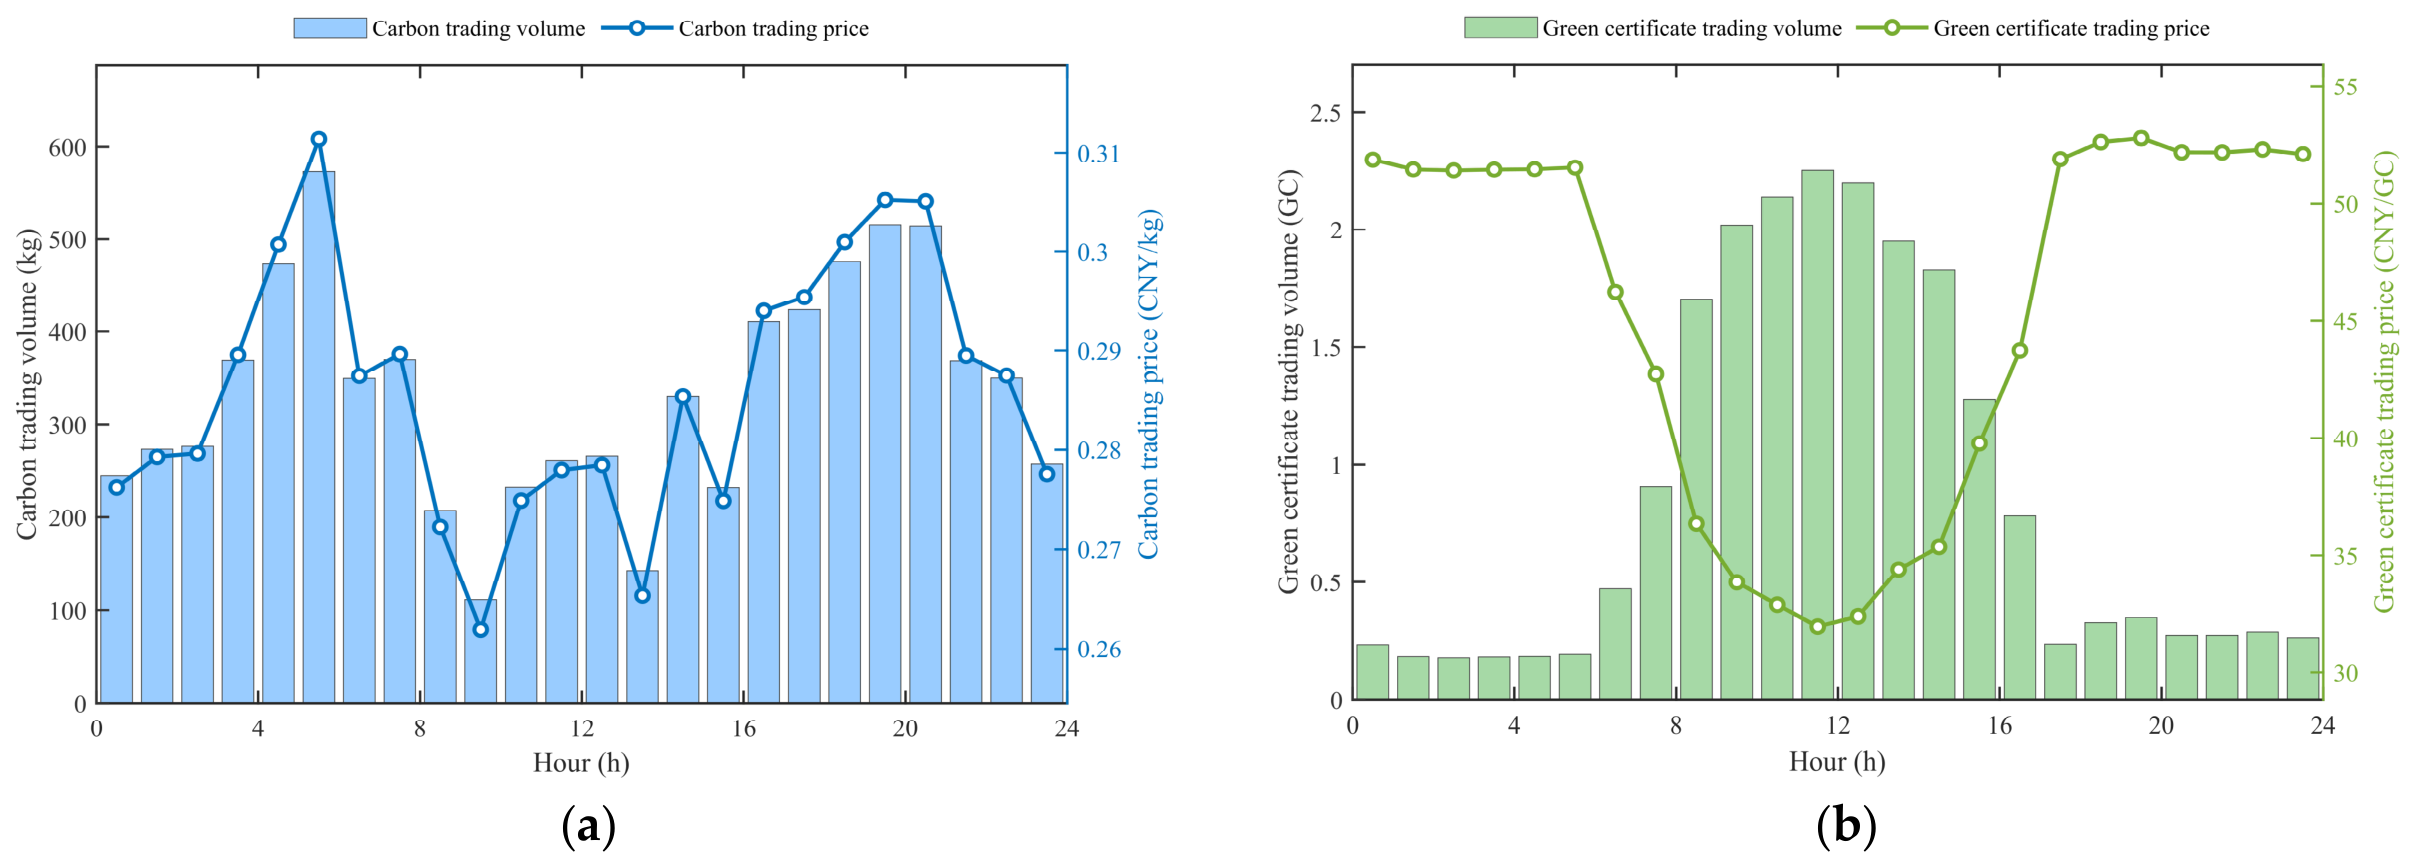
Figure 7 shows the price–quantity relationships in the carbon market and green certificate market for the industrial prosumer. As shown in Figure 7a, the industrial prosumer has a carbon allowance deficit during the scheduling horizon and therefore needs to purchase additional carbon allowances from the carbon market. The total carbon allowance trading volume is 8616.89 kg, and the corresponding carbon trading cost is CNY 2512.89. The carbon price changes dynamically with carbon allowance demand. This result reflects the supply–demand response of the proposed piecewise linear dynamic pricing mechanism.
As shown in Figure 7b, the industrial prosumer has a green certificate surplus during the scheduling horizon. Specifically, it generates 47.52 green certificates, while its quota requirement is only 11.40 certificates. Therefore, the net green certificate trading volume is −36.12 certificates, and the corresponding trading cost is CNY −1337.47. The negative trading volume indicates net sales of surplus green certificates, while the negative trading cost represents the revenue obtained from these sales. The corresponding carbon and green certificate trading results for the commercial and residential prosumers are provided in Appendix F.
These results show that the proposed interactive carbon–green certificate trading model with piecewise linear dynamic pricing can capture the dynamic relationship between market prices and supply–demand conditions.
To further evaluate the effectiveness of the proposed method, five comparative scenarios are designed, as summarized in Table 1.

5.3. Comparative Analysis of Costs and Carbon Emissions Under Different Scenarios

According to Table 2, the total alliance cost in Scenario 5 is CNY 119,427.56. This is CNY 9251.83 lower than that in Scenario 2, while the EBSP profit decreases by CNY 6233.45. The reduction in alliance cost is mainly attributable to the change in the internal trading pattern after electricity sharing is introduced. Owing to the temporal complementarity among industrial, commercial, and residential prosumers, surplus electricity from one prosumer can be transferred to other prosumers with power deficits during high-price periods. As a result, the alliance reduces electricity purchases from the EBSP during peak periods. This lowers the total operating cost of the alliance, although it also reduces the EBSP’s trading revenue.
Compared with Scenario 3, Scenario 5 further incorporates the piecewise linear dynamic CET–GCT interaction mechanism. This leads to a reduction of CNY 4480.67 in the total alliance cost, including a decrease of CNY 5250.38 in carbon trading cost. This effect occurs because the mutual recognition mechanism allows part of the green certificates to be converted into carbon offsets, thereby reducing the net carbon allowance demand of the alliance. Under the piecewise linear dynamic carbon pricing mechanism, the decline in net carbon demand not only reduces the volume of purchased carbon allowances, but also lowers carbon trading expenditure through the price–response effect. Therefore, the CET–GCT interaction mechanism improves the alliance economy through both quantity reduction and price adjustment.
As shown in Table 3, the total carbon emissions of the alliance in Scenario 5 are 96,213.83 kg. This is 13,109.75 kg lower than that in Scenario 2. The reduction is mainly due to the decrease in high-carbon external energy supply. In Scenario 2, the absence of electricity sharing forces individual prosumers to rely more heavily on gas turbine generation or additional grid electricity purchases during peak-load periods. Both actions increase carbon emissions. In contrast, Scenario 5 enables internal electricity exchange, allowing part of the demand to be supplied by surplus low-carbon electricity within the alliance. This reduces both gas turbine output and external electricity purchases, thereby lowering the total alliance emissions.
Compared with Scenario 3, Scenario 5 further reduces carbon emissions by 3656.72 kg. This finding indicates that the CET–GCT interaction mechanism affects not only settlement costs, but also operational decisions. By linking green certificates with carbon offsets, the proposed mechanism strengthens the low-carbon value of renewable electricity and encourages a dispatch pattern with lower carbon compliance pressure. As a result, total emissions are further reduced.

5.4. Comparative Analysis of Different CET–GCT Pricing Mechanisms

To further evaluate the effectiveness of the proposed piecewise linear dynamic CET–GCT pricing mechanism, two additional benchmark pricing mechanisms are introduced for comparison: a fixed-price mechanism and a stepwise pricing mechanism. In all three cases, the prosumer electricity sharing mechanism, the CET–GCT mutual recognition mechanism, and the price-based demand response model are retained. Therefore, the differences in the results can be mainly attributed to the pricing mechanisms adopted in the carbon and green certificate markets.
The fixed-price mechanism assumes that the carbon price and green certificate price remain constant throughout the scheduling horizon. The stepwise pricing mechanism adjusts market prices according to several predefined trading-volume intervals, with discontinuous price changes at interval boundaries. In contrast, the proposed mechanism adjusts carbon and green certificate prices continuously according to trading volumes through piecewise linear functions. The comparison results are shown in Table 4.
As shown in Table 4, the proposed piecewise linear dynamic pricing mechanism achieves the lowest total carbon emissions and carbon allowance demand among the three pricing mechanisms. Under the proposed mechanism, total carbon emissions are 96,213.83 kg, which are 2.31% and 0.56% lower than those under the fixed-price and stepwise pricing mechanisms, respectively. Meanwhile, carbon allowance demand is reduced by 2.35% and 0.74%, respectively. These results indicate that the proposed mechanism provides a stronger low-carbon price signal and guides the prosumer alliance toward lower-emission dispatch decisions.
From an economic perspective, the total operating cost of the alliance under the proposed mechanism is slightly higher than that under the fixed-price mechanism, with an increase of 1.91%. This is because the fixed-price mechanism cannot reflect variations in carbon allowance scarcity or green certificate surplus. Although the proposed mechanism reduces carbon allowance demand, its average carbon price reaches 0.291 CNY/kg, which is higher than the fixed carbon price of 0.250 CNY/kg. This leads to a higher carbon trading cost. Therefore, the proposed mechanism reflects carbon allowance scarcity more effectively and imposes a stronger cost constraint on carbon-intensive operation.
Compared with the stepwise pricing mechanism, the total operating cost of the alliance under the proposed mechanism increases by 2.28%. This is mainly because the stepwise mechanism produces higher green certificate revenue, reaching CNY 3643.98, whereas the revenue under the proposed mechanism is CNY 2117.04. Since all prosumers have green certificate surpluses, the proposed dynamic pricing mechanism reduces the certificate price when market supply increases. This price adjustment is consistent with the supply–demand relationship in the GCT market and avoids overestimating the economic value of surplus green certificates.
Although the stepwise mechanism has the lowest total operating cost, its total carbon emissions are higher than those of the proposed mechanism. In addition, the stepwise mechanism introduces discontinuous price changes at interval boundaries. This may cause abrupt changes in dispatch decisions and increase the computational burden. Its computation time is 832.91 s, whereas that of the proposed mechanism is 473.52 s, representing a reduction of 43.15%. Therefore, compared with the stepwise mechanism, the proposed mechanism provides a smoother price–response relationship and achieves better low-carbon performance with a lower computational burden.
Overall, the proposed pricing mechanism reduces both total carbon emissions and carbon allowance demand while keeping the total operating cost of the alliance within a reasonable range. The increase in operating cost mainly results from the stronger carbon price signal and the dynamic reduction of green certificate prices under surplus conditions. Therefore, the proposed mechanism provides a more realistic response to CET–GCT market supply–demand conditions and offers a better balance between economic performance and low-carbon operation.

5.5. Analysis of Intra-Alliance Electricity Sharing and Benefit Allocation

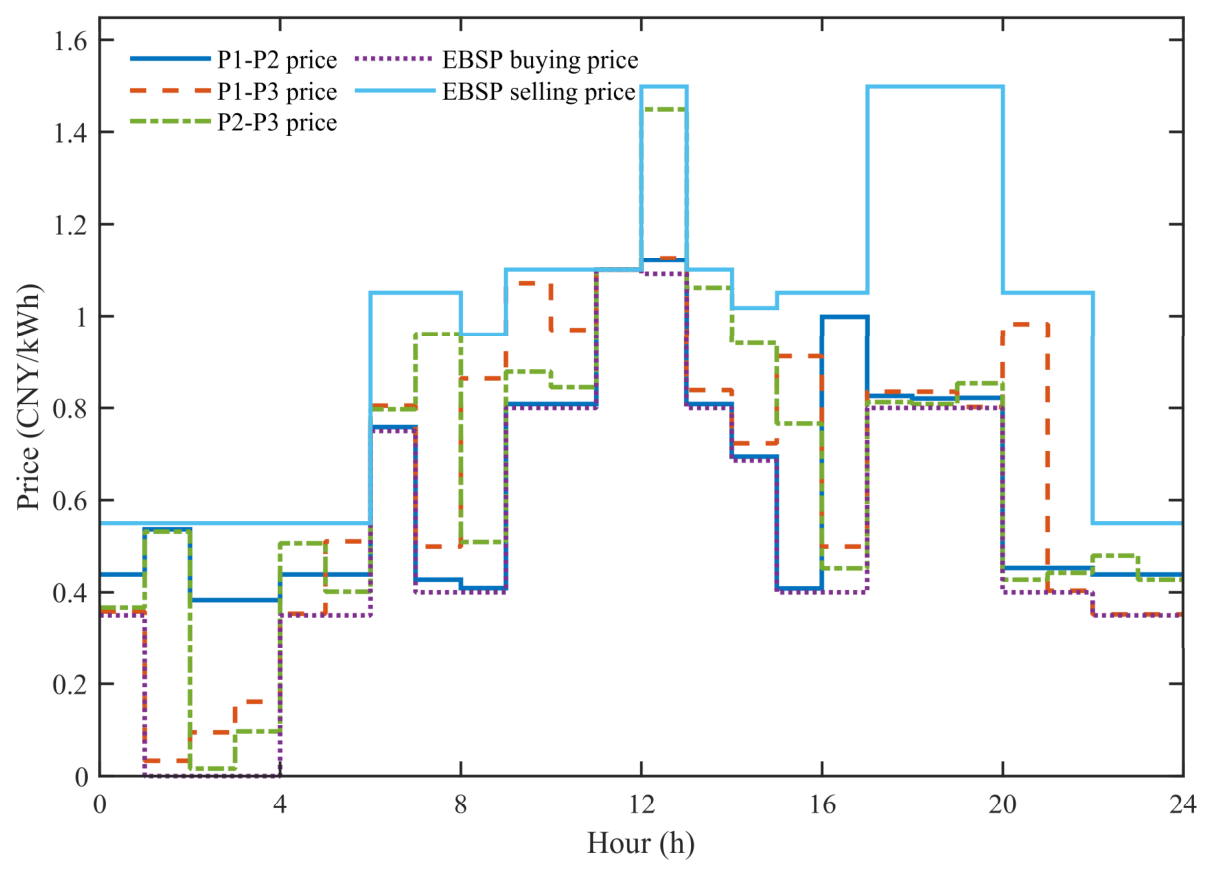
To further illustrate intra-alliance cooperation, Figure 8 and Figure 9 present the intra-alliance electricity transaction prices and exchanged electricity quantities, respectively. Table 5 reports the benefit allocation results under different bargaining models.
As shown in Figure 8, the intra-alliance electricity transaction price always remains between the EBSP buying price and selling price. This indicates that the proposed internal pricing mechanism operates within a reasonable price interval. Under this pricing rule, internal sellers can obtain higher revenue than from external sales, while internal buyers can purchase electricity at a lower cost than from the EBSP. Therefore, the proposed mechanism provides direct economic incentives for electricity sharing within the alliance.
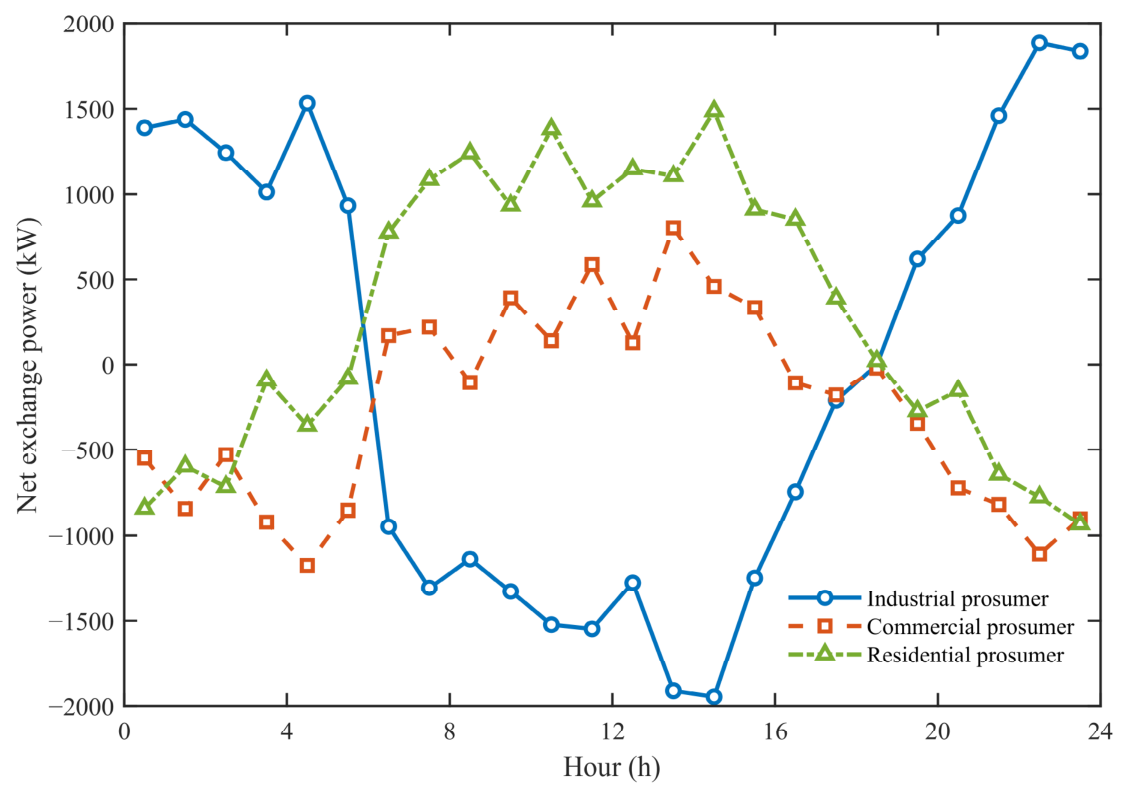
Figure 9 shows that the exchanged electricity quantities among prosumers vary dynamically over time. This reflects the complementarity among different prosumers in terms of generation and load characteristics. Through intra-alliance electricity exchange, the alliance can achieve local power balance in different periods, reduce external electricity purchases during peak-load periods, and improve the utilization efficiency of internal electricity resources.
Table 5 shows that the bargaining model directly affects the distribution of cooperative benefits. Under the asymmetric Nash bargaining model, benefit allocation depends on the bargaining factors of different prosumers. By contrast, the standard Nash bargaining model assumes equal sharing. This result suggests that the asymmetric Nash bargaining model is more suitable for reflecting the heterogeneous contributions of prosumers in alliance cooperation.

5.6. Prosumer Optimization Results Analysis

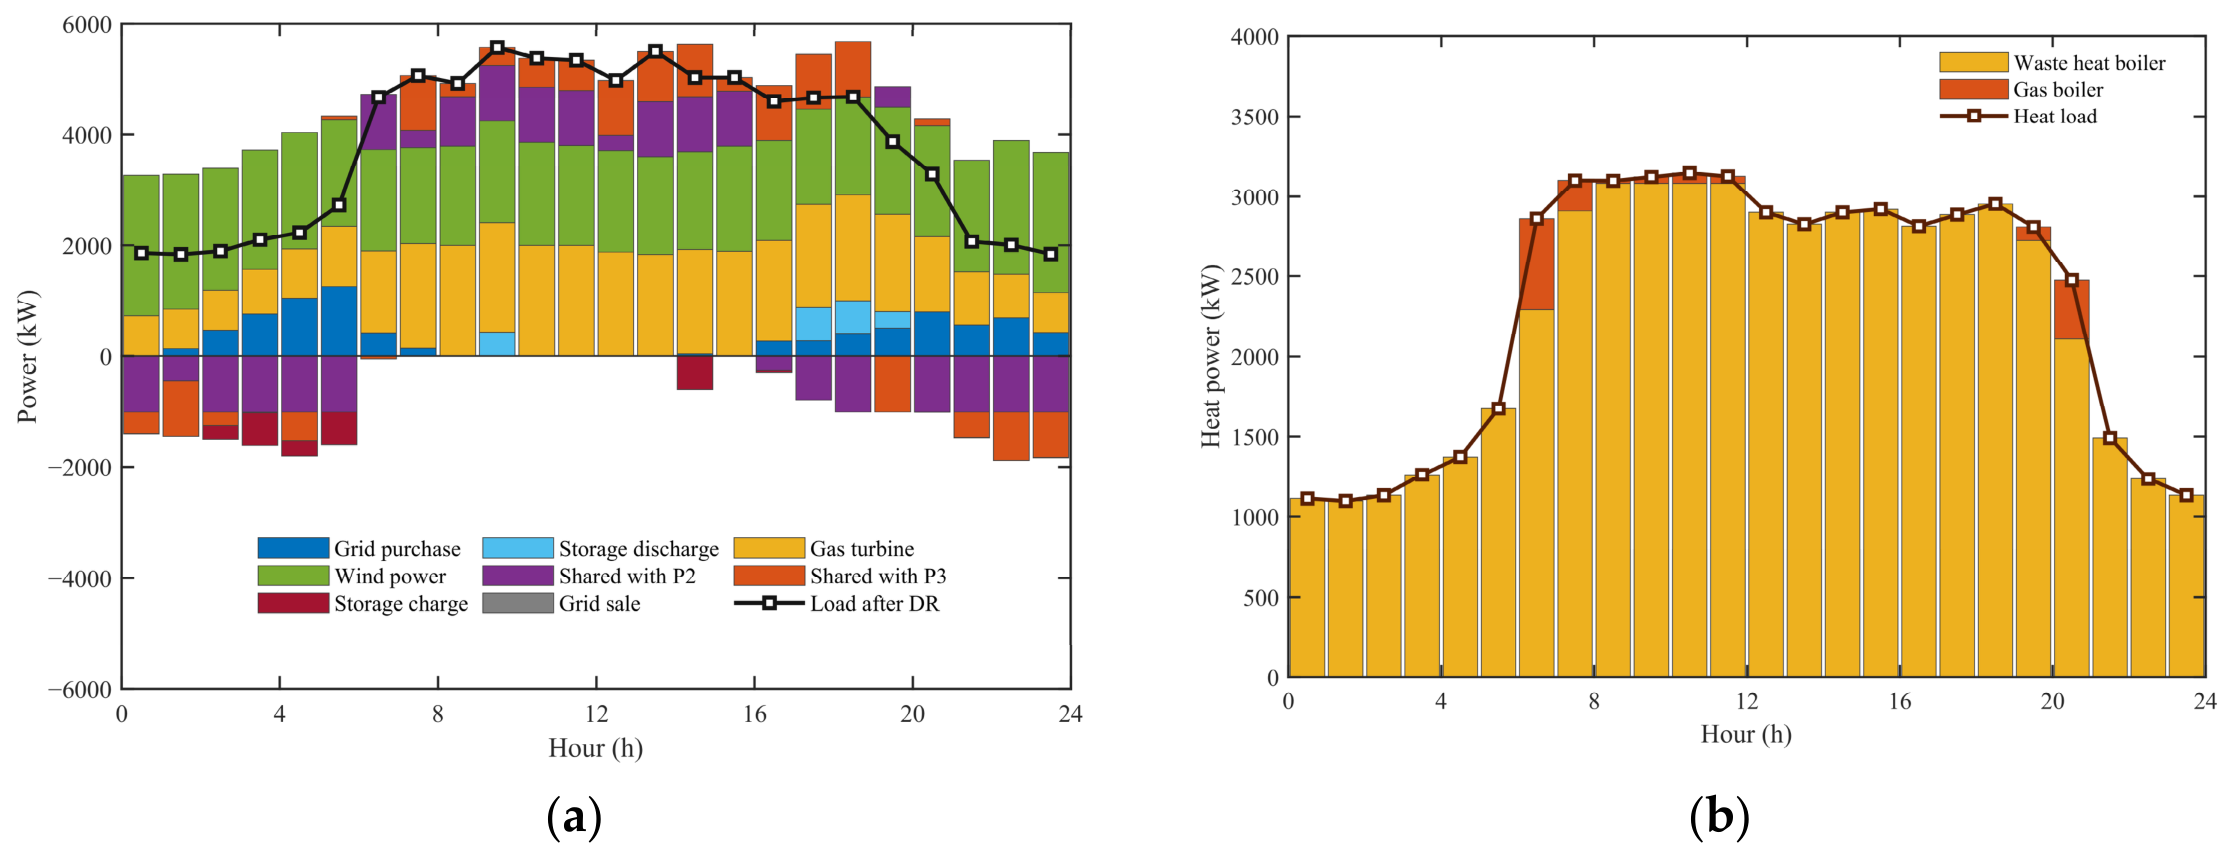
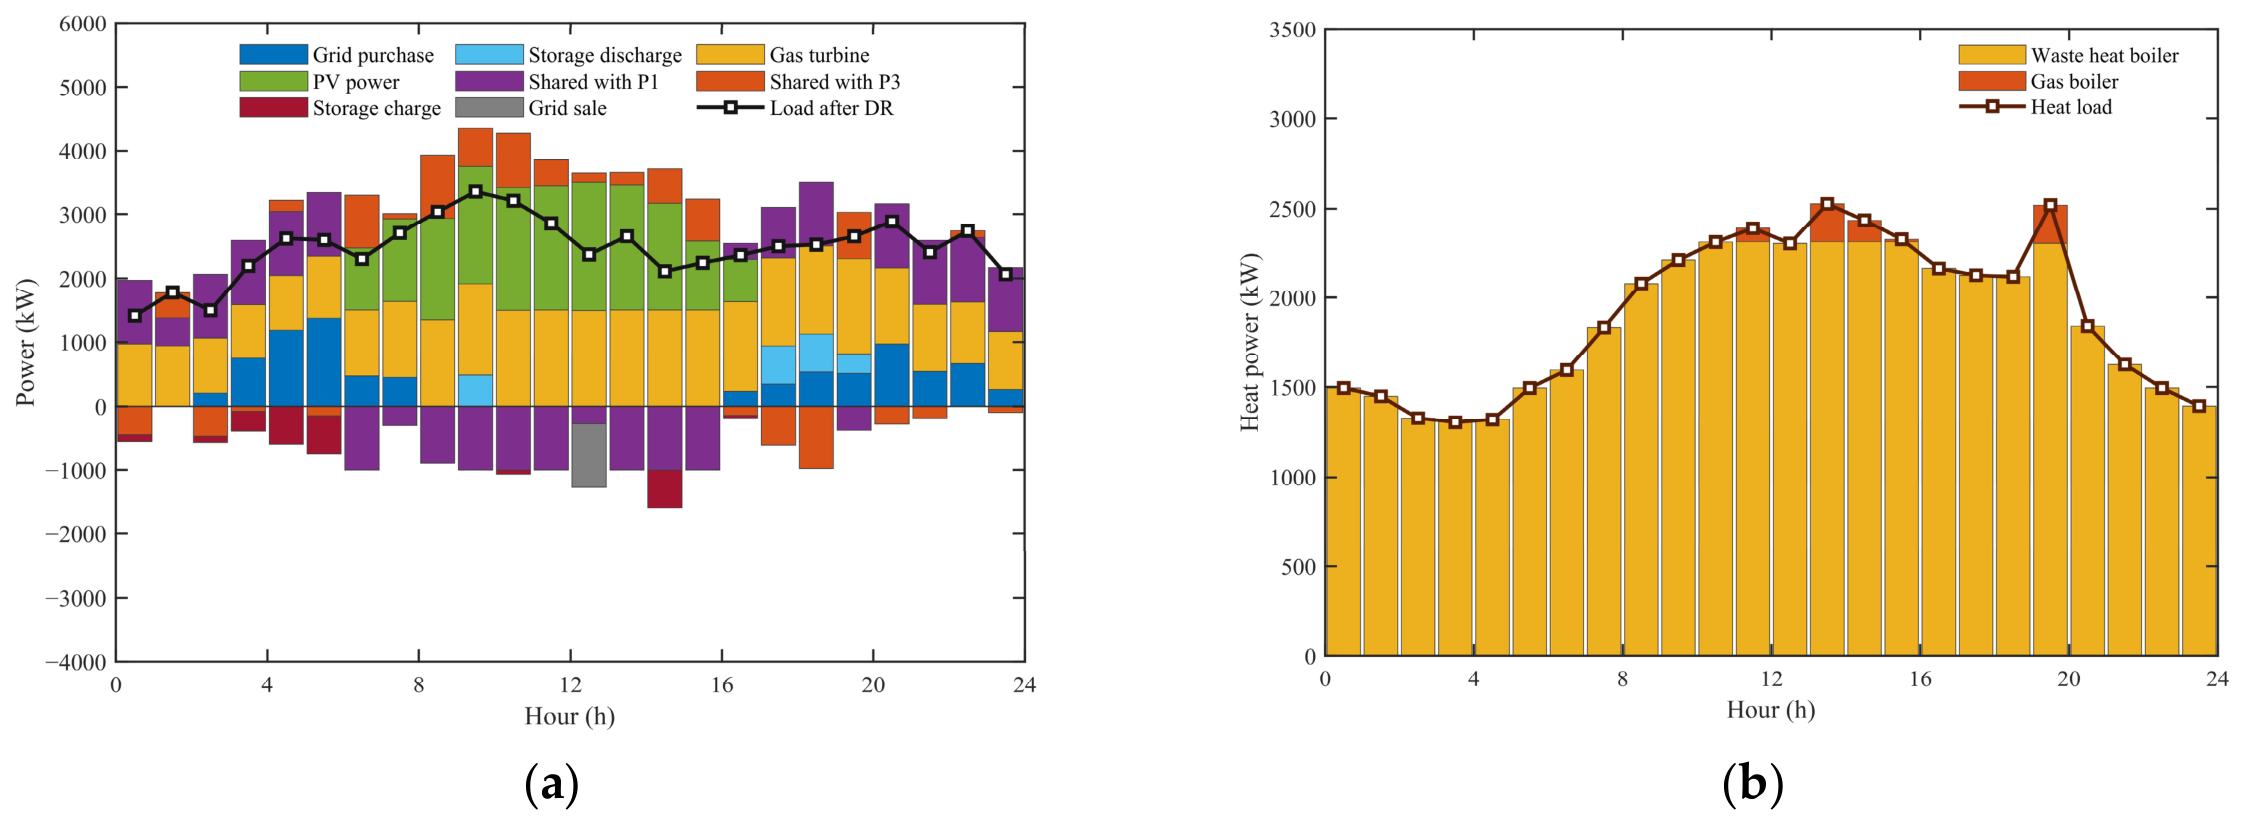
Taking the industrial prosumer as an example, the dispatch results are shown in Figure 10, while the detailed dispatch schedules of the commercial and residential prosumers are provided in Appendix G. As shown in Figure 10, the industrial prosumer has relatively low electricity demand during 00:00–06:00 and 20:00–23:00. During these periods, the output of the CHP unit and renewable energy generation can satisfy most of the local demand. Part of the surplus electricity is either transferred to other prosumers or stored in the energy storage system. Therefore, the industrial prosumer mainly acts as a net electricity supplier within the alliance during these low-load periods, which improves the local utilization of distributed energy resources.
During daytime production hours, especially from approximately 06:00 to 18:00, the electricity demand of the industrial prosumer increases significantly. During this period, the gas turbine output rises and remains at a relatively high level, reaching its upper output range in several peak-load periods. Meanwhile, the industrial prosumer receives electricity from other alliance members during most daytime periods and also purchases electricity from the external grid when necessary. The energy storage system discharges during part of the high-load periods to further support power balance. Therefore, the coordinated use of CHP generation, electricity sharing, grid electricity purchase, and energy storage enables the industrial prosumer to satisfy its load demand while helping reduce the overall operating cost of the alliance.
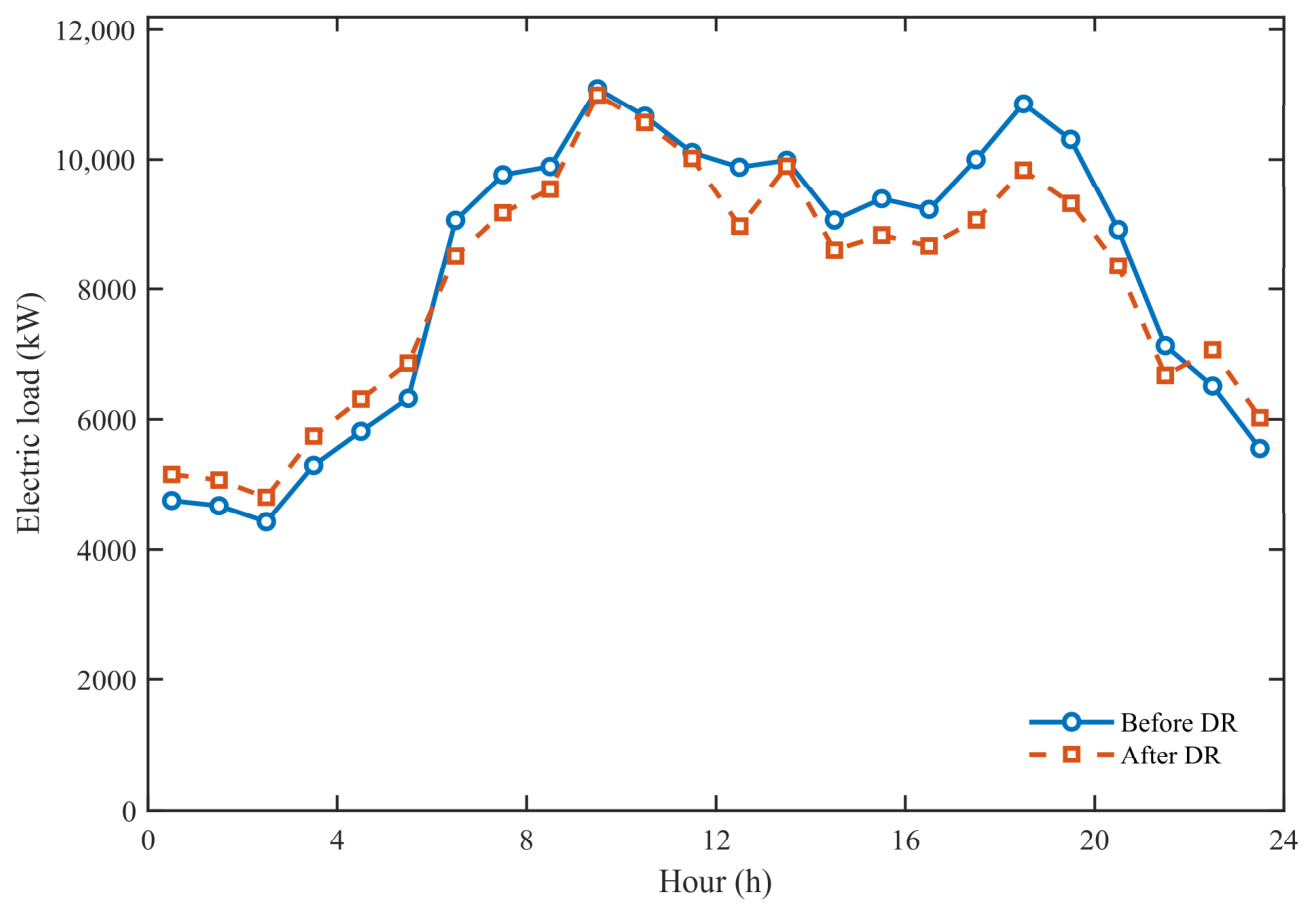
To further illustrate the effect of price-based demand response, the alliance load curves before and after demand response are compared in Figure 11. Scenario 4 does not consider price-based demand response, whereas Scenario 5 includes the proposed demand response model. According to the load data, the peak load and valley load in Scenario 4 are 11,089.88 kW and 4427.03 kW, respectively, and the peak-to-valley difference ratio is 60.08%. After introducing demand response, the peak load decreases to 10,990.91 kW, while the valley load increases to 4803.45 kW. Accordingly, the peak-to-valley difference ratio decreases to 56.30%, representing a reduction of 3.78 percentage points. These results indicate that price-based demand response can reduce peak-period load, increase valley-period load, and improve the load-shaping performance of the prosumer alliance.

5.7. Sensitivity Analysis

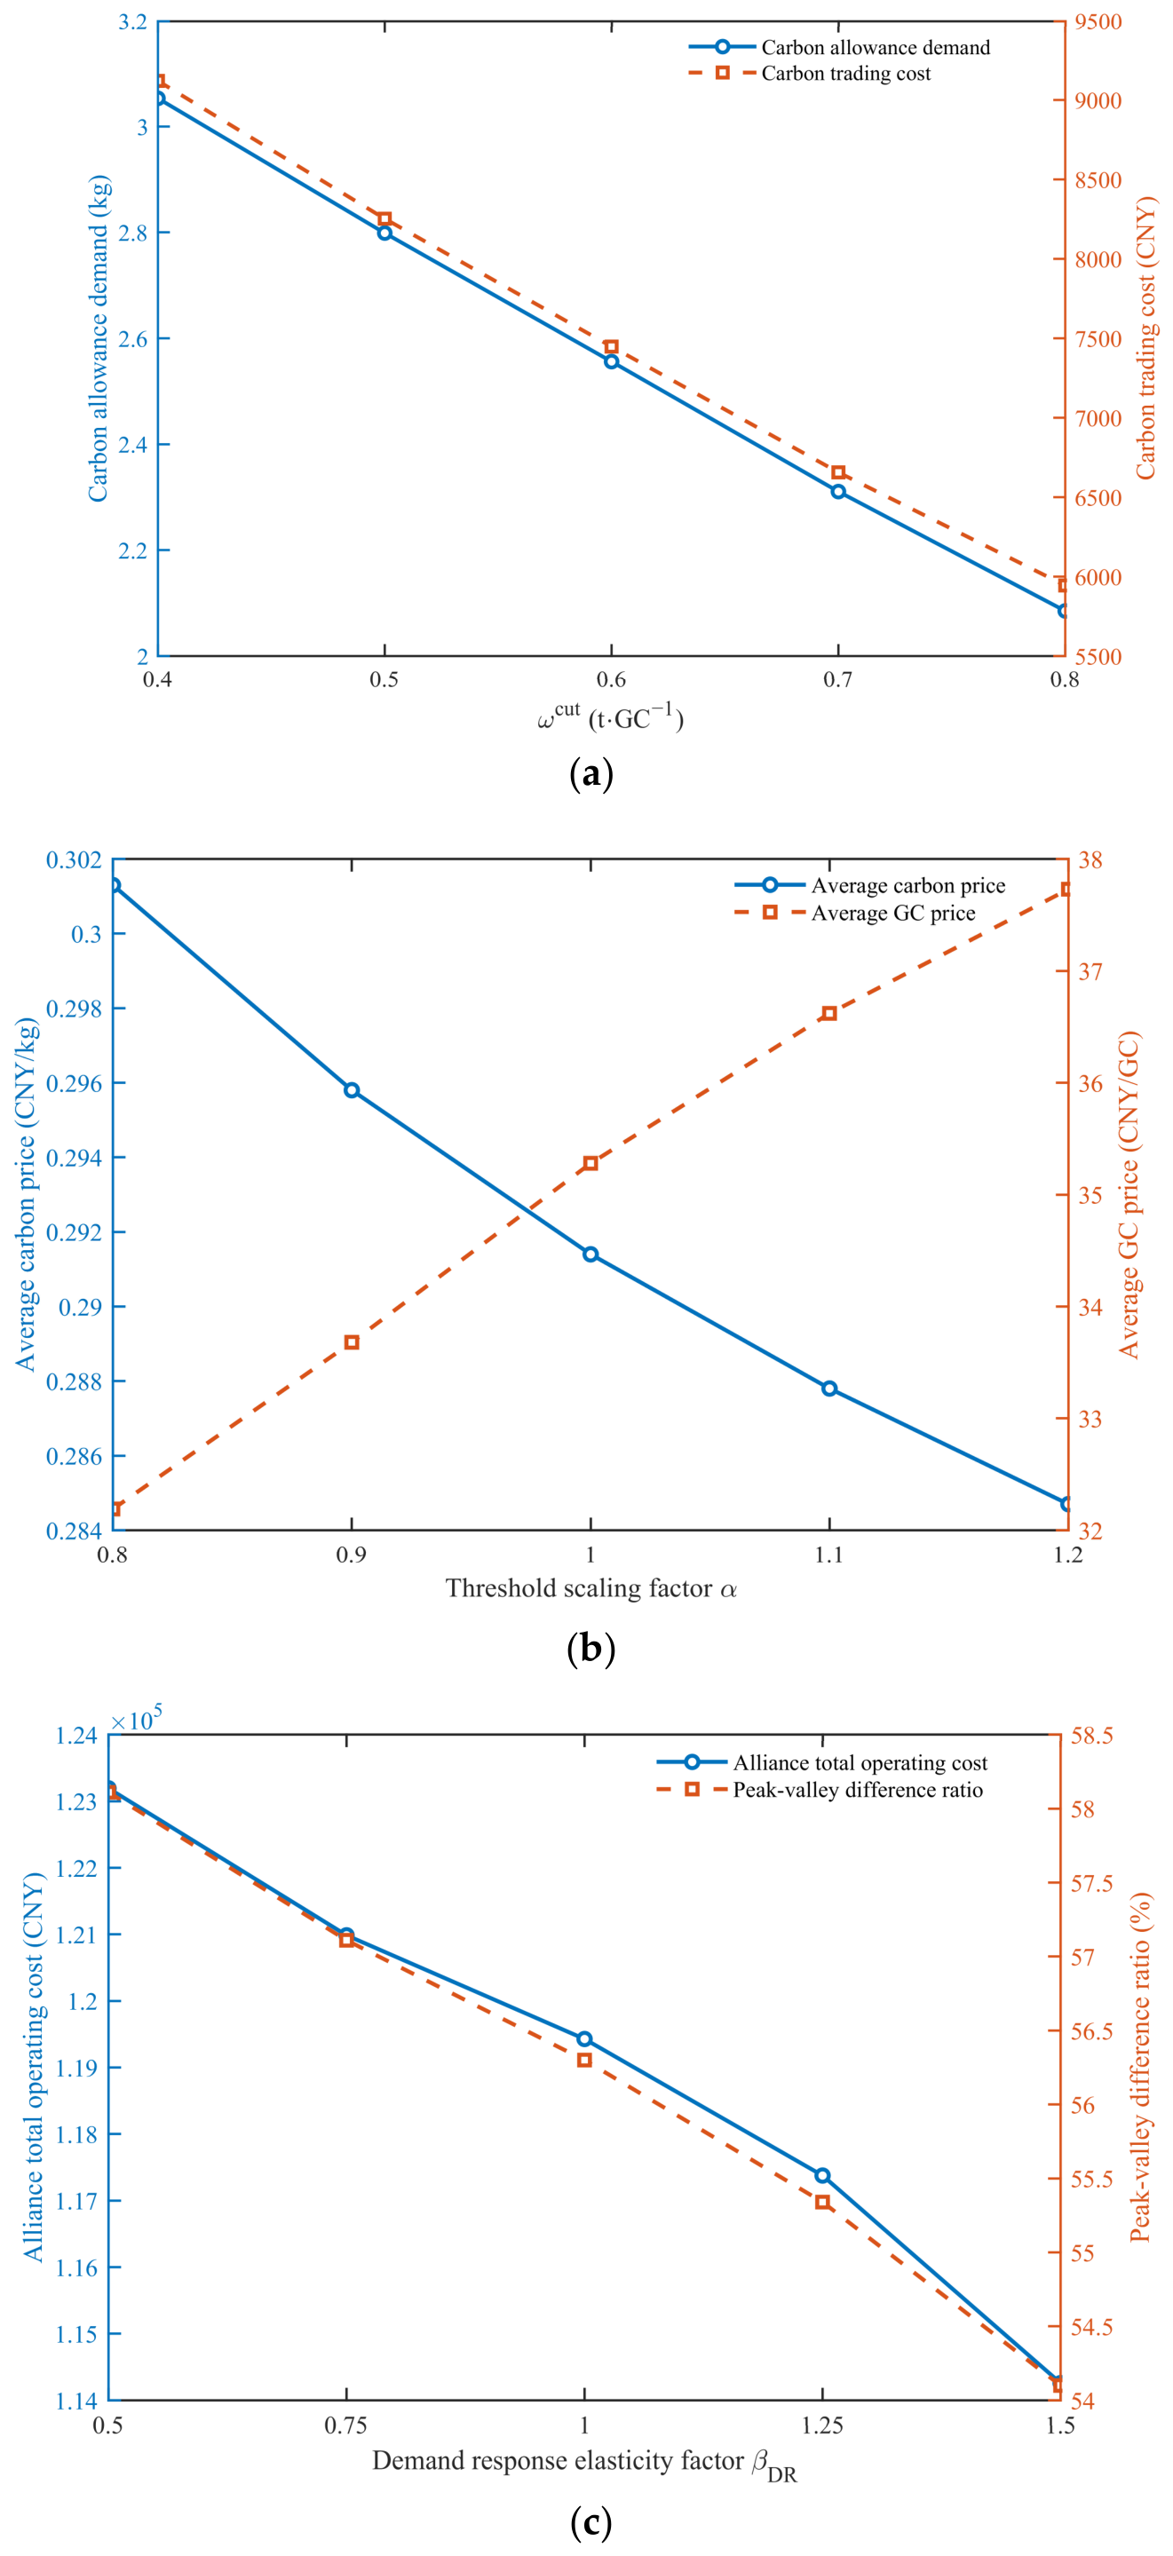
To further examine the robustness of the proposed model, sensitivity analyses are conducted on three key parameters: the carbon reduction coefficient of green certificates, the piecewise linear pricing thresholds, and the demand response elasticity. These parameters are directly related to CET–GCT mutual recognition, market price response, and demand-side flexibility, respectively. The sensitivity results are presented in Figure 12.

5.7.1. Sensitivity to the Carbon Reduction Coefficient

The carbon reduction coefficient represents the carbon emission offset corresponding to one green certificate. In the baseline case, it is set to 0.6 t/GC, indicating that one green certificate corresponds to 600 kg of carbon emission reduction. This value is selected as an approximate baseline according to China’s electricity-related carbon accounting practice, while a dynamic coefficient considering regional grid mix and policy updates will be explored in future work.
As shown in Figure 12a, both carbon allowance demand and carbon trading cost decrease continuously as the carbon reduction coefficient increases. When the carbon reduction coefficient increases from 0.4 to 0.8 t/GC, carbon allowance demand decreases from 30,531.44 kg to 20,850.47 kg, corresponding to a reduction of 31.71%. Meanwhile, the carbon trading cost decreases from CNY 9120.38 to CNY 5944.03, representing a reduction of 34.83%. This occurs because a larger carbon reduction coefficient allows each green certificate to offset more carbon emissions, thereby reducing the net carbon allowance demand after CET–GCT mutual recognition.
The total carbon emissions remain within a relatively narrow range under different carbon reduction coefficients. Specifically, total emissions fluctuate between 96,075.54 kg and 96,553.07 kg. This indicates that the carbon reduction coefficient mainly affects carbon allowance accounting and trading cost, rather than actual carbon emissions. This result is consistent with the model structure. Actual carbon emissions are determined by the dispatch of gas turbines, gas boilers, external electricity purchases, and intra-alliance electricity sharing, whereas the carbon reduction coefficient directly changes the carbon offset value of green certificates. Therefore, the carbon reduction coefficient has a more direct influence on carbon allowance demand and carbon trading cost than on the actual dispatch result.

5.7.2. Sensitivity to the Piecewise Linear Pricing Thresholds

The piecewise linear pricing thresholds determine the response strength of CET and GCT prices to trading-volume variations. In the baseline case, the carbon trading-volume threshold interval is set to [−1400, 1400] kg, with a carbon price range of [0.1, 0.4] CNY/kg. The green certificate trading-volume threshold interval is set to [−2.5, 2.5] certificates, with a price range of [30, 70] CNY/certificate. To evaluate the influence of threshold settings, the threshold scaling factor is varied from 0.8 to 1.2.
As shown in Figure 12b, when the threshold scaling factor increases from 0.8 to 1.2, the average carbon price decreases from 0.3013 CNY/kg to 0.2847 CNY/kg. This is because smaller thresholds lead to a stronger price response. Under the same trading volume, the carbon price increases more rapidly when the threshold is smaller, resulting in a stronger carbon price signal and a higher carbon settlement cost.
For the green certificate market, all prosumers have green certificate surpluses in the case study. Therefore, the green certificate price decreases as certificate supply increases. As the threshold scaling factor increases from 0.8 to 1.2, the price-response slope becomes gentler, and the average green certificate price increases from 32.19 CNY/GC to 37.73 CNY/GC. Correspondingly, green certificate revenue increases from CNY 1931.36 to CNY 2264.56. This indicates that the threshold setting directly affects CET–GCT settlement results by regulating the strength of market price response.
Although settlement prices vary with the thresholds, the low-carbon dispatch results remain stable. Total carbon emissions vary only between 96,061.79 kg and 96,402.98 kg, and carbon allowance demand remains within a narrow range of 25,526.40–25,610.29 kg. These results show that the piecewise linear thresholds mainly affect market settlement prices and costs. In contrast, the overall low-carbon operation performance of the proposed model is not sensitive to moderate variations in threshold settings.

5.7.3. Sensitivity to Demand Response Elasticity

The demand response elasticity reflects the sensitivity of flexible loads to electricity price signals. In the baseline case, the elasticity factor is set to 1.0, corresponding to the original price elasticity matrix used in the proposed model. To evaluate the influence of demand-side flexibility, the elasticity matrix is scaled by factors of 0.5, 0.75, 1.0, 1.25, and 1.5.
As shown in Figure 12c, increasing the elasticity factor significantly improves the load-shaping performance. When the elasticity factor increases from 0.5 to 1.5, the peak-to-valley difference ratio decreases from 58.11% to 54.10%, corresponding to a reduction of 4.01 percentage points. This is because higher demand response elasticity enables flexible loads to respond more strongly to electricity price variations. As a result, part of the flexible load is reduced during high-price peak periods and shifted to lower-price valley periods. This improves the peak-shaving and valley-filling performance of the prosumer alliance.
The total operating cost of the alliance also decreases as the demand response elasticity increases. When the elasticity factor increases from 0.5 to 1.5, the total operating cost decreases from CNY 123,193.28 to CNY 114,258.20, representing a reduction of 7.25%. This indicates that stronger demand-side flexibility allows the alliance to better coordinate load demand, internal electricity sharing, and distributed energy output, thereby reducing high-price external electricity purchases.
In terms of low-carbon performance, total carbon emissions decrease from 98,327.05 kg to 94,739.23 kg as the elasticity factor increases from 0.5 to 1.5. This result suggests that demand response not only adjusts the load distribution across time periods, but also affects the dispatch of internal energy conversion devices and external electricity purchases. By reducing peak-period demand and improving the matching between load demand and distributed energy resources, stronger demand response contributes to emission reduction. However, carbon allowance demand changes only slightly when the elasticity factor increases from 1.25 to 1.5. This indicates that the marginal carbon reduction benefit may gradually decrease when flexible load regulation approaches its operational limits.
Overall, the sensitivity results show that the proposed model maintains stable performance under different parameter settings. The carbon reduction coefficient mainly affects carbon allowance accounting and trading cost. The piecewise linear thresholds mainly determine the strength of CET–GCT price response. The demand response elasticity directly influences load-shaping performance and operating cost. These results confirm the robustness of the proposed framework with respect to key market and demand-side parameters.

6. Conclusions

This paper proposes a hybrid game-based optimal operation model for a multi-energy prosumer alliance under coupled CET–GCT markets. The main conclusions are as follows:
  • The proposed piecewise linear dynamic CET–GCT mechanism improves the coordination between carbon compliance and green certificate trading. Compared with Scenario 3, Scenario 5 reduces the carbon trading cost by CNY 5250.39, corresponding to a reduction of 41.35%, and decreases total carbon emissions by 3656.72 kg. Compared with the fixed-price and stepwise pricing mechanisms, the proposed pricing mechanism achieves the lowest carbon emissions and carbon allowance demand.
  • The proposed Stackelberg-cooperative hybrid game improves the economic performance of the prosumer alliance. Compared with Scenario 2, Scenario 5 reduces the total alliance cost by CNY 9251.83, corresponding to a reduction of 7.19%. The results show that intra-alliance electricity sharing can reduce external electricity purchases and better utilize the complementarity among heterogeneous prosumers.
  • The price-based demand response model improves the load-shaping performance of the alliance. Compared with Scenario 4, the peak-to-valley difference ratio decreases from 60.08% to 56.30%, representing a reduction of 3.78 percentage points. In addition, the PSO–ADMM solution strategy shows stable convergence and supports the coordinated solution of electricity pricing, integrated dispatch, electricity sharing, and benefit allocation.

Author Contributions

Conceptualization, Y.L.; Methodology, Y.L. and D.S.; Software, Y.L. and B.W.; Validation, Y.L. and D.S.; Formal analysis, Y.L.; Investigation, Y.L. and D.S.; Resources, G.S.; Data curation, Y.L. and D.S.; Writing—original draft preparation, Y.L.; Writing—review and editing, G.S.; Visualization, Y.L. and B.W.; Supervision, G.S. All authors have read and agreed to the published version of the manuscript.

Funding

This research received no external funding.

Data Availability Statement

Data are contained within the article. The data presented in this study can be requested from the authors.

Conflicts of Interest

The authors declare no conflicts of interest.

Appendix A

The relationship between trading volume and price in the green certificate market can be described by a piecewise linear dynamic green certificate pricing function. The dynamic pricing model for prosumers participating in green certificate trading is formulated in (A1).
φ i G C T = φ min G C T                                                                                                         Δ N i G C T Δ N max G C T φ a v e G C T + φ a v e G C T φ min G C T Δ N max G C T Δ N i G C T               Δ N max G C T < Δ N i G C T < 0 φ a v e G C T + φ max G C T φ a v e G C T Δ N max G C T Δ N i G C T                       0 Δ N i G C T < Δ N max G C T φ max G C T                                                                                                   Δ N max G C T     Δ N i G C T Δ N i G C T = N i P R N i g r e e n ,
where φ i G C T denotes the dynamic green certificate price for prosumer i; φ min G C T , φ max G C T , and φ a v e G C T denote the minimum, maximum, and average trading prices of green certificates, respectively. Δ N i G C T denotes the quantity of green certificatetrading volume of prosumer i in the green certificate market.
Figure A1. Piecewise linear dynamic green certificate trading mechanism.
Energies 19 02429 g0a1

Appendix B

For the Stackelberg game, the EBSP acts as the leader and the prosumer alliance acts as the follower. The existence and uniqueness of the equilibrium are analyzed as follows.
  • Existence proof:
To establish the existence of the Stackelberg equilibrium, the following sufficient conditions are considered: the objective functions of both participants are continuous over their respective strategy sets; the strategy sets are non-empty, closed, bounded, and convex; and each participant has a well-defined optimal response to any feasible strategy of the other participant.
The EBSP objective function in (16) and the prosumer objective function in (23)–(32) are composed of continuous cost and revenue terms. Therefore, both objective functions are continuous over their feasible strategy sets.
The EBSP strategy set is determined by the electricity price boundary constraints in (18) and the average price constraint in (19). Since these constraints are bounded and linear, the EBSP strategy set is non-empty, closed, bounded, and convex.
The strategy set of the prosumer alliance is determined by the grid power purchase and sale constraints, peer-to-peer transaction constraints, electrical and thermal balance constraints in (33)–(40), and the operating limits of energy conversion and storage devices. These constraints are linear or affine. Therefore, the feasible strategy set of the prosumer alliance is also non-empty, closed, bounded, and convex.
Since both participants have continuous objective functions over non-empty, closed, and bounded feasible strategy sets, an optimal response exists for each participant. Therefore, the Stackelberg game between the EBSP and the prosumer alliance admits at least one equilibrium solution.
  • Uniqueness analysis:
To make the Stackelberg equilibrium uniquely determined, it is sufficient to show that the prosumer alliance has a determinate optimal response to any feasible pricing strategy of the EBSP, and that the EBSP has a unique optimal pricing strategy for any given response of the prosumer alliance.
For the lower-level prosumer alliance, the second-order partial derivatives of the prosumer payoff with respect to the corresponding strategy variables are given by:
2 o b j p r o c p r , b u y , t 2 = 0 ,
2 o b j p r o c p r , s e l l , t 2 = 0 ,
Since the second-order partial derivatives are equal to zero, the prosumer objective function is linear with respect to the corresponding strategy variables. Under the given EBSP pricing strategy, the operation constraints, power balance constraints, and transaction constraints determine the feasible dispatch and trading decisions of the prosumer alliance. Therefore, the prosumer alliance has a determinate optimal response under the model settings considered in this paper.
For the upper-level EBSP, the second-order partial derivatives of the EBSP objective function with respect to the electricity purchase and sale prices are given by:
2 o b j E B S P P i , t g b 2 = 0 ,
2 o b j E B S P P i , t g s 2 = 0 ,
Since the second-order partial derivatives are equal to zero, the EBSP objective function is linear with respect to the corresponding pricing variables. For a given response of the prosumer alliance, the trading quantities are determined. With the electricity price boundary constraints and the average price constraint, the EBSP can determine a unique optimal pricing strategy under the given model settings.
Therefore, the prosumer alliance has a determinate optimal response to the EBSP pricing strategy, and the EBSP has a unique optimal pricing strategy corresponding to the alliance response. Hence, under the bounded strategy sets, continuous objective functions, and model settings considered in this paper, the Stackelberg equilibrium solution exists and can be uniquely determined.

Appendix C

Since the logarithmic function is monotonically increasing over the positive domain, model (42) can be equivalently transformed into:
max i = 1 N ln ( C i 0 C i ) s . t .   C i 0 C i   ,
The final cost of prosumer i after cooperation consists of the cooperative dispatch cost and the intra-alliance settlement cost, namely:
C i = C i U P R O + C i P 2 P ,
where C i P 2 P = t = 1 T j = 1 , j i N τ i j , t p 2 p P i j , t E X . For any two prosumers i and j, the internal electricity transaction satisfies P i j , t E X + P j i , t E X = 0 , and the internal transaction prices satisfy the consensus condition: τ i j , t p 2 p = τ j i , t p 2 p . Therefore, the intra-alliance settlement costs cancel out in the total alliance cost:
i = 1 N C i P 2 P = t = 1 T j = 1 , j i N ( τ i j , t p 2 p P i j , t E X + τ j i , t p 2 p P j i , t E X ) = 0   .
According to (A7) and (A8), we have:
i = 1 N C i = i N C i U P R O .
Since C i 0 is the non-cooperative cost and remains constant during the optimization process, maximizing the total cost reduction of the alliance is equivalent to minimizing the total operating cost after cooperative dispatch:
max i = 1 N ( C i 0 C i ) min i = 1 N C i UPRO .
Therefore, the cooperative dispatch part of the original Nash bargaining problem can be equivalently transformed into Subproblem P1, namely the alliance cost minimization problem. By solving P1, the optimal cooperative dispatch cost C i UPRO * and the optimal electricity transaction quantity P i j , t E X * can be obtained.
After the optimal dispatch results of P1 are obtained, the internal transaction quantities are fixed. The remaining problem is to allocate the cooperative benefits by determining the internal transaction prices. Considering the different contributions of prosumers to intra-alliance electricity sharing, the bargaining factor d i is introduced. The asymmetric Nash bargaining model can then be written as:
max i = 1 N C i 0 ( C i U P R O * + C i P 2 P ) d i s . t .   C i 0 C i U P R O * + C i p 2 p c pr , sell * τ i j , t p 2 p c pr , buy * .
Since the logarithmic function is monotonically increasing, (A11) can be equivalently transformed into:
max i = 1 N d i ln C i 0 ( C i U P R O * + C i P 2 P ) s . t .   C i 0 C i U P R O * + C i p 2 p c pr , sell * τ i j , t p 2 p c pr , buy * .
Equation (A12) is the cooperative benefit allocation subproblem of the prosumer alliance. In this subproblem, C i 0 , C i U P R O * , and P i j , t E X * are known parameters, and the optimization variable is the internal transaction price τ i j , t p 2 p . Therefore, the argument of the logarithmic function is an affine function of τ i j , t p 2 p . Since the logarithm of a positive affine function is concave and the bargaining factor is a non-negative constant, the weighted sum of these logarithmic functions is also concave. Meanwhile, the individual rationality constraint and the internal transaction price bounds are linear constraints. Therefore, the cooperative benefit allocation subproblem can be solved as a convex optimization problem.
In summary, the original non-convex Nash bargaining model can be decomposed into the alliance cost minimization subproblem P1 and the cooperative benefit allocation subproblem P2, which are solved sequentially. This completes the proof.

Appendix D

The update formulas of the ADMM variables are as follows:
  • Auxiliary variable update:
τ i j , t p 2 p ( k + 1 ) = arg min L i ( τ i j , t p 2 p ( k ) , τ i j , t p 2 p ( k ) , γ i j , t ( k ) ) τ j i , t p 2 p ( k + 1 ) = arg min L j ( τ j i , t p 2 p ( k ) , τ i j , t p 2 p ( k ) , γ i j , t ( k ) ) ,
where k denotes the iteration count; τ i j , t p 2 p ( k ) denotes the auxiliary variable at the k-th iteration; γ i j , t ( k ) denotes the dual variable at the k-th iteration.
2.
Electricity transaction price update:
τ i j , t p 2 p ( k + 1 ) = τ i j , t p 2 p ( k + 1 ) + τ j i , t p 2 p ( k + 1 ) 2 + γ i j , t ( k ) + γ j i , t ( k ) 2 ρ .
3.
Dual variable update:
γ i j , t ( k + 1 ) = γ i j , t ( k ) + ρ ( τ i j , t p 2 p ( k + 1 ) τ i j , t p 2 p ( k + 1 ) ) .
4.
Convergence condition:
τ i j , t p 2 p ( k + 1 ) τ i j , t p 2 p ( k + 1 ) ε ,
where ε denotes the convergence threshold.

Appendix E

Table A1. The electricity trading price of the higher-level power grid.
Time PeriodGrid Electricity Price (CNY/kWh)Feed-in Tariff (CNY/kWh)
22:00–06:000.40.35
06:00–09:00,
14:00–17:00, 20:00–22:00
0.790.68
09:00–14:00, 17:00–20:001.21.12
Figure A2. Electric and thermal load profiles. (a) Electric load profiles. (b) Thermal load profiles.
Energies 19 02429 g0a2
Figure A3. Forecast renewable generation profiles.
Energies 19 02429 g0a3

Appendix F

Figure A4. CET–GCT trading results of the commercial prosumer. (a) CET market. (b) GCT market.
Energies 19 02429 g0a4
Figure A5. CET–GCT trading results of the residential prosumer. (a) CET market. (b) GCT market.
Energies 19 02429 g0a5

Appendix G

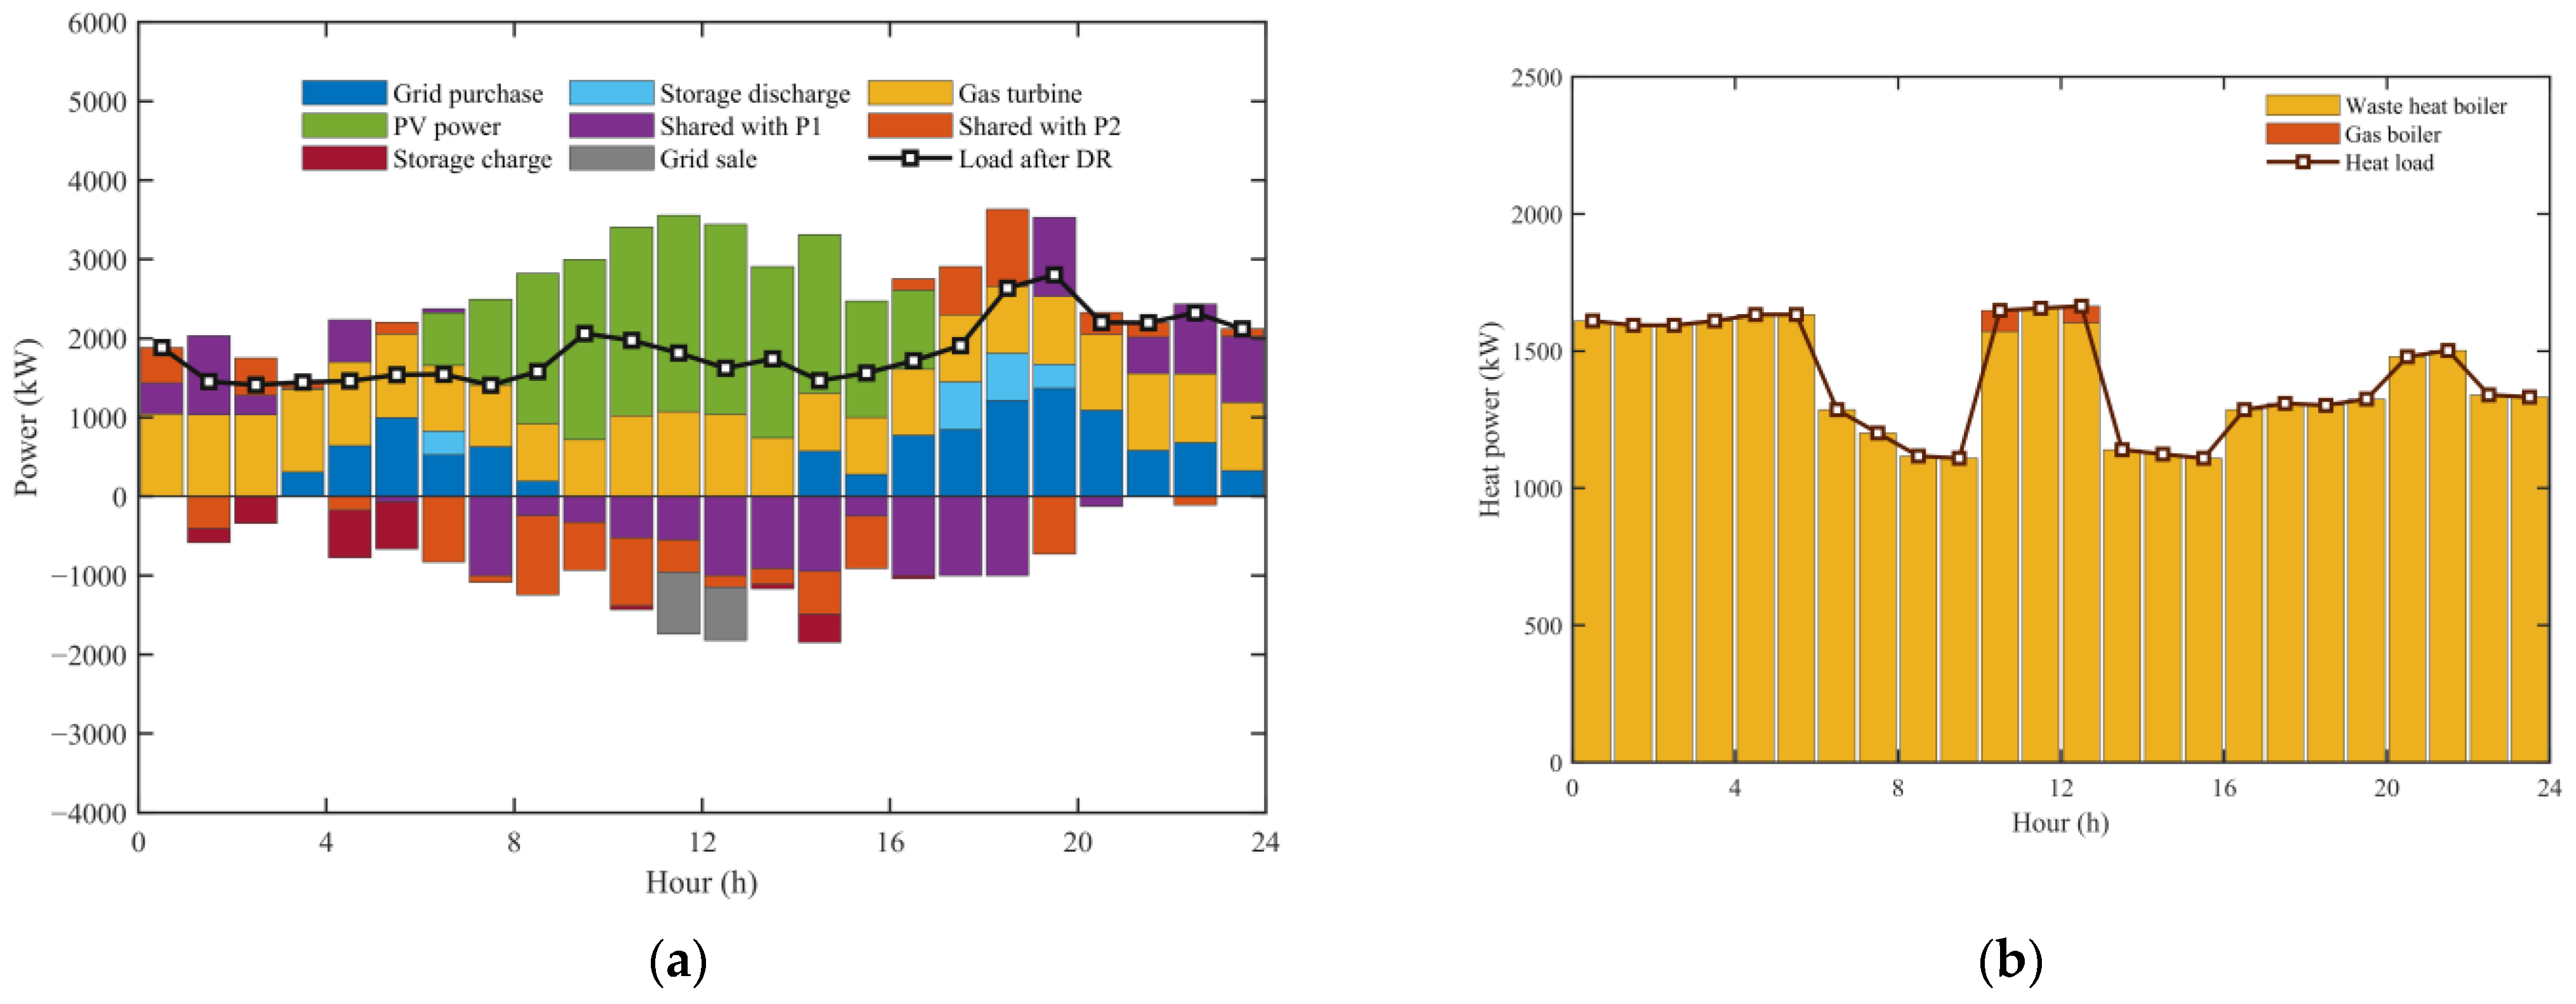
Figure A6. Commercial prosumers dispatch scheme. (a) Power operation of commercial prosumers. (b) Heating operation of commercial prosumers.
Energies 19 02429 g0a6
Figure A7. Residential prosumers dispatch scheme. (a) Power operation of residential prosumers. (b) Heating operation of residential prosumers.
Energies 19 02429 g0a7

References

  1. Chen, T.; Su, W. Indirect customer-to-customer energy trading with reinforcement learning. IEEE Trans. Smart Grid 2018, 10, 4338–4348. [Google Scholar] [CrossRef]
  2. Zhang, Z.; Kang, C. Challenges and prospects for constructing the new-type power system towards a carbon neutrality future. Proc. CSEE 2022, 42, 2806–2819. [Google Scholar]
  3. Wang, K.; Huang, Y.; Liu, Y.; Huang, T.; Zang, S. A Review of Optimization Scheduling for Active Distribution Networks with High-Penetration Distributed Generation Access. Energies 2025, 18, 4119. [Google Scholar] [CrossRef]
  4. Chen, Y.; Tanaka, M.; Takashima, R. Death spiral, transmission charges, and prosumers in the electricity market. Appl. Energy 2023, 332, 120488. [Google Scholar] [CrossRef]
  5. Hu, J.-L.; Chuang, M.-Y. The importance of energy prosumers for affordable and clean energy development: A review of the literature from the viewpoints of management and policy. Energies 2023, 16, 6270. [Google Scholar] [CrossRef]
  6. Le, J.; Liu, Y.; Ye, X.; Wu, Z.; Li, Z. Market-oriented operation pattern of regional power network integration with high penetration level of distributed energy resources. Proc. CSEE 2016, 36, 3343–3353. [Google Scholar]
  7. Cruz, C.; Alskaif, T.; Palomar, E.; Bravo, I. Prosumers integration in aggregated demand response systems. Energy Policy 2023, 182, 113745. [Google Scholar] [CrossRef]
  8. Yang, X.; Qi, L.; Wang, D.; Ai, Q. Two-stage coordinated operation mechanism for virtual power plant clusters based on energy interaction. Electronics 2025, 14, 2484. [Google Scholar] [CrossRef]
  9. Aizenberg, N.; Barakhtenko, E.; Mayorov, G. Cooperative behavior of prosumers in integrated energy systems. Mathematics 2024, 12, 4005. [Google Scholar] [CrossRef]
  10. Adeyemi, A.; Yan, M.; Shahidehpour, M.; Bahramirad, S.; Paaso, A. Transactive energy markets for managing energy exchanges in power distribution systems. Electr. J. 2020, 33, 106868. [Google Scholar] [CrossRef]
  11. Parra-Dominguez, J.; Sanchez, E.; Ordonez, A. The prosumer: A systematic review of the new paradigm in energy and sustainable development. Sustainability 2023, 15, 10552. [Google Scholar] [CrossRef]
  12. Sousa, T.; Soares, T.; Pinson, P.; Moret, F.; Baroche, T.; Sorin, E. Peer-to-peer and community-based markets: A comprehensive review. Renew. Sustain. Energy Rev. 2019, 104, 367–378. [Google Scholar] [CrossRef]
  13. Chen, J.; Gu, W.; Alharthi, Z.; Huang, S.; Mansouri, S.A. A Sustainable Framework for Coordinating Multi-Energy Prosumers in Transmission and Distribution Flexibility Markets. Energy 2025, 138176. [Google Scholar] [CrossRef]
  14. Morstyn, T.; Teytelboym, A.; McCulloch, M.D. Bilateral contract networks for peer-to-peer energy trading. IEEE Trans. Smart Grid 2018, 10, 2026–2035. [Google Scholar] [CrossRef]
  15. Zhang, Q.; Ma, S.; Jin, F.; Li, J.; Zhao, R.; Liang, Z.; Ren, X. Scheduling Strategy of Virtual Power Plant Alliance Based on Dynamic Electricity and Carbon Pricing Using Master-Slave Game. Processes 2025, 13, 1658. [Google Scholar] [CrossRef]
  16. Liu, W.; Xu, H.; Wang, X.; Zhang, S.; Hu, T. Optimal dispatch strategy of virtual power plants using potential game theory. Energy Rep. 2022, 8, 1069–1079. [Google Scholar] [CrossRef]
  17. Liu, S.; Ai, Q.; Zheng, J.; Wu, R. Bi-level coordination mechanism and operation strategy of multi-time scale multiple virtual power plants. Proc. CSEE 2018, 38, 753–761. [Google Scholar]
  18. Junjia, S.; Junjie, H.; Jiechen, W. Peer-to-peer market trading mechanism and model for virtual power plant energy management. Power Syst. Technol. 2020, 44, 3401–3408. [Google Scholar]
  19. Shaheen, M.A.; Hasanien, H.M.; Alsaleh, I.; Alassaf, A.; Zhang, M.; Alateeq, A. Optimal power flow in power systems with renewable energy resources uncertainty including geothermal power plants. Ain Shams Eng. J. 2025, 16, 103784. [Google Scholar] [CrossRef]
  20. Shaheen, M.A.; Ullah, Z.; Hasanien, H.M.; Tostado-Véliz, M.; Ji, H.; Qais, M.H.; Alghuwainem, S.; Jurado, F. Enhanced transient search optimization algorithm-based optimal reactive power dispatch including electric vehicles. Energy 2023, 277, 127711. [Google Scholar] [CrossRef]
  21. Wang, J.; Lan, J.; Wang, L.; Lin, Y.; Hao, M.; Zhang, Y.; Xiang, Y.; Qin, L. Coordinated Multi-Scenario Optimization Strategy for Park Photovoltaic Storage Based on Master-Slave Game. Sensors 2024, 24, 5042. [Google Scholar] [CrossRef] [PubMed]
  22. Zhang, H.; Meng, Q.; Ma, H.; Yan, H.; Liu, X. Economic and low-carbon dispatching strategy of cross-region interconnected system for promoting green certificate demand. Autom. Electr. Power Syst. 2022, 46, 51–61. [Google Scholar]
  23. Liu, G.; Han, D.; Liu, C.; Guo, H.; Fan, R.; Zhang, B. Dual time scale optimal scheduling of integrated energy system considering dual demand response and stepped carbon trading. Electr. Power Autom. Equip. 2023, 43, 218–225. [Google Scholar]
  24. Ravivarma, K.; Lokeshgupta, B. A peer-to-peer energy trading model for community microgrids with energy management. Peer Peer Netw. Appl. 2024, 17, 2538–2554. [Google Scholar] [CrossRef]
  25. Islam, S.N. A review of peer-to-peer energy trading markets: Enabling models and technologies. Energies 2024, 17, 1702. [Google Scholar] [CrossRef]
  26. Sun, Z.; Li, Z.; Li, Y.; Bai, X.; Zhang, J.; Zheng, J.; Deng, B. Peer-to-peer energy trading with decentralized bidirectional matching of multipreference community prosumers. Electr. Power Syst. Res. 2025, 238, 111165. [Google Scholar] [CrossRef]
  27. Zeng, H.; Du, Y.; Li, T. Low-carbon planning of a park-level integrated electric and heating system considering carbon trading and green certificate trading. Integr. Intell. Energy 2023, 45, 22–29. [Google Scholar]
  28. Cheng, L.; Li, Y.; Yang, S. Distributed cooperative optimal operation of multiple virtual power plants based on multi-stage robust optimization. Sustainability 2024, 16, 5301. [Google Scholar] [CrossRef]
  29. Zhong, X.; Zhong, W.; Liu, Y.; Yang, C.; Xie, S. Cooperative operation of battery swapping stations and charging stations with electricity and carbon trading. Energy 2022, 254, 124208. [Google Scholar] [CrossRef]
  30. Xu, Q.; Ding, S.; Zhu, Y.; Meng, Y.; Yang, J.; Liu, Y. Low-Carbon Cooperative Operation of Integrated Energy Systems Considering Joint Green Certificate and Carbon Emission Trading. Energies 2025, 18, 5509. [Google Scholar] [CrossRef]
  31. Li, X.; Deng, J.; Liu, J. Energy-carbon-green certificates management strategy for integrated energy system using carbon-green certificates double-direction interaction. Renew. Energy 2025, 238, 121937. [Google Scholar] [CrossRef]
  32. Zhang, W.; Ji, C.; Liu, Y.; Hao, Y.; Song, Y.; Cao, Y.; Qi, H. Dynamic interactions of carbon trading, green certificate trading, and electricity markets: Insights from system dynamics modeling. PLoS ONE 2024, 19, e0304478. [Google Scholar] [CrossRef]
  33. Ma, T.; Peng, L.; Wu, G.; Wei, Y.; Zou, X. Research on Multi-Scale Electricity-Carbon-Green Certificate Market Coupling Trading Based on System Dynamics. Processes 2025, 13, 109. [Google Scholar] [CrossRef]
  34. Moradi, M.; Farzaneh, H. Demand response programs in decentralized hybrid local energy markets: Evaluating the impact of risk-adjusted behavior of market players and the integration of renewable energy sources, using a novel bi-level optimization framework. Appl. Energy 2025, 390, 125806. [Google Scholar] [CrossRef]
  35. Ronghui, L.; Lekai, W.; Gaiping, S.; Zengkai, Z.; Shunfu, L. Bidding transaction model of wind-solar-storage cooperative alliance participating in the main and auxiliary joint market with demand response considering uncertainty. Power Syst. Prot. Control 2023, 51, 96–107. [Google Scholar]
  36. Pandey, V.C.; Gupta, N.; Niazi, K.; Swarnkar, A.; Thokar, R.A. Modeling and assessment of incentive based demand response using price elasticity model in distribution systems. Electr. Power Syst. Res. 2022, 206, 107836. [Google Scholar] [CrossRef]
  37. Zhang, L.; Chen, C.; Wang, Q.; Zhou, D. The impact of feed-in tariff reduction and renewable portfolio standard on the development of distributed photovoltaic generation in China. Energy 2021, 232, 120933. [Google Scholar] [CrossRef]
  38. Jiang, Y.; Cao, H.; Yang, L.; Fei, F.; Li, J.; Lin, Z. Mechanism design and impact analysis of renewable portfolio standard. Autom. Electr. Power Syst. 2020, 44, 187–199. [Google Scholar]
  39. Zhang, Z.; Xiong, X.; Wan, C.; Que, X.; Duan, S.; Wang, Z. Multi-Microgrids Cooperative Operation Optimization Strategy Considering Electricity-Carbon Trading and Comprehensive Contribution Rate. Power Syst. Technol. 2024, 48, 3258–3268. [Google Scholar]
  40. Chen, L.; Zhu, Z.; Wang, K.; Guo, B.; Xi, M. Optimal Operation of Distribution Networks and Multiple Integrated Energy Microgrids Based on Mixed Game Theory. Power Syst. Technol. 2023, 47, 2229–2243. [Google Scholar]
Figure 1. Piecewise linear dynamic carbon trading mechanism.
Energies 19 02429 g001
Figure 2. Carbon–green certificate mutual recognition and offset mechanism.
Energies 19 02429 g002
Figure 3. Hybrid game framework.
Energies 19 02429 g003
Figure 4. Hybrid game solution process.
Energies 19 02429 g004
Figure 5. Convergence of the PSO–ADMM. (a) PSO objective function for upper-level pricing; (b) ADMM primal residuals for internal benefit allocation.
Energies 19 02429 g005
Figure 6. Electricity purchase and sale prices under the Stackelberg game.
Energies 19 02429 g006
Figure 7. CET–GCT trading results of the industrial prosumer. (a) CET market; (b) GCT market.
Energies 19 02429 g007
Figure 8. Intra-alliance electricity transaction prices.
Energies 19 02429 g008
Figure 9. Intra-alliance electricity exchange quantities.
Energies 19 02429 g009
Figure 10. Dispatch results of the industrial prosumer. (a) Power operation; (b) Thermal operation.
Energies 19 02429 g010
Figure 11. Comparison of alliance load curves before and after demand response.
Energies 19 02429 g011
Figure 12. Sensitivity analysis. (a) Carbon reduction coefficient. (b) Piecewise linear pricing thresholds. (c) Demand response elasticity.
Energies 19 02429 g012
Table 1. Scenario settings.
Scenario Prosumer Cooperative Electricity Sharing Transactions Piecewise Linear CET–GCT Mutual Recognition MechanismPrice-Based Demand Response
Scenario 1×××
Scenario 2×
Scenario 3×
Scenario 4×
Scenario 5
Note: “√” indicates that the mechanism is considered, while “×” indicates that the mechanism is not considered.
Table 2. Operational cost results across scenarios.
ScenarioEBSP Benefit/CNYProsumerElectric Energy Market/CNYCarbon Trading Market/CNYGreen Certificate Market/CNYFinal Cost/CNYAlliance Total Cost/CNY
Scenario 113,747.67Industrial22,903.546471.31−1326.8164,118.41144,313.34
Commercial12,460.835114.83−317.8248,100.35
Residential6953.553414.91−452.1832,094.58
Scenario 212,348.01Industrial17,645.573194.04−1339.8955,559.61128,679.39
Commercial9869.163516.70−323.0643,993.08
Residential5003.262331.94−455.7829,126.70
Scenario 36133.66Industrial2351.184757.02−1338.7654,128.42123,908.33
Commercial4917.324204.84−323.1843,901.50
Residential14,882.353736.27−455.9925,878.41
Scenario 47018.22Industrial8789.082567.63−1326.8156,134.88127,268.48
Commercial9056.242650.08−317.8244,322.00
Residential12,626.822490.90−452.1826,811.60
Scenario 56114.56Industrial6703.622512.89−1337.4751,272.73119,427.56
Commercial6190.012605.06−323.2442,267.72
Residential10,020.722329.79−456.3225,887.11
Table 3. Carbon emissions comparison across scenarios.
ScenarioIndustrialCommercialResidentialTotal Carbon Emissions/kg
Scenario 146,555.2540,293.7028,606.08115,455.03
Scenario 242,602.9539,299.7127,420.92109,323.58
Scenario 342,394.0932,568.9024,907.5699,870.55
Scenario 437,028.1032,425.8630,656.78100,110.74
Scenario 535,922.9631,667.1528,623.7296,213.83
Table 4. Comparison of different CET–GCT pricing mechanisms.
Pricing MechanismAlliance Total Cost/CNYElectricity Market Cost/CNYCarbon Trading Cost/CNYGreen Certificate Revenue/CNYCarbon Allowance Demand/kgTotal Carbon Emissions/kgComputation Time/s
Fixed-price mechanism117,195.0222,437.476543.772999.1026,175.0798,484.32255.91
Stepwise pricing mechanism116,768.2222,351.986475.843643.9825,749.1596,757.11832.91
Proposed mechanism119,427.5622,914.367447.752117.0425,559.5096,213.83473.52
Table 5. Benefit allocation results under different bargaining models.
ProsumerBargaining FactorBargaining Cost/CNYFinal Cost/CNYBenefit Improvement/CNY
Asymmetric Nash Bargaining ModelIndustrial2.65555954.2851,272.734286.88
Commercial1.06872869.7442,267.721725.36
Residential2.0067−8824.1125,887.113239.59
Standard Nash Bargaining ModelIndustrial17157.2252,475.673083.94
Commercial11511.1640,909.143083.94
Residential1−8668.4626,042.763083.94
Disclaimer/Publisher’s Note: The statements, opinions and data contained in all publications are solely those of the individual author(s) and contributor(s) and not of MDPI and/or the editor(s). MDPI and/or the editor(s) disclaim responsibility for any injury to people or property resulting from any ideas, methods, instructions or products referred to in the content.