Article

Numerical Improvement of Battery Thermal Management Integrating Phase Change Materials with Fin-Enhanced Liquid Cooling

School of Energy and Power Engineering, University of Shanghai for Science and Technology, Shanghai 200093, China
*
Author to whom correspondence should be addressed.
Energies 2025, 18(9), 2406; https://doi.org/10.3390/en18092406
Submission received: 1 April 2025 / Revised: 28 April 2025 / Accepted: 5 May 2025 / Published: 7 May 2025
(This article belongs to the Section J1: Heat and Mass Transfer)

Abstract

:
Under high-rate charging and discharging conditions, the coupling of phase change materials (PCMs) with liquid cooling proves to be an effective approach for controlling battery pack operating temperature and performance. To address the inherent low thermal conductivity of PCM and enhance heat transfer from PCM to cooling plates, numerical simulations were conducted to investigate the effects of installing fins between the upper and lower cooling plates on temperature distribution. The results demonstrated that merely adding cooling plates on battery surfaces and filling PCM in inter-cell gaps had limited effectiveness in reducing maximum temperatures during 4C discharge (8A discharge current), achieving only a 1.8 K reduction in peak temperature while increasing the maximum temperature difference to over 10 K. Cooling plates incorporating optimized flow channel configurations in fins, alternating coolant inlet/outlet arrangements, appropriate increases in coolant flow rate (0.5 m/s), and reduced coolant inlet temperature (293.15 K) could maintain battery pack temperatures below 306 K while constraining maximum temperature differences to approximately 5 K during 4C discharge. Although increased flow rates enhanced cooling efficiency, improvements became negligible beyond 0.7 m/s due to inherent limitations in battery and PCM thermal conductivity. Excessively low coolant inlet temperatures (293.15 K) were found to adversely affect maximum temperature difference control during initial discharge phases. While reducing the inlet temperature from 300.65 K to 293.15 K decreased the maximum temperature by 10.1 K, it concurrently increased maximum temperature difference by 0.44 K.

1. Introduction

Lithium-ion power batteries are a key component of electric vehicles, and their performance is highly sensitive to temperature. Within the operating temperature range of 303 K to 313 K, every 1 K increase in battery temperature reduces its lifespan by two months [1,2,3]. Under high-temperature conditions of 343 K, the state of health (SOH) of the battery also experiences significant accelerated degradation [4]. During high-rate charging and discharging, battery packs generate substantial heat in a short time. For example, during rapid discharging at 2C and 4C rates, lithium batteries can produce heat fluxes as high as 0.18 MW/m3 and 0.4 MW/m3, respectively [5], which can easily lead to elevated operating temperatures or even thermal runaway [6,7,8]. Therefore, efficient and reliable battery thermal management is crucial for ensuring the safety and performance of electric vehicles.
Currently, battery thermal management cooling methods mainly include air cooling, liquid cooling, phase change material (PCM) cooling, and heat pipe cooling [9,10,11,12,13]. Under high-rate charging and discharging conditions, batteries impose stricter requirements on cooling systems. It is challenging for a single thermal management method to simultaneously meet the demands for maximum temperature, temperature uniformity, and low flow resistance of the cooling medium [14,15,16]. For instance, Sun et al. [17] employed an indirect liquid cooling system to control the maximum temperature and temperature difference of the battery pack within target ranges. However, this required a coolant mass flow rate of 0.4 kg/s and a flow velocity of 0.89 m/s, resulting in high flow resistance and significant energy consumption for fluid transport. Zhang et al. [18] developed a PCM-based cooling system that could limit the maximum temperature difference to within 5 K. However, due to the low thermal conductivity of PCM, the maximum battery temperature exceeded 320 K, which could negatively impact long-term battery lifespan. Ye et al. [19] designed a heat pipe-based cooling system, but its cooling module height of 90 mm increased the overall thermal management system volume by 64.29%, leaving room for improvement in compactness. Zhang et al. [20] proposed a hybrid thermal management system combining PCM and liquid cooling. When the PCM thermal conductivity was 0.2 W/(m·K), under thermal runaway conditions, introducing cooling water at 0.01 m/s reduced the maximum battery temperature by 63.5 K compared to no liquid cooling. Yang et al. [21] designed a hexagonal honeycomb-structured thermal management system integrating microchannel liquid cooling and PCM. Compared to a rectangular cold plate, this hybrid system reduced the maximum battery temperature by 0.36 K and the maximum temperature difference by 2.3 K. Afaynou et al. [22] conducted a study on the thermodynamic and phase change dynamics performance of a phase change material (PCM)-based heat dissipation system (HS), investigating the impact of varying height ratios of metal foam filling on system performance. The research found that when the aluminum foam filling height ratio increased from 1/3 to full filling, the system’s heat dissipation efficiency significantly improved: the maximum temperature of electronic components decreased by 15.85 °C, and the complete melting time of the PCM was reduced by over 1000 s.
In hybrid PCM–liquid cooling battery thermal management systems, the coolant rapidly removes heat transferred from the battery to the cold plate, while PCM improves temperature uniformity. Therefore, such hybrid systems demonstrate excellent performance and application potential under high-rate charging and discharging conditions. However, due to the low thermal conductivity of PCM, enhancing heat transfer from the battery surface through the PCM to the cold plate is key to further improving the thermal management performance of this hybrid system. To investigate the enhancement of heat dissipation in 18650 cylindrical battery packs through fin arrangements within hybrid PCM–liquid cooling thermal management systems, numerical simulations were conducted to study the battery temperature distribution evolution during 4C (the battery, with a rated capacity of 2000 mAh, is discharged at a constant current of 8 A) discharge, along with systematic optimization of cooling plate arrangement, channel number, coolant flow direction, velocity, and inlet temperature.

2. Numerical Methodology
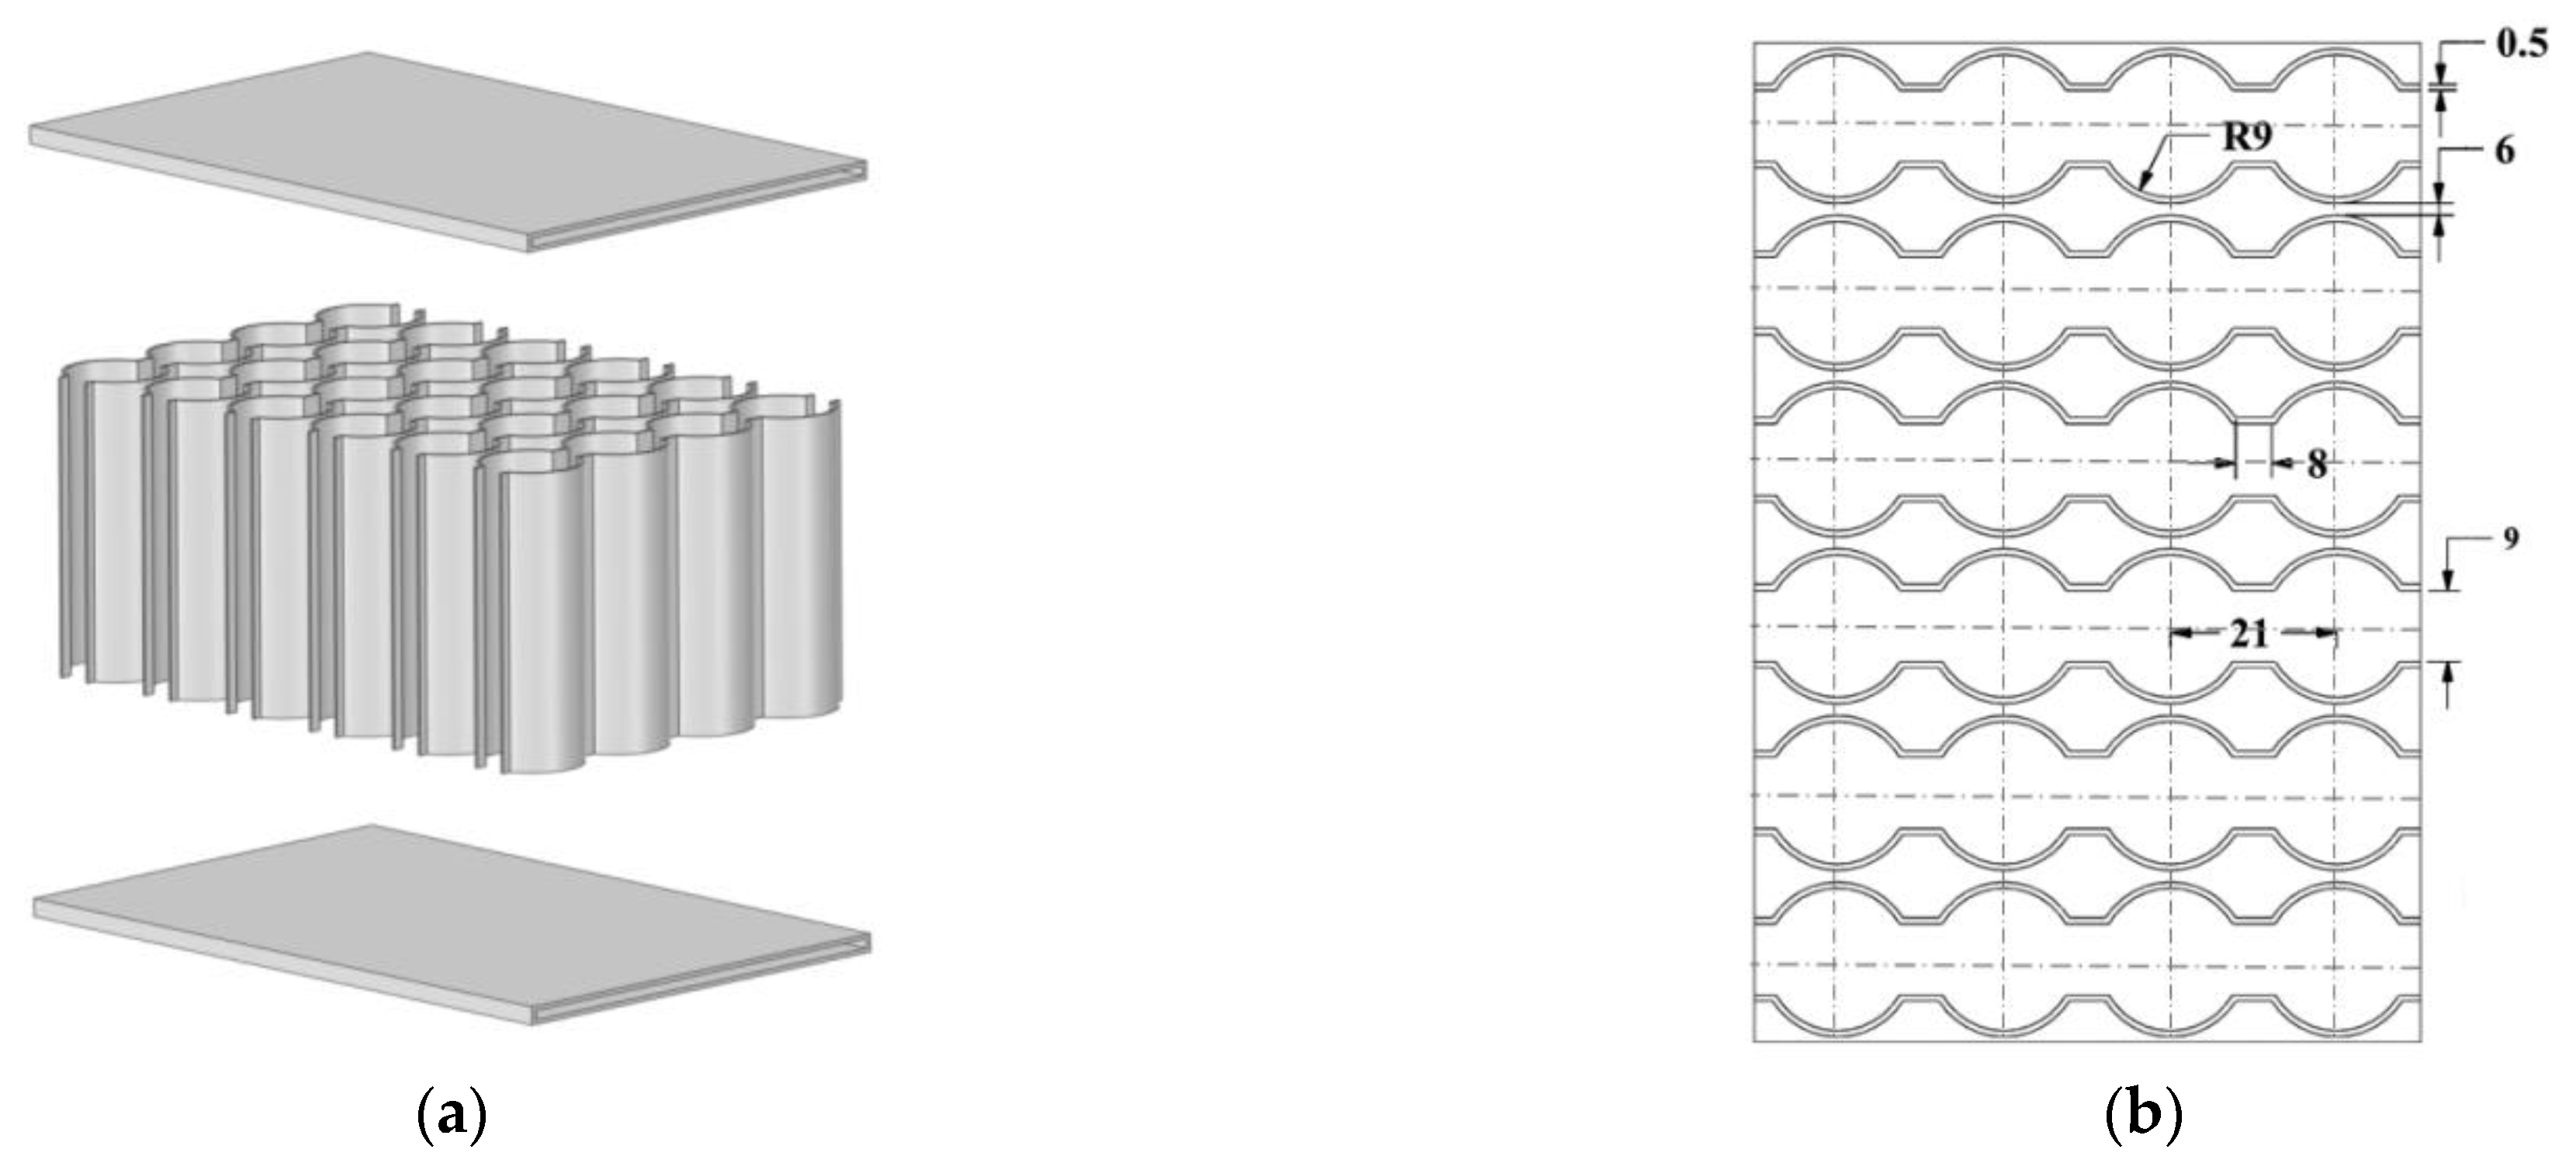
2.1. Physical Model

The battery pack consists of 24 cylindrical 18650 lithium-ion cells, with the gaps between the cells filled with PCM. The density (ρb), specific heat capacity (Cp, b), axial thermal conductivity (λa, b) and radial thermal conductivity (λr, b) of the battery are listed in Table 1 [23]. The density (ρpcm), specific heat capacity (Cp, pcm), thermal conductivity (λpcm), latent heat of phase change (Lpcm) and onset melting temperature (Tom, pcm) of PCM are listed in Table 2 [24]. The coolant in the cold plate is assumed to be water, with corresponding thermophysical properties.
Figure 1 illustrates a conventional hybrid thermal management system combining PCM cooling and liquid cooling. The battery dimensions include a height of 65 mm and a diameter of 18 mm, with horizontal and longitudinal spacings of 21 mm between adjacent cells. The interstitial spaces are filled with PCM. Figure 1a shows the combination of a side-mounted cold plate with PCM, while Figure 1b illustrates the integration of a bottom-mounted cold plate with PCM. Figure 2 depicts an enhanced hybrid system incorporating PCM cooling and fin-reinforced liquid cooling. Aluminum fins (0.5 mm thick) are arranged between the top and bottom cold plates, with an arc segment radius of 9 mm for the curved fin sections. The minimum spacing between adjacent fins is 6 mm, while the straight fin segments have a length of 8 mm. The spacing between straight fin segments on both sides of the battery is 9 mm, and the center-to-center distance between batteries is 21 mm. while PCM still occupies the remaining gaps. Electrical interconnection approaches are excluded from this study’s scope but will be systematically addressed in subsequent research.

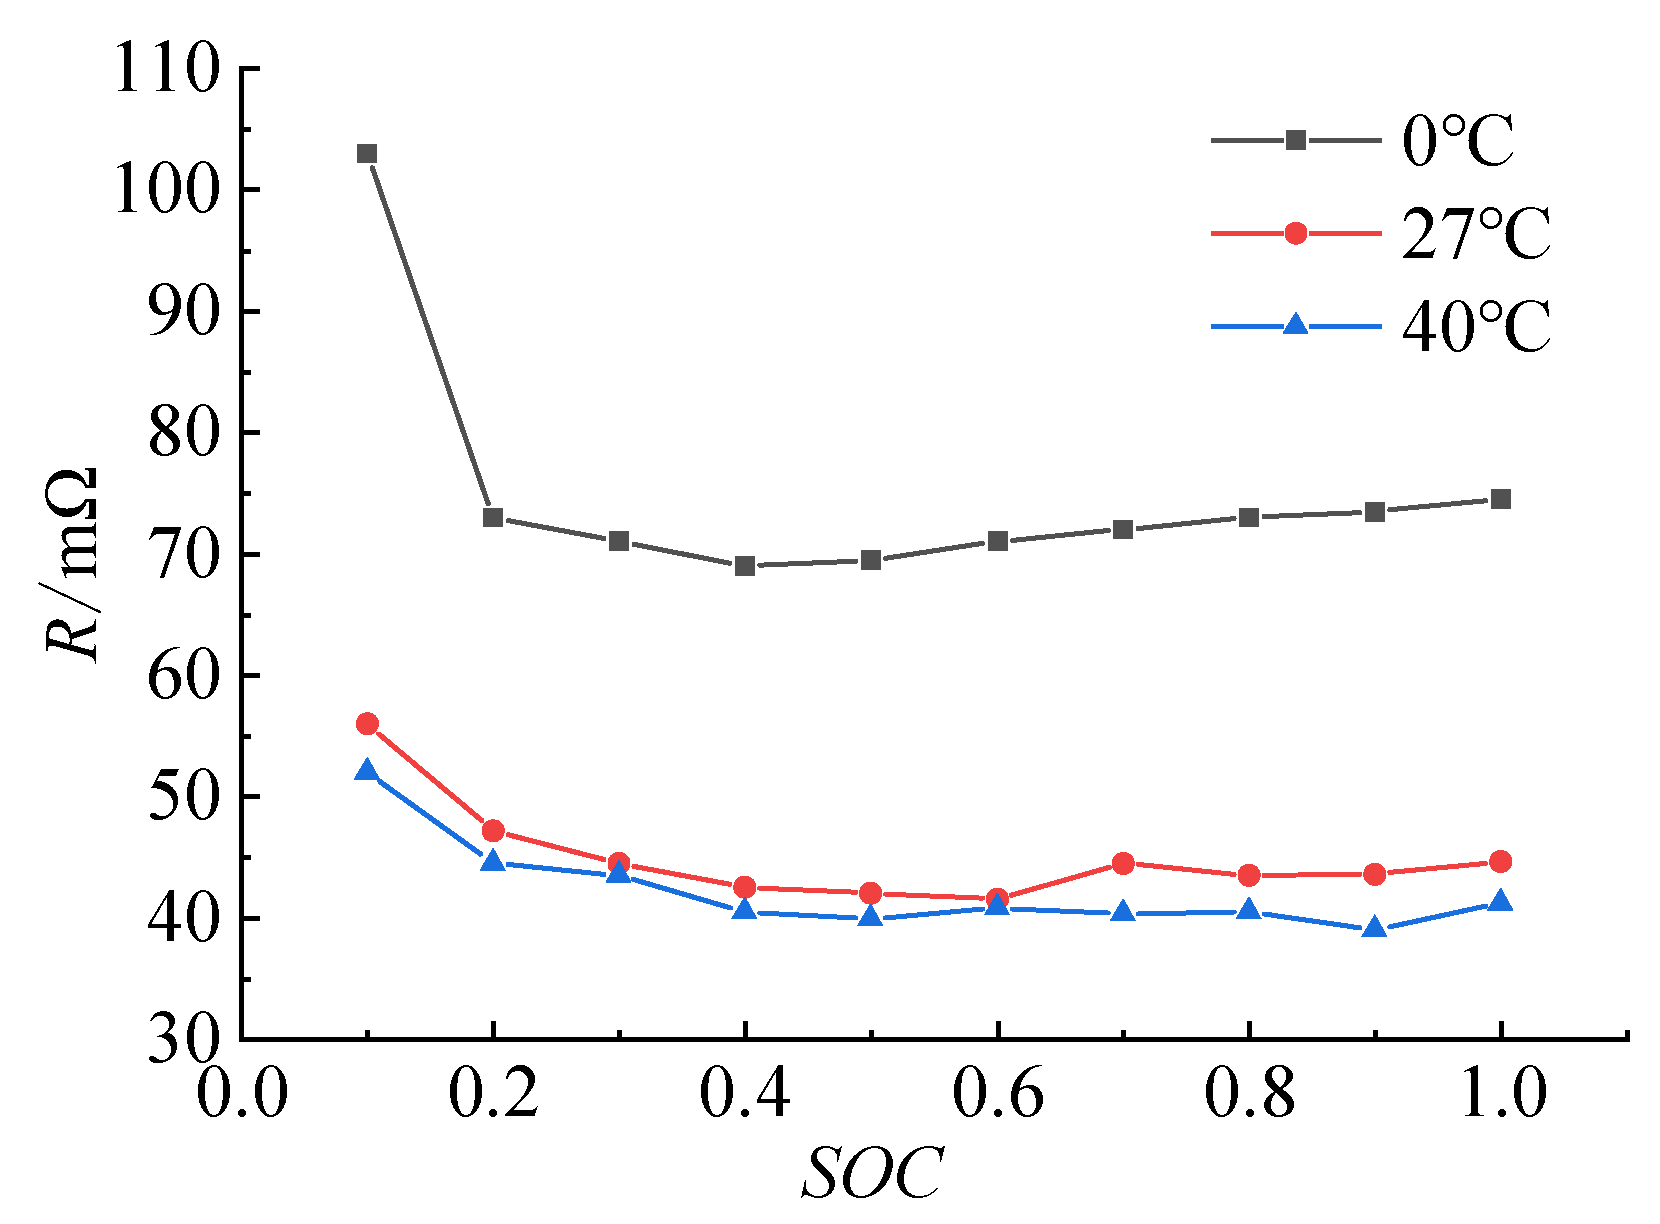
2.2. Battery Heat Generation Model

The heat generation in lithium-ion batteries arises from internal chemical reactions, Joule heating, polarization effects, and side reactions. The heat generation rate is calculated with the Bernardi model:
q b = I V U 0 U + T b U 0 T b = 1 V I 2 R + I T b U 0 T b
where qb is the heat generation rate, I is the operating current, V is the cell volume, U0 is the open-circuit voltage, U is the working voltage, Tb is the battery temperature, ∂U0/∂T is the temperature coefficient (0.000469 V/°C for 20–50 °C; 0.001 V/°C below 20 °C), and R is the internal resistance.
In ANSYS Fluent 2020 R2, the implementation of time-varying heat sources is achieved through User-Defined Functions (UDFs). As indicated by Equation (1), the heat generation rate of lithium-ion batteries can be determined by their internal resistance, necessitating the characterization of resistance variations during charge/discharge cycles. The internal resistance of lithium-ion batteries consists of ohmic resistance and polarization resistance. Since polarization resistance constitutes a relatively small proportion of the total internal resistance, it is thus omitted, and calculations are performed using ohmic resistance as the effective internal resistance. Taking a 4C discharge rate under varying ambient temperatures as an example, the relationship between internal resistance and battery state of charge (SOC) is illustrated in Figure 3.
The internal resistance R depends on operating temperature and state of charge (SOC). Based on experimental data, it is empirically fitted as:
R = ζ1⋅(SOC)6 + ζ2⋅(SOC)5 + ζ3⋅(SOC)4 + ζ4⋅(SOC)3 + ζ5⋅(SOC)2 + ζ6⋅(SOC) + ζ7
The coefficients ζ1~ζ7 are provided in Table 3.

2.3. Heat Transfer Model and Boundary Conditions

The following assumptions are made for the numerical model of the thermal management system:
(a)
The PCM has uniform and isotropic physical properties;
(b)
The specific heat capacity and thermal conductivity of the PCM are constant and independent of temperature;
(c)
The density and volume of the PCM remain unchanged during phase change;
(d)
The PCM remains stationary within the battery pack, and its internal heat conduction follows Fourier’s law, like solid materials;
(e)
Radiative heat transfer between the battery pack and the environment is negligible.
Heat flux through solids and PCM follows Fourier’s conduction formula:
q s = λ s T s
where qs is the heat flux, λs is the thermal conductivity, and ∇Ts is the temperature gradient.
The fluid flow and heat transfer in cold plates are described by the following continuity equation, momentum equation and energy equation:
ρ l t + · ρ l u l = 0
ρ l u l t + u l · ρ l u l = p l + μ l 2 u l + ρ l g + F
ρ l H l t + u l · ρ l H l = · λ l T l + S
where ρl is the density, u is the velocity, Hl is the enthalpy, λl is the thermal conductivity, pl is the pressure, μl is the dynamic viscosity, and Tl is the temperature of the cooling fluid, respectively. F is the source term in the momentum equation, and S is the source term in the energy equation and t is time. The laminar flow model is applied when the Reynolds number is less than 2300, while the k-ω turbulence model is adopted when the Reynolds number is equal to or greater than 2300.
The liquid volume fraction of the PCM is calculated with the Enthalpy-Porosity Method:
β = 0 i f   T p c m < T o m ,   p c m   T p c m T o m ,   p c m T c m ,   p c m T o m ,   p c m i f   T o m ,   p c m T p c m < T c m ,   p c m   1 i f   T p c m T c m ,   p c m
H p c m = h p c m + β L p c m
h p c m = T i n i ,   p c m T p c m C p ,   p c m d T p c m
where β is the liquid volume fraction, Hpcm is the enthalpy, hpcm is the sensible enthalpy, Lpcm is the latent heat, Tom, pcm is the onset melting temperature, Tcm, pcm is the complete melting temperature, Tini, pcm is the initial temperature, Tpcm is the present temperature, and Cp, pcm is the specific heat capacity of the PCM, respectively.
The walls of the cold plate solid domain are set with periodic boundary conditions. The walls at the inlet and outlet ends are configured with adiabatic boundary conditions, while the walls of the fluid channels serve as fluid–solid coupling interfaces. A velocity inlet is applied at the fluid domain entrance, and a pressure outlet is used at the exit. The outer surfaces of the battery pack are assigned convective boundary conditions with a convective heat transfer coefficient of 5 W/(m2·K). The convective heat flux is calculated using Newton’s law of cooling.
q c = h c T s u r f T a m b
where qc is convective heat flux, Tsurf is the surface temperature of the battery pack, and Tamb is the ambient temperature.

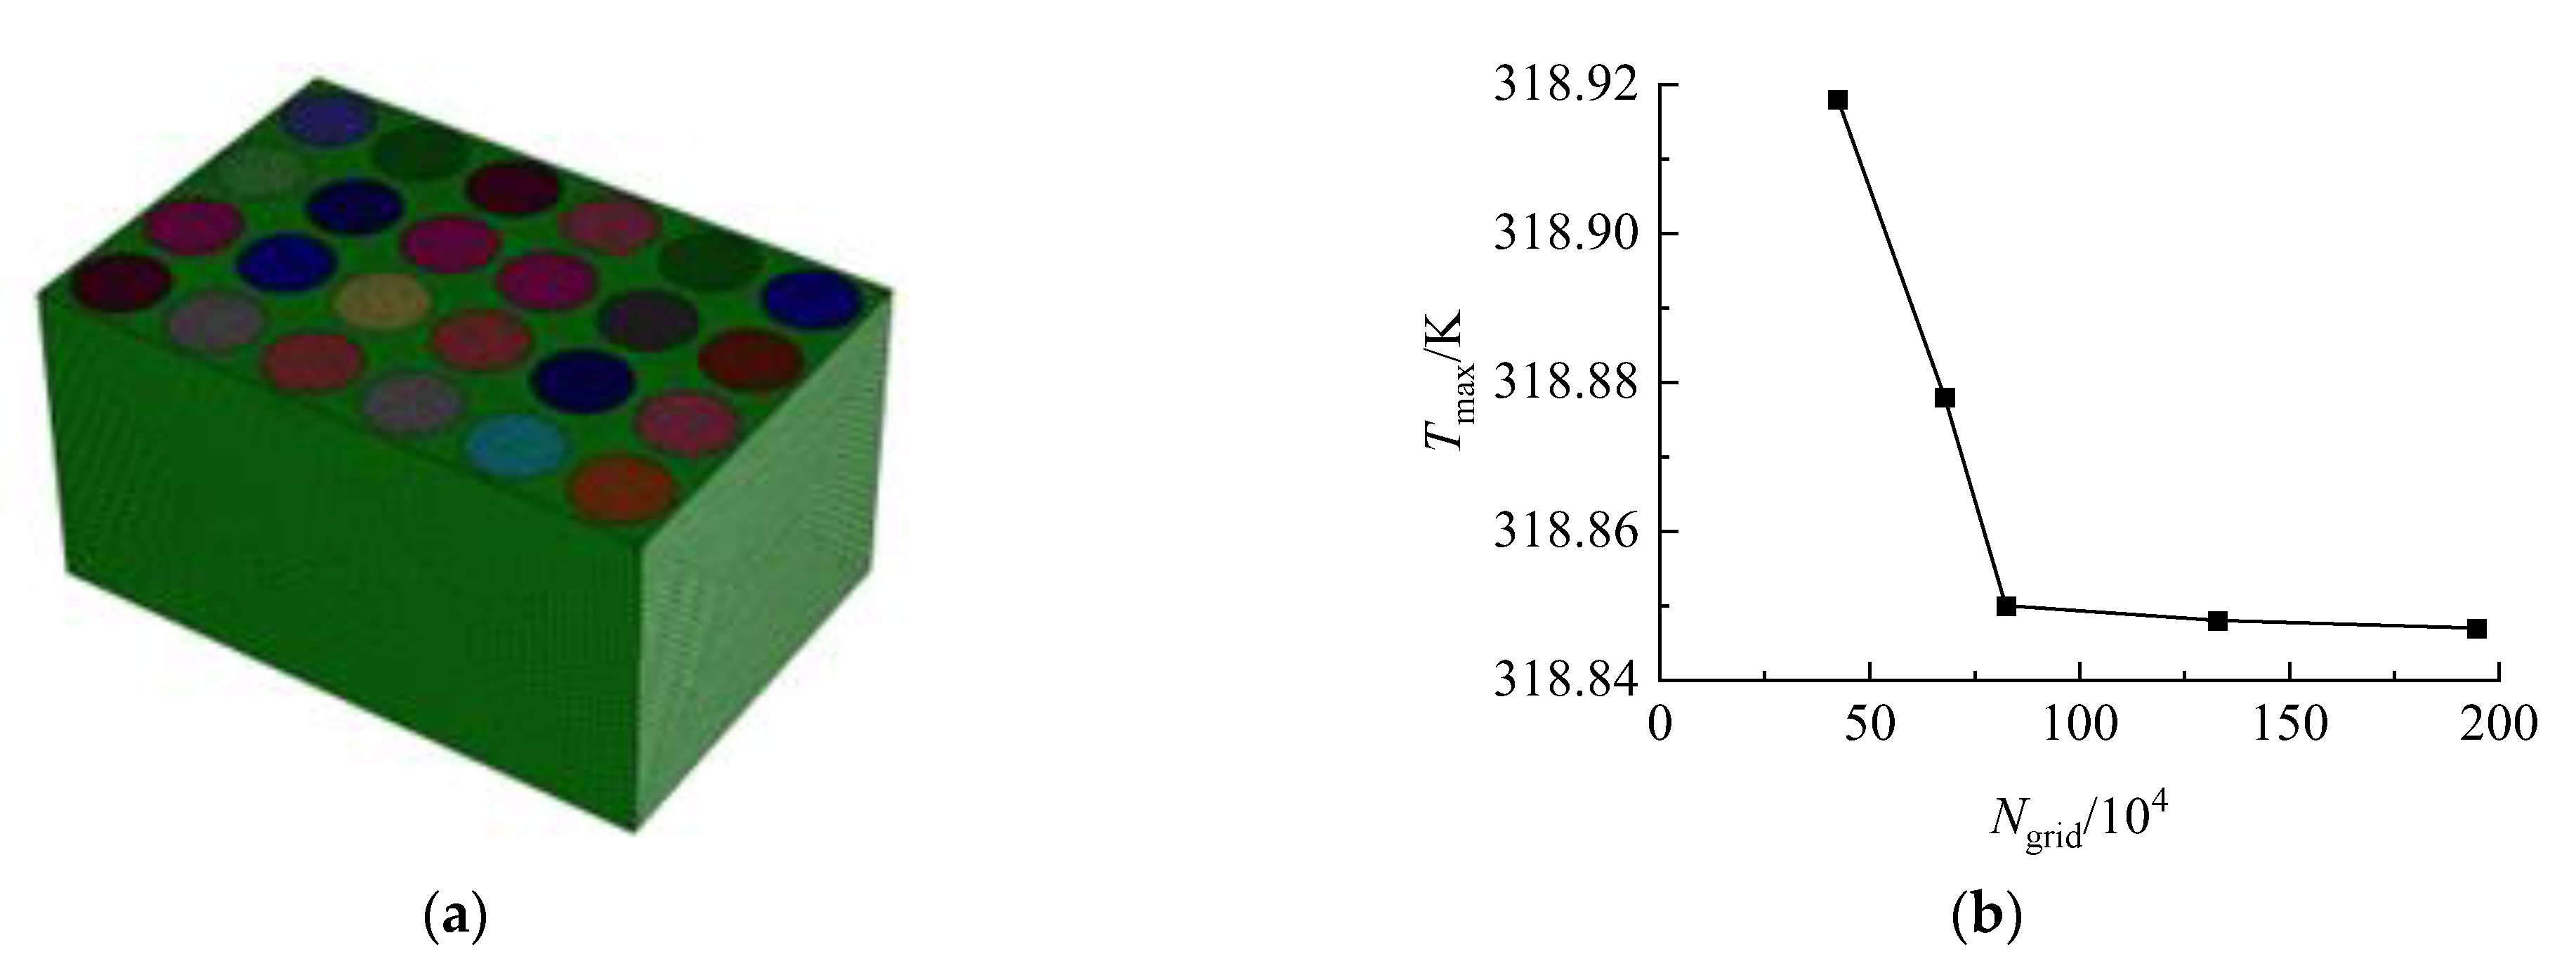
2.4. Mesh Model and Grid Independence Verification

To reduce computational complexity, the battery thermal management system was appropriately simplified by omitting minor structural details such as upper grooves and wiring harnesses. The 3D model was constructed using SpaceClaim 2020 R2 and meshed with unstructured grids via Fluent Meshing.
Grid independence verification was conducted to ensure computational accuracy while minimizing resource consumption. Taking the PCM-only cooling model as an example (ambient temperature: 298 K, discharge rate: 4C), Figure 4 shows the relationship between the battery pack’s maximum temperature (Tmax) and grid count (Ngrid). Results indicate that when the grid count reaches 823,346, further mesh refinement yields negligible changes in Tmax. Thus, the model with 823,346 grid elements was selected for simulations.

2.5. Model Validation

In this study, to verify the reliability of the numerical simulation method, as shown in Figure 5, the constant–current discharge experiments of lithium-ion batteries from 0.5C to 2C in reference [25] were simulated using ANSYS Fluent. The maximum error between the simulation results and the experimental data was below 2.23%, indicating that the simulation method is reliable [10].

3. Results and Analysis

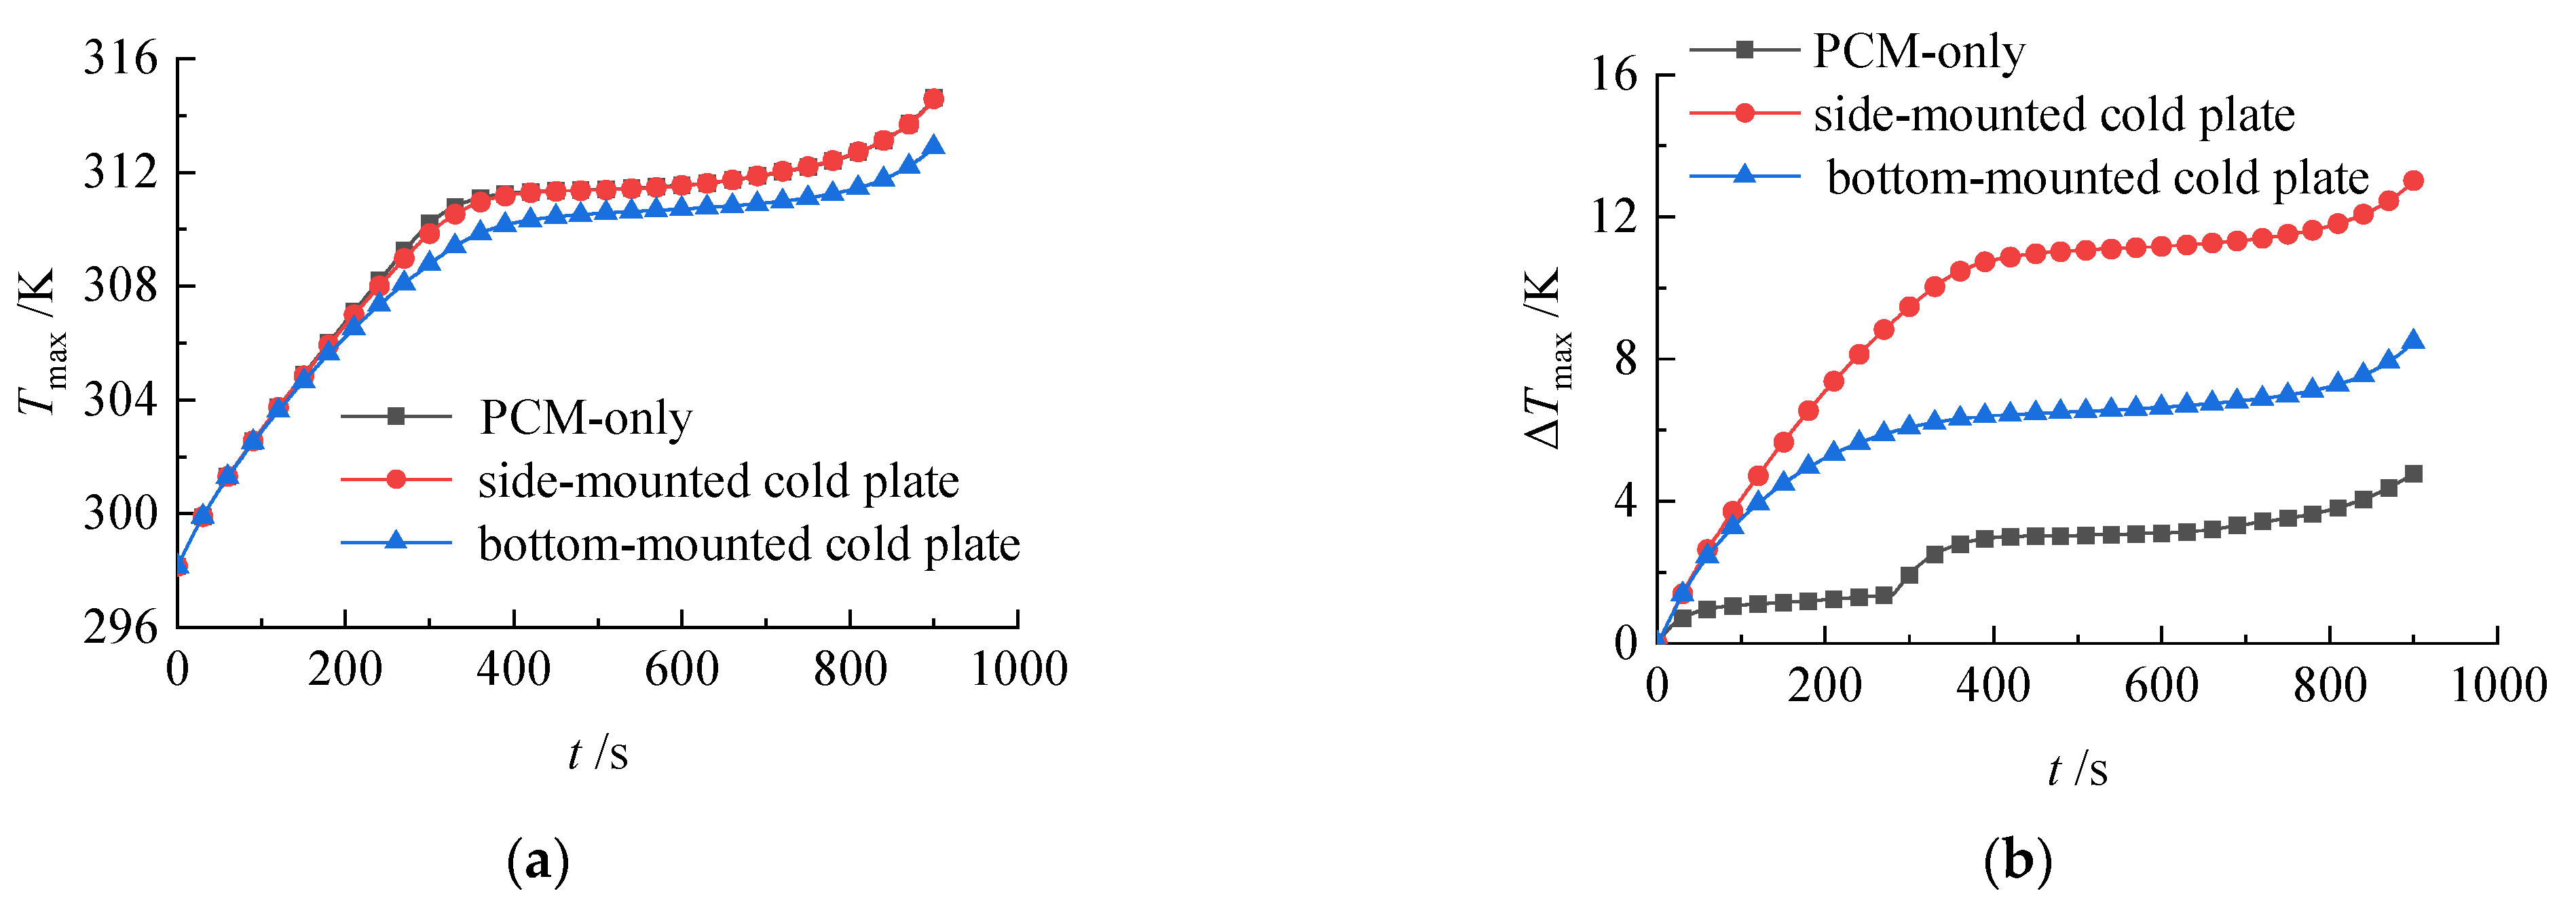
3.1. Thermal Management Performance of PCM–Conventional Liquid Cooling Hybrid System

The battery pack employs the PCM–liquid cooling hybrid thermal management system with side-mounted or bottom-mounted cold plates, as shown in Figure 1. Under conditions of ambient and coolant inlet temperatures at 298.15 K and a coolant flow velocity of 0.1 m/s, the 4C discharge process was simulated. Compared to a PCM-only cooling system without cold plates, the variations in the battery pack’s maximum temperature (Tmax) and maximum temperature difference (ΔTmax) during discharge are illustrated in Figure 6. Around 300 s later, the temperature rise slows down. After the latent heat of the PCM is consumed, the liquid cooling system and natural convection take over as the main cooling mechanisms. Their enhanced thermal conduction and convection effects offset the temperature increase in the sensible heat stage. The cold plate design improves the cooling path. The synergy of the hybrid system ensures thermal stability during discharging.
The side-mounted cold plate configuration showed nearly identical Tmax to the PCM-only system. As shown in Figure 7, while the sides near the cold plates were cooler, the central region exhibited high thermal resistance due to PCM’s low conductivity, resulting in minimal Tmax reduction. The battery pack with a bottom-mounted cold plate reached a Tmax of 312.89 K at the end of discharge, which is 1.8 K lower than that without a cold plate and slightly better than the side-mounted configuration. Since the battery bottom is in direct contact with the cold plate and the axial thermal conductivity of cylindrical lithium batteries is higher than the radial direction, the bottom-mounted cold plate can dissipate more heat during battery discharge under the same coolant flow rate conditions.
Both cold plate configurations exacerbated temperature inhomogeneity, with ΔTmax exceeding 10 K, representing increases of 212.3% and 172.3%, respectively compared to the configuration without cold plates. This is primarily because the battery cells close to the cold plate benefit from effective heat dissipation conditions, leading to significantly lower temperatures, while the internal cells farther from the cold plate maintain relatively higher temperatures.
The results demonstrate that merely adding cold plates to PCM-filled battery packs yields limited Tmax suppression (≤1.8 K) during 4C discharge while severely compromising temperature uniformity—a critical lifespan determinant. The following section explores fin-enhanced designs to enhance thermal management, thereby improving temperature uniformity during high-rate discharges.

3.2. Thermal Management Performance of PCM–Fin Enhanced Liquid Cooling Hybrid System

As shown in Figure 2, cold plates were arranged on both the top and bottom of the battery pack, with fins added to enhance heat dissipation. Furthermore, optimization analyses were conducted on several key parameters of the cold plates, including the number of flow channels, the coolant flow direction, the fluid velocity, and the inlet temperature.

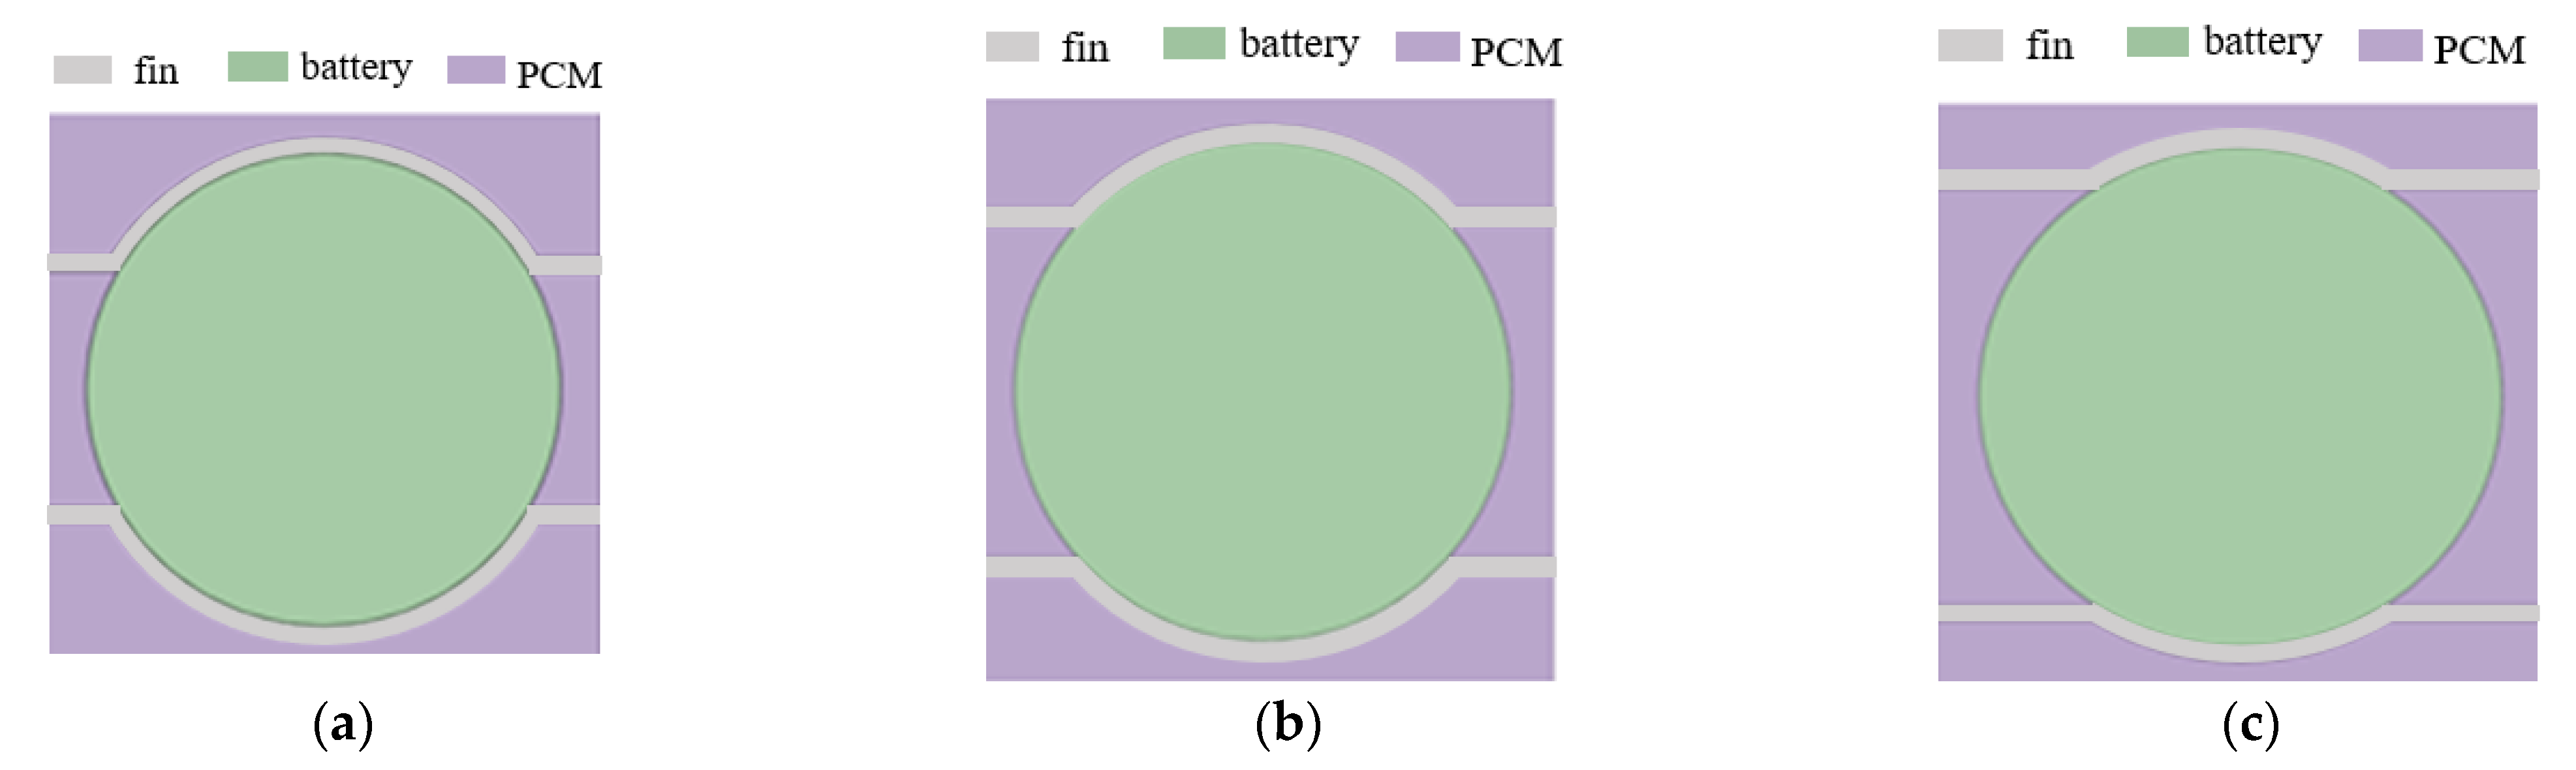
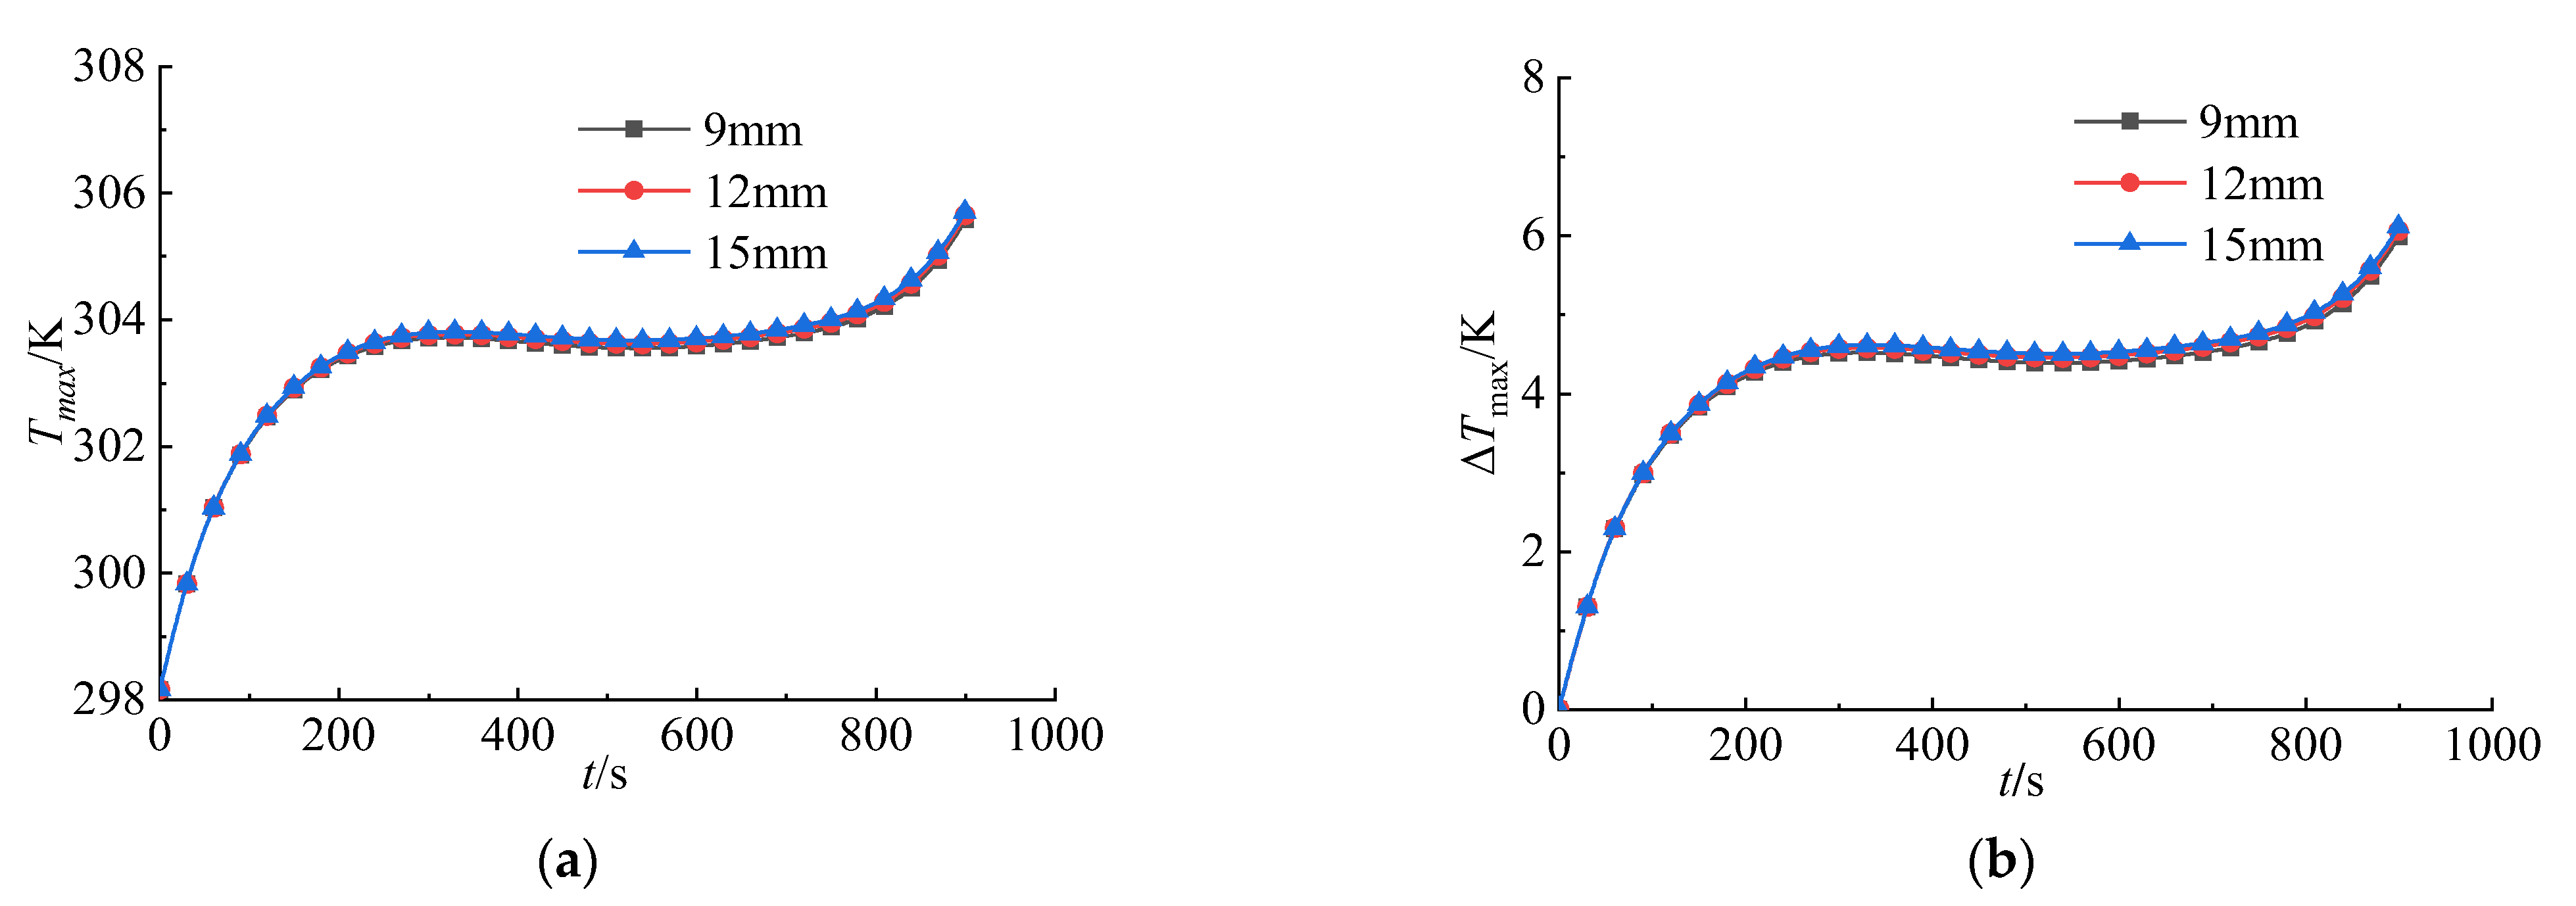
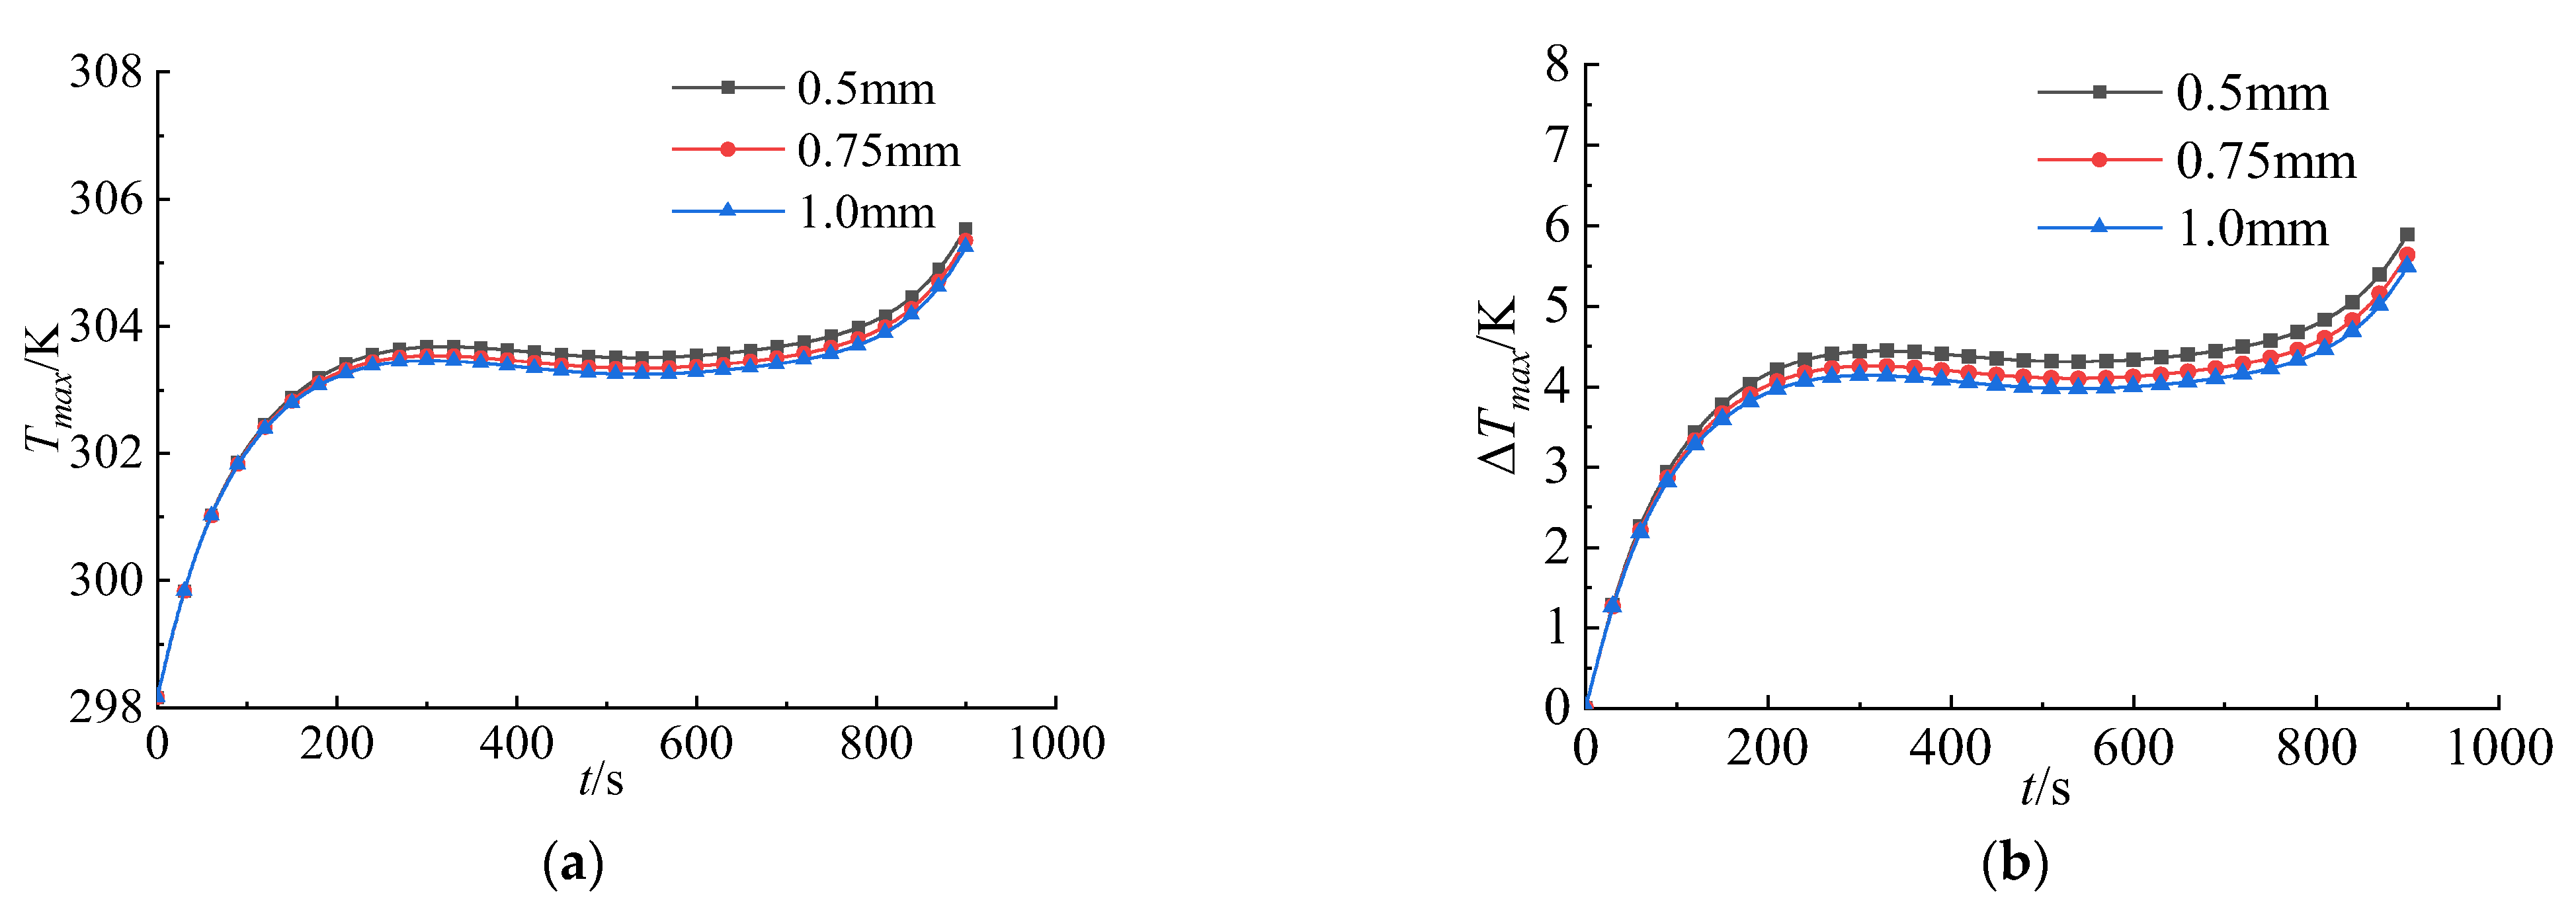
3.2.1. Influence of Fin Spacing and Fin Thickness on Temperature Distribution

The spacing between fins significantly affects the heat exchange performance of the heat exchanger. A comparison was conducted among fin structures with spacings of 9 mm, 12 mm, and 15 mm to evaluate their impacts on battery module temperature. The structural diagrams are shown in Figure 8. The maximum temperatures and maximum temperature differences of battery packs with different fin spacings are presented in Figure 9. The temperature and temperature difference curves demonstrate close similarity. As the fin spacing increases from 9 mm to 15 mm, the maximum temperatures of the battery pack are 305.58 K, 305.65 K, and 305.71 K, respectively, while the maximum temperature differences are 5.99 K, 6.06 K, and 6.12 K, respectively. The gradual rise in maximum battery pack temperature with increased fin spacing occurs because larger spacing reduces the contact area between fins and the battery module. The 9 mm fin spacing configuration proves more appropriate.
Fin thickness also influences thermal conductivity. Models with thicknesses of 0.5 mm, 0.75 mm, and 1.0 mm were compared (structural diagrams in Figure 10). Figure 11 shows the temperature rise characteristics during 4C discharge at 25 °C ambient temperature. Regarding maximum temperature: all three fin thickness configurations meet design specifications. Compared with the 0.5 mm fin configuration, the 0.75 mm and 1.0 mm configurations reduce maximum temperature by 0.18 K and 0.29 K, respectively. Both maximum temperature and temperature difference decrease with increasing fin thickness due to enhanced thermal conductivity and improved heat transfer between the thermal management system and battery module. However, while the 1.0 mm configuration reduces the maximum temperature and temperature difference by only 0.28 K and 0.4 K compared to the 0.5 mm configuration, the mass of fins increases by 49.6%. Comprehensive evaluation suggests the 0.5 mm fin thickness configuration is more suitable.

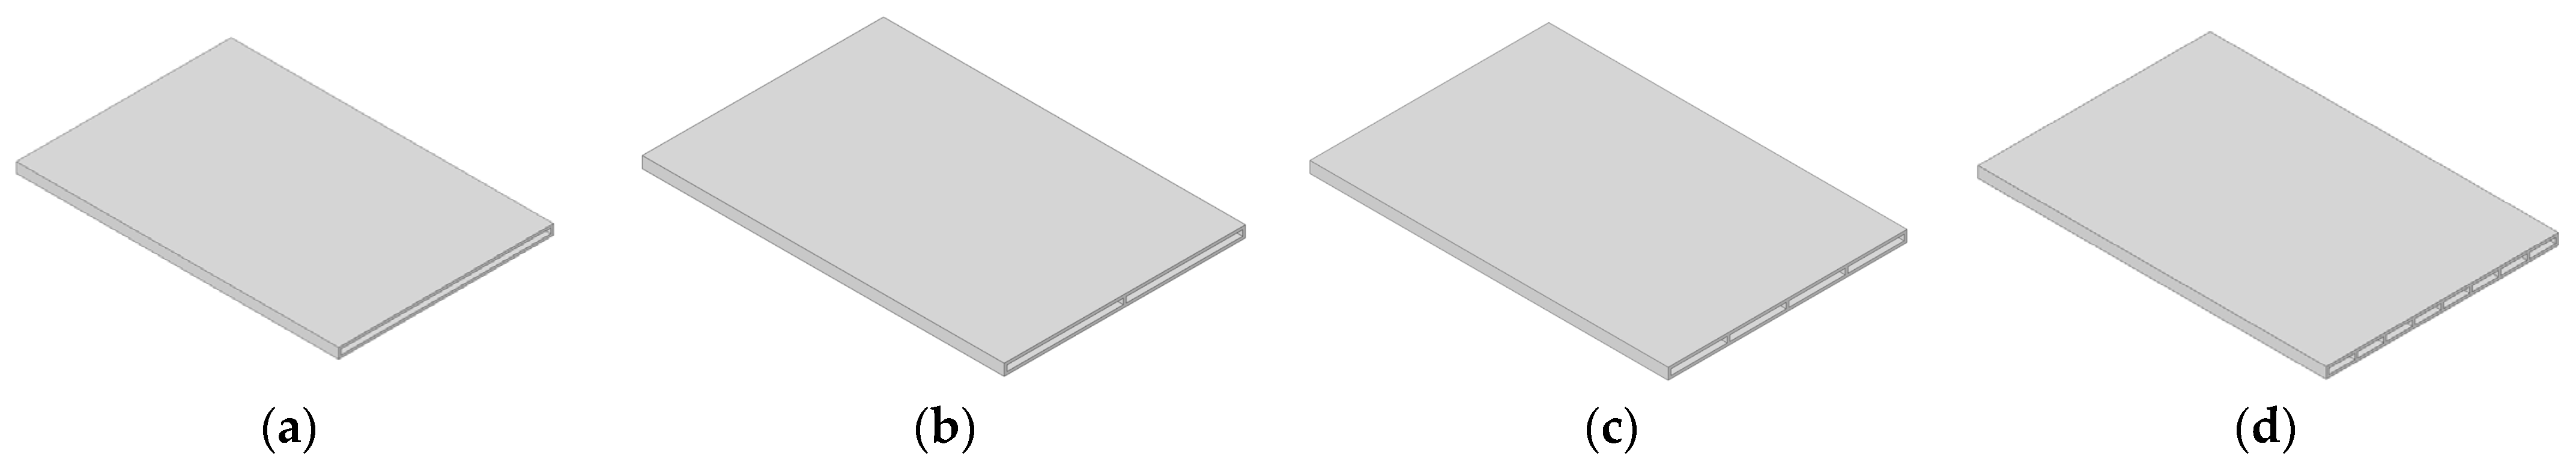
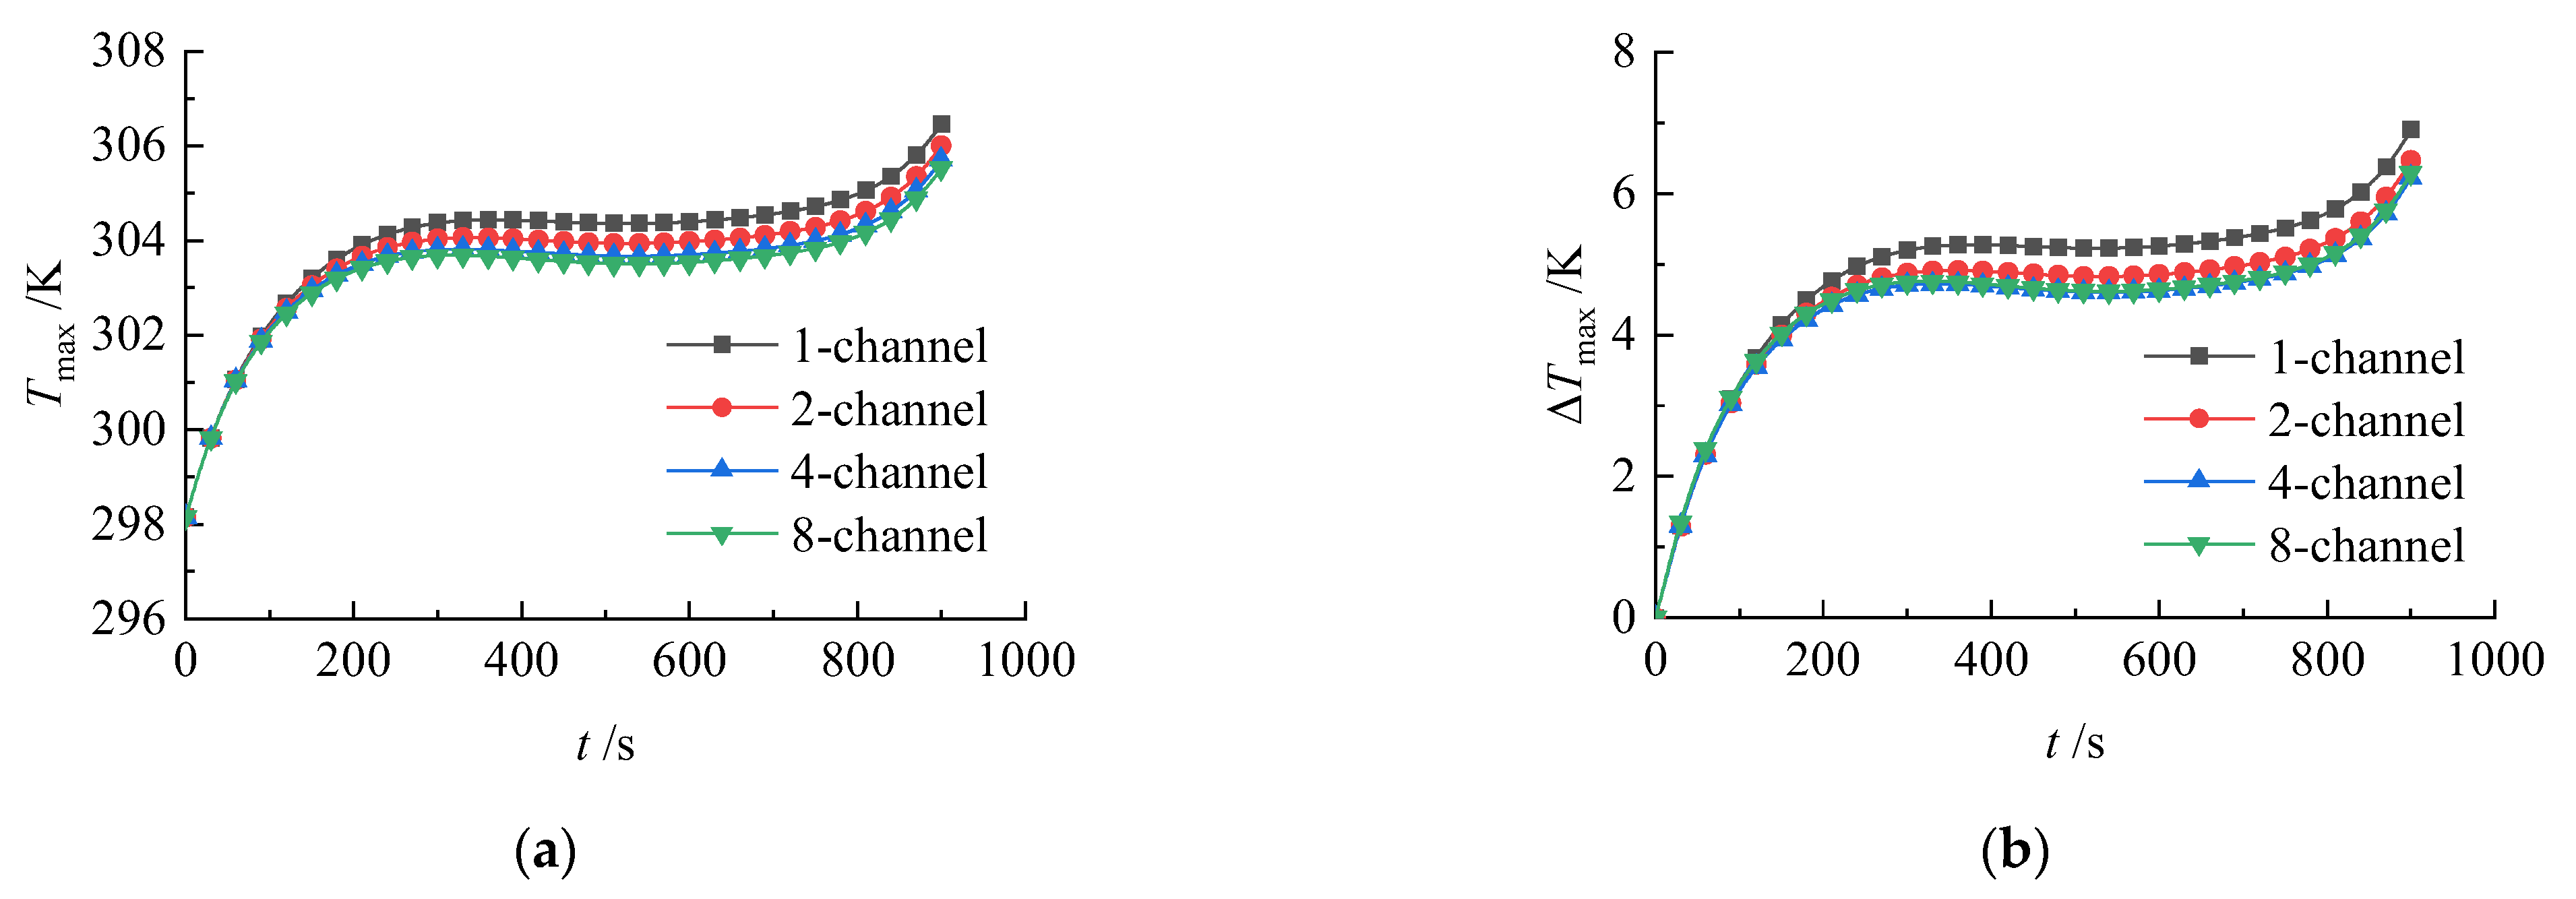
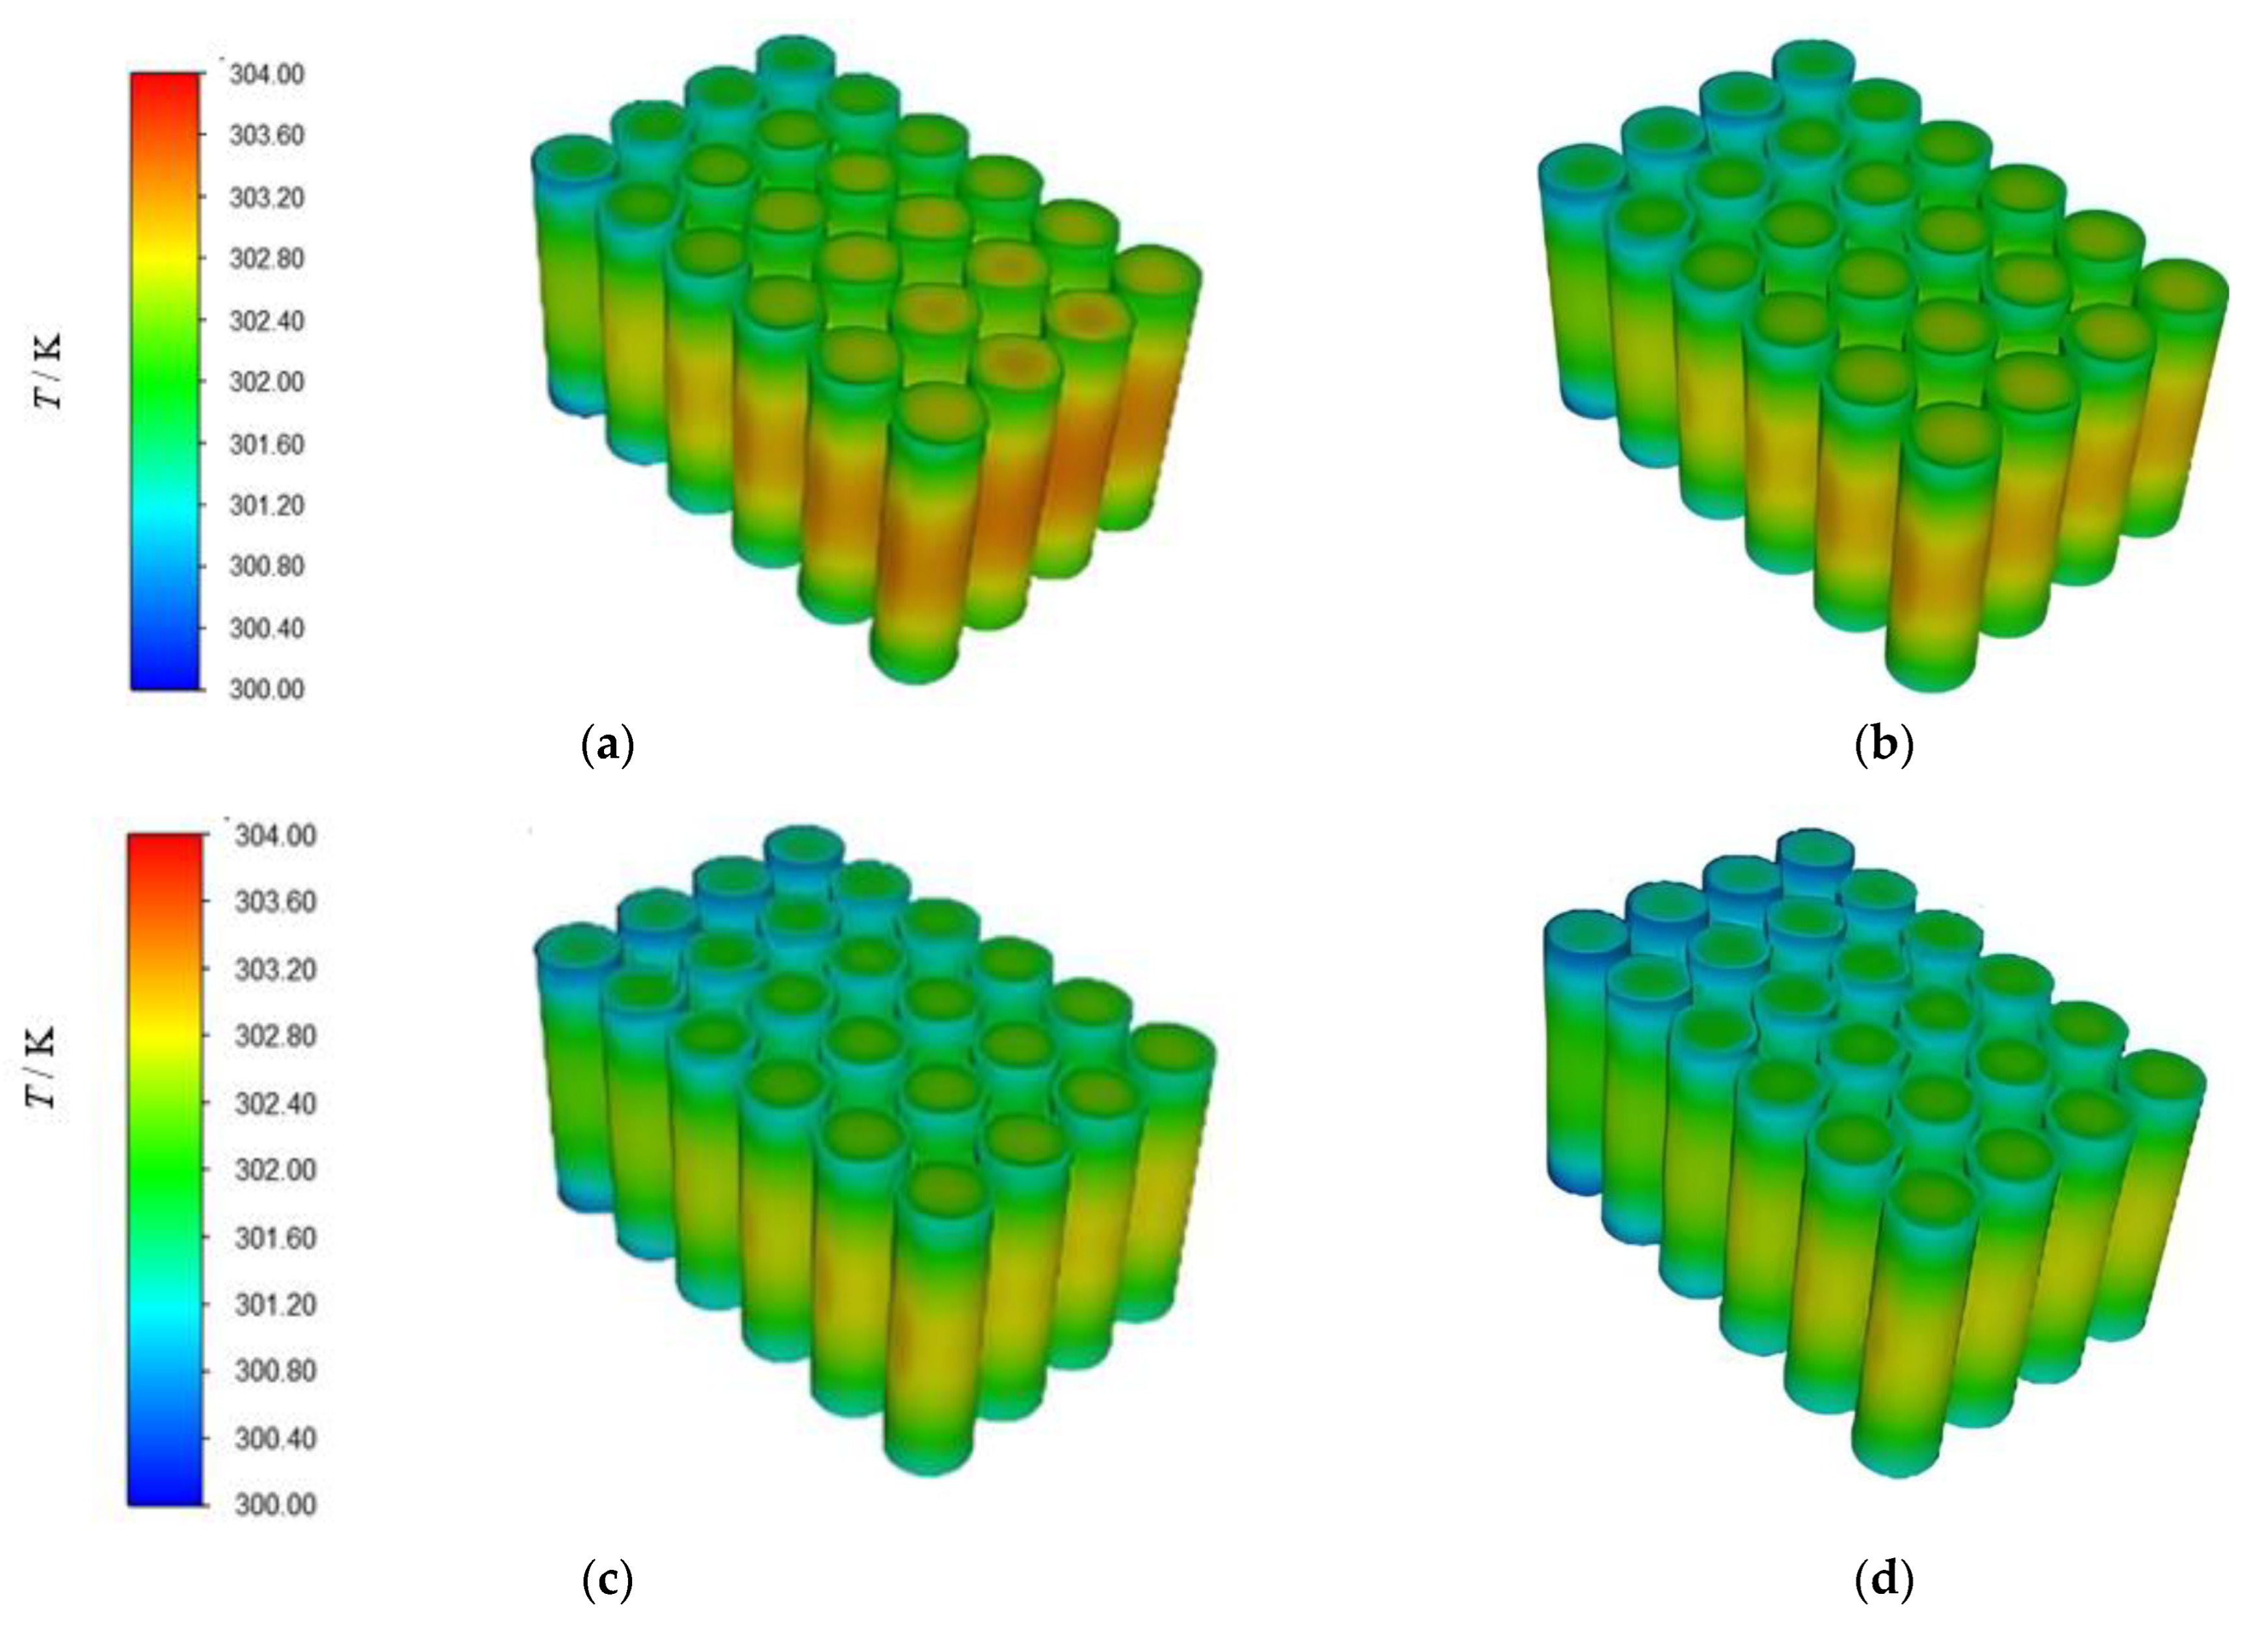
3.2.2. Effect of Channel Quantity on Battery Pack Temperature Distribution

Four cold plate configurations with one, two, four, and eight flow channels were modeled, as illustrated in Figure 12. Each cold plate had the same channel width, a channel height of 2 mm, and a wall thickness of 1 mm.
Under conditions of ambient and coolant inlet temperatures at 298.15 K, unidirectional coolant flow at 0.1 m/s, and a 4C discharge rate, the results in Figure 13 show that the Tmax gradually decreases with channel quantity. This improvement is attributed to the partition walls between the flow channels acting as fins, enhancing heat transfer between the coolant and the cold plate. However, the rate of temperature reduction diminishes with additional channels. For example, the eight-channel configuration reduced Tmax by only 0.17 K compared to the four-channel design, while the ΔTmax remained largely unchanged and still exceeded 6 K.
The temperature distributions in Figure 14 reveal that, due to the consistent coolant flow direction across all configurations, the temperature profiles were similar for all four designs. Temperatures increased from the inlet to the outlet, with the central region of the battery pack exhibiting significantly higher temperatures than the top and bottom due to its distance from the cold plate. The eight-channel and four-channel designs showed nearly identical Tmax and ΔTmax curves. The four-channel configuration exceeds a ΔTmax of 5 K after 785 s, while the eight-channel design did so after 781 s. Considering both heat transfer efficiency and manufacturing feasibility, the four-channel cold plate was selected for further optimization.

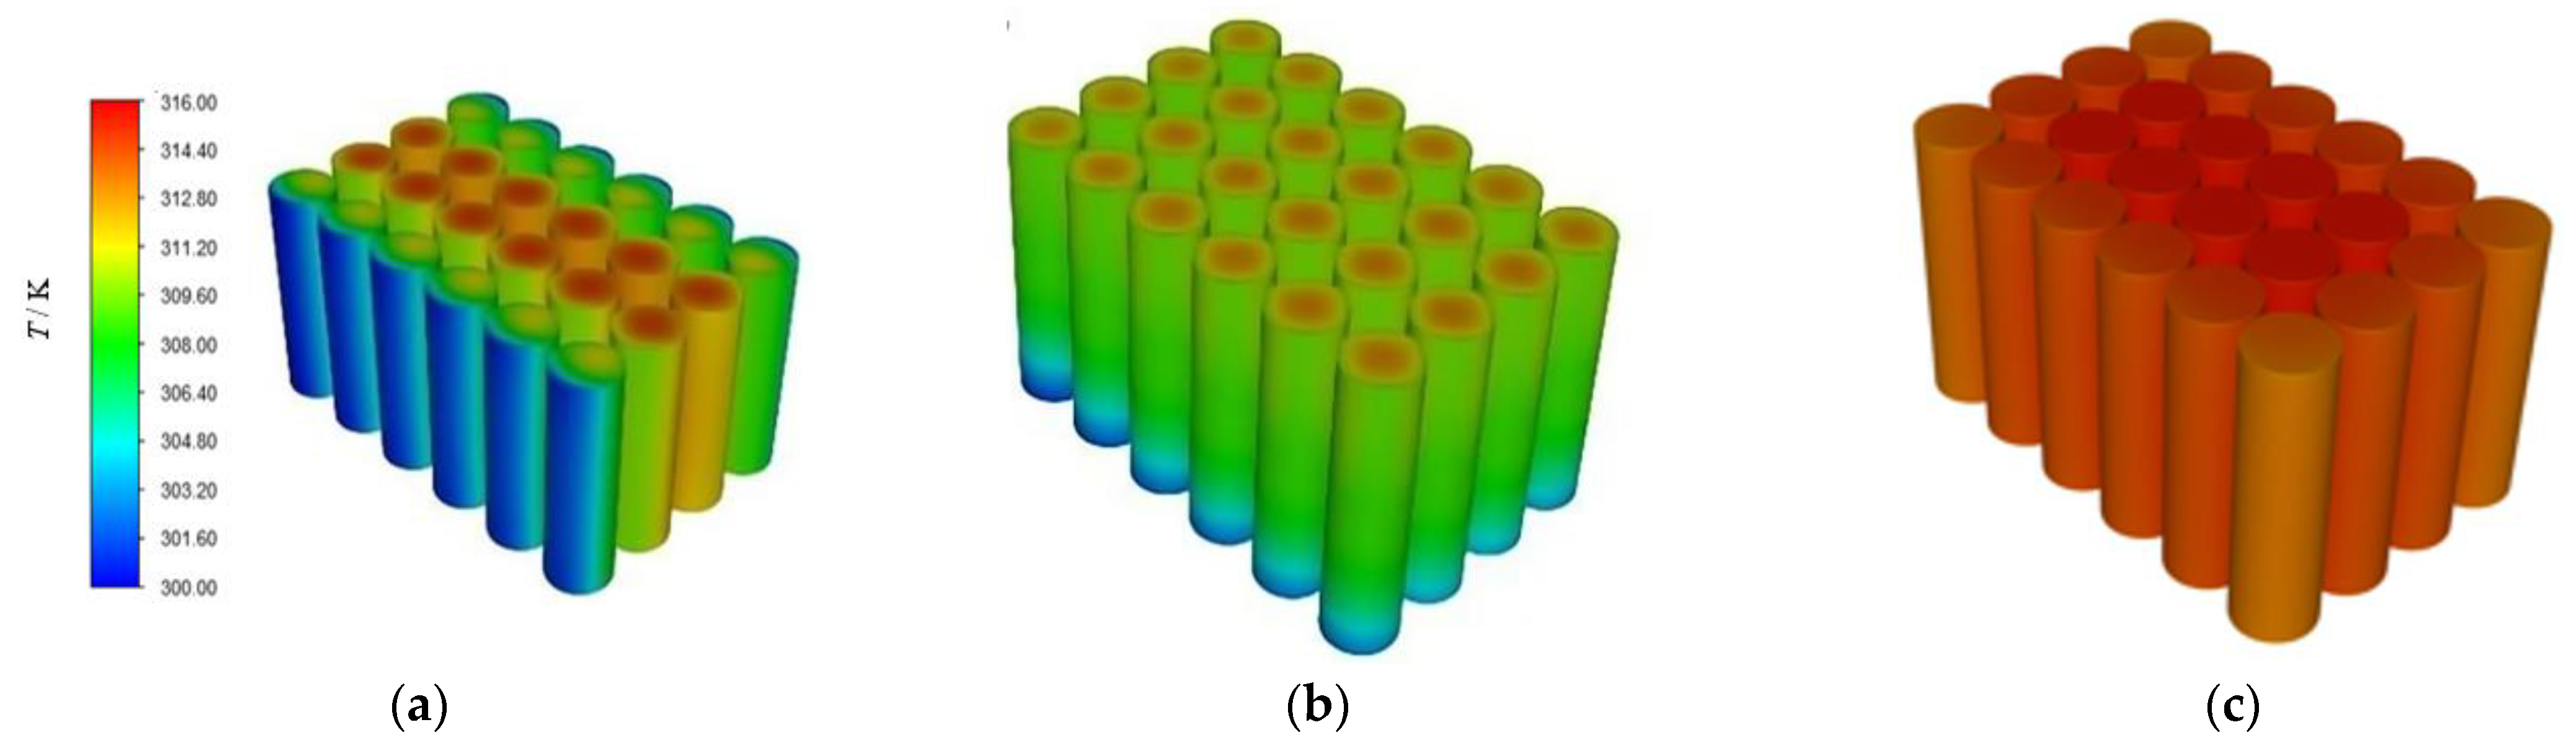
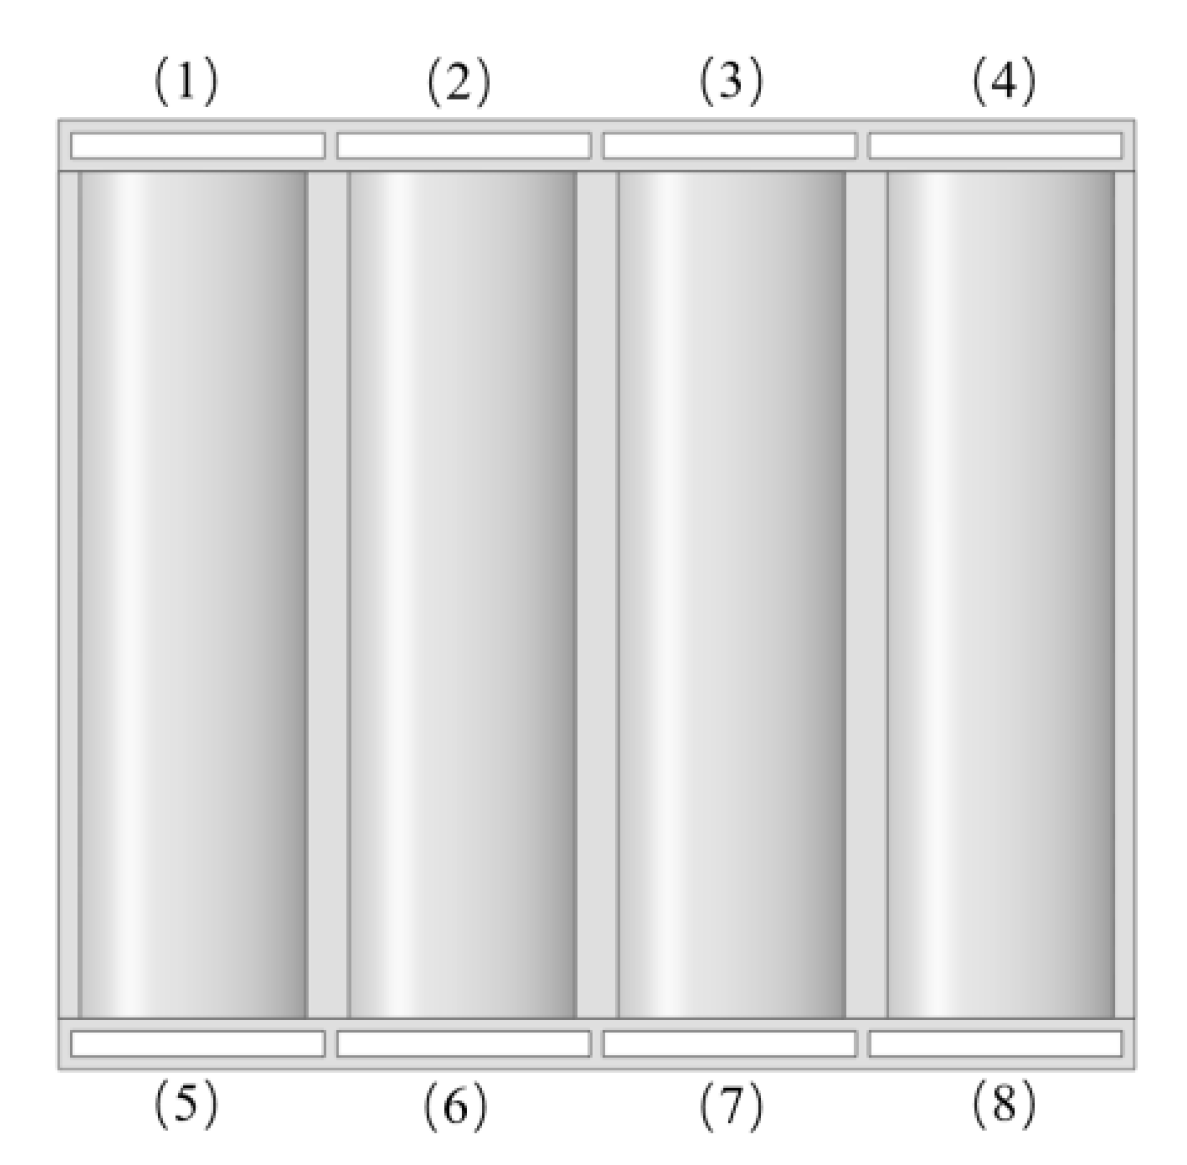
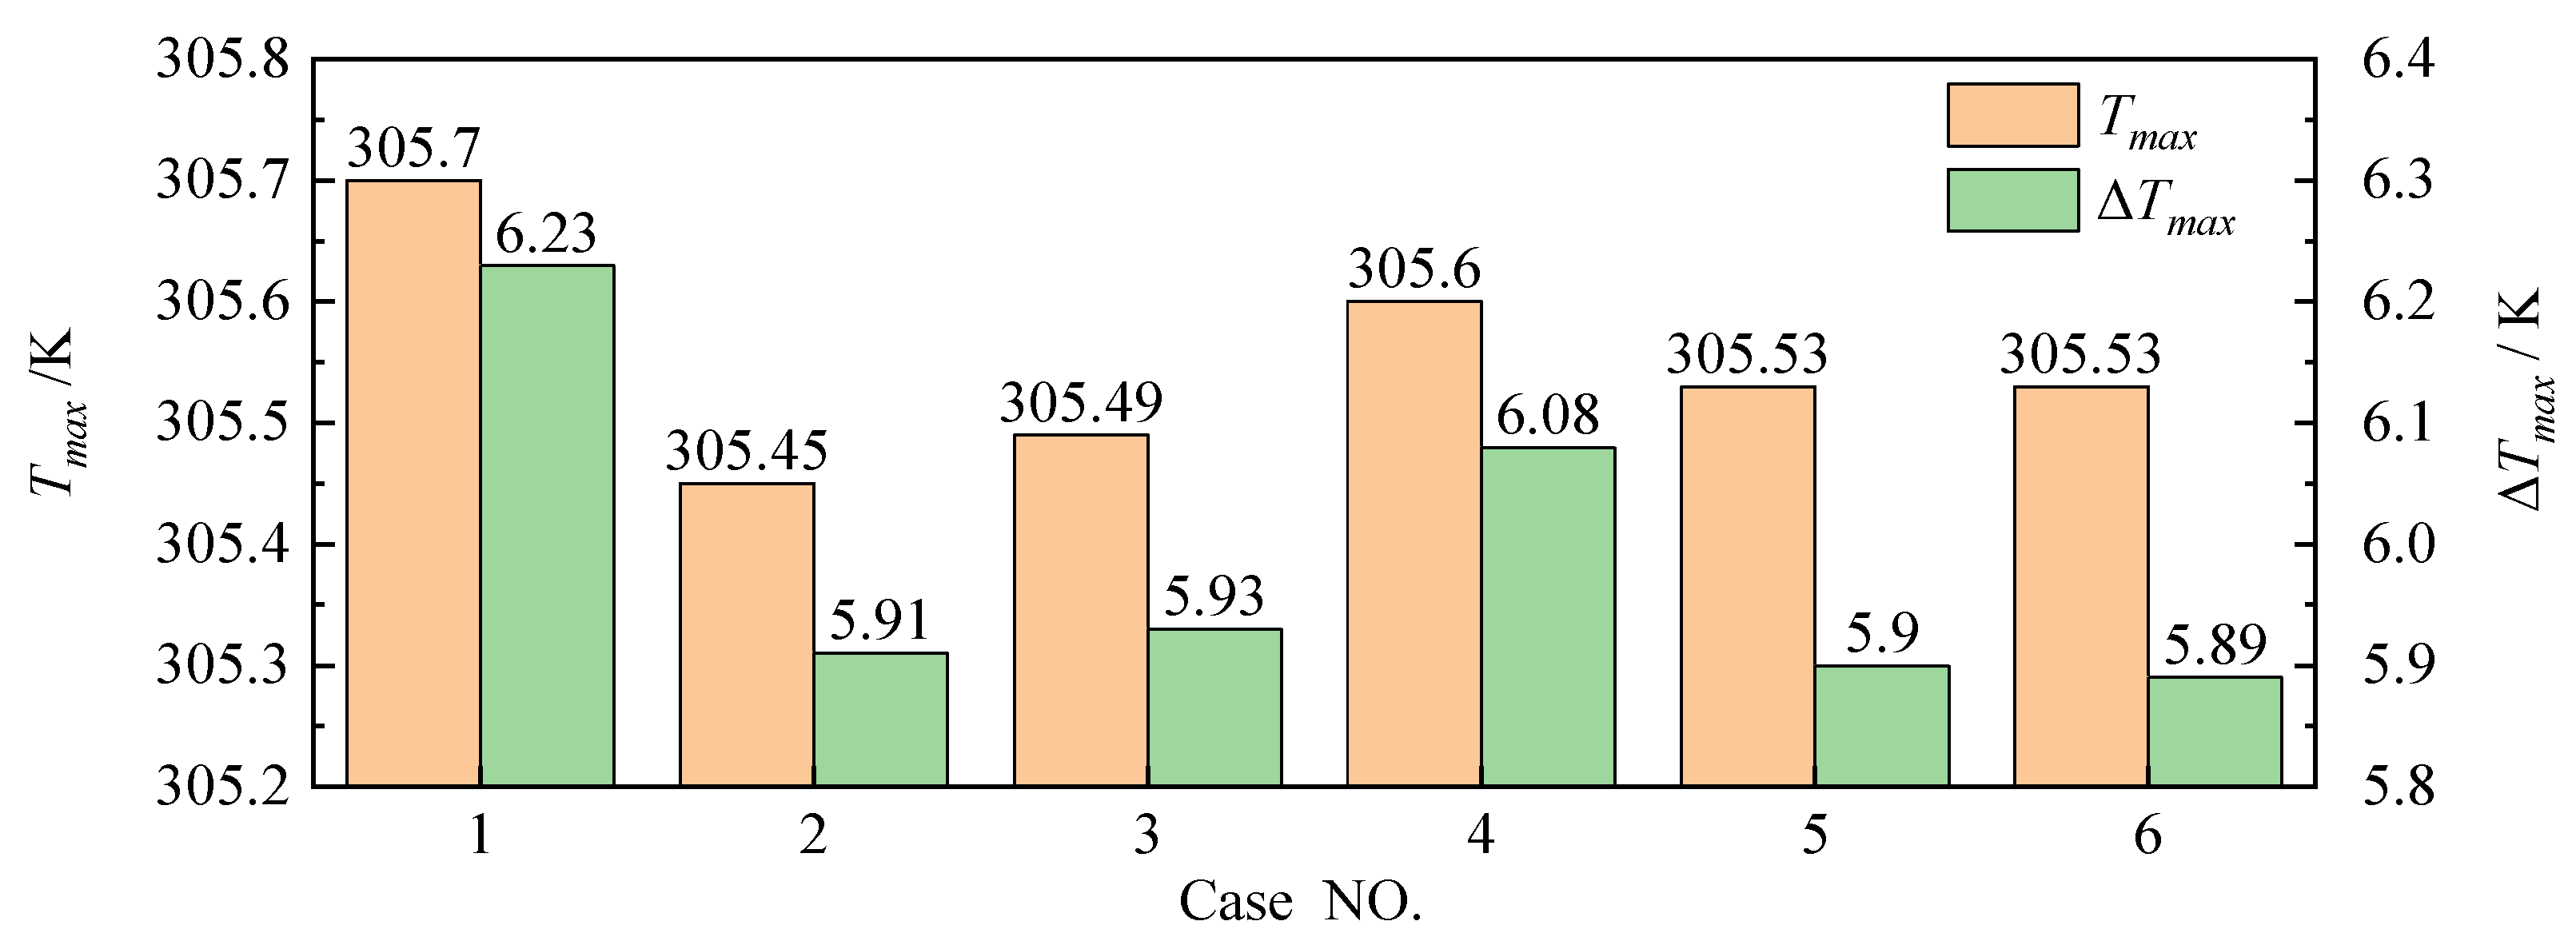
3.2.3. Effect of Coolant Flow Direction on Battery Temperature Distribution

The eight flow channels in the top and bottom cold plates were numbered as shown in Figure 15. By configuring the flow direction of each channel as either “inlet” or “outlet”, six different flow arrangements were established (Table 4).
Under the same operating conditions (ambient and coolant inlet temperatures at 298.15 K, flow velocity of 0.1 m/s, and 4C discharge), all six flow arrangements maintained the maximum battery temperature below 306 K, an acceptable range (Figure 16). Among all these configurations, Case 6 achieved the smallest ΔTmax of 5.89 K.

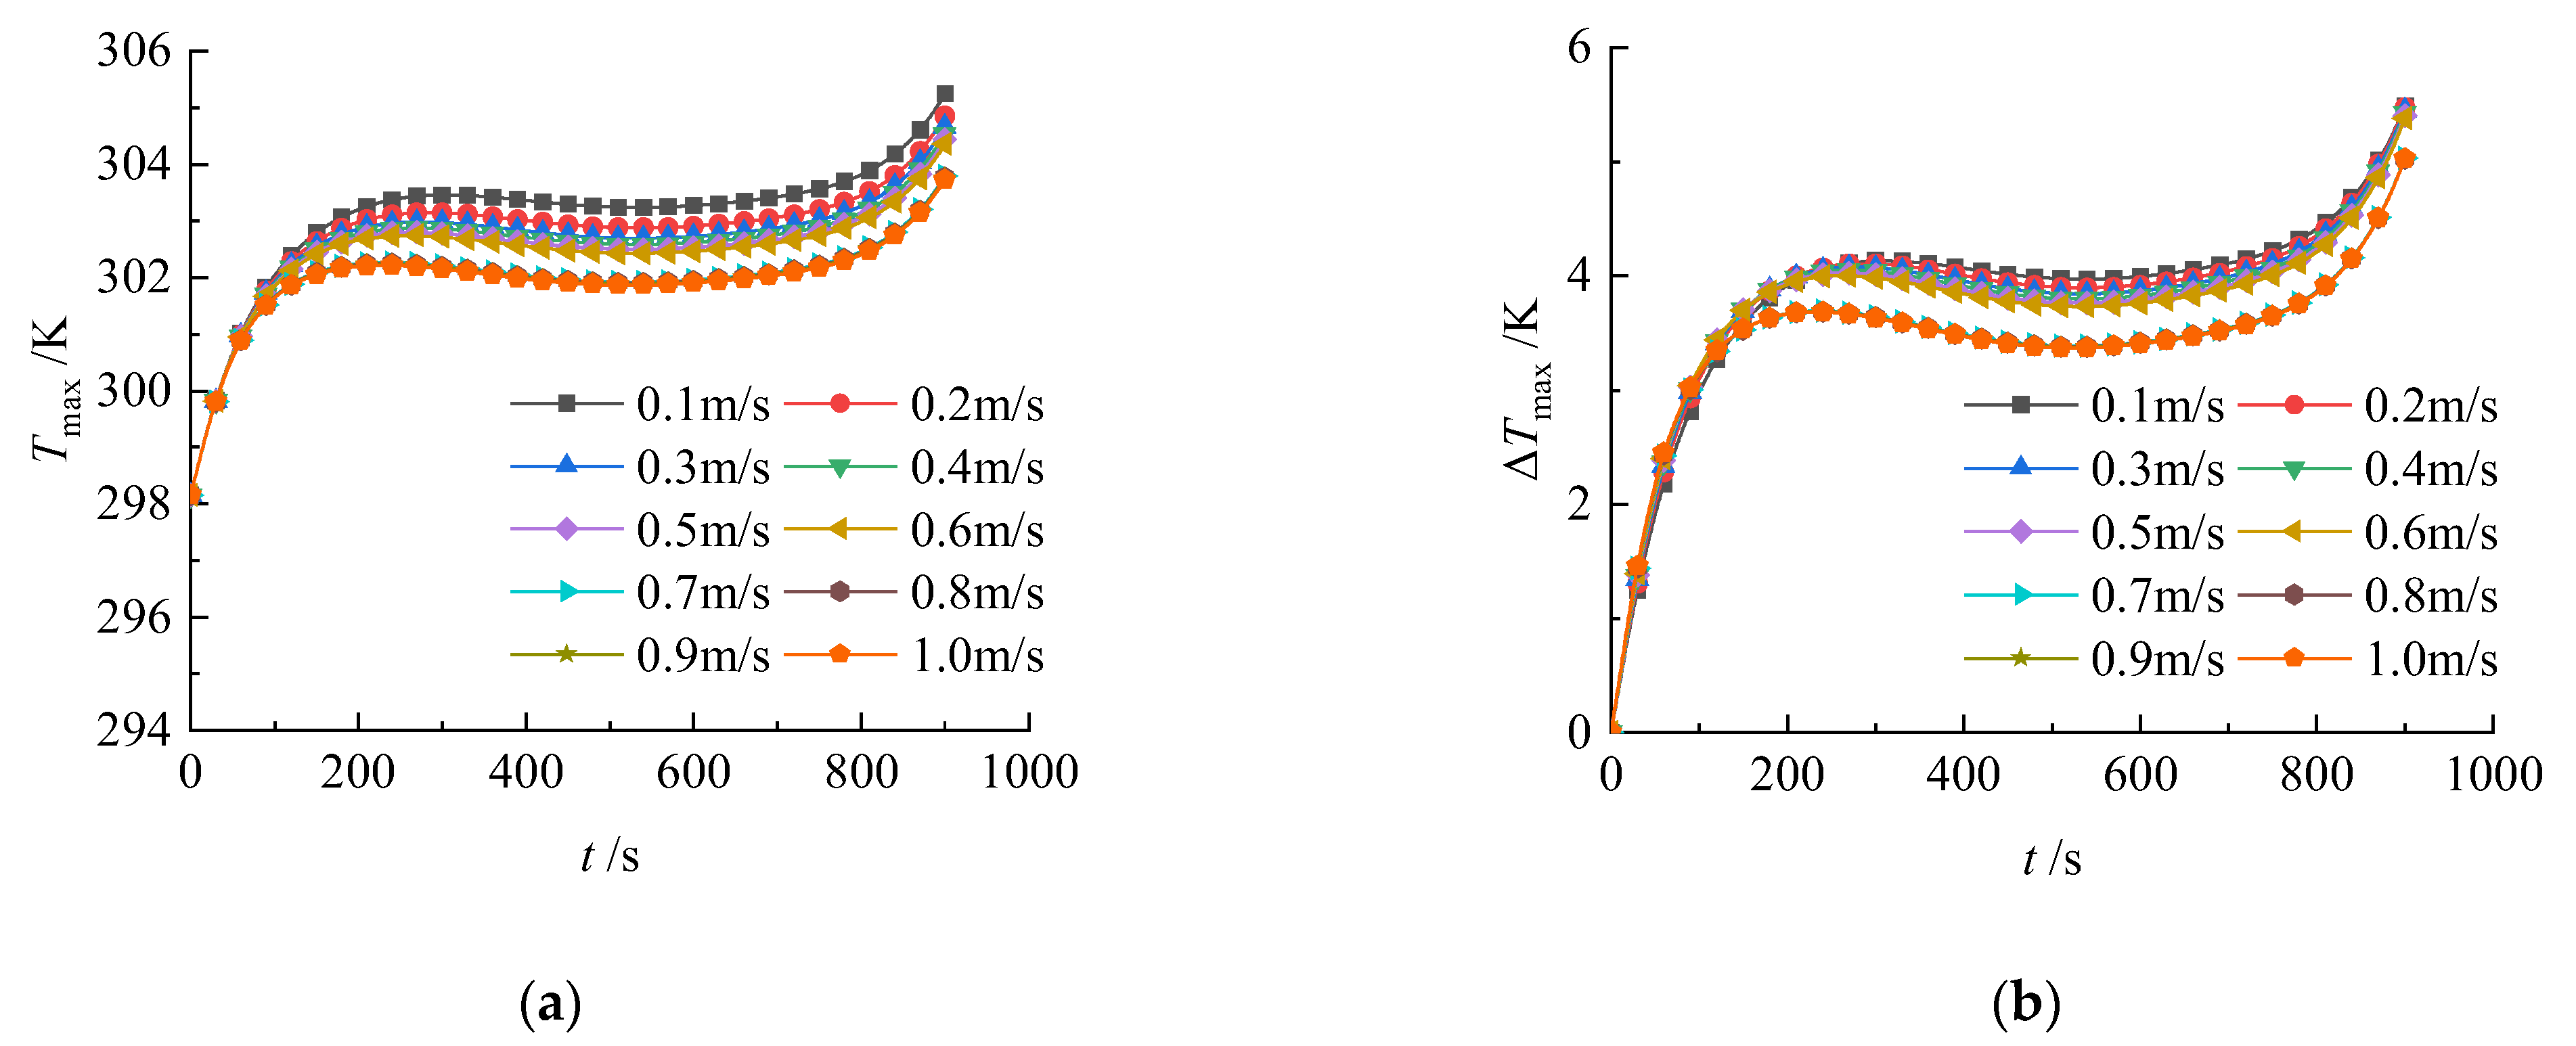
3.2.4. Effect of Coolant Flow Velocity on Battery Temperature Distribution

Based on Case 6, the coolant flow velocity was incrementally increased from 0.1 m/s to 1.0 m/s. The resulting changes in Tmax and ΔTmax are shown in Figure 17. The results indicate that both Tmax and ΔTmax decreased with increasing flow velocity. However, beyond a certain point, further increases in velocity had minimal impact due to limitations in the thermal conductivity of the battery and phase change material. At 0.7 m/s, Tmax reached 303.79 K, with the coolant entering turbulent flow and showing significant cooling improvement. Increasing the velocity to 1.0 m/s only reduced Tmax by less than 0.1 K compared to 0.7 m/s. Similarly, ΔTmax at 0.7 m/s was 5.03 K, with negligible improvement at higher velocities.

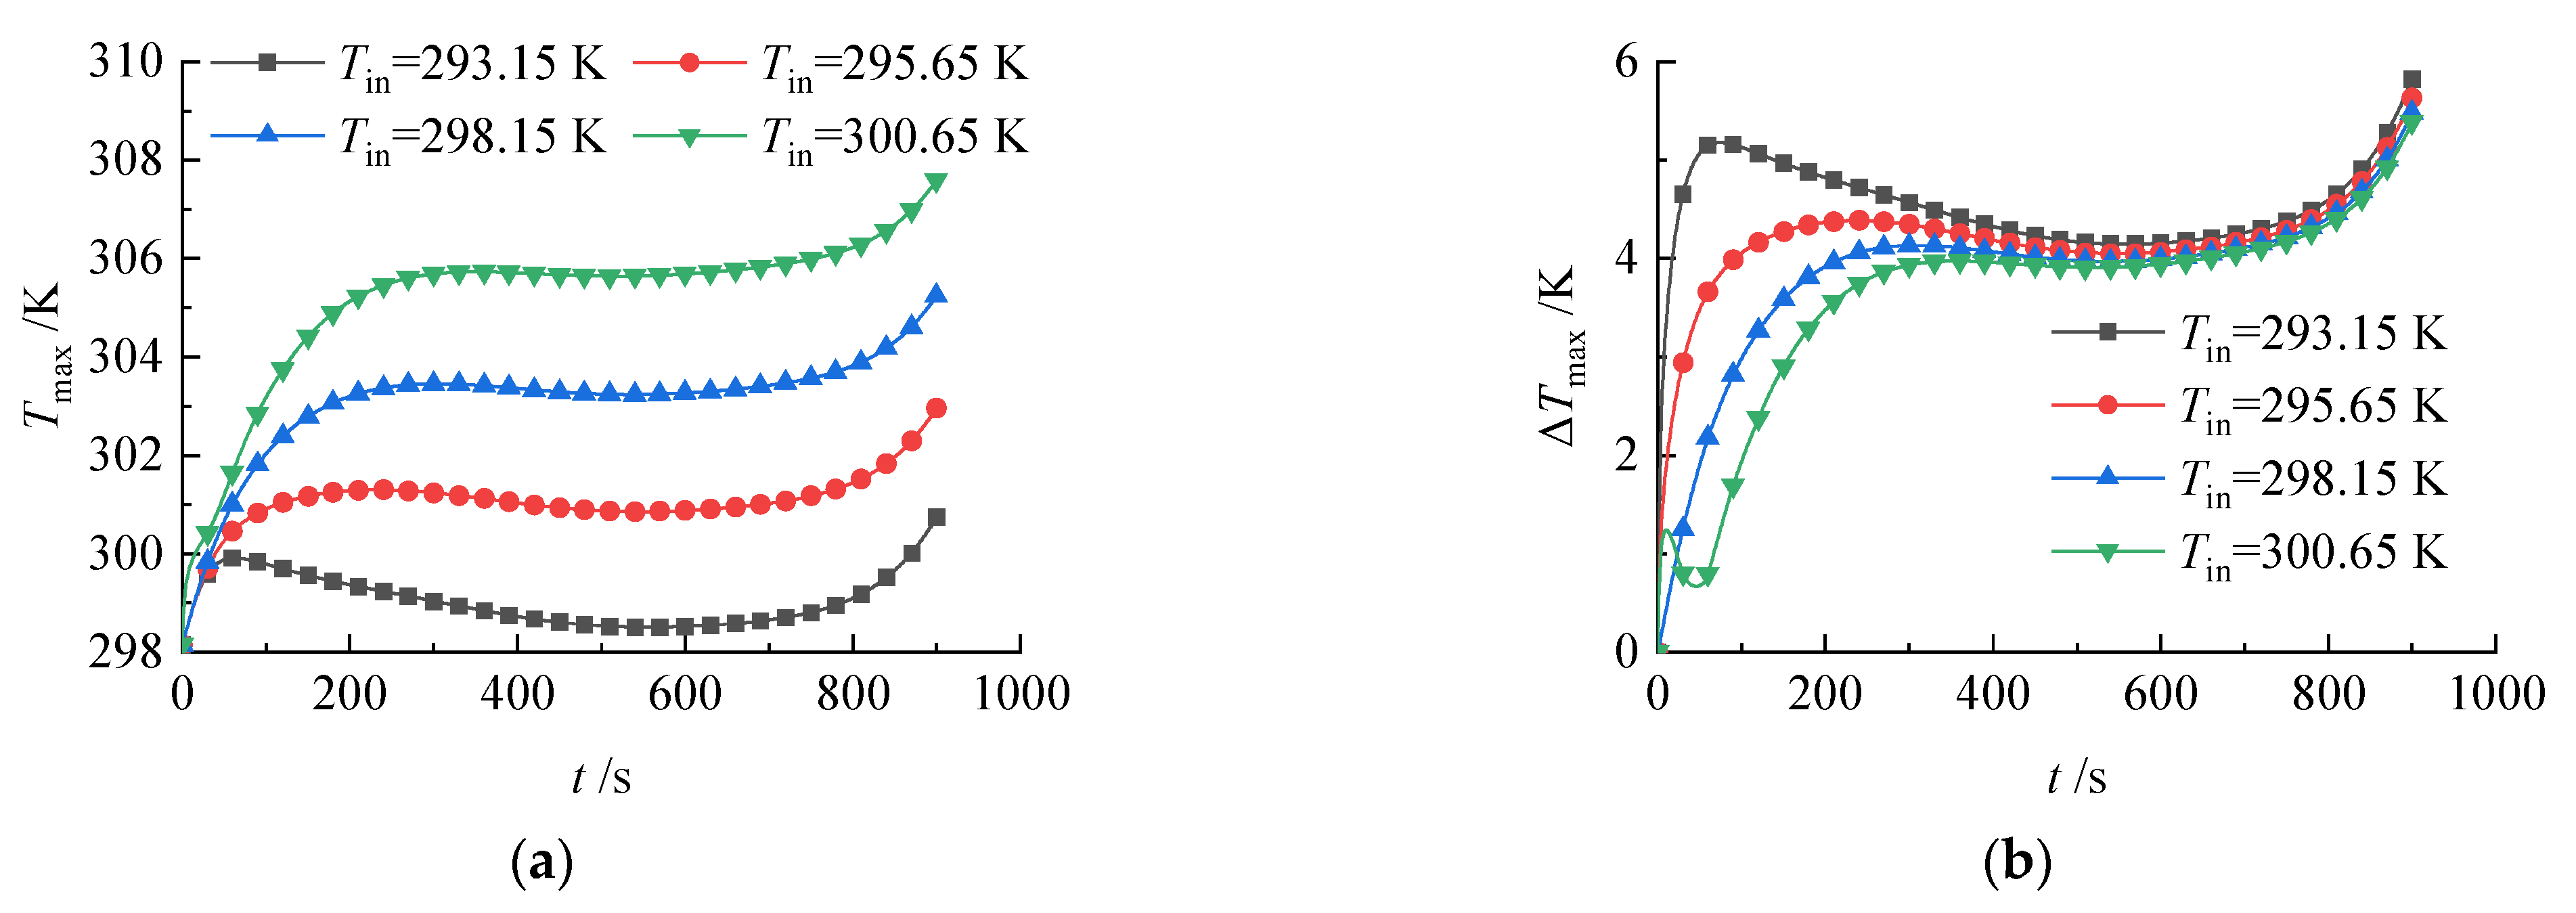
3.2.5. Effect of Coolant Inlet Temperature on Battery Temperature Distribution

The coolant inlet temperature also influenced the thermal management performance. Simulations were further conducted with inlet temperatures of 293.15 K, 295.65 K, 298.15 K, and 300.65 K, under the same operating conditions of ambient and coolant inlet temperatures at 298.15 K, flow velocity of 0.1 m/s, and 4C discharge.
The results demonstrate a positive correlation between battery temperature rise and coolant inlet temperature (Figure 18). Lower inlet temperatures enhanced heat transfer due to a larger temperature gradient between the fluid and solid domains, thereby reducing Tmax. For example, at an inlet temperature of 300.65 K, Tmax reached 310.01 K by the end of discharge, whereas at 293.15 K, Tmax initially peaked at 299.91 K before stabilizing and then rising rapidly due to increased internal resistance. Notably, higher inlet temperatures resulted in smaller ΔTmax values (5.38 K at 300.65 K vs. 5.82 K at 293.15 K). This suggests that while lower coolant temperatures help control Tmax, excessively low temperatures may exacerbate temperature non-uniformity, particularly during the initial discharge phase.

4. Conclusions

A numerical simulation study was conducted to investigate the thermal management performance of a hybrid system combining PCM and fin-enhanced liquid cooling for a 4 × 6 array of 18650 cylindrical lithium-ion batteries. The study included optimization analyses of cold plate arrangement, number of flow channels, coolant flow direction, velocity, and inlet temperature. The main findings are as follows:
(1)
Limited effectiveness of basic PCM–liquid cooling: During the 4C discharge process, when only side-mounted and bottom-mounted cold plates are added to the battery pack filled with phase change material (PCM), the maximum temperature of the battery pack decreases by merely 1.8 K. Concurrently, the temperature non-uniformity significantly intensifies, resulting in a maximum temperature difference exceeding 10 K within the battery pack.
(2)
Superior performance of fin-enhanced hybrid system: The aluminum heat dissipation fin dual cooling plates, with a thickness of 0.5 mm and spacing of 9 mm, optimize the heat transfer path through their design. This configuration reduces the maximum temperature to 305.58 K while lowering the maximum temperature difference to 5.99 K. Further optimized parameters, including alternating flow directions, four-channel cooling plates, and a flow velocity of 0.7 m/s, achieve greater performance enhancement, maintaining the maximum temperature difference below 5 K.
(3)
Diminishing returns at higher flow velocities: Increasing the flow rate enhances cooling efficiency up to 0.7 m/s. Beyond this, further increasing the coolant speed yields negligible improvements due to the inherent thermal conductivity limitations of the battery and PCM.
(4)
Trade-off in coolant temperature selection: While lower inlet temperatures reduced the maximum temperature among the batteries in the pack, excessively low temperatures could lead to higher temperature difference, particularly during early discharge stages. At an inlet temperature of 300.65 K, the maximum temperature is 310.01 K, and the maximum temperature difference is 5.38 K. In contrast, at an inlet temperature of 293.15 K, the maximum temperature is 299.91 K, and the maximum temperature difference is 5.82 K. Thus, a 7.5 K reduction in inlet temperature leads to a 10.1 K decrease in maximum temperature and a 0.44 K increase in maximum temperature difference.
The present study primarily focuses on the thermal dissipation performance of the battery pack, while further research should incorporate considerations such as electrical connections, specific energy density, and lifecycle cost.

Author Contributions

Conceptualization and supervision, B.W.; formal analysis, investigation and data curation, C.J.; methodology, software and validation, B.W., C.J. and S.Z.; writing—original draft preparation, C.J. and S.Z. All authors have read and agreed to the published version of the manuscript.

Funding

This research received no external funding.

Data Availability Statement

Data involved in this study are available from the authors under a reasonable request.

Conflicts of Interest

The authors declare no conflicts of interest.

References

  1. Aneke, M.; Wang, M. Energy storage technologies and real life applications—A state of the art review. Appl. Energy 2016, 179, 350–377. [Google Scholar] [CrossRef]
  2. Zhao, R.; Gu, J.; Liu, J. Performance assessment of a passive core cooling design for cylindrical lithium-ion batteries. Int. J. Energy Res. 2018, 42, 2728–2740. [Google Scholar] [CrossRef]
  3. Zhao, R.; Gu, J.; Liu, J. An experimental study of heat pipe thermal management system with wet cooling method for lithium ion batteries. J. Power Sources 2015, 273, 1089–1097. [Google Scholar] [CrossRef]
  4. Zhang, S.T. Degradation Law and Failure Mechanism of Li-Ion Batteries Under High Temperature Conditions. Master’s Thesis, Harbin University of Science and Technology, Harbin, China, 2023. [Google Scholar]
  5. Mei, W.; Chen, H.; Sun, J.; Wang, Q.S. Numerical study on tab dimension optimization of lithium-ion battery from the thermal safety perspective. Appl. Therm. Eng. 2018, 142, 148–165. [Google Scholar] [CrossRef]
  6. Wang, M.M.; Sun, L.; Guo, P.Y.; Guo, D.L.; Zhao, L.T.; Jin, Y. Overcharge and thermal runaway characteristics of lithium iron phosphate energy storage battery modules based on gas online monitoring. High Volt. Eng. 2021, 47, 279–286. [Google Scholar]
  7. Zhou, G.; Huang, Q.; Zhang, Q.; Niu, C.X.; Lu, H.H.; Yang, S.Q.; Liu, Y.; Wei, Z.K.; Li, S.L.; Kong, Y. Thermal insulation phase-change hydrogel with enhanced mechanical properties for inhibiting thermal runaway propagation in lithium-ion battery module. J. Energy Storage 2024, 102, 114102. [Google Scholar] [CrossRef]
  8. Sun, Z.Y.; Wang, Z.P.; Liu, P.; Zhang, Z.S.; Chen, Y.; Qu, C.H. Overview of fault diagnosis in new energy vehicle power battery system. J. Mech. Eng. 2021, 57, 87–104. [Google Scholar]
  9. Liu, B.J.; Wang, L.W.; Wu, Y.Y.; Liu, Y.C.; Zhong, G.B.; Xiang, H.F. Advances in thermal management of lithium-ion batteries. CIESC J. 2024, 75, 4413–4431. [Google Scholar]
  10. Wang, B.; Sun, C.C.; Wang, Y.L.; Chen, X.Y.; Zhou, Q.P. Thermal insulation and preheating performance of lithium battery based on phase change material. Chem. Eng. 2022, 50, 23–28. [Google Scholar]
  11. Zhu, X.Q.; Wang, Z.P.; Wang, H.; Wang, C. Review of thermal runaway and safety management for lithium-ion traction batteries in electric vehicles. J. Mech. Eng. 2020, 56, 91–118. [Google Scholar]
  12. Jin, Z.H.; Yuan, Q.; Han, Z.N.; Xue, F. Thermal management performance analysis of lithium battery with flat heat pipe and liquid cooling. Chem. Eng. 2023, 51, 41–45. [Google Scholar]
  13. Hendrayanto, A.P.; Fathoni, M.A.; Aliefiansyah, S.M.; Nandy, P. Experimental study on start-up and heat transfer characteristics in loop heat pipes with dual heat sources for battery thermal management system. Therm. Sci. Eng. Prog. 2024, 55, 102980. [Google Scholar] [CrossRef]
  14. Lin, T.; Liu, Q.Y.; Yang, G.; Han, F.Q. Study on thermal management circuit and temperature control effect of power batteries. Chin. J. Power Sources 2019, 43, 849–852. [Google Scholar]
  15. Wen, K.; Fu, X.F.; Pei, F. Research on the thermal management safety of the fast-charging power battery management system. Energy Rep. 2023, 10, 3289–3296. [Google Scholar] [CrossRef]
  16. Deng, J.; Li, Z.; Chen, J. Experiment study of pseudo-passive heat removal system for power battery thermal runaway propagation inhibition. Appl. Therm. Eng. 2024, 253, 123777. [Google Scholar] [CrossRef]
  17. Sun, Y.; Tao, L.R.; Lei, L.X.; Tao, H. Simulation analysis of thermal management system of parallel liquid cooled battery. Agric. Equip. Veh. Eng. 2021, 59, 19–24. [Google Scholar]
  18. Zhang, Z.; Li, Y. Experimental study of a passive thermal management system using copper foam-paraffin composite for lithium-ion batteries. Energy Procedia 2017, 142, 2403–2408. [Google Scholar] [CrossRef]
  19. Ye, Y.H.; Saw, L.H.; Shi, Y.; Tay, A.A.O. Numerical analyses on optimizing a heat pipe thermal management system for lithium-ion batteries during fast charging. Appl. Therm. Eng. 2015, 86, 281–291. [Google Scholar] [CrossRef]
  20. Zhang, W.C.; Liang, Z.C.; Yin, X.X.; Ling, G.Z. Avoiding thermal runaway propagation of lithium-ion battery modules by using hybrid phase change material and liquid cooling. Appl. Therm. Eng. 2021, 184, 116380. [Google Scholar] [CrossRef]
  21. Yang, W.; Zhou, F.; Liu, Y.C.; Xu, S.; Chen, X. Thermal performance of honeycomb-like battery thermal management system with bionic liquid mini-channel and phase change materials for cylindrical lithium-ion battery. Appl. Therm. Eng. 2021, 188, 116649. [Google Scholar] [CrossRef]
  22. Afaynou, I.; Faraji, H.; Choukairy, K.; Khallaki, K.; Akrour, D. Effectiveness of a PCM-based heat sink with partially filled metal foam for thermal management of electronics. Int. J. Heat Mass Transf. 2024, 235, 126196. [Google Scholar] [CrossRef]
  23. Chen, M.Y. Research on 18650 Lithium-Ion Battery Compound Thermal Management System Based on Direct Liquid Cooling-Air Cooling. Master’s Thesis, Jiangsu University of Technology, Changzhou, China, 2022. [Google Scholar]
  24. Chen, H.F. Performance and Structural Optimization of Low-Temperature Thermal Management System for Lithium-Ion Batteries Based on Composite Phase Change Materials. Master’s Thesis, Lanzhou University of Technology, Lanzhou, China, 2023. [Google Scholar]
  25. Chen, C. Research on Heat Dissipation and Optimization Design of Square Power Lithium Battery for New Energy Vehicle. Master’s Thesis, Shanghai Institute of Technology, Shanghai, China, 2020. [Google Scholar]
Figure 1. Battery thermal management system integrating phase change material with conventional liquid cooling: (a) lateral coolant plate deployment; (b) underpack cooling module.
Energies 18 02406 g001
Figure 2. Battery thermal management system combining phase change material with fin-enhanced liquid cooling: (a) 3D structure; (b) top view.
Energies 18 02406 g002
Figure 3. Variation of battery internal resistance with SOC under different temperatures.
Energies 18 02406 g003
Figure 4. Mesh independence verification: (a) mesh model, (b) effect of mesh count on the maximum temperature of the battery pack.
Energies 18 02406 g004
Figure 5. Comparison of simulated and experimental average surface temperatures of lithium-ion batteries at different discharge rates.
Energies 18 02406 g005
Figure 6. Influence of cold plate arrangement on (a) maximum battery temperature and (b) maximum battery temperature difference.
Energies 18 02406 g006
Figure 7. Temperature distribution under different cold plate configurations: (a) side-mounted plate, (b) bottom-mounted plate, (c) no cold plate.
Energies 18 02406 g007
Figure 8. Schematic diagram of fins with different spacings (a) 9 mm, (b) 12 mm, (c) 15 mm.
Energies 18 02406 g008
Figure 9. Influence of fin spacing on battery pack temperature variation (a) maximum battery temperature and (b) maximum battery temperature difference.
Energies 18 02406 g009
Figure 10. Structural schematic of fins with different thicknesses (a) 0.5 mm, (b) 0.75 mm, (c) 1.0 mm.
Energies 18 02406 g010
Figure 11. Influence of fin thickness on battery pack temperature variation (a) maximum battery temperature and (b) maximum battery temperature difference.
Energies 18 02406 g011
Figure 12. Cross-sectional views of cold plate configurations with varying channel quantities: (a) 1, (b) 2, (c) 4, and (d) 8 cooling channels (all channels maintain 2 mm height and 1 mm wall thickness).
Energies 18 02406 g012
Figure 13. Influence of channel quantity on (a) maximum battery temperature and (b) maximum battery temperature difference.
Energies 18 02406 g013
Figure 14. Temperature distributions of battery packs with (a) 1, (b) 2, (c) 4, and (d) 8 cooling channels.
Energies 18 02406 g014
Figure 15. Schematic of the cold plate flow channel structure.
Energies 18 02406 g015
Figure 16. Effect of flow direction on battery temperature distribution.
Energies 18 02406 g016
Figure 17. Influence of coolant flow velocity on (a) maximum battery temperature and (b) maximum battery temperature difference.
Energies 18 02406 g017
Figure 18. Influence of coolant inlet temperature on (a) maximum battery temperature and (b) maximum battery temperature difference.
Energies 18 02406 g018
Table 1. Thermal properties of 18650 battery [23].
ρb/(kg·m)−3Cp, b/(J kg−1·K−1)λa, b/(W·m−1·K−1)λr, b/(W·m−1·K−1)
2673.551034.1820.190.87
Table 2. Thermal properties of phase change material [24].
ρpcm/(kg·m)−3Cp, pcm/(J kg−1·K−1)Lpcm/(J·kg−1)Tom, pcm/Kλpcm/(W·m−1·K−1)
8142150182200308.150.33
Table 3. Physical properties of phase change material.
T/°Cζ1ζ2ζ3ζ4ζ5ζ6ζ7
05.764−20.74029.810−21.8508.616−1.7340.209
272.608−8.61411.180−7.2992.578−0.4930.086
402.799−9.07611.560−7.3892.525−0.4580.079
Table 4. Coolant flow direction configurations.
Channel No.Case 1Case 2Case 3Case 4Case 5Case 6
(1)InletOutletOutletOutletOutletInlet
(2)InletOutletOutletOutletInletOutlet
(3)InletOutletInletInletOutletInlet
(4)InletOutletInletInletInletOutlet
(5)InletInletInletOutletOutletOutlet
(6)InletInletInletOutletInletInlet
(7)InletInletOutletInletOutletOutlet
(8)InletInletOutletInletInletInlet
Disclaimer/Publisher’s Note: The statements, opinions and data contained in all publications are solely those of the individual author(s) and contributor(s) and not of MDPI and/or the editor(s). MDPI and/or the editor(s) disclaim responsibility for any injury to people or property resulting from any ideas, methods, instructions or products referred to in the content.

