
A Synergistic Planning Framework for Low-Carbon Power Systems: Integrating Coal-Fired Power Plant Retrofitting with a Carbon and Green Certificate Market Coupling Mechanism

Abstract
1. Introduction
- Considering that CFPPs are major contributors to carbon emissions in power systems, retrofitting strategies for CFPPs are incorporated into the low-carbon planning framework to reduce system carbon emissions while maintaining stability and economic efficiency.
- To further reduce system carbon emissions and improve the utilization of renewable energy resources, a carbon–green certificate market coupling mechanism is considered within the planning framework.
- A multi-stage planning model is proposed, which considers both CFPP retrofitting and the carbon–green certificate market coupling mechanism. This model facilitates dynamic decision-making regarding the retrofitting of CFPPs and investment in new energy and energy storage systems.
2. Coal-Fired Power Plant Retrofitting Strategies and Carbon–Green Certificate Market Coupling Mechanism
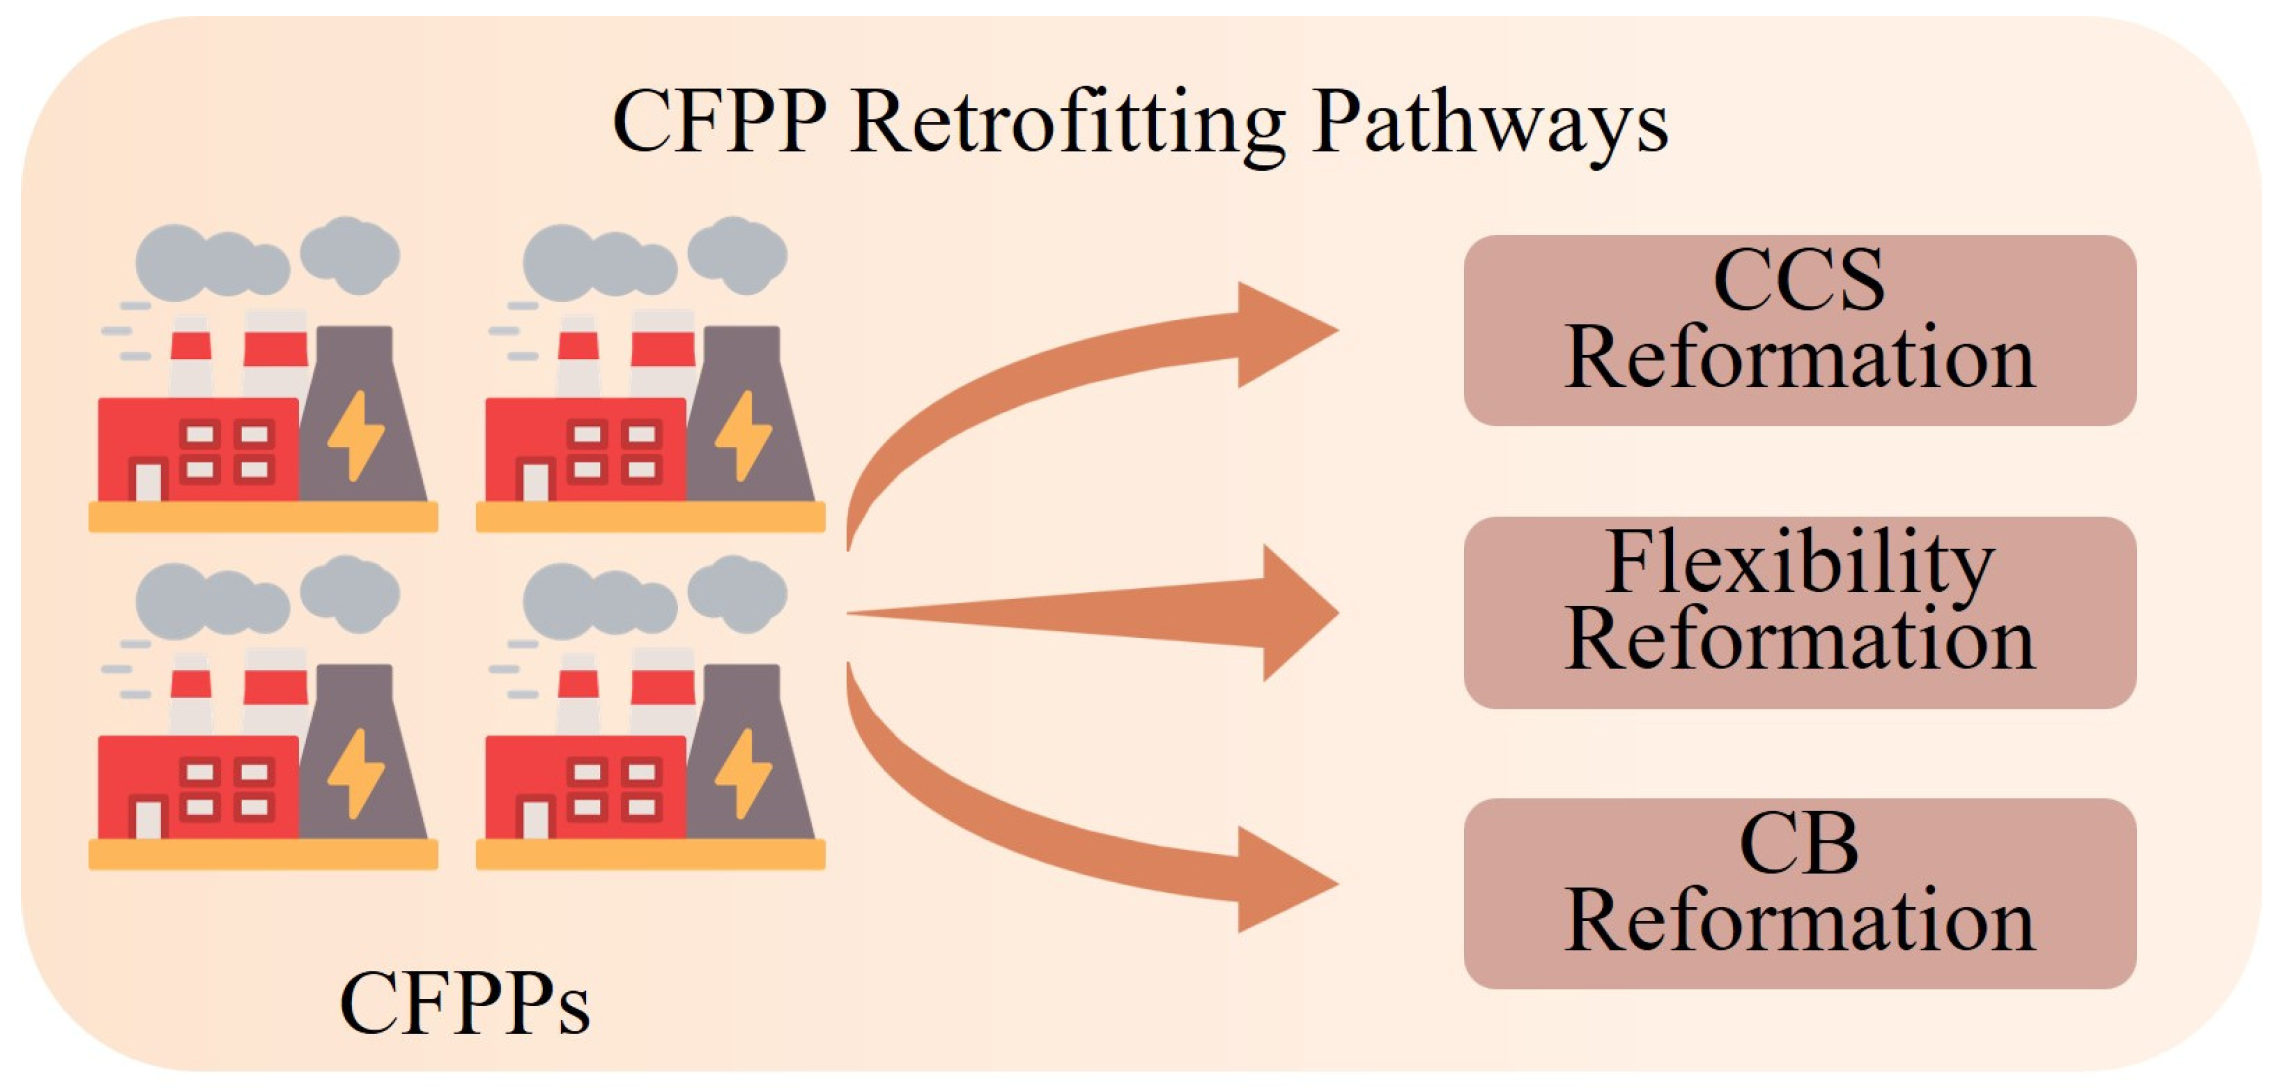
2.1. Coal-Fired Power Plant Retrofitting Strategies
2.1.1. CCS Retrofitting
2.1.2. Flexibility Retrofitting
2.1.3. CB Retrofitting
2.2. Carbon–Green Certificate Market Coupling Mechanism
2.2.1. Carbon Emission Trading Market
2.2.2. Green Certificate Trading Market
2.2.3. Carbon–Green Certificate Market Coupling
3. Low-Carbon Power System Planning Model with Coordinated Carbon–Green Certificate Market Coupling Mechanism and Coal-Fired Power Plant Retrofitting
3.1. Objective Function
3.2. Constraints
3.2.1. Investment Constraints
3.2.2. Operational Constraints
- (1)
- CFPP operation constraints
- (2)
- Renewable energy resources operation constraints
- (3)
- Energy storage system operation constraints
- (4)
- Power balance constraints
3.3. Abstract Expression
3.4. Collaborative Planning Model Considering Uncertainties of Renewable Energy Sources
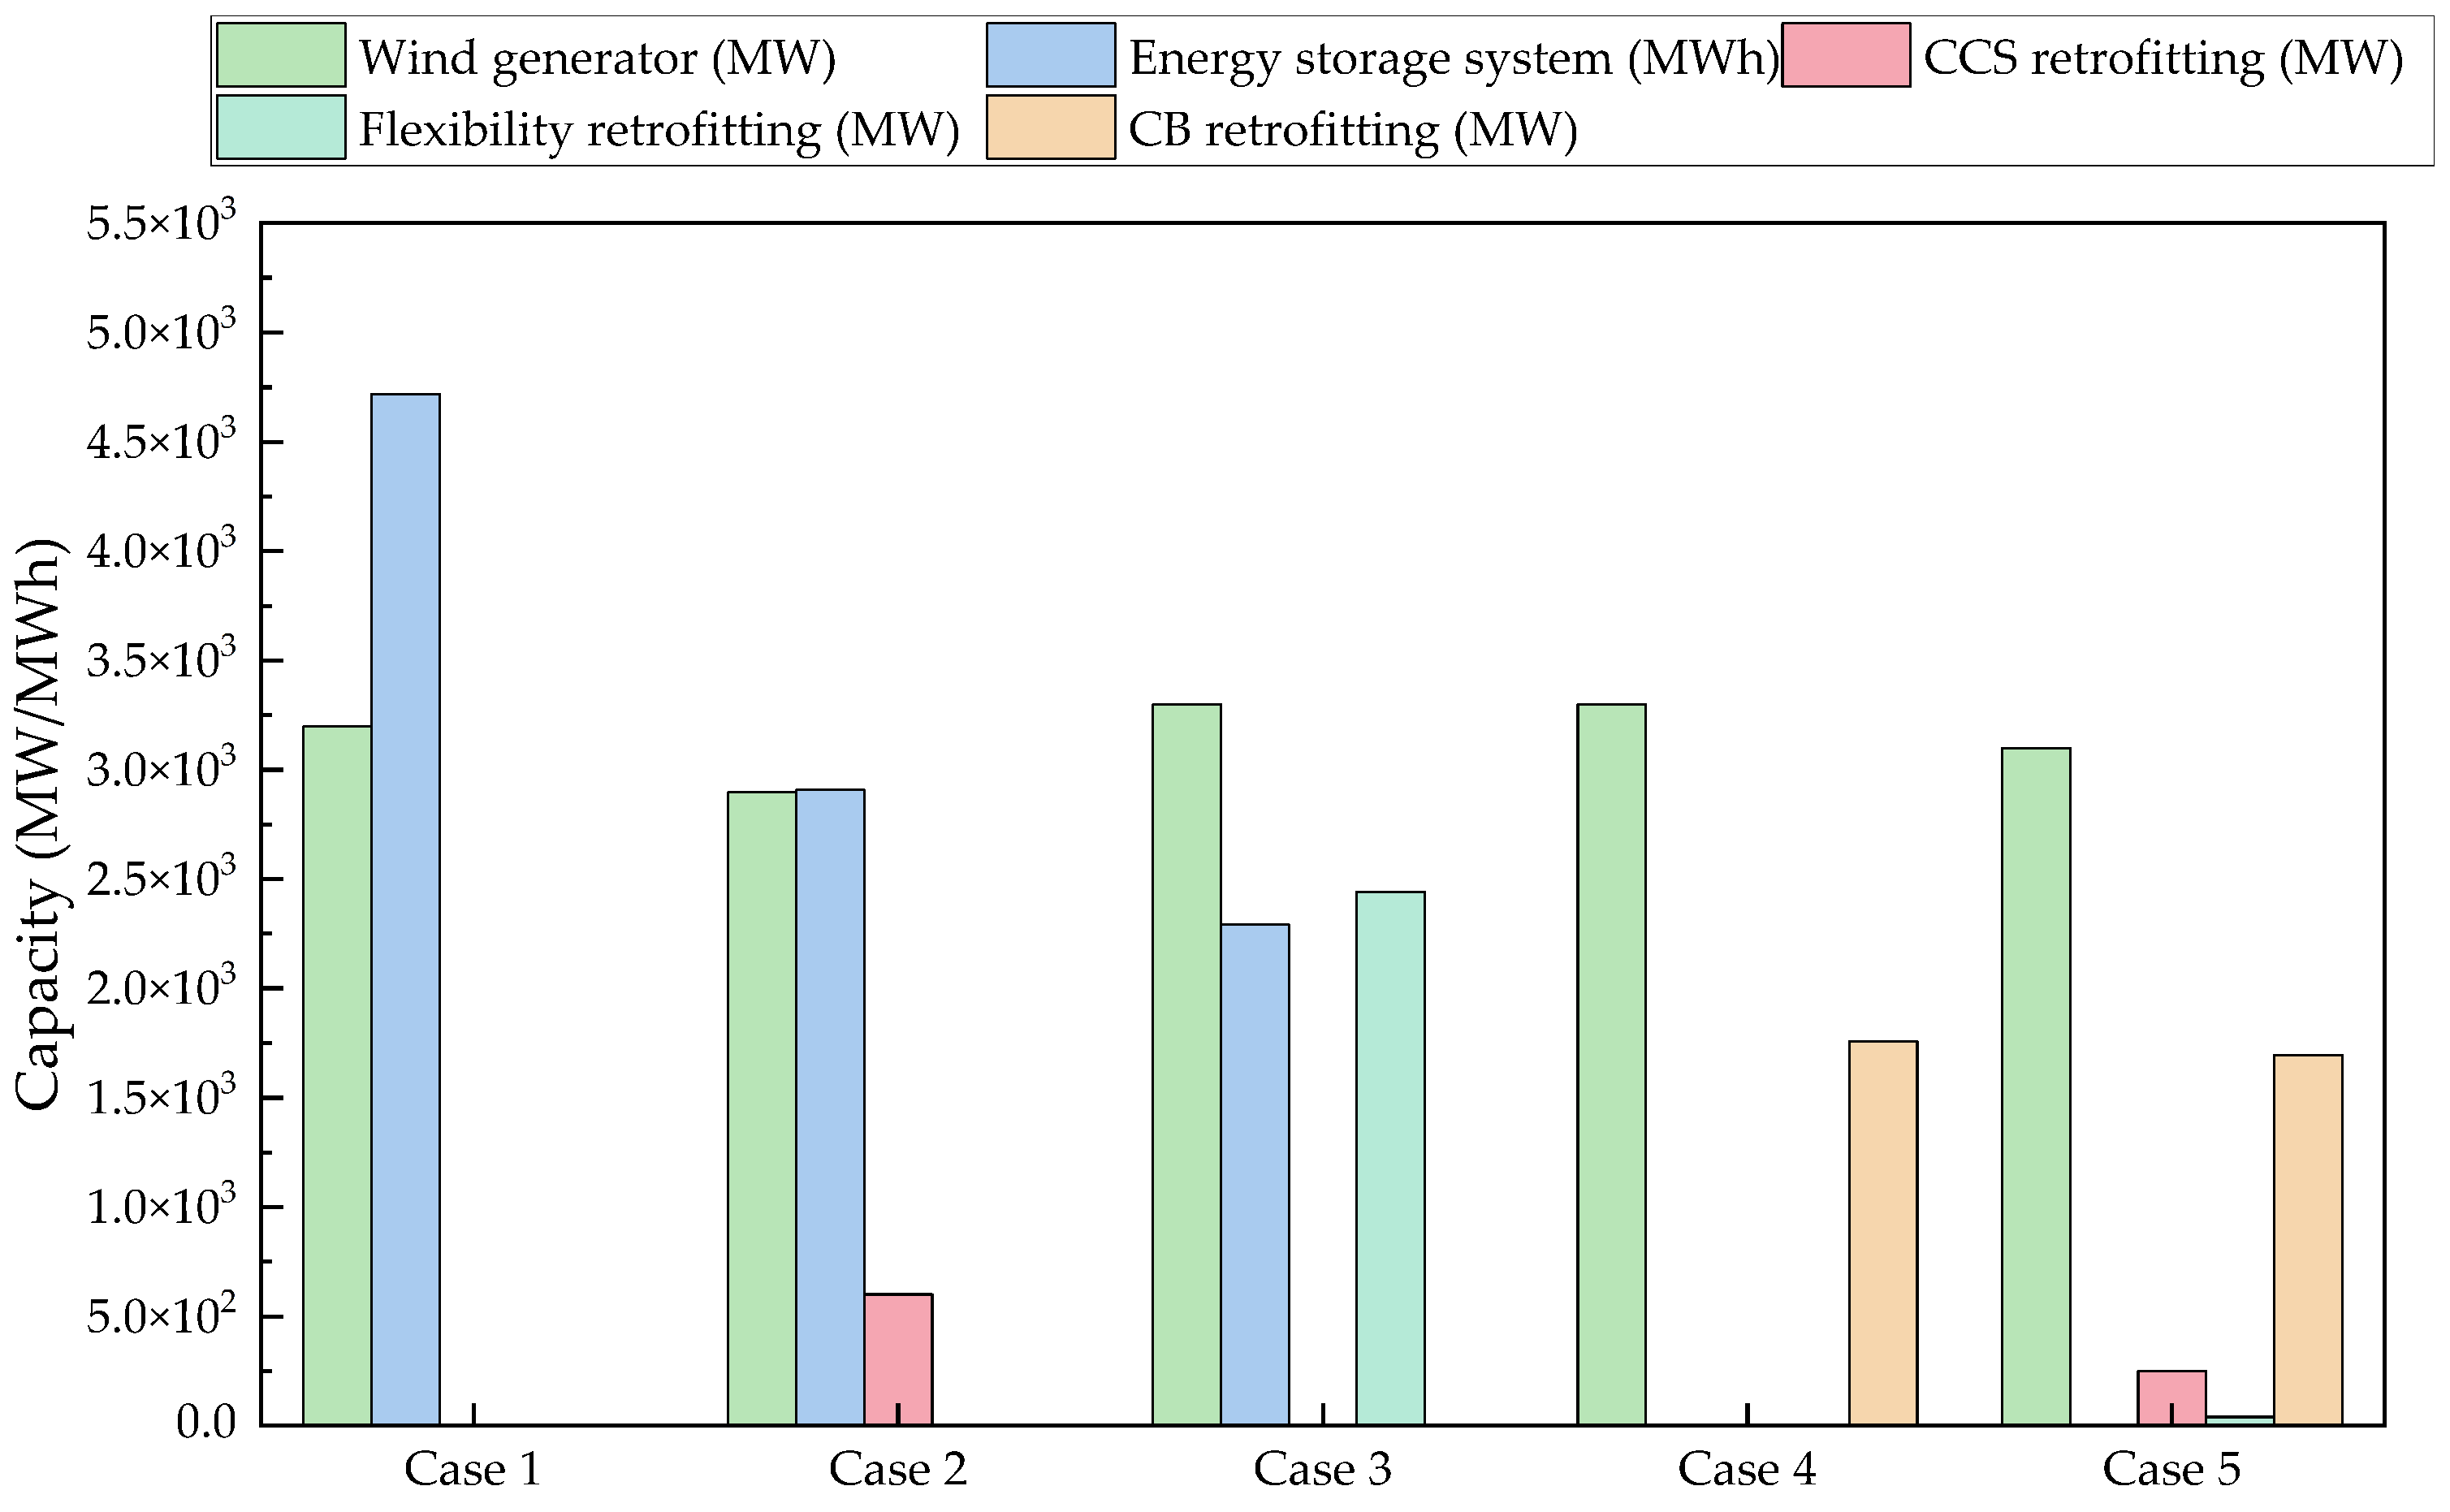
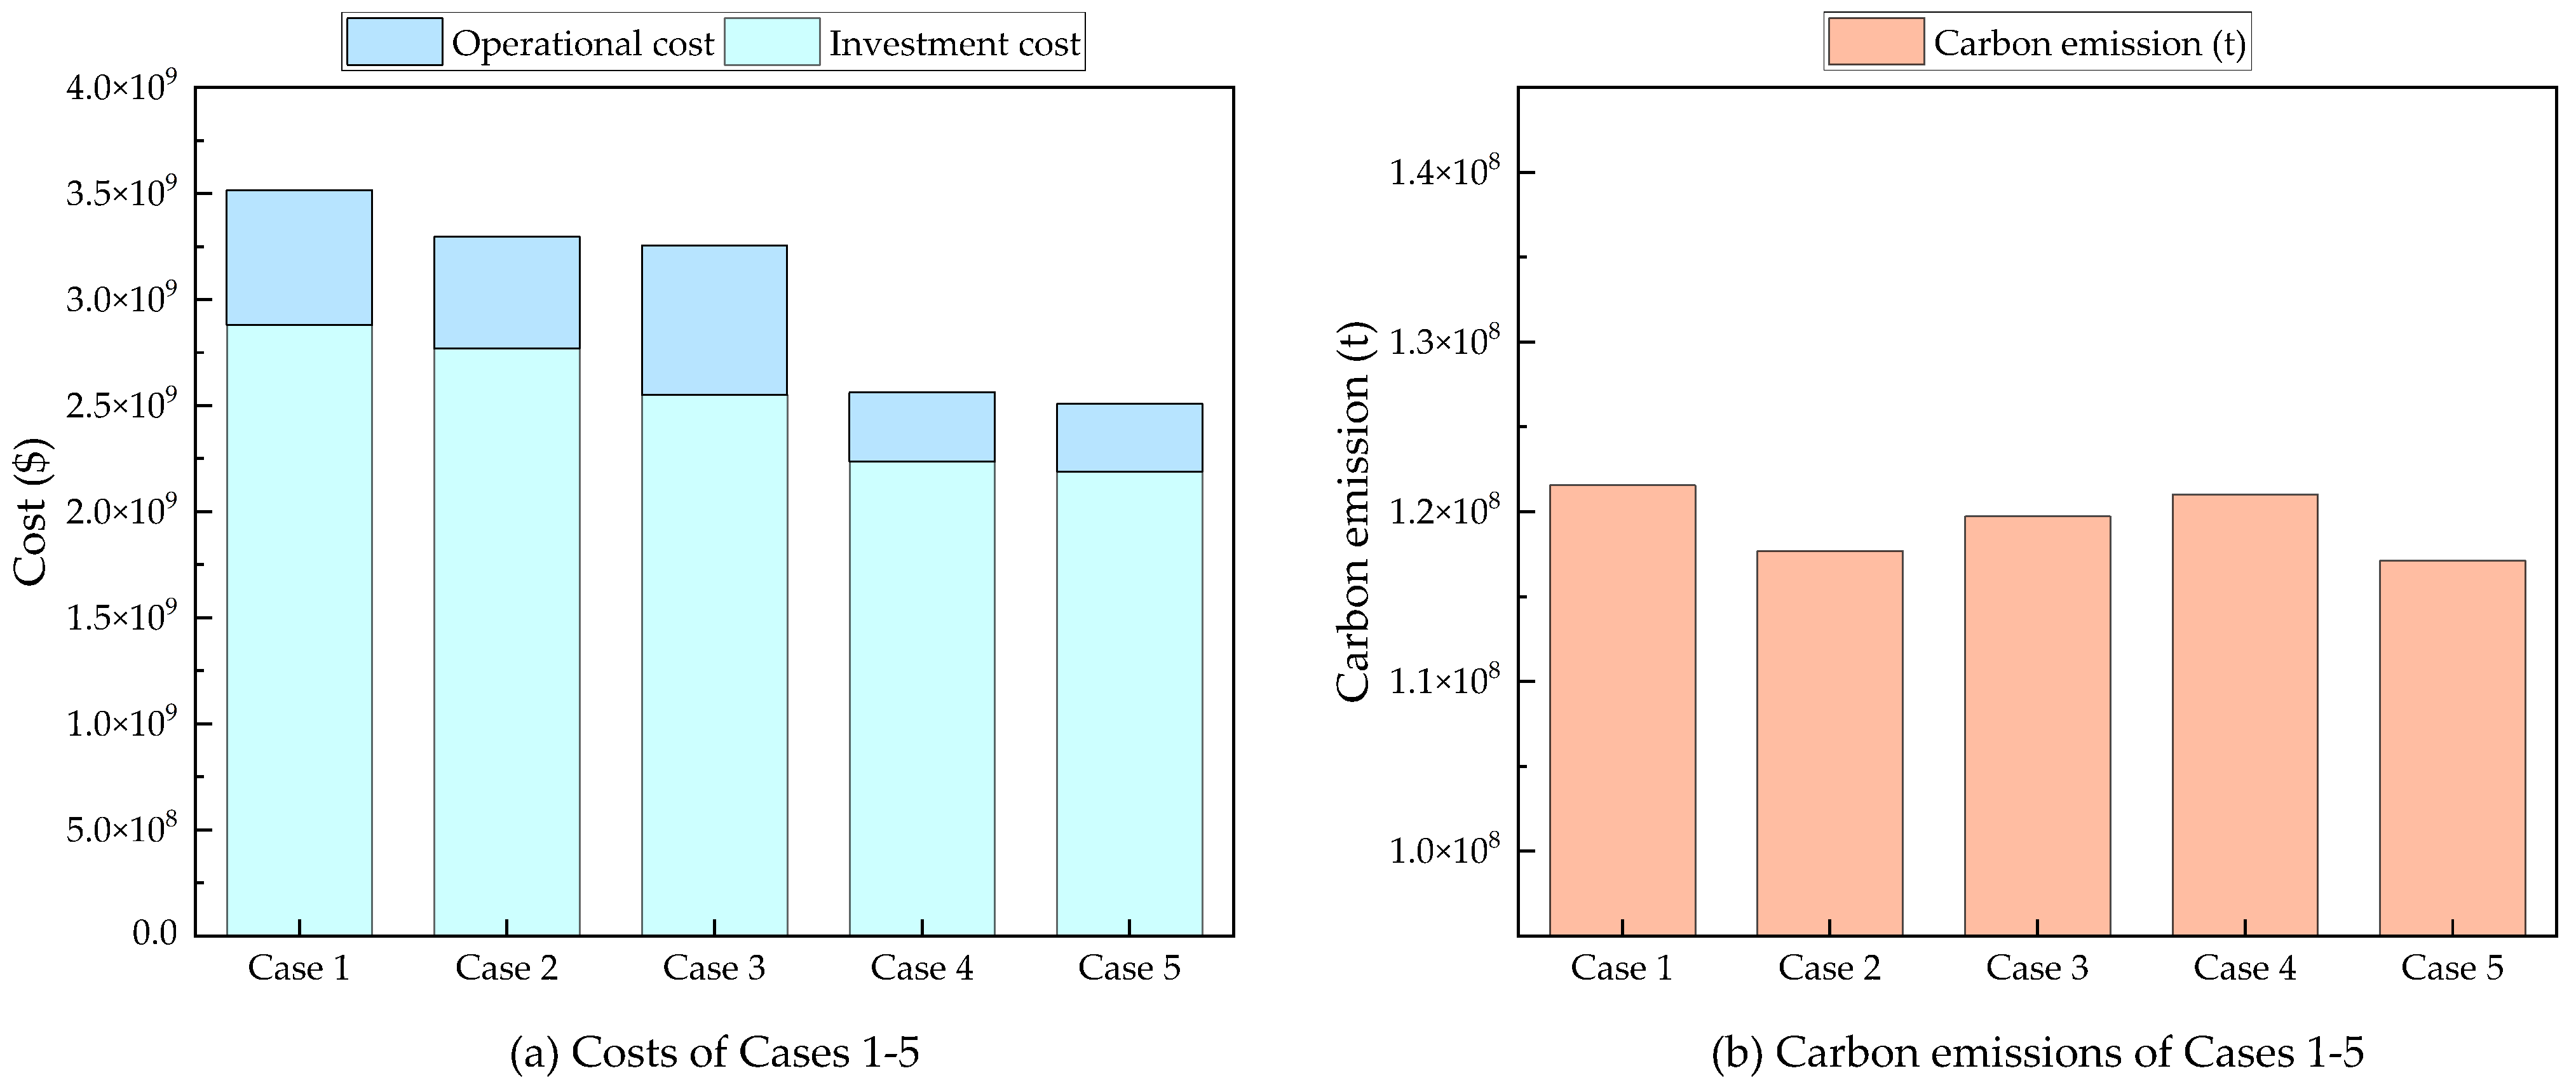
4. Case Studies
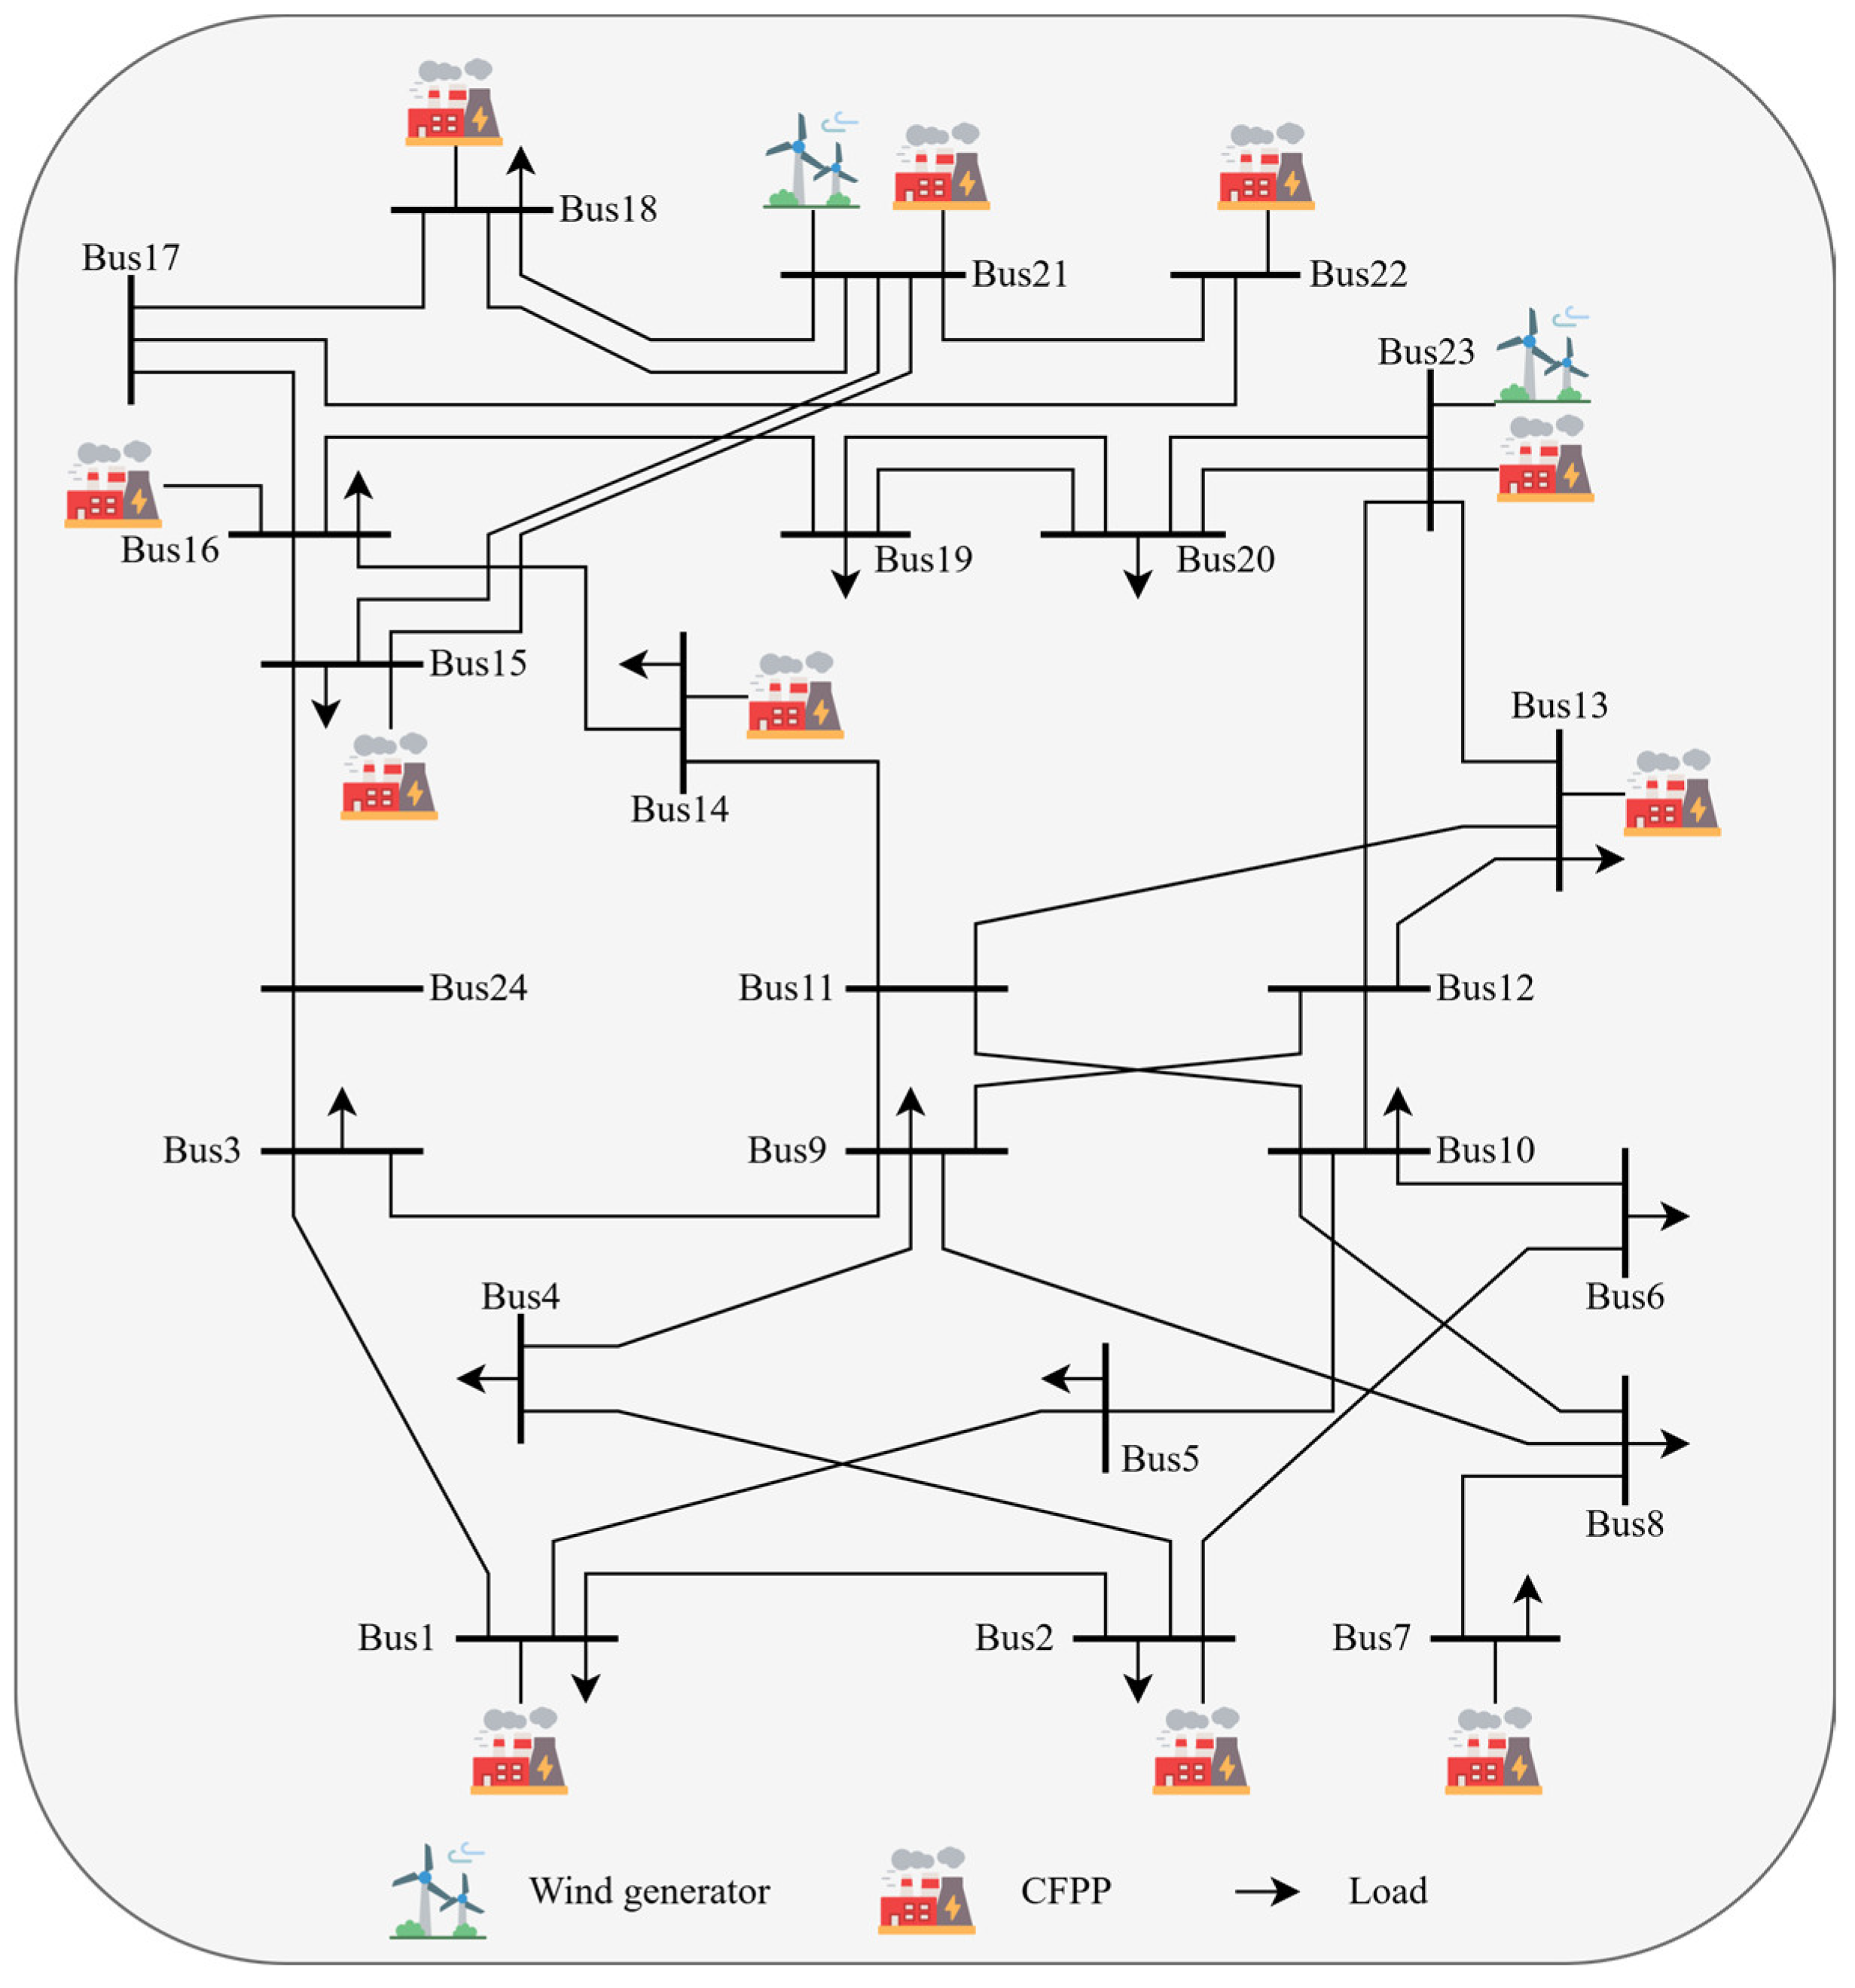
4.1. IEEE RTS 24-Bus Test System
4.2. IEEE 118-Bus System
5. Discussion
6. Conclusions
Author Contributions
Funding
Data Availability Statement
Conflicts of Interest
Abbreviations and Nomenclature
| Abbreviations | |
| CB | Carnot battery |
| CCS | Carbon capture and storage |
| CET | Carbon emission trading |
| CFPP | Coal-fired power plant |
| GCT | Green certificate trading |
| TES | Thermal energy storage |
| Variables | |
| Transaction costs within the carbon market within stage | |
| Retrofitting costs for CB within stage | |
| Retrofitting costs for CCS within stage | |
| Operational expenses of CFPPs within stage | |
| Retrofitting expenses for CFPPs within stage | |
| Investment costs for energy storage systems within stage | |
| Retrofitting costs for flexibility enhancement within stage | |
| Trading costs of green certificates within stage | |
| Penalty costs for load shedding within stage | |
| Penalty costs for curtailment of renewable energy resources within stage | |
| Investment costs associated with renewable energy sources within stage | |
| Stored energy of energy storage system at time in stage | |
| Actual carbon emission trading volume within stage | |
| Carbon emission trading rights after offsetting within stage | |
| CCS amount at time within stage for CFPP | |
| Upper limit of CCS amount at time within stage for CFPP | |
| Carbon emissions at time within stage for CFPP | |
| Actual carbon emissions at time within stage for CFPP | |
| Carbon emission trading rights offset by green certificates in stage | |
| Actual number of green certificate transaction within stage | |
| Number of green certificates remaining after offsetting within stage | |
| Number of green certificates used to offset carbon emission trading rights within stage | |
| Charging/discharging power of CB at time within stage | |
| Power consumption of CCS equipment at time within stage for CFPP | |
| Power output of CFPP at time within stage | |
| Discharge/charge power of energy storage system at time in stage | |
| Load power at node at time within stage | |
| Load shedding at node at time within stage | |
| Net power output of CFPP at time within stage | |
| Output of renewable energy unit at time during stage | |
| TES level of CB at time within stage | |
| Charging/discharging thermal energy of CB at time within stage | |
| Charging/discharging state of CB at time within stage | |
| On/off status of CFPP at time within stage | |
| Discharge/charge states of energy storage system at time in stage | |
| Continuous operational/downtime durations of CB at time within stage | |
| Continuous operational/downtime duration of CFPP at time within stage | |
| CB retrofitting state of CB within stage | |
| Retrofitting status of CFPP during stage | |
| deployment status of energy storage within stage | |
| Flexibility modification status of CFPP during stage | |
| Deployment status of renewable energy resources within stage | |
| Constants and Sets | |
| Unit carbon trading price | |
| Unit retrofitting costs for CCS | |
| Unit investment costs for electric heating devices | |
| Unit investment costs for energy storage | |
| Unit retrofitting costs for flexibility enhancement | |
| Fuel price of CFPP | |
| Unit green certificate price | |
| Unit penalty cost for load shedding | |
| Unit investment costs for renewable energy resources | |
| Unit penalty cost for curtailment of renewable energy | |
| Unit investment costs for thermal-to-electric conversion devices | |
| Unit investment costs for TES | |
| Rated capacity of energy storage system | |
| Heat rate curve of CFPP | |
| Carbon allowance within stage | |
| Green certificate quota within stage | |
| Set of time periods | |
| Lower/upper bounds of discharging power for CB | |
| Fixed power consumption of CCS equipment for CFPP | |
| Lower/upper power output limit for CFPP | |
| Minimum power output of CFPP following flexibility retrofits | |
| Rated capacity of electrical heating device for CB | |
| Upper limit of discharge and charge power of energy storage system | |
| Rated capacity of CFPP | |
| Predicted output of renewable energy resource at time within stage | |
| Rated capacity of renewable energy resources | |
| Lower/upper bound of TES for CB | |
| Ramp rate for charging/discharging of CB | |
| Minimum startup/shutdown time for CB | |
| Minimum startup/shutdown time for CFPP | |
| Ramp-up/ramp-down rate for CFPP | |
| Ramp-up/ramp-down rate for CFPP subsequent to flexibility retrofits. | |
| Unit power consumption of CCS equipment | |
| CCS rate of CFPP | |
| Carbon emission rate of CFPP | |
| Present value factor within stage | |
| Electrical-to-thermal/thermal-to-electrical efficiency of CB ; | |
| Charging/discharging efficiency of CB | |
| Discharge/charge efficiencies of energy storage system | |
| Initial capacity coefficient of energy storage system | |
| Upper/lower limit coefficients of energy storage system’s capacity | |
| Time interval | |
| Responsibility weight for renewable energy consumption | |
| Carbon emission baseline value | |
| Conversion coefficient for offsetting carbon emission trading rights with green certificates | |
| Discount rate | |
| Set of CFPPs | |
| Set of energy storage systems to be deployed | |
| Set of loads | |
| Set of renewable energy installations | |
References
- IEA. Global Energy Review. 2025. Available online: https://www.iea.org/events/global-energy-review-2025 (accessed on 22 March 2025).
- Luo, S.; Hu, W.; Liu, W.; Zhang, Z.; Bai, C.; Huang, Q.; Chen, Z. Study on the decarbonization in China’s power sector under the background of carbon neutrality by 2060. Renew. Sustain. Energy Rev. 2022, 166, 112618. [Google Scholar] [CrossRef]
- Guo, J.; Wang, T.; Luo, K.; Qin, X.H.; Jing, Y.R.; Zhao, B.; Ma, S.C. Development of New Power Systems: Challenges and Solutions. New Type Power Syst. 2023, 1, 32–43. [Google Scholar]
- Xin, B.; Shan, B.; Li, Q.; Yan, H.; Wang, C. Rethinking of the “Three Elements of Energy” Toward Carbon Peak and Carbon Neutrality. Proc. CSEE 2022, 42, 3117–3125. [Google Scholar]
- Shu, Y.; Zhang, Z.; Tang, Y. Fundamental Issues of New-type Power System Construction. Proc. CSEE 2024, 44, 8327–8340. [Google Scholar]
- Xiang, Y.; Guo, Y.; Wu, G.; Liu, J.; Sun, W.; Lei, Y.; Zeng, P. Low-carbon economic planning of integrated electricity-gas energy systems. Energy 2022, 249, 123755. [Google Scholar] [CrossRef]
- Zhang, Z.; Zhou, M.; Yuan, B.; Guo, Z.; Wu, Z.; Li, G. Multipath retrofit planning approach for coal-fired power plants in low-carbon power system transitions: Shanxi Province case in China. Energy 2023, 275, 127502. [Google Scholar]
- Yong, Q.; Tian, Y.; Qian, X.; Li, X. Retrofitting coal-fired power plants for grid energy storage by coupling with thermal energy storage. Appl. Therm. Eng. 2022, 215, 119048. [Google Scholar] [CrossRef]
- Ban, M.; Sun, Y.; Chen, Q.; Liu, Y.; Jiang, H.; Song, W.; Xia, S.; Song, M.; Liu, H.; Bai, W.; et al. Coordination of maintenance and multi-technical flexibility retrofits for coal-fired power plants. IEEE Trans. Ind. Appl. 2024, 60, 4946–4957. [Google Scholar] [CrossRef]
- Janicka, J.; Debiagi, P.; Scholtissek, A.; Dreizler, A.; Epple, B.; Pawellek, R.; Maltsev, A.; Hasse, C. The potential of retrofitting existing coal power plants: A case study for operation with green iron. Appl. Energy 2023, 339, 120950. [Google Scholar] [CrossRef]
- Li, J.; Zhang, C.; Davidson, M.R.; Lu, X. Assessing the synergies of flexibly-operated carbon capture power plants with variable renewable energy in large-scale power systems. Appl. Energy 2025, 377, 124459. [Google Scholar] [CrossRef]
- Xuan, A.; Shen, X.; Guo, Q.; Sun, H. Two-stage planning for electricity-gas coupled integrated energy system with carbon capture, utilization, and storage considering carbon tax and price uncertainties. IEEE Trans. Power Syst. 2022, 38, 2553–2565. [Google Scholar] [CrossRef]
- Okazaki, T.; Shirai, Y.; Nakamura, T. Concept study of wind power utilizing direct thermal energy conversion and thermal energy storage. Renew. Energy 2015, 83, 332–338. [Google Scholar] [CrossRef]
- Wang, H.N.; Xue, X.J.; Zhao, C.Y. Performance analysis on combined energy supply system based on Carnot battery with packed-bed thermal energy storage. Renew. Energy 2024, 228, 120702. [Google Scholar] [CrossRef]
- Zhang, Z.; Zhou, M.; Yuan, B.; Wu, Z.; Liu, J.; Liu, S.; Guo, Z.; Li, G. Decarbonizing the power system by co-planning coal-fired power plant transformation and energy storage. J. Energy Storage 2023, 66, 107442. [Google Scholar] [CrossRef]
- Yang, X.; Meng, L.; Gao, X.; Ma, W.; Fan, L.; Yang, Y. Low-carbon economic scheduling strategy for active distribution network considering carbon emissions trading and source-load side uncertainty. Electr. Power Syst. Res. 2023, 223, 109672. [Google Scholar] [CrossRef]
- Dong, H.; Yun, Y.; Ma, Z.; Wang, D. Low-carbon optimal operation of integrated energy system considering multi-energy conversion and concentrating solar power plant participation. Power Syst. Technol. 2020, 44, 3689–3700. [Google Scholar]
- Zeng, L.; Wang, J.; Zhao, L. An inter-provincial tradable green certificate futures trading model under renewable portfolio standard policy. Energy 2022, 257, 124772. [Google Scholar] [CrossRef]
- Zhou, D.; Dong, Z.; Sang, X.; Wang, Q.; Yu, X. Do feed-in tariff reduction and green certificate trading effectively promote regional sustainable development? Energy 2023, 283, 129042. [Google Scholar] [CrossRef]
- Yang, J.; Lei, L.; Liu, D.; Luo, W. A distributed dispatch approach for district-level electric-heat-gas integrated energy systems considering carbon emission and green certificate trading. Electr. Power Syst. Res. 2025, 244, 111541. [Google Scholar] [CrossRef]
- Zhang, L.; Xiang, Z.; Yu, P.; Xu, Z.; Xu, J.; Zhu, Z. Dynamic Environmental Economic Dispatch of Power System with Wind Farm Based on Green Certificate Transaction Mechanisms. Smart Power 2021, 49, 75–82. [Google Scholar]
- Wang, X.; Chen, H.; Tong, X.; Gao, Y.; Pan, P.; Liu, W. Optimal scheduling of a multi-energy complementary system simultaneously considering the trading of carbon emission and green certificate. Energy 2024, 310, 133212. [Google Scholar] [CrossRef]
- Yu, X.; Dong, Z.; Zhou, D.; Sang, X.; Chang, C.T.; Huang, X. Integration of tradable green certificates trading and carbon emissions trading: How will Chinese power industry do? J. Clean. Prod. 2021, 279, 123485. [Google Scholar] [CrossRef]
- Liu, D.; Luo, Z.; Qin, J.; Wang, H.; Wang, G.; Li, Z.; Zhao, W.; Shen, X. Low-carbon dispatch of multi-district integrated energy systems considering carbon emission trading and green certificate trading. Renew. Energy 2023, 218, 119312. [Google Scholar] [CrossRef]
- Yin, Y.; He, C.; Liu, T.; Wu, L. Risk-averse stochastic midterm scheduling of thermal-hydro-wind system: A network-constrained clustered unit commitment approach. IEEE Trans. Sustain. Energy 2022, 13, 1293–1304. [Google Scholar] [CrossRef]
- Mutlu, S.; Şenyiğit, E. Literature review of transmission expansion planning problem test systems: Detailed analysis of IEEE-24. Electr. Power Syst. Res. 2021, 201, 107543. [Google Scholar] [CrossRef]
- Wang, Y.; Qiu, J.; Tao, Y.; Zhao, J. Carbon-oriented operational planning in coupled electricity and emission trading markets. IEEE Trans. Power Syst. 2020, 35, 3145–3157. [Google Scholar] [CrossRef]
- Tao, Y.; Qiu, J.; Lai, S.; Zhao, J.; Xue, Y. Carbon-oriented electricity network planning and transformation. IEEE Trans. Power Syst. 2020, 36, 1034–1048. [Google Scholar] [CrossRef]
- Chen, B.; Liu, T.; Liu, X.; He, C.; Nan, L.; Wu, L.; Su, X.; Zhang, J. A Wasserstein distance-based distributionally robust chance-constrained clustered generation expansion planning considering flexible resource investments. IEEE Trans. Power Syst. 2022, 38, 5635–5647. [Google Scholar] [CrossRef]


| Parameters | Value | Parameters | Value |
|---|---|---|---|
| 607,730 $/MW | 100,000 $/MW | ||
| 155,000 $/MW | 90% | ||
| 50,000 $/MW | 0.269 MWh/t | ||
| 30,000 $/MW | 1.08 t/MWh |
| Parameters | Value | Parameters | Value |
|---|---|---|---|
| 1,097,900 $/MW | 0.9 | ||
| 300,000 $/MW | 0.4 | ||
| 1 MWh | 0.9 | ||
| 0.2 MW | 0.1 |
| Case | Total Cost | Carbon Emissions | Installed Capacity | |||
|---|---|---|---|---|---|---|
| Wind Generator | CCS Retrofitting | Flexibility Retrofitting | CB Retrofitting | |||
| Case 8 | 2182 M$ | 69.39 Mt | 3800 MW | 100 MW | 150 MW | 2446 MW |
| Case 9 | 2055 M$ | 62.18 Mt | 4700 MW | 100 MW | - | 3396 MW |
| Total Cost | Carbon Emissions | Installed Capacity | ||||
|---|---|---|---|---|---|---|
| Wind Generator | CCS Retrofitting | Flexibility Retrofitting | CB Retrofitting | |||
| 0.25 | 2261 M$ | 73.96 Mt | 4100 MW | 804 MW | 40 MW | 2692 MW |
| 0.375 | 2172 M$ | 67.87 Mt | 4500 MW | 100 MW | 40 MW | 3086 MW |
| 0.5 | 2055 M$ | 62.18 Mt | 4700 MW | 100 MW | - | 3396 MW |
| 0.625 | 1944 M$ | 65.25 Mt | 4700 MW | 100 MW | - | 3396 MW |
| 0.75 | 1819 M$ | 67.71 Mt | 4900 MW | - | - | 3446 MW |
| Case | Total Cost | Carbon Emissions | Installed Capacity | |||
|---|---|---|---|---|---|---|
| Wind Generator | CCS Retrofitting | Flexibility Retrofitting | CB Retrofitting | |||
| Case 10 | 2183 M$ | 64.71 Mt | 4600 MW | 100 MW | 80 MW | 3546 MW |
| Case | Investment Cost | Operational Cost | Total Cost | Carbon Emissions | Computation Time |
|---|---|---|---|---|---|
| Case 1 | 31.604 B$ | 1.081 B$ | 32.684 B$ | 335.93 Mt | 467 s |
| Case 2 | 28.370 B$ | 0.911 B$ | 29.281 B$ | 280.67 Mt | 542 s |
| Case 3 | 29.554 B$ | 1.342 B$ | 30.896 B$ | 325.01 Mt | 617 s |
| Case 4 | 26.466 B$ | 0.586 B$ | 27.052 B$ | 334.22 Mt | 593 s |
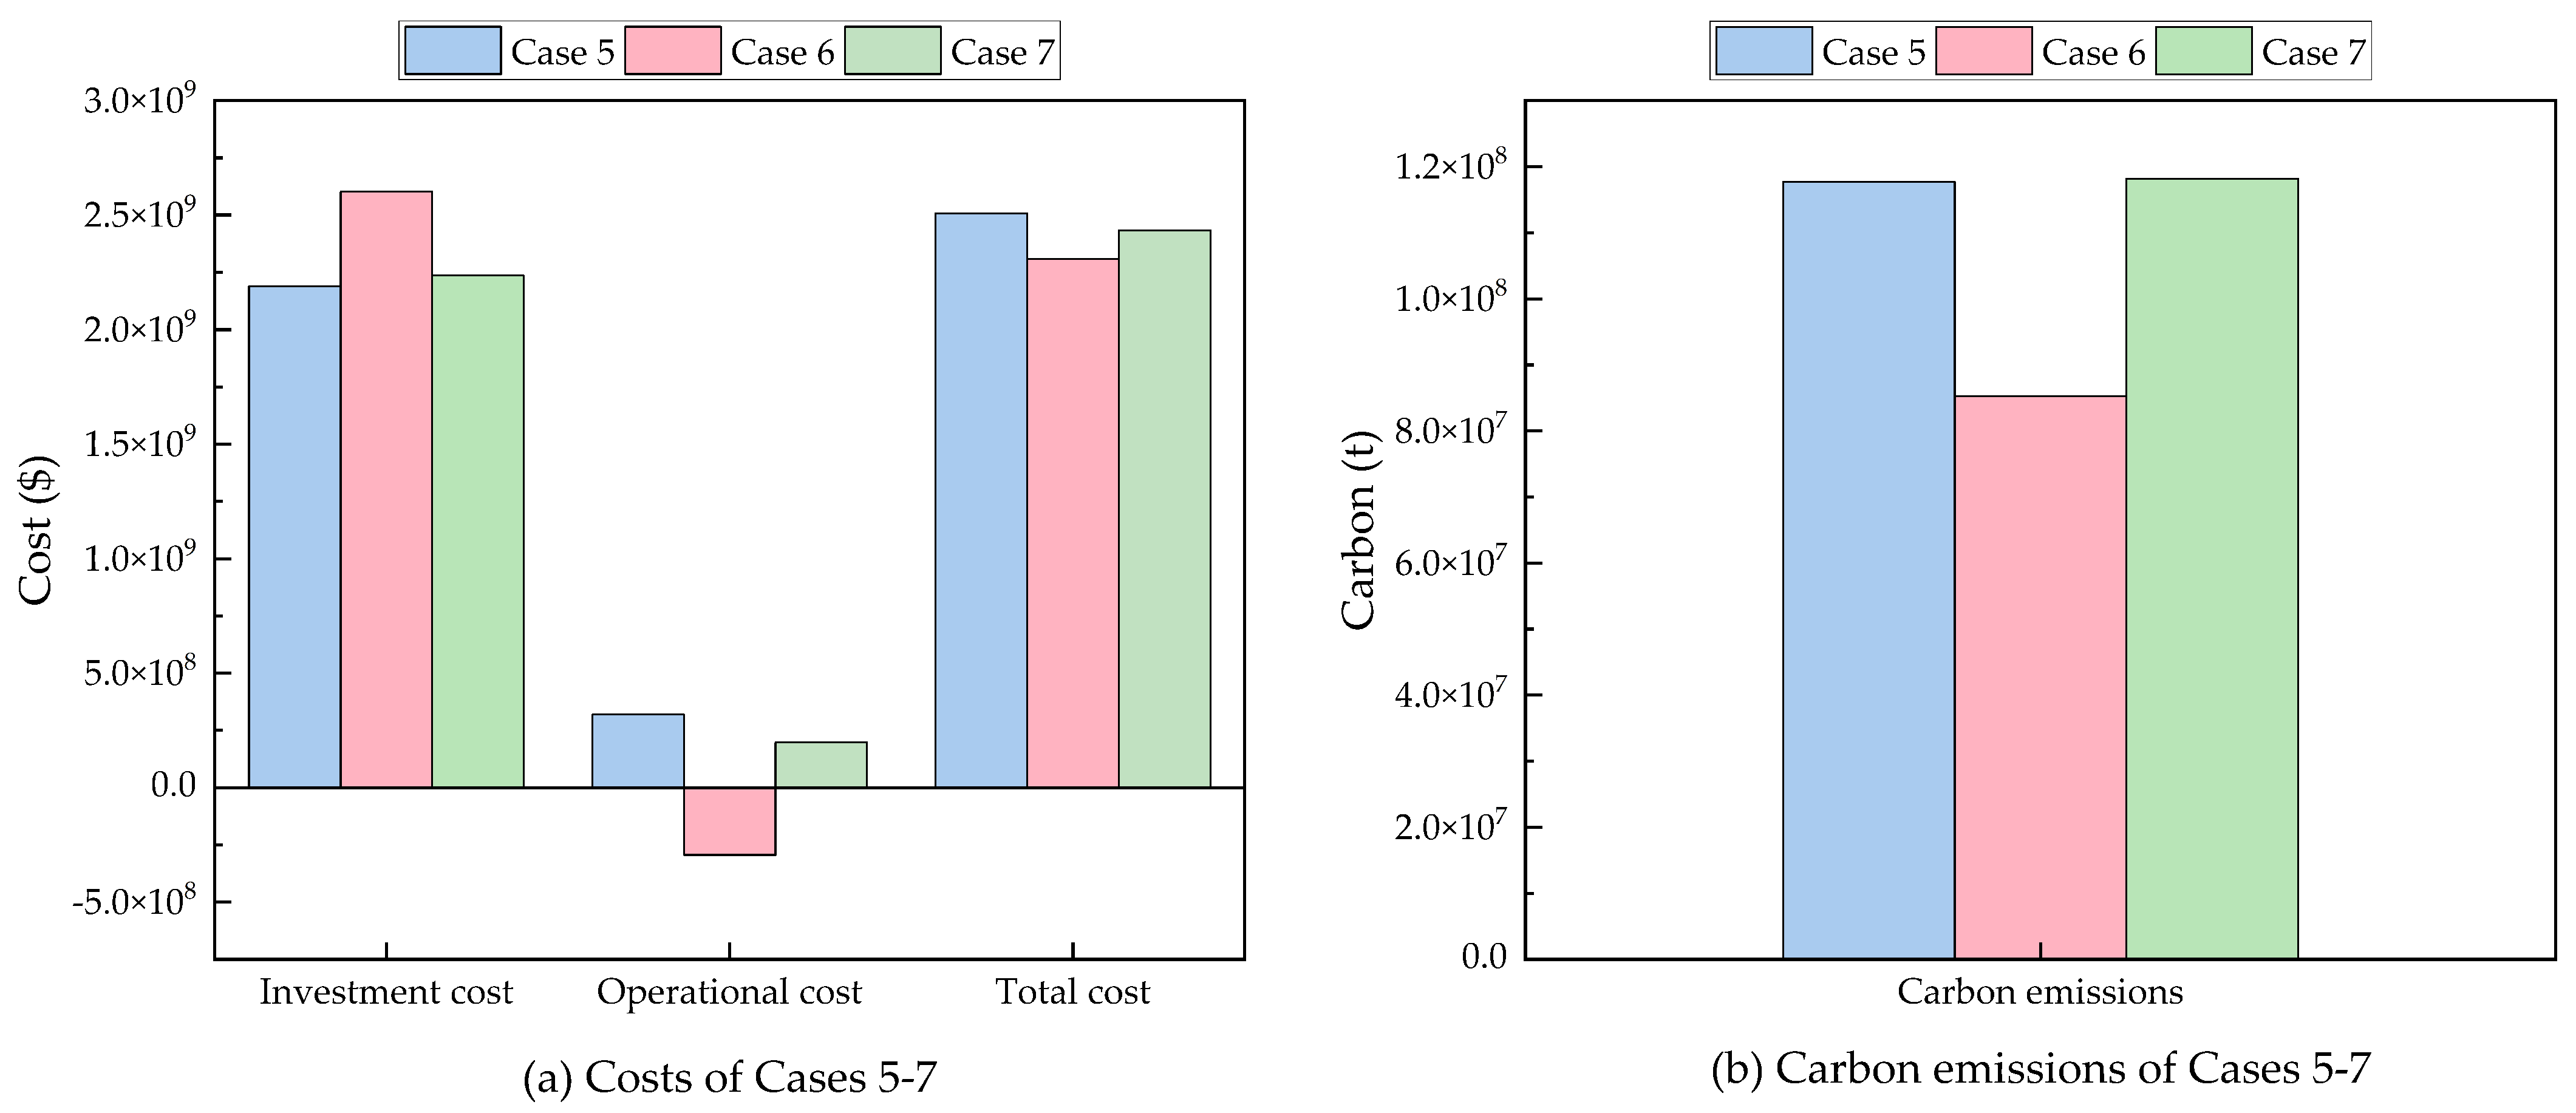
| Case 5 | 24.008 B$ | 0.691 B$ | 24.699 B$ | 270.39 Mt | 2668 s |
| Case 6 | 25.564 B$ | −3.008 B$ | 22.556 B$ | 229.82 Mt | 3101 s |
| Case 7 | 24.462 B$ | 0.136 B$ | 24.598 B$ | 270.81 Mt | 2974 s |
| Case 8 | 19.762 B$ | 1.695 B$ | 21.457 B$ | 190.20 Mt | 3238 s |
| Case 9 | 19.278 B$ | 1.241 B$ | 20.519 B$ | 174.67 Mt | 3443 s |
| Case 10 | 20.633 B$ | 1.781 B$ | 22.414 B$ | 189.90 Mt | 18,765 s |
Disclaimer/Publisher’s Note: The statements, opinions and data contained in all publications are solely those of the individual author(s) and contributor(s) and not of MDPI and/or the editor(s). MDPI and/or the editor(s) disclaim responsibility for any injury to people or property resulting from any ideas, methods, instructions or products referred to in the content. |
© 2025 by the authors. Licensee MDPI, Basel, Switzerland. This article is an open access article distributed under the terms and conditions of the Creative Commons Attribution (CC BY) license (https://creativecommons.org/licenses/by/4.0/).
Share and Cite
Tang, Z.; Yin, Y.; Chen, C.; Liu, C.; Li, Z.; Shi, B. A Synergistic Planning Framework for Low-Carbon Power Systems: Integrating Coal-Fired Power Plant Retrofitting with a Carbon and Green Certificate Market Coupling Mechanism. Energies 2025, 18, 2403. https://doi.org/10.3390/en18092403
Tang Z, Yin Y, Chen C, Liu C, Li Z, Shi B. A Synergistic Planning Framework for Low-Carbon Power Systems: Integrating Coal-Fired Power Plant Retrofitting with a Carbon and Green Certificate Market Coupling Mechanism. Energies. 2025; 18(9):2403. https://doi.org/10.3390/en18092403
Chicago/Turabian StyleTang, Zifan, Yue Yin, Chao Chen, Changle Liu, Zhuoxun Li, and Benyao Shi. 2025. "A Synergistic Planning Framework for Low-Carbon Power Systems: Integrating Coal-Fired Power Plant Retrofitting with a Carbon and Green Certificate Market Coupling Mechanism" Energies 18, no. 9: 2403. https://doi.org/10.3390/en18092403
APA StyleTang, Z., Yin, Y., Chen, C., Liu, C., Li, Z., & Shi, B. (2025). A Synergistic Planning Framework for Low-Carbon Power Systems: Integrating Coal-Fired Power Plant Retrofitting with a Carbon and Green Certificate Market Coupling Mechanism. Energies, 18(9), 2403. https://doi.org/10.3390/en18092403