
Operation at Reduced Atmospheric Pressure and Concept of Reliability Redundancy for Optimized Design of Insulation Systems


Abstract
1. Introduction
2. Aging Modeling and Experimental Characterization
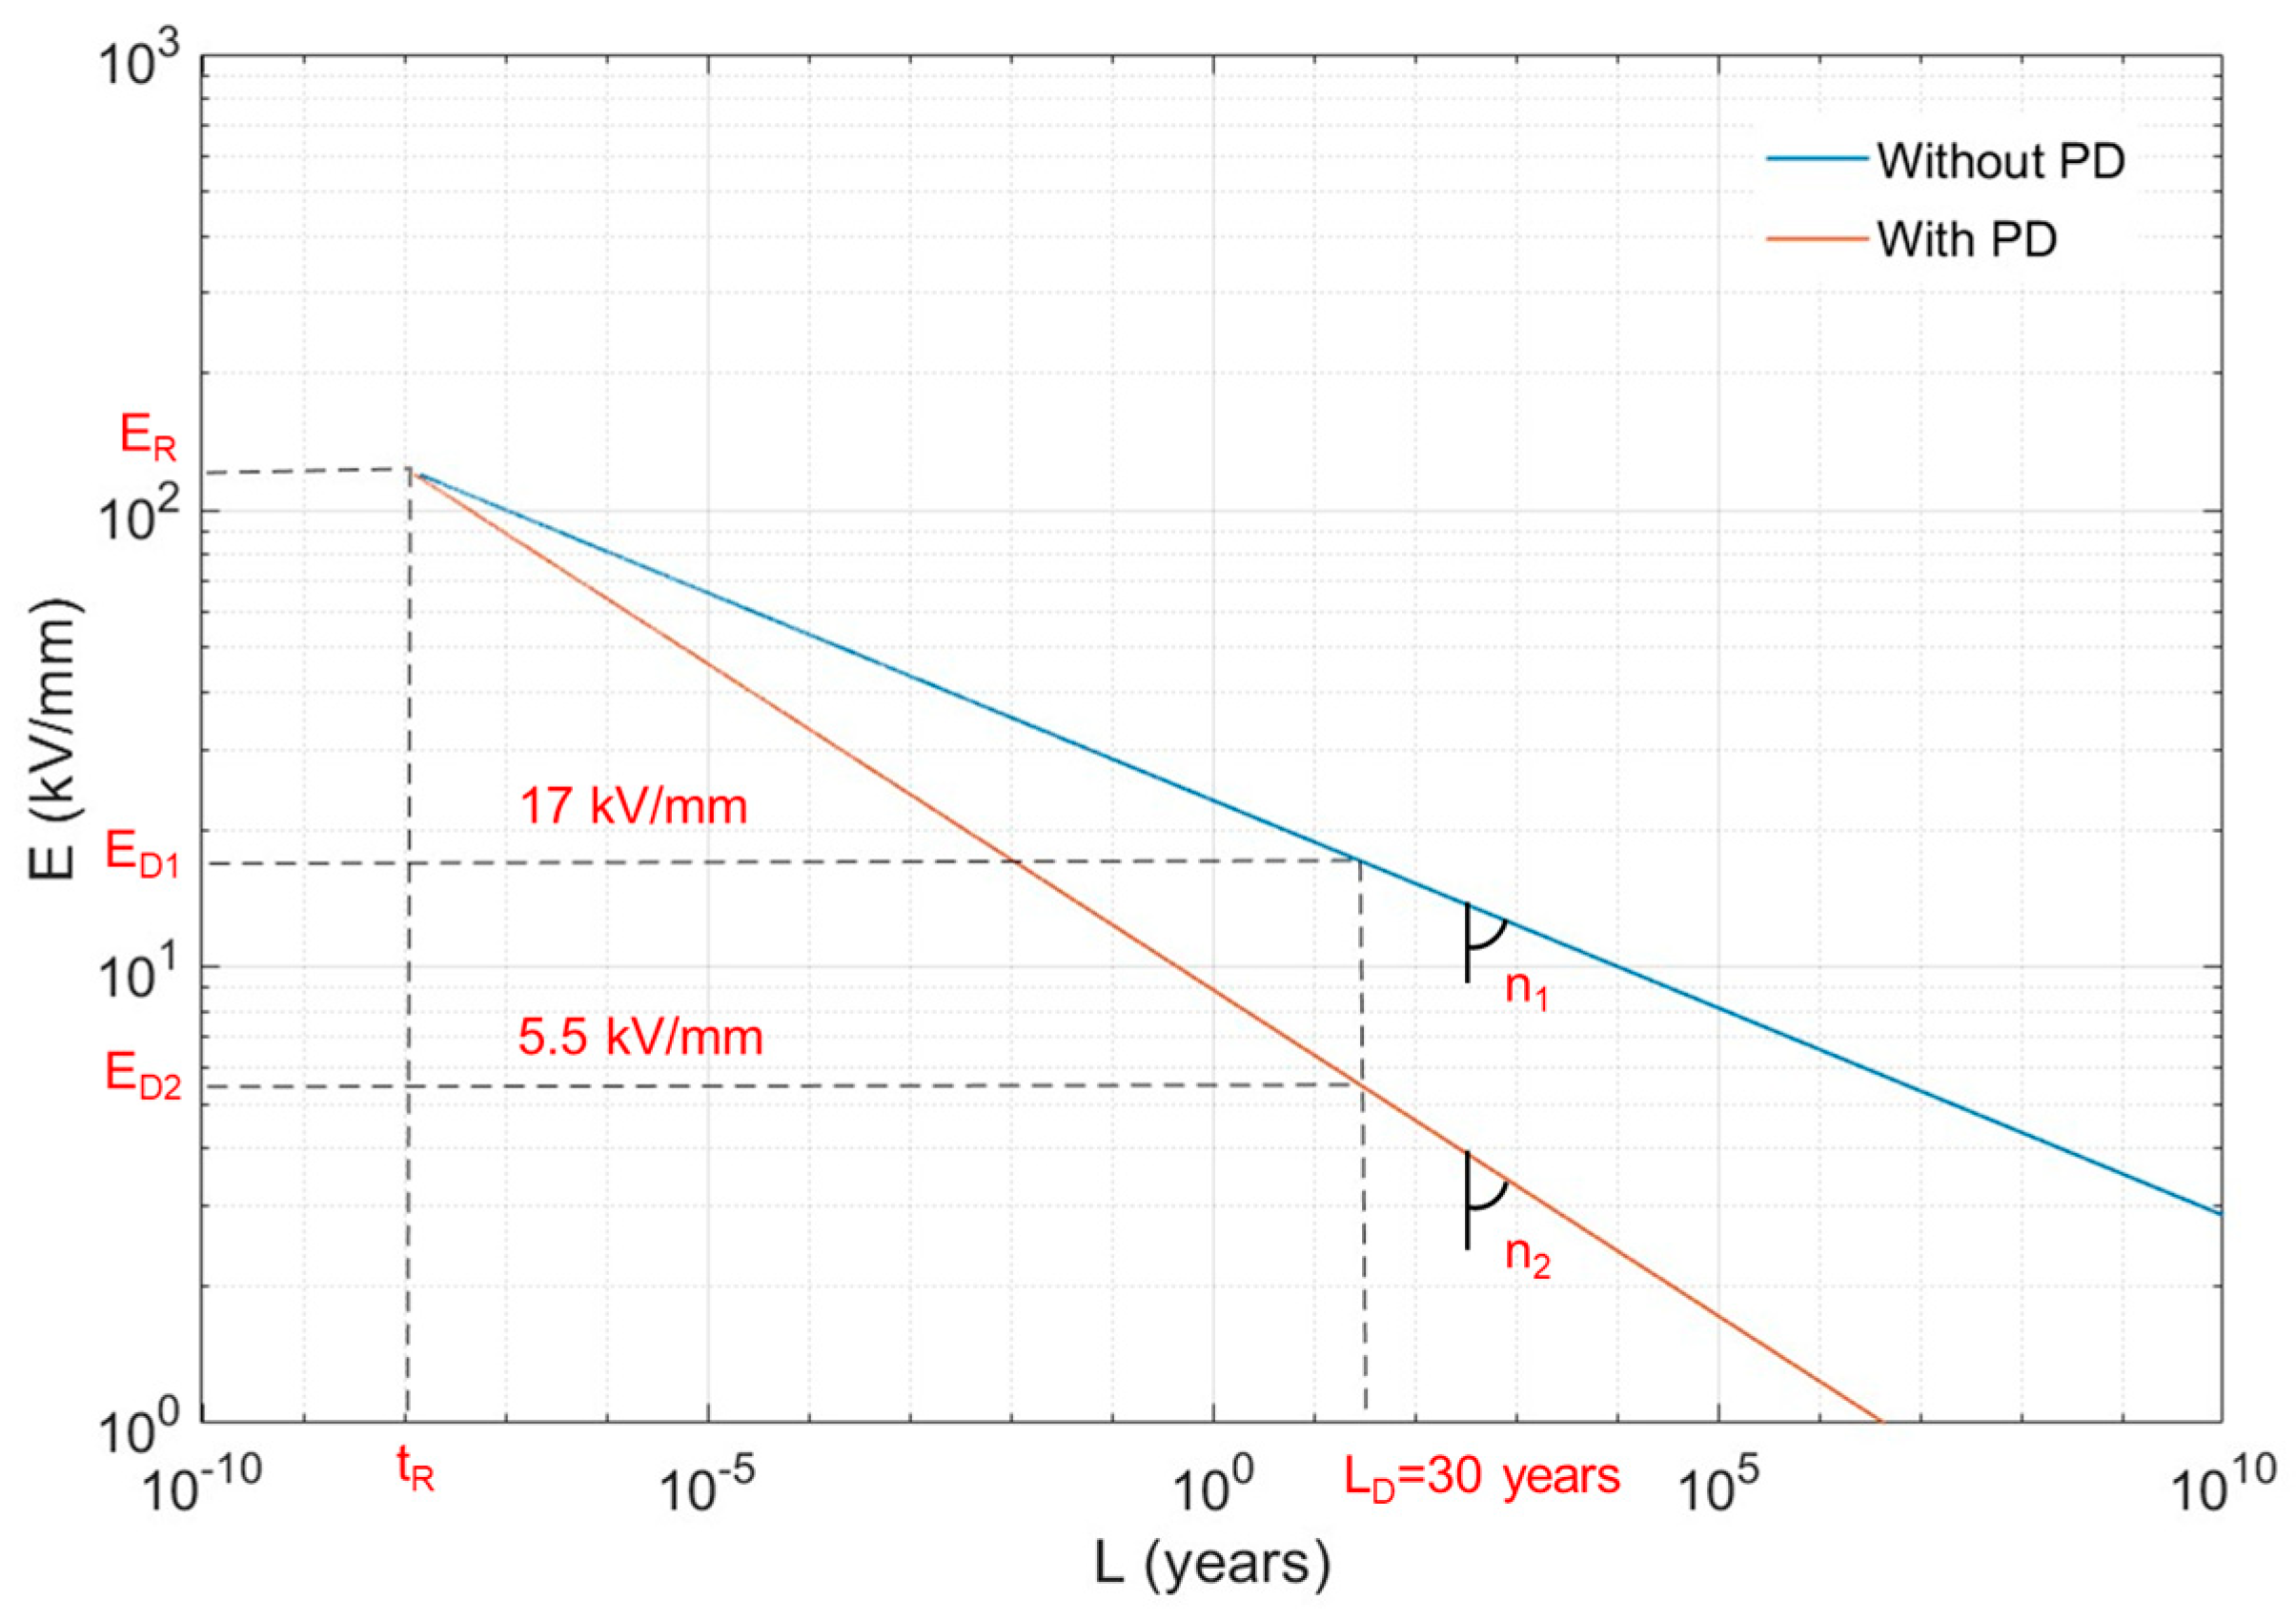
2.1. Dynamic Aging Modeling
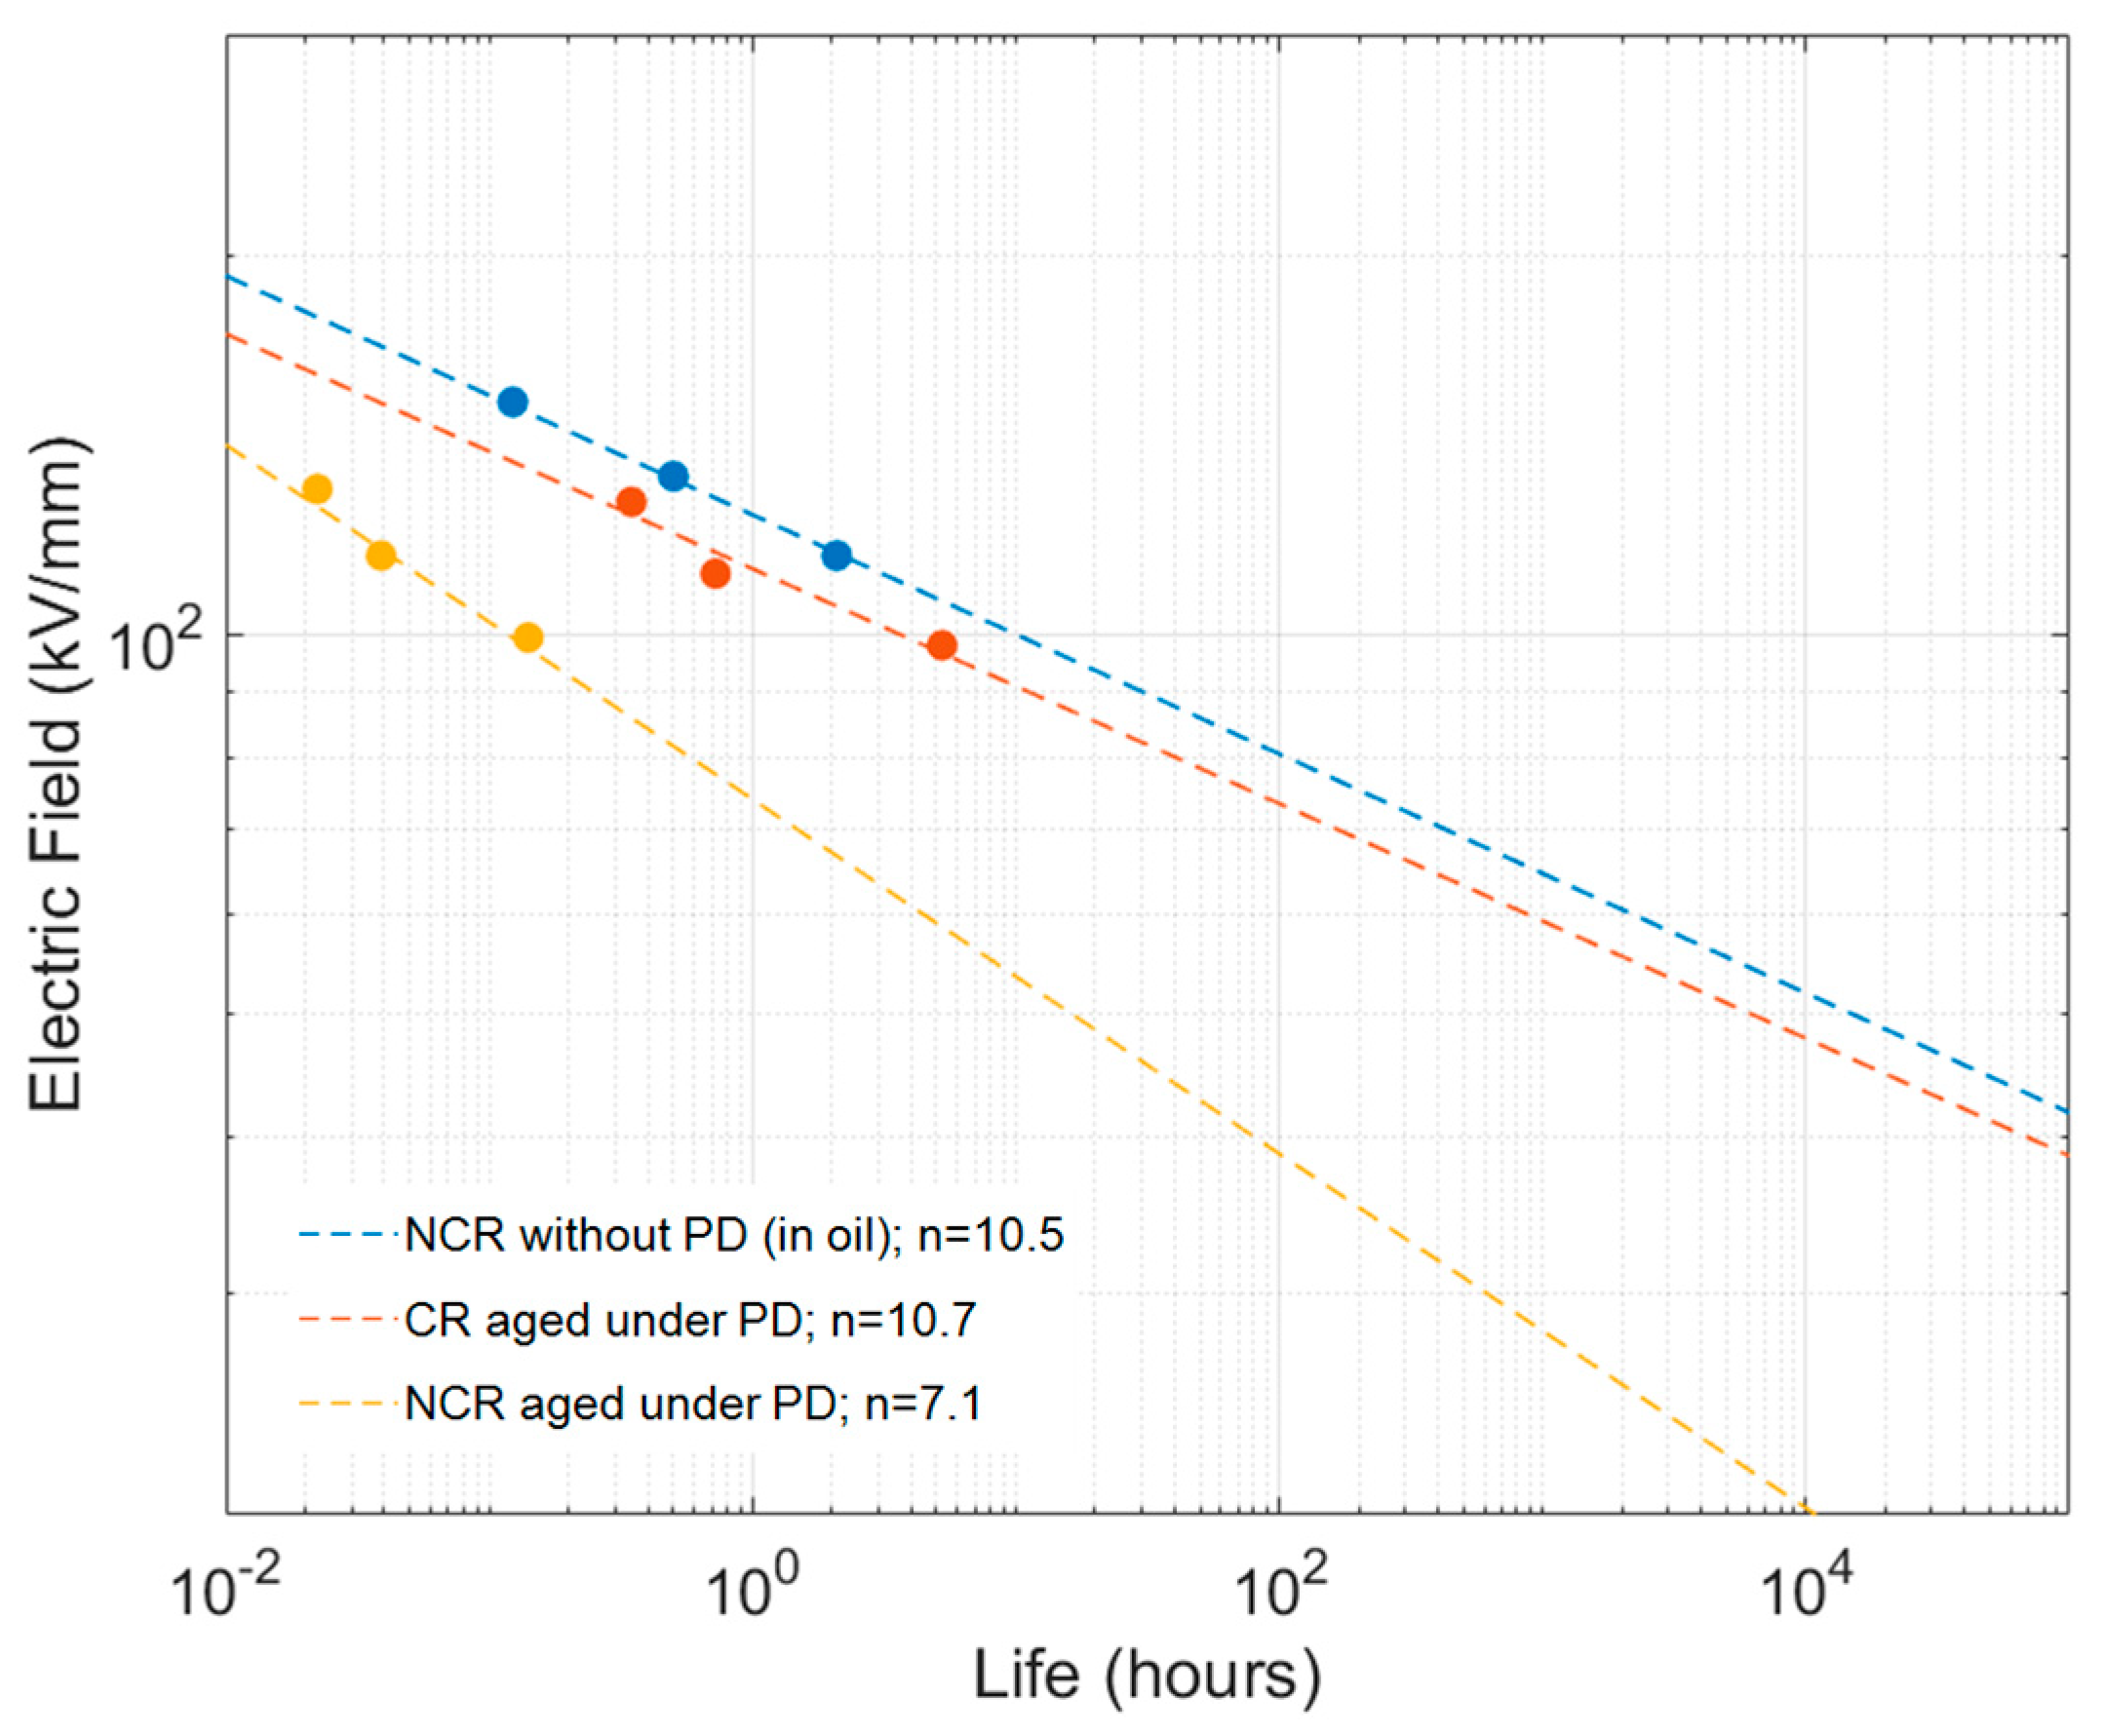
2.2. Experiments to Determine Life Model Parameters and Partial Discharge Endurance
2.3. PD Measurements
2.4. Damage Quantification
3. Extrinsic-Aging-Free Design and Reliability Redundancy
3.1. Three-Leg Approach for a PD-Free Design
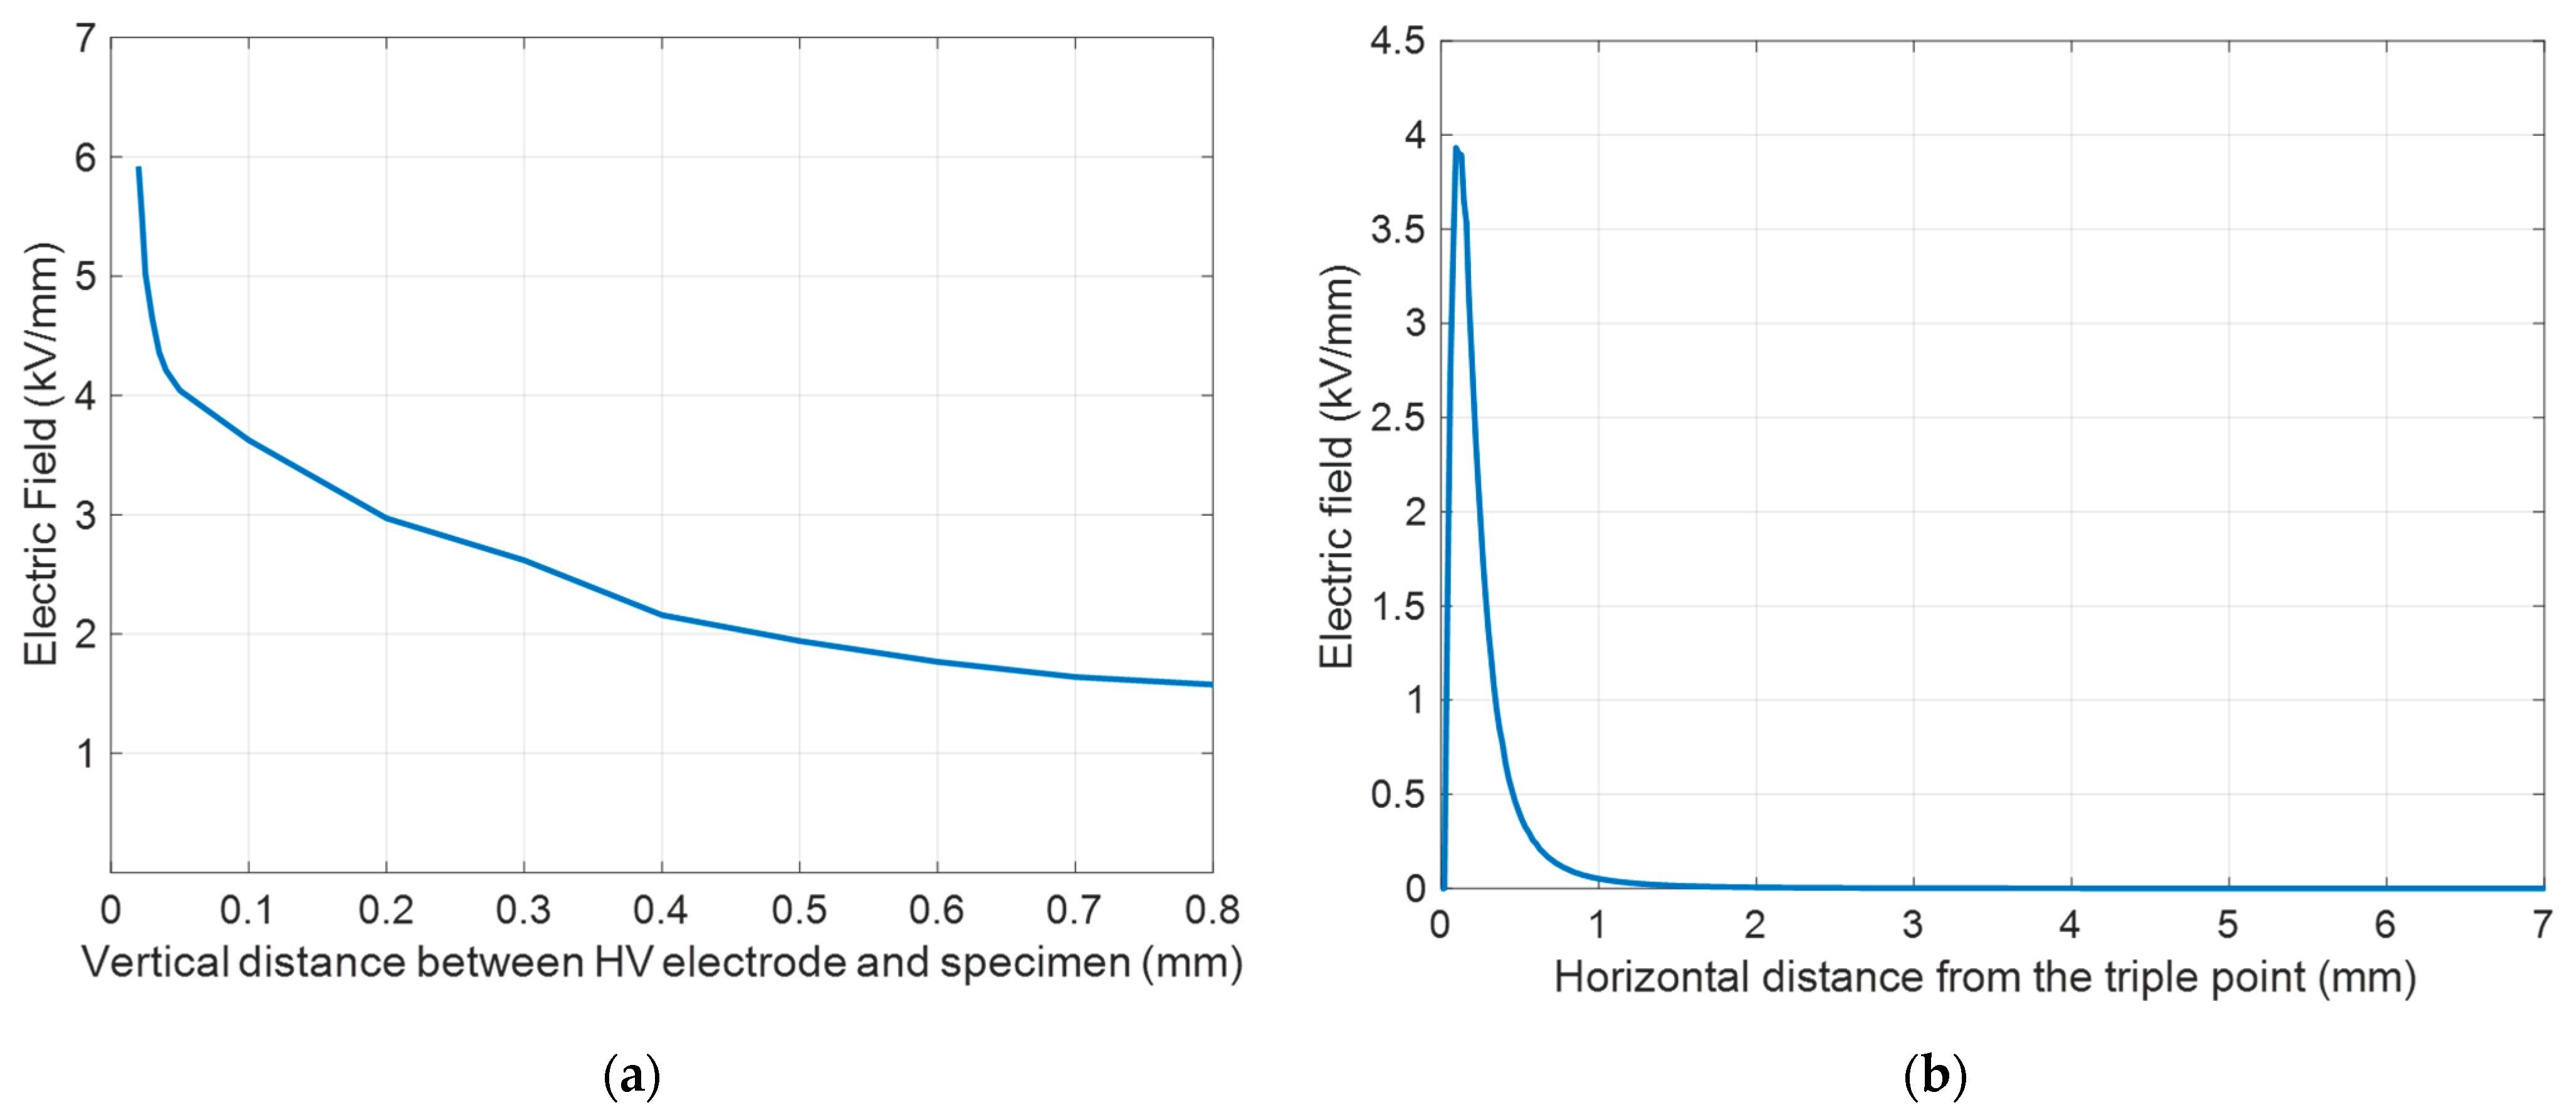
- Electric field calculation;
- Matching with PD inception field models;
- Validation by PDIV measurements.
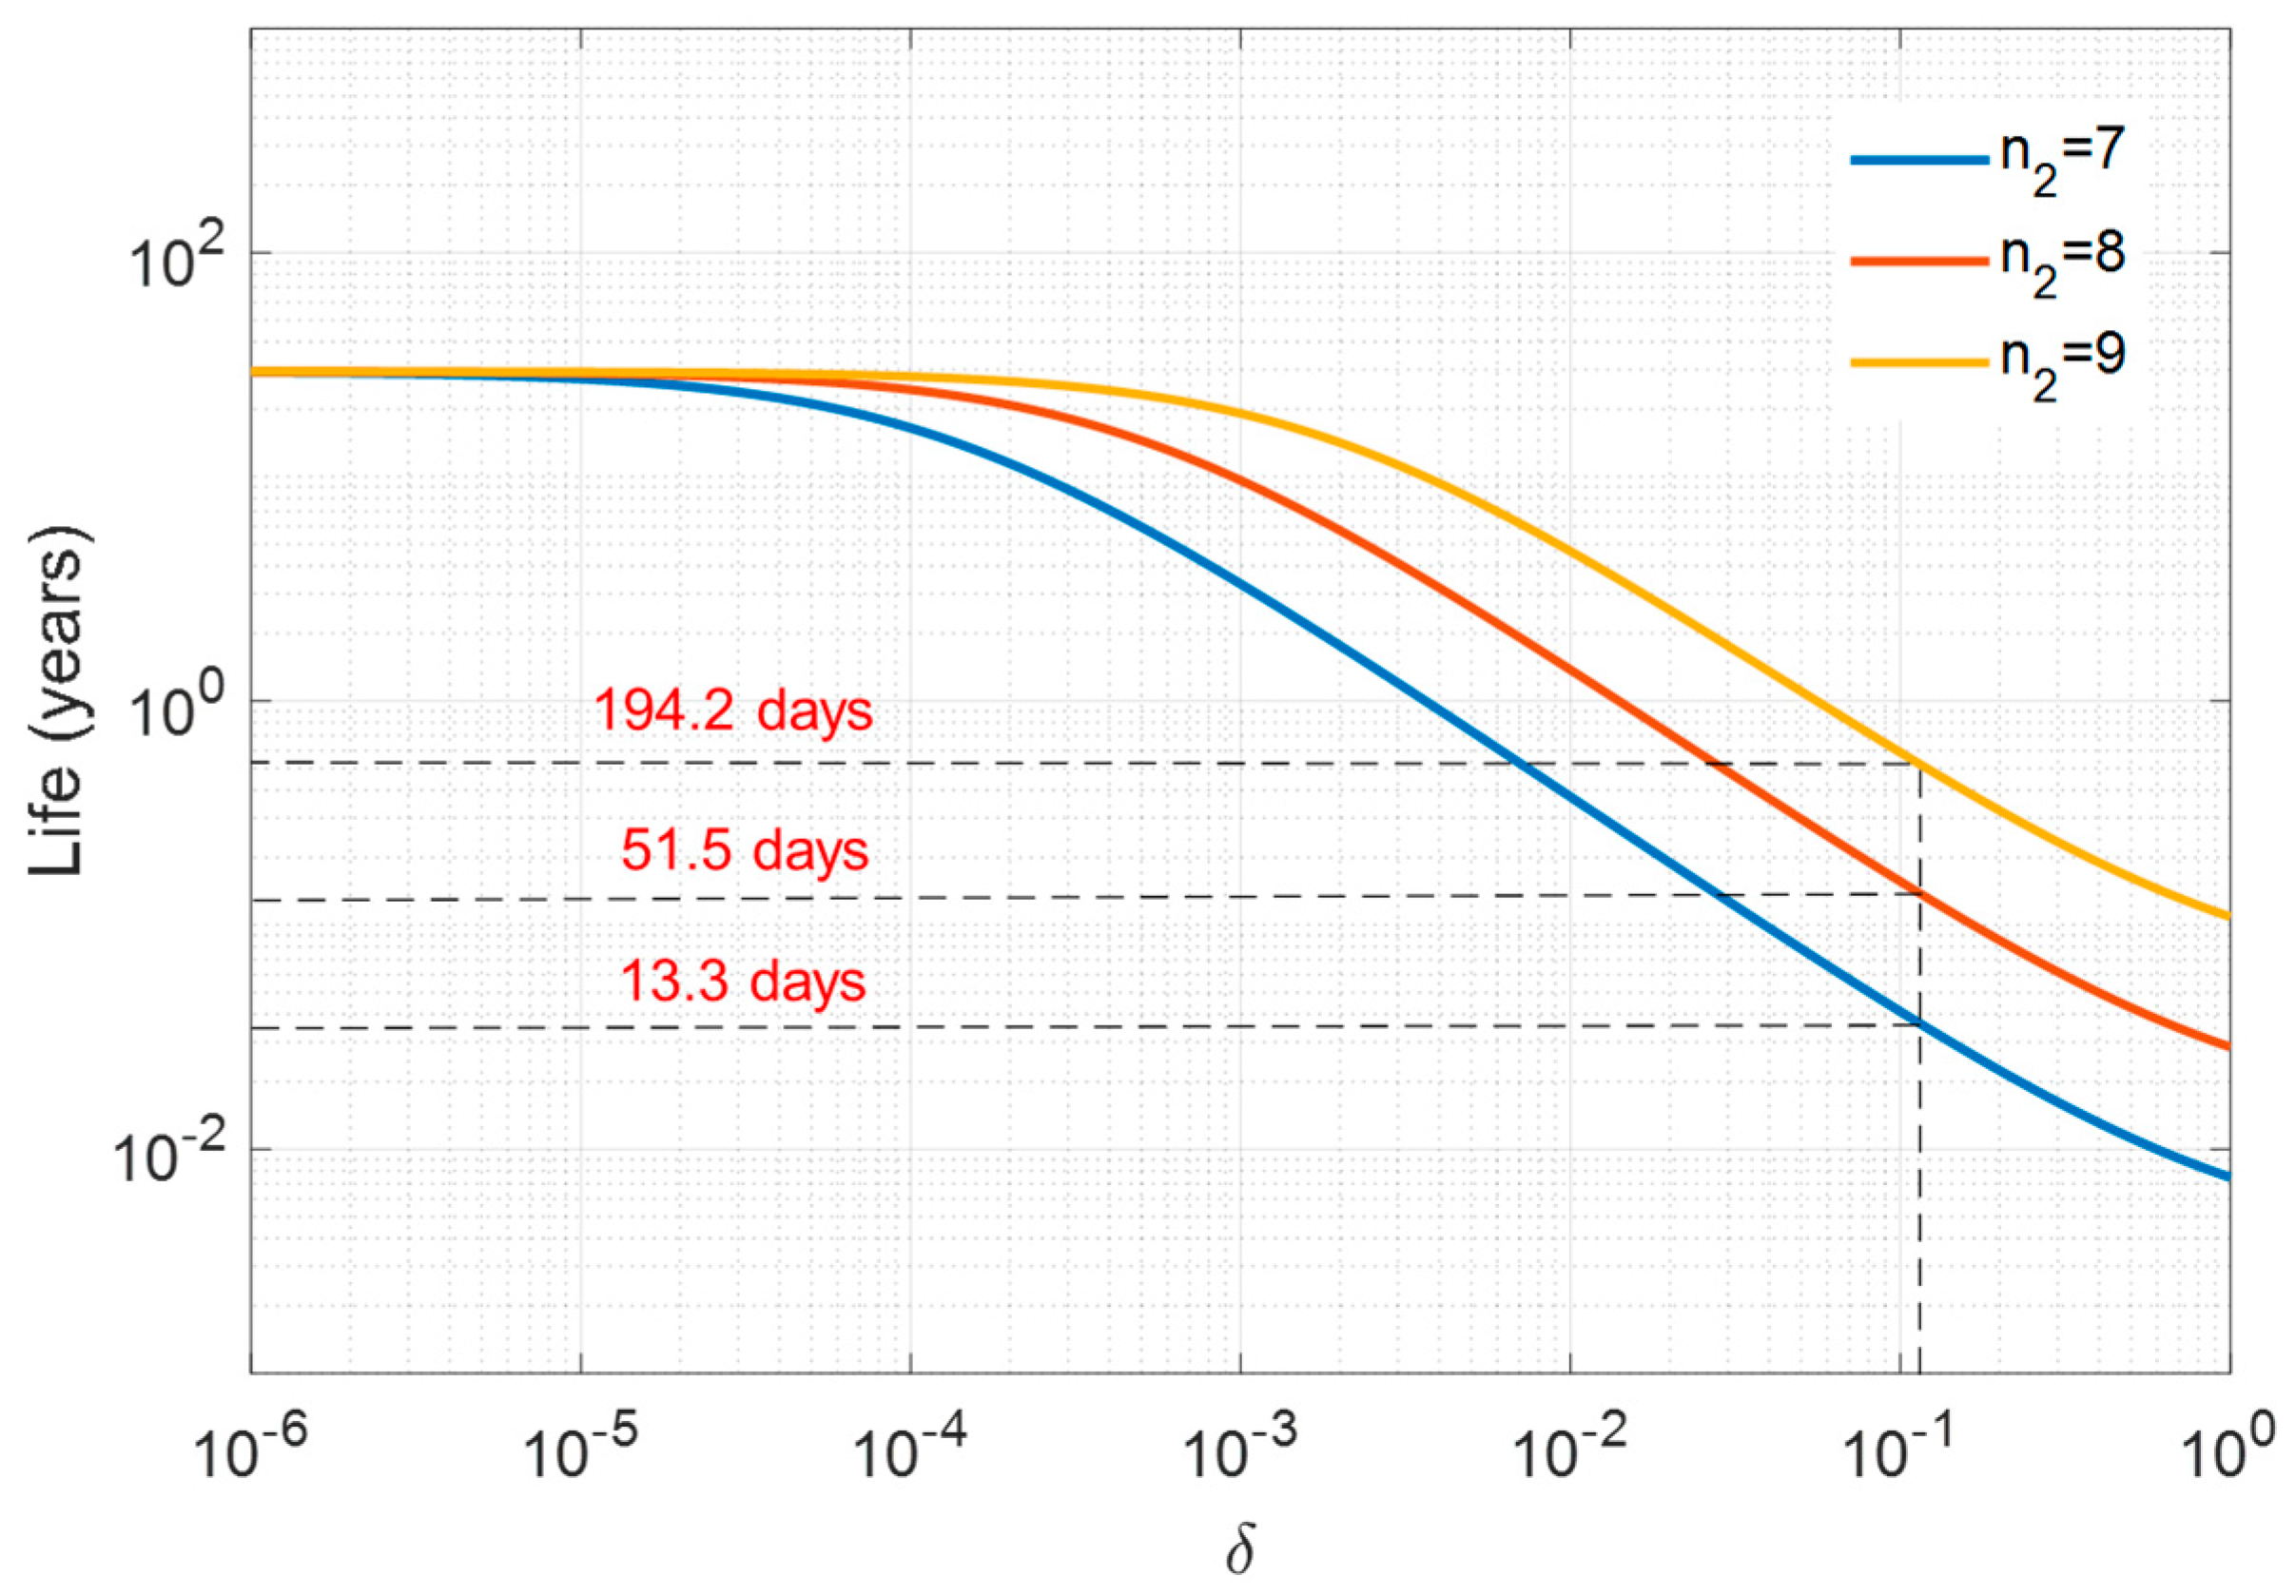
3.2. Reliability Redundancy
4. Conclusions
Author Contributions
Funding
Data Availability Statement
Conflicts of Interest
Abbreviations and Nomenclature
| PD | Partial Discharge |
| VEC or n | Voltage Endurance Coefficient |
| NCR | Non-Corona Resistant |
| CR | Corona Resistant |
| PDIV | Partial Discharge Inception Voltage |
| SAP | Standard Atmospheric Pressure |
| Design electric stress | |
| Design life at failure probability, P | |
| Failure time | |
| P | Failure probability |
| Shape parameter of the failure time from Weibull distribution | |
| Reference electric stress | |
| Failure time at applied field, | |
| tF50 | Time for 50% erosion depth increment |
| tBD | Breakdown time |
| Damage density per unit time | |
| Coefficient accounting for the probability that an electron involved in a PD with a certain amplitude is exceeding an energy level, e.g., 8 eV | |
| Fraction of effective hot electrons contributing to damage | |
| Mean PD repetition rate | |
| Average measured charge amplitude | |
| Measurement sensitivity factor | |
| Electric field at inception of surface/gas discharge | |
| p | Pressure |
| Distance between positive and negative electrodes or internal defect height | |
| Reduced critical electric field | |
| Kcr, C and β | Parameters related to the physics of the ionization process |
| Field dependent factor which takes into account the field gradient, i.e., the shape of field profile. |
References
- Schwab, A.; Thomas, A.; Bennett, J.; Robertson, E.; Cary, S. Electrification of Aircraft: Challenges, Barriers, and Potential Impacts; No. NREL/TP-6A20-80220; National Renewable Energy Lab. (NREL): Golden, CO, USA, 2021. [Google Scholar]
- Lizcano, M.; Williams, T.S.; Shin, E.S.E.; Santiago, D.; Nguyen, B. Aerospace environmental challenges for electrical insulation and recent developments for electrified aircraft. Materials 2021, 15, 8121. [Google Scholar] [CrossRef] [PubMed]
- Lemmon, A.N.; Khanna, R.; Chalfant, J.; Davoudi, A.; Bazzi, A.M. Guest Editorial Special Issue on Electrified Ship Technologies. IEEE Trans. Transp. Electrif. 2025, 10, 7645–7650. [Google Scholar] [CrossRef]
- Hospodka, J.; Bínová, H.; Pleninger, S. Assessment of all-electric general aviation aircraft. Energies 2020, 13, 6206. [Google Scholar] [CrossRef]
- Madonna, V.; Giangrande, P.; Galea, M. Electrical power generation in aircraft: Review, challenges, and opportunities. IEEE Trans. Transp. Electrif. 2018, 4, 646–659. [Google Scholar] [CrossRef]
- Liang, Y.; Mouli, G.R.C.; Bauer, P. Charging technology for electric aircraft: State of the art, trends, and challenges. IEEE Trans. Transp. Electrif. 2023, 10, 6761–6788. [Google Scholar] [CrossRef]
- Li, C.; Yang, Y.; Xu, G.; Zhou, Y.; Jia, M.; Zhong, S.; Gao, Y.; Park, C.; Liu, Q.; Wang, Y.; et al. Insulating materials for realising carbon neutrality: Opportunities, remaining issues and challenges. High Volt. 2022, 7, 610–632. [Google Scholar] [CrossRef]
- Borghei, M.; Ghassemi, M. Insulation materials and systems for more-and all-electric aircraft: A review identifying challenges and future research needs. IEEE Trans. Transp. Electrif. 2021, 7, 1930–1953. [Google Scholar] [CrossRef]
- Bourdon, J.; Asfaux, P.; Etayo, A.M. Review of power electronics opportunities to integrate in the more electrical aircraft. In Proceedings of the IEEE International Conference on Electrical Systems for Aircraft, Railway, Ship Propulsion and Road Vehicles (ESARS), Aachen, Germany, 3–5 March 2015. [Google Scholar]
- Chen, J.; Wang, C.; Chen, J. Investigation on the selection of electric power system architecture for future more electric aircraft. IEEE Trans. Transp. Electrif. 2018, 4, 563–576. [Google Scholar] [CrossRef]
- Coffey, S.; Timmers, V.; Li, R.; Wu, G.; Egea-Àlvarez, A. Review of MVDC applications, technologies, and future prospects. Energies 2021, 14, 8294. [Google Scholar] [CrossRef]
- Lebey, T.; Rumi, A.; Cavallini, A. Challenges for electrical insulation systems in high voltage aviation applications. IEEE Electr. Insul. Mag. 2022, 38, 5–11. [Google Scholar] [CrossRef]
- De Doncker, R.W. Power electronic technologies for flexible DC distribution grids. In Proceedings of the International Power Electronics Conference (IPEC-Hiroshima 2014-ECCE ASIA), Hiroshima, Japan, 18–21 May 2014. [Google Scholar]
- Naval Power and Energy System: Technology Development Roadmap. In The U.S. Navy Power & Energy Leap Forward; NAVSEA: Washington, DC, USA, 2019; pp. 1–44.
- Montanari, G.C.; Shafiq, M.; Schwartz, S. A Dynamic Health Index approach for aviation electrical assets based on the detection of partial discharges and their harmfulness. In Proceedings of the Aeroforum, San Diego, CA, USA, 11–13 December 2023. [Google Scholar]
- Ghosh, R.; Seri, P.; Montanari, G.C. Partial discharges in DC electrical insulation during voltage transients and steady state: Noise rejection discharge source identification and life estimation. Electr. Power Syst. Res. 2021, 194, 107117. [Google Scholar] [CrossRef]
- IEC 60505; Evaluation and Qualification of Electrical Insulation Systems, 4th ed. IEC: Geneva, Switzerland, 2011.
- IEC 61251; Electrical Insulating Materials and Systems—AC Voltage Endurance Evaluation, 1st ed. IEC: Geneva, Switzerland, 2015.
- Dissado, L.A.; Fothergill, J.C. Electrical Degradation and Breakdown in Polymer; Peter Peregrinus Press: London, UK, 1992. [Google Scholar]
- Dunbar, W.G. HV Design Guide: Aircraft; Boeing Report, AFWAL-TR-82; Boeing Aerospace Co.: Seattle, WA, USA, January 1983. [Google Scholar]
- Yang, Q.; Montanari, G.C.; Nath, D.A. Global approach to the design of insulation systems for aerospace electrical assets: Focus on Printed Circuit Board. IEEE Trans. Aerosp. Electron. Syst. 2023, 59, 5613–5623. [Google Scholar] [CrossRef]
- Brammer, R.; Filliben, S.A. New corona resistant wire insulation for traction applications. In Proceedings of the IEEE Electrical Insulation Conference (EIC), Baltimore, MD, USA, 11–14 June 2017. [Google Scholar]
- IEC 62539 First Edition 2007-07 IEEE 930; IEC/IEEE Guide for the Statistical Analysis of Electrical Insulation Breakdown Data (Adoption of IEEE Std 930-2004). IEEE: New York, NY, USA, 2007; pp. 1–53.
- Endicott, H.; Hatch, B.; Sohmer, R. Application of the Eyring model to capacitor aging data. IEEE Trans. Compon. Parts 1965, 12, 34–41. [Google Scholar] [CrossRef]
- Crine, J.P.; Parpal, J.L.; Lessard, G. A model of aging of dielectric extruded cables. In Proceedings of the 3rd International Conference on Conduction and Breakdown in Solid Dielectrics, Trondheim, Norway, 3–6 July 1989. [Google Scholar]
- Testa, L.; Serra, S.; Montanari, G.C. Advanced modeling of electron avalanche process in polymeric dielectric voids: Simulations and experimental validation. J. Appl. Phys. 2010, 108, 034110. [Google Scholar] [CrossRef]
- Myneni, S.B.; Montanari, G.C. Accelerated aging tests to evaluate partial discharge endurance of electrical insulating materials for HV electric aircraft assets. In Proceedings of the AIAA/IEEE Electric Aircraft Technologies Symposium (EATS), Las Vegas, NV, USA, 29 July–2 August 2024; p. 3704. [Google Scholar]
- Occhini, E. A statistical approach to the discussion of the dielectric strength in electric cables. IEEE Trans. Power Appar. Syst. 1971, 90, 2671–2682. [Google Scholar] [CrossRef]
- Rumi, A.; Marinelli, J.; Barater, D.; Cavallini, A.; Seri, P. The Challenges of Reliable Dielectrics in Modern Aerospace Applications: The Hazard of Corona Resistant Materials. IEEE Trans. Transp. Electrif. 2022, 8, 4646–4653. [Google Scholar] [CrossRef]
- IEC 60270; High-Voltage Test Techniques—Partial Discharge Measurements, 3rd ed. International Electrotechnical Commission: Geneva, Switzerland, 2015.
- Lusuardi, L.; Rumi, A.; Neretti, G.; Seri, P.; Cavallini, A. Assessing the severity of partial discharges in aerospace applications. In Proceedings of the IEEE Conference on Electrical Insulation and Dielectric Phenomena (CEIDP), Richland, WA, USA, 20–23 October 2019. [Google Scholar]
- Rui, R.; Cotton, I. Impact of low-pressure aerospace environment on machine winding insulation. In Proceedings of the IEEE International Symposium on Electrical Insulation, San Diego, CA, USA, 6–9 June 2010; pp. 1–5. [Google Scholar]
- Jiang, J.; Zhang, B.; Li, Z.; Zhang, C.; Ranjan, P.; Zhang, X. Partial discharge investigation under low air pressure and variable frequency for more-electric-aircraft. IEEE Trans. Dielectr. Electr. Insul. 2021, 28, 1793–1801. [Google Scholar] [CrossRef]
- Naderiallaf, H.; Seri, P.; Montanari, G.C. DC cables: Effect of voltage transient slew rate on partial discharge phenomenology and harmfulness. In Proceedings of the Jicable HVDC, Liege, Belgium, 8–10 November 2021. [Google Scholar]
- Bartnikas, R.; Novak, J.P. On the character of different forms of partial discharge and their related terminologies. IEEE Trans. Electr. Insul. 1993, 28, 956–968. [Google Scholar] [CrossRef]
- Sanche, L. Nanoscopic aspects of electronic aging in dielectrics. IEEE Trans. Dielectr. Electr. Insul. 1997, 4, 507–543. [Google Scholar] [CrossRef]
- Fothergill, J.C.; Dissado, L.A. Space Charge in Solid Dielectrics; The Dielectrics Society: London, UK, 1998. [Google Scholar]
- Niemeyer, L. A generalized approach to partial discharge modeling. IEEE Trans. Dielectr. Electr. Insul. 1995, 2, 510–528. [Google Scholar] [CrossRef]
- Kreuger, F.H. Partial Discharge Detection in High-Voltage Equipment; Butterworth-Heinemann: London, UK, 1990. [Google Scholar]
- IEC 60034-27-1; Rotating Electrical Machines. Off-Line Partial Discharge Measurements on the Winding Insulation. IEC: Geneva, Switzerland, 2019.
- Stone, G.C.; Boggs, S.A. Propagation of partial discharge pulses in shielded power cable. In Proceedings of the IEEE Conference on Electrical Insulation & Dielectric Phenomena-Annual Report, Amherst, MA, USA, 17–28 October 1982; pp. 275–280. [Google Scholar]


| n2 |
Design Life When δ = 0.01 (PD Occurring for About 1% of the Total Design Life) (Days) |
Design Life When δ = 0.11 (PD Occurring for About 10% of the Total Design Life) (Days) | Design Life When δ = 1 (PD Occurring for About 50% of the Total Design Life) (Days) |
|---|---|---|---|
| 7 | 401 (1.1 years) | 13.3 | 7.9 |
| 8 | 1060 (2.9 years) | 51.5 | 23.2 |
| 9 | 2628 (7.2 years) | 194.2 | 68.0 |
| Failure Criterion Considered for Estimating Lifelines | Voltage Endurance Coefficient (n) of Kapton CR | ||
|---|---|---|---|
| SAP | 0.5 bar | 0.2 bar | |
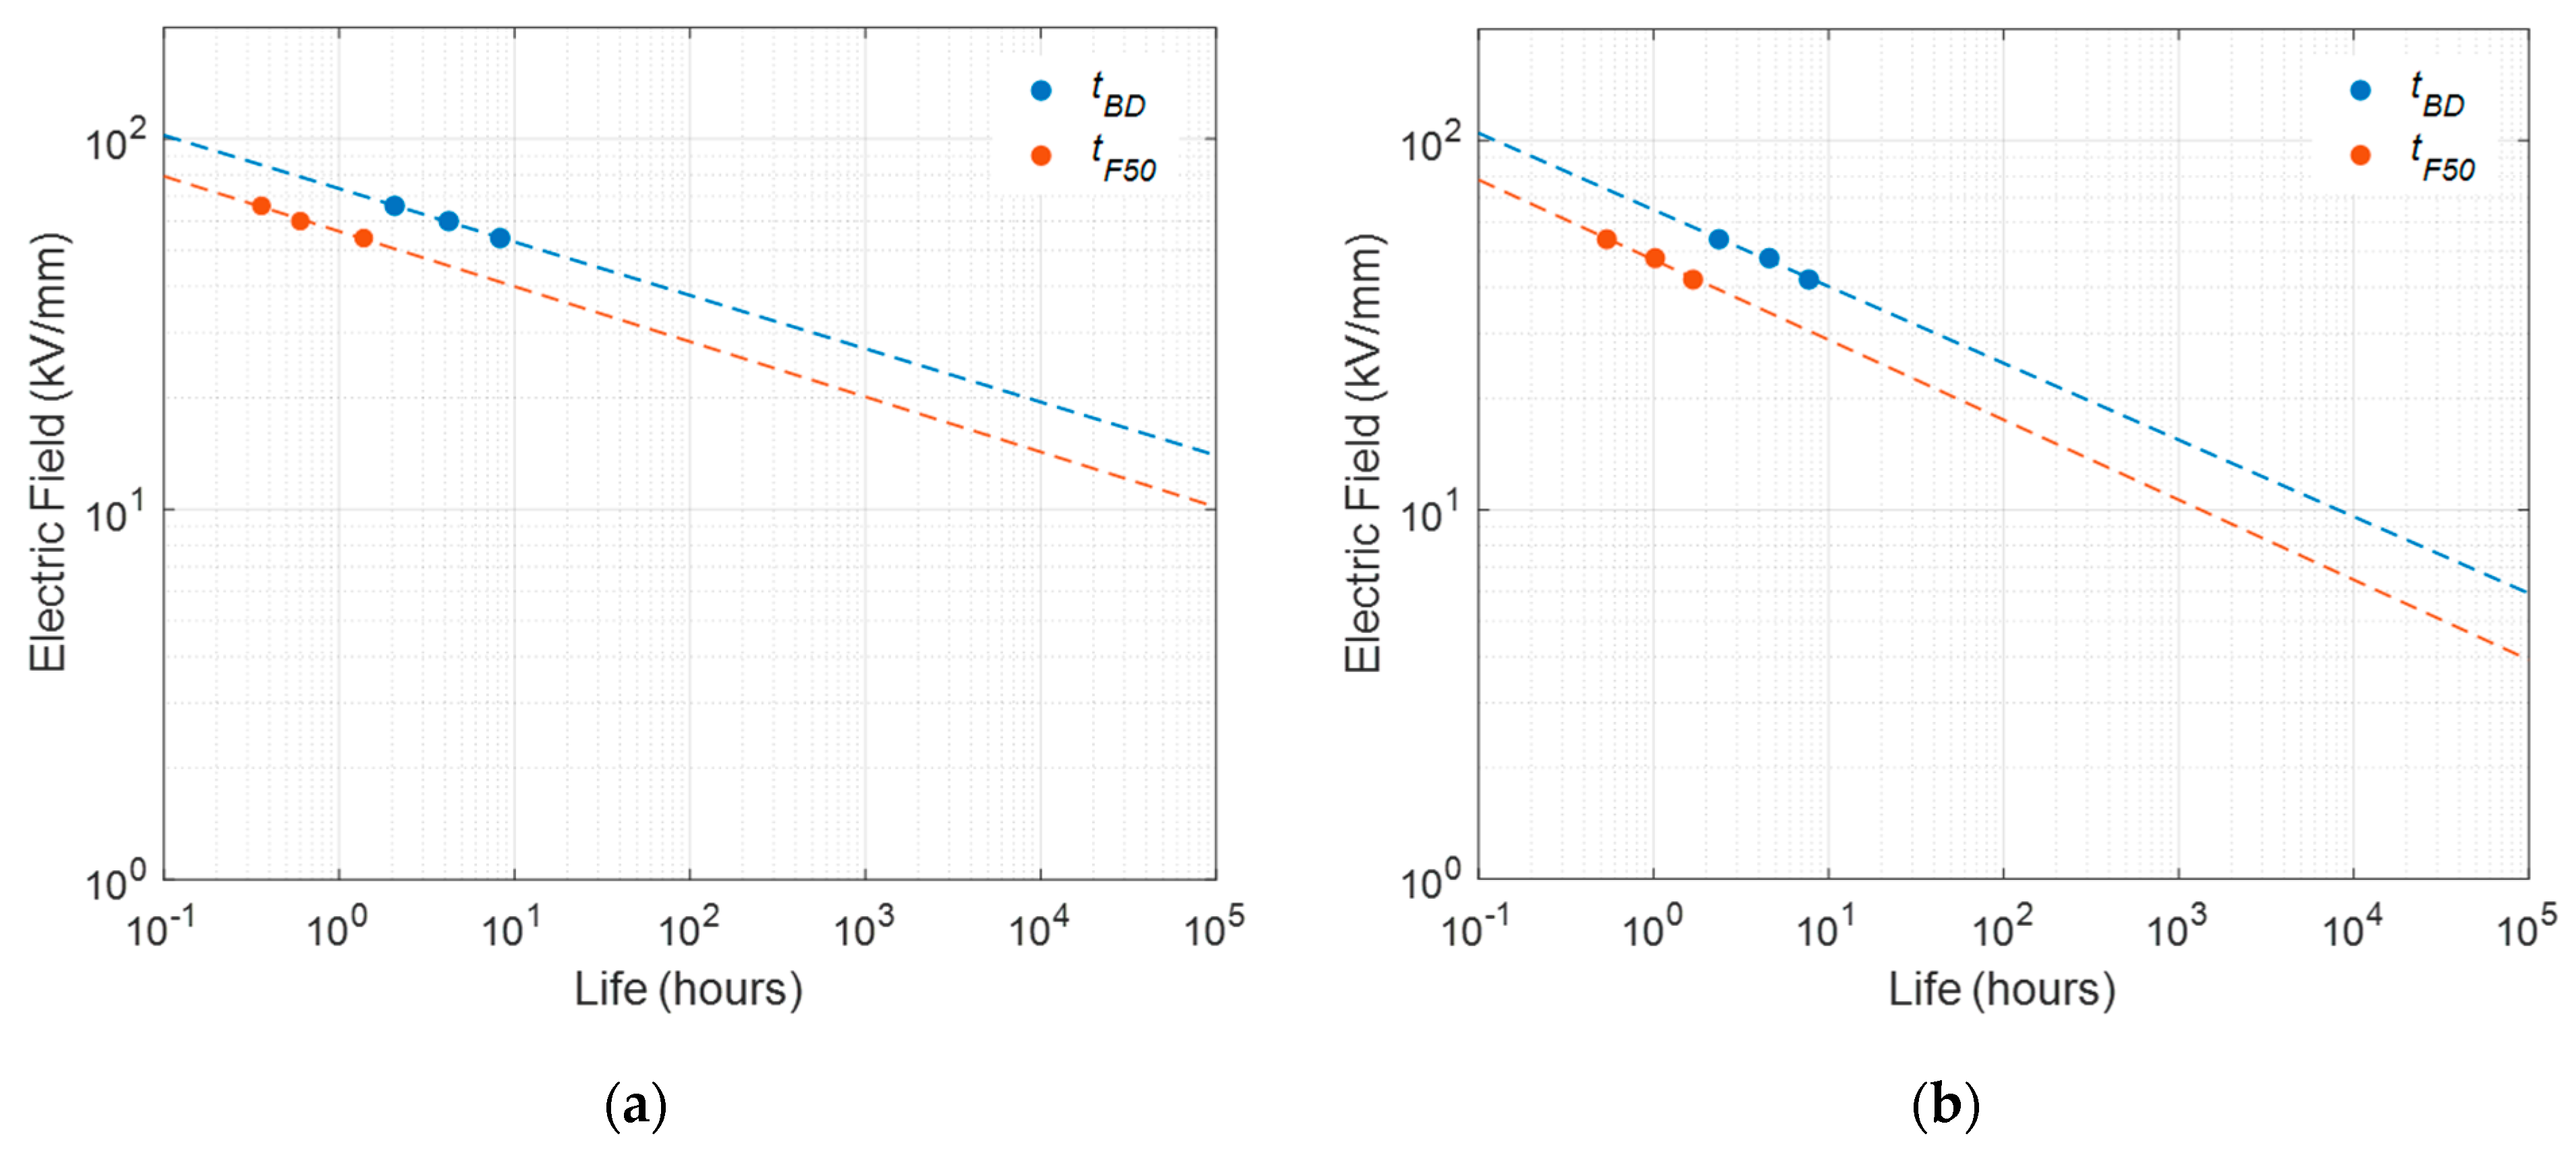
| Time to 50% erosion depth increment (tF50) | 6.7 | 7.1 | 7.3 |
| Breakdown time (tBD) | 6.9 | 7.2 | 7.5 |
| Failure Criterion Considered for Estimating Lifelines | Voltage Endurance Coefficient (n) of Kapton NCR | ||
|---|---|---|---|
| SAP | 0.5 bar | 0.2 bar | |
| Time to 50% erosion depth increment (tF50) | 4.6 | 5.1 | 5.5 |
| Breakdown time (tBD) | 4.8 | 5.1 | 5.4 |
| Pressure [bar] | Applied Voltage [kV] | Breakdown Time of Kapton NCR [hours] |
|---|---|---|
| 1 (SAP) | 2.1 kV (3.5 PDIV SAP) | 7.7 |
| 0.5 | 2.1 kV (3.5 PDIV SAP ≈ 4.66 PDIV at 0.5 bar) | 3.0 |
| 0.2 | 2.1 kV (3.5 PDIV SAP ≈ 6.36 PDIV at 0.2 bar) | 1.8 |
Disclaimer/Publisher’s Note: The statements, opinions and data contained in all publications are solely those of the individual author(s) and contributor(s) and not of MDPI and/or the editor(s). MDPI and/or the editor(s) disclaim responsibility for any injury to people or property resulting from any ideas, methods, instructions or products referred to in the content. |
© 2025 by the authors. Licensee MDPI, Basel, Switzerland. This article is an open access article distributed under the terms and conditions of the Creative Commons Attribution (CC BY) license (https://creativecommons.org/licenses/by/4.0/).
Share and Cite
Montanari, G.C.; Myneni, S.B. Operation at Reduced Atmospheric Pressure and Concept of Reliability Redundancy for Optimized Design of Insulation Systems. Energies 2025, 18, 2371. https://doi.org/10.3390/en18092371
Montanari GC, Myneni SB. Operation at Reduced Atmospheric Pressure and Concept of Reliability Redundancy for Optimized Design of Insulation Systems. Energies. 2025; 18(9):2371. https://doi.org/10.3390/en18092371
Chicago/Turabian StyleMontanari, Gian Carlo, and Sukesh Babu Myneni. 2025. "Operation at Reduced Atmospheric Pressure and Concept of Reliability Redundancy for Optimized Design of Insulation Systems" Energies 18, no. 9: 2371. https://doi.org/10.3390/en18092371
APA StyleMontanari, G. C., & Myneni, S. B. (2025). Operation at Reduced Atmospheric Pressure and Concept of Reliability Redundancy for Optimized Design of Insulation Systems. Energies, 18(9), 2371. https://doi.org/10.3390/en18092371