Article

Pyrolysis Characterization of Simulated Radioactive Solid Waste: Pyrolysis Behavior, Kinetics, and Product Distribution

1
Hainan Nuclear Power Co., Ltd., Changjiang 572700, China
2
State Key Laboratory of Clean Energy Utilization, Zhejiang University, Hangzhou 310027, China
3
Southwestern Institute of Physics, Chengdu 610041, China
4
Qingshanhu Energy Research Center, Zhejiang University, 1699 Dayuan Road, Qingshanhu Science and Technology City, Hangzhou 311305, China
*
Authors to whom correspondence should be addressed.
Energies 2025, 18(9), 2341; https://doi.org/10.3390/en18092341
Submission received: 2 April 2025 / Revised: 26 April 2025 / Accepted: 27 April 2025 / Published: 3 May 2025

Abstract

:
The disposal of low-level and intermediate-level radioactive solid waste has aroused widespread concern. In this work, the pyrolysis characterizations of simulated radioactive solid waste, cotton gloves (CG), stain removal cloths (SRC), plastic bags (PB), shoe covers (SC), and ion exchange resins (IER), were analyzed using thermogravimetric analysis, Thermogravimetric–Fourier Transform Infrared Spectrometry–Mass Spectrometry (TG-FTIR-MS) and Pyrolysis-Gas Chromatography/Mass Spectrometry (Py-GC/MS). The main mass loss stages of CG, SRC, PB, SC, and IER were 240–500 °C, 210–500 °C, 400–550 °C, 180–610 °C, and 25–700 °C, respectively. The average activation energies calculated by three iso-conversional methods were 184.09–211.46 kJ/mol, 172.33–180.85 kJ/mol, 264.63–268.01 kJ/mol, 150.49–184.36 kJ/mol, and 150.72–151.66 kJ/mol, respectively. Pyrolysis of CG and SRC mainly produced CO2 and oxygenated compounds. SC generated large amounts of HCl during pyrolysis. Combined with rapid pyrolysis analysis, it was shown that CG and SRC mainly produced carbohydrates, aliphatic hydrocarbons, and aromatics. The pyrolysis products of SC mainly consisted of aliphatic hydrocarbons, aromatics, and acids. The pyrolysis products of PB were mainly olefins and alcohols. IER produced large amounts of aromatics during rapid pyrolysis. Specifically, the pyrolysis of IER generated some SO2. This work provides a theoretical basis and data support for the treatment of mixed combustible radioactive waste.

1. Introduction

With the rapid development of nuclear technology, the world’s installed nuclear power scale and power generation capacity have grown steadily. According to statistics, there are 439 nuclear power reactors in operation worldwide as of March 2022, of which 67% have a lifespan of more than 30 years [1]. The development and utilization of nuclear energy have brought enormous benefits to mankind. However, along with the operation, maintenance, and decommissioning of nuclear power plants, the amount of radioactive solid waste (RSW) generated is increasing by the day. Improper disposal of RSW causes great harm to the surrounding environment and human health. Low-level and intermediate-level radioactive solid waste (LLRSW, ILRSW) accounts for more than 95% of the total amount of RSW [2]. LLRSW and ILRSW generated by nuclear power plants include waste resin, waste protective equipment, waste plastics, waste paper, waste cloth, rubber, and so on. The problem of efficient volume reduction of these RSW has long plagued the sustainable development of nuclear power plants. Therefore, how to further reduce and harmlessly treat such waste has become an urgent problem to be solved.
Incineration is one of the most effective ways for volume reduction. Despite advances in modern incineration technologies incorporating sophisticated gas control and filtration systems, incineration of disposed plastics and rubber still generates toxic gases such as dioxins and furans [3]. Compared with traditional incineration, pyrolysis and plasma melting technologies help to reduce the potential hazards of RSW to the environment and human health. The RSW pyrolysis-incineration technology independently developed by the China Institute for Radiation Protection (CIRP) has been in operation in China for more than 20 years, and has processed a large amount of LLRSW, which is characterized by high purification efficiency, good volume reduction, and excellent nuclide control [4]. Wang et al. [5] demonstrated that the addition of ZrO2 (1 wt.%) resulted in the negligible migration of Co/Sr and a more than 50% reduction in Cs during pyrolysis gasification of LLRSW, such as plastics and gloves. Matsuda et al. [6] carried out research work on waste ion exchange resins using a quartz tube furnace and concluded that pyrolysis was one of the more stable and effective methods for reducing the amount of radioactive waste. Plasma melting technology has the characteristics of volume reduction, inorganization, and stable radioactivity containment, which can safely, economically, and rapidly treat LLRSW and ILRSW. It has now become the main research direction of radioactive waste disposal, and has excellent applicability to the radioactive waste of nuclear power plants with complex components [7,8,9]. Polyakov et al. [10] and Sampathraju and Mansuri [11] investigated the atmospheric pollutants generated by the plasma pyrolysis system, respectively. The results showed that the toxicity level of dioxins was effectively inhibited (0.014–0.02 ng TEQ/Nm3), and the concentrations of pollutants such as PM10 and total volatile organic compounds (VOCs) were well within permissible limits. Also, there was no problem with the operation and maintenance of the plasma biomedical waste treatment system.
In a plasma melting system, the organic substances in the disposed waste are first decomposed and gasified at high temperatures to produce combustible gases [12,13,14]. Therefore, it is necessary to investigate the pyrolysis characteristics of disposed waste. The exploration of pyrolysis characteristics of solid waste contributes to an in-depth understanding of the decomposition process of waste and the generation mechanism of products [15,16,17,18,19,20]. It provides a theoretical basis for the modeling and optimization of the pyrolysis process, which is of guiding significance for the improvement of equipment design and the efficient recycling of waste. At present, Thermogravimetric–Fourier Transform Infrared Spectrometry–Mass Spectrometry (TG-FTIR-MS) has been widely used to study the pyrolysis characteristics of various materials and to analyze the gas precipitation during thermal degradation. Pyrolysis-Gas Chromatography/Mass Spectrometry (Py-GC/MS) has also been successfully used for the identification and quantification of volatile products (especially high molar mass VOCs) from biomass pyrolysis. Before plasma treatment, Pancholi et al. [3] analyzed the pyrolysis mechanism of simulated LLRSW (cellulose, rubber, plastics, and mixtures) under argon and oxygen environments by Thermo Gravimetric and Evolved Gas Analysis (TG-EGA). They also studied waste volume and weight reduction via simulated pyrolysis in a laboratory resistance furnace. The above work laid a foundation for engineering-scale plasma pyrolysis incineration testing and provided valuable insights for future large-scale plasma system development. Huang et al. [21] investigated the rapid pyrolysis behavior of mushroom bran and corn stover, typical high-nitrogen and high-ash biomass materials, by TG-FTIR and Py-GC/MS under high heat-up rate conditions, which provided detailed pyrolysis characterization for the effective utilization of such biomass.
The study of pyrolysis kinetics is crucial for understanding the thermal decomposition process of organic waste. It provides a theoretical foundation for optimizing the design and operation of subsequent reaction systems, such as gasification and combustion processes, as well as key operational parameters like temperature control, residence time, and heat transfer efficiency, all of which are critical for improving the overall efficiency and sustainability of waste-to-energy conversion [22,23,24,25,26,27]. Ullah et al. [27] investigated the pyrolysis synergies, product release behavior, and pyrolysis reaction kinetics of plastics, biomass, and their blends using TG-FTIR-MS and kinetic modeling (Friedman, KAS). This work gave a comprehensive understanding of the pyrolysis process of typical medical waste components, which helped to develop a targeted pyrolysis strategy. Aboulkas et al. [26] determined the thermal degradation kinetics of high-density polyethylene (HDPE), low-density polyethylene (LDPE), and polypropylene (PP) at four heating rates (2, 10, 20, and 50 K/min), and applied the Coats–Redfern and Criado methods in an attempt to determine a model for the pyrolysis reaction of thermoplastics. This work contributed to the subsequent development of the recycling of polymers such as thermoplastics on an industrial scale.
In China, there is still no practical engineering application of plasma high-temperature melting technology in the field of nuclear power generation, although relatively mature pilot demonstration projects on the disposal of solid waste by plasma technology have appeared gradually [28,29,30,31,32]. Therefore, collecting clean simulated RSW from actual nuclear power plants and investigating its pyrolysis behaviors are of great significance in realizing the application of plasma high-temperature melting technology in the field of nuclear solid waste disposal. In view of the limited research on the pyrolysis of LLRSW and ILRSW in typical nuclear power plants, after clarifying the actual compositions of LLRSW and ILRSW from current nuclear power plants, cotton gloves (CG), stain removal cloths (SRC), plastic bags (PB), shoe covers (SC), and ion exchange resins (IER), which are used in the operation and maintenance of a typical nuclear power plant in China, were collected as simulated RSW to explore and compare the thermal decomposition process and pyrolysis products evolution using thermogravimetric analysis and TG-FTIR-MS in this work. The apparent activation energies of the pyrolysis reactions of CG, SRC, PB, SC, and IER were calculated through Flynn–Wall–Ozawa (FWO), Kissinger–Akahira–Sunose (KAS), and Friedman methods. In addition, the product distribution characteristics of CG, SRC, PB, SC, and IER under rapid pyrolysis were investigated by Py-GC/MS. This work provides a comprehensive understanding of the pyrolysis characteristics of typical LLRSW and ILRSW. The experimental results provide basic pyrolysis kinetic analysis and product distribution characteristics, which provide basic data support for the subsequent studies on the product distribution of simulated RSW in the pyrolysis and gasification process, as well as a scientific basis for the optimization of plasma high-temperature melting systems and other high-temperature processing systems. Furthermore, the characterization of the pyrolysis of individual waste components is conducive to guiding the adjustment of working conditions of the RSW disposal system, as well as the adjustment of waste types and ratios. This lays the foundation for accelerating the practical application of plasma high-temperature melting technology in nuclear power generation and developing large-scale mixed combustible RSW disposal technologies.

2. Materials and Methods

2.1. Raw Materials

CG, SRC, PB, SC, and IER used in this work were obtained from Chengdu, Sichuan Province, China. The IER samples were in the form of particles with a small particle size. The remaining four samples, except for IER, were first coarsely crushed to a particle size of 10–100 mm, and then crushed to a particle size of 0.2–1 mm by liquid nitrogen. The four crushed samples obtained were dried in an oven at 105 °C for 12 h and finally presented in granular or flocculent form. Photos of the five materials are shown in Figure S1.

2.2. Thermogravimetric Analysis

Thermogravimetric analysis can be used to observe the process of mass change in materials with temperature or time, as well as to test the thermal stability. The mass loss (TG) curve and its derivative curve (DTG) allow further investigation of the kinetics of the reaction process. In this work, a STA-7200 thermogravimetric analyzer (HITACHI, Tokyo, Japan) was used to heat CG, SRC, PB, SC, and IER (about 5 mg) at three different heating rates (5, 10, and 20 K/min) from ambient temperature to 900 °C. The protective gas was a 100 mL/min flow of pure nitrogen. Usually, TGA does not reckon with the conditions in commercial pyrolysis units, so the data obtained from these experiments only provide fundamental insights rather than serve as direct guidance for commercial applications.

2.3. TG-FTIR-MS Analysis

The TG-FTIR-MS experiments were carried out using a thermogravimetric analyzer-Fourier Transform Infrared Spectroscopy–Mass Spectrometer (TGA8000–Frontier–Clarus SQ 8T, Perkin Elmer, Waltham, MA, USA). In this work, CG, SRC, PB, SC, and IER (about 5 mg) were heated from ambient temperature to 1000 °C in a nitrogen atmosphere at a heating rate of 10 K/min, respectively. The gaseous products of the thermogravimetric analyzer went first to FTIR and then to MS. The connecting pipes between the three instruments were maintained at 250 °C. FTIR identifies the functional groups contained in the compounds based on the major characteristic peaks and is used to qualitatively analyze the functional groups of the gases escaping from the pyrolysis process of materials. The measured spectrum ranges from 4000 to 400 cm−1. The full-scan mode of MS is used to identify m/z between 0 and 450 and to track their changes with temperature or time. The volatile components released from each material at different levels of pyrolysis were obtained in real time by TG-FTIR-MS.

2.4. Py-GC/MS Analysis

The instrument used was from the State Key Laboratory of Clean Energy Utilization Instrumental Analysis Center. A Py-GC/MS (PY-3030D/Trace3000/ISQ 7000, Thermo Fisher Scientific, Waltham, MA, USA) was used for semi-quantitative online analysis of organic compounds produced by CG, SRC, PB, SC, and IER during rapid pyrolysis. An appropriate amount of material (about 0.2 mg) was placed in the sample cup for each experiment. The pyrolysis atmosphere was high-purity argon (99.99%). The pyrolysis experiments were carried out at 800 °C for 30 s. Subsequently, the generated pyrolysis products were purged into the GC/MS for detection and analysis. GC/MS was set up as follows: the initial temperature was 40 °C and held for 3 min, then GC/MS was heated up to 240 °C at a heating rate of 5 °C/min and held for 10 min. The temperature of the transfer line for pyrolysis products and the injection valve was set to 250 °C. A DB-WAX capillary column (30 m × 0.25 mm × 0.25 μm) was used for chromatography. The split ratio was 1:100. A detection range of 35 to 650 was set for m/z. The products were matched according to the NIST spectral library. The ratio of the corresponding chromatographic peak area of each product to the total peak area was calculated, and the relative content of each product was expressed based on the peak area percentage.

3. Results and Discussion

3.1. Proximate and Ultimate Analysis

The proximate analysis of individual materials was carried out to acquire the content of moisture (M), ash, volatile matter (VM), and fixed carbon (FC). The ultimate analysis of individual materials was performed by an Elemental analyzer (Vario MAX cube, ELEMENTAR Company, Frankfurt, Germany). Cl is the total chlorine content in the combustible portion of the material as determined by oxygen bomb combustion-ion chromatography. The results of proximate analysis, ultimate analysis, and Cl of the raw materials are presented in Table 1, which provides basic data support for the subsequent pyrolysis characterization.

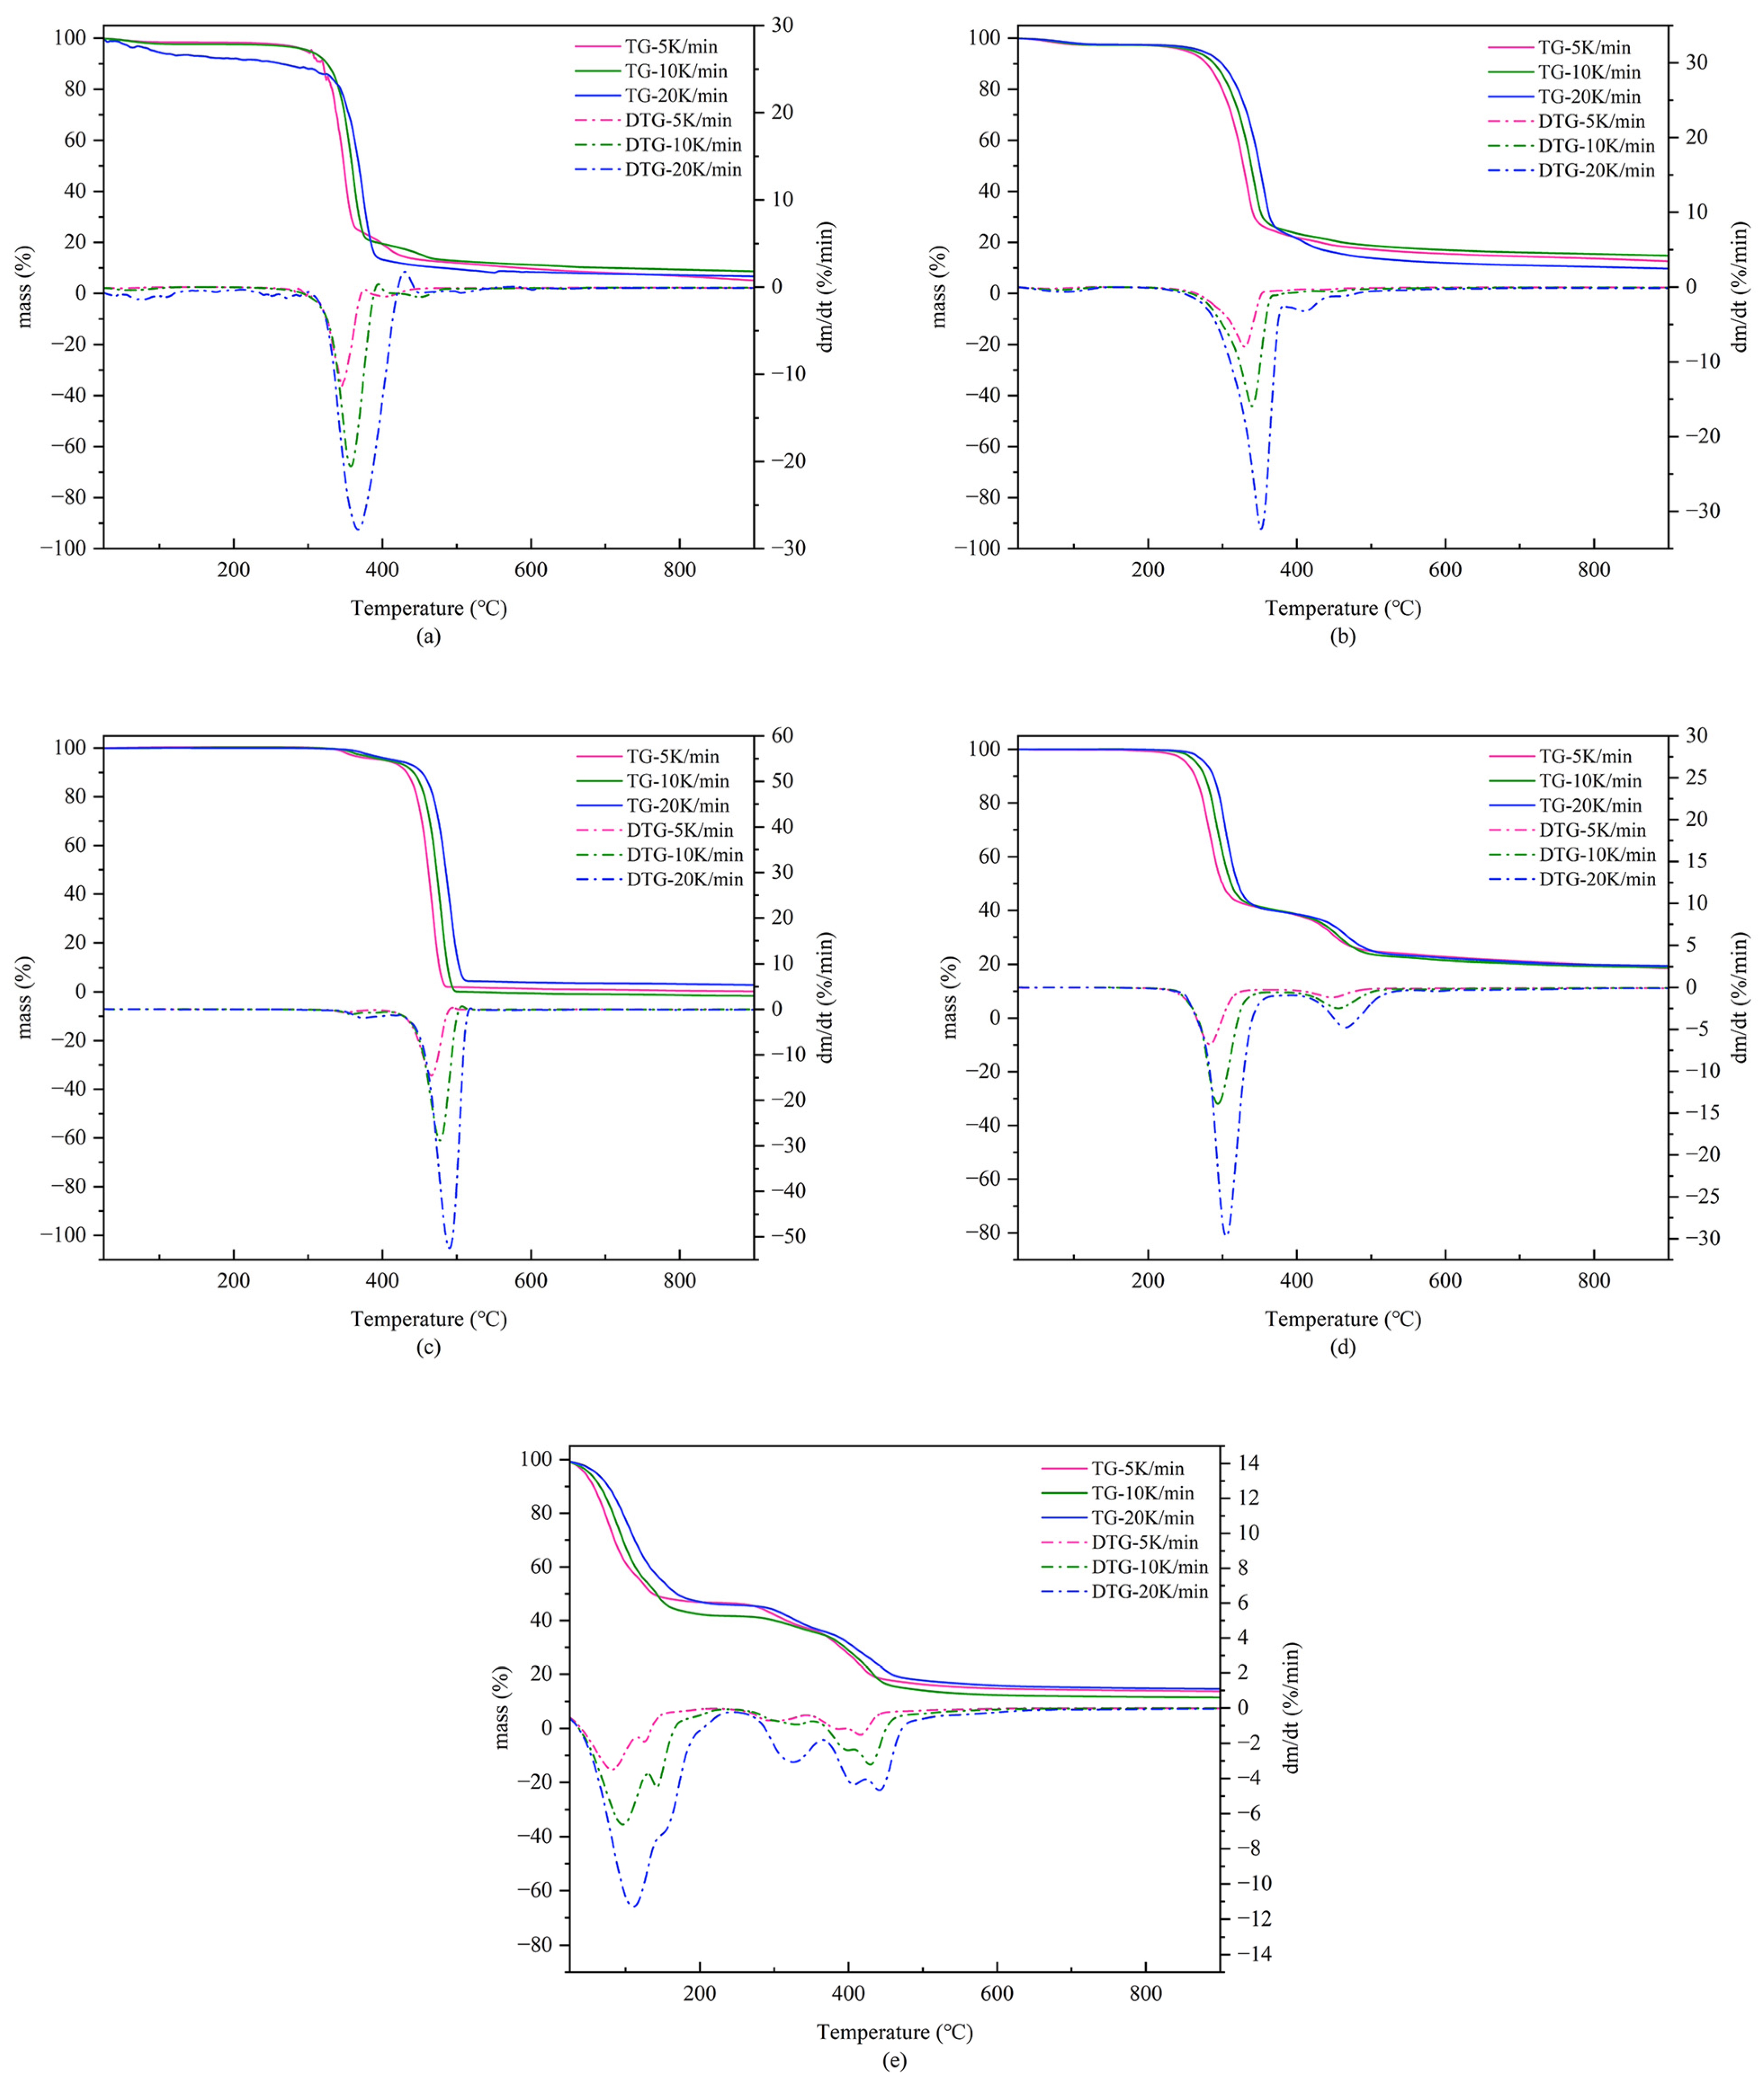
3.2. TG-DTG Analysis

As shown in Figure 1, the TG and DTG curves of five different materials, CG, SRC, PB, SC, and IER, were obtained from ambient temperature to 900 °C at the heating rates of 5 K/min, 10 K/min, and 20 K/min, respectively. Due to differences in chemical composition and molecular structure, the process of pyrolytic mass loss varies considerably between different classes of materials. In the subsequent FTIR and MS analyses, the specific reaction processes of the mass loss stages were analyzed.
CG and SRC belong to the biomass category of samples, and the main mass loss temperature intervals are 240–500 °C and 210–500 °C, respectively, which correspond to the decomposition temperatures of cellulose and hemicellulose [33,34]. The final residue masses are all around 10%, with mass losses of 90% and 85%. At three different heating rates, the maximum mass loss rates of CG and SRC are 1.00 mg/min, 2.66 mg/min, and 3.98 mg/min and 0.88 mg/min, 1.70 mg/min, and 2.57 mg/min, respectively.
PB is a low-chlorine (Cl) content type of plastic with high thermal stability, and the main mass loss interval is 400–550 °C, with a mass loss of approximately 95%. This is due to the pyrolysis of its main component, HDPE, which follows the mechanism of random cracking and end-chain cracking to generate a large amount of volatile matter [35]. Because of the high volatility in PB, which is over 96%, the residue mass can be ignored. The maximum mass loss rates of PB at different heating rates are 0.84 mg/min, 1.78 mg/min, and 3.51 mg/min, respectively.
SC is a high Cl content type of plastic, and its TG-DTG curve is basically the same as that of polyvinyl chloride (PVC)-like substances, which can be mainly divided into two stages [36]. Between 180 and 360 °C, the pyrolysis of SC produces a large amount of HCl, which in turn forms a conjugated olefin structure, causing the first step of mass loss. Between 370 and 610 °C, the conjugated olefin chain is cleaved, and intramolecular cyclization occurs, resulting in the formation of a variety of aromatic and aliphatic small molecule compounds and the formation of high carbon residues, resulting in the second step of mass loss in SC [37]. The mass losses of SC occurring in the above two stages are 60% and 20%, respectively, and the residue mass is within 20%. At different heating rates, the maximum mass loss rates are 1.27 mg/min, 2.50 mg/min, and 5.26 mg/min and 0.24 mg/min, 0.45 mg/min, and 0.84 mg/min for stage I and stage II, correspondingly.
IER is a macromolecular polymer with a three-dimensional network structure composed of styrene monomer crosslinked with divinylbenzene and has high water content [38]. The TG curves of IER are roughly divided into three stages, which are the combined water removal stage from 25 to 240 °C, the functional group thermal decomposition stage from 240 to 370 °C, and the base polymer thermal decomposition stage from 370 to 700 °C. The mass losses of IER in the three stages are 55%, 10%, and 20%, respectively [39,40]. And the final residue mass is around 15%. In the first stage, the maximum mass loss rates corresponding to three heating rates are 0.8 mg/min, 1.35 mg/min, and 1.81 mg/min. In the second stage, the maximum mass loss rates are 0.05 mg/min, 0.19 mg/min, and 0.49 mg/min, respectively. In the third stage, the maximum mass loss rates are 0.34 mg/min, 0.66 mg/min, and 0.75 mg/min, respectively.
Overall, SC generates a large amount of HCl in the first stage and shows weak stability. PB, on the other hand, has a more stable C-H chain structure compared with other materials, and has a strong thermal stability at high temperatures, resulting in a significantly higher pyrolysis temperature. Among the five materials, the pyrolysis temperature ranges of CG, SRC, SC, and IER are all wider than that of PB (400–550 °C), which makes it necessary to appropriately increase the residence time of the materials in this temperature interval for more adequate pyrolysis in actual engineering. In addition, the TG and DTG curves of all materials shift toward higher temperature regions as the heating rate increases. This is due to different heat transfer efficiencies caused by varying heating rates, leading to thermal hysteresis. A lower heating rate favors sufficient reaction time for the materials, leading to more mass loss in pyrolysis. The peak of the DTG curve increases significantly with the increase in heating rate, but the shape of the TG curve does not change with the increase in heating rate. In other words, changing the heating rate does not change the pyrolysis reaction mechanism [41].

3.3. Pyrolysis Kinetics Analysis

In the kinetic analysis, three iso-conversional methods, FWO, KAS, and Friedman, were used to calculate the E values of CG, SRC, PB, SC, and IER. Kinetic study and the above three iso-conversional methods are introduced in the Supplementary Material [42,43,44,45,46,47]. Figure S2 shows the linear relationship between ln(β), ln ln(β/T2), ln(dα/dt), and 1/T at different heating rates. The fitting curves are basically parallel at different conversion rates, which proves that these models are reliable [48]. The E values and the correlation coefficient R2 are presented in Table 2. For CG, the R2 calculated by all three methods is above 0.9, but the R2 calculated by the FWO method is slightly higher, which suggests that the FWO method is more credible for studying the kinetic properties of CG. For SRC, R2 is greater than 0.95 for all conditions except for α = 0.9, indicating that all methods are applicable to study the kinetic properties of SRC. Among the five materials, the largest R2 was obtained when calculating the E values of PB, especially when using the FWO method. For SC, R2 ranges from 0.927–0.9999, 0.9194–0.9999, and 0.9485–0.9999, respectively, suggesting that the Friedman model is more suitable for the analysis. R2 of IER remains above 0.95 for both conversions below 0.6 and above 0.7. While at α = 0.6 and α = 0.7, the R2 values are lower, which may be due to the sudden increase in E values and the complexity of the reaction process. In general, reactions with high required E values are difficult to occur, and the E value is often used as a parameter to understand the reaction properties of fuels [49,50]. For CG, SRC, and IER, the E values show similar changes with the increase in conversion rate, corresponding to the reaction stages in the TG and DTG curves. According to the E values, the pyrolysis process of CG can be roughly divided into two stages: stage I (α = 0.1–0.3), temperature ranges from 310 to 340 °C, represents the decomposition of small extractives and hemicellulose; stage II (α = 0.3–0.9), temperature ranges from 340 to 370 °C, represents the pyrolysis of cellulose components. SRC can also be divided into two stages because of the similar components. Stage I (α = 0.1–0.6), temperature ranges from 270 to 330 °C, represents the decomposition of small extractives and hemicellulose; Stage II (α = 0.6–0.8), temperature ranges from 330 to 415 °C, represents the pyrolysis of cellulose components. However, IER should be divided into three stages: stage I (α = 0.1–0.4), stage II (α = 0.4–0.7), and stage III (α = 0.7–0.9), and the corresponding temperature ranges are 50–100 °C, 100–360 °C, and 360–430 °C, representing the evaporation of moisture and decomposition of functional groups and base polymers. The E values of PB calculated by the FWO and KAS methods decrease with an increasing conversion rate, and the E values of the SC obtained increase with an increasing conversion rate. However, when using the Friedman method, the E values of PB and SC fluctuate in the range of 239.11–297.56 kJ/mol and 118.02–309.83 kJ/mol, respectively. Overall, the pyrolysis process of PB and SC can both be regarded as one stage. When conversion degree α varies from 0.1 to 0.9, the corresponding temperature ranges from 430 to 480 °C and 240 to 460 °C, respectively. The cracking of HDPE produces a large number of small molecules, causing a decrease in E values for PB. However, SC experiences two main reactions during pyrolysis, the formation of HCl and conjugated olefin structure and the cleavage of conjugated olefins, which makes the reaction harder to happen. For PB and IER, the differences in the average E values calculated by the three methods are small, which ensures the credibility of calculations [51]. For CG, SRC, and SC, the E values calculated by the Friedman model are significantly higher than the others. The difference between the E values is due to the approximation and calculation of the temperature integral used to solve the model-free method [50].

3.4. TG-FTIR-MS Analysis

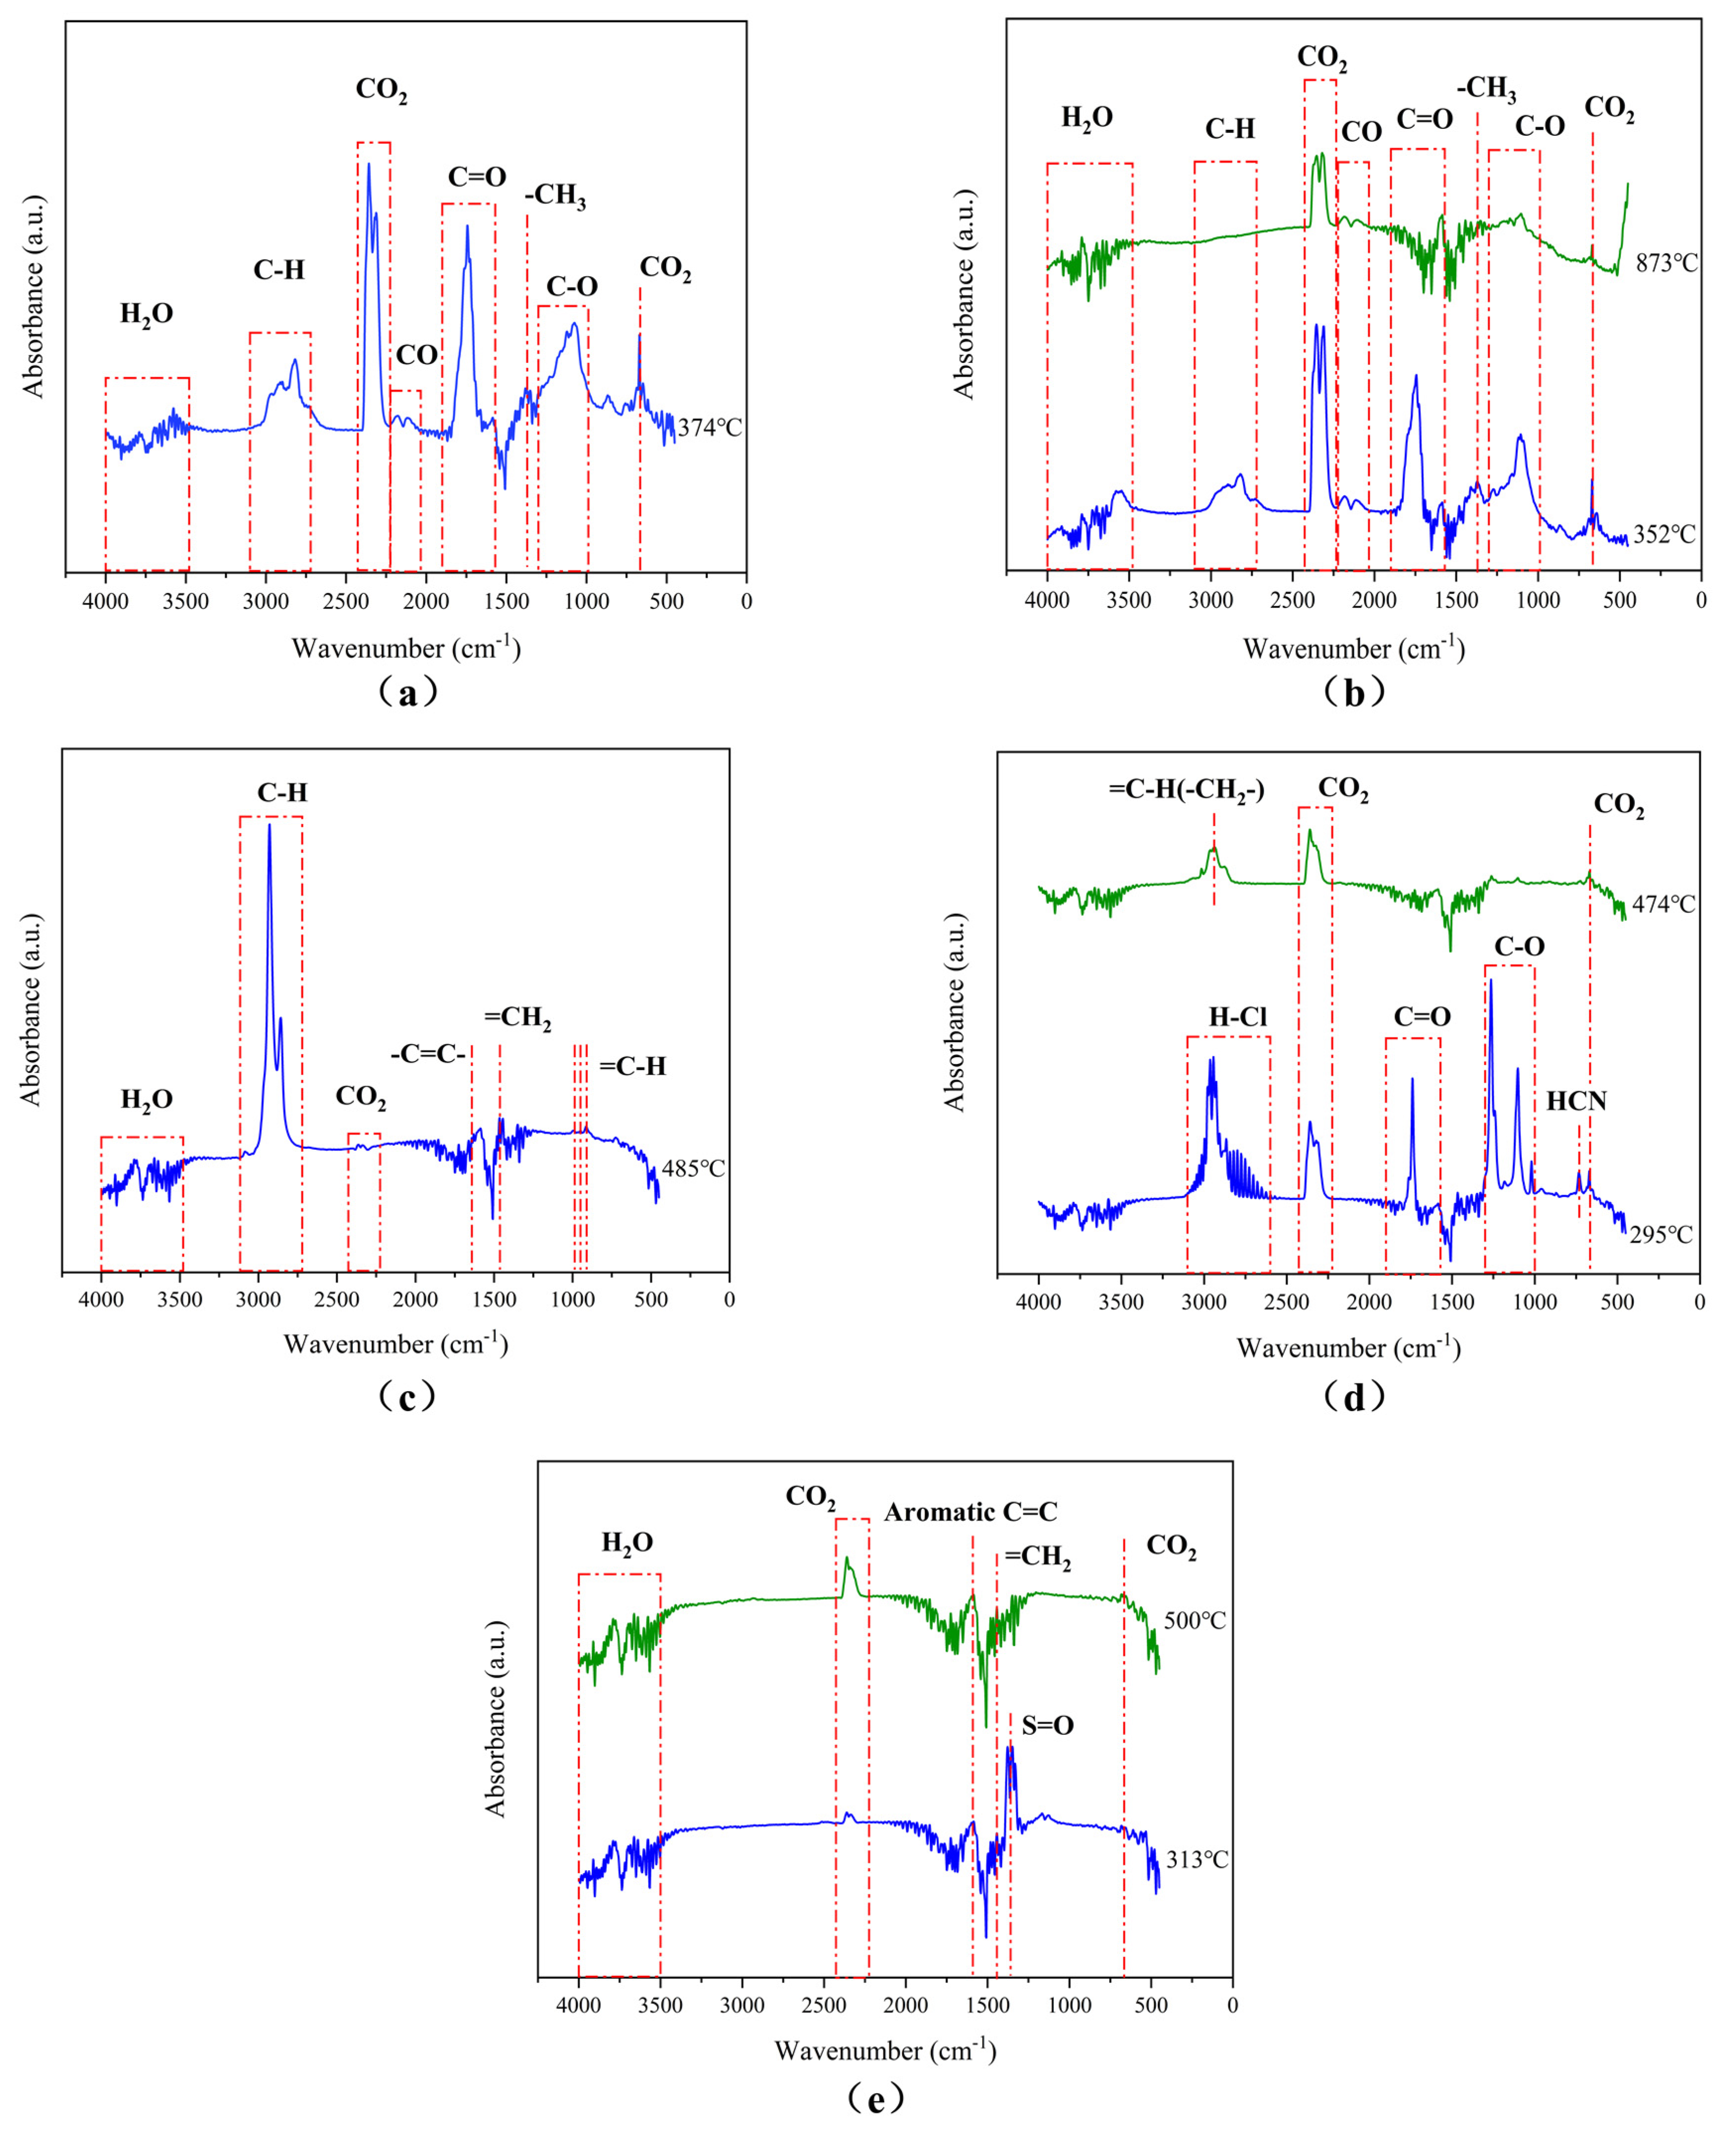
3.4.1. FTIR Analysis
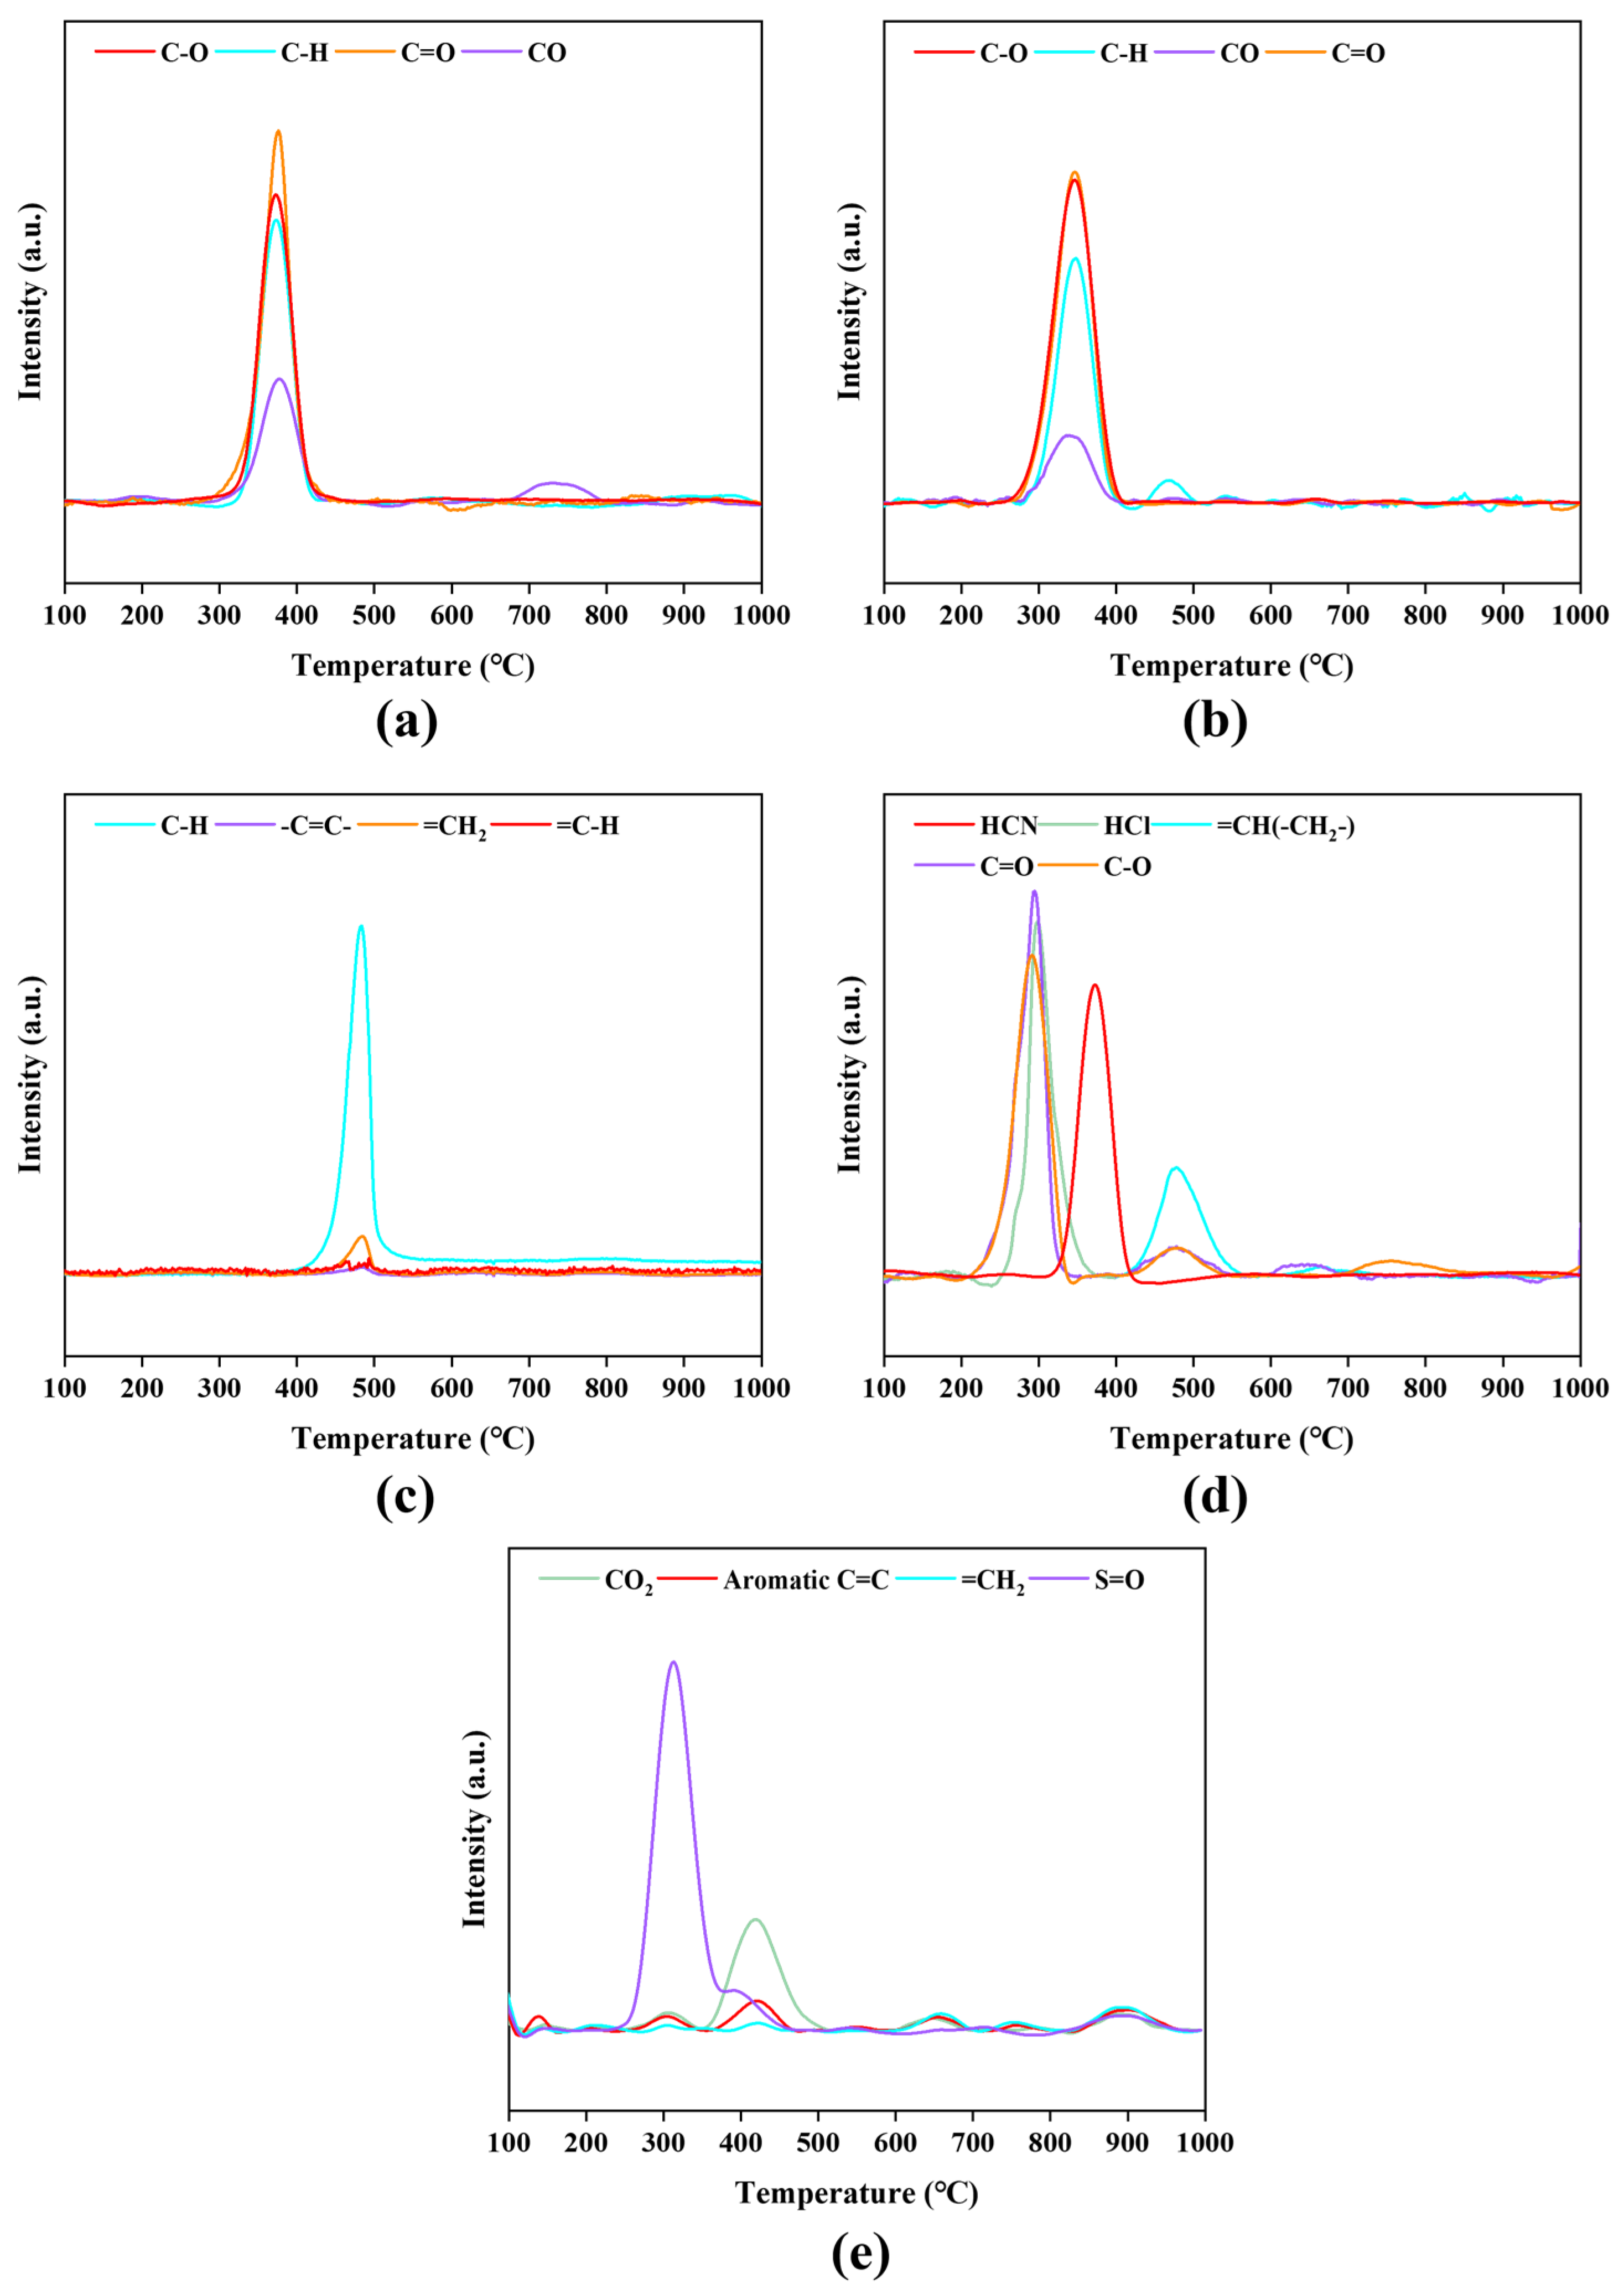
The 2DFTIR spectra of the gaseous products released during the pyrolysis of the five materials at different temperatures are shown in Figure 2. The temperatures were selected from those near the peak of the DTG curves of the individual materials. According to Lambert–Beer law, the absorbance of specific wavelengths in the FTIR spectrum is linearly related to the gas concentration [52]. Therefore, the change in absorbance of the main gas products during pyrolysis of the material reflects the change in product concentration.
As can be seen from the peaks in the range of 4000–3500 cm−1 in Figure 2a,b, a small amount of H2O is volatilized at this stage, which may come from the crystalline water in the samples or from the cleavage reaction of the organic matter. There are distinct peaks in the range 3100–2750 cm−1 and at wave number 1370 cm−1, corresponding to the C-H stretching vibration in hydrocarbons and the -CH3 distortion vibration in alkanes, respectively [53,54]. Characteristic peaks at wave numbers 2400–2200 cm−1 and 665 cm−1 are CO2 [55]. CO2 probably arises from decarboxylation of carbonyl (-C=O-) and carboxyl (-COOH) groups as well as secondary cleavage of aldehyde-containing intermediates (furans and furfural) at higher temperatures (200 to 800 °C) [56]. Under high temperature and anoxic conditions, a weak peak appears at 2230–2000 cm−1, corresponding to CO, probably due to the large amount of CO2 produced by pyrolysis and subsequent reductions by reaction with coke [55]. Characteristic peaks of C=O stretching vibrations are detected in the range of 1900–1600 cm−1, indicating the possible presence of esters, carboxylic acids, ketones, and aldehydes in the pyrolysis gas products [57]. Characteristic peaks of C-O stretching vibration are detected in the range of 1300–1000 cm−1, indicating the possible presence of ethers, alcohols, and phenols in pyrolysis gas products [57]. From the TG-FTIR results, it can be seen that in the main stage of pyrolysis, the pyrolysis products of CG and SRC are mainly CO2 and substances containing C=O and C-O functional groups. In addition, by comparing the pyrolysis products of SRC at 352 °C and at 873 °C, it is observed that in the late stage of pyrolysis, the concentration of pyrolysis products both decreases, and CO2 is the main pyrolysis product.
As can be seen from Figure 2c, PB mainly produces hydrocarbons during pyrolysis. The range of 1680–1600 cm−1 is telescopic vibration of -C=C-, and the range of 1000–860 cm−1 corresponds to non-planar wobbling vibration bands of =C-H [53]. Meanwhile, obvious peaks can be observed at wave numbers 2930 cm−1, 2850 cm−1, and 1460 cm−1. Therefore, it can be judged that the main component of PB is -CH2-, which is irregularly cracked during the pyrolysis process, mainly generating olefins [53]. Since the oxygen content of biomass-based materials is much higher than that of PB, PB pyrolysis produces less CO2 and oxygenated compounds. This is also in line with the results of previous works [57].
As can be seen in Figure 2d, the pyrolysis products of SC at the two rapid mass loss stages are very different. In the first rapid mass loss phase, the main reaction is the dehydrochlorination of PVC, with a very strong absorption band at wave numbers of 3100–2600 cm−1 corresponding to the asymmetric stretching of H-Cl [58]. The strong absorption peaks at wave numbers 1269 cm−1, 1018 cm−1, and 1110 cm−1 correspond to the stretching vibrations of C-O [59]. The peak at wave number 730 cm−1 is the characteristic peak of HCN [21]. It is shown that the pyrolysis products of SC at this stage mainly include HCl, CO2, HCN, and substances containing C=O and C-O functional groups. As the pyrolysis temperature increases, the content of HCl decreases gradually. The main reaction gradually changes to rearrangement and cyclization of the conjugated polyene [60]. In the second rapid mass loss stage, the absorption peak at wave number 2939 cm−1 corresponds to an asymmetric stretching vibration of =C-H(-CH2-) [58]. The pyrolysis products of SC at this stage are mainly hydrocarbons and CO2. SC contains more Cl, which is released mainly as HCl during the pyrolysis process. The oxygen content in SC is higher compared to low-Cl plastic-type materials, so the pyrolysis products contain more CO2 and oxygenated compounds. Unlike PVC, whose pyrolysis products are mainly HCl, alkenes, aromatic hydrocarbons, and a small number of chlorinated hydrocarbons, SC also produces some oxygenated compounds during the pyrolysis process. Comparison of the results of the ultimate analysis reveals that it is mainly due to the higher oxygen content and lower Cl content in SC [58].
In Figure 2e, the stretching vibration of S=O near wave number 1360 cm−1 indicates the release of SO2 [61]. Wave numbers 1495 cm−1 and 1590 cm−1 are stretching vibrations of aromatic C=C, and the weak absorption peak at wave number 1443 cm−1 corresponds to the shearing vibration of =CH2 [53]. IER has a high sulfur content. During pyrolysis, the sulfur is released mainly in the form of SO2. In addition, the pyrolysis products of IER in the rapid mass loss stage are CO2, hydrocarbons, and H2O.
Figure 3 shows the evolution of the relative intensity of typical functional groups with pyrolysis temperature. The evolution of the CO2 and H2O signals will be explicitly described in the subsequent MS Analysis Section and therefore will not be repeated here. In addition, when investigating the pyrolysis products of SC, the evolution of the HCl signal is not investigated after 400 °C (the temperature cut-off between the two pyrolysis stages of SC), and the evolution of =CH(-CH2-) is not investigated before 400 °C. As can be seen from Figure 3, the evolution of the infrared absorption relative intensities corresponds to the thermogravimetric analysis results of the five materials. The main active pyrolysis regions of CG, SRC, PB, SC, and IER are 300–420 °C, 290–410 °C, 400–520 °C, 200–590 °C, and 250–510 °C, respectively.

3.4.2. MS Analysis

FTIR can identify functional groups in pyrolysis products, but has limitations in distinguishing compounds with similar chemical structures and determining the specific types of products. MS can identify the mass-to-charge (m/z) signals of gases and detect the variation in ionic current intensity with temperature for substances of the same m/z online. Therefore, MS was combined with FTIR to more accurately identify substances generated during the pyrolysis of materials and to study the trend of their concentrations with temperature. Figure 4 shows the MS spectra of the main pyrolysis products of each material between 100 and 1000 °C at a heating rate of 10 K/min. The investigated m/z and their corresponding substances are CH4 (m/z = 16), H2O (m/z = 18), C2H6 (m/z = 30), HCl (m/z = 36), C3H5+ (m/z = 41), C3H7+/C2H3O+ (m/z = 43), CO2/C3H8 (m/z = 44), SO (m/z = 48), SO2 (m/z = 64), C6H6 (m/z = 78), and C7H8 (m/z = 92), respectively [27,54,62,63,64,65]. CO is not analyzed here since it coincides with the m/z of N2.
Methane CH4 is a typical product when polymer chains are randomly cut. As can be seen in Figure 4a, the starting point of IER is the highest, indicating that at this point, the polymer chains in IER have begun to break at random in large numbers. The curves of CG and SRC have a peak between 300 and 400 °C, which corresponds to the rapid pyrolytic mass loss of biomass-based materials at that stage. As the pyrolysis process proceeds, the organic macromolecules in various materials decrease, and CH4 emissions show a decreasing trend in general. That is, CH4 emissions decrease with increasing temperature.
In the early stages of pyrolysis, IER releases a large quantity of H2O, mainly from water adsorbed by the material. After that, the biomass-based materials produce the highest amount of H2O, which is also consistent with the results of proximate analysis. With the increase in pyrolysis temperature and the deepening of the pyrolysis degree of the materials, the curves of SRC, CG, and PB show obvious peaks, respectively, which may be attributed to the cleavage reaction of -OH-containing compounds in the high-temperature region [62].
The m/z = 30, 41, and 43 indicate that C2H6, C3H5+, and C3H7+/C2H3O+, mainly saturated hydrocarbons, unsaturated hydrocarbons, aldehydes, and alcohols, respectively, are formed from the materials during pyrolysis. A comparison with Figure 2 shows that the main temperature intervals of C2H6, C3H5+, and C3H7+/C2H3O+ formation are basically the same as the main mass loss temperature intervals for each material. A comparison of Figure 4c,e,f reveals that both biomass-based materials (CG, SRC) and PB produce a significant quantity of hydrocarbons during the pyrolysis. However, the pyrolysis products of PB contain more unsaturated hydrocarbons such as C3H5+ compared to CG and SRC, which is also consistent with the analysis of FTIR results. Figure 4d shows that SC produces a large amount of HCl (m/z = 36) during the pyrolysis. From Figure 4g, it can be seen that biomass-based materials release significantly more CO2 (m/z = 44) during pyrolysis than the remaining materials. The CO2 change curves of the five materials basically correspond to their mass loss processes. Between 700 and 800 °C, the CO2 emissions of CG, SRC, PB, SC, and IER all minimize with the gradual end of the pyrolysis. However, after 800 °C, the CO2 emissions all show an increasing trend again, which may be the result of the cracking and reforming of some high-carbon residues at high temperatures. A lot of SO (m/z = 48) and SO2 (m/z = 64) are detected in the pyrolysis products of IER, which is consistent with FTIR results. In addition, as can be seen from Figure 4j,k, unlike CG, SRC, and PB, IER produces a large number of aromatic compounds such as C6H6 (m/z = 78) and C7H8 (m/z = 92) during the pyrolysis. Except for C2H6, C3H5+, and C3H7+, the hydrocarbons produced by SC during pyrolysis also contain some aromatic compounds.

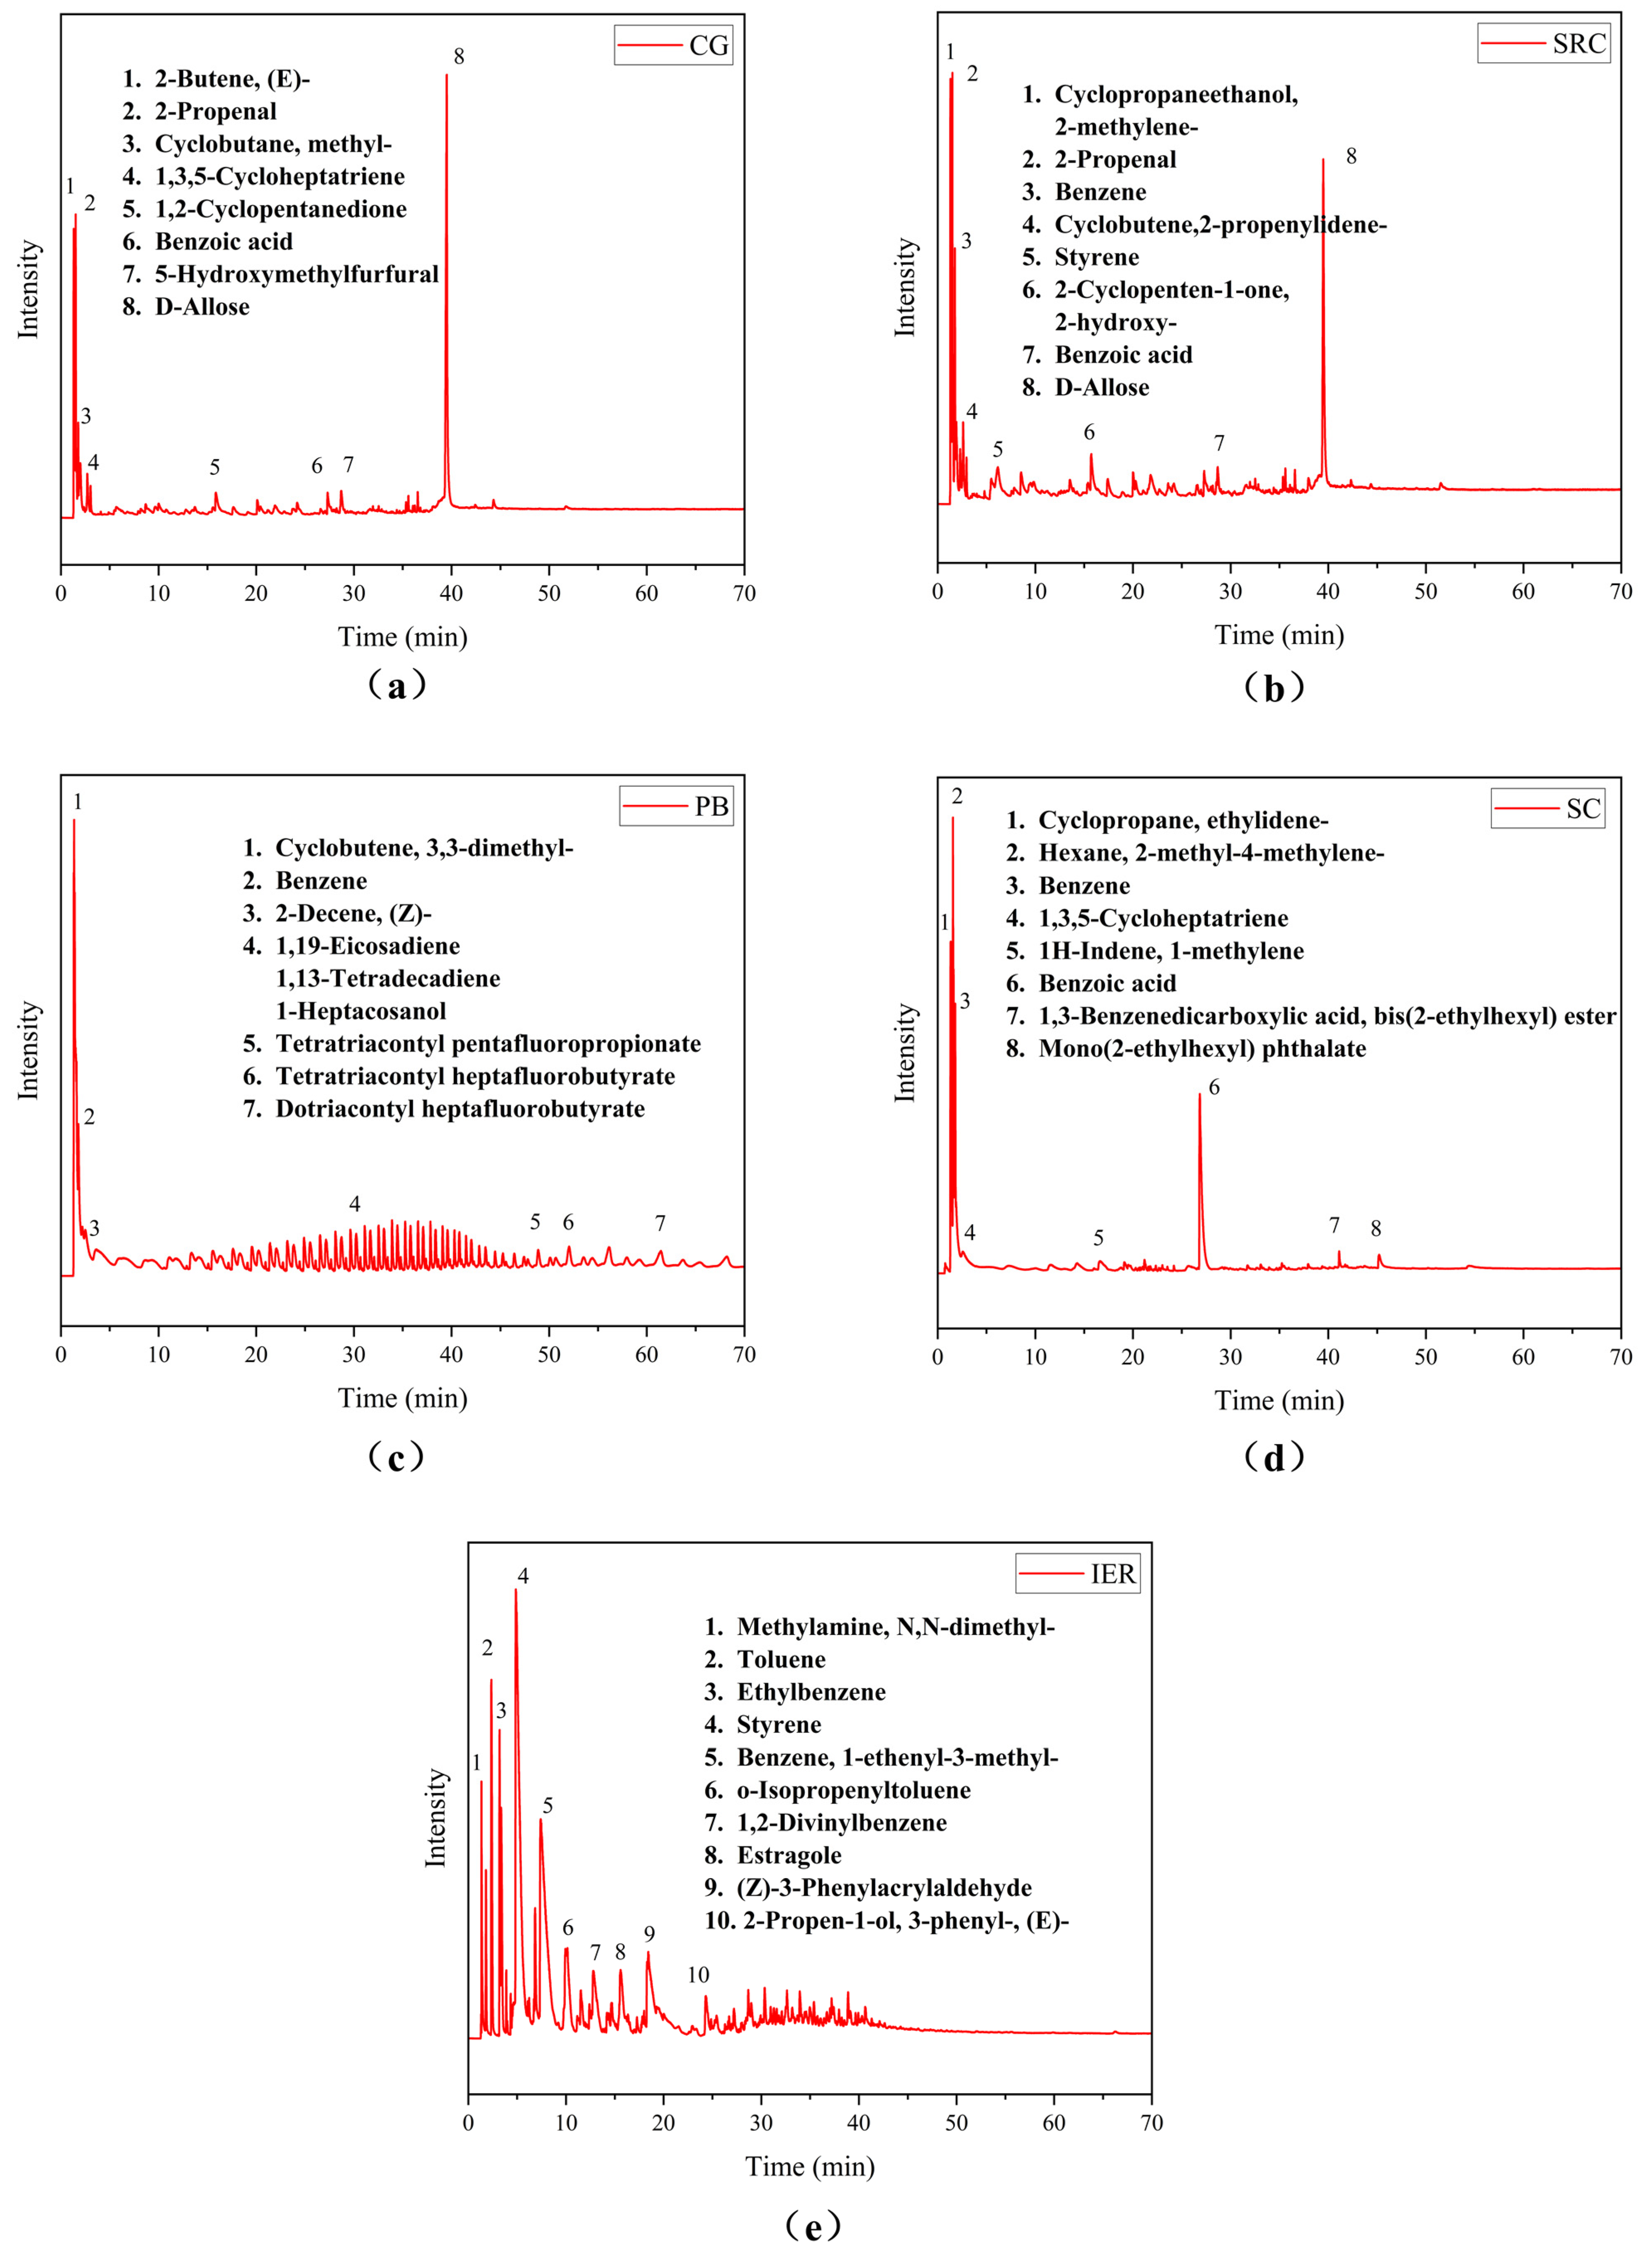
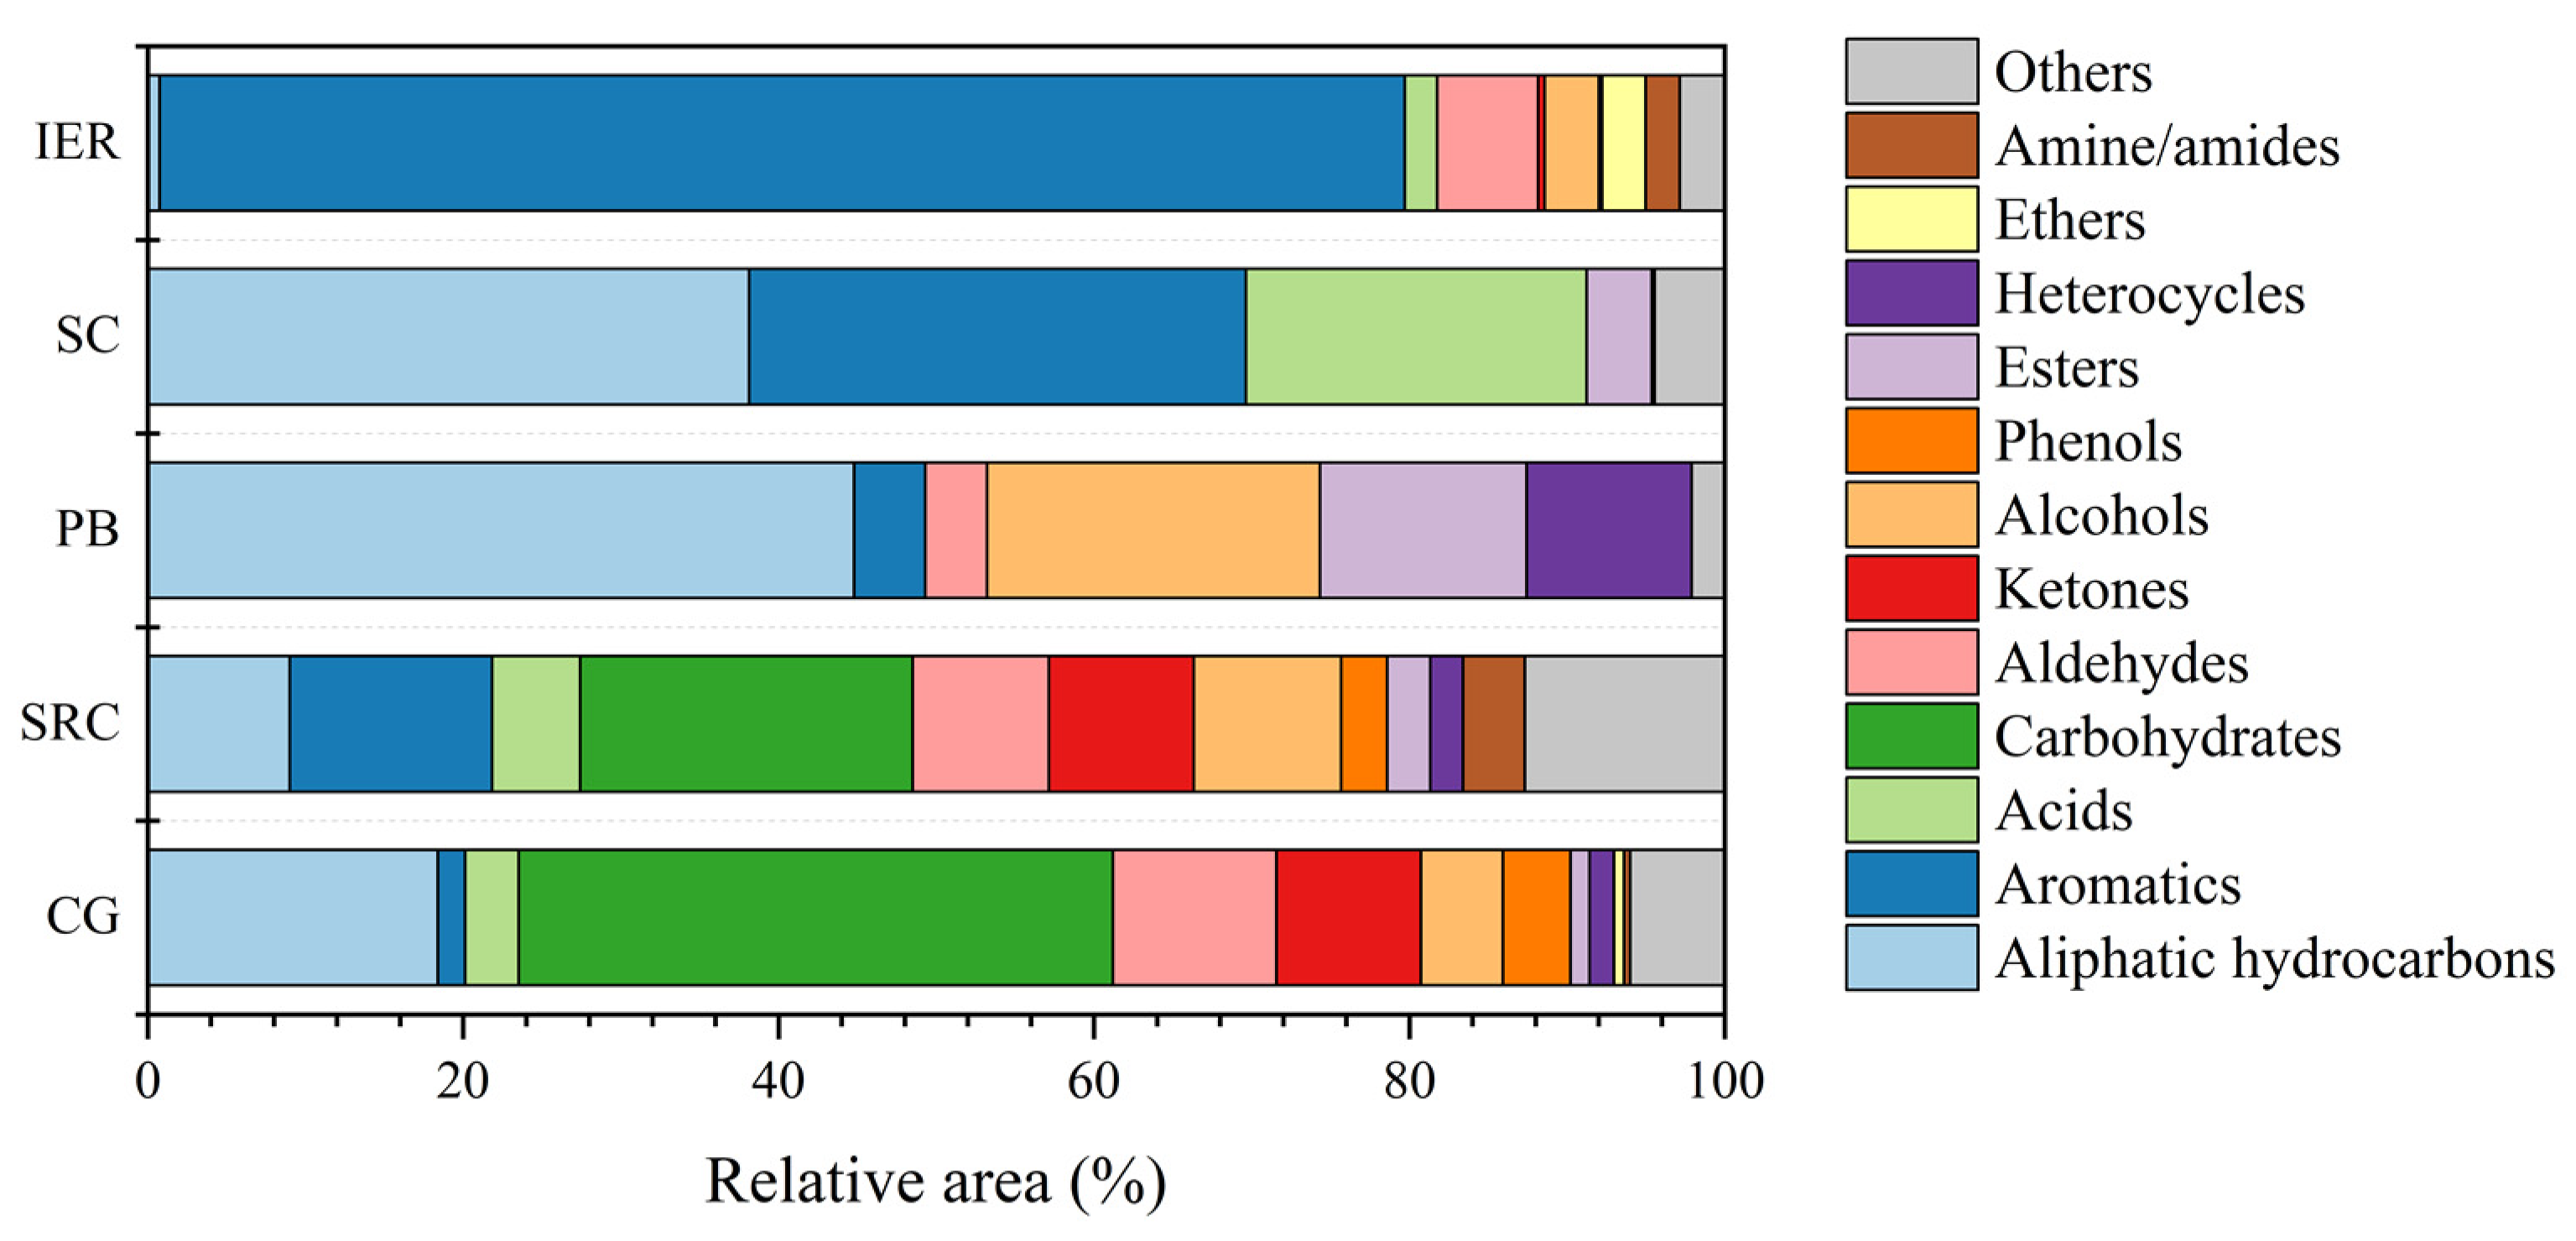
3.5. Py-GC/MS Analysis

Py-GC/MS was used to detect, classify, and semi-quantitatively analyze the major volatile products generated during the rapid pyrolysis of CG, SRC, PB, SC, and IER. The low-molecular-weight non-condensable gases are susceptible to interference from the sweep gas. Therefore, only VOCs are analyzed. In addition, some of the pyrolysis products, such as the heavier fractions in the tar or the condensable fractions in the pyrolysis gas, cannot be identified due to equipment limitations. The categorization of the main pyrolysis products has been described in the Supplementary Materials. The substances detected by Py-GC/MS are mainly classified as aliphatic hydrocarbons, aromatics, acids, carbohydrates, aldehydes, ketones, alcohols, phenols, esters, heterocycles, ethers, and amine/amides. Figure 5 shows the fast pyrolysis total ion chromatogram (TIC) graphs of CG, SRC, PB, SC, and IER at 800 °C for the same pyrolysis time, and some major pyrolysis products are detected. Figure 6 shows the distribution of rapid pyrolysis products of CG, SRC, PB, SC, and IER at 800 °C.
When the pyrolysis temperature is 800 °C, the pyrolysis products of biomass-based materials have the highest content of carbohydrates and hydrocarbons (including aliphatic hydrocarbons and aromatics), and the relative content of both in the pyrolysis products of CG and SRC is 58% and 43%, respectively. They are followed by aldehydes, ketones, alcohols, and acids. Phenols, heterocycles, esters, ethers, and amines/amides have the lowest content, with the relative content below 5%. Among the fast pyrolysis products of CG and SRC, D-Allose is the most abundant, followed by aldehydes and hydrocarbons such as 2-Propenal, 2-Butene, (E)-, and Styrene. Probably due to the higher cellulose content of CG, the relative contents of D-Allose and aliphatic hydrocarbons in the pyrolysis products of CG are up to 36% and 18%, respectively, which are twice as much as those of SRC. Pyrolysis products of biomass-based materials are complex and have been seen in other studies [66,67]. This is associated with the large amount of oxygen radicals released during pyrolysis [66]. Due to the high oxygen content of the biomass-based materials, the pyrolysis products are mostly oxygen-containing compounds with a relative content of more than 60%, including carbohydrates, aldehydes, ketones, alcohols, phenols, and acids.
The pyrolysis products of PB have the highest relative content of aliphatic hydrocarbons (44.8%), followed by alcohols (21.1%), esters (13.1%), heterocyclic (10.5%), aromatics (4.5%), and aldehydes (3.9%). Of these, the relative content of olefins is 38.7%. The pyrolysis products of PB contained more olefins than alkanes, which is the same as the findings of other scholars [68]. Polymer degradation begins with the breakdown of larger molecules into free radicals, followed by successive cracking into smaller compounds and the formation of olefins. When the free radicals break down to form intermediates referred to as oligomers, the termination stage occurs [69]. SC mainly produces aliphatic hydrocarbons, aromatics, and acids during pyrolysis, with relative contents of 38.1%, 31.5%, and 21.6%, respectively. They are followed by esters (4.1%) and heterocycles (0.2%). Herein, the formation of aromatics can be attributed to molecular rearrangement and cyclization of partial polyene fragments, and aliphatic hydrocarbons may be derived from the degradation of aromatic compounds or cyclization reactions of chain alkenes [58]. Among the pyrolysis products of IER, aromatics are the most abundant (79.0%), and aliphatic hydrocarbons have the lowest relative content (0.74%). The rest consists of aldehydes (6.4%), alcohols (3.4%), ethers (2.8%), amines/amides (2.2%), acids (2.1%), ketones (0.4%), and heterocycles (0.2%). The highest content of pyrolysis products is hydrocarbons such as Styrene and Toluene. IER generates a large number of benzene ring radicals during pyrolysis, which favors the formation of aromatics in the products [68].
Comparison of the rapid pyrolysis products of five materials shows that the pyrolysis products of biomass-based materials are the most complex, with the highest content of carbohydrates, followed by aliphatic hydrocarbons and aromatics. The pyrolysis products of PB, SC, and IER are relatively simple, and mainly consist of hydrocarbons. The relative content of hydrocarbons in pyrolysis products is IER, SC, and PB from high to low. However, the hydrocarbon components of the three materials are very different. The hydrocarbon produced by PB pyrolysis is mainly aliphatic hydrocarbons, and the hydrocarbon produced by IER pyrolysis is mainly aromatics. However, the contents of aliphatic hydrocarbons and aromatics produced by SC pyrolysis are both very high. This further confirms the results of MS.

4. Conclusions

In this work, the pyrolysis behavior, kinetic parameters of pyrolysis reaction, and evolution of pyrolysis products of CG, SRC, PB, SC, and IER were analyzed using thermogravimetric analysis, iso-conversional methods, and TG-FTIR-MS, and the distribution characteristics of the pyrolysis products under rapid pyrolysis were investigated by Py-GC/MS. The conclusions are as follows:
(1) The main mass loss stages of CG, SRC, PB, SC, and IER were 240–500 °C, 210–500 °C, 400–550 °C, 180–610 °C, and 25–700 °C, respectively. In the actual disposal of the waste, it may be necessary to appropriately increase the residence time of the materials in the temperature range. The average activation energies of CG, SRC, PB, SC, and IER calculated through FWO, KAS, and Friedman method were 184.09–211.46 kJ/mol, 172.33–180.85 kJ/mol, 264.63–268.01 kJ/mol, 150.49–184.36 kJ/mol, and 150.72–151.66 kJ/mol, respectively. Among the five materials, PB had the strongest thermal stability.
(2) At a heating rate of 10 K/min, the pyrolysis products of CG and SRC mainly consisted of CO2, substances with C=O and C-O functional groups, and a few hydrocarbons due to the high oxygen content. SC had a large amount of Cl, and large quantities of HCl were generated in the pyrolysis. In addition, the pyrolysis products also contained lots of substances with C=O and C-O functional groups, and a small quantity of HCN and hydrocarbons. Under rapid pyrolysis, CG and SRC mainly produced carbohydrates (37.7%, 21.1%) such as D-Allose and hydrocarbons, including aliphatic hydrocarbons (18.4%, 9.0%) and aromatics (1.7%, 12.8%). Aliphatic hydrocarbons (38.1%), aromatics (31.5%), and acids (21.6%) were mainly detected in the pyrolysis products of SC. PB and IER had high contents of carbon and hydrogen and produced a large number of olefins (38.7%) and aromatics (78.9%), respectively, during pyrolysis. Unlike the other materials, a small amount of SO2 was generated from the pyrolysis of IER. In practical engineering, if the disposed waste contains a high proportion of SC and IER, attention should be paid to controlling the emission of hazardous gases such as HCl, SO2, and dioxins.
In the present experiments, some of the pyrolysis products, such as the heavier fractions in the tar or the condensable fractions in the pyrolysis gas, cannot be identified. Therefore, the distribution characteristics of gas-phase, liquid-phase, and solid-phase pyrolysis products of the simulated waste can be further investigated based on the tube furnace pyrolysis system in future studies. In addition, some non-radioactive stable isotopes can be added to the simulated waste to explore the effect of simulated nuclides on the pyrolysis properties of the waste. The pyrolysis properties of actual radioactive waste can also be studied in plasma high-temperature melting engineering to explore the interaction between the radioactive materials and the waste.

Supplementary Materials

The following supporting information can be downloaded at: https://www.mdpi.com/article/10.3390/en18092341/s1, Figure S1: The pictures of (a) CG, (b) SRC, (c) PB, (d) SC, (e) IER; Figure S2: Kinetic fitting curves obtained by FWO, KAS and Friedman methods for CG, SRC, PB, SC and IER; Table S1: The major pyrolytic products of CG at 800 °C; Table S2: The major pyrolytic products of SRC at 800 °C; Table S3: The major pyrolytic products of PB at 800 °C; Table S4: The major pyrolytic products of SC at 800 °C; Table S5: The major pyrolytic products of IER at 800 °C.

Author Contributions

Conceptualization, Z.W. and L.L.; data curation, L.D.; methodology, Z.W., W.W., P.D., W.J., C.Z. and L.L.; validation, P.D. and W.J.; formal analysis, Z.W., L.D., W.W. and L.L.; investigation, Z.W., L.D., W.W., P.D., W.J. and C.Z.; resources, L.L. and M.T.; writing—original draft, Z.W. and L.D.; writing—review and editing, L.L. and M.T.; visualization, Z.W., L.D. and W.W.; supervision, L.L.; project administration, L.L.; funding acquisition, L.L. and M.T. All authors have read and agreed to the published version of the manuscript.

Funding

This research was funded by the Major Science and Technology Project of Hainan Province, grant number ZDKJ2021056.

Data Availability Statement

The original contributions presented in this study are included in the article/Supplementary Materials. Further inquiries can be directed to the corresponding author.

Conflicts of Interest

Authors Zhigang Wei, Wei Wang, Pan Ding and Chi Zuo were employed by company Hainan Nuclear Power Co., Ltd. The remaining authors declare that the research was conducted in the absence of any commercial or financial relationships that could be construed as a potential conflict of interest.

References

  1. Cho, S.; Park, J.; Suh, H.; Kim, G.; Lim, J.; Seok, S.; Bae, S. Effects of ultrasound-assisted sulfuric acid treatment on the decontamination of Co nuclides in cement paste simulating radioactive concrete waste from dismantled nuclear power plants. Constr. Build. Mater. 2023, 373, 130878. [Google Scholar] [CrossRef]
  2. Cai, X.; Yang, H.; Yang, X.; He, Y.; Shan, J. Research on a novel γ-ray spectrum analysis method for low- and intermediate-level radioactive solid waste in nuclear power plants. Nucl. Eng. Technol. 2024, 56, 4688–4697. [Google Scholar] [CrossRef]
  3. Pancholi, K.C.; Mishra, R.; Kolay, S.; Singh, P.J.; Vincent, T.; Kaushik, C.P. Thermal decomposition study for effective management of low level radioactive combustible solids. J. Radioanal. Nucl. Chem. 2022, 331, 1309–1322. [Google Scholar] [CrossRef]
  4. Xu, W.; Chu, H.; Zheng, B.; Tang, C.; Yu, E.; Xue, P.; Sheng, J.; Li, X. Application and improvement of low & medium-level radioactive waste pyrolysis incineration technology in China. Radiat. Prot. 2020, 40, 387–393. [Google Scholar]
  5. Wang, H.W.; Chen, M.Q.; Fu, K.; Wei, S.H.; Zhong, X.B. Evaluation on migration and transformation of trace nuclides in thermal degradation for low-level radioactive waste. J. Anal. Appl. Pyrolysis 2022, 161, 105420. [Google Scholar] [CrossRef]
  6. Matsuda, M.; Funabashi, K.; Yusa, H.; Kikuchi, M. Influence of Functional Sulfonic Acid Group on Pyrolysis Characteristics for Cation Exchange Resin. J. Nucl. Sci. Technol. 1987, 24, 124–128. [Google Scholar] [CrossRef]
  7. Gomez, E.; Rani, D.A.; Cheeseman, C.R.; Deegan, D.; Wise, M.; Boccaccini, A.R. Thermal plasma technology for the treatment of wastes: A critical review. J. Hazard. Mater. 2009, 161, 614–626. [Google Scholar] [CrossRef]
  8. Womack, R.; Shuey, M. Development and Use of the Dual-Mode Plasma Torch. In Proceedings of the Conference: Waste Management 2002 Symposium, Tucson, AZ, USA, 24–28 February 2002. [Google Scholar]
  9. Nakashima, M.; Fukui, T.; Nakashio, N.; Isobe, M.; Ohtake, A.; Wakui, T.; Hirabayashi, T. Characterization of Solidified Products Yielded by Plasma Melting Treatment of Simulated Non-Metallic Radioactive Wastes. J. Nucl. Sci. Technol. 2002, 39, 687–694. [Google Scholar] [CrossRef]
  10. Polyakov, N.; Chulkin, S. Application of plasma-pyrolytic processing of solid radioactive waste on a floating nuclear power plant. IOP Conf. Ser. Earth Environ. Sci. 2020, 578, 012027. [Google Scholar] [CrossRef]
  11. Sampathraju, R.; Mansuri, M.A. Assessment of air pollutants in the occupational environment of plasma biomedical waste disposal system in Ahmedabad, India. J. Environ. Saf. 2019, 10, 89–93. [Google Scholar] [CrossRef]
  12. Prado, E.S.P.; Miranda, F.S.; de Araujo, L.G.; Petraconi, G.; Baldan, M.R. Thermal plasma technology for radioactive waste treatment: A review. J. Radioanal. Nucl. Chem. 2020, 325, 331–342. [Google Scholar] [CrossRef]
  13. Ma, Y.; Chu, H.; Zheng, B. Research progress of plasma melting technology in radioactive waste treatment of nuclear power plants. Ann. Nucl. Energy 2024, 198, 110307. [Google Scholar] [CrossRef]
  14. Tzeng, C.-C.; Kuo, Y.-Y.; Huang, T.-F.; Lin, D.-L.; Yu, Y.-J. Treatment of radioactive wastes by plasma incineration and vitrification for final disposal. J. Hazard. Mater. 1998, 58, 207–220. [Google Scholar] [CrossRef]
  15. Tee, M.Y.; Woon, K.S.; Wong, S.L.; Nyakuma, B.B.; Tan, J.P.; Chong, W.W.F.; Mong, G.R. Unveiling the dynamics of solid waste co-pyrolysis through thermogravimetric analysis and kinetic analysis for technological upscaling (2001–2022). J. Anal. Appl. Pyrolysis 2024, 183, 106806. [Google Scholar] [CrossRef]
  16. Li, Q.; Faramarzi, A.; Zhang, S.; Wang, Y.; Hu, X.; Gholizadeh, M. Progress in catalytic pyrolysis of municipal solid waste. Energy Convers. Manag. 2020, 226, 113525. [Google Scholar] [CrossRef]
  17. Chen, D.; Yin, L.; Wang, H.; He, P. Reprint of: Pyrolysis technologies for municipal solid waste: A review. Waste Manag. 2015, 37, 116–136. [Google Scholar] [CrossRef]
  18. Prajapati, S.B.; Gautam, A.; Gautam, S. Co-pyrolysis of printed circuit boards (PCBs): A review on current research and future prospects. Mater. Today Proc. 2024, 111, 44–52. [Google Scholar] [CrossRef]
  19. Bianasari, A.A.; Khaled, M.S.; Hoang, T.-D.; Reza, M.S.; Bakar, M.S.A.; Azad, A.K. Influence of combined catalysts on the catalytic pyrolysis process of biomass: A systematic literature review. Energy Convers. Manag. 2024, 309, 118437. [Google Scholar] [CrossRef]
  20. Bassyouni, M.; Nasser, R.; El-Bagoury, M.; Shaker, I.; Attia, A.M.; Elhenawy, Y.; Aboelela, D. Integrating medical plastic waste pyrolysis and circular economy for environmental sustainability. Renew. Sustain. Energy Rev. 2025, 209, 115062. [Google Scholar] [CrossRef]
  21. Huang, Y.; Sekyere, D.T.; Zhang, J.; Tian, Y. Fast pyrolysis behaviors of biomass with high contents of ash and nitrogen using TG-FTIR and Py-GC/MS. J. Anal. Appl. Pyrolysis 2023, 170, 105922. [Google Scholar] [CrossRef]
  22. Das, P. Pyrolysis study of a waste plastic mixture through different kinetic models using isothermal and nonisothermal mechanism††Electronic supplementary information (ESI) available. RSC Adv. 2024, 14, 25599–25618. [Google Scholar] [CrossRef] [PubMed]
  23. Athparia, M.; Saikia, N.; Namdeo, A.; Garg, A.; Sarangi, P.K.; Kataki, R. Kinetic analysis and pyrolysis behavior of organic fraction of municipal solid waste towards the production of renewable fuel: A sustainable approach to resource recovery for circular economy. Sustain. Chem. Pharm. 2024, 42, 101822. [Google Scholar] [CrossRef]
  24. Yang, L.; Zhang, Z.; Chen, A.; Mao, W.; Zhu, Z.; Zhao, Y.; Zhang, L. Experimental and kinetic study on pyrolysis and combustion characteristics of pesticide waste liquid. J. Environ. Chem. Eng. 2024, 12, 111994. [Google Scholar] [CrossRef]
  25. Gulshan, S.; Shafaghat, H.; Wang, S.; Dai, L.; Tang, C.; Fu, W.; Wen, Y.; Wang, C.-H.; Evangelopoulos, P.; Yang, W. Kinetic investigation on the catalytic pyrolysis of plastic fractions of waste electrical and electronic equipment (WEEE): A mathematical deconvolution approach. Waste Manag. 2024, 187, 156–166. [Google Scholar] [CrossRef] [PubMed]
  26. Aboulkas, A.; Elharfi, K.; El Bouadili, A. Thermal degradation behaviors of polyethylene and polypropylene. Part I: Pyrolysis Kinet. mechanisms. Energy Convers. Manag. 2010, 51, 1363–1369. [Google Scholar] [CrossRef]
  27. Ullah, F.; Ji, G.; Zhang, L.; Irfan, M.; Fu, Z.; Manzoor, Z.; Li, A. Assessing pyrolysis performance and product evolution of various medical wastes based on model-free and TG-FTIR-MS methods. Chem. Eng. J. 2023, 473, 145300. [Google Scholar] [CrossRef]
  28. Zhang, Q.; Dor, L.; Fenigshtein, D.; Yang, W.; Blasiak, W. Gasification of municipal solid waste in the Plasma Gasification Melting process. Appl. Energy 2012, 90, 106–112. [Google Scholar] [CrossRef]
  29. Pei, S.-L.; Chen, T.-L.; Pan, S.-Y.; Yang, Y.-L.; Sun, Z.-H.; Li, Y.-J. Addressing environmental sustainability of plasma vitrification technology for stabilization of municipal solid waste incineration fly ash. J. Hazard. Mater. 2020, 398, 122959. [Google Scholar] [CrossRef]
  30. Cai, X.; Du, C. Thermal Plasma Treatment of Medical Waste. Plasma Chem. Plasma Process. 2021, 41, 1–46. [Google Scholar] [CrossRef]
  31. Byun, Y.; Cho, M.; Chung, J.W.; Namkung, W.; Lee, H.D.; Jang, S.D.; Kim, Y.-S.; Lee, J.-H.; Lee, C.-R.; Hwang, S.-M. Hydrogen recovery from the thermal plasma gasification of solid waste. J. Hazard. Mater. 2011, 190, 317–323. [Google Scholar] [CrossRef]
  32. Wang, S.; Cheng, C.; Lan, W.; Zhang, X.; Liu, D.; Yang, S.-Z. Experimental Study of Thermal Plasma Processing Waste Circuit Boards. Adv. Mater. Res. 2013, 652–654, 1553–1561. [Google Scholar] [CrossRef]
  33. Barneto, A.G.; Carmona, J.A.; Alfonso, J.E.M.; Blanco, J.D. Kinetic models based in biomass components for the combustion and pyrolysis of sewage sludge and its compost. J. Anal. Appl. Pyrolysis 2009, 86, 108–114. [Google Scholar] [CrossRef]
  34. Yu, Z.; Ahmad, M.S.; Shen, B.; Li, Y.; Ibrahim, M.; Bokhari, A.; Klemeš, J.J. Activated waste cotton cellulose as renewable fuel and value-added chemicals: Thermokinetic analysis, coupled pyrolysis with gas chromatography and mass spectrometry. Energy 2023, 283, 128341. [Google Scholar] [CrossRef]
  35. Singh, R.K.; Ruj, B.; Sadhukhan, A.K.; Gupta, P. A TG-FTIR investigation on the co-pyrolysis of the waste HDPE, PP, PS and PET under high heating conditions. J. Energy Inst. 2020, 93, 1020–1035. [Google Scholar] [CrossRef]
  36. Marcilla, A.; Beltrán, M. Thermogravimetric kinetic study of poly(vinyl chloride) pyrolysis. Polym. Degrad. Stab. 1995, 48, 219–229. [Google Scholar] [CrossRef]
  37. Kuttiyathil, M.S.; Ali, L.; Teoh, W.Y.; Altarawneh, M. Dechlorination of waste polyvinyl chloride (PVC) via its co-pyrolysis with Ca(OH)2: A TG-IR-GCMS investigation. Case Stud. Chem. Environ. Eng. 2025, 11, 101162. [Google Scholar] [CrossRef]
  38. Wang, J.; Wan, Z. Treatment and disposal of spent radioactive ion-exchange resins produced in the nuclear industry. Prog. Nucl. Energy 2015, 78, 47–55. [Google Scholar] [CrossRef]
  39. Castro, H.A.; Luca, V.; Bianchi, H.L. Study of plasma off-gas treatment from spent ion exchange resin pyrolysis. Environ. Sci. Pollut. Res. 2018, 25, 21403–21410. [Google Scholar] [CrossRef]
  40. Luo, J.; Hu, W.; Suo, Z.; Wang, Y.; Zhang, Y. Co-pyrolysis of spent radioactive ion exchange resin and manganese dioxide: Decrease the decomposition temperatures of functional groups. J. Hazard. Mater. 2021, 418, 126275. [Google Scholar] [CrossRef]
  41. Huang, X.; Yin, H.; Zhang, H.; Mei, N.; Mu, L. Pyrolysis characteristics, gas products, volatiles, and thermo–kinetics of industrial lignin via TG/DTG–FTIR/MS and in–situ Py–PI–TOF/MS. Energy 2022, 259, 125062. [Google Scholar] [CrossRef]
  42. Ahmad, M.S.; Mehmood, M.A.; Al Ayed, O.S.; Ye, G.; Luo, H.; Ibrahim, M.; Rashid, U.; Arbi Nehdi, I.; Qadir, G. Kinetic analyses and pyrolytic behavior of Para grass (Urochloa mutica) for its bioenergy potential. Bioresour. Technol. 2017, 224, 708–713. [Google Scholar] [CrossRef]
  43. Flynn, J.H.; Wall, L.A. A quick, direct method for the determination of activation energy from thermogravimetric data. J. Polym. Sci. Part B Polym. Lett. 1966, 4, 323–328. [Google Scholar] [CrossRef]
  44. Ozawa, T. A New Method of Analyzing Thermogravimetric Data. Bull. Chem. Soc. Jpn. 1965, 38, 1881–1886. [Google Scholar] [CrossRef]
  45. Doyle, C.D. Kinetic analysis of thermogravimetric data. J. Appl. Polym. Sci. 1961, 5, 285–292. [Google Scholar] [CrossRef]
  46. Ozawa, T. Estimation of activation energy by isoconversion methods. Thermochim. Acta 1992, 203, 159–165. [Google Scholar] [CrossRef]
  47. Sharara, M.; Sadaka, S. Thermogravimetric Analysis of Swine Manure Solids Obtained from Farrowing, and Growing-Finishing Farms. J. Sustain. Bioenergy Syst. 2014, 4, 75–86. [Google Scholar] [CrossRef]
  48. Li, F.; Tao, J.; Kumar, A.; Zhang, J.; Sun, Y.; Guo, W.; Cheng, Z.; Yan, B.; Chen, G. Pyrolysis characteristics and kinetics of waste photovoltaic module: A TG-MS-FTIR study. J. Clean. Prod. 2024, 444, 141267. [Google Scholar] [CrossRef]
  49. Gai, C.; Dong, Y.; Zhang, T. The kinetic analysis of the pyrolysis of agricultural residue under non-isothermal conditions. Bioresour. Technol. 2013, 127, 298–305. [Google Scholar] [CrossRef]
  50. Kaur, R.; Gera, P.; Jha, M.K.; Bhaskar, T. Pyrolysis kinetics and thermodynamic parameters of castor (Ricinus communis) residue using thermogravimetric analysis. Bioresour. Technol. 2018, 250, 422–428. [Google Scholar] [CrossRef]
  51. Li, Y.; Liu, S.; Yin, F.; Liang, D. Pyrolysis kinetics and reaction mechanism of waste medical masks by sectional heating process. Therm. Sci. Eng. Prog. 2024, 56, 103065. [Google Scholar] [CrossRef]
  52. Gu, X.; Ma, X.; Li, L.; Liu, C.; Cheng, K.; Li, Z. Pyrolysis of poplar wood sawdust by TG-FTIR and Py–GC/MS. J. Anal. Appl. Pyrolysis 2013, 102, 16–23. [Google Scholar] [CrossRef]
  53. Liu, Y.; Tao, J.; Li, J.; Li, H.; Li, F.; Cheng, Z.; Yan, B.; Chen, G. Pyrolysis of combustible fractions in excavated waste: Effect of landfill time on pyrolysis characteristics analyzed by TG-FTIR-MS. J. Anal. Appl. Pyrolysis 2024, 177, 106298. [Google Scholar] [CrossRef]
  54. Bi, H.; Ni, Z.; Tian, J.; Wang, C.; Jiang, C.; Zhou, W.; Bao, L.; Sun, H.; Lin, Q. The effect of biomass addition on pyrolysis characteristics and gas emission of coal gangue by multi-component reaction model and TG-FTIR-MS. Sci. Total Environ. 2021, 798, 149290. [Google Scholar] [CrossRef]
  55. Zhou, A.; Deng, N.; Deng, S.; Hu, Z.; Magdziarz, A.; Tan, H.; Wang, X. Study on pyrolysis behavior of municipal sludge based on TG-FTIR-MS. J. Energy Inst. 2024, 114, 101643. [Google Scholar] [CrossRef]
  56. Volli, V.; Gollakota, A.R.K.; Shu, C.-M. Comparative studies on thermochemical behavior and kinetics of lignocellulosic biomass residues using TG-FTIR and Py-GC/MS. Sci. Total Environ. 2021, 792, 148392. [Google Scholar] [CrossRef]
  57. Pang, Y.; Zhu, X.; Li, N.; Wang, Z. Study on CO2 co-gasification of cellulose and high-density polyethylene via TG-FTIR and ReaxFF MD. Process Saf. Environ. Protect. 2024, 186, 1471–1480. [Google Scholar] [CrossRef]
  58. Zhou, J.; Liu, G.; Wang, S.; Zhang, H.; Xu, F. TG-FTIR and Py-GC/MS study of the pyrolysis mechanism and composition of volatiles from flash pyrolysis of PVC. J. Energy Inst. 2020, 93, 2362–2370. [Google Scholar] [CrossRef]
  59. Zhao, X.; Wang, J.; Li, J.; Yu, Q. Kinetic modeling of thermal degradation of TDI/MDI-based flexible polyurethane foam under nitrogen and air atmospheres with Shuffled Complex Evolution algorithm: Insights from TG-FTIR analysis. J. Anal. Appl. Pyrolysis 2024, 177, 106279. [Google Scholar] [CrossRef]
  60. Luo, X.T.; Wang, Z.Q.; Wu, J.L.; Wu, J.H. Study on the pyrolysis mechanism of polyethylene, polystyrene, and polyvinyl chloride by TGA-FTIR. Ranliao Huaxue Xuebao/J. Fuel Chem. Technol. 2012, 40, 1147–1152. [Google Scholar]
  61. Castro, H.A.; Rodríguez, R.A.; Luca, V.; Bianchi, H.L. Pyrolysis and High Performance Plasma Treatment Applied to Spent Ion Exchange Resins. J. Nucl. Eng. Radiat. Sci. 2019, 5, 020901. [Google Scholar] [CrossRef]
  62. Ni, Z.; Bi, H.; Jiang, C.; Sun, H.; Zhou, W.; Qiu, Z.; Lin, Q. Research on the co-pyrolysis of coal slime and cellulose based on TG-FTIR-MS, artificial neural network, and principal component analysis. Fuel 2022, 320, 123960. [Google Scholar] [CrossRef]
  63. Jiang, C.; Zhou, W.; Bi, H.; Ni, Z.; Sun, H.; Lin, Q. Co-pyrolysis of coal slime and cattle manure by TG–FTIR–MS and artificial neural network modeling: Pyrolysis behavior, kinetics, gas emission characteristics. Energy 2022, 247, 123203. [Google Scholar] [CrossRef]
  64. Wang, C.; Bi, H.; Lin, Q.; Jiang, X.; Jiang, C. Co-pyrolysis of sewage sludge and rice husk by TG–FTIR–MS: Pyrolysis behavior, kinetics, and condensable/non-condensable gases characteristics. Renew. Energy 2020, 160, 1048–1066. [Google Scholar] [CrossRef]
  65. Pappa, A.; Mikedi, K.; Agapiou, A.; Karma, S.; Pallis, G.C.; Statheropoulos, M.; Burke, M. TG–MS analysis of nitrile butadiene rubber blends (NBR/PVC). J. Anal. Appl. Pyrolysis 2011, 92, 106–110. [Google Scholar] [CrossRef]
  66. Wu, M.; Wang, Z.; Chen, G.; Zhang, M.; Sun, T.; Wang, Q.; Zhu, H.; Guo, S.; Chen, Y.; Zhu, Y.; et al. Synergistic effects and products distribution during Co-pyrolysis of biomass and plastics. J. Energy Inst. 2023, 111, 101392. [Google Scholar] [CrossRef]
  67. Yang, J.; Wang, H.; Huang, W.; Peng, X.; Yuan, B.; Hu, Y. TG-FTIR-MS and Py-GC/MS study on the pyrolysis characteristics and gas evolution behavior of forest duff. J. Anal. Appl. Pyrolysis 2023, 176, 106233. [Google Scholar] [CrossRef]
  68. Zhang, Y.; Fu, Z.; Wang, W.; Ji, G.; Zhao, M.; Li, A. Kinetics, Product Evolution, and Mechanism for the Pyrolysis of Typical Plastic Waste. ACS Sustain. Chem. Eng. 2022, 10, 91–103. [Google Scholar] [CrossRef]
  69. Idris, I.A.; Nisamaneenate, J.; Atong, D.; Sricharoenchaikul, V. A comprehensive study of facemasks pyrolysis using Py-GC/MS, kinetic analysis and ANN modeling. Arab. J. Chem. 2024, 17, 105605. [Google Scholar] [CrossRef]
Figure 1. The TG and DTG curves of (a) CG, (b) SRC, (c) PB, (d) SC, (e) IER.
Energies 18 02341 g001
Figure 2. 2DFTIR spectra: (a) CG; (b) SRC; (c) PB; (d) SC; (e) IER.
Energies 18 02341 g002
Figure 3. Evolutions of infrared absorption relative intensity with temperature: (a) CG; (b) SRC; (c) PB; (d) SC; (e) IER.
Energies 18 02341 g003
Figure 4. Intensity evolution of major pyrolysis gas products and ionized fragments: (a) CH4 (m/z = 16); (b) H2O (m/z = 18); (c) C2H6 (m/z = 30); (d) HCl (m/z = 36); (e) C3H5+ (m/z = 41); (f) C3H7+/C2H3O+ (m/z = 43); (g) CO2/C3H8 (m/z = 44); (h) SO (m/z = 48); (i) SO2 (m/z = 64); (j) C6H6 (m/z = 78); (k) C7H8 (m/z = 92).
Energies 18 02341 g004
Figure 5. Rapid pyrolysis TIC diagram at 800 °C for the same pyrolysis time: (a) CG; (b) SRC; (c) PB; (d) SC; (e) IER.
Energies 18 02341 g005
Figure 6. Distribution of rapid pyrolysis products at 800 °C.
Energies 18 02341 g006
Table 1. Analysis of individual materials (wt%).
MaterialProximate Analysis Ultimate Analysis Cl
MadashadVMadFCad,diffCadHadNadSadOad, diff
CG4.261.2388.216.3044.136.040.320.4643.560.00
SRC8.361.0381.319.3041.335.490.780.4542.560.04
PB0.102.3996.471.0480.5215.020.480.870.620.01
SC0.248.3879.8511.5347.436.080.820.5236.5324.46
IER19.380.0164.0116.6051.137.102.074.7415.570.02
Note: ad: Air dry basis. diff: Calculated by difference. M: Moisture, VM: Volatile matter, FC: Fixed carbon.
Table 2. Activation energy values obtained by FWO, KAS, and Friedman methods.
MaterialDegrees of Conversion (α)FWO MethodKAS MethodFriedman Method
Ea (kJ/mol)R2Ea (kJ/mol)Ea (kJ/mol)R2Ea (kJ/mol)
CG0.1152.930.9963150.970.9958153.920.9981
0.2153.560.9984151.370.9982181.740.9995
0.3184.260.9999178.100.9995202.080.9974
0.4168.620.9995179.330.9997184.490.9949
0.5182.750.9999181.750.9998187.030.9999
0.6184.530.9999183.560.9999187.620.9999
0.7185.980.9999185.020.9999190.800.9999
0.8188.330.9999198.480.9983224.570.9936
0.9256.830.9654248.270.9766390.870.9067
Average184.20 184.09 211.46
SRC0.1153.820.9617152.520.9570164.970.9837
0.2164.270.9939163.170.9931175.470.9982
0.3170.410.9955169.420.9949181.700.9964
0.4174.620.9934173.700.9926184.360.9924
0.5176.720.9888176.320.9906185.680.9890
0.6180.950.9990184.640.9915187.270.9874
0.7181.720.9899180.860.9887184.200.9810
0.8179.100.9888177.970.9873183.130.9892
Average172.70 172.33 180.85
PB0.1285.930.9999288.900.9999277.810.9998
0.2271.640.9999273.630.9999270.900.9999
0.3269.740.9999271.510.9999297.560.9966
0.4268.690.9999270.330.9999269.440.9999
0.5266.740.9999268.200.9999263.080.9999
0.6263.840.9999265.090.9999239.110.9972
0.7260.280.9999259.860.9945253.960.9997
0.8258.210.9999259.040.9999256.120.9994
0.9254.920.9999255.510.9999253.670.9992
Average266.67 268.01 264.63
SC0.165.700.950960.210.9370118.020.9955
0.2107.620.9913104.000.9898166.040.9987
0.3126.080.9981123.290.9979165.760.9982
0.4135.990.9990133.620.9989163.640.9991
0.5145.380.9999143.390.9999169.110.9971
0.6152.950.9997151.240.9996169.210.9991
0.7153.670.9992151.780.9991162.010.9899
0.8209.470.9270208.750.9194235.660.9485
0.9276.150.9941278.170.9936309.830.9999
Average152.56 150.49 184.36
IER0.165.800.992063.630.990455.910.9929
0.259.530.994856.760.993551.790.9937
0.357.100.993253.990.991451.320.9887
0.456.340.989352.960.986454.660.9792
0.563.010.975159.020.983371.570.9528
0.686.450.839182.610.8140108.380.7947
0.7390.280.8692400.640.8635426.570.8954
0.8340.740.9999347.390.9999325.990.9996
0.9238.740.9999239.460.9999218.760.9997
Average150.89 150.72 151.66
Disclaimer/Publisher’s Note: The statements, opinions and data contained in all publications are solely those of the individual author(s) and contributor(s) and not of MDPI and/or the editor(s). MDPI and/or the editor(s) disclaim responsibility for any injury to people or property resulting from any ideas, methods, instructions or products referred to in the content.

