Article

Non-Invasive Multivariate Prediction of Human Thermal Comfort Based on Facial Temperatures and Thermal Adaptive Action Recognition

1
School of Electrical and Information Engineering, Jiangsu University, Zhenjiang 212013, China
2
School of Overseas Education, Jiangsu University, Zhenjiang 212013, China
*
Author to whom correspondence should be addressed.
Energies 2025, 18(9), 2332; https://doi.org/10.3390/en18092332
Submission received: 17 March 2025 / Revised: 24 April 2025 / Accepted: 29 April 2025 / Published: 2 May 2025
(This article belongs to the Section G: Energy and Buildings)

Abstract

:
Accurately assessing human thermal comfort plays a key role in improving indoor environmental quality and energy efficiency of buildings. Non-invasive thermal comfort recognition has shown great application potential compared with other methods. Based on thermal correlation analysis, human facial temperature recognition and body thermal adaptive action detection are both performed by one binocular infrared camera. The YOLOv5 algorithm is applied to extract facial temperatures of key regions, through which the random forest model is used for thermal comfort recognition. Meanwhile, the Mediapipe tool is used to detect probable thermal adaptive actions, based on which the corresponding thermal comfort level is also assessed. The two results are combined with PMV calculation for multivariate human thermal comfort prediction, and a weighted fusion strategy is designed. Seventeen subjects were invited to participate in experiments for data collection of facial temperatures and thermal adaptive actions in different thermal conditions. Prediction results show that, by using the experiment data, the overall accuracies of the proposed fusion strategy reach 82.86% (7-class thermal sensation voting, TSV) and 94.29% (3-class TSV), which are better than those of facial temperature-based thermal comfort prediction (7-class: 78.57%, 3-class: 90%) and PMV model (7-class: 20.71%, 3-class: 65%). If probable thermal adaptive actions are detected, the accuracy of the proposed fusion model is further improved to 86.8% (7-class) and 100% (3-class). Furthermore, by changing clothing thermal resistance and metabolic level of subjects in experiments, the influence on thermal comfort prediction is investigated. From the results, the proposed strategy still achieves better accuracy compared with other single methods, which shows good robustness and generalization performance in different applications.

1. Introduction

Over the past decade, population growth, increased indoor time, and the demand for enhanced indoor environmental quality have significantly impacted building energy consumption [1]. Research indicates that people now spend more than 80% of their time indoors, underscoring the critical role of indoor environments in personal and professional life [2,3,4,5,6]. In the United States, HVAC systems’ energy consumption has comprised 50% of total building energy usage [7], and the proportion in China is similar. However, personal dissatisfaction with the indoor thermal environment is still high [8,9]. For large-space buildings, the spatiotemporal uneven distribution of environmental parameters further exacerbates this thermal discomfort [10,11]. Analyzing the reasons, on the one hand, the thermal comfort of the human body is not only affected by external environmental factors, but also related to inner metabolic level and psychological factors. On the other hand, current thermal comfort evaluation methods primarily focus on the overall thermal comfort of the population, neglecting individual differences in thermal sensation [12]. Therefore, designing a fast and accurate identification method for thermal sensations of indoor residents is of great significance for improving the quality of building environment and energy efficiency.

1.1. Relevant Research

For human thermal comfort assessment, the predictive mean voting (PMV) method has been widely used and been recognized by ASHRAE [13] and ISO 7730 [14]. It divides human thermal sensation level into multiple classes by considering both environmental and physiological factors, including indoor air temperature, relative humidity, average radiation temperature, wind speed, clothing thermal resistance, and metabolic rate [15,16]. However, PMV shows difficulty at reflecting the difference in thermal comfort caused by dynamic environmental changes or population differences. With the rapid development of sensor and machine learning technologies, more and more attention has been paid to on-site data acquisition and data-driven thermal comfort modeling. Zhou et al. [17] used support vector machine (SVM [18,19]) and a public data set (RP-884 database) for thermal comfort modeling. Compared to the PMV model, the SVM’s sum of squares for residuals (SSE) was reduced by 96.4%. Similarly, Jiang and Yao [20] designed an SVM-based personal thermal sensation model and achieved better predictive performance than the PMV model. Luo et al. [21] compared the applications of logistic regression (LR), gradient boosting (GB), SVM, and random forest algorithms (RF [22,23]) in predicting thermal sensation voting (TSV). RF model based on a parallel ensemble learning strategy achieved the best performance. Similar to RF, the AdaBoost model using a serial ensemble strategy was also reported for personal thermal comfort predictions [24,25].
In data-driven modeling, the question of how to access reliable thermal sensation data plays the key role [26,27]. The collection of approaches can be roughly divided into three categories: traditional invasive measurements, semi-invasive, and non-invasive measurements [28,29]. For invasive methods, physical contact and subject cooperation are required during the measurement. The foreign body sensation during data collection can inevitably affect the accuracy of physiological markers and questionnaire surveys to some extent [30,31,32]. The semi-invasive methods mainly integrate sensors into wearable devices [33,34], which can collect various physiological data more conveniently, such as skin temperature [35], blood pressure, and heart rate [36]. This method reduces the physical contact between subjects and sensors. The foreign body sensation is relieved, but the subjective influence cannot be completely eliminated.
In recent years, non-invasive methods have shown great potential in personal thermal comfort assessment [37]. By using remote monitoring devices such as infrared camera, the measurement interference on human bodies is minimized [38]. At the same time, the data collection process can be quick and real-time, which makes HVAC control based on human thermal comfort assessment more achievable. At present, remote detection of human body temperature is the main non-invasive measuring approach used for thermal comfort prediction [39,40,41]. For example, Cheng et al. [42] adopted a contactless approach to measure human body temperatures by correlating skin temperature with skin color saturation using Eulerian video magnification (EVM). Jeoung et al. [43] recognized the ROI of the human face based on 68 facial feature points in thermal images, and predicted thermal comfort with an accuracy of 90.26% (3-class, TSV). Bai et al. [44] extracted facial features and applied high-resolution feature learning networks (HRNet) to obtain infrared skin temperatures and skeletal points. Li et al. [45] applied the YOLO algorithm (You Only Look Once [46]) to recognize infrared facial images at multiple angles/distances, and extracted two facial key-region temperatures (nose, cheek) for thermal comfort prediction with an accuracy of 85.68% (3-class). It is noted that inappropriate camera angles or facial covering would result in degraded accuracy or even prediction failure.
By using a contactless method for detecting the human body’s thermal adaptive actions, the corresponding thermal comfort level may also be evaluated. In this respect, Meier et al. [47] used Kinect devices to detect four human postures (self-embrace, button-up, pull collar, and wipe eyebrows). Yang et al. [48,49] identified 12 thermal comfort-related actions based on 369 questionnaires, and the OpenPose tool was used to detect these actions for predicting thermal comfort. It is noted that, although thermal adaptive actions are directly driven by thermal sensation, they do not occur continuously, which would lead to interruption of thermal comfort assessment. Based on the categories and detection objects of images, Table 1 briefly summarizes personal thermal comfort assessments by different contactless measurements. The used data-driven models with reported accuracies are also provided.
From the brief review of non-invasive studies, it is seen that human thermal comfort can be accurately estimated by contactless measurements that minimize subjective influence. It is also found that current studies mainly focus on single non-invasive measuring methods for thermal comfort assessment. When the detection conditions are not satisfied, it will easily lead to degraded accuracy or prediction failures [45]. Regarding this research gap, a combination of multiple non-invasive detection methods may compensate for their respective defects, making thermal comfort prediction more reliable and robust. The impact of parameter changes (such as clothing thermal resistance and physiological metabolism) on the performance of thermal comfort assessment needs to be well understood [57,58]. A more comprehensive case study simulating practical applications is required.

1.2. Main Contributions

To address the above-mentioned issues, this study analyzes features of facial temperature measurement and thermal adaptive action detection through field experiments. In order to make use of their respective advantages, a non-invasive multivariate prediction strategy for human thermal comfort is designed. The main contributions include the following:
(1) By using one binocular infrared camera, facial key-region temperatures and probable thermal adaptive actions are detected. The YOLOv5 algorithm is applied for detection of facial key regions, then the RF model is used for facial temperature-based thermal comfort prediction. Meanwhile, skeletal-point data of six thermal adaptive actions are detected by combining YOLOv5 and Mediapipe tool. The action recognition model is built by RF, and the corresponding TSV level is determined by survey questionnaire results.
(2) A comprehensive framework for multivariate thermal comfort prediction is proposed by combing results from facial temperature recognition, thermal adaptive action detection, and PMV model. The fusion strategy is based on a weighted average method. The higher the single model’s recognition accuracy, the greater the corresponding weight.
(3) Three field experiments are designed. Experiment I collects data for training the prediction model based on facial temperature. Experiment II and experiment III collect data including thermal adaptation behavior to test the performance of fusion strategies under different conditions (normal office condition, change clo, change met, and both change clo and met). The robustness and generalization performance of the proposed strategy are investigated by these experiments, and the results are discussed in detail.

1.3. Paper Organization

Section 2 describes the methods used of facial recognition and thermal adaptive action detection. The data collection experiments and the overall strategy are both presented in this section. Section 3 comprehensively analyzes the results of detection algorithms and fusion strategy. Section 4 presents the study’s findings and its limitations. Section 5 briefly offers the conclusions of this study.

2. Methods

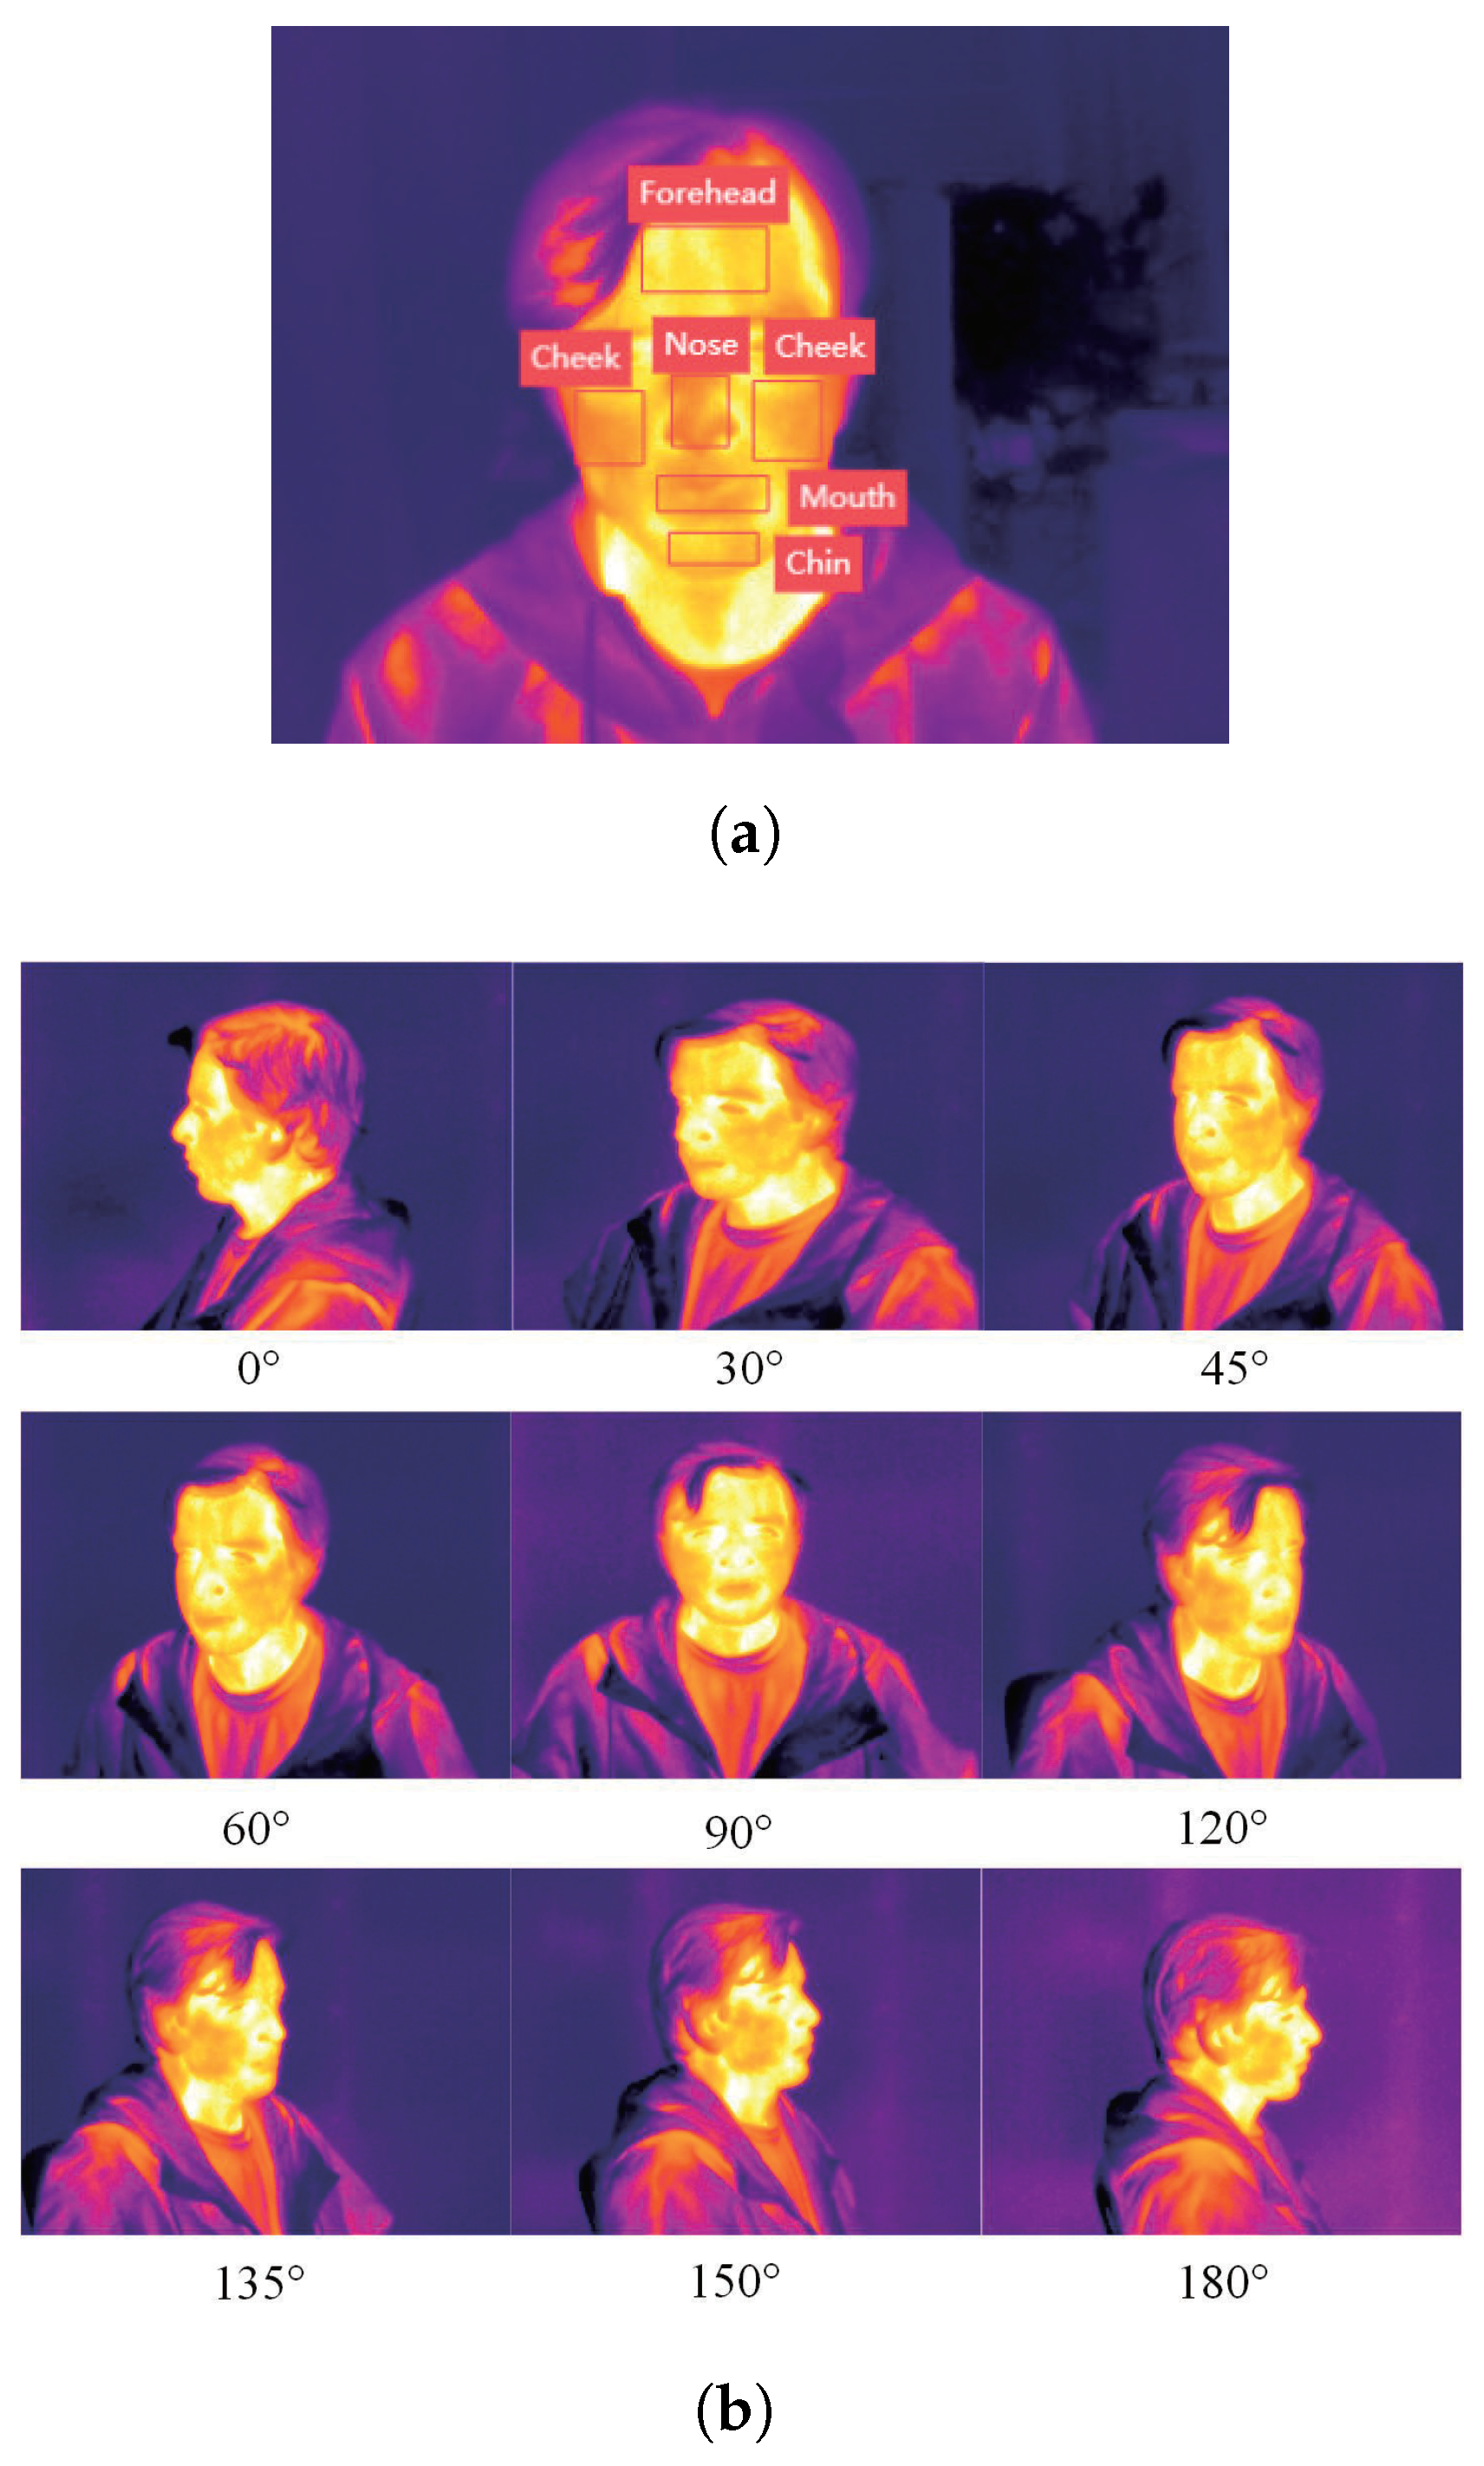
2.1. Multi-Region Facial Recognition Method

(1)
Object detection algorithm
For the detection of human facial key regions, the object detection algorithm YOLOv5 is applied. Compared with other object detection algorithms, YOLO algorithm [59] is widely used because of its efficiency, reliability, and ease of use in recognizing objects within images. The network structure of YOLOv5 is mainly divided into three parts: backbone network, neck network, and head network [60]. The primary function of the backbone network is feature extraction, which extracts object information from images through convolutional neural networks and continuously shrinks the feature map for subsequent object detection. The main structures of backbone include three submodules, i.e., the conv module, C3 module, and SPPF module [61]. The function of the neck network is to combine shallow graphic features with deep semantic features to obtain more complete features, thereby enhancing the network’s robustness and object detection ability. The obtained features are then transmitted to the head network for prediction. The head network deduces and outputs the class and location information of recognized objects.
In practice, the trained YOLOv5 model identifies facial key regions and provides the position coordinates of detection boxes; using these as input, the average temperature of each region is extracted. The temperature extraction function refers to the Software Development Kit (SDK) provided by infrared thermal imager manufacturers (MAGNITY, China). The extracted average temperatures of facial regions are used for TSV prediction, which will be described in Section 2.3.
(2)
Dataset collection of thermal images
According to the sensitivity analysis results in our previous research [45], the nose and cheeks are selected from six facial regions of interest (ROI, nose, cheeks, forehead, mouth, and chin) as the key regions (see Figure 1a). Considering that the angles and distances between the camera and the object probably affectthe detection performance, four distances (1 m, 2 m, 3 m, and 4 m) and nine angles (0–180°) are set for image collection. All collected images are labeled in forms that the YOLOv5 network can use by the “LabelImg” tool. A total of 898 effective infrared images are collected, and through data enhancement (including adding Gaussian noise, changing the brightness of images, cropping, translation, and mirroring), the infrared images used are increased to 5394. Figure 1b shows one typical subject’s nine infrared images from nine different angles (two meters’ distance from the camera).

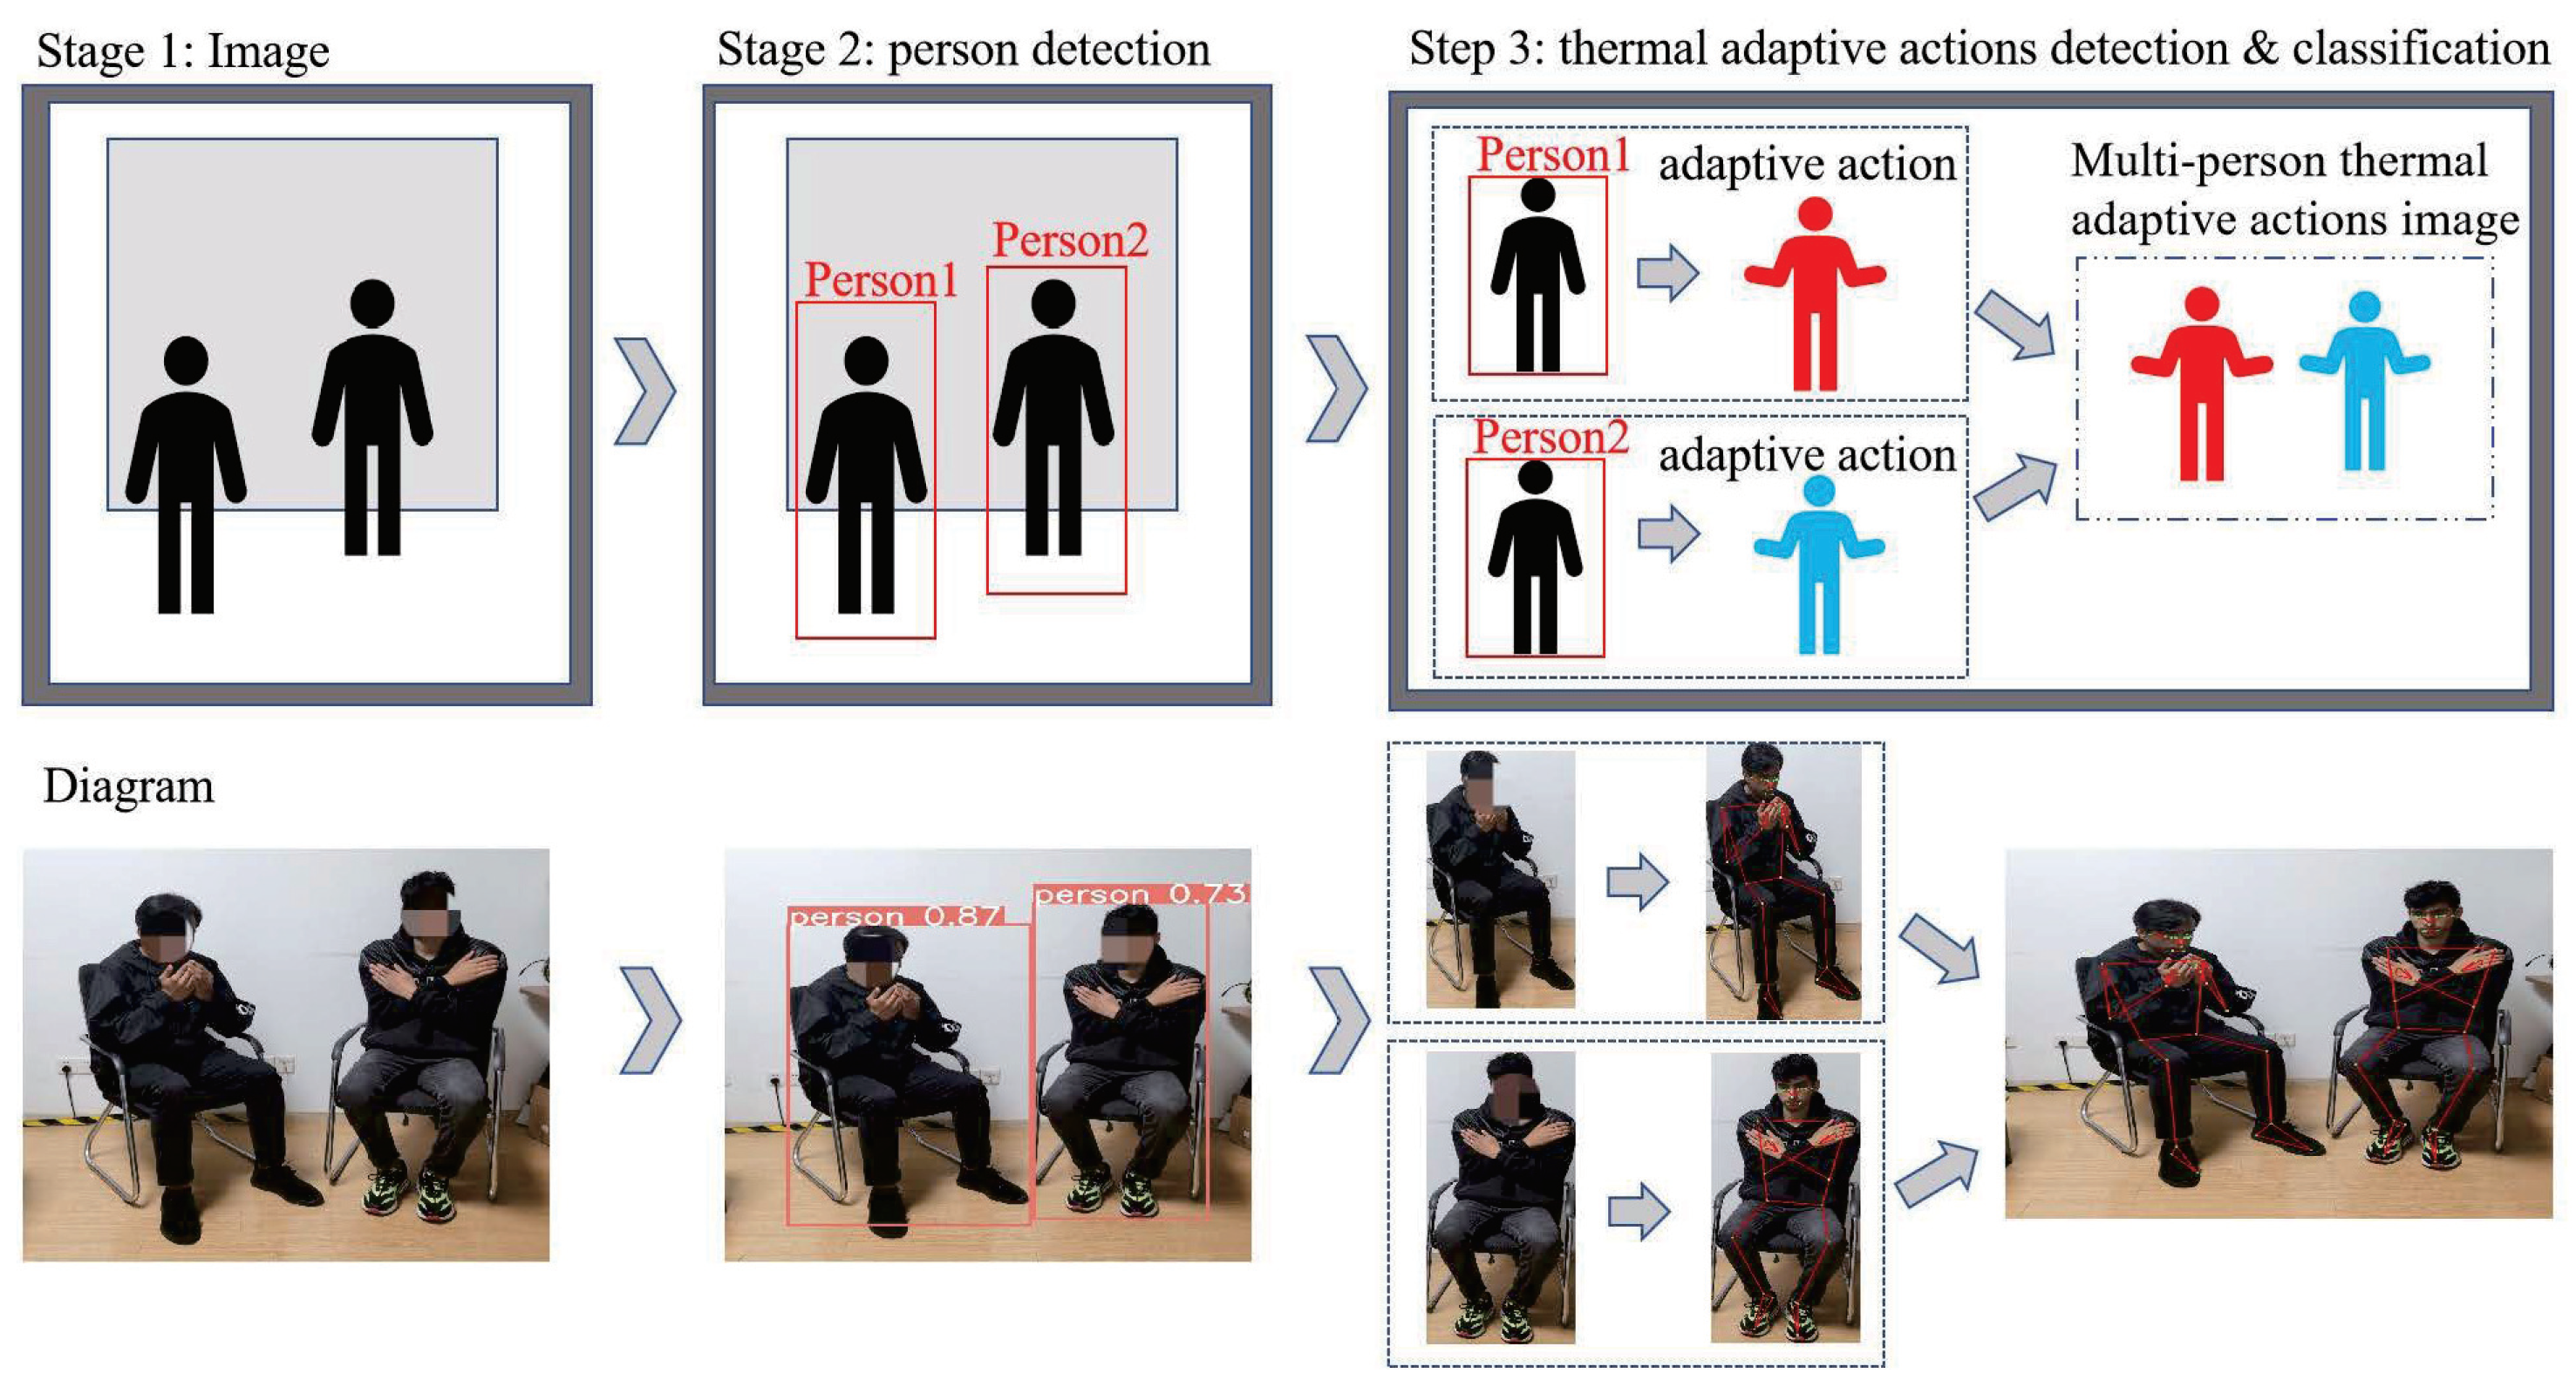
2.2. Thermal Adaptive Action Recognition Method

(1)
Action detection algorithm
For the thermal adaptive action detection, the Mediapipe tool box (developed by Google [62]) is applied in this study. It is based on a lightweight convolutional neural network architecture called BlazePose [63] for human posture estimation, and is characterized by ease of use, modular architecture, and good real-time performance. The topological structure of human posture consists of 33 key skeletal points [64]. A detector–tracker machine-learning pipeline [65] is used for two-stage human posture detection. Firstly, the pipeline uses the detector to locate ROI in the frame. Then, the tracker predicts the human posture’s landmarks (33 skeletal points) within the ROI. For this study, the detection of thermal adaptive actions has the following steps: (S1) Shoot video of thermal adaptive action and label it with corresponding action type. (S2) Input the video into Mediapipe, and detect/extract the position information of 33 skeletal points with a confidence level higher than 0.5. (S3) Use the skeletal points’ position data as inputs for data-driven model’s training and action prediction.
Considering practical application scenarios, a multi-person thermal adaptive action detection strategy is further designed by combining Mediapipe with the YOLO object detection algorithm. The main steps include the following: (S1) Identify human bodies in the multi-person image and obtain the position coordinate of each person’s recognition box by using the YOLO algorithm. (S2) Crop the multi-person image based on the recognition boxes, and transform the multi-person image into multiple single-person images. (S3) Detect the thermal adaptive action on each single-person image sequentially, and put back the detected images to achieve multi-person thermal adaptive action recognition. The schematic diagram is shown in Figure 2.
(2)
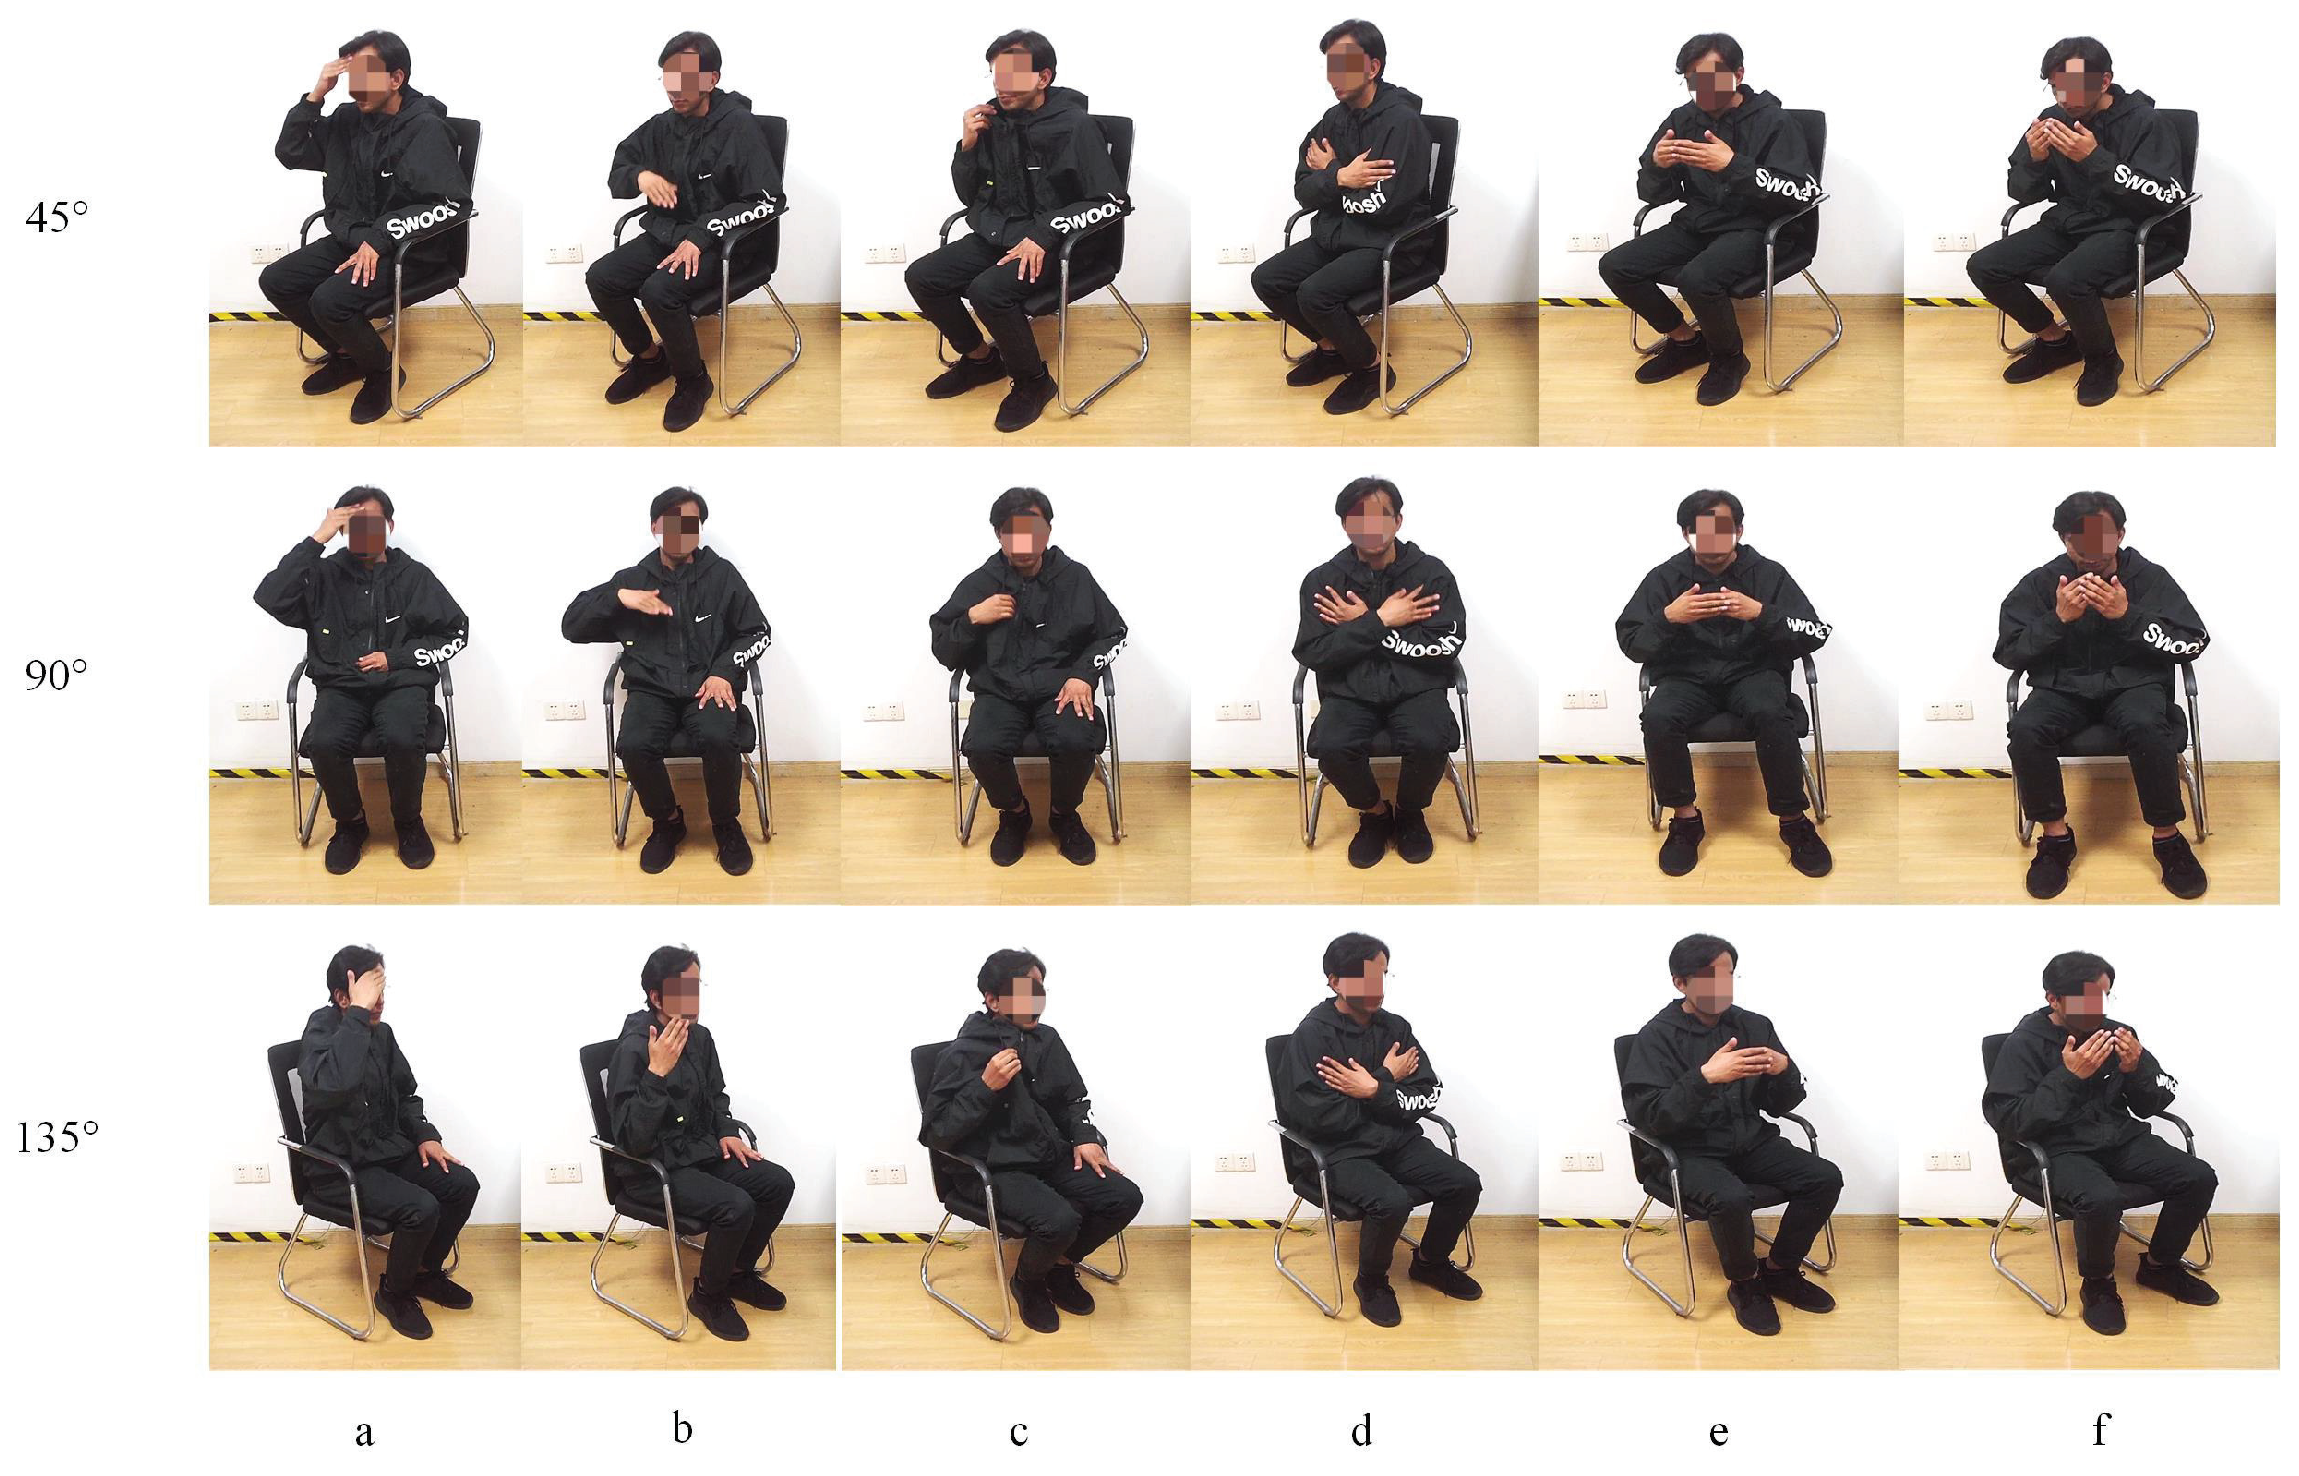
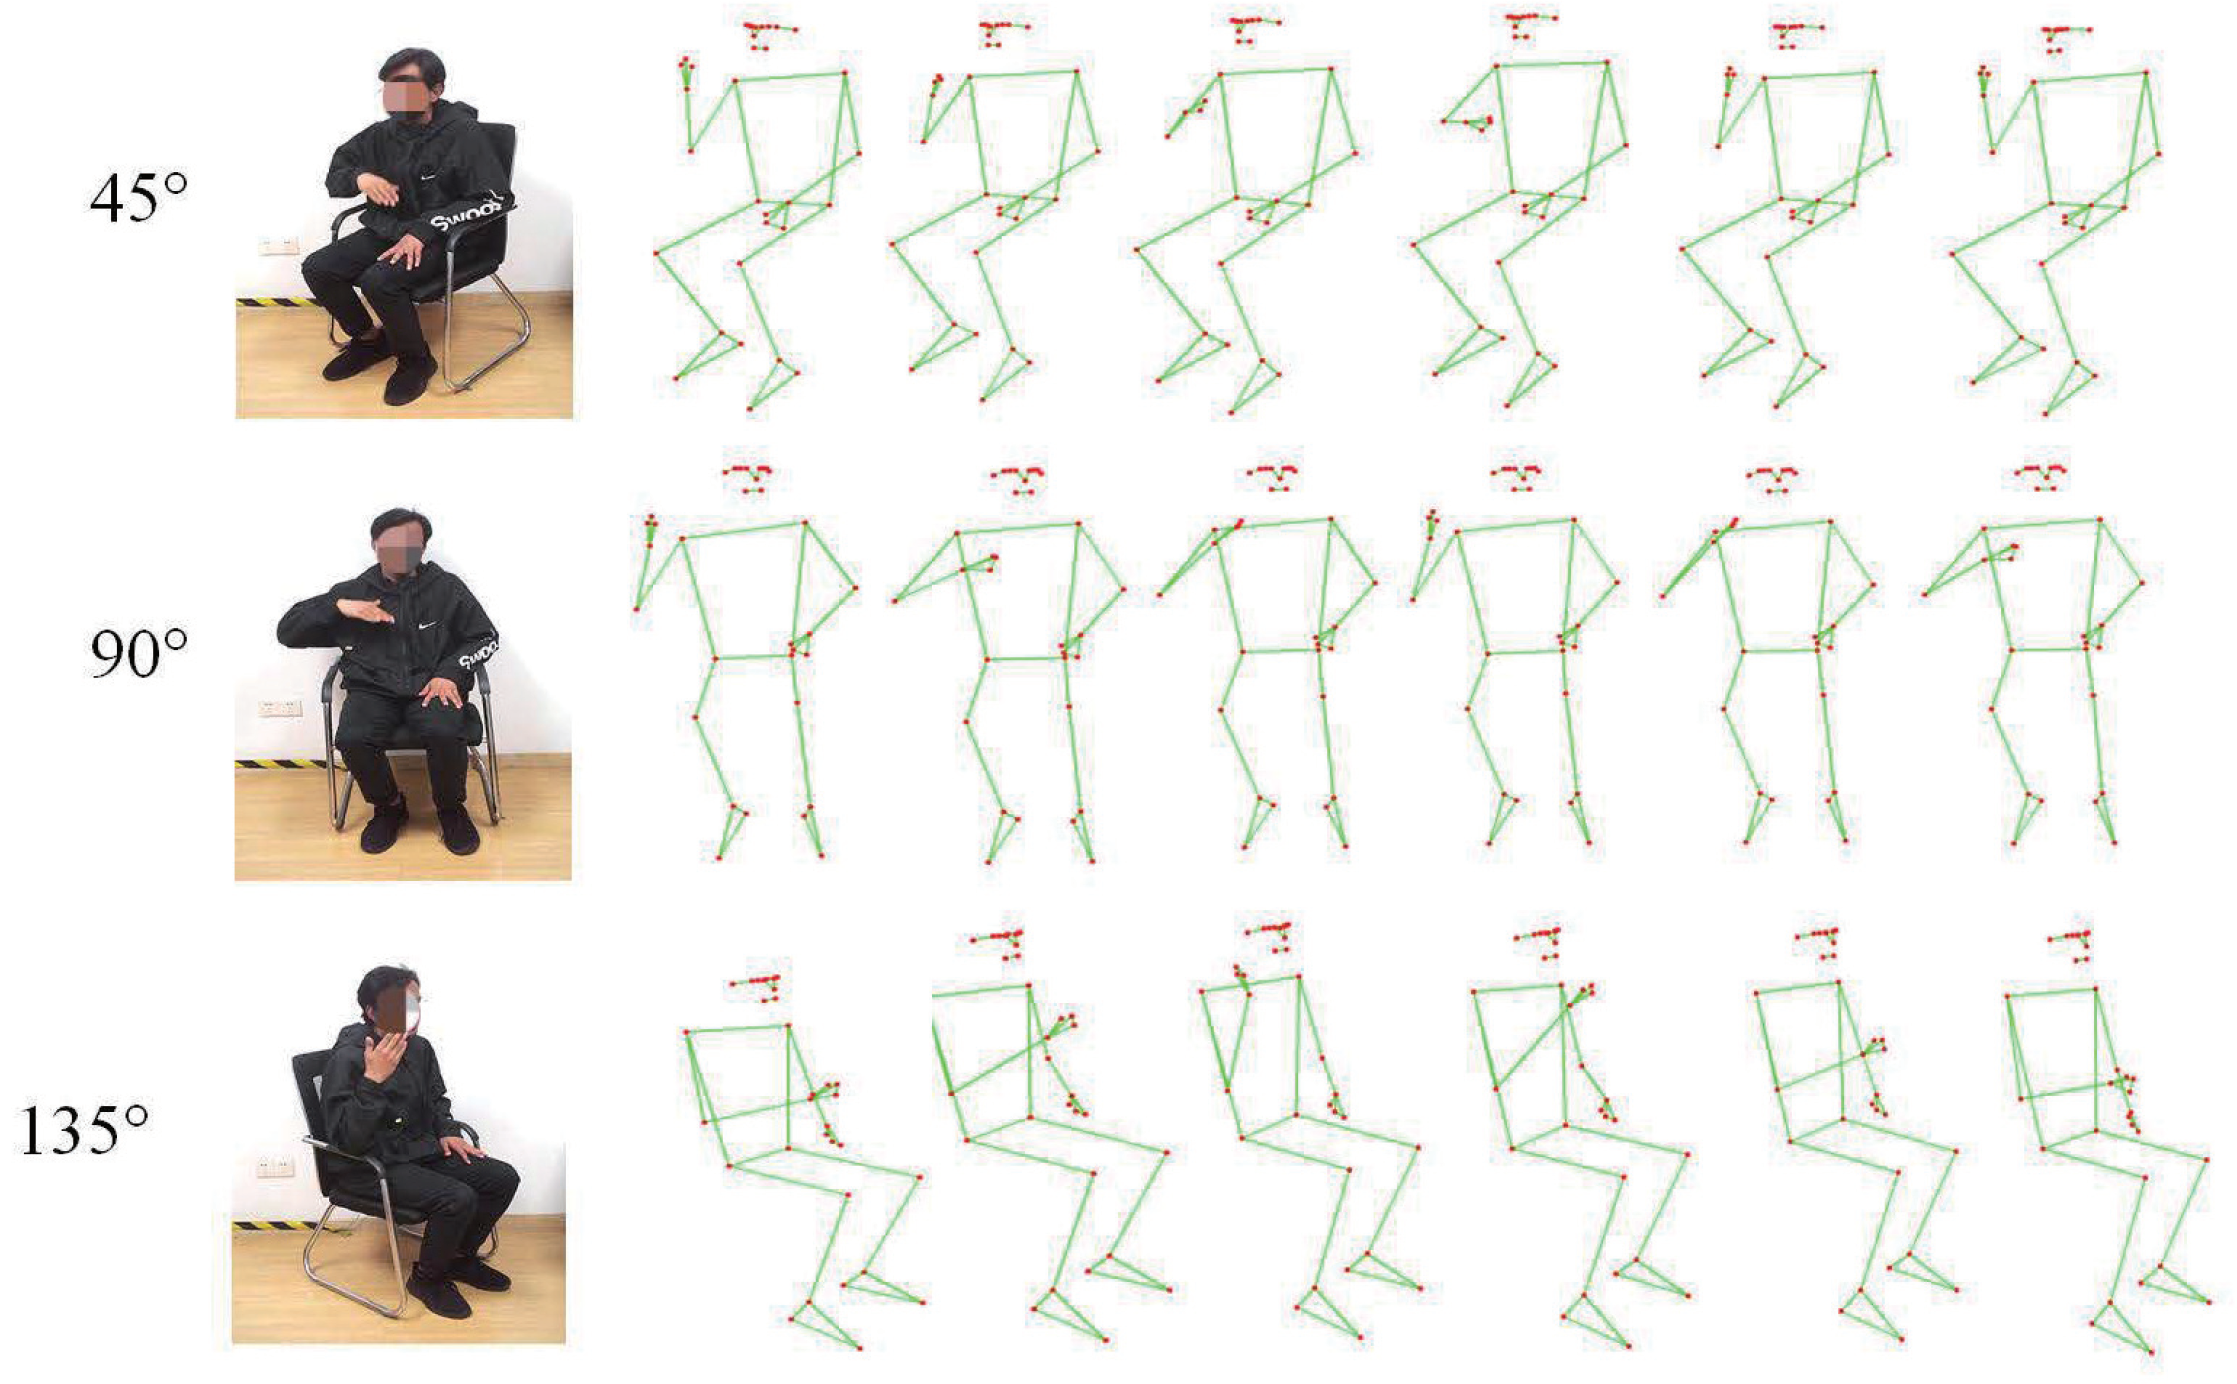
Dataset collection of skeletal points
Based on previous studies [48,49], six related thermal adaptive actions are selected for this study, which include wiping forehead, fanning oneself, shaking T-shirt, embracing both arms, blowing on hands, and rubbing hands. Considering that excessive angles and distances between the camera and human body probably affect the detection performance in practical applications, the thermal adaptive action video shooting is performed at three distances (1 m, 2 m, and 3 m) with three angles (45°, 90° and 135°), respectively. A total of 378 videos with a duration of approximately 6 s are recorded, with a total duration of 2268 s. Input the collected video into Mediapipe, and detect/extract the position information of skeletal points with a confidence level higher than 0.5. In this way, a dataset of thermal adaptive action skeletal points is constructed containing a total of 65,071 sets of skeletal points. Figure 3 records eighteen frames of six thermal adaptive actions performed by the typical subject (at three different angles from the camera). According to the visual changes between consecutive frames, the change of skeletal points is displayed by extracting one frame every ten. As an example, Figure 4 shows the changes in skeletal points while performing action of “fanning oneself” (three angles: 45°, 90°, and 135°).
(3)
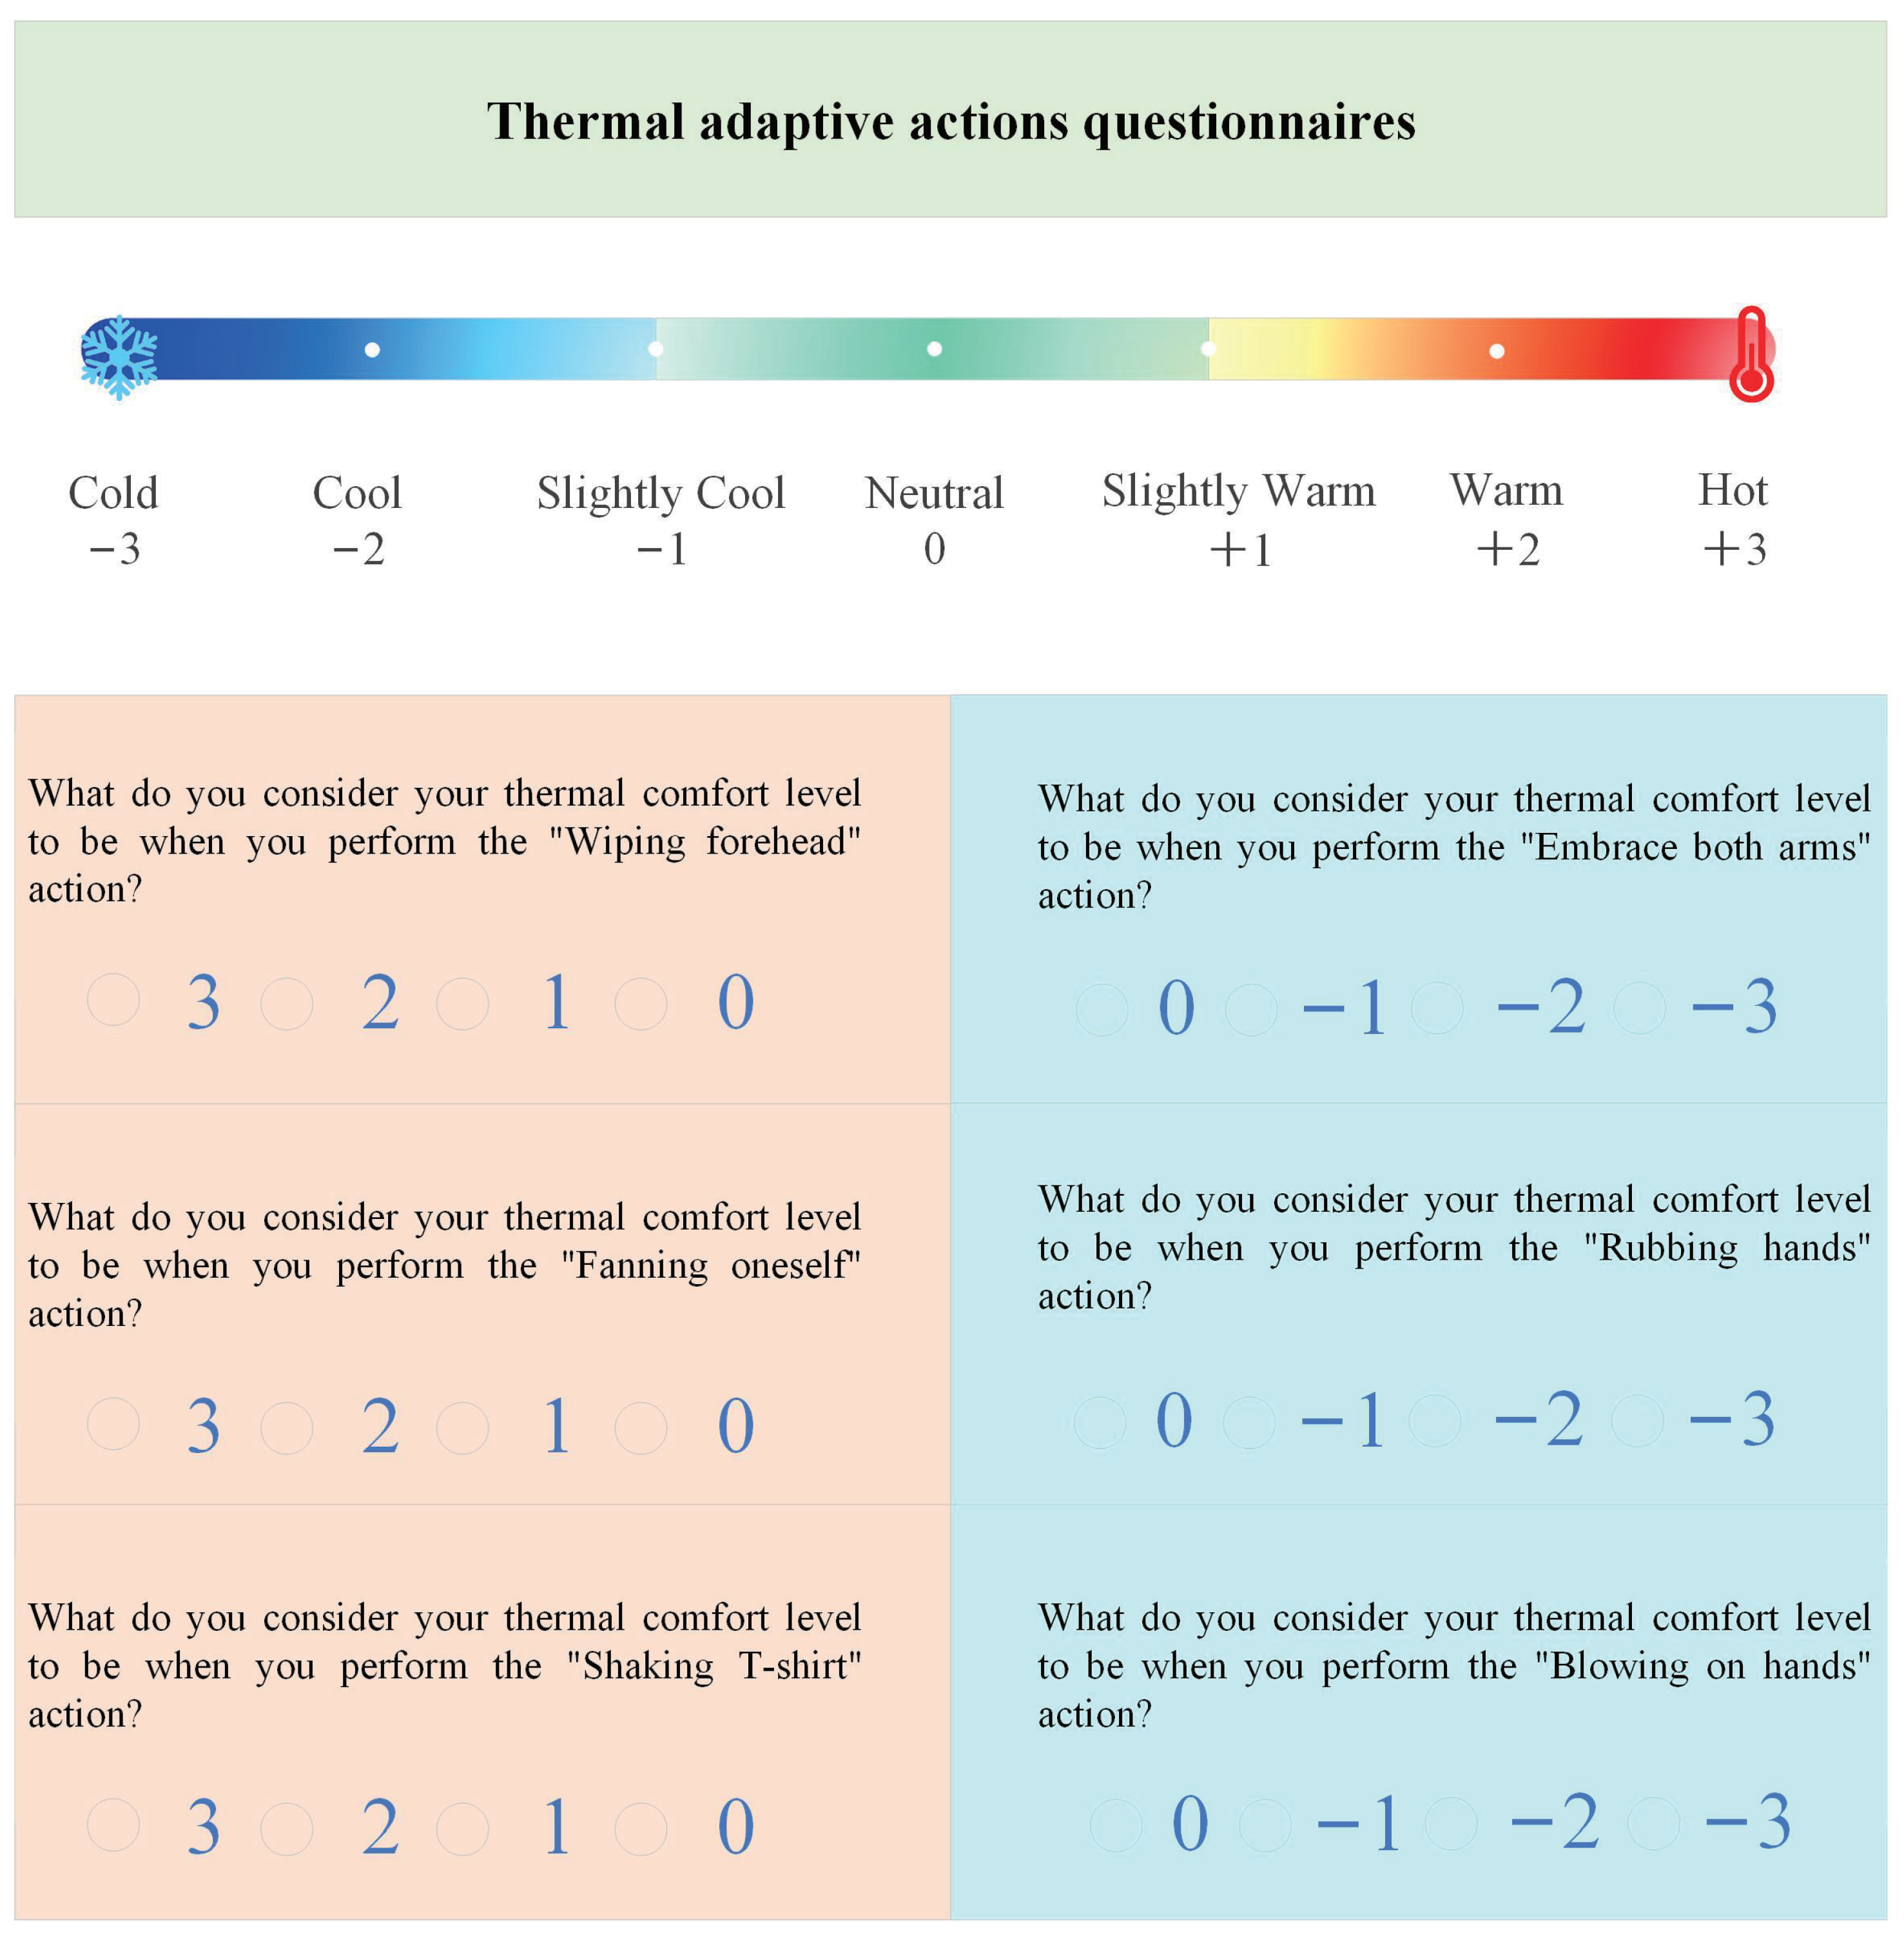
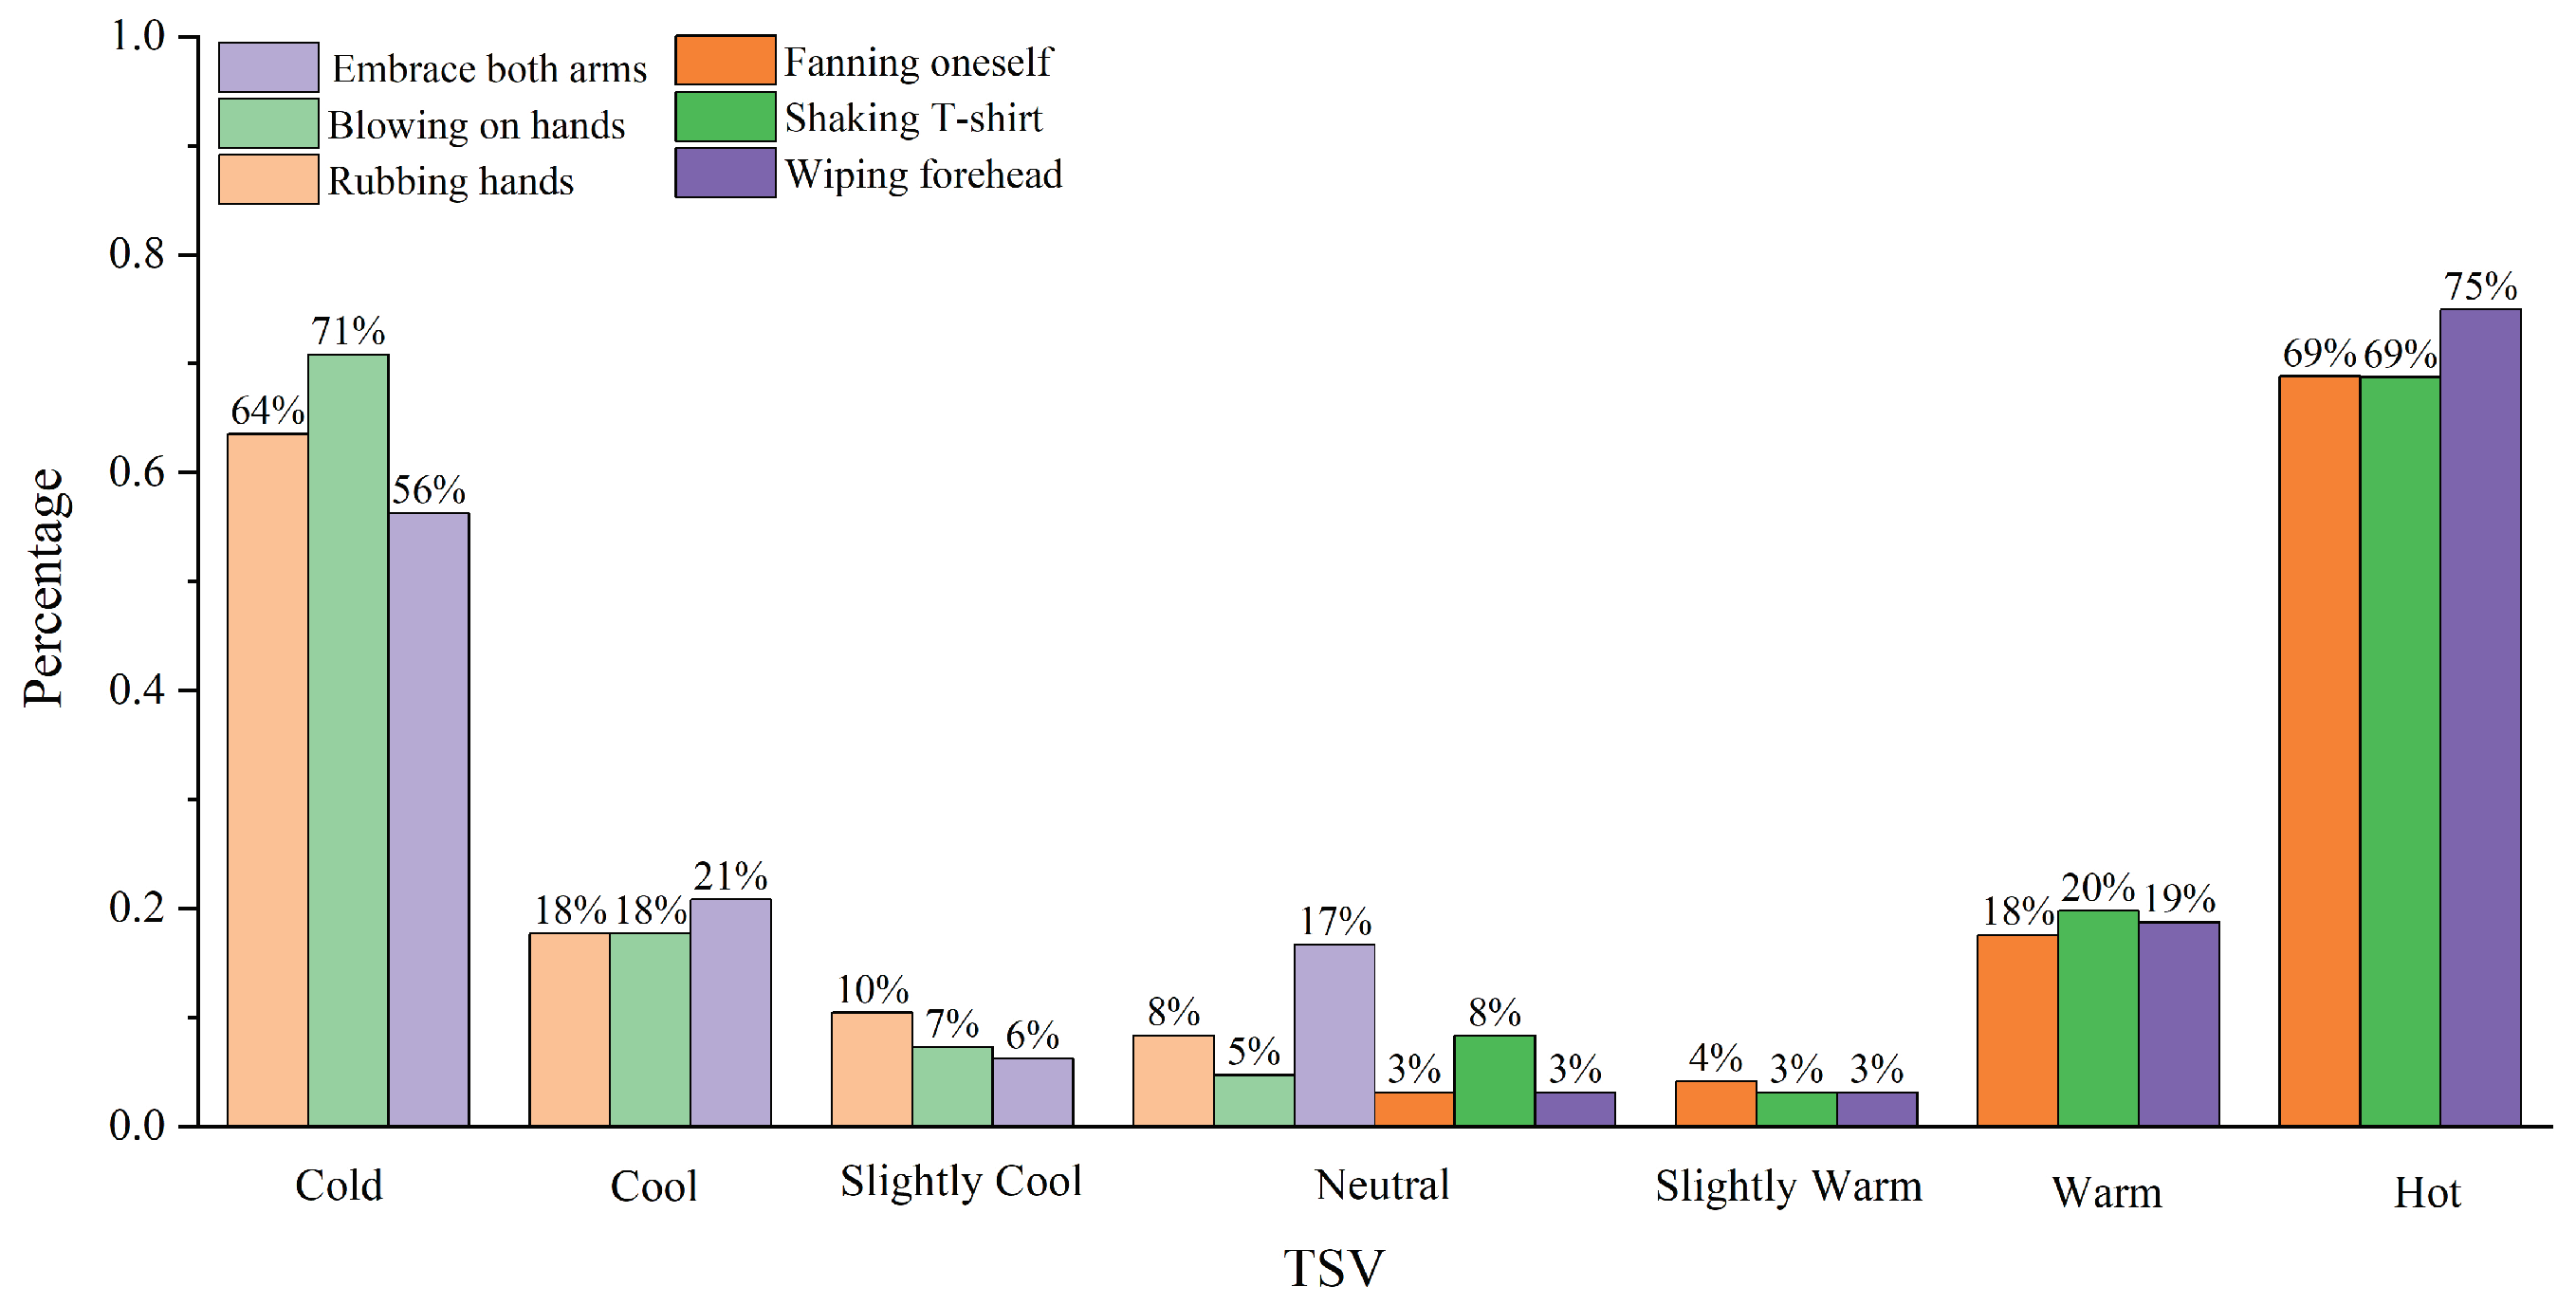
Determination of TSV levels corresponding to thermal adaptive actions
In order to determine the correspondence between each thermal adaptive action and the thermal sensation level (7-class), this study uses the result of survey questionnaires from 100 college students (98 valid questionnaires received). The survey questionnaire is designed in the form of an online answer sheet, details of which are shown in the Appendix A (Figure A1). It is noted that thermal sensations represented by people’s thermal adaptive actions are subjective to some extent. The statistical results of the voted thermal sensation level represented by each action are shown in Figure 5. For this study, the thermal sensation level of each action is determined by the weighted sum of voting proportions on all levels. Based on the results of survey questionnaires, the TSV levels of all six thermal adaptive actions are set as follows: wiping forehead (2.66), fanning oneself (2.47), shaking T-shirt (2.5), embrace both arms (−2.16), rubbing hands (−2.38), and blowing on hands (−2.56).

2.3. Thermal Comfort Prediction Model
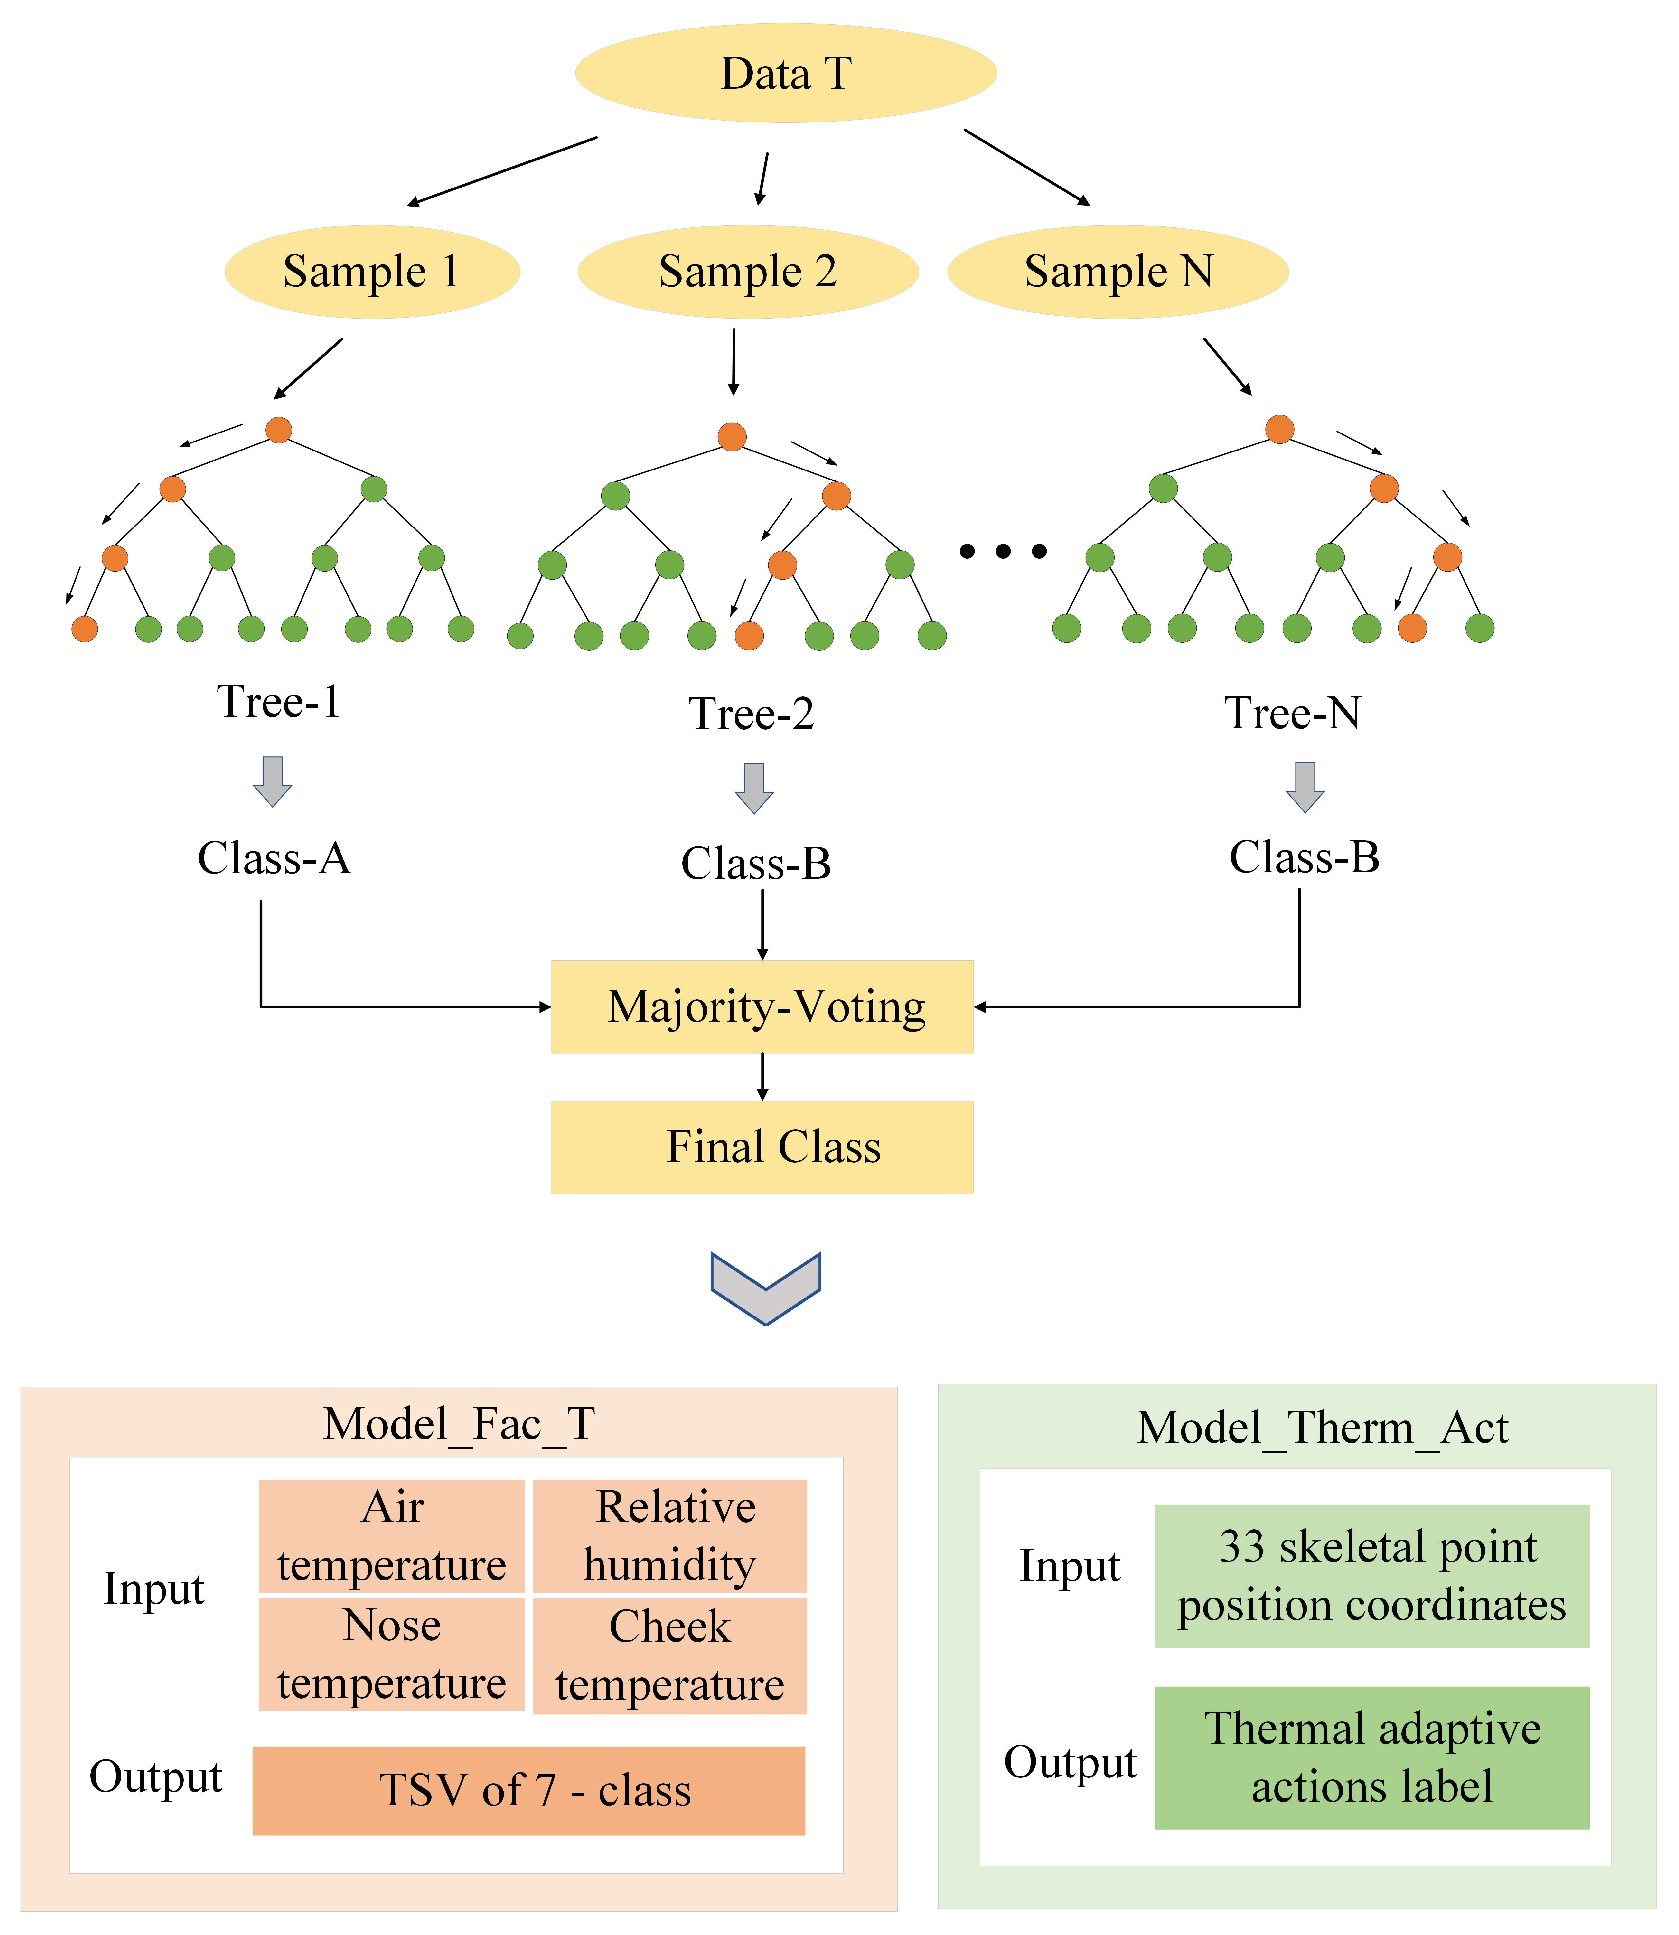
(1)
Random forest
Random forest [66] belongs to a bagging-type ensemble learning algorithm, and is suitable for multivariate classification problems such as thermal sensation assessment [21]. It combines multiple weak classifiers and can achieve high accuracy and generalization performance through voting or taking the mean. In this study, RF is used for thermal comfort prediction based on human facial temperatures (called Model_Fac_T). The proposed thermal adaptive action detection model (called Model_Therm_Act) is also based on RF algorithm. The main steps of RF are as follows:
(S1) Given a dataset T (containing facial skin temperatures or thermal adaptive actions), randomly generate N sample sets with dropout based on bootstrap method. By using the N sample sets, train the corresponding decision trees: Tree-1, Tree-2, …, Tree-N.
(S2) For each node on the decision tree, randomly select m features from the M features in the sample set ( m M ), and calculate the optimal splitting method with these m features based on the Gini index.
(S3) During the decision tree’s forming process, each node must be split according to Step 2 until it can no longer be split. No pruning operation is used during the entire forming process.
(S4) The random forest model is built by establishing multiple decision trees according to the above steps. Count the prediction results of each decision tree and use a voting mechanism to select the predicted value with the most occurrences as the final prediction result.
The schematic diagram of the basic RF and its applications in this study are shown in Figure 6.
(2)
Fusion strategy
By using an infrared camera and a temperature/humidity sensor, and by utilizing the above detection and modeling methods, human thermal comfort prediction models based on facial temperature and thermal adaptive actions can be obtained, respectively. In addition, through environmental temperature and humidity measurements, the traditional PMV result can also be estimated. The thermal comfort prediction results of these three types of models are combined together with a weighted fusion method. A non-invasive multivariate human thermal comfort prediction framework is designed for this study. The basic fusion equations are as follows:
L total = α 1 L f a c _ T + α 2 L t h e r m _ a c t + α 3 L p m v ,
α 1 = P Y O L O P R F / 2 i f a c t i o n d e t e c t e d , P Y O L O P R F i f n o a c t i o n d e t e c t e d ,
α 2 = P m e d i a p i p e / 2 i f a c t i o n d e t e c t e d , 0 i f n o a c t i o n d e t e c t e d ,
α 3 = 1 α 1 α 2 ,
where L F a c _ T is the thermal comfort level predicted by Model_Fac_T, L t h e r m _ a c t is the product sum of the predicted action’s voted TSV values, L p m v is the PMV value calculated under the ASHRAE standard [13], and L t o t a l is the fusion result. The weighting values of α 1 to α 3 are related to the accuracy of non-invasive recognition. The higher the accuracy, the greater the corresponding weight. Specifically, α 1 represents the weight of facial temperature-based TSV prediction, which is composed of the product of P Y O L O and P R F , where P Y O L O is the mean average precision of facial key-region recognition and P R F is the TSV prediction accuracy of the RF model (Model_Fac_T). α 2 represents the weight of thermal adaptive action prediction, and P m e d i a p i p e is the recognizing accuracy of thermal adaptive actions based on Mediapipe. P Y O L O , P R F , and P m e d i a p i p e are static values obtained in offline evaluation to reflect the relative contribution of each model in the fusion strategy. α 3 is the weight of PMV result. Such weight setting can normalize the sum of three weights to be 1. When no thermal adaptive action is detected, α 2 is set to zero, and the fusion result mainly depends on the prediction of facial temperature and PMV. When the detections of facial temperature and thermal adaptive action both fail, α 1 and α 2 are zeros, which means the prediction model degenerates into the traditional PMV model.

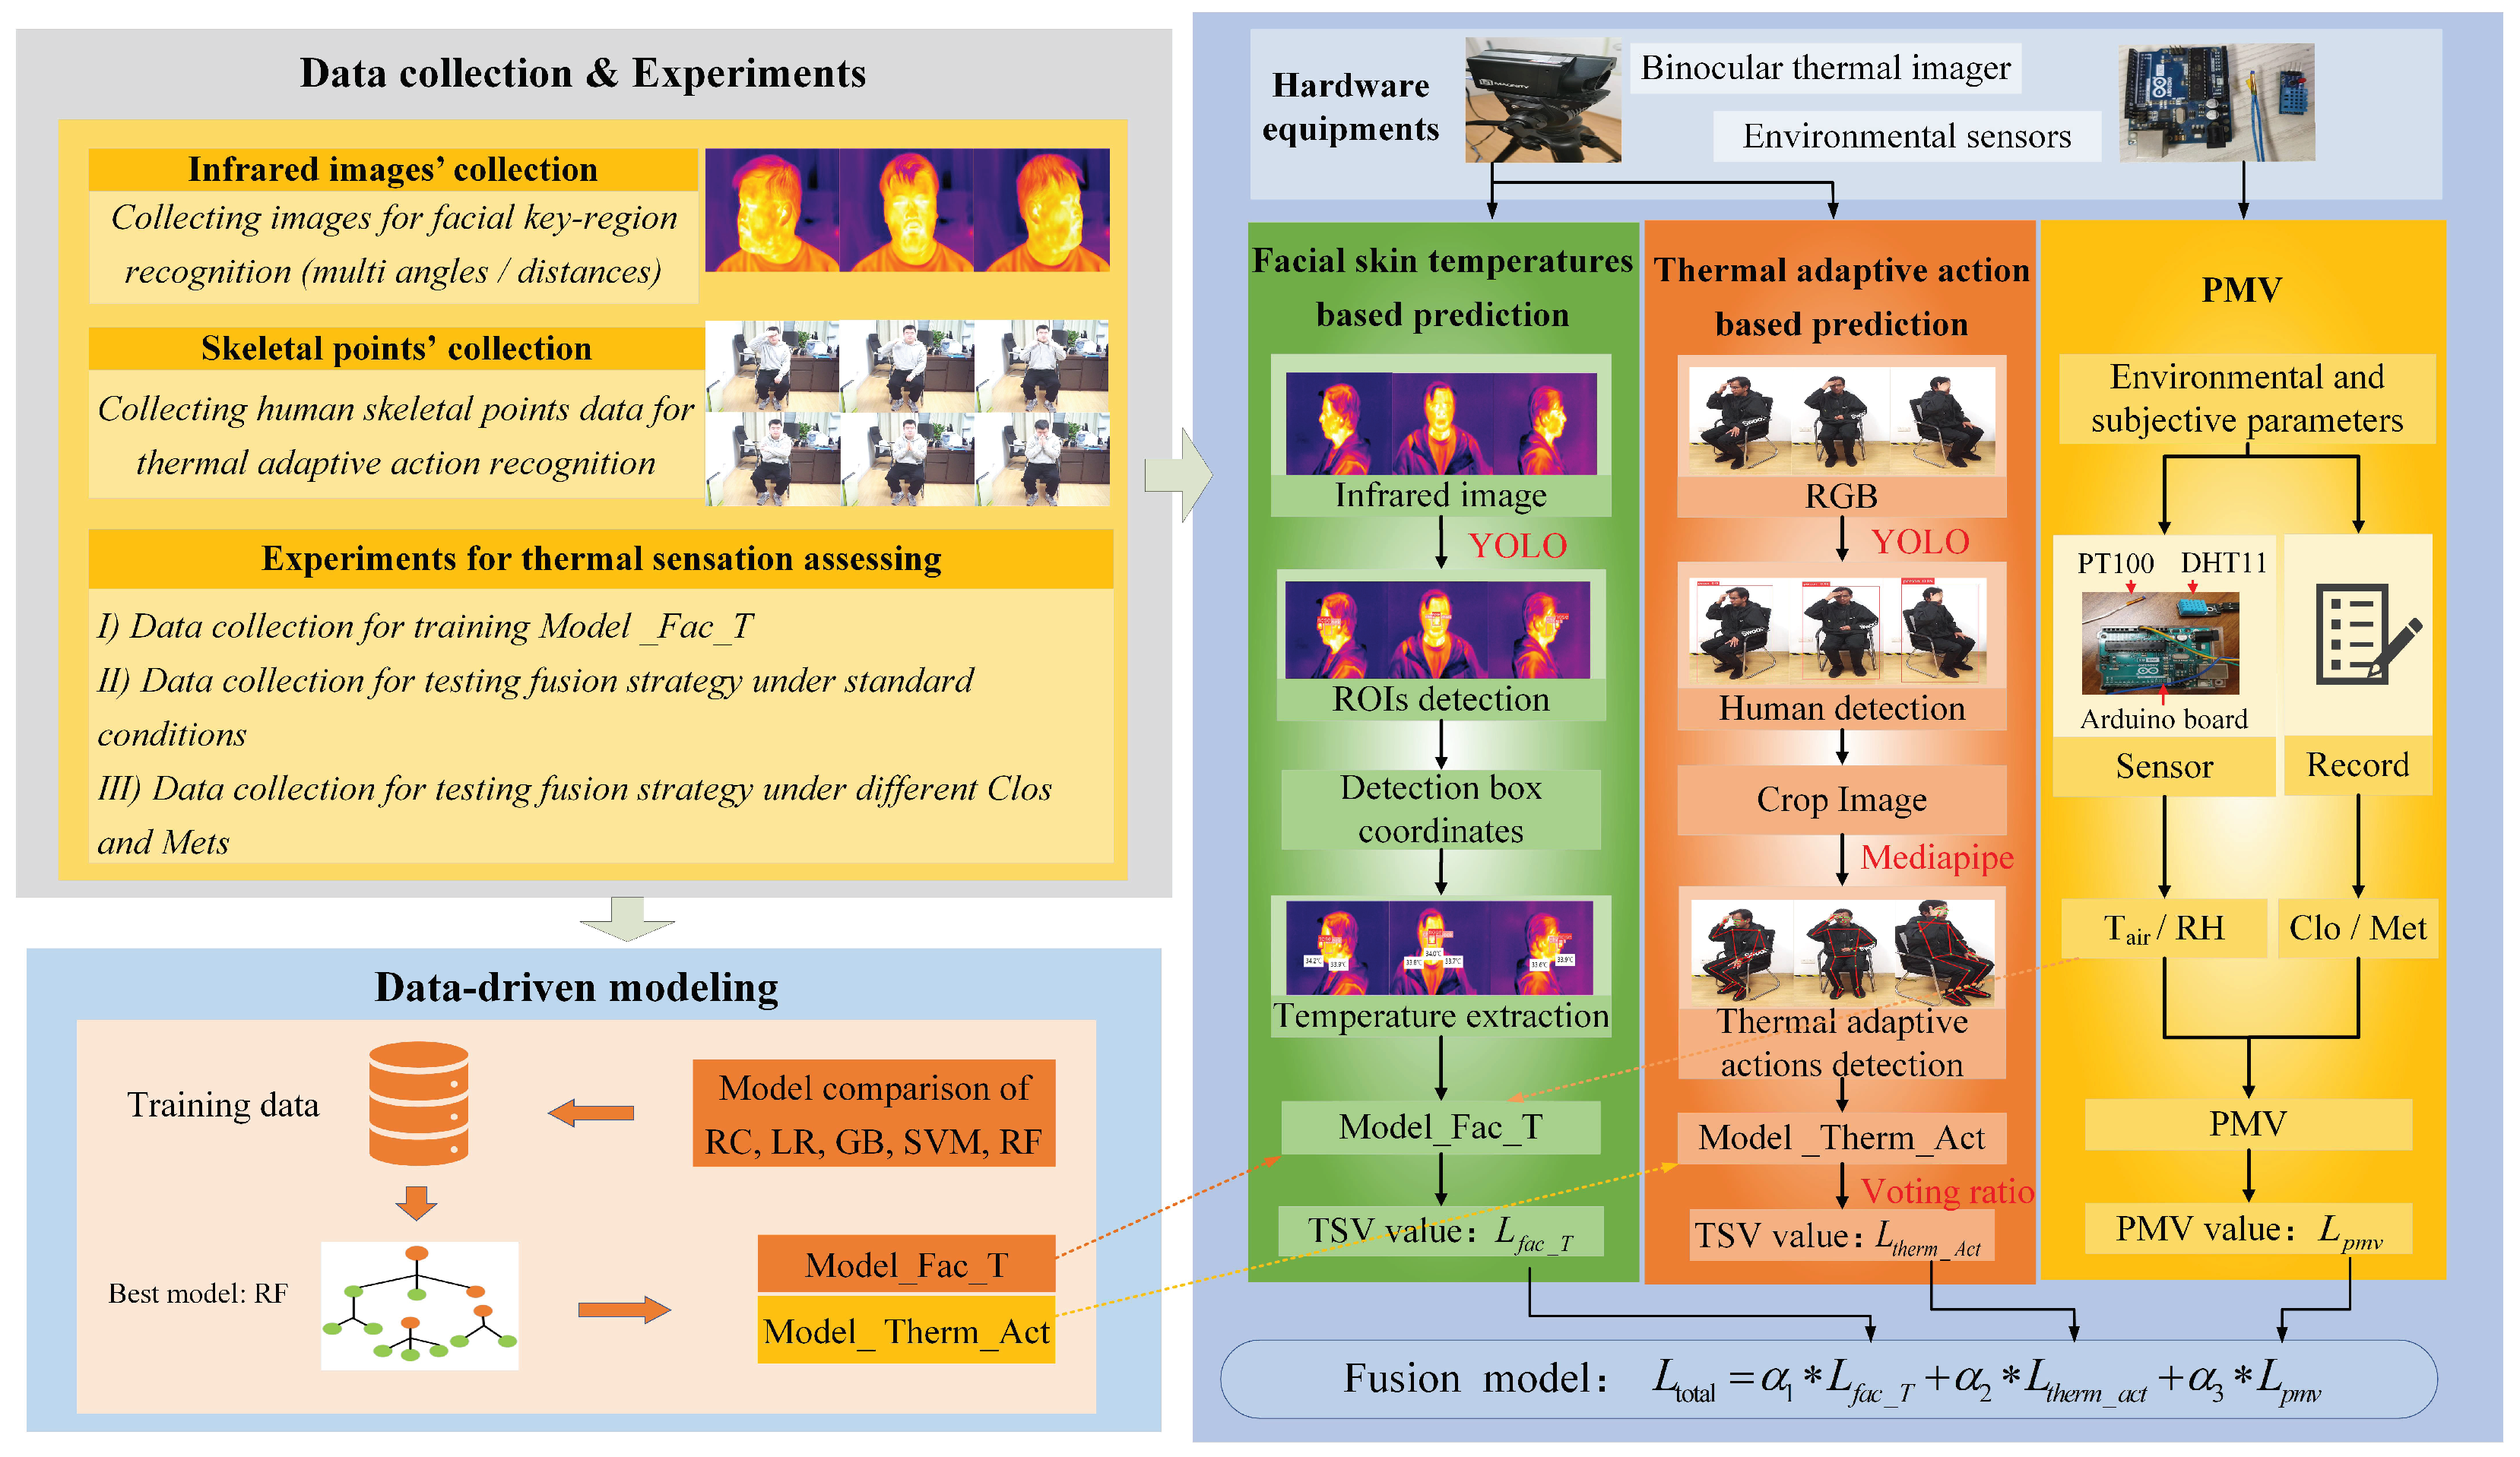
2.4. Overall Framework

Based on the methods described above, the overall framework of this study is specified as follows. By using one binocular infrared camera, facial key-region temperatures are detected by YOLO algorithm. Based on collected field experimental data set (experiment I, Section 2.5 (3)), the corresponding thermal comfort predictive model (Model_Fac_T) is built using RF algorithm. Meanwhile, skeletal-point data of six typical thermal adaptive actions are detected and collected by YOLO and Mediapipe tool. The corresponding action recognition model (Model_Therm_Act) is also built by RF. It is noted that classifier RF is selected by performance comparison of five different data-driven models. Additionally, the PMV result is also calculated through environmental temperature/humidity measurements.
In the proposed multi-variable fusion strategy of thermal comfort prediction, the three types of models are combined with a weighted average method. The weighting values of α 1 α 3 are related to the accuracies of non-invasive recognitions. The higher the accuracy, the greater the corresponding weight. The performance validation of the proposed strategy is carried out by using data sets collected by experiments II and III (Section 2.5 (3)). Figure 7 shows the overall framework of this study.

2.5. Data Collection Experiment

(1)
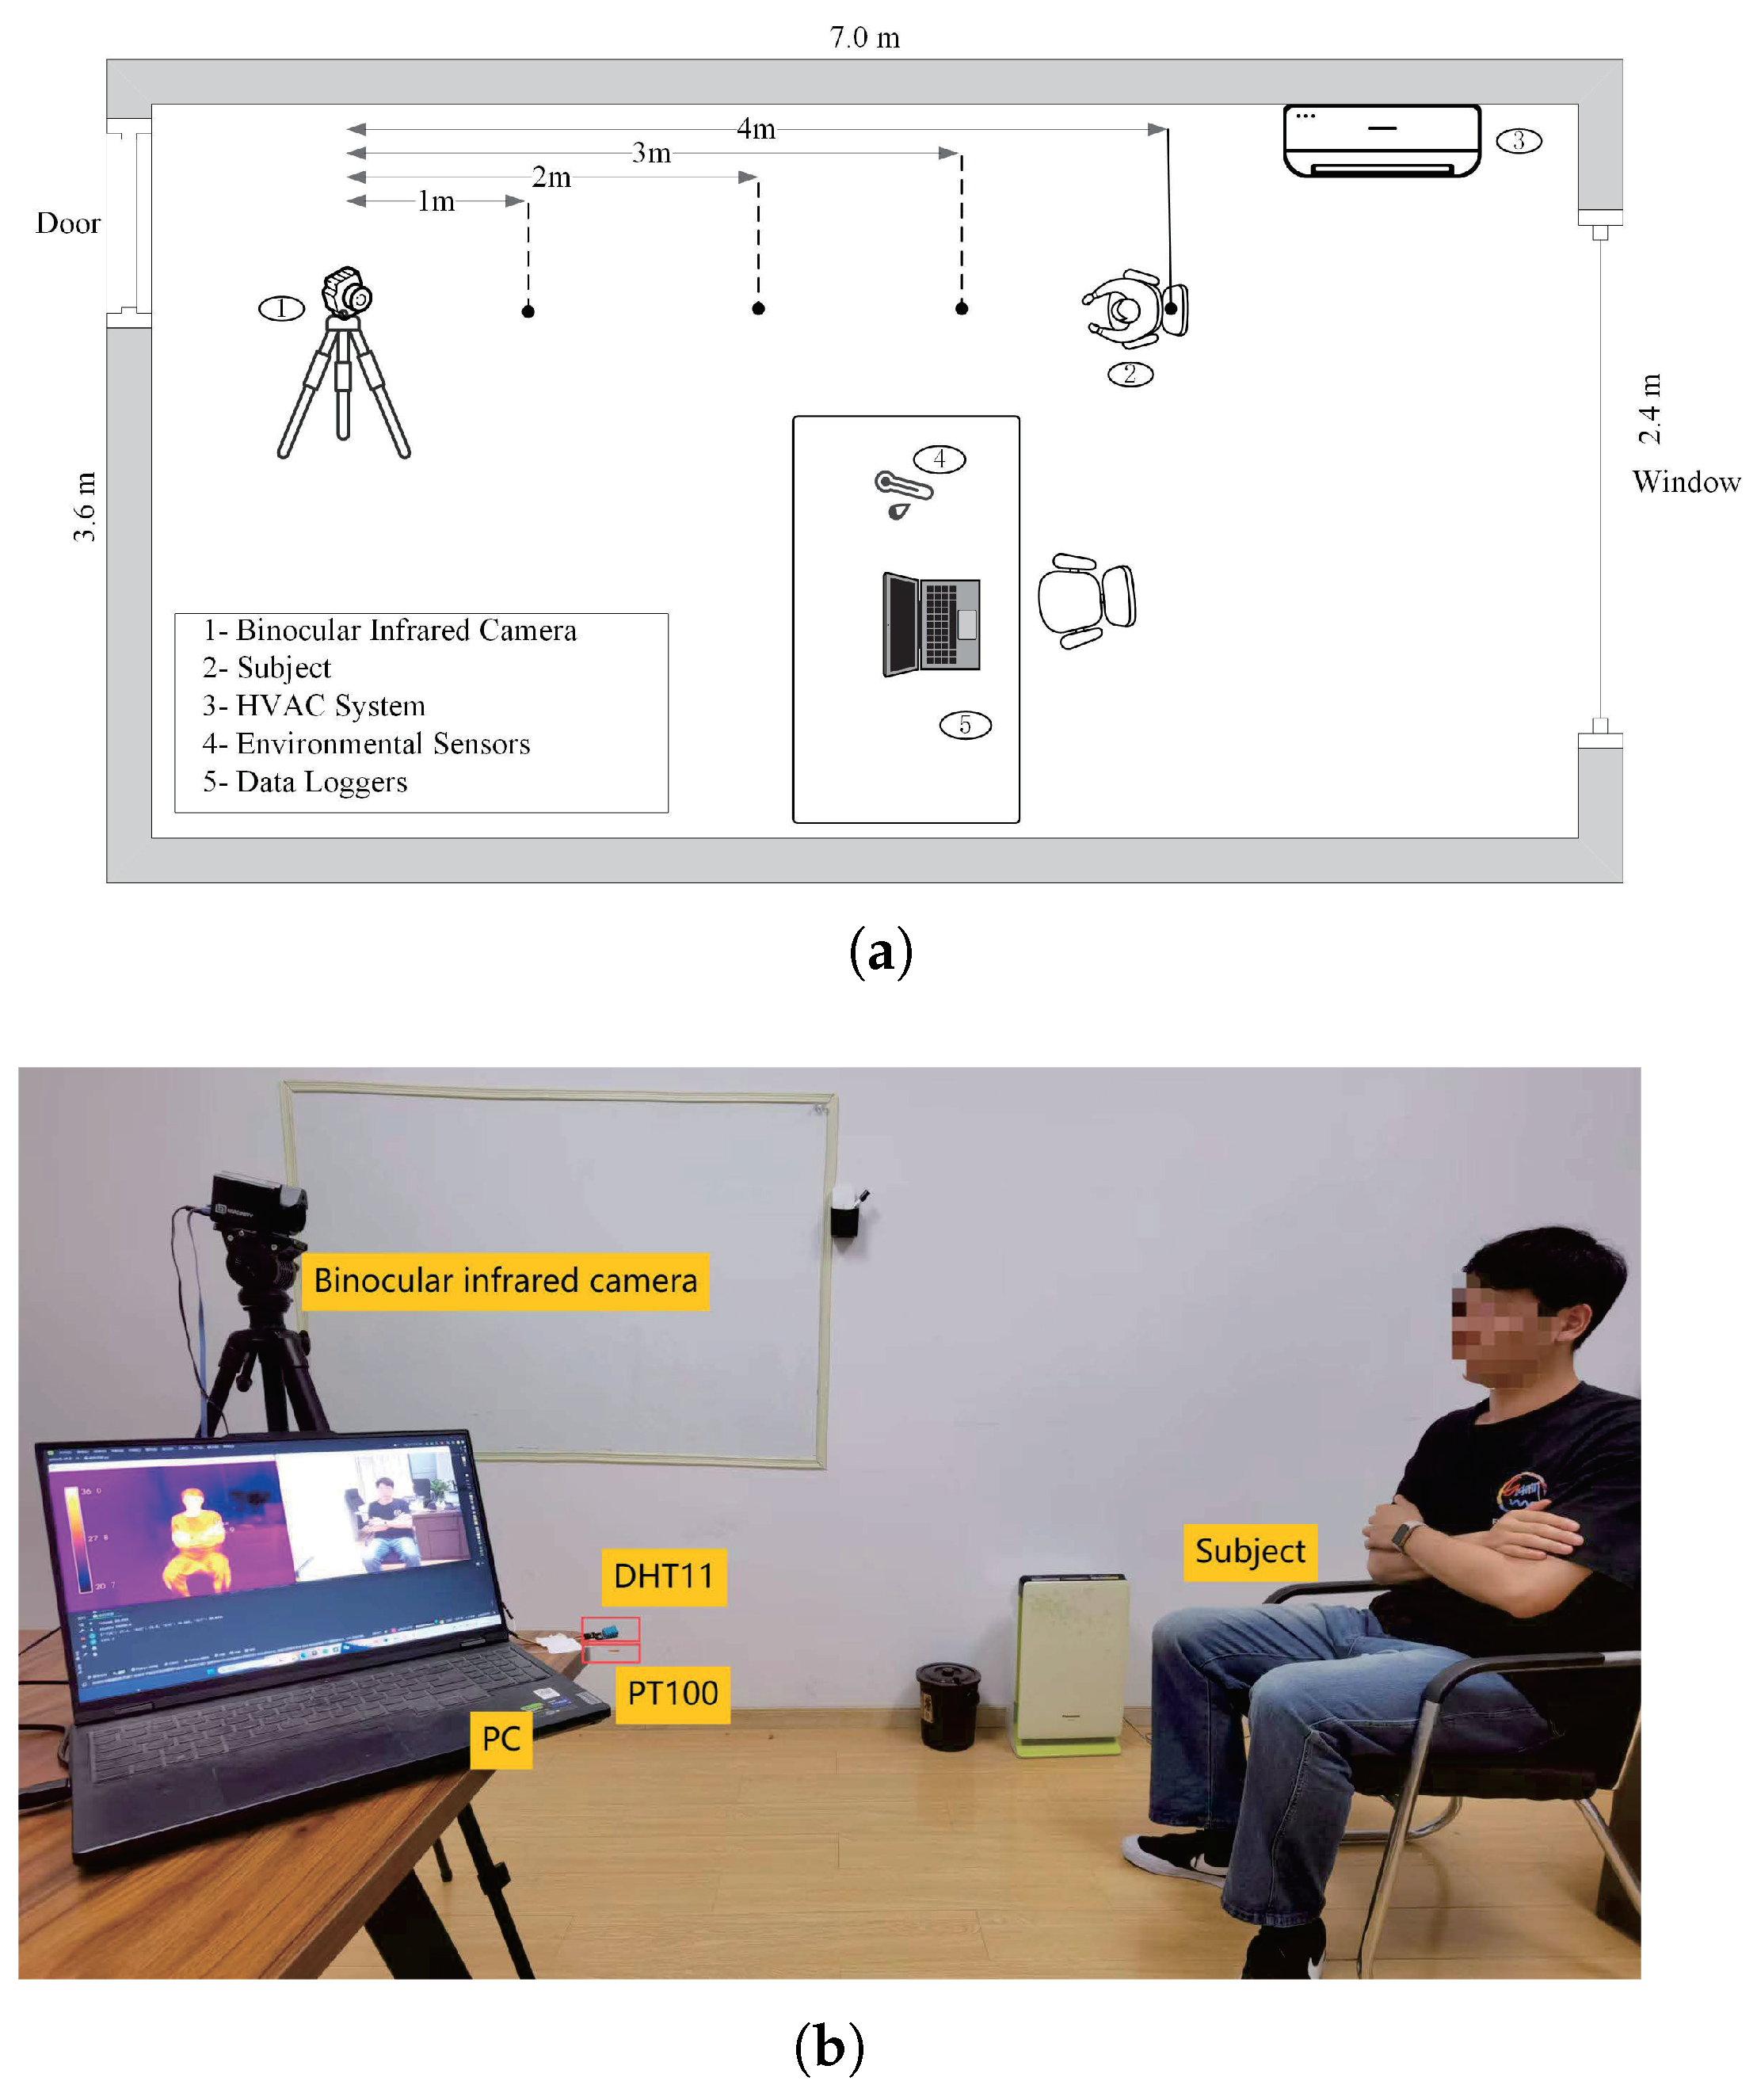
Experimental environment and equipments
Data collection experiments are conducted in a standard office environment (7.0 m in length and 3.6 m width) at Jiangsu University in Zhenjiang, China. The indoor environment is regulated by a suspended air conditioning system with the controlled temperature range of 16–30 °C. The indoor wind speed is less than 0.1 m/s. The environmental parameters include indoor temperature ( T a i r ) and relative humidity ( R H ), collected through sensors of DHT11 (Sinochip Electronics, China) and PT100 (YIMENGWEI, China). These sensors are placed on a test bench at a height of 0.7 m from the ground. This is close to the ASHRAE standard (0.6 m) [67]. A binocular infrared thermal imager MAG-RT384 (MAGNITY, China) is placed in front of the subject (2 m, 90°). The equipment has the temperature measurement accuracy of 0.4 °C, visible light resolution of 1920 ∗ 1080, and infrared resolution of 384 ∗ 288. The experimental site and room layout are shown in Figure 8.
(2)
Subjects and TSV levels
This study recruits 17 subjects for data collection experiments, including 10 males and 7 females, aged between 23 and 28, with BMIs within the normal range. The essential physiological statistical data of all subjects are listed in Table 2. All subjects undergo a physical and mental health (stress level) assessment before the experiment. They are also required to avoid activities such as staying up late, taking medication, drinking alcohol, or engaging in vigorous exercise before the experiment. All subjects are required to wear typical summer clothing in the experiment. The calculation of clothing thermal resistance is based on the Evaluation Standard for Indoor Thermal and Humid Environment of Civil Buildings (CHINA, GB/T 50785-2012) [68]. Under standard experimental conditions, participants wear a T-shirt (0.15 clo; clo is a commonly used unit to represent the clothing thermal resistance), trousers (0.15 clo), underwear (0.05 clo), short socks (0.02 clo), and sports shoes (0.02 clo), resulting in a total clothing thermal resistance of 0.39 clo. The clothing style is consistent with that shown in the experimental graph, with no significant differences between male and female participants. Under the altered thermal resistance condition, participants additionally wear a lightweight sweatshirt (0.2 clo), increasing the total thermal resistance to 0.59 clo. Due to the need for capturing infrared images of their faces, each subject’s consent is obtained prior to the experiment. In this study, two kinds of TSVs (7-class and 3-class) are both applied according to the ASHRAE standard.
(3)
Experiment process and experiment content
The data collection experiment was conducted from July to October 2023. The entire experiment procedure consists of three stages: the preparation stage, and the first/repetition stages. At the preparation stage, the experimental environment and equipment are prepared. The subject is asked to stabilize his (her) physical and mental states outside of the test room for 20 min. In the meantime, subjects are informed about the details of experimental procedure, including TSV voting levels, experimental procedures, data collection methods (non-invasive), confidentiality of personal information, and voluntary principles that comply with ethical requirements. To mitigate potential bias arising from psychological expectations, participants are not informed beforehand of the specific environmental temperature setpoints. They are only informed that the environmental conditions during the experiment can change. Then, the subject enters the room and the first stage begins. In the first 20 min of this stage ( B 1 ), the subject re-stabilizes his physical and mental states to the indoor thermal conditions. During the following 5 min ( B 2 ), the subject performs the thermal sensation voting. In the meantime, his infrared images are taken, and the environmental information is recorded. After that, the repetition stage begins. The ambient temperature is decreased by 2 °C a total of six times (from around 30 °C to around 18 °C). The experiment procedure is consistent with that in the first stage. It is noted that when a thermal adaptive action is detected, the corresponding thermal vote and infrared images are collected immediately to ensure the consistency of time tags. A detailed experimental procedure is shown in Figure 9. During the adaptation stage of the subject to the environment ( B 1 and C 2 ), the subject is allowed to engage in some chatting, reading, and other relaxing activities. All permitted activities have low metabolic rate, aiming to maintain emotional stability and to prevent the effects of physiological discomfort caused by mood swings on voting. These activities show minimal differences in metabolic level and do not significantly affect skin temperature or subjective thermal perception.
According to the above steps, three experiment contents (I–III) are carried out separately. Experiment I is conducted to collect data for the training of Model_Fac_T. The collected data include environmental temperature/humidity, skin temperature of facial key regions ( T n o s e and T c h e e k ), and TSV votes. Among them, the average temperatures of facial regions are manually extracted through ThermoScope (developed by MAGNITY, China). A total of 168 data sets are collected according to the above experimental procedure. It is noted that data collection for the training of Model_Therm_Act is performed in advance, which is already described in Section 2.2 (2).
Based on these two trained models, experiments II and III are conducted to collect data for performance testing of the proposed fusion strategy. In experiment II, the probable thermal adaptive actions are also recorded in addition to the collected data items of experiment I. A total of 140 sets of experimental data are collected. The data details can be found in Table 3. It is noted that in experiments I and II, subjects are required to wear typical summer clothing (with a thermal resistance of about 0.39 clo) simulating normal office conditions (1 met; met is a unit of metabolic level).
To further test the prediction ability of the proposed model in different clothing and metabolic level, experiment III is designed to form a more widely distributed testing data set. In this experiment, subjects are required to put on an extra thin coat to change thermal resistance by 0.2 clo. Subjects are required to perform 10 push-ups immediately before stages B 2 or C 3 to change the metabolic level by 2 mets. The procedure of data collection is consistent with experiment II, with a total of 210 datasets collected. Note: A total of 17 subjects are recruited for these three experiments. Subjects randomly participate in different experiments, and each subject participates in the same experiment up to two times.

3. Results

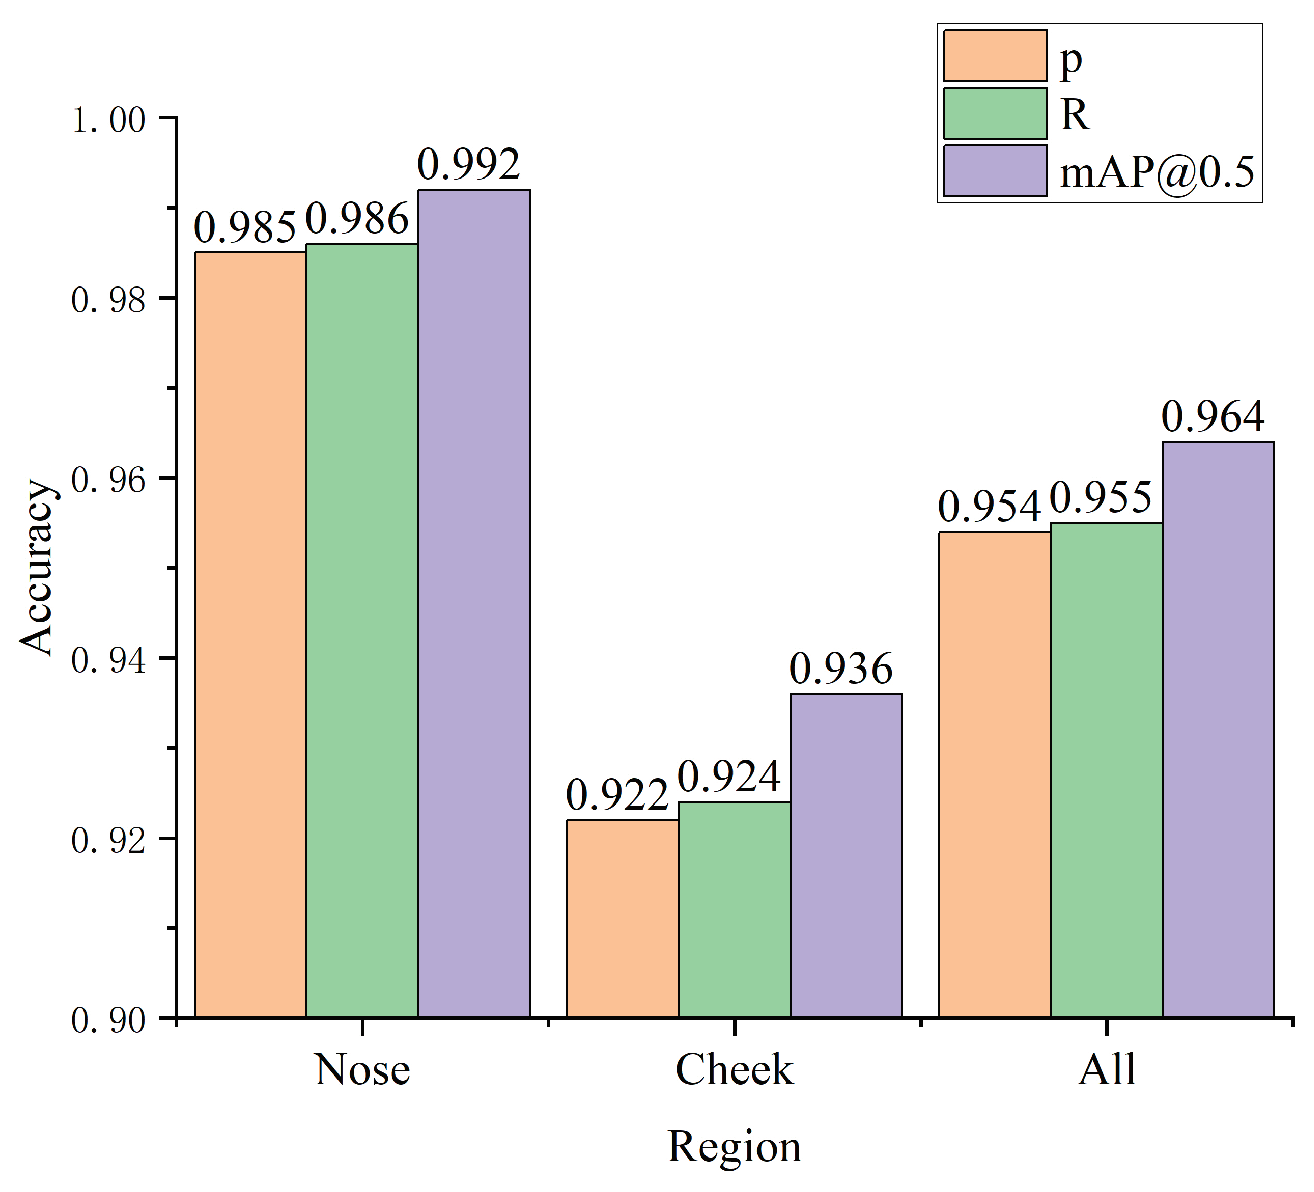
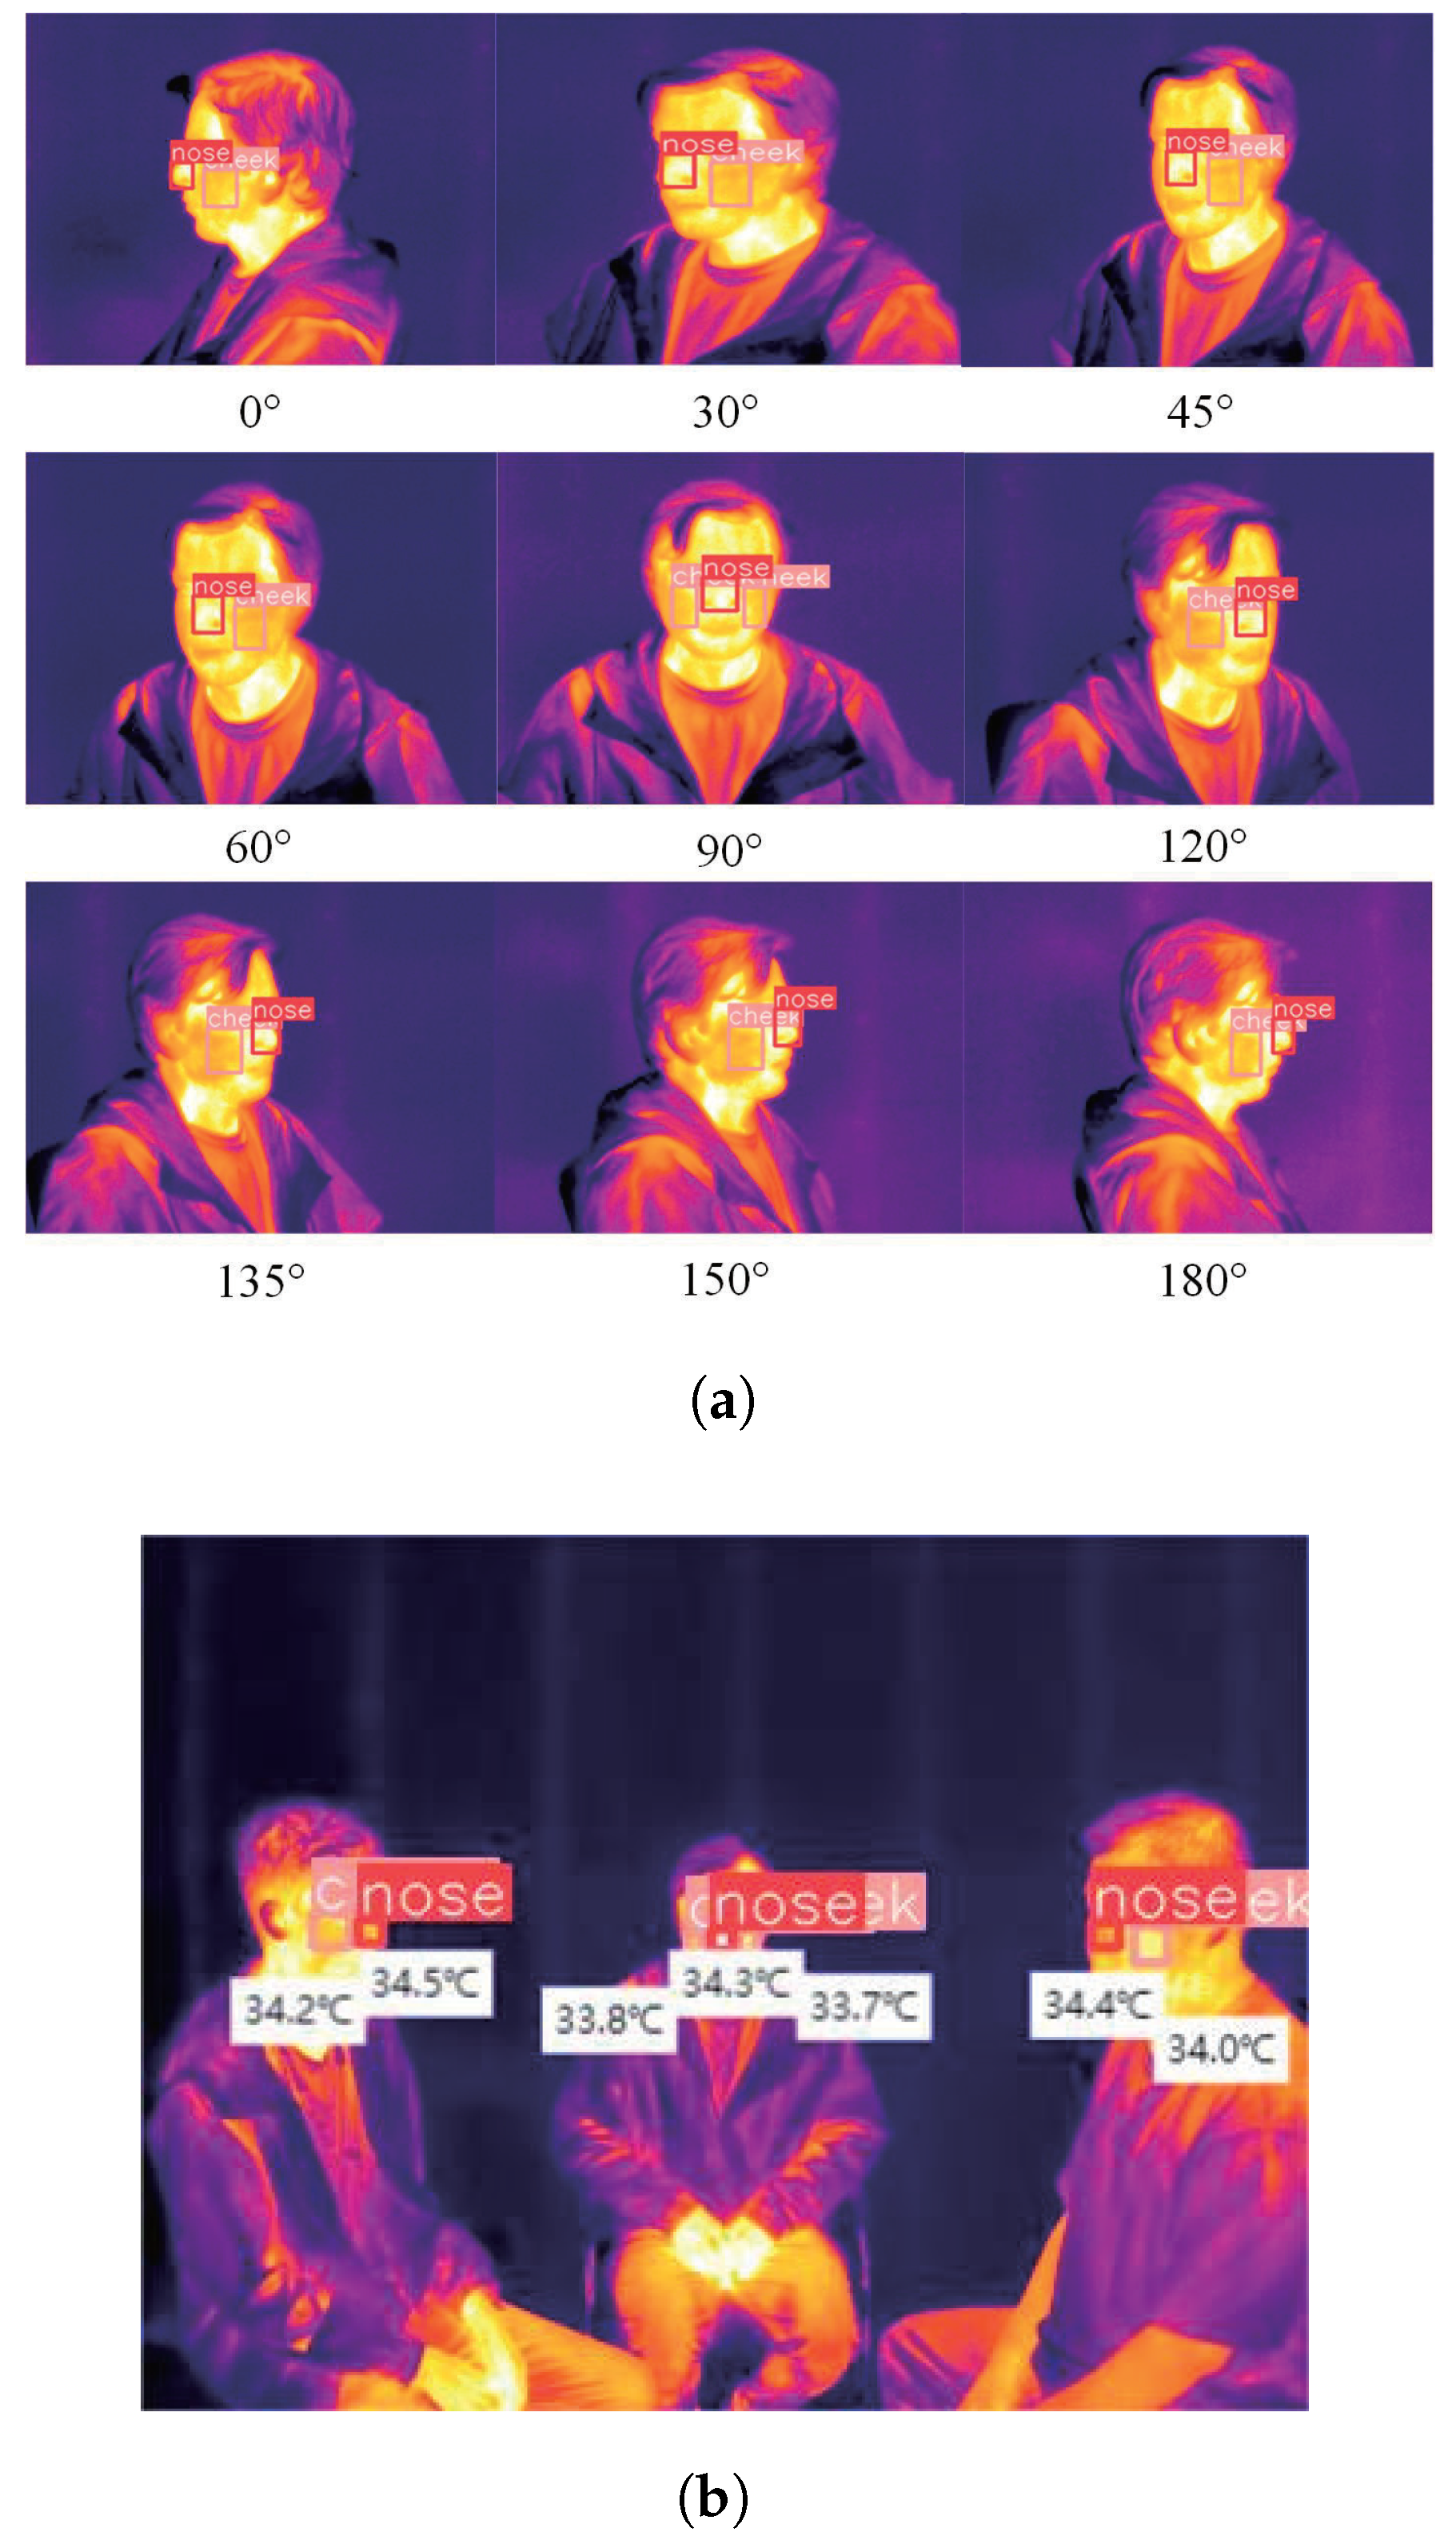
3.1. Recognition Results of Facial Regions and Temperatures

According to Section 2.1’s description, the YOLOv5 algorithm is used for facial key-region recognition. A total of 5394 infrared images are obtained by data collection and image enhancement. They are randomly divided into training, validation, and testing sets by the ratios of 7:2:1. To evaluate the performance of YOLOv5 recognition, the metrics of precision (P), recall (R), and mean average precision calculated at an IoU (Intersection over Union) threshold of 0.5 ( m A P @ 0.5 ) are provided, which are formulated as follows:
P = T P T P + F P
R = T P T P + F N
A P = 0 1 P · R d R
m A P = 1 N A P
where T P (True Positions) is the number of correctly detecting “noses and cheeks”, F P (False Positions) is the number of “non-nose and non-cheeks” falsely detected as “noses and cheeks”, F N (False Negatives) is the number of missed “noses and cheeks”, and N is the number of images. Main parameter settings of YOLOv5 are listed in Table 4.
The recognition results of facial regions by YOLOv5 are presented in Figure 10. It is seen that the nose region’s recognition accuracy is much higher than that of cheek region (0.992 > 0.936, m A P @ 0.5 ), which means in infrared photos taken from multiple angles, the feature of nose region is more prominent than cheek region. The average recognition accuracies of two regions achieve higher than 0.95, which shows high feasibility of the thermal comfort assessment based on facial-region temperature detection. A typical facial detection result at nine different angles is shown in Figure 11a. Further, multiple subjects’ facial regions and temperatures could also be recognized successfully within the available ranges (0–180°). Figure 11b shows a typical recognition result of three subjects with different facial angles. It is noted that the accuracy of temperature measurement by infrared camera is related to the hardware performance and measurement distance.

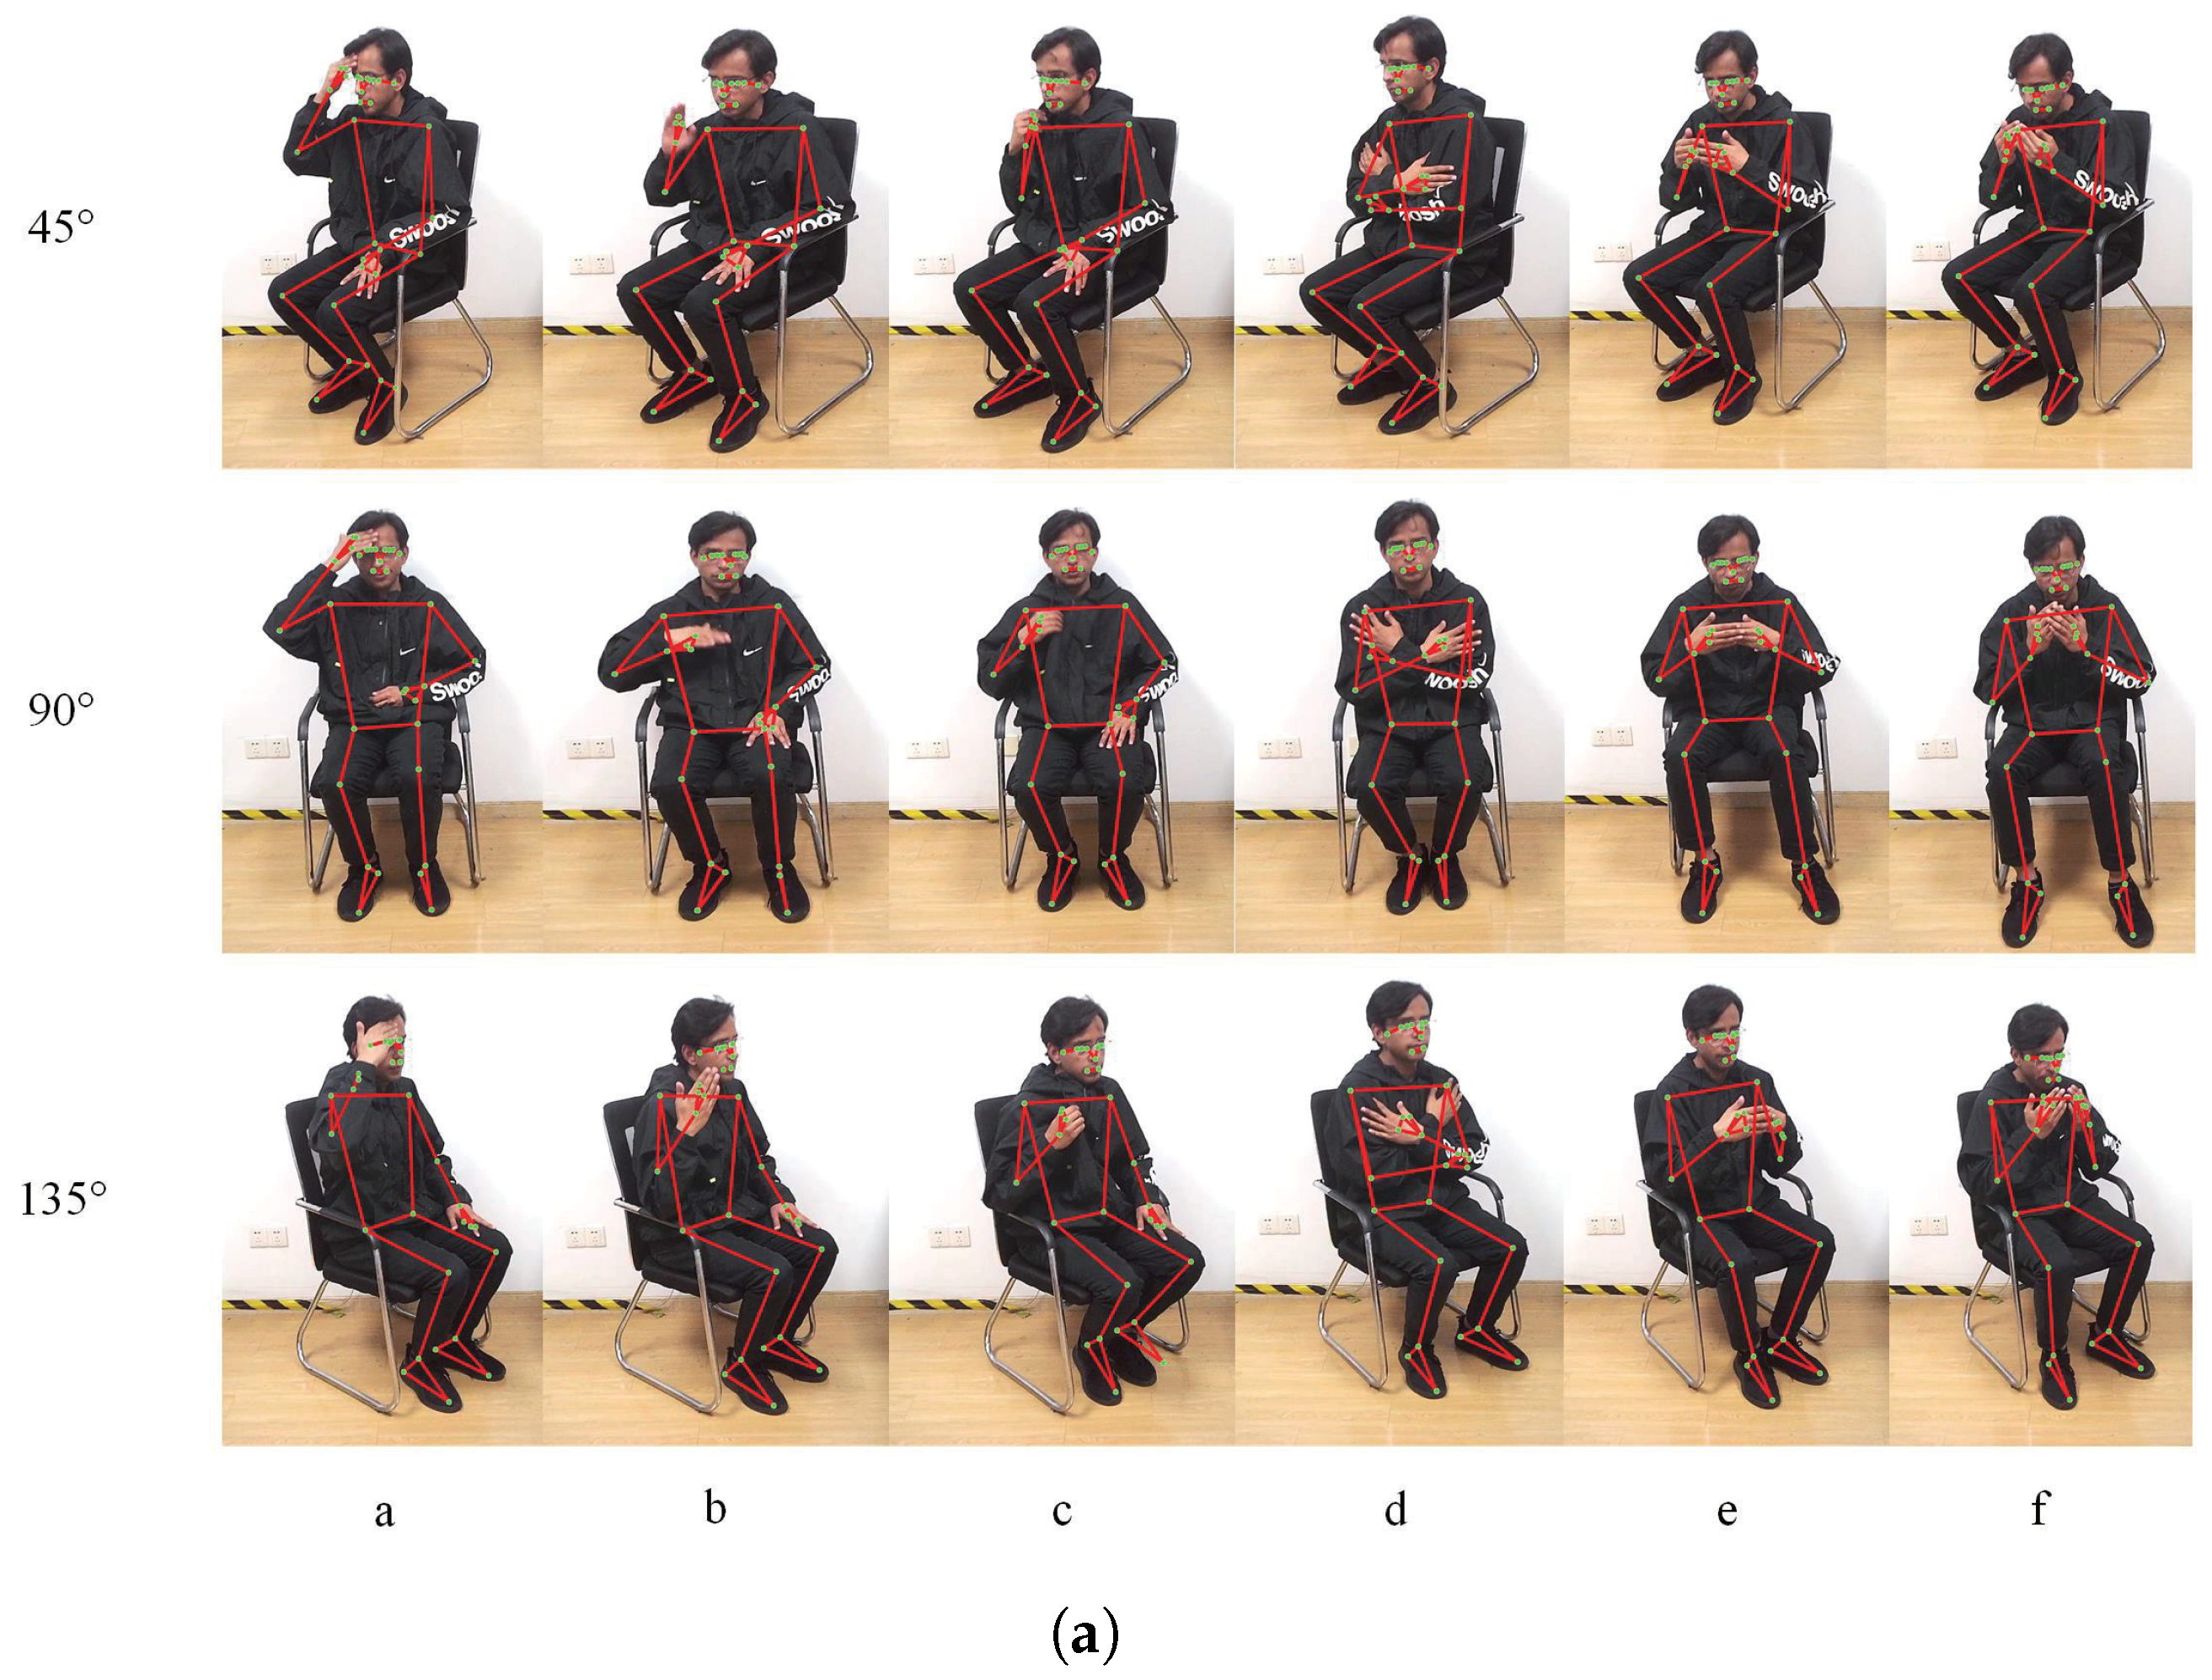
3.2. Recognition Results of Thermal Adaptive Actions

According to Section 2.2’s description, a total of 65,071 sets of valid skeletal-point data are collected. They are randomly divided into training and testing sets by the ratios of 8:2. The Mediapipe tool is used to detect/extract the position information of 33 skeletal points, based on which the RF classifier is applied for thermal adaptive action recognition.
As mentioned in Section 2.4, the RF model is selected by the comparison with four other classifiers in advance, including logistic regression (LR), ridge classifier (RC), gradient boosting classifier (GB), and support vector machine (SVM). For the comparison, all parameters are set to optimal values by trail. Both Model_Fac_T and Model_Therm_Act are built using the above five data-driven models, and the classification results are shown in Figure 12. It is seen that RF always achieves the best accuracies for the two prediction tasks. The combination of Mediapipe and RF has a great recognition accuracy of over 99% for all six thermal adaptive actions. Concretely, the recognition accuracy for “wiping forehead” is the lowest at 99.7%, while the recognition accuracies for “embrace both arms” and “rubbing hands” are the highest at 100%. Typical recognition results of six thermal adaptive actions (by one subject) from three angles are recorded in Figure 13a.
Further, as mentioned in Section 2.2, the Mediapipe tool could be combined with YOLO algorithm for multi-person’s thermal adaptive action detection simultaneously. Figure 13b shows a typical detection result when two subjects perform different thermal adaptive actions at the same time. Results show that the action recognition accuracy of multi-person is consistent with that of single person.

3.3. Results of Thermal Comfort Prediction

(1)
Results of TSV prediction based on facial region temperatures
Based on the results of Section 3.1, facial key-region temperatures are recognized by YOLOv5. The research shows that the ambient air temperature has the highest correlation with TSV, followed by the cheek and nose temperature, and finally the relative humidity [45]. On this basis, the thermal comfort prediction based on facial temperatures is carried out using the RF model (i.e., Model_Fac_T). The model has four inputs, including two facial temperatures (nose and cheek), ambient air temperature, and relative humidity. A total of 168 sets of labeled data collected from experiment I are used for model training and testing (ratios of 8:2). As described in Section 2.2, the RF model achieves the best accuracy compared with the other four data-driven models (see Figure 12 for details).
Further, from another field experiment (experiment II), 140 sets of data are purely used for testing the trained Model_Fac_T. With the 140 sets of testing data, the built RF model achieves accuracies of 78.57% (7-class) and 90% (3-class). With the estimated clothing thermal resistance (0.39 clo) and metabolic rate (1 met), the calculated PMV accuracies are only 20.71% (7-class) and 65% (3-class).
(2)
Results of TSV prediction based on fusion model
According to the fusion strategy described in Section 2.3 (2), three thermal comfort predictive models based on facial temperature, thermal adaptive action, and PMV are all combined in the form of a weighted sum. According to the weighting equations in Section 2.3 (2), the value of P R F is set to 0.794, P Y O L O is 0.964, and P m e d i a p i p e is 0.99. In 140 sets of testing data from experiment II, 38 sets of data contain thermal adaptive actions, which help increase the overall fusion model’s accuracies to 82.86% (7-class) and 94.29% (3-class). If only taking those 38 sets of data into account, the fusion accuracy of thermal comfort prediction reaches 86.8% (7-class) and 100% (3-class). This means that the recognition of thermal adaptive actions can significantly improve the accuracy of thermal comfort prediction. Table 5 lists the details of fusion results by different models using experiment II’s 140 data sets.
(3)
Prediction results of fusion model in changed condition (clo/met)
To investigate the effects of changed clothing thermal resistance and metabolic level on thermal comfort predictions, experiment III’s data sets are used for model testing. According to Table 3, 210 sets of data contain three situations: changing the clothing thermal resistance (by 0.2 clo), changing metabolism (by 2 met), and changing both at the same time. It should be noted that the trained predictive model is based on normal conditions (experiment I/II). The robustness and generalization ability of the model are tested by different data sets from experiment III. From the prediction results, it is found that although the changing of clothing and metabolism affects the accuracy of the predictive models, the proposed fusion strategy still achieves the best accuracies under all three changing situations (changing clothing: 75.71% (7-class), 92.86% (3-class); changing metabolism: 74.29% (7-class), 92.86% (3-class); changing both: 75.7% (7-class), 94.29% (3-class)). Compared with other models, the accuracy advantage of the fusion model is more significant. Especially when metabolism is changed, the accuracy of the fusion model is better than Model_Fac_T by nearly 20 percentage points (7-class). Details can be found in Table 6.

4. Discussion

Based on the above experiments and prediction results, a brief discussion is conducted on this study:
(1) Compared to the traditional PMV model, the Model_Fac_T with the addition of skin temperatures of facial key regions improves the prediction accuracy from 20.71% to 78.57% (7-class). The facial skin temperatures can well reflect the thermal sensation of the human body, and can serve as the related parameters for thermal comfort assessment. This discovery is consistent with the existing literature [43,44,45,50,51]. Further, by combining with the recognition of thermal adaptive actions, the proposed fusion strategy achieves the best prediction accuracy compared with PMV and Model_Fac_T. The parallel ensemble strategy takes more features into account that can compensate for the defects of every single method. Compared with the prediction results of the relevant literature in Table 1, the proposed model also has significant accuracy advantages.
(2) To verify the robustness and generalization performance of the proposed strategy, the changing of clothing thermal resistance and metabolism are conducted in this study. The experimental results show that when parameters (clo or met) of testing set are changed, the accuracy of predictive models degrades to some extent. This is because increasing clothing thermal resistance and metabolism causes an increase of somatosensory temperature, which will lead to different thermal comfort votes. Taking the changing of both clothing and metabolic level as an example, the accuracy of Model_Fac_T decreases from 78.57% to 57.14% (decreased by 21.43%, 7-class), and that of the fusion model only decreases from 82.86% to 75.7% (decreased by 7.16%, 7-class). From the perspective of model robustness, when the testing set’s distribution changes, the fusion model has a better performance than Model_Fac_T (decreased accuracy: 7.16% vs. 21.43%, 7-class). This indicates that the fusion model has better generalization ability, and thus has greater potential for different applications. Given the availability of computing resources, multi-person thermal comfort identification is also technically feasible. How to integrate individual data from multiple residents to create a comprehensive thermal sensation voting value is thus the key issue needing to be addressed in future research.
There are still some limitations in this study. Firstly, this article does not consider certain facial occlusion factors (such as masks, glasses, and other factors). The facial region can be effectively detected within the range of 0° to 180°. When the effective detection range is exceeded, facial temperature data collection will fail. Similarly, the thermal adaptive action detection only collects data from 45° to 135°. A larger shooting angle will cause overlapping of skeletal points, resulting in poor or failed action recognition. Secondly, there are some prerequisites for achieving prediction accuracy, and the data collection experiment of this study is mainly conducted in the summer. The proposed fusion prediction strategy may not be suitable for winter. Furthermore, our datasets are collected from young participants with normal BMIs; the predictive performance may not be the same for other groups, such as the elderly. Thirdly, the error of the sensor itself can cause the actual value to be inconsistent with the measured value. Common assumptions are applied to parameters such as wind speed. However, these may differ from actual environmental conditions and potentially affect the accuracy of the analysis.

5. Conclusions

Accurately evaluating human thermal comfort is of great significance for improving indoor environment quality and building energy efficiency. Addressing the defects of single thermal comfort prediction methods, this study proposed a multivariate fusion predictive strategy with non-invasive detecting methods. The YOLOv5 algorithm combined with an infrared thermal imager was used to extract skin temperature in facial key regions. The Mediapipe tool and random forest algorithm were used to recognize human thermal adaptive actions. The human thermal comfort level was predicted by combining results of facial temperatures and thermal adaptive action-based predictions with PMV results. From the fusion results, it was seen that the proposed fusion prediction strategy achieved the best accuracy (82.86%, 7-class) compared with single non-invasive prediction (78.57%) and PMV model (20.71%) under normal thermal conditions. When the thermal adaptive action was detected, the proposed fusion model was able to reach higher performances of 86.8% (7-class) and 100% (3-class). The parallel ensemble strategy took more features into account that could compensate for the defects of other single methods. Its robustness and generalization performance were also validated by changing clothing thermal resistance and metabolism in the testing data set. The results also showed better performance compared with the other two methods, thus demonstrating greater potential for different applications in the future. The data collection and model validation of a wider population are the focus of the next research step.

Author Contributions

K.L. designed the overall framework. F.L. developed the transfer learning model and performed the case studies. Y.L. and M.A.K. prepared all data sets and realized part of the algorithms. F.L. wrote the paper. All authors have read and agreed to the published version of the manuscript.

Funding

This work was supported the Key Research and Development Program of Zhenjiang City (Grant No. SH2023108), National Natural Science Foundation of China (Grant No. 61873114) and “Six Talents Peak” High-level Talents Program of Jiangsu Province (Grant No. JZ-053).

Data Availability Statement

All data are available per request.

Acknowledgments

The author would like to thank all the subjects who participated in the experiment for providing the experimental data.

Conflicts of Interest

The authors declare that they have no known competing financial interests or personal relationships that could have appeared to influence the work reported in this paper.

Nomenclature

HVACHeating, ventilation, and air conditioning
PMVPredicted mean vote
TSVThermal sensation vote
SVMSupport vector machine
LRLogistic regression
GBGradient boosting
RFRandom forest
ROIRegion of interest
MetMetabolic level
CloClothing thermal resistance
Model_Fac_TThermal comfort prediction model based on human facial temperature
Model_Therm_ActThermal comfort prediction model based on thermal adaptive action detection
T a i r Indoor temperature
R H Relative humidity
T n o s e Nose temperature
T c h e e k Cheek temperature
L F a c _ T The thermal comfort level predicted by Model_Fac_T
L t h e r m _ a c t The product sum of the predicted action’s voted TSV values
L p m v PMV value calculated under the ASHRAE standard
L t o t a l The fusion result
α 1 The weight of facial temperature-based TSV prediction
α 2 The weight of thermal adaptive action prediction
α 3 The weight of PMV result
P Y O L O The mean average precision of facial key-region recognition
P R F The TSV prediction accuracy of the RF model (Model_Fac_T)
P m e d i a p i p e The recognizing accuracy of thermal adaptive actions based on Mediapipe
m A P @ 0.5 mean average precision calculated at an IoU threshold of 0.5

Appendix A

Figure A1. Schematic diagram of survey questionnaire on thermal adaptive actions.
Energies 18 02332 g0a1

References

  1. Cao, X.; Dai, X.; Liu, J. Building energy-consumption status worldwide and the state-of-the-art technologies for zero-energy buildings during the past decade. Energy Build. 2016, 128, 198–213. [Google Scholar] [CrossRef]
  2. Ma, Z.; Wang, J.; Ye, S.; Wang, R.; Dong, F.; Feng, Y. Real-time indoor thermal comfort prediction in campus buildings driven by deep learning algorithms. J. Build. Eng. 2023, 78, 107603. [Google Scholar] [CrossRef]
  3. Abt, E.; Suh, H.H.; Catalano, P.; Koutrakis, P. Relative contribution of outdoor and indoor particle sources to indoor concentrations. Environ. Sci. Technol. 2000, 34, 3579–3587. [Google Scholar] [CrossRef]
  4. Nafiz, M.; Zaki, S.A.; Nadarajah, P.D.; Singh, M.K. Influence of psychological and personal factors on predicting individual’s thermal comfort in an office building using linear estimation and machine learning model. Adv. Build. Energy Res. 2024, 18, 105–125. [Google Scholar] [CrossRef]
  5. Iskandaryan, D.; Ramos, F.; Trilles, S. Application of deep learning and machine learning in air quality modeling. In Current Trends And Advances In Computer-Aided Intelligent Environmental Data Engineering; Elsevier: Amsterdam, The Netherlands, 2022; pp. 11–23. [Google Scholar]
  6. Iskandaryan, D.; Ramos, F.; Trilles, S. Air quality prediction in smart cities using machine learning technologies based on sensor data: A review. Appl. Sci. 2020, 10, 2401. [Google Scholar] [CrossRef]
  7. Pérez-Lombard, L.; Ortiz, J.; Pout, C. A review on buildings energy consumption information. Energy Build. 2008, 40, 394–398. [Google Scholar] [CrossRef]
  8. Huizenga, C.; Abbaszadeh, S.; Zagreus, L.; Arens, E.A. Air quality and thermal comfort in office buildings: Results of a large indoor environmental quality survey. Proc. Healthy Build. 2006, III, 393–397. [Google Scholar]
  9. Ma, N.; Zhang, Q.; Murai, F.; Braham, W.W.; Samuelson, H.W. Learning building occupants’ indoor environmental quality complaints and dissatisfaction from text-mining Booking. com reviews in the United States. Build. Environ. 2023, 237, 110319. [Google Scholar] [CrossRef]
  10. Luo, M.; Wang, Z.; Brager, G.; Cao, B.; Zhu, Y. Indoor climate experience, migration, and thermal comfort expectation in buildings. Build. Environ. 2018, 141, 262–272. [Google Scholar] [CrossRef]
  11. Luo, T.; He, Q.; Wang, W.; Fan, X. Response of summer Land surface temperature of small and medium-sized cities to their neighboring urban spatial morphology. Build. Environ. 2024, 250, 111198. [Google Scholar] [CrossRef]
  12. Almagro-Lidón, M.; Pérez-Carramiñana, C.; Galiano-Garrigós, A.; Emmitt, S. Thermal comfort in school children: Testing the validity of the Fanger method for a Mediterranean climate. Build. Environ. 2024, 253, 111305. [Google Scholar] [CrossRef]
  13. ANSI/ASHRAE Standard 55-2020; Thermal Environmental Conditions for Human Occupancy. ASHRAE: Atlanta, Georgia, 2020.
  14. ISO 7730: 2005; Ergonomics of the Thermal Environment-Analytical Determination and Interpretation of Thermal Comfort Using Calculation of the PMV and PPD Indices and Local Thermal Comfort Criteria. ISO: Geneva, Switzerland, 2005.
  15. Zare, S.; Hasheminezhad, N.; Sarebanzadeh, K.; Zolala, F.; Hemmatjo, R.; Hassanvand, D. Assessing thermal comfort in tourist attractions through objective and subjective procedures based on ISO 7730 standard: A field study. Urban Clim. 2018, 26, 1–9. [Google Scholar] [CrossRef]
  16. Özbey, M.F.; Turhan, C. A novel comfort temperature determination model based on psychology of the participants for educational buildings in a temperate climate zone. J. Build. Eng. 2023, 76, 107415. [Google Scholar] [CrossRef]
  17. Zhou, X.; Xu, L.; Zhang, J.; Niu, B.; Luo, M.; Zhou, G.; Zhang, X. Data-driven thermal comfort model via support vector machine algorithms: Insights from ASHRAE RP-884 database. Energy Build. 2020, 211, 109795. [Google Scholar] [CrossRef]
  18. Sun, J.; Cong, S.; Mao, H.; Zhou, X.; Wu, X.; Zhang, X. Identification of eggs from different production systems based on hyperspectra and CS-SVM. Br. Poult. Sci. 2017, 58, 256–261. [Google Scholar] [CrossRef]
  19. Chen, Y.; Chen, L.; Huang, C.; Lu, Y.; Wang, C. A dynamic tire model based on HPSO-SVM. Int. J. Agric. Biol. Eng. 2019, 12, 36–41. [Google Scholar] [CrossRef]
  20. Jiang, L.; Yao, R. Modelling personal thermal sensations using C-Support Vector Classification (C-SVC) algorithm. Build. Environ. 2016, 99, 98–106. [Google Scholar] [CrossRef]
  21. Luo, M.; Xie, J.; Yan, Y.; Ke, Z.; Yu, P.; Wang, Z.; Zhang, J. Comparing machine learning algorithms in predicting thermal sensation using ASHRAE Comfort Database II. Energy Build. 2020, 210, 109776. [Google Scholar] [CrossRef]
  22. Xu, Q.; Cai, J.R.; Zhang, W.; Bai, J.W.; Li, Z.Q.; Tan, B.; Sun, L. Detection of citrus Huanglongbing (HLB) based on the HLB-induced leaf starch accumulation using a home-made computer vision system. Biosyst. Eng. 2022, 218, 163–174. [Google Scholar] [CrossRef]
  23. Yu, J.; Zhangzhong, L.; Lan, R.; Zhang, X.; Xu, L.; Li, J. Ensemble Learning Simulation Method for Hydraulic Characteristic Parameters of Emitters Driven by Limited Data. Agronomy 2023, 13, 986. [Google Scholar] [CrossRef]
  24. Li, D.; Menassa, C.C.; Kamat, V.R. Personalized human comfort in indoor building environments under diverse conditioning modes. Build. Environ. 2017, 126, 304–317. [Google Scholar] [CrossRef]
  25. Katić, K.; Li, R.; Zeiler, W. Machine learning algorithms applied to a prediction of personal overall thermal comfort using skin temperatures and occupants’ heating behavior. Appl. Ergon. 2020, 85, 103078. [Google Scholar] [CrossRef] [PubMed]
  26. Alam, N.; Zaki, S.A.; Ahmad, S.A.; Singh, M.K.; Azizan, A.; Othman, N.A. Machine learning approach for predicting personal thermal comfort in air conditioning offices in Malaysia. Build. Environ. 2024, 266, 112083. [Google Scholar] [CrossRef]
  27. Nadarajah, P.D.; Lakmal, H.; Singh, M.K.; Zaki, S.A.; Ooka, R.; Rijal, H.; Mahapatra, S. Identification and application of the best-suited machine learning algorithm based on thermal comfort data characteristic: A data-driven approach. J. Build. Eng. 2024, 95, 110319. [Google Scholar] [CrossRef]
  28. Simone, A.; Kolarik, J.; Iwamatsu, T.; Asada, H.; Dovjak, M.; Schellen, L.; Shukuya, M.; Olesen, B.W. A relation between calculated human body exergy consumption rate and subjectively assessed thermal sensation. Energy Build. 2011, 43, 1–9. [Google Scholar] [CrossRef]
  29. Metzmacher, H.; Wölki, D.; Schmidt, C.; Frisch, J.; van Treeck, C. Real-time human skin temperature analysis using thermal image recognition for thermal comfort assessment. Energy Build. 2018, 158, 1063–1078. [Google Scholar] [CrossRef]
  30. Ghahramani, A.; Tang, C.; Becerik-Gerber, B. An online learning approach for quantifying personalized thermal comfort via adaptive stochastic modeling. Build. Environ. 2015, 92, 86–96. [Google Scholar] [CrossRef]
  31. Aryal, A.; Becerik-Gerber, B. A comparative study of predicting individual thermal sensation and satisfaction using wrist-worn temperature sensor, thermal camera and ambient temperature sensor. Build. Environ. 2019, 160, 106223. [Google Scholar] [CrossRef]
  32. Huizenga, C.; Zhang, H.; Arens, E.; Wang, D. Skin and core temperature response to partial-and whole-body heating and cooling. J. Therm. Biol. 2004, 29, 549–558. [Google Scholar] [CrossRef]
  33. Yang, B.; Li, X.; Hou, Y.; Meier, A.; Cheng, X.; Choi, J.H.; Wang, F.; Wang, H.; Wagner, A.; Yan, D.; et al. Non-invasive (non-contact) measurements of human thermal physiology signals and thermal comfort/discomfort poses—A review. Energy Build. 2020, 224, 110261. [Google Scholar] [CrossRef]
  34. Ghahramani, A.; Castro, G.; Karvigh, S.A.; Becerik-Gerber, B. Towards unsupervised learning of thermal comfort using infrared thermography. Appl. Energy 2018, 211, 41–49. [Google Scholar] [CrossRef]
  35. Cheng, X.; Yang, B.; Hedman, A.; Olofsson, T.; Li, H.; Van Gool, L. NIDL: A pilot study of contactless measurement of skin temperature for intelligent building. Energy Build. 2019, 198, 340–352. [Google Scholar] [CrossRef]
  36. Cosma, A.C.; Simha, R. Machine learning method for real-time non-invasive prediction of individual thermal preference in transient conditions. Build. Environ. 2019, 148, 372–383. [Google Scholar] [CrossRef]
  37. Wu, Y.; Zhao, J.; Cao, B. A systematic review of research on personal thermal comfort using infrared technology. Energy Build. 2023, 301, 113666. [Google Scholar] [CrossRef]
  38. Farokhi, S.; Flusser, J.; Sheikh, U.U. Near infrared face recognition: A literature survey. Comput. Sci. Rev. 2016, 21, 1–17. [Google Scholar] [CrossRef]
  39. Miura, J.; Demura, M.; Nishi, K.; Oishi, S. Thermal comfort measurement using thermal-depth images for robotic monitoring. Pattern Recognit. Lett. 2020, 137, 108–113. [Google Scholar] [CrossRef]
  40. Jazizadeh, F.; Jung, W. Personalized thermal comfort inference using RGB video images for distributed HVAC control. Appl. Energy 2018, 220, 829–841. [Google Scholar] [CrossRef]
  41. Jung, W.; Jazizadeh, F. Vision-based thermal comfort quantification for HVAC control. Build. Environ. 2018, 142, 513–523. [Google Scholar] [CrossRef]
  42. Cheng, X.; Yang, B.; Olofsson, T.; Liu, G.; Li, H. A pilot study of online non-invasive measuring technology based on video magnification to determine skin temperature. Build. Environ. 2017, 121, 1–10. [Google Scholar] [CrossRef]
  43. Jeoung, J.; Jung, S.; Hong, T.; Lee, M.; Koo, C. Thermal comfort prediction based on automated extraction of skin temperature of face component on thermal image. Energy Build. 2023, 298, 113495. [Google Scholar] [CrossRef]
  44. Bai, Y.; Liu, L.; Liu, K.; Yu, S.; Shen, Y.; Sun, D. Non-intrusive personal thermal comfort modeling: A machine learning approach using infrared face recognition. Build. Environ. 2024, 247, 111033. [Google Scholar] [CrossRef]
  45. Li, K.; Li, W.; Liu, F.; Xue, W. Non-invasive human thermal comfort assessment based on multiple angle/distance facial key-region temperatures recognition. Build. Environ. 2023, 246, 110956. [Google Scholar] [CrossRef]
  46. Jocher, G.; Nishimura, K.; Mineeva, T.; Vilariño, R. Yolov5. Code Repository. 2020. Available online: https://github.com/ultralytics/yolov5 (accessed on 1 September 2022).
  47. Meier, A.; Dyer, W.; Graham, C. Using human gestures to control a building’s heating and cooling System. In Energy Efficiency in Domestic Appliances and Lighting (EEDAL’17); European Union: Luxembourg, 2017; pp. 627–635. [Google Scholar]
  48. Yang, B.; Cheng, X.; Dai, D.; Olofsson, T.; Li, H.; Meier, A. Real-time and contactless measurements of thermal discomfort based on human poses for energy efficient control of buildings. Build. Environ. 2019, 162, 106284. [Google Scholar] [CrossRef]
  49. Yang, B.; Cheng, X.; Dai, D.; Olofsson, T.; Li, H.; Meier, A. Macro pose based non-invasive thermal comfort perception for energy efficiency. arXiv 2018, arXiv:1811.07690. [Google Scholar]
  50. Wu, Y.; Cao, B. Recognition and prediction of individual thermal comfort requirement based on local skin temperature. J. Build. Eng. 2022, 49, 104025. [Google Scholar] [CrossRef]
  51. Cosma, A.C.; Simha, R. Using the contrast within a single face heat map to assess personal thermal comfort. Build. Environ. 2019, 160, 106163. [Google Scholar] [CrossRef]
  52. Li, D.; Menassa, C.C.; Kamat, V.R. Non-intrusive interpretation of human thermal comfort through analysis of facial infrared thermography. Energy Build. 2018, 176, 246–261. [Google Scholar] [CrossRef]
  53. Garg, S.; Saxena, A.; Gupta, R. Yoga pose classification: A CNN and MediaPipe inspired deep learning approach for real-world application. J. Ambient. Intell. Humaniz. Comput. 2023, 14, 16551–16562. [Google Scholar] [CrossRef]
  54. Makhijani, R.; Sagar, S.; Reddy, K.B.P.; Mourya, S.K.; Krishna, J.S.; Kulkarni, M.M. Yoga Pose Rectification Using Mediapipe and Catboost Classifier. In Computer Vision and Machine Intelligence: Proceedings of CVMI 2022; Springer: Berlin/Heidelberg, Germany, 2023; pp. 379–387. [Google Scholar]
  55. Bucarelli, N.; El-Gohary, N. Deep learning approach for recognizing cold and warm thermal discomfort cues from videos. Build. Environ. 2023, 242, 110277. [Google Scholar] [CrossRef]
  56. Duan, W.; Wang, Y.; Li, J.; Zheng, Y.; Ning, C.; Duan, P. Real-time surveillance-video-based personalized thermal comfort recognition. Energy Build. 2021, 244, 110989. [Google Scholar] [CrossRef]
  57. Zhang, Y.; Lin, Z.; Zheng, Z.; Zhang, S.; Fang, Z. A review of investigation of the metabolic rate effects on human thermal comfort. Energy Build. 2024, 315, 114300. [Google Scholar] [CrossRef]
  58. Zhang, H.; Xie, X.; Hong, S.; Lv, H. Impact of metabolism and the clothing thermal resistance on inpatient thermal comfort. Energy Built Environ. 2021, 2, 223–232. [Google Scholar] [CrossRef]
  59. Ji, W.; Pan, Y.; Xu, B.; Wang, J. A real-time apple targets detection method for picking robot based on ShufflenetV2-YOLOX. Agriculture 2022, 12, 1619. [Google Scholar] [CrossRef]
  60. Yang, B.; Liu, Y.; Liu, P.; Wang, F.; Cheng, X.; Lv, Z. A novel occupant-centric stratum ventilation system using computer vision: Occupant detection, thermal comfort, air quality, and energy savings. Build. Environ. 2023, 237, 110332. [Google Scholar] [CrossRef]
  61. Zhang, Q.; Bao, X.; Sun, S.; Lin, F. Lightweight network for small target fall detection based on feature fusion and dynamic convolution. J. Real-Time Image Process. 2024, 21, 17. [Google Scholar] [CrossRef]
  62. Lugaresi, C.; Tang, J.; Nash, H.; McClanahan, C.; Uboweja, E.; Hays, M.; Zhang, F.; Chang, C.L.; Yong, M.; Lee, J.; et al. Mediapipe: A framework for perceiving and processing reality. In Proceedings of the Third Workshop on Computer Vision for AR/VR at IEEE Computer Vision and Pattern Recognition (CVPR), Long Beach, CA, USA, 17 June 2019; Volume 2019, pp. 1–4. [Google Scholar]
  63. Bazarevsky, V.; Grishchenko, I.; Raveendran, K.; Zhu, T.; Zhang, F.; Grundmann, M. Blazepose: On-device real-time body pose tracking. arXiv 2020, arXiv:2006.10204. [Google Scholar]
  64. Singh, A.K.; Kumbhare, V.A.; Arthi, K. Real-time human pose detection and recognition using mediapipe. In International Conference on Soft Computing and Signal Processing; Springer: Singapore, 2021; pp. 145–154. [Google Scholar]
  65. Min, Z. Human body pose intelligent estimation based on BlazePose. In Proceedings of the 2022 IEEE International Conference on Electrical Engineering, Big Data and Algorithms (EEBDA), Changchun, China, 25–27 February 2022; IEEE: NewYork, NY, USA, 2022; pp. 150–153. [Google Scholar]
  66. Breiman, L. Random forests. Mach. Learn. 2001, 45, 5–32. [Google Scholar] [CrossRef]
  67. Aryal, A.; Becerik-Gerber, B. Energy consequences of Comfort-driven temperature setpoints in office buildings. Energy Build. 2018, 177, 33–46. [Google Scholar] [CrossRef]
  68. GB/T 50785-2012; Evaluation Standard for Indoor Thermal Environment in Civil Buildings. Standardization Administration: Beijing, China, 2012.
Figure 1. (a) Schematic diagram of human facial ROIs. (b) Typical nine facial infrared images from different angles.
Energies 18 02332 g001
Figure 2. Schematic diagram of multi-person thermal adaptive action detection.
Energies 18 02332 g002
Figure 3. Schematic diagram of six thermal adaptive actions from three angles: (a) wiping forehead; (b) fanning oneself; (c) shaking T-shirt; (d) embrace both arms; (e) rubbing hands; (f) blowing on hands.
Energies 18 02332 g003
Figure 4. Spatial variation of skeletal points while performing “fanning oneself” at three angles.
Energies 18 02332 g004
Figure 5. The statistical results of the voted thermal sensation levels represented by thermal adaptive actions.
Energies 18 02332 g005
Figure 6. Schematic diagram of basic RF and its trained model.
Energies 18 02332 g006
Figure 7. The overall framework of this study.
Energies 18 02332 g007
Figure 8. (a) Layout of the entire testing room. (b) Experiment site with equipment.
Energies 18 02332 g008
Figure 9. Basic experimental process for this study.
Energies 18 02332 g009
Figure 10. Recognition accuracies of facial key regions by YOLOv5.
Energies 18 02332 g010
Figure 11. (a) Typical detection results of single subject’s facial ROIs from nine angles. (b) Typical detection result of multiple subjects’ facial ROIs/average temperatures.
Energies 18 02332 g011
Figure 12. Prediction accuracies for Model_Fac_T and Model_Therm_Act using five different classifiers.
Energies 18 02332 g012
Figure 13. (a) Typical recognition results of single subject’s six thermal adaptive actions from three angles. (b) Typical recognition results of multiple subjects’ two thermal adaptive actions simultaneously.
Energies 18 02332 g013aEnergies 18 02332 g013b
Table 1. Related studies on human thermal comfort prediction by different contactless measurements.
LiteraturesDetection Object/Image TypeDetection ToolThermal Comfort Prediction ModelTSV ClassAccuracy
Jeoung et al. (2024) [43]facial temperature/infraredYOLOv5MLP, GBM, KNN, SVM, RF, DT3-class *90.26% (MLP)
Bai et al. (2024) [44]facial temperature/infraredDlib/HRNetBL, RF, GBM, GBDT, DCF3-class90.44% (BL)
Li et al. (2023) [45]facial temperature/infraredYOLOv5CLPSO-SVM7-class **81.65%
3-class85.68%
Wu et al. (2022) [50]facial temperature/infrarednot reportedSVM2-class79.9%
Cosma et al. (2019) [51]facial temperature/infrared and RGBHaar/OpenPoseSVM7-class76%
Li et al. (2018) [52]facial temperature/infraredHaar CascadeRF3-class85%
Garg et al. (2023) [53]body action/RGBMediapipeCNNnot reported97.09%
Makhijani et al. (2023) [54]body action/RGBMediapipeCatBoostnot reported98.9%
Bucarell et al. (2023) [55]body action/RGBTensorFlow Object Detection APIResNet101 + LSTM + MLP3-class86.7%
Duan et al. (2021) [56]body action/RGBOpenPoseST-GCN3-class78%
Yang et al. (2019) [48]body action/RGBOpenPosenot reported7-class86.37%
Meier et al. (2017) [47]body action/RGBKinectnot reportednot reportednot reported
* 3-class: warm discomfort (+1), comfort (0), and cool discomfort (−1); ** 7-class: hot (+3), warm (+2), slightly warm (+1), neutral (0), slightly cold (−1), cool (−2), and cold (−3).
Table 2. Physiological information statistics of the subjects.
GenderAgeHeight (cm)Weight (Kg)BMI (Kg/m2)
Men24.4 ±1.58177 ± 6.2769.8 ± 9.2322.28 ± 2.60
Female23.9 ± 1.35166 ± 2.4456.43 ± 3.5120.37 ± 1.16
Table 3. Detailed experiment information.
ExperimentQuantity of DataCollected FeaturesSubjects (Times/Subject)Gender Ratio
I168 T a i r , R H , T c h e e k , T n o s e 12 (2)7:5
II140 T a i r , R H , T c h e e k , T n o s e , Clo, Met, Thermal adaptive actions10 (2)3:2
III70 T a i r , R H , T c h e e k , T n o s e , Clo( Δ 0.2 clo), Met, Thermal adaptive actions5 (2)3:2
70 T a i r , R H , T c h e e k , T n o s e , Clo, Met( Δ 2 met), Thermal adaptive actions5 (2)3:2
70 T a i r , R H , T c h e e k , T n o s e , Clo( Δ 0.2 clo), Met( Δ 2 met), Thermal adaptive actions5 (2)3:2
Table 4. Parameter settings related to YOLOv5 and Mediapipe.
YOLOv5 Mediapipe 
Size640 ∗ 640Static_image_modeFalse
Batch size16Smooth_landmarksTrue
Epoch300Min_tracking_confidence0.5
Learning rate0.01Model_complexity1
Weight decay0.0005Min_detection_confidence0.5
Table 5. Prediction accuracies of different models under normal office conditions (summer, 0.39 clo, 1 met).
Quantity of DataModelParameterAccuracy
7-Class3-Class
140 (experiment II)PMV T a i r , R H , Clo, Met20.71%65%
Model_Fac_T T a i r , R H , T c h e e k , T n o s e 78.57%90%
Fusion model (total data) L F a c _ T , L t h e r m _ a c t , L p m v 82.86%94.29%
Fusion model (actions detected) L F a c _ T , L t h e r m _ a c t , L p m v 86.8%100%
Table 6. Prediction accuracies of different models under changed condition (changing clo and met).
Quantity of DataModelAccuracy
Change CloChange MetChange Clo and Met
7-Class3-Class7-Class3-Class7-Class3-Class
210 (experiment III)PMV31.42%71.4%22.85%58.57%18.57%45.71%
Model_Fac_T74.28%91.42%54.29%81.42%57.14%87.14%
Fusion model (total data)75.71%92.86%74.29%92.86%75.7%94.29%
Fusion model (actions detected)80%100%86.38%100 %80.95 %95.24%
Disclaimer/Publisher’s Note: The statements, opinions and data contained in all publications are solely those of the individual author(s) and contributor(s) and not of MDPI and/or the editor(s). MDPI and/or the editor(s) disclaim responsibility for any injury to people or property resulting from any ideas, methods, instructions or products referred to in the content.

