Article

Accurate Location Method for Abnormal Line Losses in Distribution Network Considering Topology Matching and Parameter Estimation in Grid

1
State Grid Jiangsu Electric Power Research Institute, Nanjing 211100, China
2
Tsinghua Shenzhen International Graduate School, Tsinghua University, Shenzhen 518055, China
*
Author to whom correspondence should be addressed.
Energies 2025, 18(9), 2324; https://doi.org/10.3390/en18092324
Submission received: 7 February 2025 / Revised: 28 February 2025 / Accepted: 28 April 2025 / Published: 2 May 2025
(This article belongs to the Section F1: Electrical Power System)

Abstract

:
With the increasing emphasis on managing line losses, accurately locating and analyzing abnormal line losses in distribution networks has become a critical challenge in implementing effective loss reduction strategies. Aiming at locating and analyzing abnormal line losses caused by equipment aging in the distribution network, an accurate location method considering topology matching and parameter estimation in the grid is proposed. Firstly, a topology matching model based on a support vector machine in the grid is established to identify the real-time topology connection relationship within the distribution network. The accuracy of SVM is enhanced through an optimized parameter selection strategy. Secondly, a multi-objective optimization model is built employing the operation data collected by the measurement equipment, focusing on voltage and power estimation to form a parameter estimation model. This model focuses on voltage and power estimation, improving the accuracy of parameter estimation compared to single-parameter optimization methods. The weighting coefficient is selected to minimize the solution error. Finally, by comparing the deviation between the estimated values of the branch parameters and the theoretical values, the aging degree of each branch is evaluated, and branches with abnormal line losses are accurately located. The effectiveness of the proposed method is verified using the IEEE 33-bus distribution network, demonstrating its potential for improving the accuracy of identifying abnormal line losses caused by equipment aging and supporting enhanced distribution network management.

1. Introduction

Effective line loss management plays a pivotal role in achieving the low-carbon transition of power systems, as line losses constitute a significant component of overall energy consumption. Enhancing the efficiency and accuracy of line loss control has become a critical objective to meet the new requirements for sustainable power system management [1,2]. Power loss serves as a critical indicator of the efficiency and quality of management in a power grid. Abnormal power loss can reduce the system’s efficiency and increase operational costs, imposing a financial burden on maintenance and management efforts [3]. Therefore, the accurate identification and localization of abnormal line losses in distribution networks is of great importance.
Power loss in distribution networks can be categorized into technical loss (TL) and non-technical loss (NTL). The TL is associated with the system’s equipment parameters, network topology, and operational modes, typically arising from standard power transmission and conversion processes. In contrast, the NTL comes from management issues, including electricity theft, faulty metering devices, and infrastructure failures. Although extensive research has focused on identifying and mitigating NTL [4], addressing the challenges posed by TL, particularly those caused by equipment aging, remains underexplored. For instance, deep learning models such as the deep neural network (DNN) [5] and the firefly algorithm optimized deep belief network [6] have been developed to detect NTL by leveraging station area features or enhancing detection accuracy through advanced optimization methods. Additionally, multi-dimensional scene division has been used to build standard line loss libraries for tracking abnormal users [3]. Despite these advancements in NTL identification, the impact of aging infrastructure on TL requires further investigation. This paper aims to fill this gap by focusing on TL caused by equipment aging in distribution networks.
The methods for identifying abnormal line losses can be broadly classified into state-based, game-based, and data-driven approaches. Traditional approaches rely on state estimation and optimization-based techniques, such as mixed-integer linear programming or quadratic programming, which incorporate switch statuses as binary variables to identify network configurations. Reference [7] proposes a state-based method that applies random matrix theory to detect electricity theft by analyzing correlations between power consumption and system state data through augmented and contrasted matrices, enabling efficient anomaly detection at both regional and individual customer levels. Similarly, reference [8] presents a state-based method for detecting NTLs in power systems by combining distribution state estimation to localize anomalies in feeder bus demand data and analysis of variance to identify individual customer meter defects or tampering, leveraging smart meter and distribution network data for enhanced accuracy. For game-based methods, reference [9] develops a game-theoretic framework to model adversarial interactions between electricity distributors and fraudulent customers, analyzing optimal pricing, investment in fraud monitoring, and diagnostic schemes to maximize distributor efficiency under different market structures. However, these methods often suffer from high computational complexity, making them unsuitable for real-time applications [10,11,12].
Recent advancements in data-driven techniques, including machine learning and deep learning models, have introduced more efficient solutions for abnormal loss detection. Graph neural networks (GNNs) have been used to model power distribution networks as graphs to predict switch statuses, offering computational advantages [11]. Similarly, ensemble deep learning models leverage phasor measurement unit (PMU) data to detect topology changes, providing robustness against noise and load variations [13]. Other innovative approaches include transfer learning frameworks for electricity theft detection in small-sample scenarios [14] and clustering-classification combined algorithms for systematic abnormal power loss evaluation [15]. Data-driven methods such as the Isolation Forest algorithm [16] and graph attention networks [17] further illustrate the potential of leveraging advanced analytics to address both technical and non-technical losses. These diverse methodologies highlight the ongoing evolution in topology identification, balancing computational efficiency, scalability, and accuracy for dynamic power systems. Despite these advances, current methods struggle to balance real-time adaptability and high accuracy. Further, while addressing the multifaceted impacts of equipment aging, the current literature predominantly focuses on estimating a single variable, such as voltage or power, which limits the ability to comprehensively capture the complex impacts of equipment aging.
This paper proposes an accurate location method for abnormal line losses, considering topology matching and parameter estimation to address the challenge of technical abnormal line losses caused by equipment aging in distribution networks. A Support Vector Machine (SVM)-based topology matching model is developed to accurately identify the real-time topological connections of the distribution network during operation. An optimized parameter selection strategy is employed to enhance the accuracy of SVM. With the identified topology and operational data collected from measurement devices, a parameter estimation model is formulated from two perspectives: voltage estimation and power estimation. By analyzing the estimated line parameters and comparing them with theoretical values, an aging threshold is established to evaluate the condition of network branches. This approach enables the accurate localization of branches with abnormal technical line losses due to aging, offering a practical and efficient solution for improving distribution network management.
The rest of the paper is organized as follows: The distribution network topology matching based on SVM is described in Section 2. The determination of the aging degree of lines based on parameter estimation is detailed in Section 3. The case study results are presented in Section 4, followed by the conclusions.

2. Distribution Network Topology Matching Model Based on SVM

2.1. Data Preprocessing

To mitigate the impact of differing data dimensions on algorithm performance, we apply the min-max normalization method to standardize the measurement data collected from various devices [18]. This process scales the original data to the range [0, 1], ensuring consistency across different data categories. The normalization formula is as follows:
h i = h i h i min h i max h i min
where h i is the original value of feature i; h i is the normalized value of feature i; h i min and h i max are the maximum and minimum value of feature i, respectively.
In the actual operation of a distribution network, faults in measurement equipment or the data transmission process can result in missing data, which may impact the performance of the topology matching method. To address this, we apply a missing data imputation method based on the minimum variance K-nearest neighbor algorithm. Additionally, mutual information-based feature selection is employed to reduce the number of input parameters required by the topology matching model, thereby improving computational efficiency and accelerating the matching process [19].

2.2. Parameter Optimization of SVM Based on Improved Grid Search Method

The SVM model, as a classifier designed to handle high-dimensional data and complex nonlinear relationships, leverages margin maximization to enhance robustness. By following the structural risk minimization principle, it effectively balances model complexity and empirical risk, preventing overfitting caused by overly complex models. Additionally, the flexible selection of kernel functions and regularization parameters improves both fitting capability and generalization performance.
In this study, an improved grid search method is employed to jointly optimize the SVM kernel functions and penalty parameters. This optimization process ensures the identification of the optimal model configuration, specifically tailored for distribution network topology identification tasks. The improved grid search method starts with a coarse search using a large step in a wide range of parameter values. Once locally optimal parameter combinations are identified, a finer search is conducted using smaller intervals near these parameters to find the final optimal combination. If multiple sets of locally optimal parameter combinations are found during the coarse search, each combination is further fine-tuned to improve model precision under different operation environments.

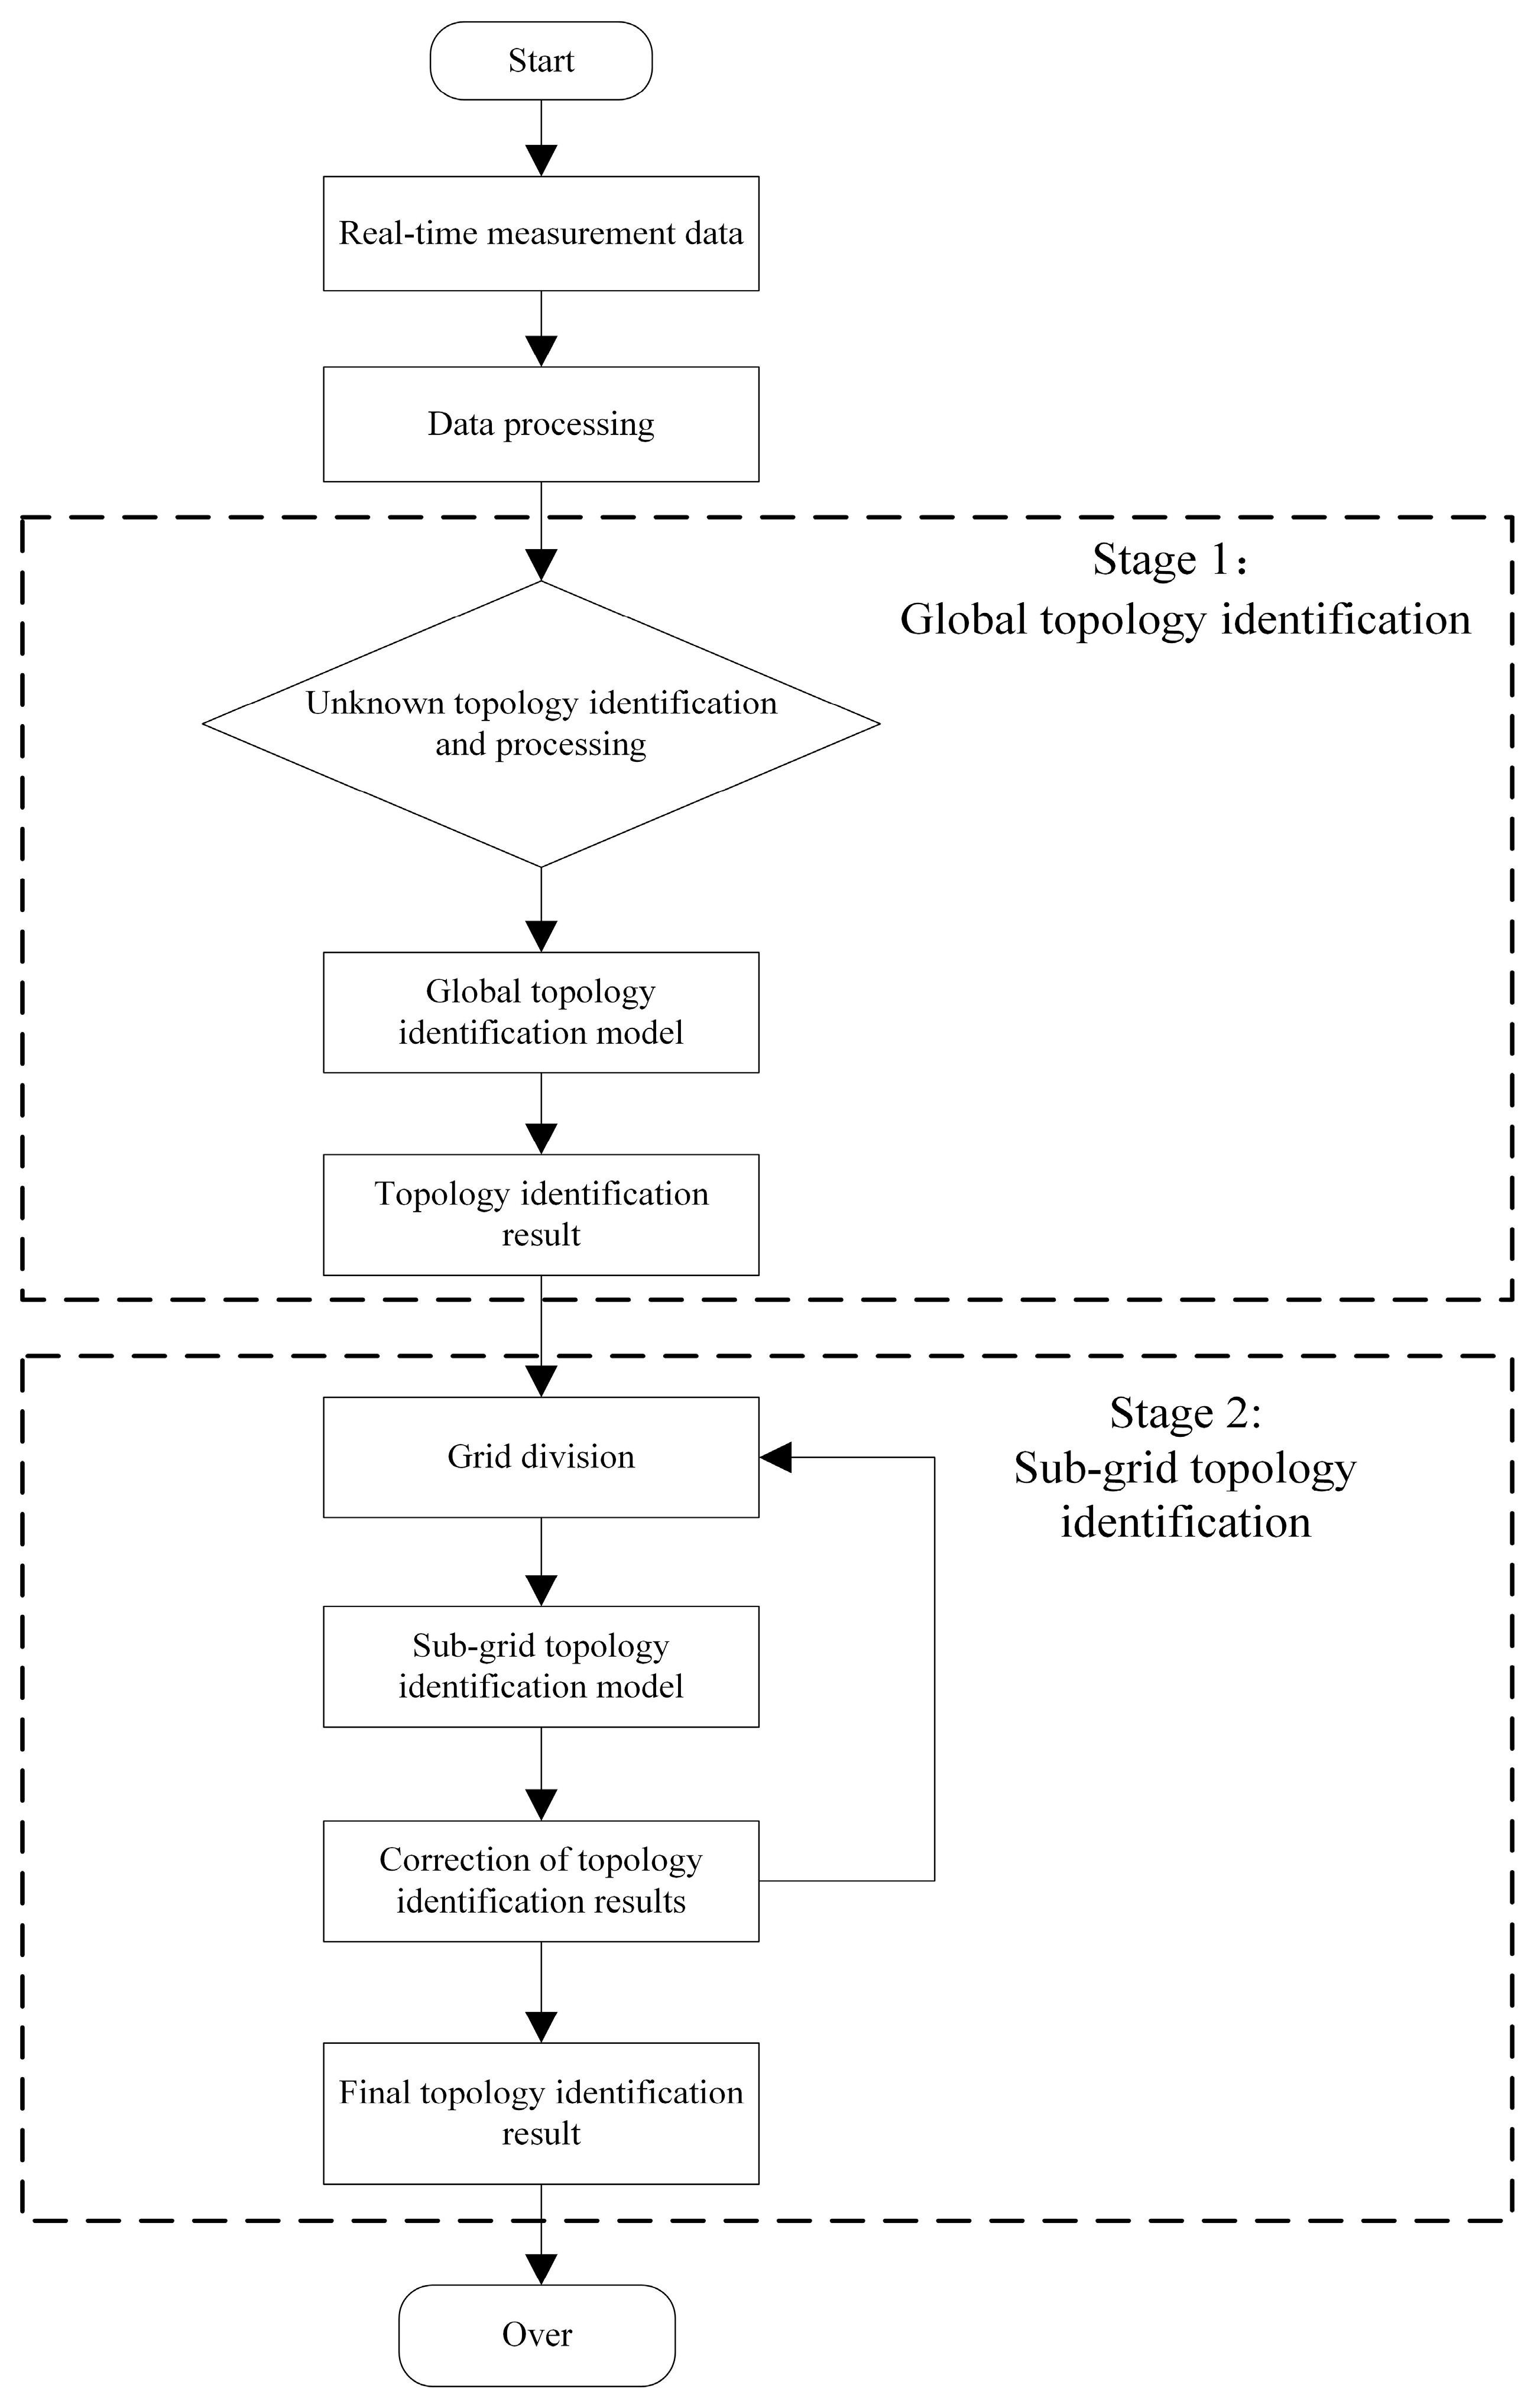
2.3. The Overall Process of the Distribution Network Topology Matching Method

The topology matching process of the distribution network based on SVM is shown in Figure 1, which is divided into two stages.
After preprocessing the real-time operation data collected from measurement devices in the distribution network, the first stage topology matching process begins. Firstly, the Pearson correlation coefficient is used to analyze and identify the new unknown topology structure during operation. Then, the global topology identification result is obtained according to the topology identification model based on SVM. On the basis of this result, the second stage begins, and the topology correction is performed for the grid. The initial grid division is carried out based on the electrical distance [20]. Then, according to the topology matching model based on SVM, the topology of each grid is identified. The error of the preliminary global topology identification result is identified and corrected to obtain a new topology identification structure. This process continues iteratively: the grid is further subdivided, and the sub-grid topology identification is conducted. Through multiple cyclic iterations of grid division and correction, the final distribution network topology identification result is obtained.
The SVM-based topology matching model can also be divided into two stages. The known topology structures under the normal operation of the distribution network are recorded as 1, 2, ..., and N. In the offline training stage, the distribution network measurement data collected under different topologies by measurement devices, together with their corresponding topology labels, constitute the original training dataset. After data normalization, the optimal topology identification feature subset is selected, and the data dimension reduction is completed. The SVM algorithm is used to train the N-classification models, which correspond to each topology structure. In the online identification stage, after data processing, the test dataset is input into each classification model to obtain the prediction score. The label of the topology identification result is then output to obtain the topology identification result.

3. Determination of the Aging Degree of Lines Based on Parameter Estimation

3.1. Parameter Estimation Model Combining Voltage Estimation and Power Estimation

For the branches in the distribution network with a simple topology shown in Figure 2, such as the branch connecting node B and node 2, there is a voltage relationship [21]:
U ˙ B U ˙ 2 = Z B 2 I ˙ B 2
where U ˙ B and U ˙ 2 are the voltages of the two nodes, respectively, I ˙ B 2 is the current flowing from node B to node 2, and Z B 2 is the impedance of the branch connecting the two nodes, which can be expressed as Z B 2 = R B 2 + j X B 2 .
The voltage of node B can be expressed as
U B = f ( R B 2 , X B 2 )
The voltage of upstream nodes can be gradually calculated from node 2, and the voltage of the head node O can be expressed as
U O - 2 = f ( R O A , , R B 2 , X O A , , X B 2 )
where U O - 2 is the voltage of the head node calculated from the terminal node 2, and ( R O A , , R B 2 , X O A , , X B 2 ) is the impedance of each branch between the two nodes.
When calculations are performed from different terminal nodes, different equations can be derived, which can be expressed as U O 1 , U O 2 , , U O w , where w is the number of terminal nodes. By comparing the calculated value of voltage with the actual measured value of voltage of the head node, the error U var can be expressed as
U var = t = 1 T k = 1 w ( U O k t U r t ) 2
where U O k t is the value of voltage of the head node O calculated from the terminal node k at time t, U r t is the value of voltage of the head node O obtained by the measuring devices at time t, and T is the number of moments.
By minimizing this error, the impedance can be determined through optimization, using voltage calculations as the objective function.
For any branch in the distribution network, the current flowing through it is related to the current on the adjacent downstream lines:
I i = j l ( i ) I j
where i is the number of the branches of the distribution network, and l(i) is the set of downstream branches adjacent to line i.
By adding the load power of each node to the power loss caused by the branch impedance, the power of the head node can be calculated by
P = a = 1 m P a + i = 1 n I i 2 R i
Q = a = 1 m Q a + i = 1 n I i 2 X i
where n is the number of distribution network branches, and Ii, Ri, and Xi are the values of current, resistance, and reactance of branch i.
The calculated values of power are compared with the values of power from the head node obtained from actual measurement, and the error is expressed as
S var = t = 1 T ( P t P r t ) 2 + ( Q t Q r t ) 2
where P t and Q t are the calculated values of power obtained at time t, and P r t and Q r t are the power values of the head node obtained by the measuring devices at time t.
Therefore, the impedance parameters can also be obtained by solving and optimizing the minimum value with the power calculation.
However, relying solely on single-objective optimization models for voltage or power estimation often results in poor accuracy due to an overemphasis on either voltage or power estimation. To address this, the two single-objective optimization models are combined into a multi-objective optimization model with the following objective function:
min f ( X ) = S var t + σ U var t
where α is the weight coefficient. By changing the value of α, the influence of power estimation and voltage estimation on parameter estimation can be changed.
The selection of weight coefficient magnitudes must account for the respective accuracy of voltage-based and power-based estimation models when applied to distribution networks. In this study, we examined multiple topological configurations, as shown in Figure 3, and systematically varied the weight coefficients. For each configuration, we computed the average solution error of the multi-objective optimization model. As illustrated in Figure 4, the minimal solution error was observed when the weight coefficients ranged between 0.4 and 0.6. Based on this analysis, we provisionally set the weight coefficient to 0.5 in this study.
The steepest descent method, as an ideal iterative minimization algorithm, represents one of the most widely adopted approaches for solving unconstrained optimization problems [22,23]. Given that the proposed model in this study constitutes an unconstrained optimization framework with a large number of parametric variables, the steepest descent method is employed as the iterative algorithm to achieve the fastest objective function reduction and efficient iteration convergence.

3.2. Evaluation Method of Line Aging Degree
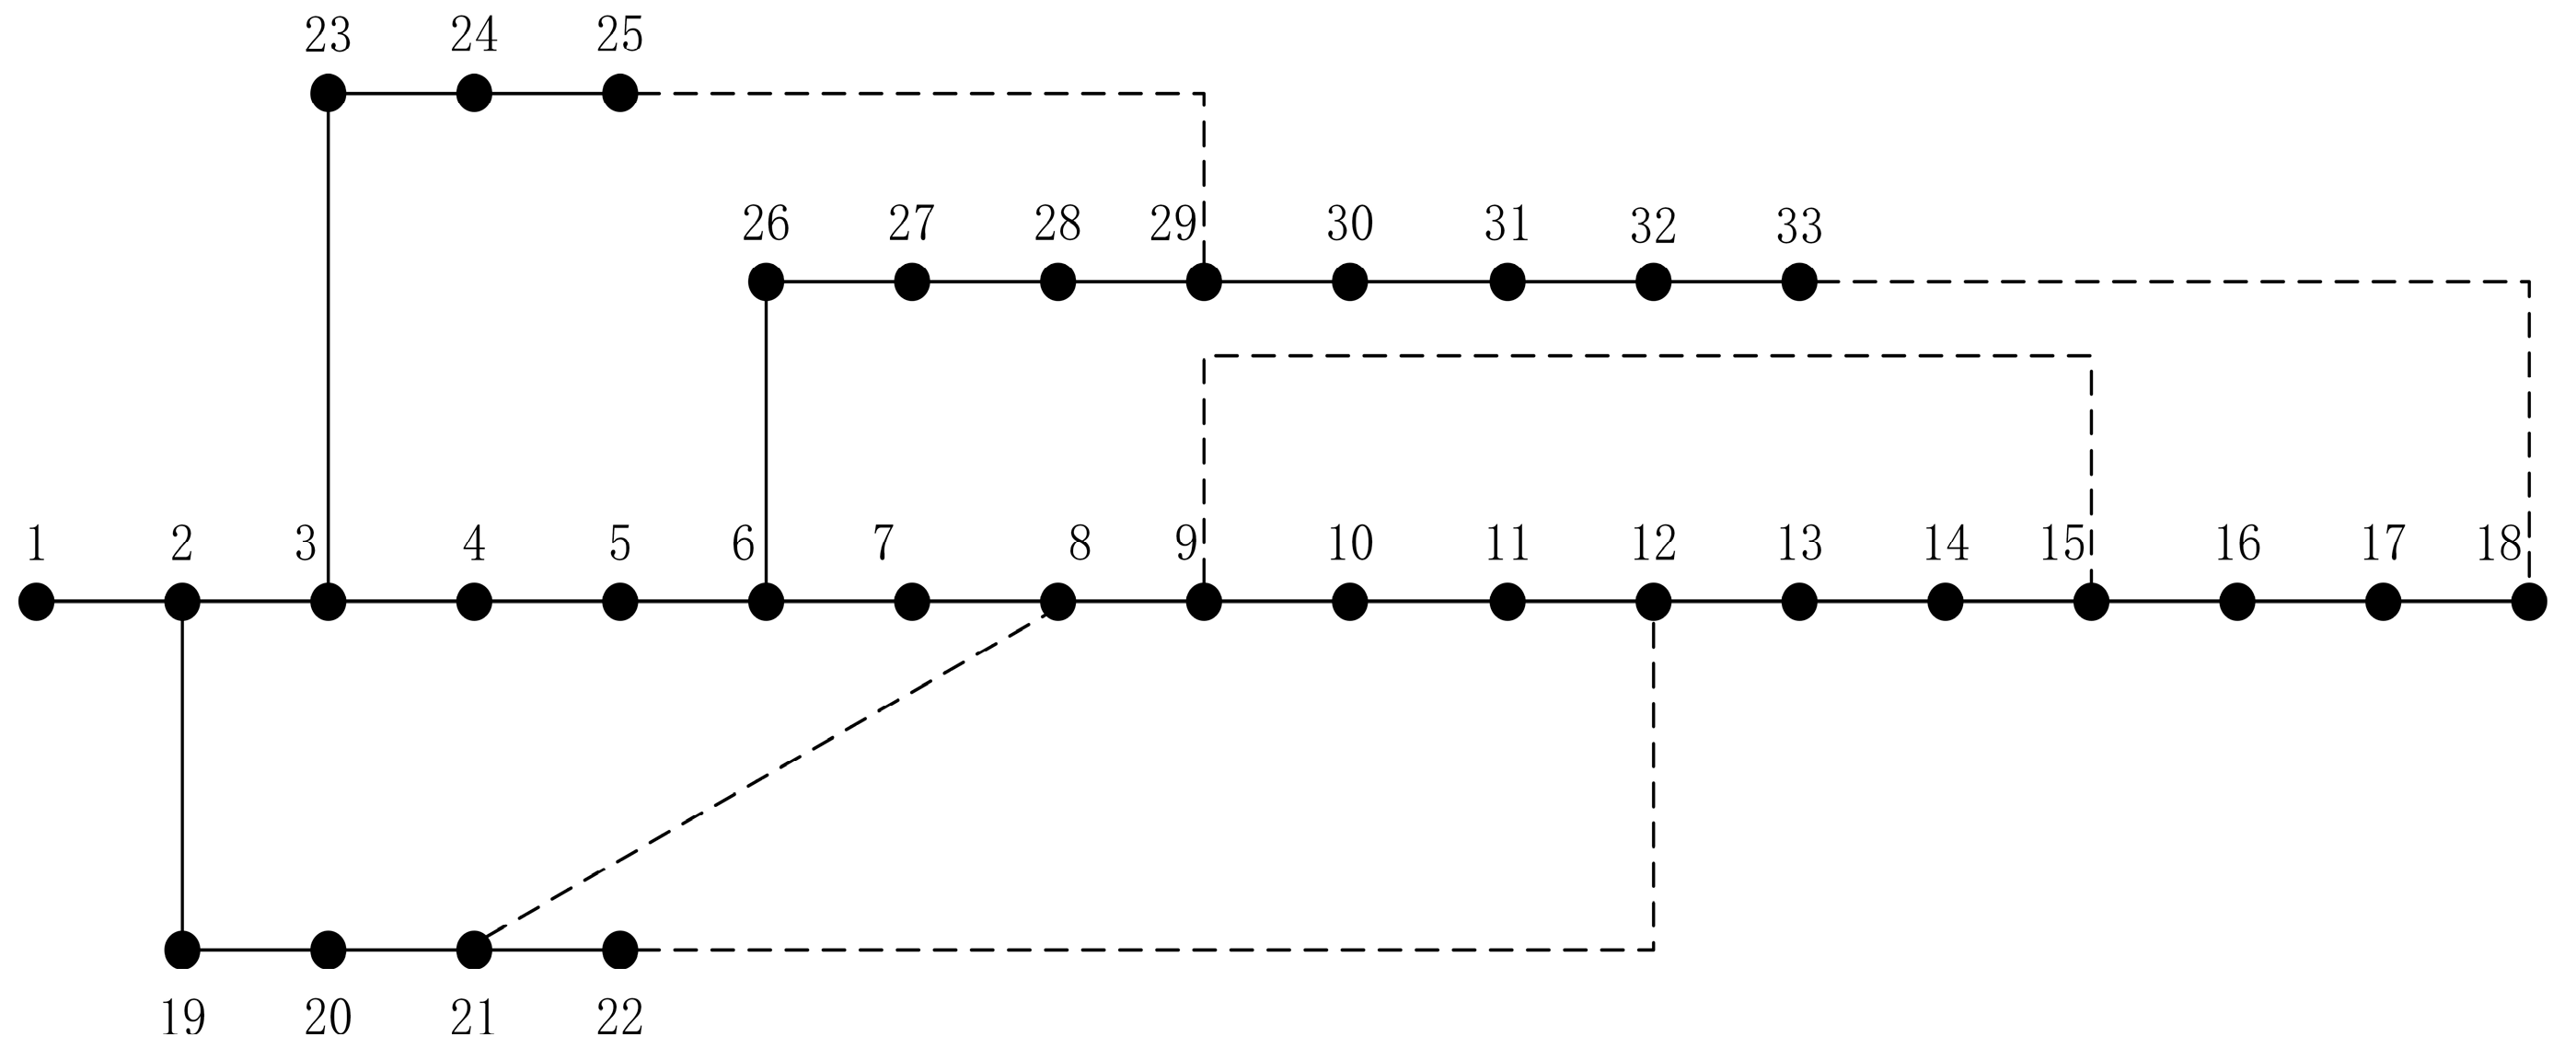
The aging degree of each branch in the distribution network is estimated by comparing the parameters obtained through parameter estimation with the theoretical values. Specifically, the resistance and reactance deviations for each branch are calculated to quantify the aging level [24]. The evaluation is based on the following formulas:
δ i r = r i ^ r i r i
δ i x = x i ^ x i x i
k i = δ i r + δ i x
where for the branch i,  r i and r i ^ are the theoretical value and estimated value of the resistance parameter, δ i r is the resistance deviation, x i and x i ^ are the theoretical and estimated value of the reactance parameter, δ i x is the reactance deviation, and k i is the aging degree.

4. Case Study

The IEEE 33-bus distribution network model [25] is employed to validate the effectiveness of the proposed model. All cases were implemented in MATLAB 2023b on a 2.3-GHz Intel Core i7-12700H computer.

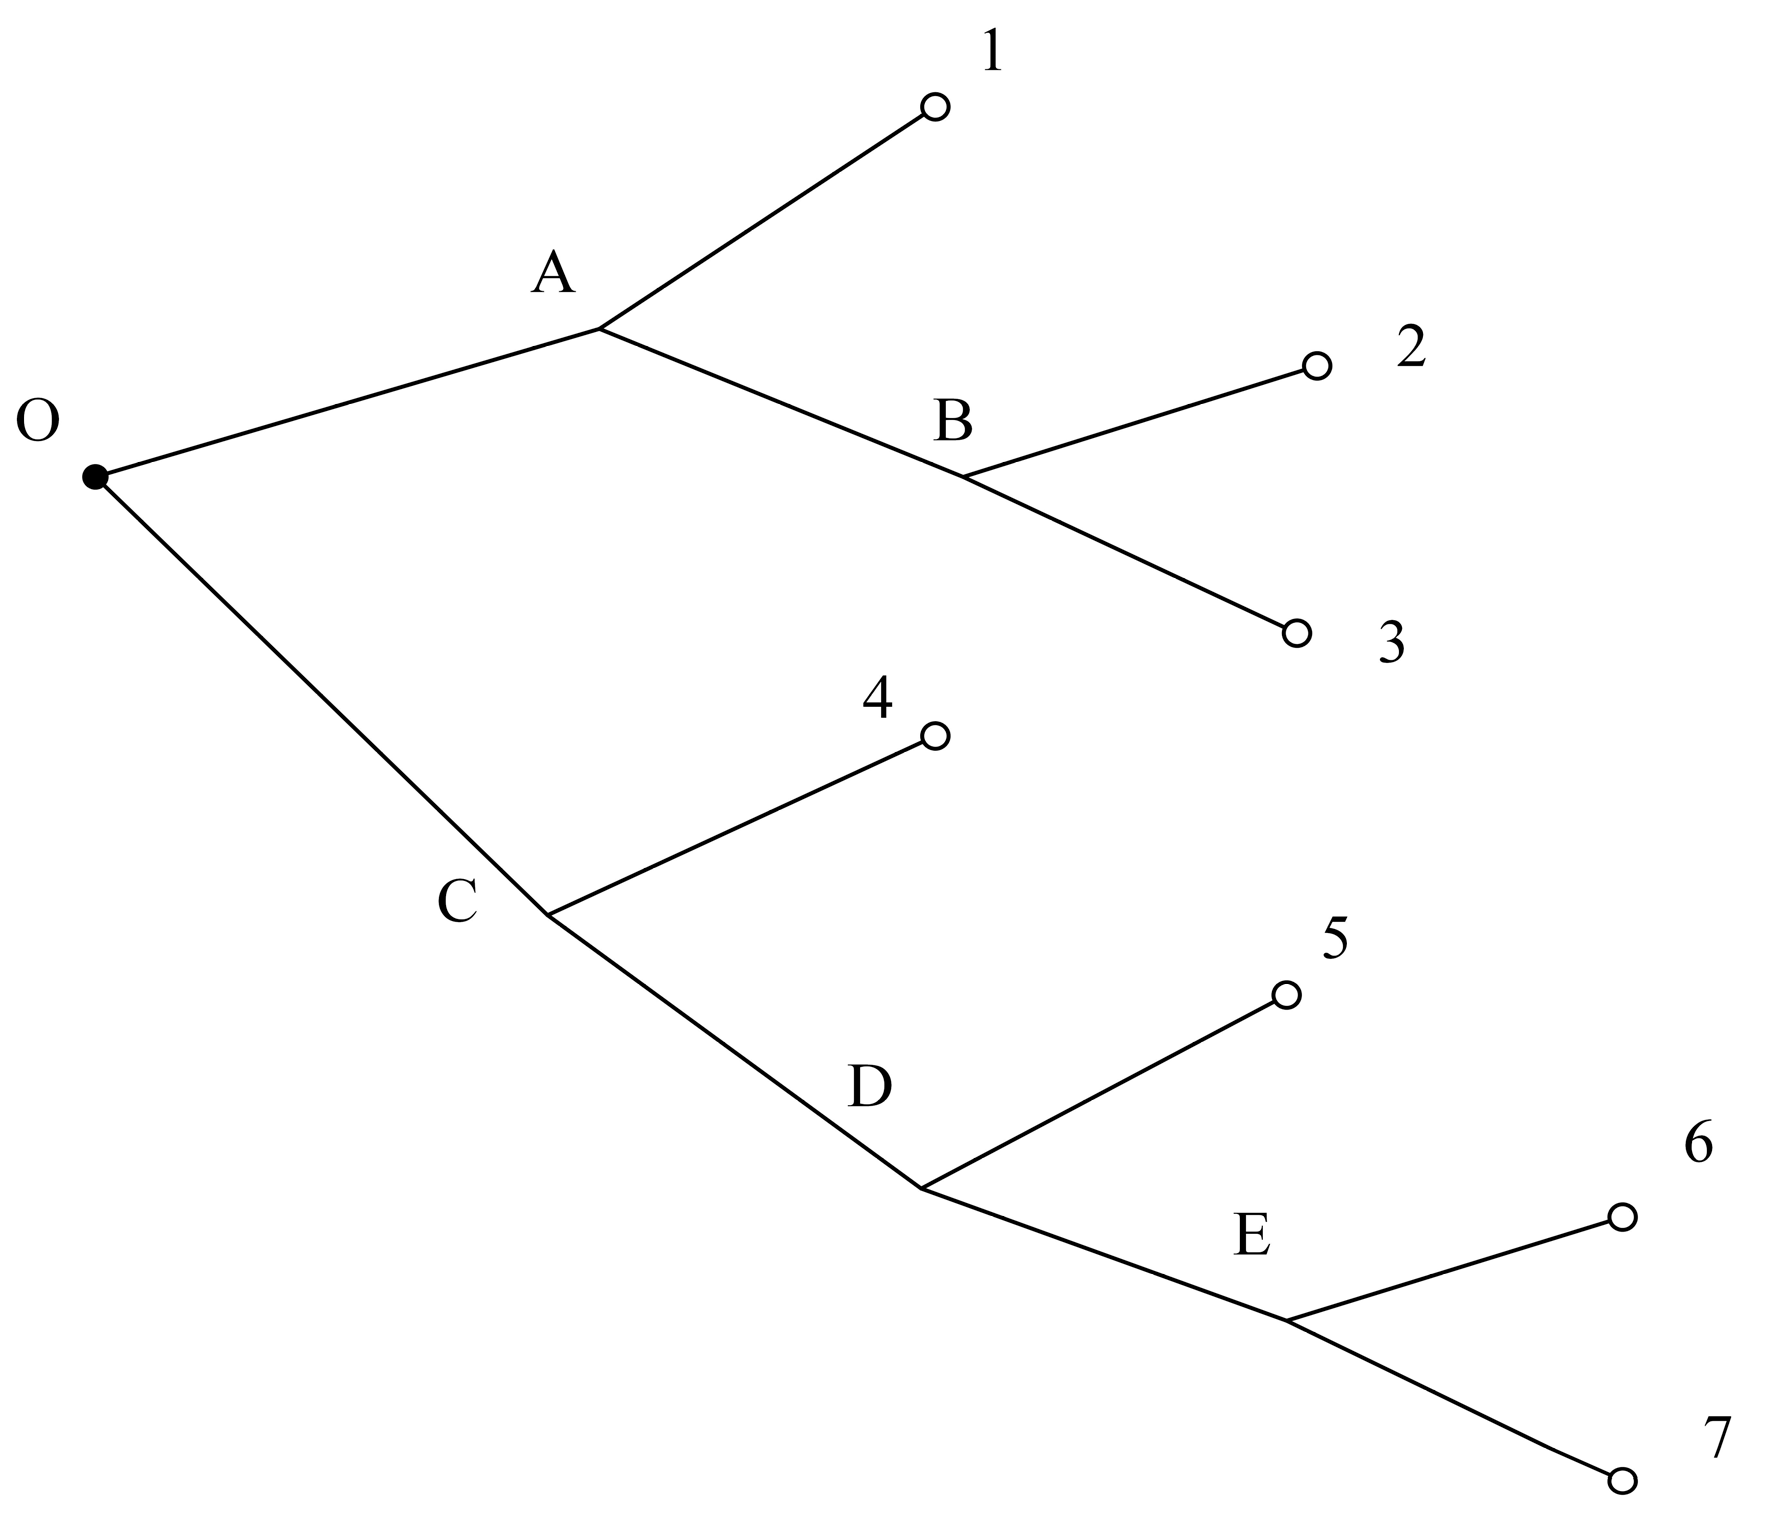
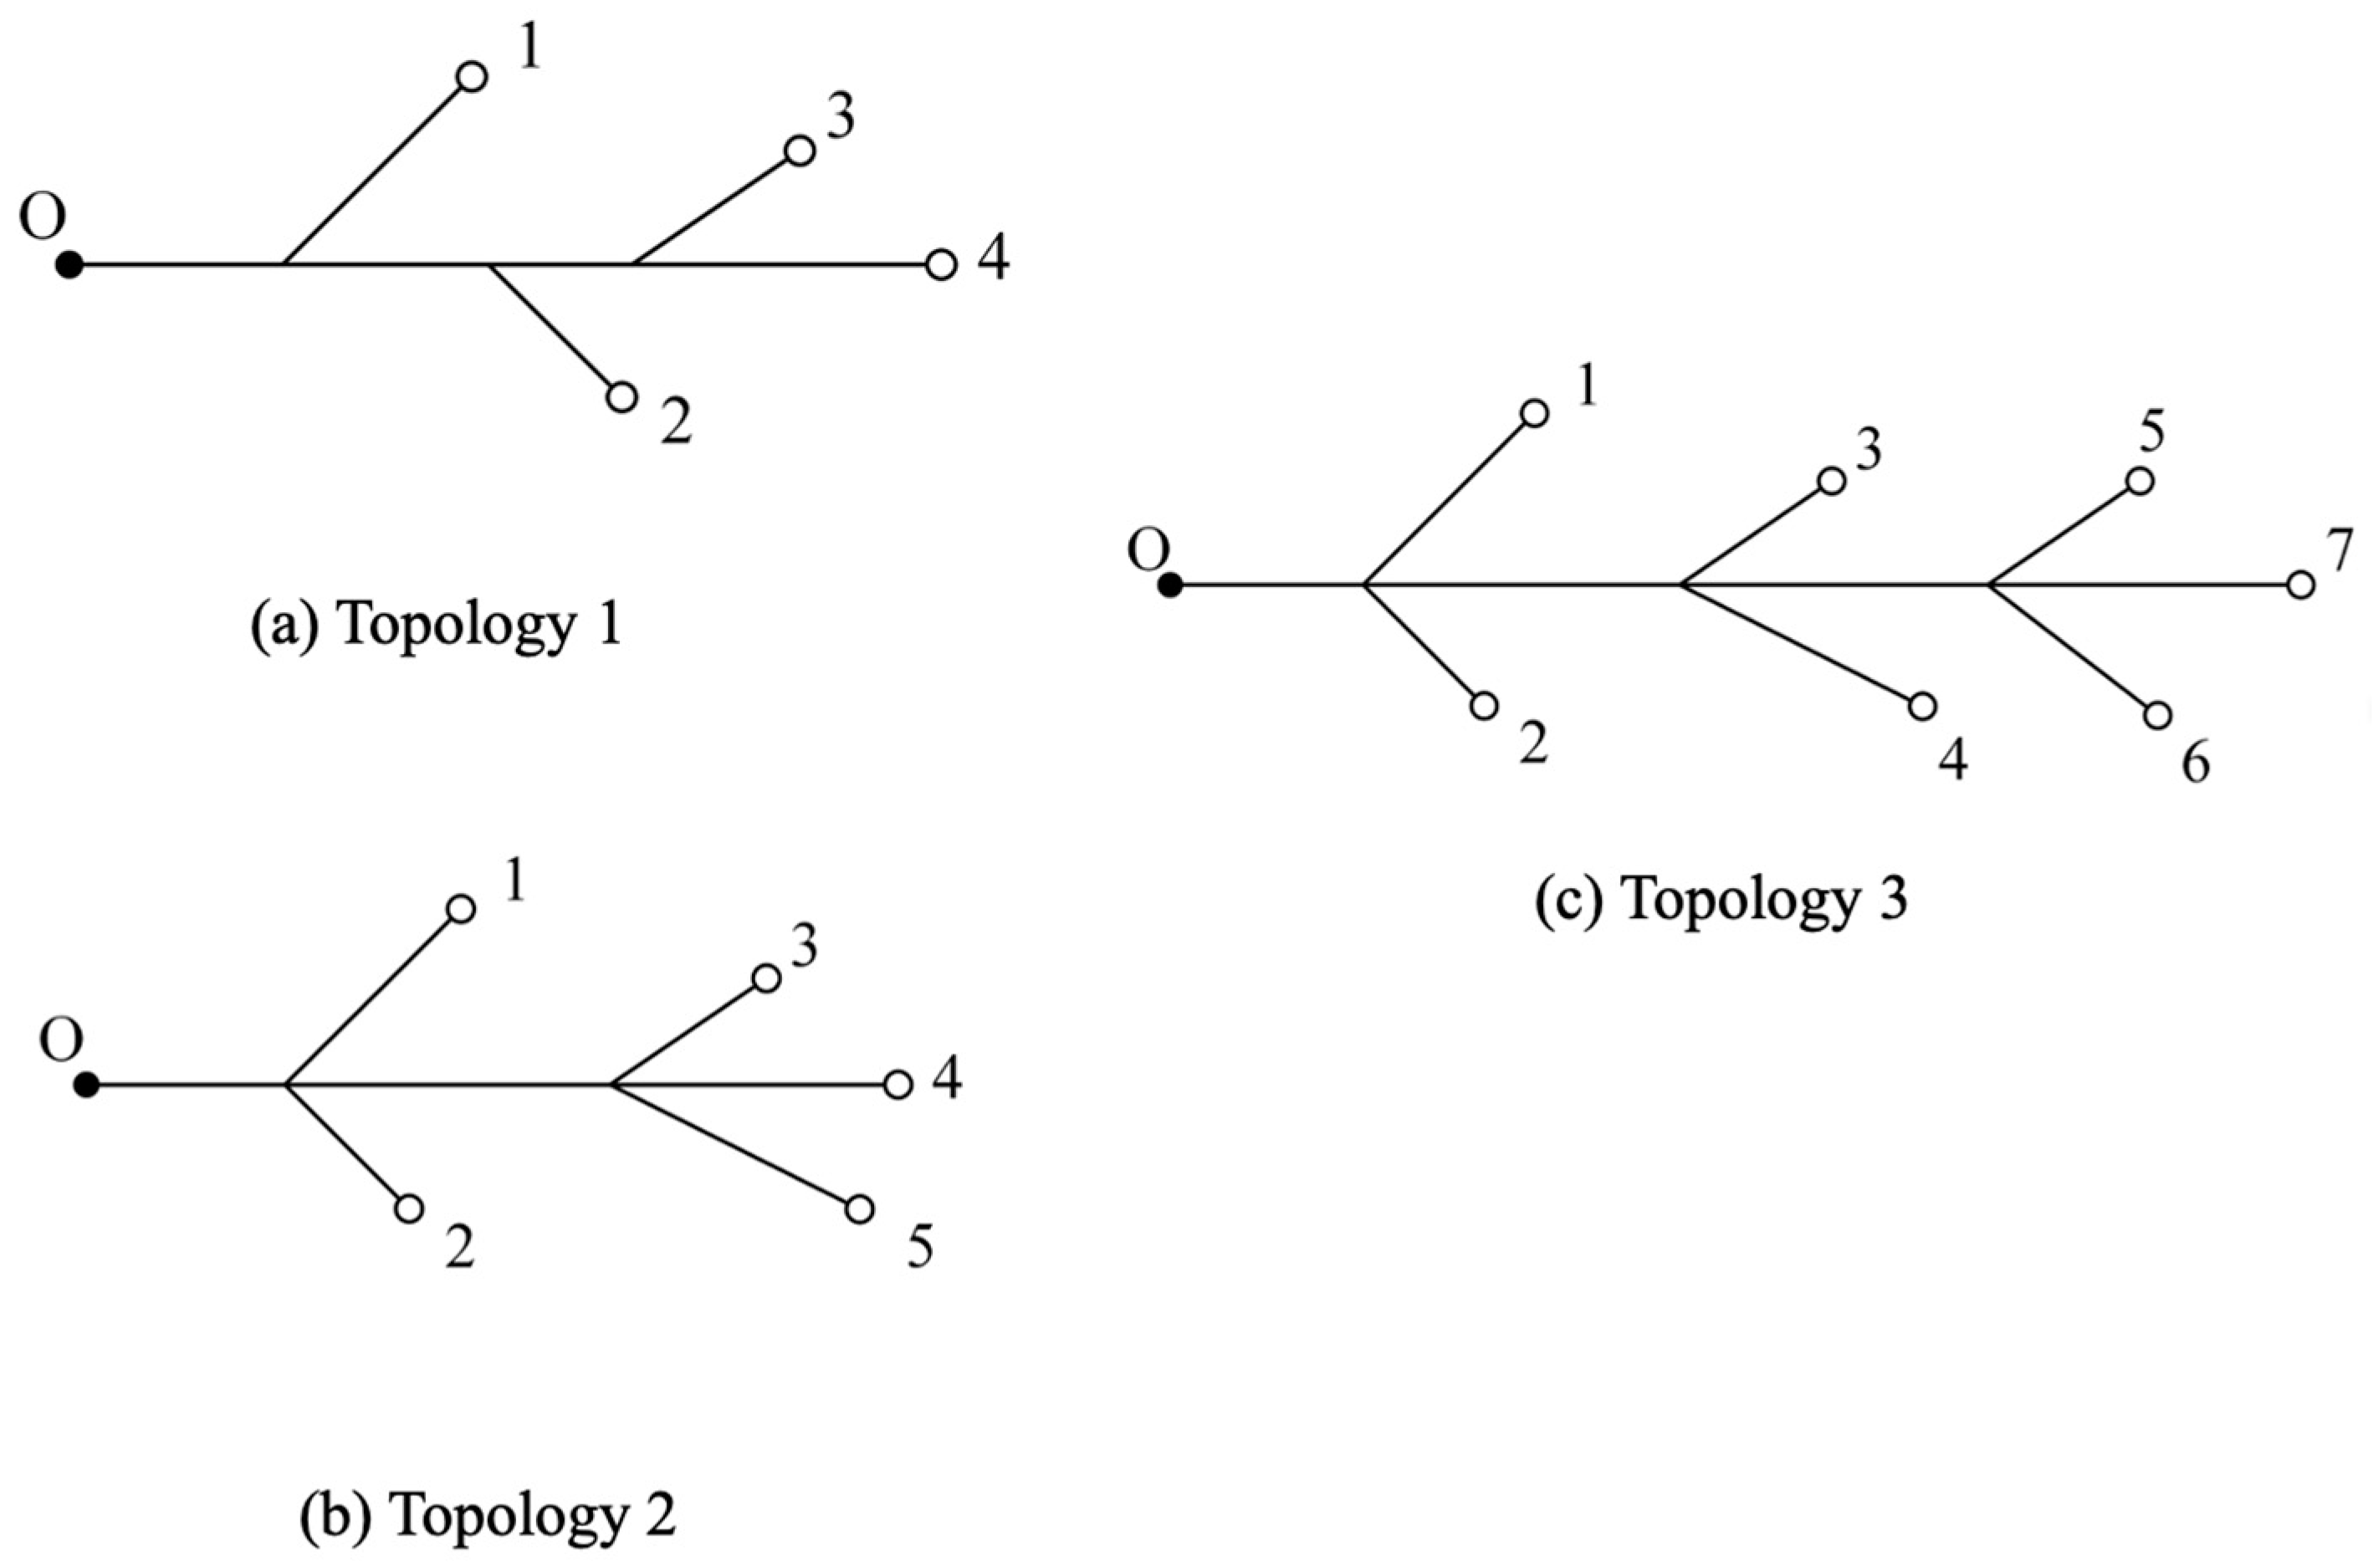
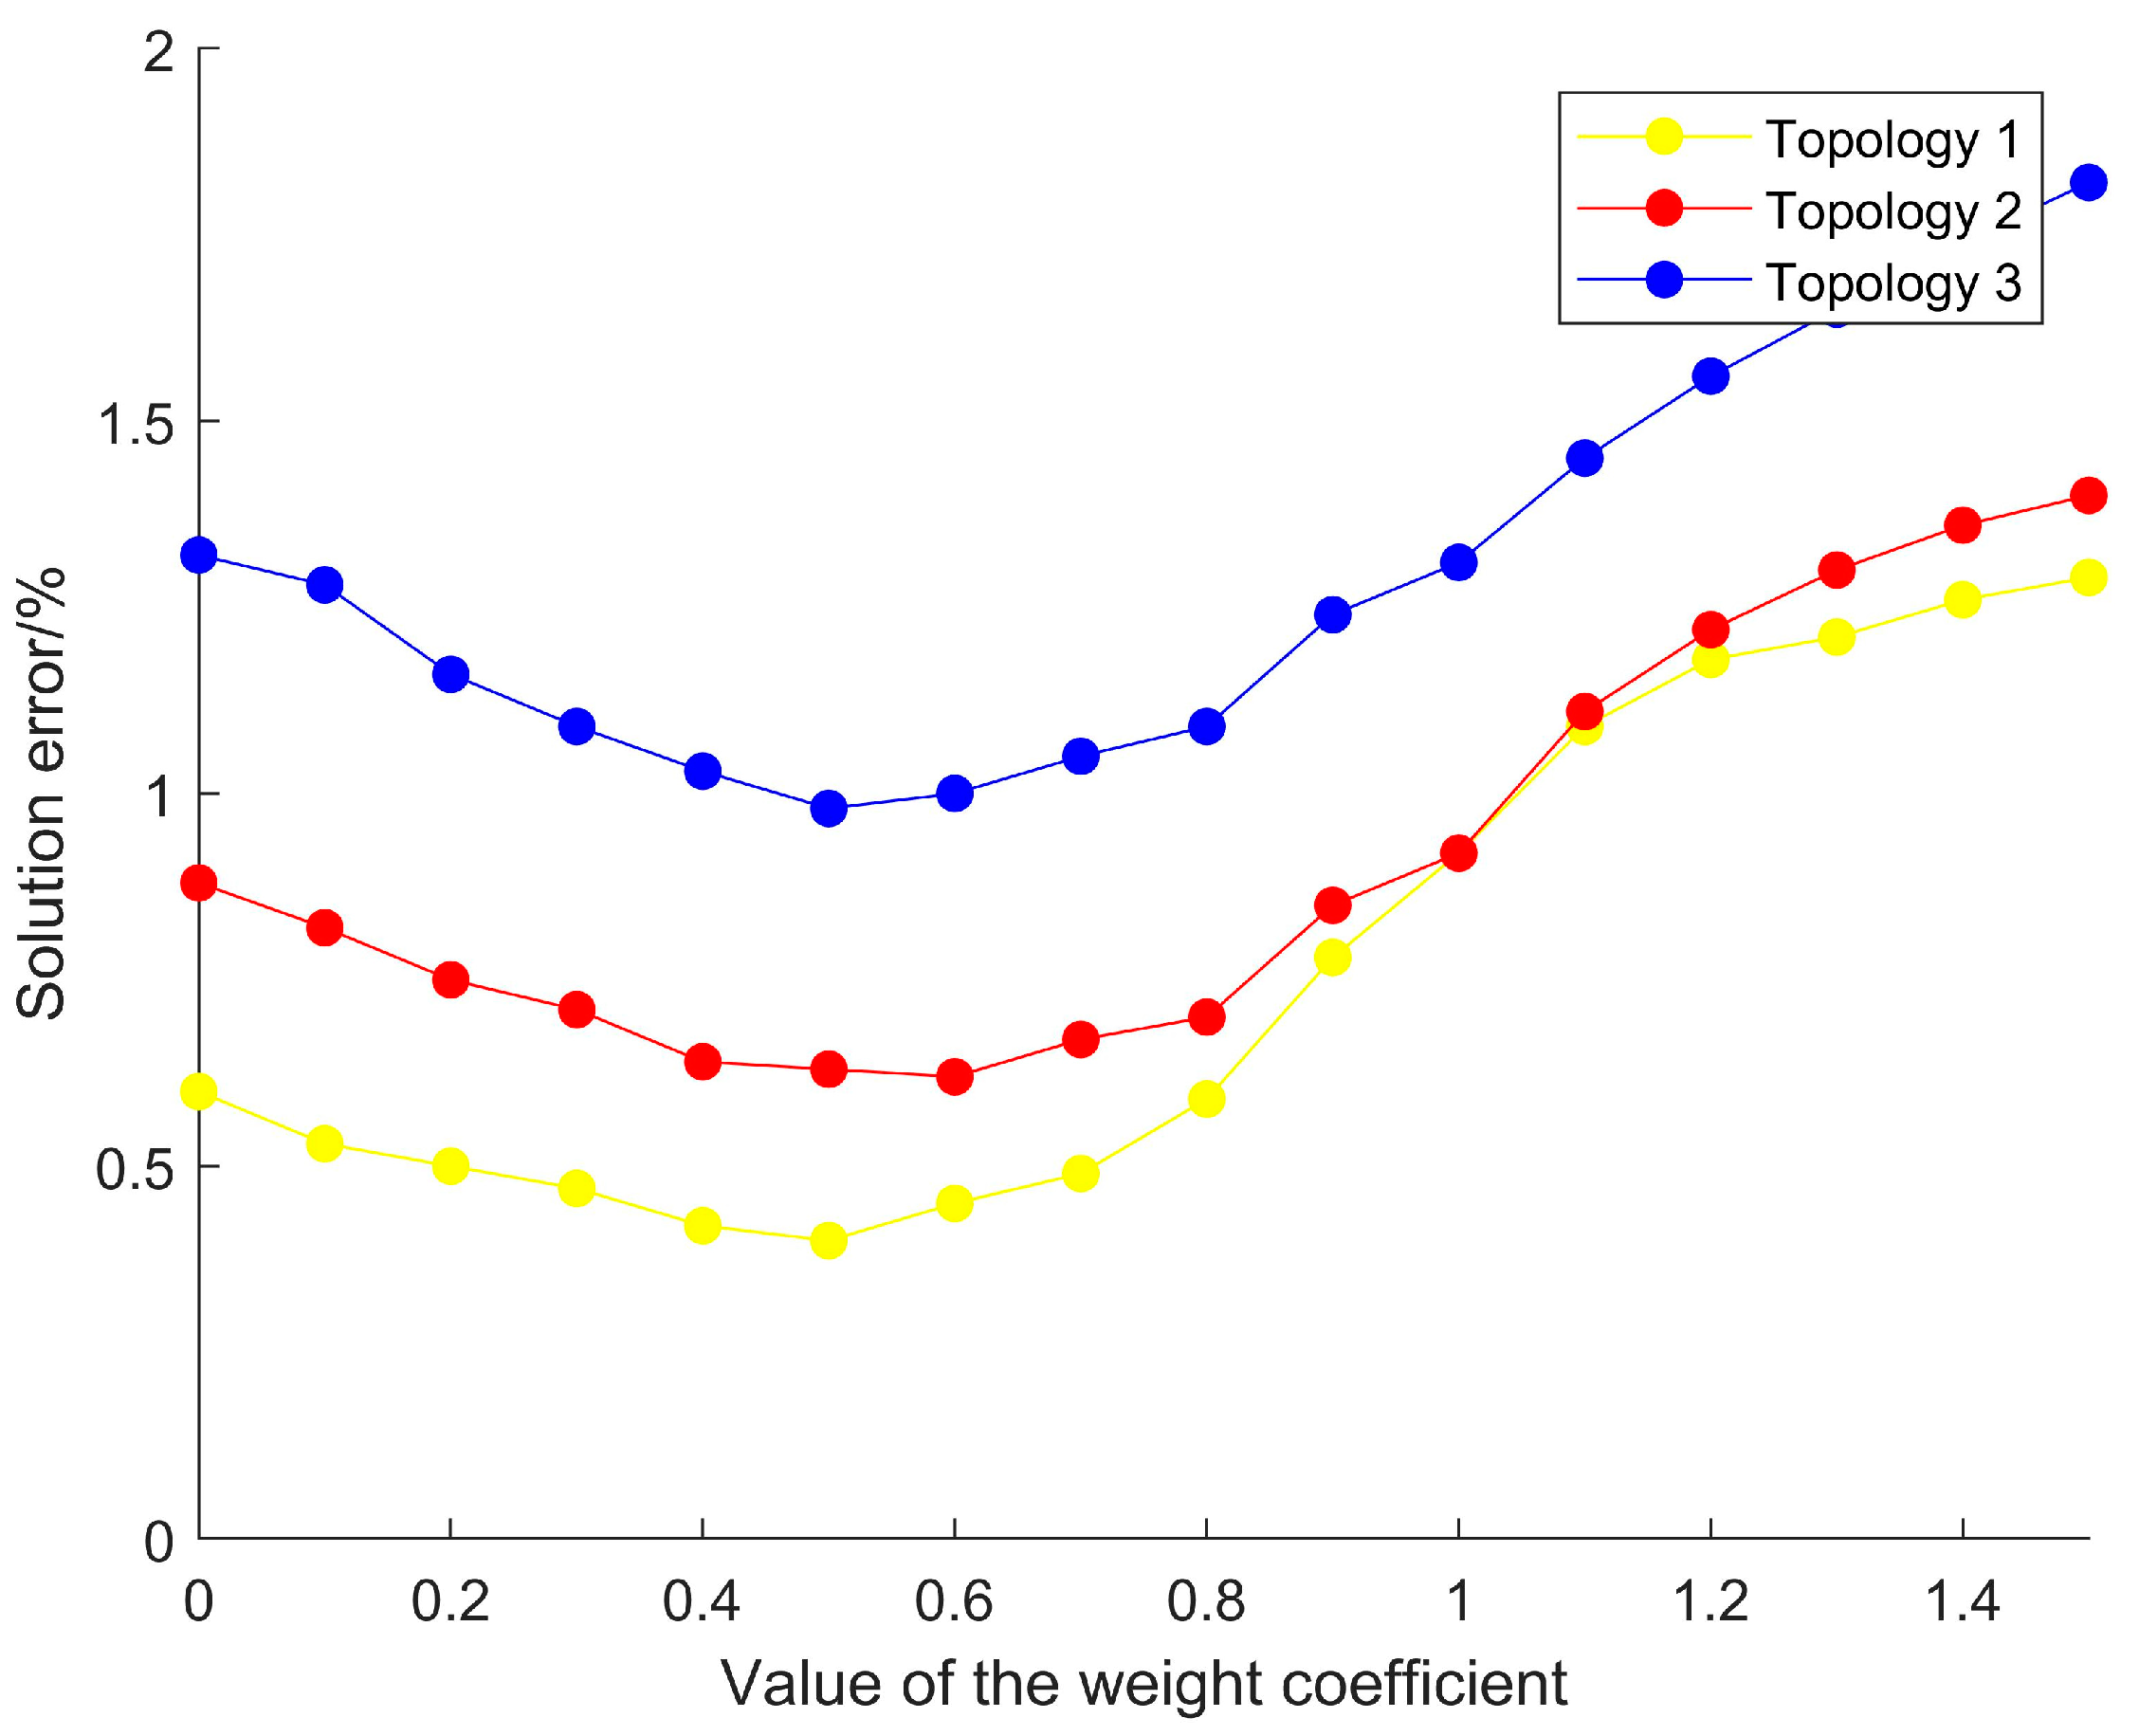
4.1. Topology Matching

Based on the initial topology shown in Figure 5, 15 typical topologies are selected from a known topology library, while the remaining topologies are treated as unknown during model testing. The known topology library includes both distribution networks and radial structures, with the topology label set to 0~15. For each of these 16 topologies, 72 h of measurement data are generated, resulting in a total of 16 × 72 samples. Each sample contains initial data such as voltage magnitude, active power injection, and reactive power injection [26].
The initial topology of the distribution network is divided into regions using a grid-based method based on electrical distance. Within each region, the SVM model is employed to refine the preliminary global topology identification results. The performance of the grid-based topology identification result is compared with the global topology identification result, as shown in Table 1. The accuracy of the global topology matching method is 95.31%, while the grid-based method achieves an improved accuracy of 97.46%. This effectively improves the accuracy of topology identification and provides more reliable topology connections for parameter estimation.

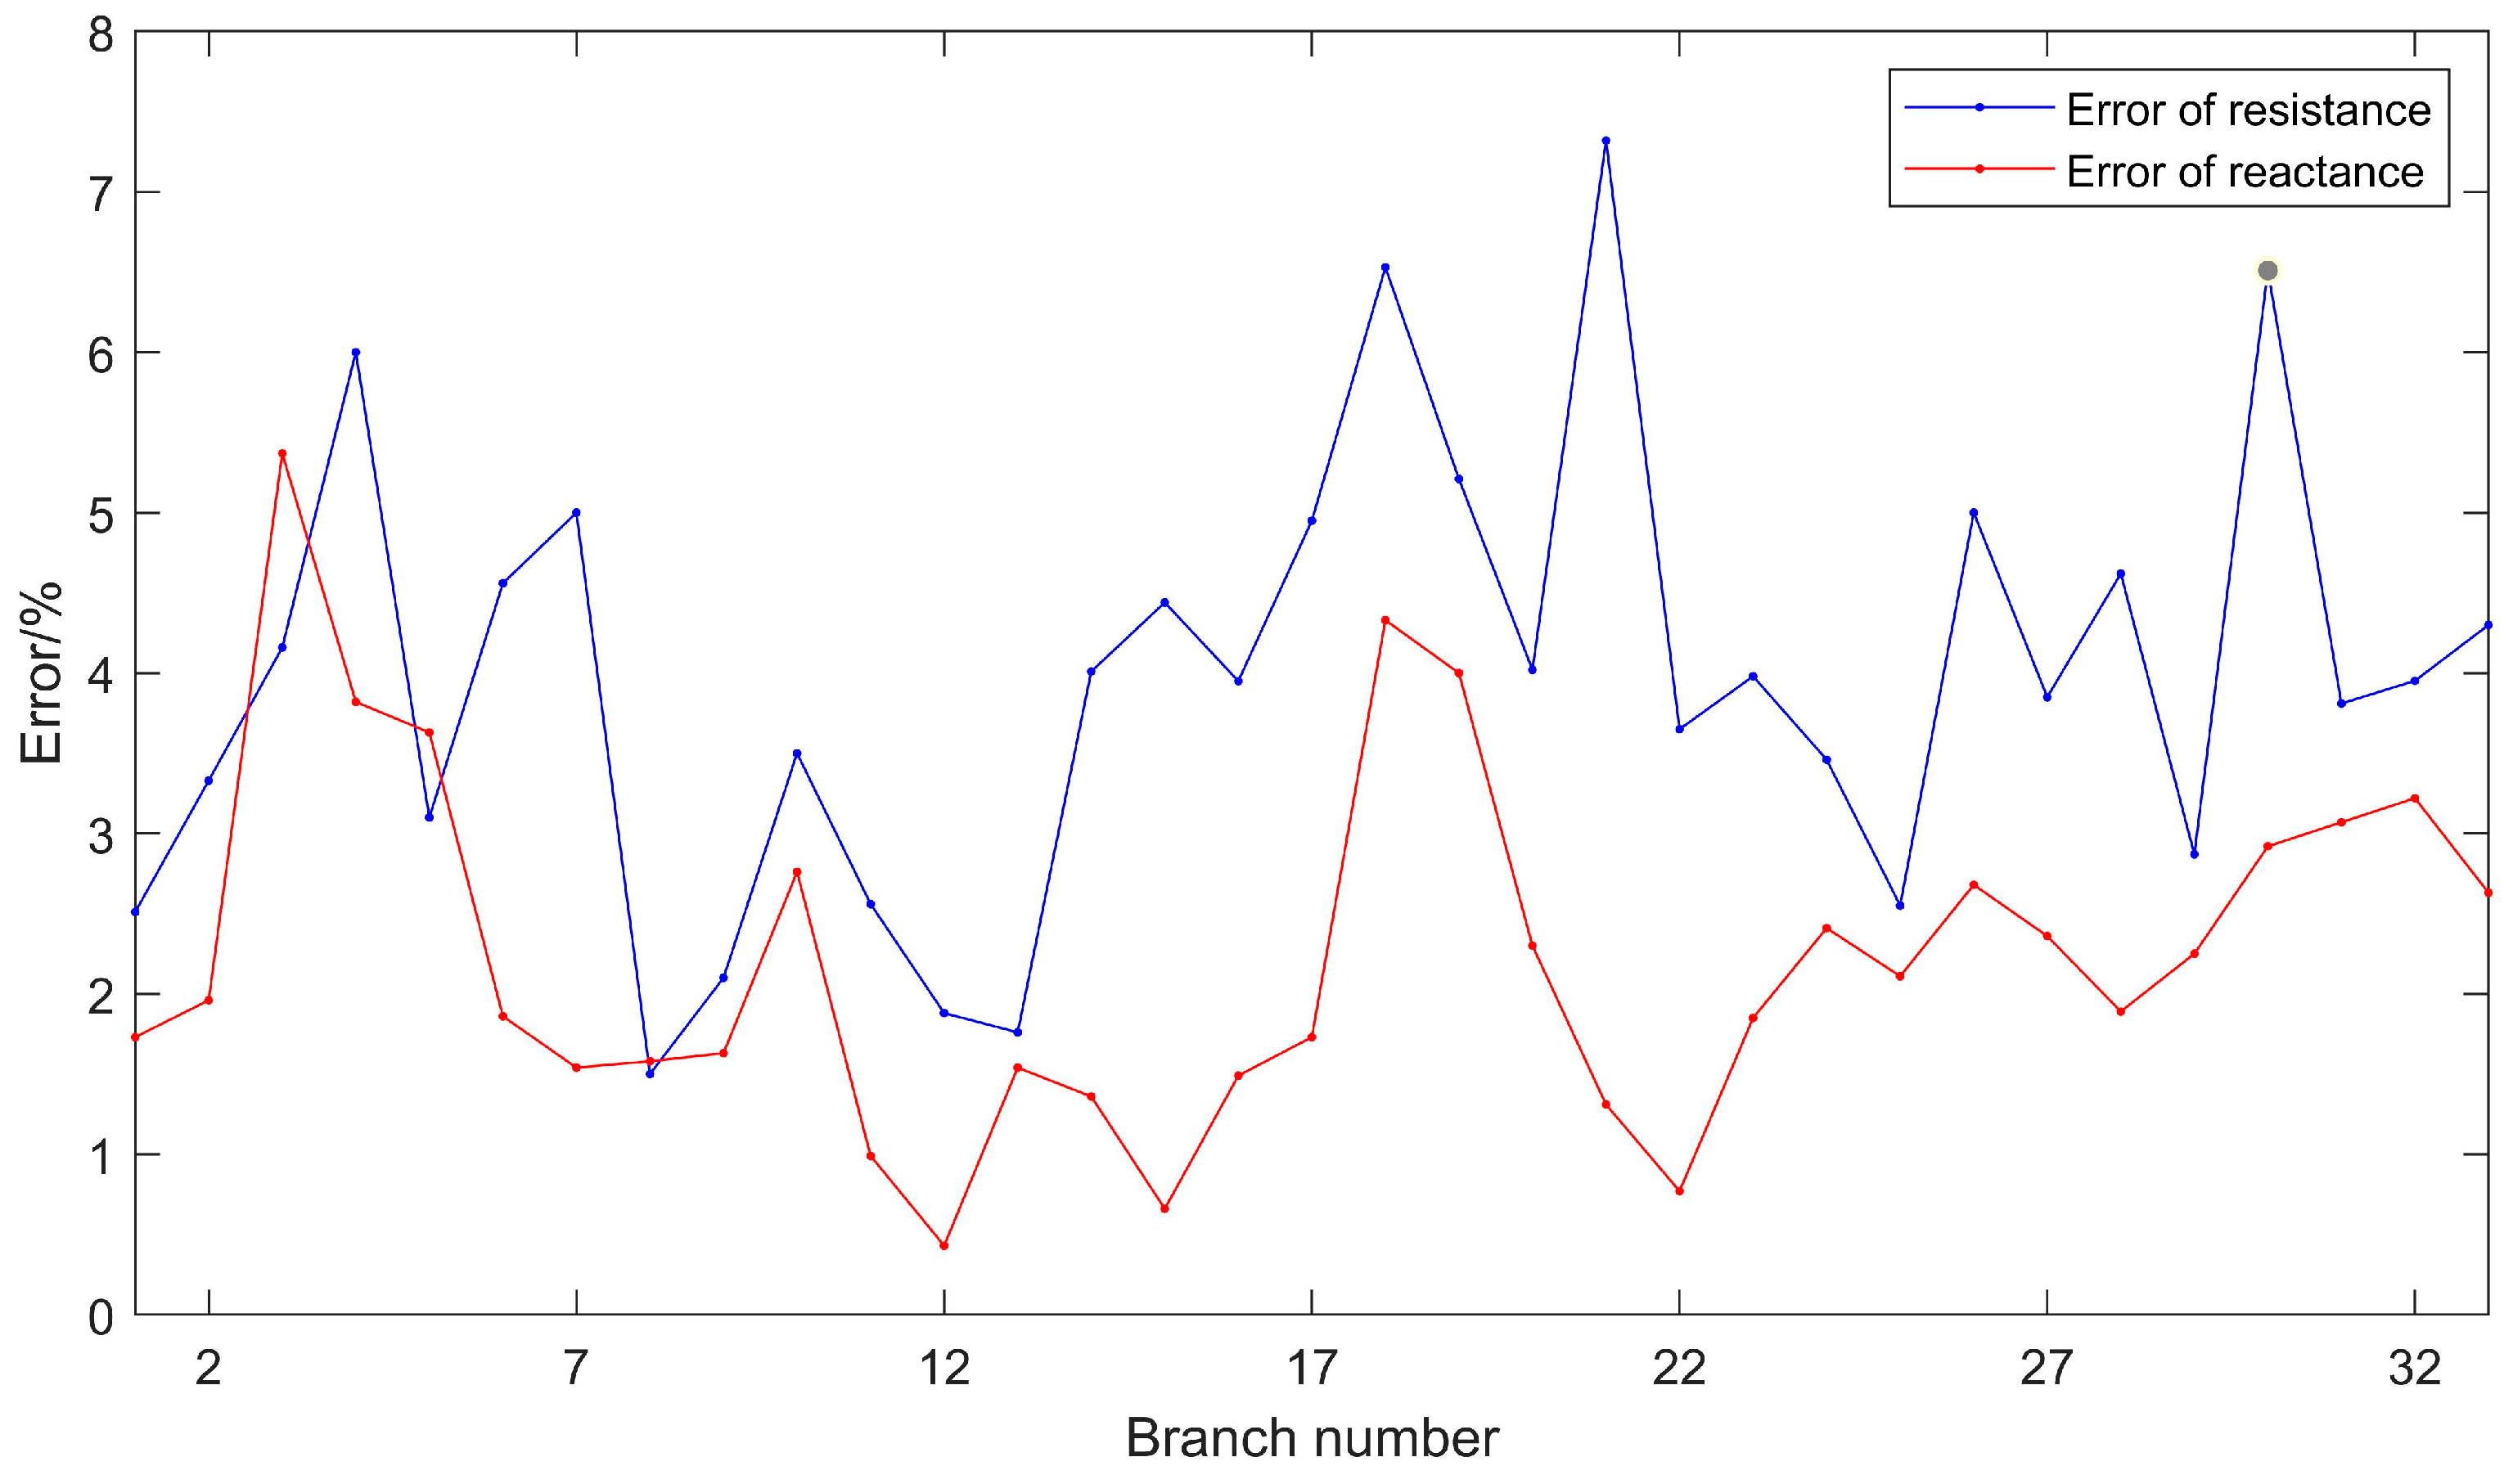
4.2. Parameter Estimation

Voltage, current, and power data from the head and terminal nodes are used to simulate the data acquisition in a distribution network. The target parameters are the impedance values of the line branches. The user power consumption data required in this paper were sampled in Jiangsu Province, and the data of 100 time sections were measured. Gaussian noise was introduced to simulate random errors. The model calculated the impedance parameters, and the results were compared with actual values. Figure 6 illustrates the solution error of the model. With a measurement error of 0.5%, the average error in the resistance parameter is 3.97%, with a maximum error of 7.32%. Similarly, the average error of the reactance parameter is 2.25%, with the maximum error of 5.37%. The overall average error in impedance parameters is 3.11%.
To further evaluate the robustness of the proposed model, we added Gaussian noise with varying proportions to the load data to simulate measurement errors, following the approach in [27]. The performance of the proposed model was then compared with that of a single estimation model. As shown in Table 2, the proposed model demonstrates superior noise resistance and maintains higher accuracy under noisy conditions.

4.3. Location of Abnormal Line Loss Branches

The branch parameters obtained by parameter estimation are compared with the theoretical values to evaluate the aging severity of each branch in the topology shown in Figure 3. As shown in Figure 7, the severity of branch aging increases with the value of ki. In a practical distribution network, the system maintenance personnel are required to establish an aging threshold based on the actual operational conditions. When the aging degree parameter ki of the branch exceeds this threshold, the associated power equipment needs to be overhauled. For instance, with the aging threshold set to 0.18, six branches exceed the aging threshold, indicating a need for maintenance.

5. Conclusions

In this paper, an accurate location method for abnormal line losses in distribution networks, considering topology matching and parameter estimation, is proposed. The method mainly includes two steps: topology matching and parameter estimation. The topology structure of real-time operation of the distribution network is obtained by the topology matching model based on SVM. The accuracy of SVM is enhanced through an optimized parameter selection strategy. On this basis, a multi-objective optimization model is used to estimate power and voltage parameters, improving the accuracy of parameter estimation compared to single-parameter optimization methods. The weighting coefficient is selected to minimize the solution error. Then, the assessment of branch aging levels is employed, and technical abnormal line losses caused by equipment aging are precisely identified.
Comparative results demonstrate that the proposed method significantly enhances parameter estimation accuracy, allowing for the accurate localization of branches with abnormal line losses. Future research aims to develop a systematic and comprehensive framework for abnormal line loss localization by integrating technical and non-technical loss management.

Author Contributions

Conceptualization, H.A. and Q.Z.; methodology, H.A. and Q.Z.; software, H.A. and Q.Z.; validation, H.A., Y.L., and C.H.; formal analysis, H.A.; investigation, H.A.; resources, Q.Z.; data curation, H.A.; writing—original draft preparation, H.A.; writing—review and editing, J.L. and Q.W.; visualization, J.L. and Q.W.; supervision, J.L. and Q.W. All authors have read and agreed to the published version of the manuscript.

Funding

This research was funded by the Science and Technology Project of Jiangsu Electric Power Co., Ltd. Research Institute (5400-202318203A-1-1-ZN).

Data Availability Statement

No new data were created or analyzed in this study.

Conflicts of Interest

Authors Haiyun An, Yufang Liu and Cheng Huang were employed by the company State Grid Jiangsu Electric Power Research Institute. The remaining authors declare that the research was conducted in the absence of any commercial or financial relationships that could be construed as a potential conflict of interest. The funders had no role in the design of the study; in the collection, analysis, or interpretation of data; in the writing of the manuscript; or in the decision to publish the results.

Abbreviations

The following abbreviations are used in this manuscript:
SVMSupport vector machine
NTLNon-technical loss
TLTechnical loss

References

  1. Chen, H.; Xu, L.; Yang, L.; Jin, Y.; Fu, H.; Li, S. Research status and prospects on technical loss reduction of regional power grid. Power Syst. Technol. 2024, 49, 1–13. [Google Scholar]
  2. Sun, K. Lean Analysis of Transformer District Line Loss Based on Data Mining Applied Research. Master’s Theses, Zhengzhou University, Zhengzhou, China, 2021. [Google Scholar]
  3. Chen, G.; Zhang, S.; Yang, L.; Huang, W.; Nan, Y.; Zhang, Y.; Hao, S. Station line loss rate anomaly identification and accurate tracking method of associated users based on multi-dimensional scene division. Power Syst. Prot. Control 2024, 52, 162–177. [Google Scholar]
  4. Chen, C. Research on Abnormal Power Loss Detection and Combined Power Loss Reduction Strategy Optimization in the Distribution Network. Master’s Thesis, Southeast University, Nanjing, China, 2021. [Google Scholar]
  5. Wang, H.; Zhang, Y.; Yan, F.; Chen, Y.; Yang, L.; Chang, Q.; Zhang, Z.; Chen, Q.; Yuan, Q. The study of coal-to-electricity district line loss anomaly identification method based on deep neural network. Power Demand Side Manag. 2018, 20, 31–35. [Google Scholar]
  6. Zhang, C.; Xiao, X.; Zheng, Z. Electricity theft detection for customers in power utility based on real-valued deep belief network. Power Syst. Technol. 2019, 43, 1083–1091. [Google Scholar]
  7. Xiao, F.; Qian, A. Electricity theft detection in smart grid using random matrix theory. IET Gener. Transm. Distrib. 2018, 12, 371–378. [Google Scholar] [CrossRef]
  8. Huang, S.-C.; Lo, Y.-L.; Lu, C.-N. Non-Technical Loss Detection Using State Estimation and Analysis of Variance. IEEE Trans. Power Syst. 2013, 28, 2959–2966. [Google Scholar] [CrossRef]
  9. Amin, S.; Schwartz, G.A.; Cardenas, A.A.; Sastry, S.S. Game-Theoretic Models of Electricity Theft Detection in Smart Utility Networks: Providing New Capabilities with Advanced Metering Infrastructure. IEEE Control Syst. Mag. 2015, 35, 66–81. [Google Scholar]
  10. Guo, Y.; Yuan, Y.; Wang, Z. Distribution grid modeling using smart meter data. IEEE Trans. Power Syst. 2021, 37, 1995–2004. [Google Scholar] [CrossRef]
  11. Madbhavi, R.; Natarajan, B.; Srinivasan, B. Distribution System Topology Identification Using Graph Neural Networks. In Proceedings of the 2023 IEEE PES GTD International Conference and Exposition (GTD), Istanbul, Turkiye, 22–25 May 2023; pp. 151–155. [Google Scholar]
  12. Zelenskii, E.G.; Tuchina, D.S.; Kononov, Y.G.; Kozhevnikov, V.M. Mobile Laboratory for Identification of Radial Distribution Network Topology. In Proceedings of the 2022 IEEE International Multi-Conference on Engineering, Computer and Information Sciences (SIBIRCON), Yekaterinburg, Russia, 11–13 November 2022; pp. 2110–2115. [Google Scholar]
  13. Amoateng, D.O.; Yan, R.; Mosadeghy, M.; Saha, T.K. Topology detection in power distribution networks: A PMU based deep learning approach. IEEE Trans. Power Syst. 2021, 37, 2771–2782. [Google Scholar] [CrossRef]
  14. Liao, W.; Zhu, R.; Takiddin, A.; Tariq, M.; Ruan, G.; Cui, X. Transfer Learning-Driven Electricity Theft Detection in Small Sample Cases. IEEE Trans. Instrum. Meas. 2024, 73, 1–13. [Google Scholar] [CrossRef]
  15. Long, H.; Chen, C.; Gu, W.; Xie, J.; Wang, Z.; Li, G. A data-driven combined algorithm for abnormal power loss detection in the distribution network. IEEE Access 2020, 8, 24675–24686. [Google Scholar] [CrossRef]
  16. Bettiol, A.L.; Gomides, P.S.; Figueiredo, D.B.S.; Medeiros, R. Detection and Tracking of Atypical Billings Aiming at Minimizing Non-Technical Losses in Distribution Companies in Brazil. In Proceedings of the 2023 International Conference on Electrical, Computer and Energy Technologies (ICECET), Cape Town, South Africa, 16–17 November 2023; pp. 1–5. [Google Scholar]
  17. Liao, W.; Zhu, R.; Yang, Z.; Liu, K.; Zhang, B.; Zhu, S.; Feng, B. Electricity Theft Detection Using Dynamic Graph Construction and Graph Attention Network. IEEE Trans. Ind. Inform. 2024, 20, 5074–5086. [Google Scholar] [CrossRef]
  18. Larose, D.T.; Larose, C.D. Discovering Knowledge in Data: An Introduction to Data Mining; John Wiley & Sons: Hoboken, NJ, USA, 2014. [Google Scholar]
  19. Liao, Z.; Liu, Y.; Wang, B.; Tao, W. Topology Identification of Active Low-Voltage Distribution Network Based on Regression Analysis and Knowledge Reasoning. Energies. 2024, 17, 1762. [Google Scholar] [CrossRef]
  20. Wu, X.; Sun, F.; Li, F. Dynamic reactive power optimization of distribution network based on electric distance partition. J. Xi’an Shiyou Univ. (Nat. Sci. Ed.) 2023, 38, 94–99+128. [Google Scholar]
  21. Luan, W.; Wang, B.; Zhou, N.; Guo, Z. Modeling of LV distribution network based on metering data. Power Syst. Technol. 2015, 39, 3141–3146. [Google Scholar]
  22. Wang, X. A survey of gradient descent and optimization algorithms. Comput. Knowl. Technol. 2022, 18, 71–73. [Google Scholar]
  23. Wang, Q.S. A New Steepest Descent Method. Master’s Thesis, Jilin University, Jilin, China, 2021. [Google Scholar]
  24. Li, S.; Chen, H.; Qin, Y.; Guo, W.; Xu, X. Research on the influence of 10 kV line aging and high resistance grounding fault on line loss. Electr. Power Equip. Manag. 2021, 4, 185–186. [Google Scholar]
  25. Baran, M.E.; Wu, F.F. Optimal capacitor placement on radial distribution systems. IEEE Trans. Power Deliv. 1989, 4, 725–734. [Google Scholar] [CrossRef]
  26. Zimmerman, R.D.; Murillo-Sanchez, C.E.; Thomas, R.J. MATPOWER: Steady-state operations, planning, and analysis tools for power systems research and education. IEEE Trans. Power Syst. 2011, 26, 12–19. [Google Scholar] [CrossRef]
  27. Liu, Q. Online Analysis of Low Frequency Oscillation Identification Based on WAMS Light. Master’s Thesis, Shandong University, Shandong, China, 2014. [Google Scholar]
Figure 1. The topology matching process of the distribution network.
Energies 18 02324 g001
Figure 2. Topology diagram of the distribution network.
Energies 18 02324 g002
Figure 3. Three typical distribution network topologies.
Energies 18 02324 g003
Figure 4. Value of weight coefficient and solution error.
Energies 18 02324 g004
Figure 5. Initial topology of the IEEE 33-bus distribution network.
Energies 18 02324 g005
Figure 6. Solution error of branch impedance parameters.
Energies 18 02324 g006
Figure 7. Assessment diagram of the aging degree of branches.
Energies 18 02324 g007
Table 1. Performance comparison of topology matching methods.
Topology Matching MethodAccuracy/%Time/s
Global topology matching method95.310.962
The topology matching method combined with the grid97.462.412
Table 2. Comparison of solution errors of impedance parameters under different measurement errors.
Measurement Error/%Average Error of Impedance Parameters/%
The Model Established in This PaperVoltage Estimation ModelPower Estimation Model
0.53.113.325.94
13.364.116.78
35.717.199.93
Disclaimer/Publisher’s Note: The statements, opinions and data contained in all publications are solely those of the individual author(s) and contributor(s) and not of MDPI and/or the editor(s). MDPI and/or the editor(s) disclaim responsibility for any injury to people or property resulting from any ideas, methods, instructions or products referred to in the content.

