1. Introduction
The shift toward sustainable mobility stands as one of the greatest challenges of our time, driven by the pressing need to cut greenhouse gas emissions, reduce air pollution, and lessen dependence on fossil fuels. Central to meeting these objectives is the advancement of electric propulsion systems in vehicles, which presents a compelling alternative to traditional internal combustion engines powered by gasoline or diesel. Fueled by improvements in battery technology and the incorporation of renewable energy sources, electric propulsion systems are redefining the future of transportation. By eliminating exhaust emissions, electric vehicles (EVs) directly contribute to cleaner air and a reduction in greenhouse gases, addressing environmental issues on both local and global scales. Additionally, the growing use of renewable energy, such as wind and solar, in charging networks enhances the sustainability of electric propulsion, aligning it closely with broader renewable energy targets.
In this endeavor, governments, industry leaders, and researchers around the world are instrumental. Following the European Union’s 2011 proposal to phase out conventional fuel sales, many countries have set deadlines to discontinue traditional fuel vehicle production, bolstered by supportive funding and policies that further accelerate the development of battery-powered vehicles [
1]. The main energy source driving these electric motors is the battery system. Today, various types of batteries, including nickel–cadmium (Ni-Cd), nickel–metal hydride (Ni-MH), and lithium-ion (Li-ion), are proposed and utilized in electric and hybrid vehicles. Among the battery types used in large-scale electric vehicle production by main manufacturers, Ni-Cd and Ni-MH were the most popular choices up until the early 2000s [
2,
3]. However, in recent years, Li-ion batteries have become the preferred choice for electric vehicle manufacturers due to their notable benefits, such as a low self-discharge rate, extended cycle life, lighter weight, higher recyclability, and high power and energy density [
4,
5]. Moreover, recent studies suggest that lithium-ion batteries will keep evolving, becoming more affordable, safer, and more efficient in both energy storage and power output capabilities, maintaining a competitive edge over other battery types in the coming years [
6].
Nonetheless, issues related to degradation and thermal safety remain key factors in the development of lithium-ion batteries and their use in electric vehicles [
7,
8]. Research has shown that temperature greatly influences battery capacity [
9], cycle life [
10], and safety [
11]. The performance and stability of Li-ion batteries can deteriorate quickly outside of optimal temperature ranges (from 20 °C to 40 °C [
12,
13]) for most cell materials.
At low temperatures, battery capacity can drop substantially due to lithium plating during high-rate charging/discharging [
14], while high temperatures accelerate battery degradation [
15,
16]. In this work the analysis is focused on the high-temperature related issues since they represent the main problem in this type of battery. Indeed, at elevated temperatures, several detrimental effects impact battery performance, including capacity and power fade, as well as increased self-discharge rates [
2]. These factors can lead to significant energy loss. Bandhauer et al. [
17] have documented the degradation of capacity and power in various positive electrode materials subjected to high-temperature cycling and storage, revealing that capacity begins to decline when temperatures exceed approximately 50 °C. For example, Sony 18650 cells experienced a 36% capacity loss after 800 cycles at 45 °C, and over 70% capacity loss after 490 cycles at 55 °C [
18]. Thomas et al. [
19] performed an accelerated aging test to investigate how aging and temperature affect the performance of lithium-ion cells, revealing that a 55% power loss occurred after 20 weeks of storage at 55 °C. Safety is a major concern for EVs; in addition to the poor performance at elevated temperatures, each cell in the battery pack is prone to overheating due to short circuits or excessively high external temperatures. If the self-heating process becomes uncontrollable, thermal runaway may happen, resulting in fire or explosion hazards [
20].
In addition to performance at high temperatures, maintaining a uniform temperature distribution is crucial for ensuring the efficient operation of batteries. Effective temperature uniformity must be assessed at the cell, module, and pack levels [
2]. A non-uniform temperature distribution within a single cell leads to varying electrochemical reaction rates, which can shorten battery lifespan and reduce the effective energy usage [
21]. A temperature variation of just 5 °C can decrease the capacity of a battery pack by 1.5–2% [
22] and reduce its power output by 10% [
23]. Variations in characteristics like capacity, voltage, and internal resistance between cells [
24] can cause different charging and discharging behaviors, resulting in an uneven temperature distribution across the module [
25]. Cells operating at different temperatures undergo distinct aging processes, leading to lower capacity utilization within the module [
2,
13].
To address these challenges, a battery thermal management system (BTMS) is essential for ensuring the longevity and optimal performance of the battery pack. Numerous researchers have focused their efforts on developing and improving thermal management systems for electric vehicle batteries, recognizing the importance of managing temperature to enhance both performance and durability by adopting various cooling strategies. BTMS are primarily classified according to energy usage, thermal management fluid, and the interface between the coolant and the battery casing. The traditional battery cooling methods include air cooling, liquid cooling, and phase-change material (PCM) cooling, each offering distinct advantages for managing battery temperature [
26]. Air cooling, as one of the most conventional methods, has been extensively researched and is widely used in commercial applications [
27]. For instance, the Honda Insight and Toyota Prius hybrid electric vehicles (HEVs) use conditioned cabin air to directly cool the battery pack [
28,
29]. Both natural convection (passive) and forced convection (active) can be employed as cooling techniques. Typically, the heat transfer efficiency of natural convection is much lower compared to forced convection, making natural convection cooling more suitable for low-energy-density batteries. Despite its advantages of simplicity, lightness, and cost-effectiveness, it has seen limited research in recent years. On the other hand, forced air cooling, enhanced by fans or blowers, significantly increases the heat transfer coefficient, which is vital for efficient heat dissipation. However, air cooling has been characterized by low thermal conductivity, leading to an insufficient thermal dissipation in the presence of high loads [
27]. On the other hand, a liquid cooling system offers superior thermal performance and cooling efficiency, making it the most widely commercialized method for battery thermal management. It could be employed both in a direct or indirect manner, depending on the contact between the cooling fluid and the surface of the battery and they can be in single- or two-phase conditions [
30,
31,
32]. Liquid cooling often requires more complex design, including in the systems pumps or/and coolant reservoirs, which contribute to increase weight and space requirements. A variety of heat transfer fluids are used in liquid-based cooling systems, including water, de-ionized water, a mixture of ethylene glycol and water, mineral oil, liquid metal, and nanofluids [
26]. Both air and liquid cooling systems, in the case of forced convection or the presence of a pump, require additional energy consumption, reducing overall system efficiency. In contrast, recent studies have explored the effectiveness of advanced battery thermal management systems, including phase-change materials (PCMs) [
33] and heat pipes [
34].
An optimal BTMS should ensure safe operation [
35] within the limited space of electric vehicles, guarantee adequate chilling by not exceeding the maximum working temperature and uniform temperature distribution, and remain cost-effective. Among the cooling methods mentioned, liquid-based systems in a two-phase state are the most efficient; however, they typically need an external energy source and are not trivial in terms of energy consumption and cost.
A promising solution that combines passive operation with low cost is the use of pulsating heat pipes (PHPs). PHPs fit into the group of passive, dual-phase, capillary-driven devices. PHPs consist of capillary-sized tubes arranged in a meandering channel, partly loaded with fluid. Heat is added to the evaporator and removed at the condenser, causing evaporation and condensation. This creates pressure imbalances, generating forces that drive the oscillation of liquid slugs and vapor bubbles, transferring heat throughout the PHP. Heat is transmitted as latent heat through the vapor plug and sensible heat through the liquid slug. PHPs operate passively without external power and are simpler to construct than traditional heat pipes as they lack wick material [
36,
37]. They can manage high heat loads due to the phase-change phenomenon and the significant sensible heat transfer from continuous pulsations [
38].
For BTMS application, three-dimensional (3D) PHPs are particularly interesting. The term “3D” refers to the complex spatial arrangement of the PHP, which features multiple interconnected loops arranged in three dimensions. This design allows to cover and to cool a larger surface area using a single device, thereby maximizing heat dissipation efficiency and improving the temperature uniformity around the battery pack. The improved thermal regulation provided by 3D PHPs can contribute to enhanced battery performance, increased lifespan, and improved safety under dynamic driving conditions. Additionally, the 3D structure allows for better adaptability to different battery pack geometries, making it a versatile solution for various electric vehicle applications.
Despite extensive research on BTMSs, limited studies have focused on three-dimensional PHP configurations specifically designed for pouch cell batteries. This work addresses this gap by experimentally analyzing a 3D PHP’s performance under realistic operational conditions, evaluating its effectiveness in maintaining temperature uniformity and optimizing thermal resistance.
The proposed BTMS, based on a three-dimensional PHP, was developed for practical use with a 6-cell series battery pack composed of SKI E566 pouch cells, each featuring a nominal voltage of 3.5 V and a capacity of 55.6 Ah. This type of cell and similar configurations are normally used in EVs [
39]. Pouch cells have been chosen since they are emerging as a preferred option due to their potential for creating more compact and lightweight battery packs. Initially, the PHP’s operating parameters were optimized by testing in a test rig the PHP alone, independent from the operation with the batteries. Considered were two different working fluids (R134a and Opteon-SF33), three filling ratio values (30%, 50%, or 80%), six different conditions at the condenser (combining natural and forced air convection with temperatures of 5 °C, 20 °C, and 35 °C), and a broad spectrum of power inputs at the evaporator (ranging from 5 to 200 W).
The PHP was then assessed by employing a power load to replicate the heat produced during three discharge procedures of the battery under consideration. These three discharge curves represented full discharge cycles at a constant operating current with varying C-rate values (specifically, 0.5C, 1C, and 2C).
2. Experimental Setup
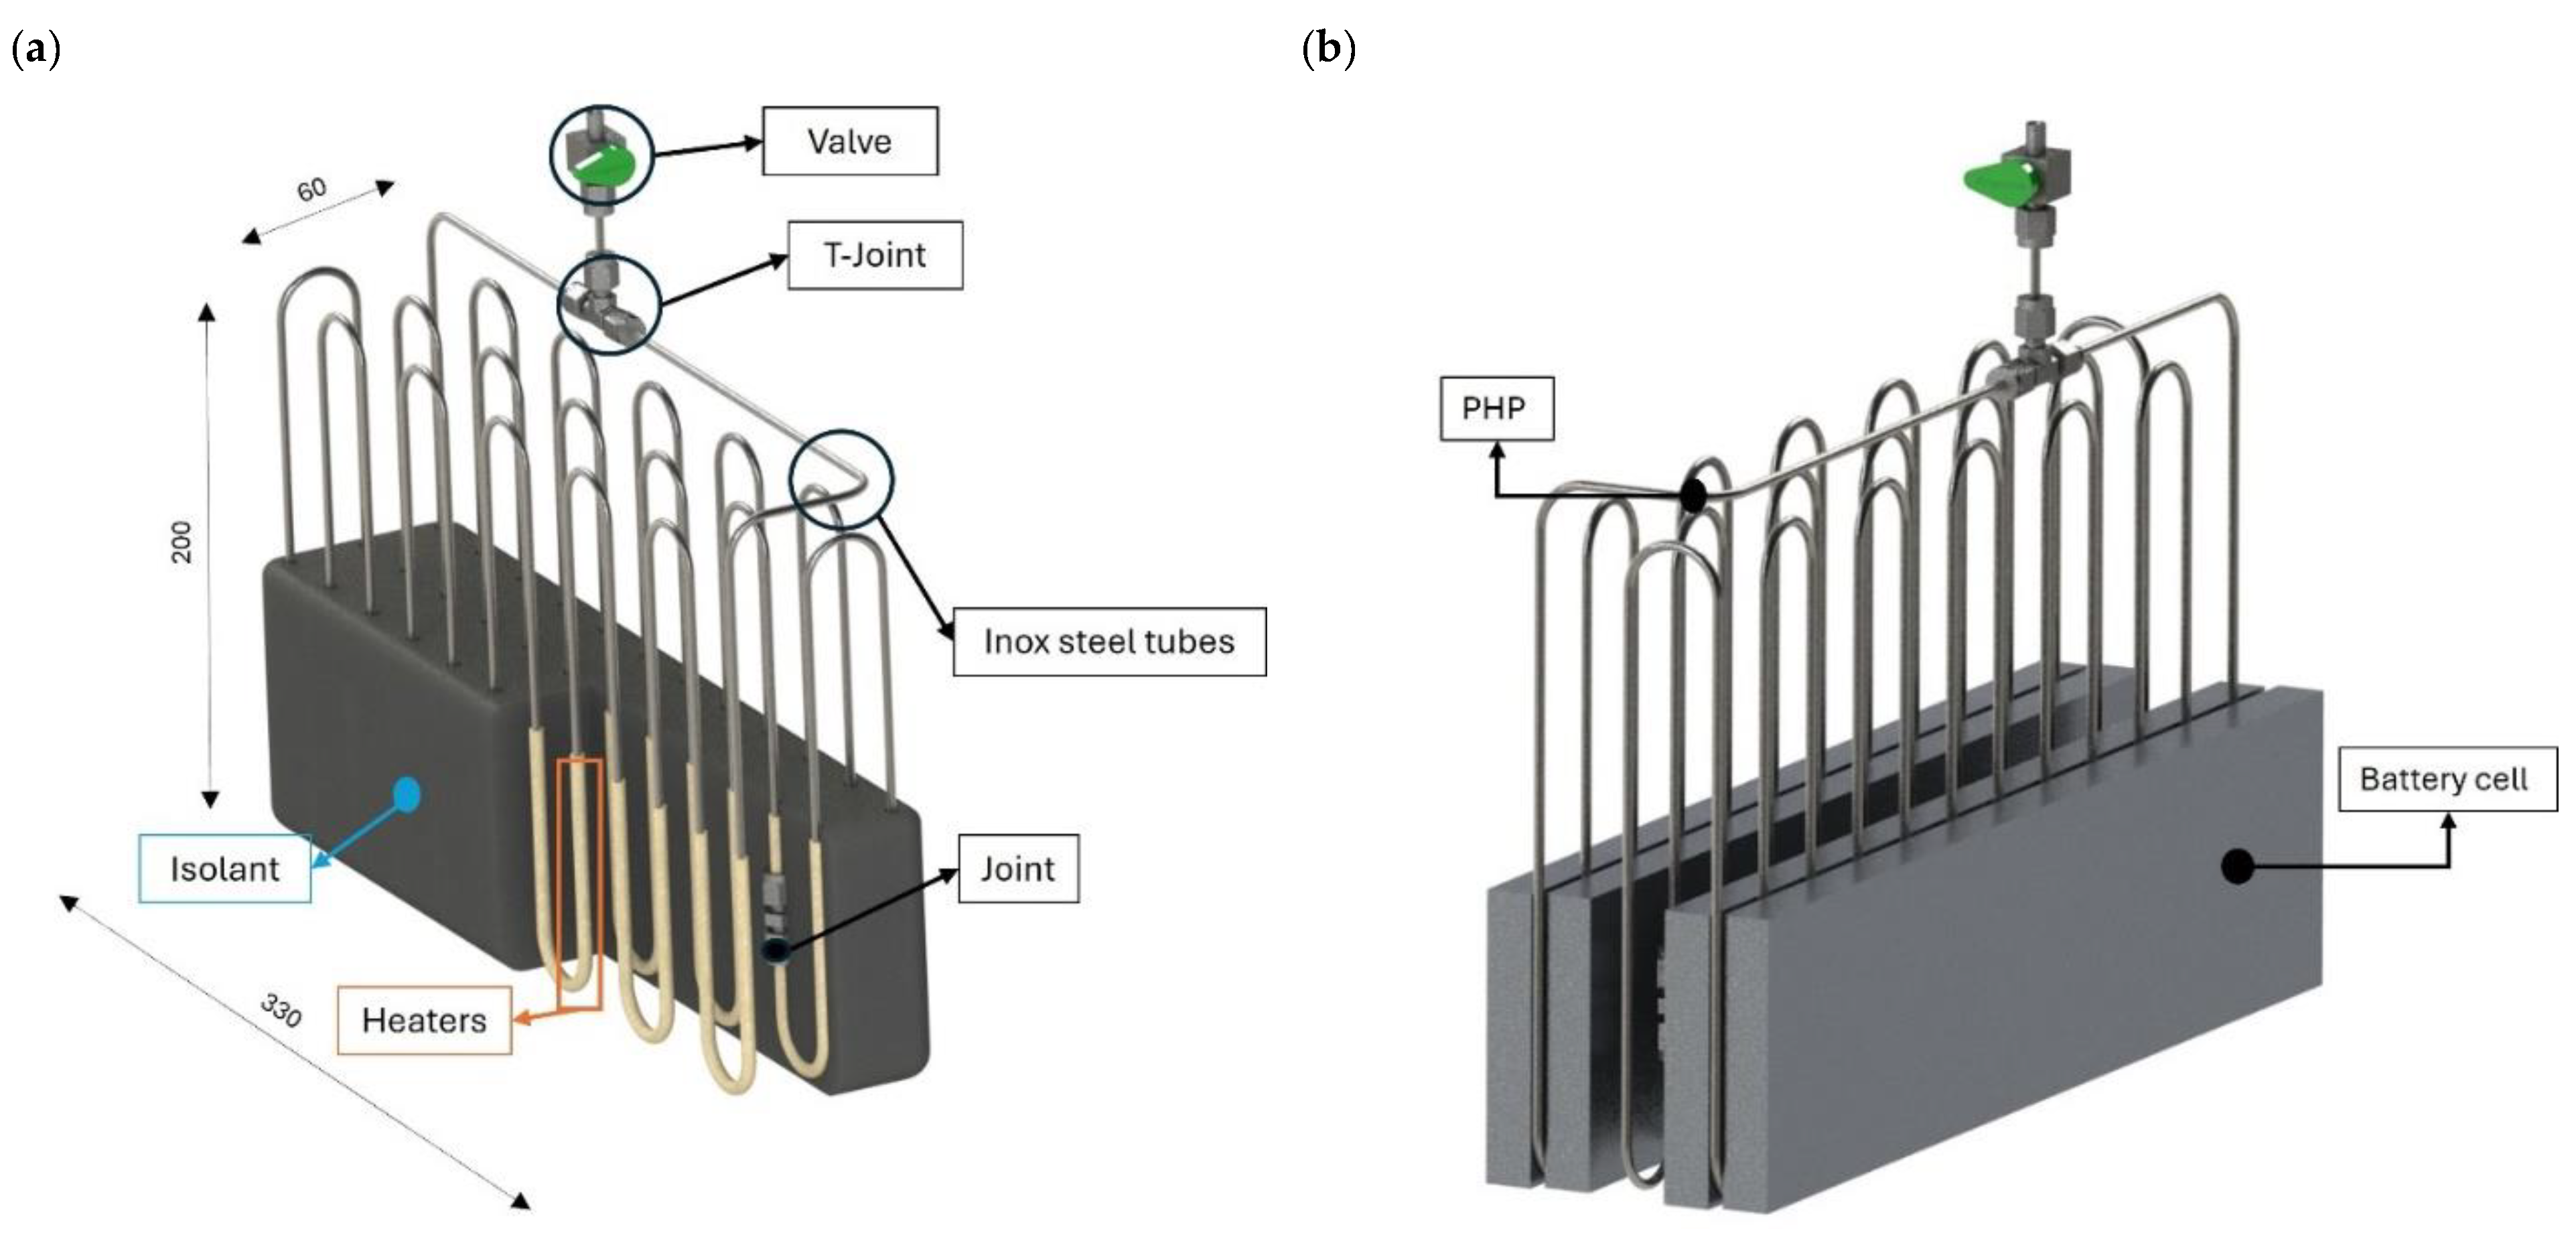
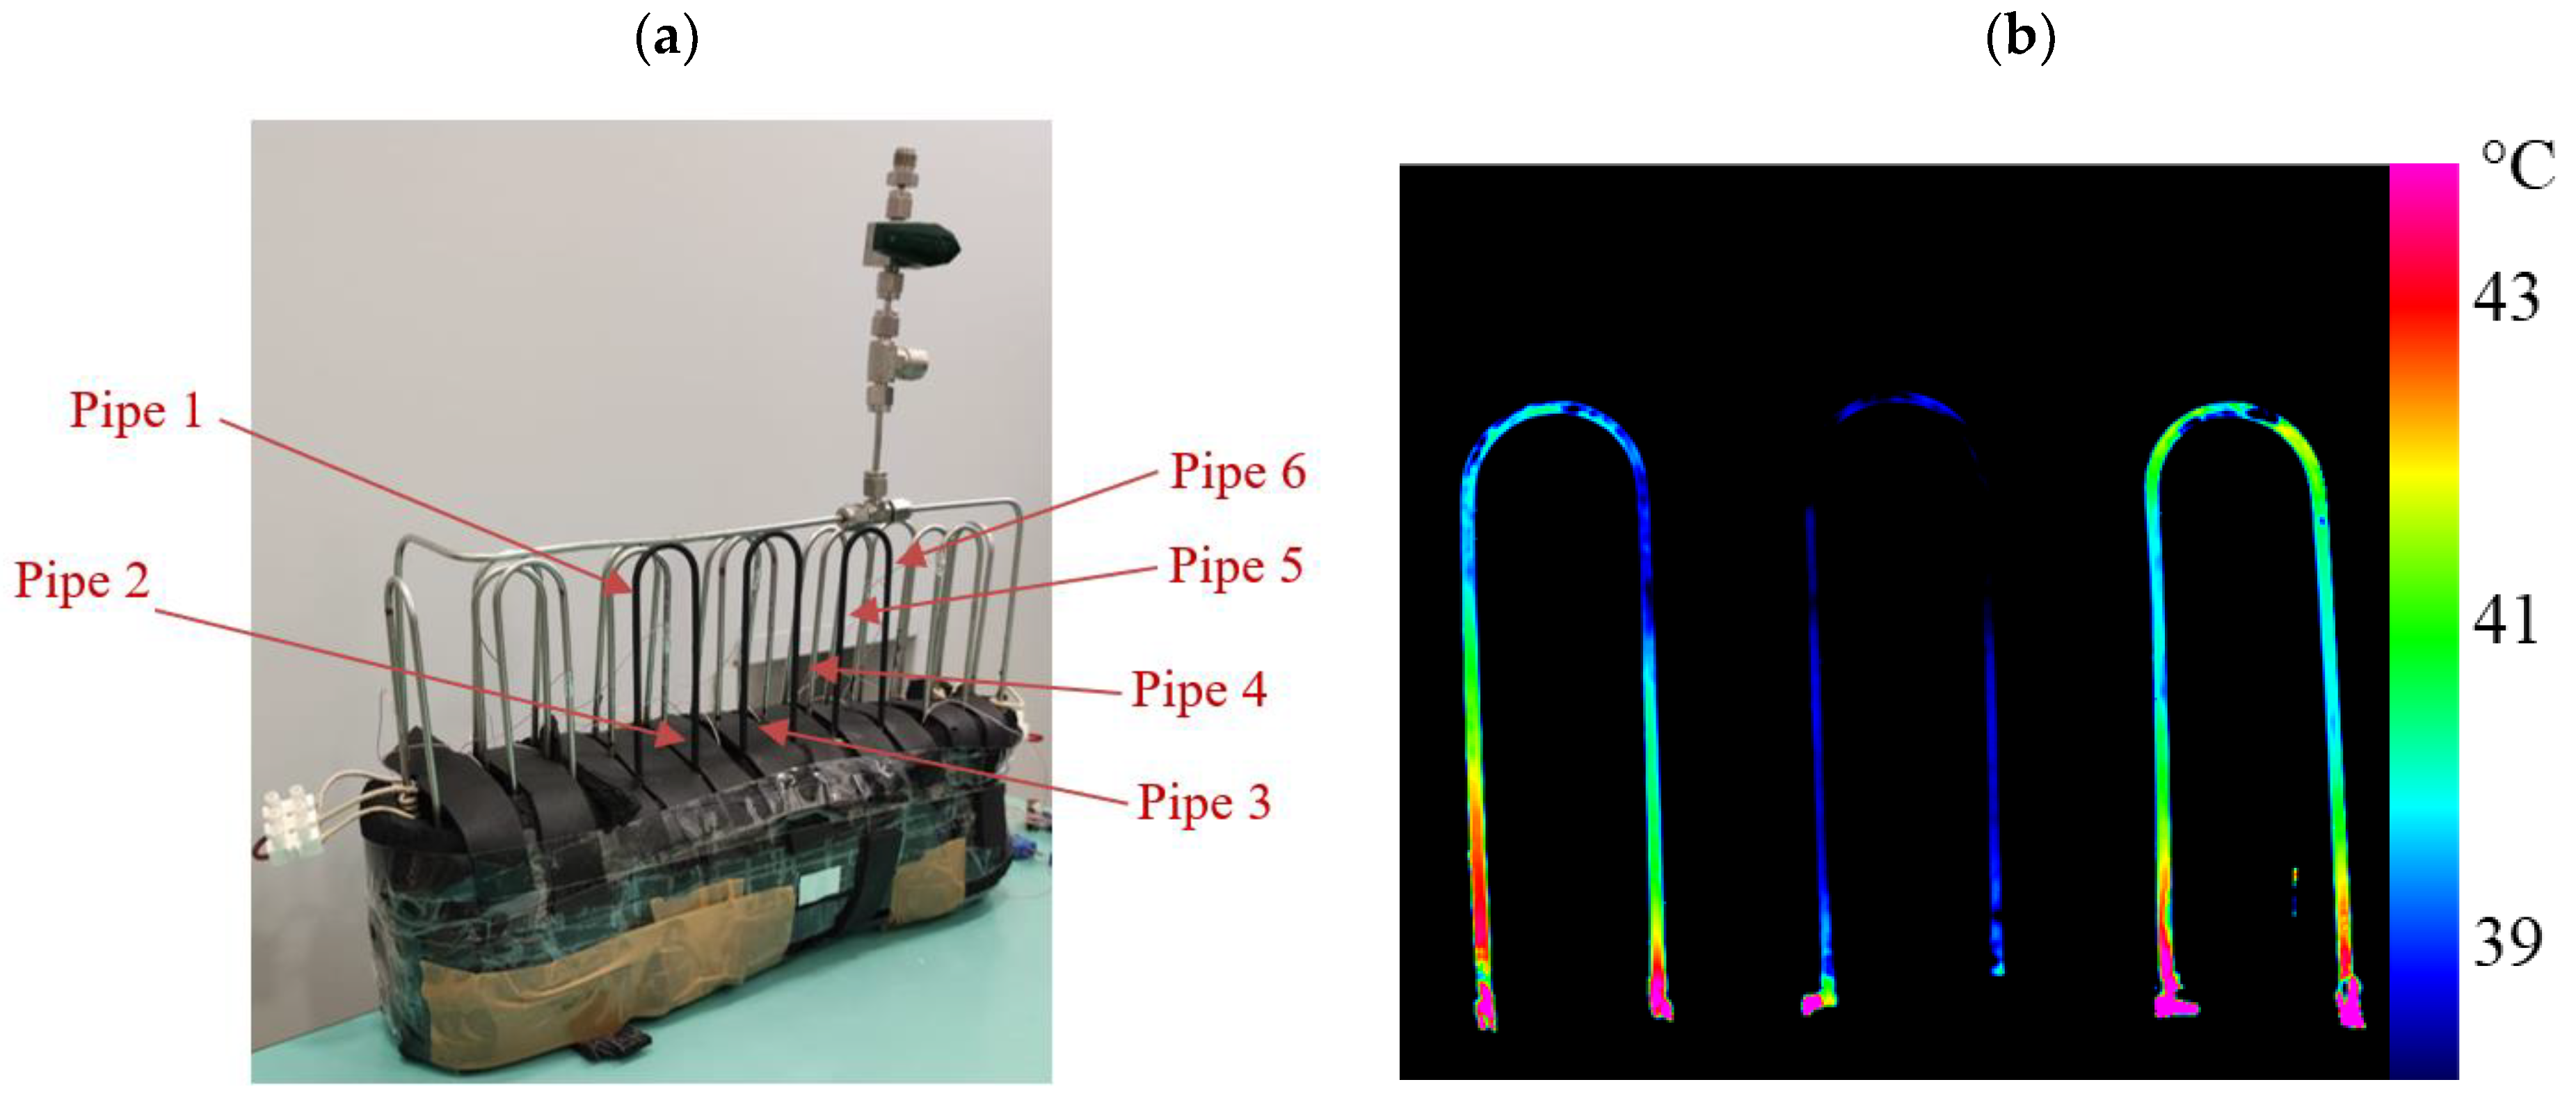
The proposed BTMS was developed for practical integration with a 6-cell series battery pack utilizing SKI E566 pouch cells. Each cell operates at a nominal voltage of 3.5 V with a capacity of 55.6 Ah, a configuration commonly employed in electric vehicle battery systems. The PHP used in this study measures 330 mm in length, 60 mm in width, and 200 mm in height. It consists of three primary sections, an evaporator, a condenser, and an adiabatic section, with respective heights of 9 cm, 9 cm, and 2 cm, as illustrated in
Figure 1a.
As presented in
Figure 1b, the PHP features a 3D arrangement composed of three rows of turns that should fully surround the paired battery cells without obstructing the assembly process. The PHP was assembled by curving a stainless-steel tube, characterized by an inner diameter of 1.76 mm and an external diameter of 3.18 mm, into 11 turns with a bending radius of 15 mm. To prevent deformation—a common issue in small-diameter tubes—a Swagelok
® (Solon, OH, USA) hand tube bender was utilized. The reduced diameter and the arbitrary selection of the curvature radius of the PHP facilitate its integration into a wide variety of cell designs and spatial configurations available on the market. This design flexibility enhances compatibility with different geometries and contributes to improved system integration and overall design efficiency. Stainless steel was chosen due to its affordability, durability, and ease of availability, all of which are essential elements for practical commercial devices. The pipe was vacuum-sealed and partially filled to a specified filling ratio (30%, 50%, or 80%) with either R134a or Opteon-SF33 fluid.
The choice of working fluids is crucial for PHP performance. R134a was selected due to its well-documented thermal performance, favorable thermophysical properties, and widespread use in cooling applications. Opteon-SF33, a newer environmentally friendly refrigerant, was chosen as an alternative due to its lower global warming potential (GWP) while still providing efficient heat transfer characteristics. The comparison between these two fluids allows for evaluating the trade-off between performance and sustainability in PHP applications. The physical properties of R134a and Opteon SF33 are summarized in
Table 1.
The filling ratio (FR) indicates the volume percentage of the PHP firstly occupied by the liquid, calculated at environmental thermal conditions [
40]. The filling ratio (FR) significantly influences PHP functionality. Three filling ratios (30%, 50%, and 80%) were selected to explore different operational behaviors. A low filling ratio (30%) ensures a higher proportion of vapor, which can enhance oscillatory motion but may lead to dry-out conditions. A medium filling ratio (50%) balances liquid and vapor distribution, offering stable operation and improved thermal performance. A high filling ratio (80%) increases the liquid content, which can enhance thermal conductivity but may dampen PHP oscillations, potentially reducing efficiency. Testing across these three ratios provides a comprehensive understanding of their effects on PHP performance under varying conditions.
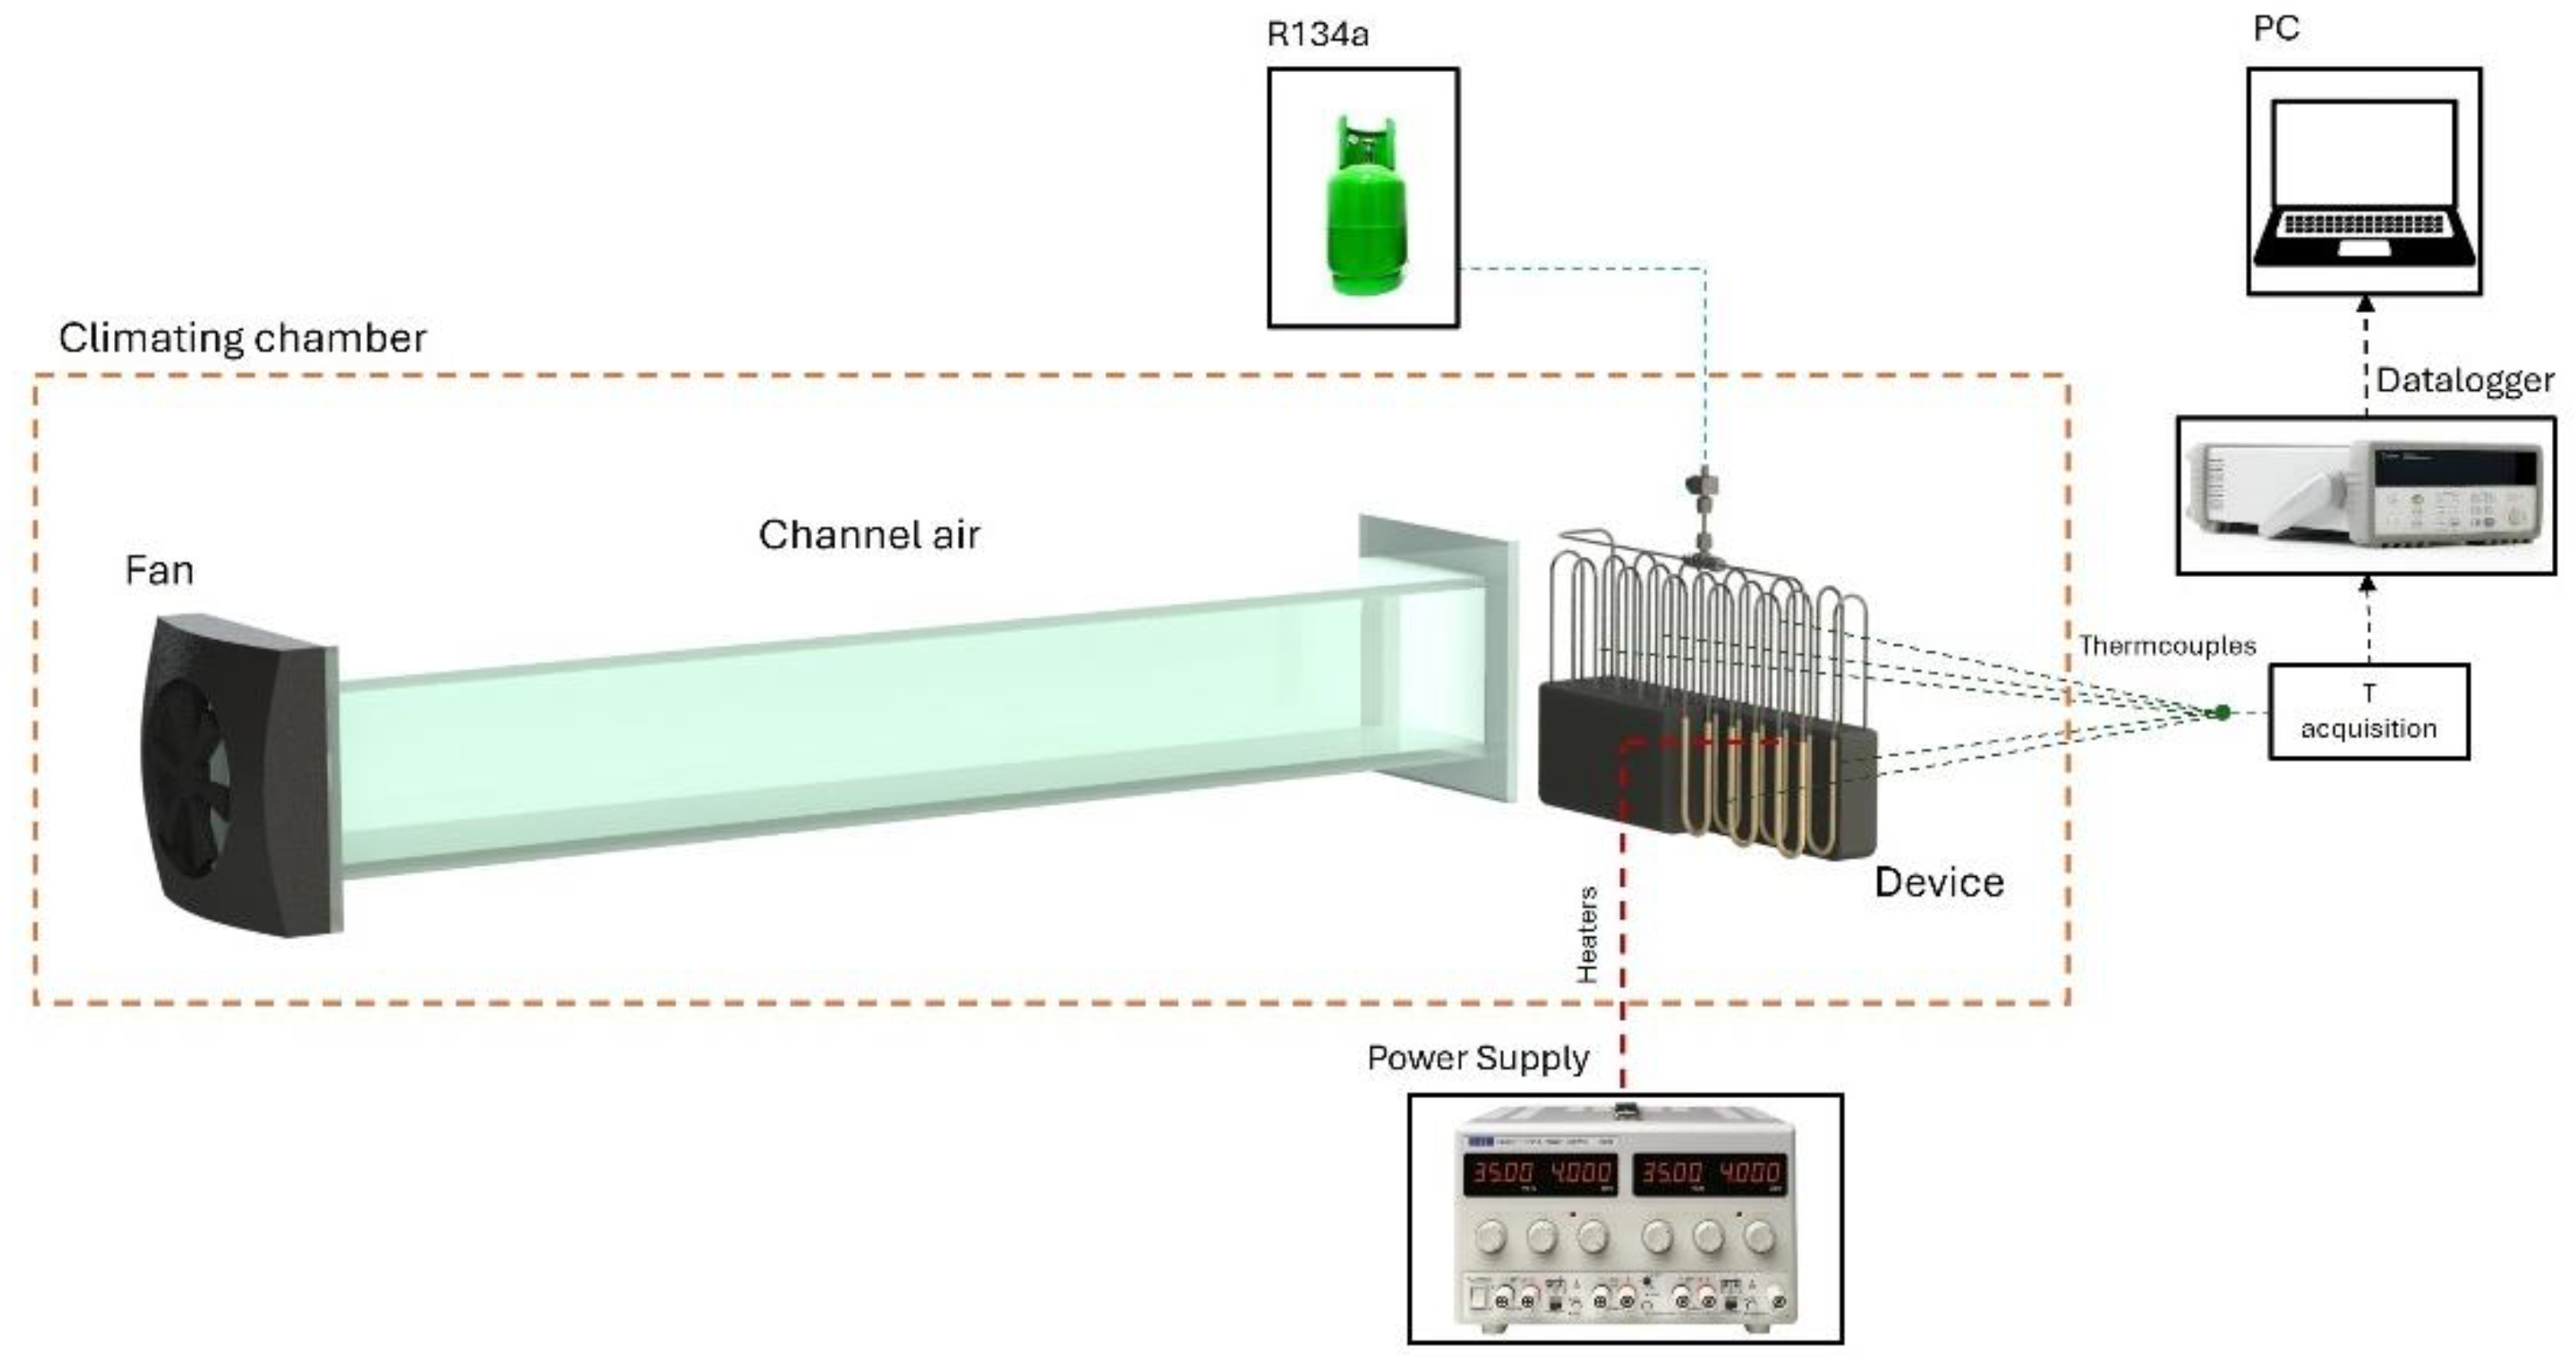
Fluid volume was determined by calculating the density of the liquid at ambient temperature and weighing the PHP before and after filling utilizing a high-accuracy scale (KERN EG 620 3NM). Additional tests were conducted on the empty PHP to analyze its behavior in the absence of a working fluid. Heat input at the evaporator section was applied via Joule heating using a wire resistor wrapped around the tubes and connected to a power supply. Cooling at the condenser section was achieved through natural and forced air convection under environmental temperatures of 5 °C, 20 °C, and 35°C. Forced convection tests were conducted using a wind tunnel, as shown in
Figure 2. The tunnel features a fan at the rear, with air flowing through a rectangular section of a constant cross-section with a length of two meters. Air velocity was set to 6 m/s, a representative speed for an EV in motion, and was measured at multiple locations along the PHP’s 3D structure using an anemometer (TESTO 435). Airflow measurements showed a variance of less than 15%, confirming uniform distribution across the PHP. Environmental temperatures were controlled thanks to two thermal chambers that operate in the temperature range of −20 °C and 0 °C and 10 °C to 35 °C, respectively, and were connected via a crossflow heat exchanger. Temperature measurements were collected via T-type thermocouples: nine at the evaporator, seven at the condenser, and additional sensors at the adiabatic section and in the ambient.
Although the current PHP configuration is optimized for compact EV battery modules, its modular design enables scalability for larger applications. However, integrating multiple PHP modules may introduce spatial constraints that require further optimization. Future research will focus on enhancing the condenser design and exploring additional working fluid options to improve heat dissipation efficiency. In this study, battery thermal behavior was simulated using a wire resistor as described earlier. A schematic of the proposed PHP–battery coupling is presented in
Figure 1b.
Initially, PHP operating parameters were optimized by evaluating two working fluids (R134a and Opteon-SF33), three filling ratios (30%, 50%, 80%), six different condenser conditions (combinations of natural and forced convection at 5 °C, 20 °C, and 35 °C), and power inputs ranging from 5 to 200 W. The optimized PHP was subsequently tested under simulated battery discharge cycles, replicating heat loads for discharge rates of 0.5C, 1C, and 2C. Measurements were acquired using an AGILENT 34970A data acquisition system, ensuring high accuracy with measurement uncertainties of ±0.1 °C for temperature and ±(0.05% full scale) for voltage and current readings.
3. Results and Discussion
Initially, by many tests, PHP’s operating parameters were optimized. Throughout these experiments, a stepped power load was systematically applied to the evaporative section, ranging incrementally from 5 W to 200 W. The heat management behavior of the suggested system was analyzed by calculating the average thermal resistance (
Req), a parameter extensively discussed and defined by multiple researchers in the existing body of literature [
37,
40] and which is as follows:
where
represents the average temperature recorded by the thermocouples positioned at the evaporator, while
corresponds to the average temperature at the condenser. The parameter
denotes the electrical power input delivered to the resistance heater. The temperatures of the evaporator and condenser are calculated by taking the average of the corresponding measured values under steady load conditions over a 300 s interval. Data are collected exclusively after achieving a pseudo-steady state to ensure accurate reading. The uncertainty in the calculated
Req was assessed using the error propagation method as outlined in [
41]. This analysis determined that the highest inaccuracy in the
Req measurements was ±10%.
This performance evaluation was conducted using two distinct working fluids, R134a and Opteon-SF33, under a variety of operating conditions. Specifically, the tests examined three different filling ratios (30%, 50%, and 80%) and six condenser scenarios. These scenarios combined natural and forced air convection with environmental temperatures of 5 °C, 20 °C, and 35 °C. In cases involving forced air convection, the airflow velocity was maintained at 6 m/s, simulating conditions typical for a vehicle in motion on a roadway.
3.1. Optimization Tests with R134a
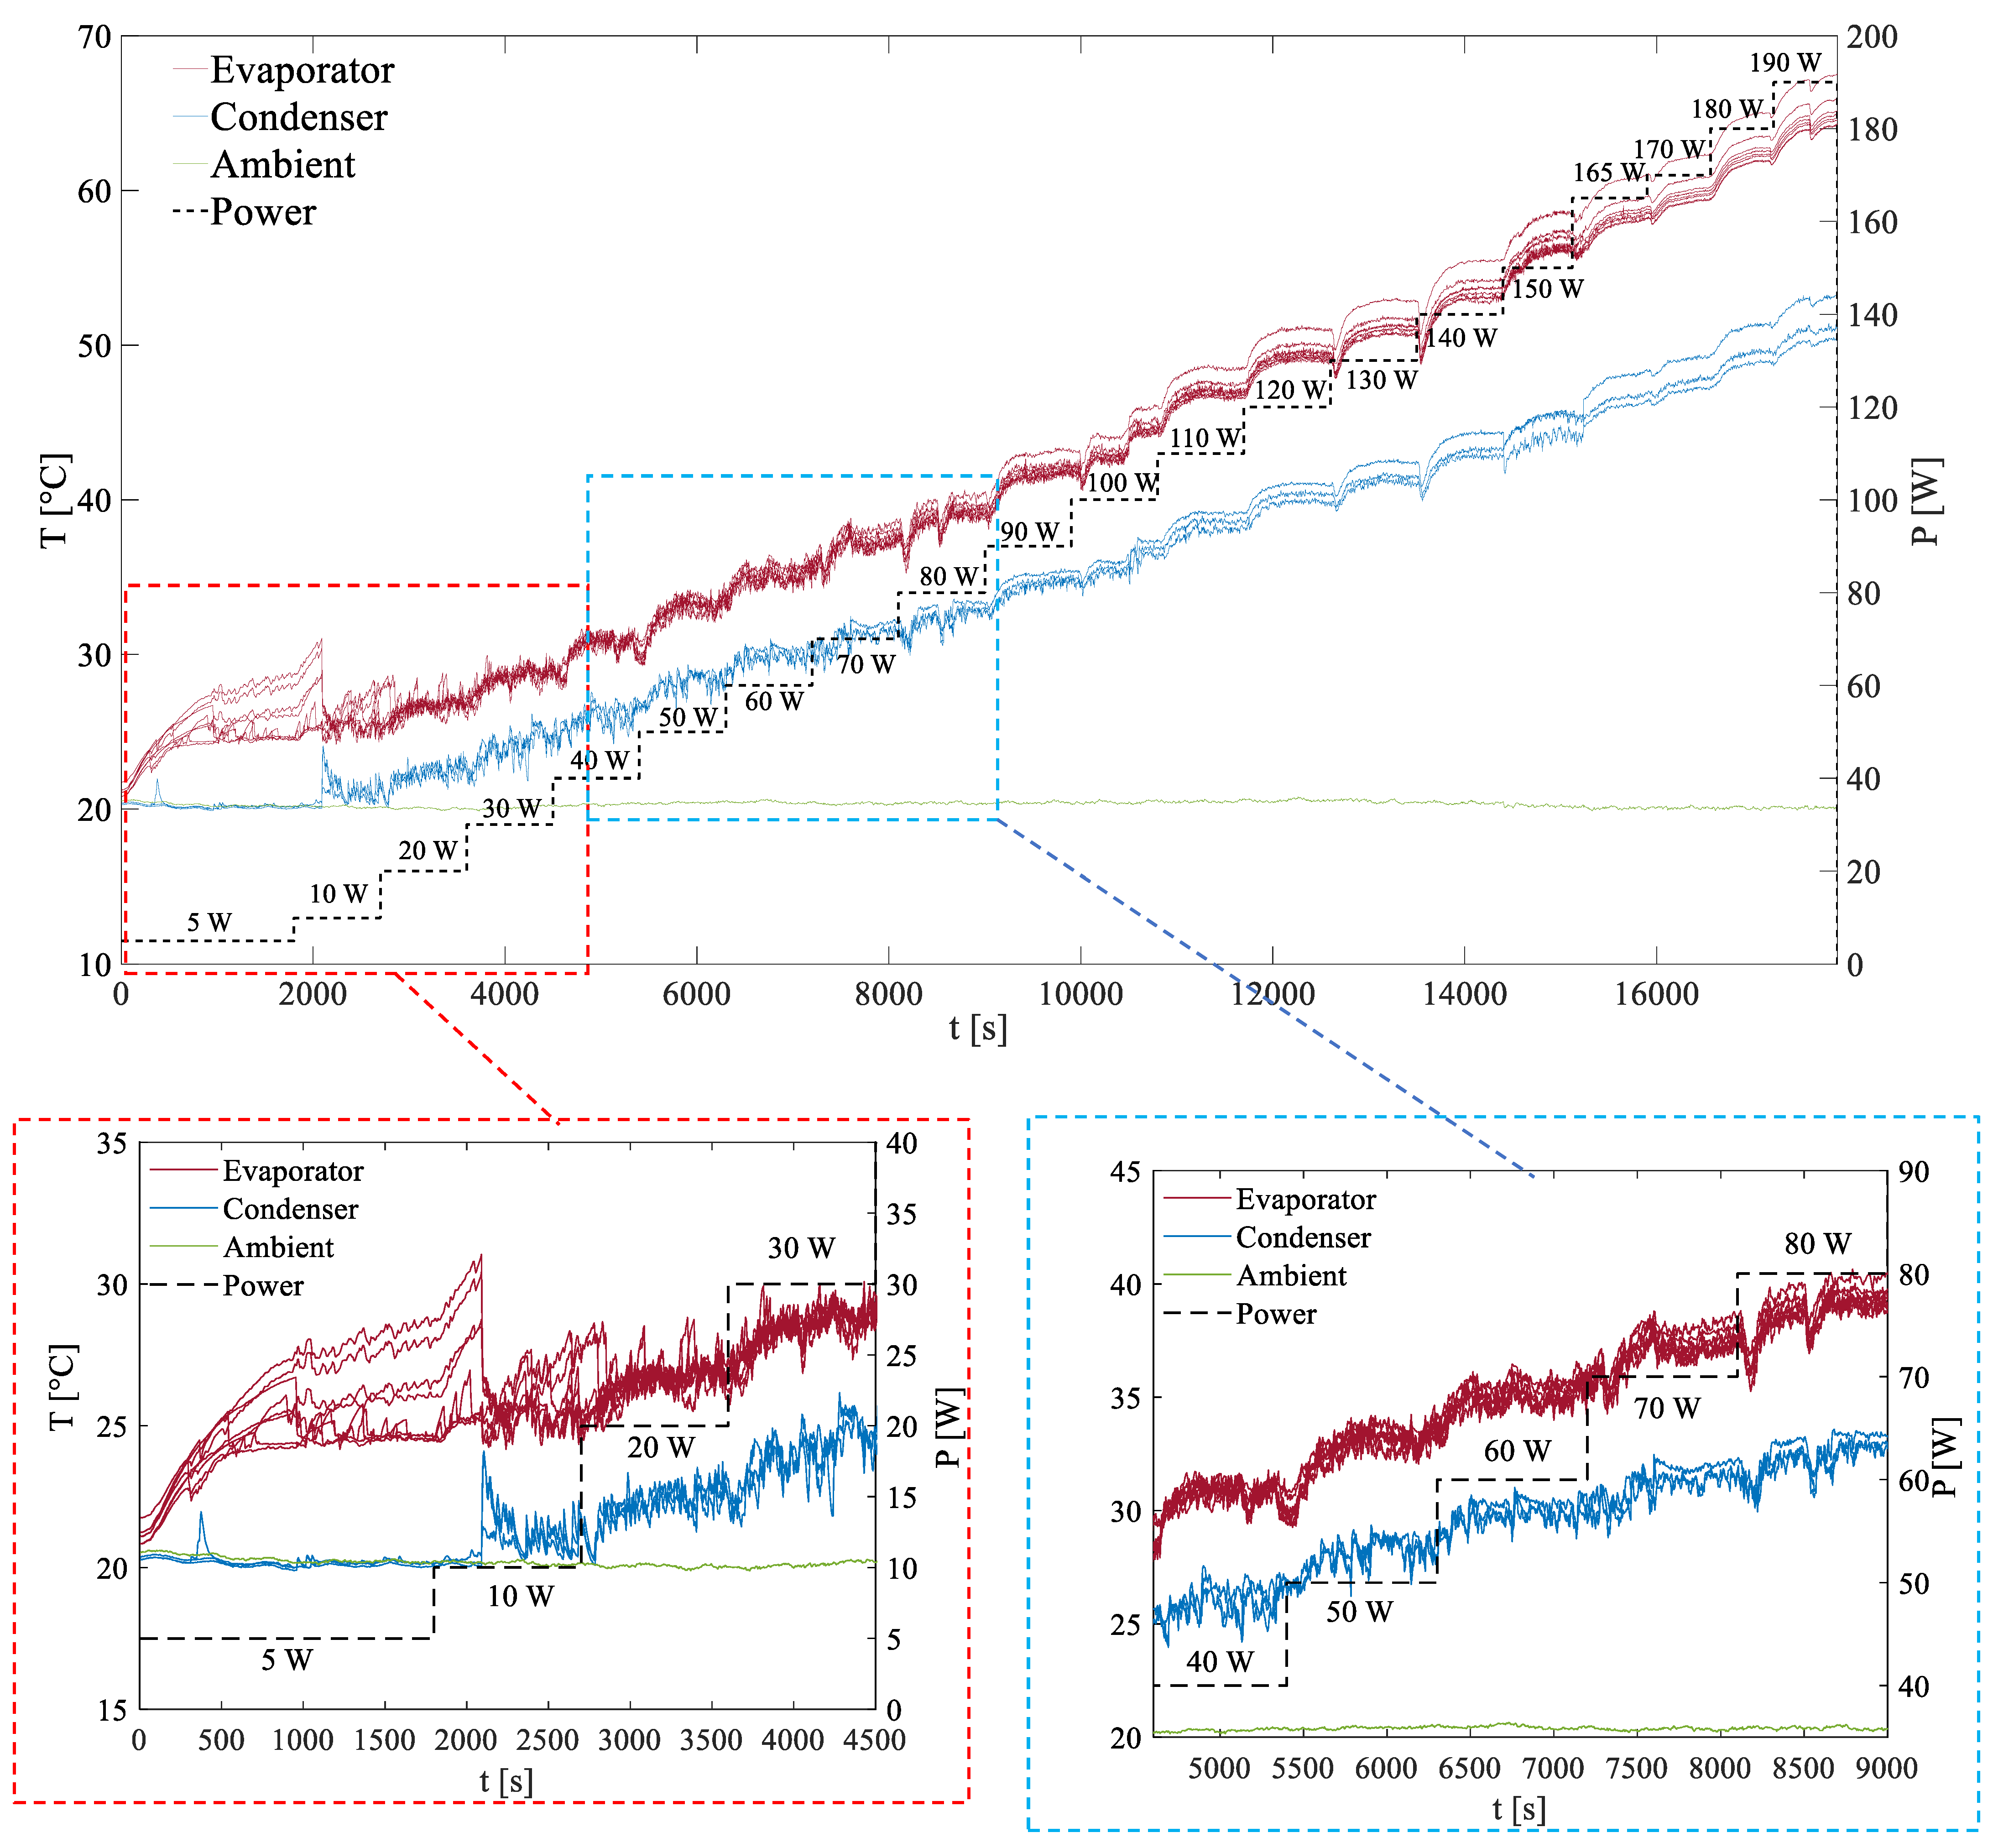
Figure 3 depicts the time-dependent temperature profiles measured by all thermocouples during the experiments. These data correspond to an input power range of 5–190 W, using R134a as the working fluid with a 50% filling ratio. The system was cooled by forced air convection, maintaining an ambient temperature of 20 °C.
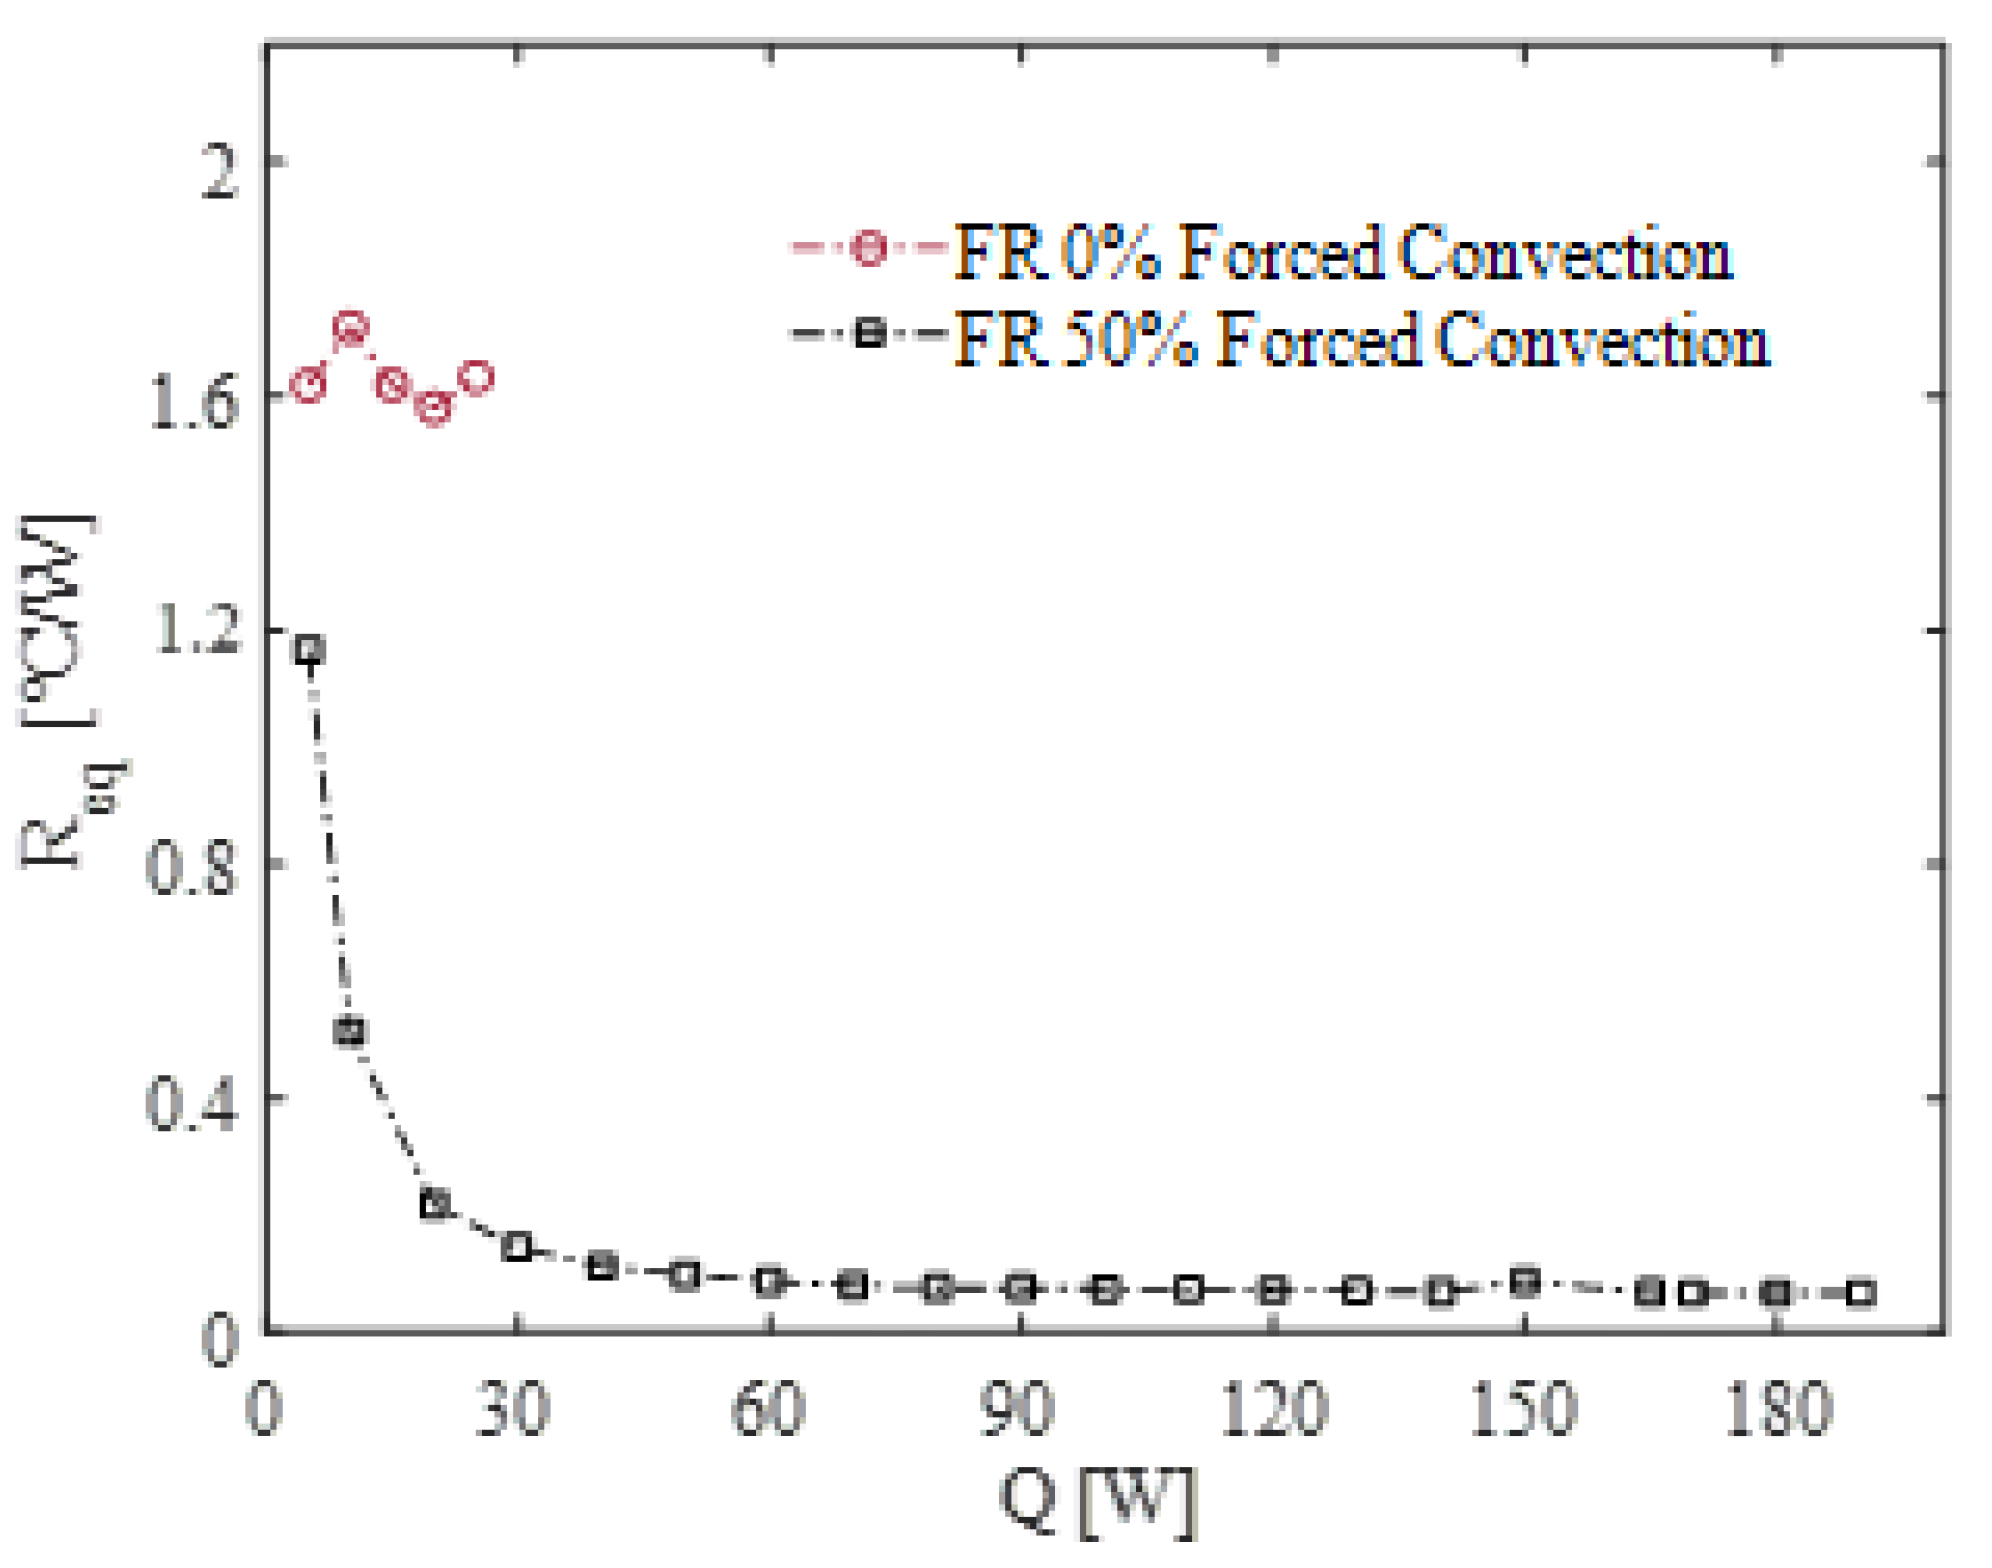
Figure 4 presents the
Req vs. heating input for the same case, alongside the results for the empty device cooled by forced air convection at 20 °C.
When empty, the device functions solely as a conductive medium, with
Req remaining nearly constant (~1.6 °C/W) regardless of the heat input. In contrast, when it is filled with fluid, five different operation modes can typically be classified inside PHPs: pure conduction, startup, intermittent flow, full activation, and dry-out [
42]. Prior to the startup phase, raising the power load results in an increase in the evaporator temperature. However, noticeable fluctuations are absent at both the evaporator and condenser locations. The pressure in the condenser remains steady, matching the saturation pressure associated with the corresponding saturation temperature. This suggests that the system has yet to activate its oscillatory or dynamic heat transfer mechanisms, with heat transfer predominantly governed by conduction and static latent heat processes [
42]. Instead, startup occurs when temperature oscillations are recognizable in at least one channel. From
Figure 3, the initiation of oscillations, where at least one branch of the PHP becomes active, appears to happen quite early within the input power range of 10 to 20 W. At this stage, noticeable oscillations begin to manifest in the temperature profiles. Once startup occurs, the temperatures at the evaporator become unstable, exhibiting intermittent pauses accompanied by rapid spikes and pronounced oscillations.
These fluctuations indicate the onset of dynamic heat transfer processes, reflecting the active behavior of the system as it transitions to oscillatory flow or other operational modes. Shortly after applying 10 W of input power, the condenser temperatures rapidly approach those of the evaporator, signaling a marked improvement in the heat transfer capability of the system. This is further corroborated by the abrupt reduction in average thermal resistance observed at the same power levels, as also depicted in
Figure 4. The vertical orientation, with the evaporator positioned at the bottom, undoubtedly facilitates the onset of this startup condition by leveraging gravitational effects to enhance fluid motion. Once pulsations become established and fluid inertia begins to play a significant role, the PHP exhibits outstanding thermal performance. In fact, within the input power range of 40–190 W, the full-activation operation mode is reached, and the thermal resistance of the PHP decreases by a remarkable factor of 20 compared to the empty device, demonstrating the system’s exceptional efficiency under these conditions. A similar behavior was also observed for the case of natural convection cooling at the same ambient temperature, as can be observed in
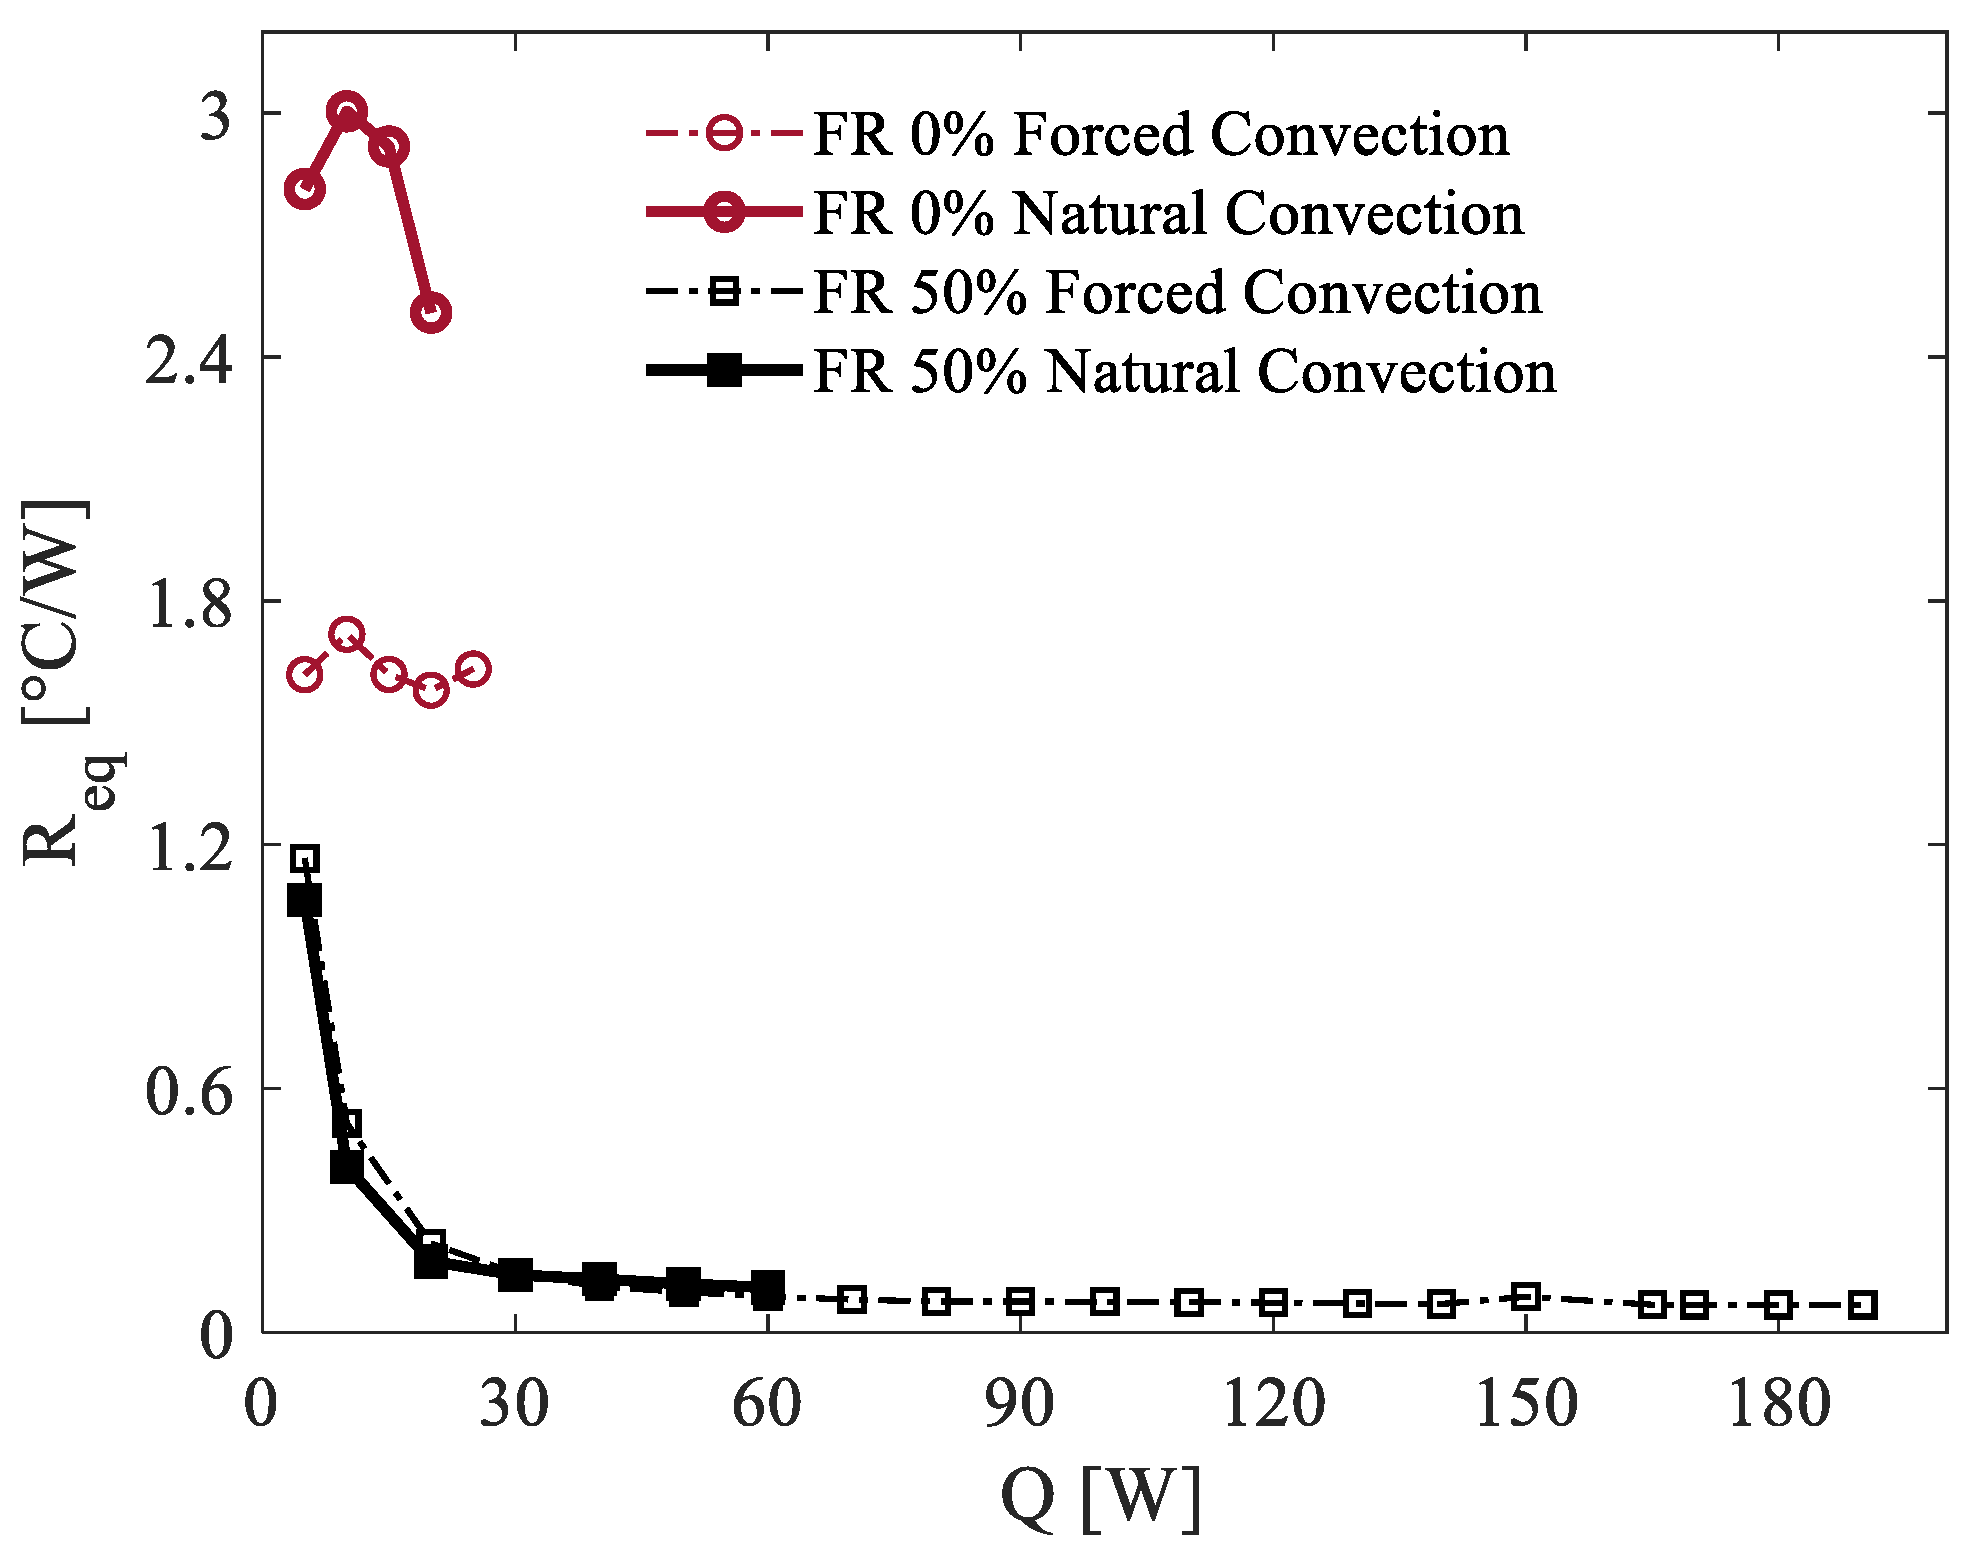
Figure 5. Thermal resistance values for FR = 50% were consistently measured within the range of 5–60 W. However, the highest tested value, 60 W, represented the upper operational limit of this configuration. At this point, certain areas within the evaporation section began to approach critical temperature thresholds, posing a significant risk of transitioning into a dry-out condition. Such a condition could lead to rapid degradation of the device’s performance and reliability.
The observed performance differences between the two configurations can be primarily attributed to variations in the heat transfer coefficient among the condenser section and the surrounding environment. In the case of natural convection, this coefficient becomes the primary thermal bottleneck of the system. As a result, the condenser temperature progressively increases to ensure the dissipation of the applied heat load. This limitation underscores the challenges associated with natural convection in managing higher heat loads and maintaining stable operation within safe temperature limits. The thermal resistance is also higher for FR = 0% where the performance is even more penalized. The same experiments were repeated using two additional filling ratios (FRs), namely 30% and 80%, to cover a broader range of FR values that ensure the device’s operation as a true pulsating heat pipe [
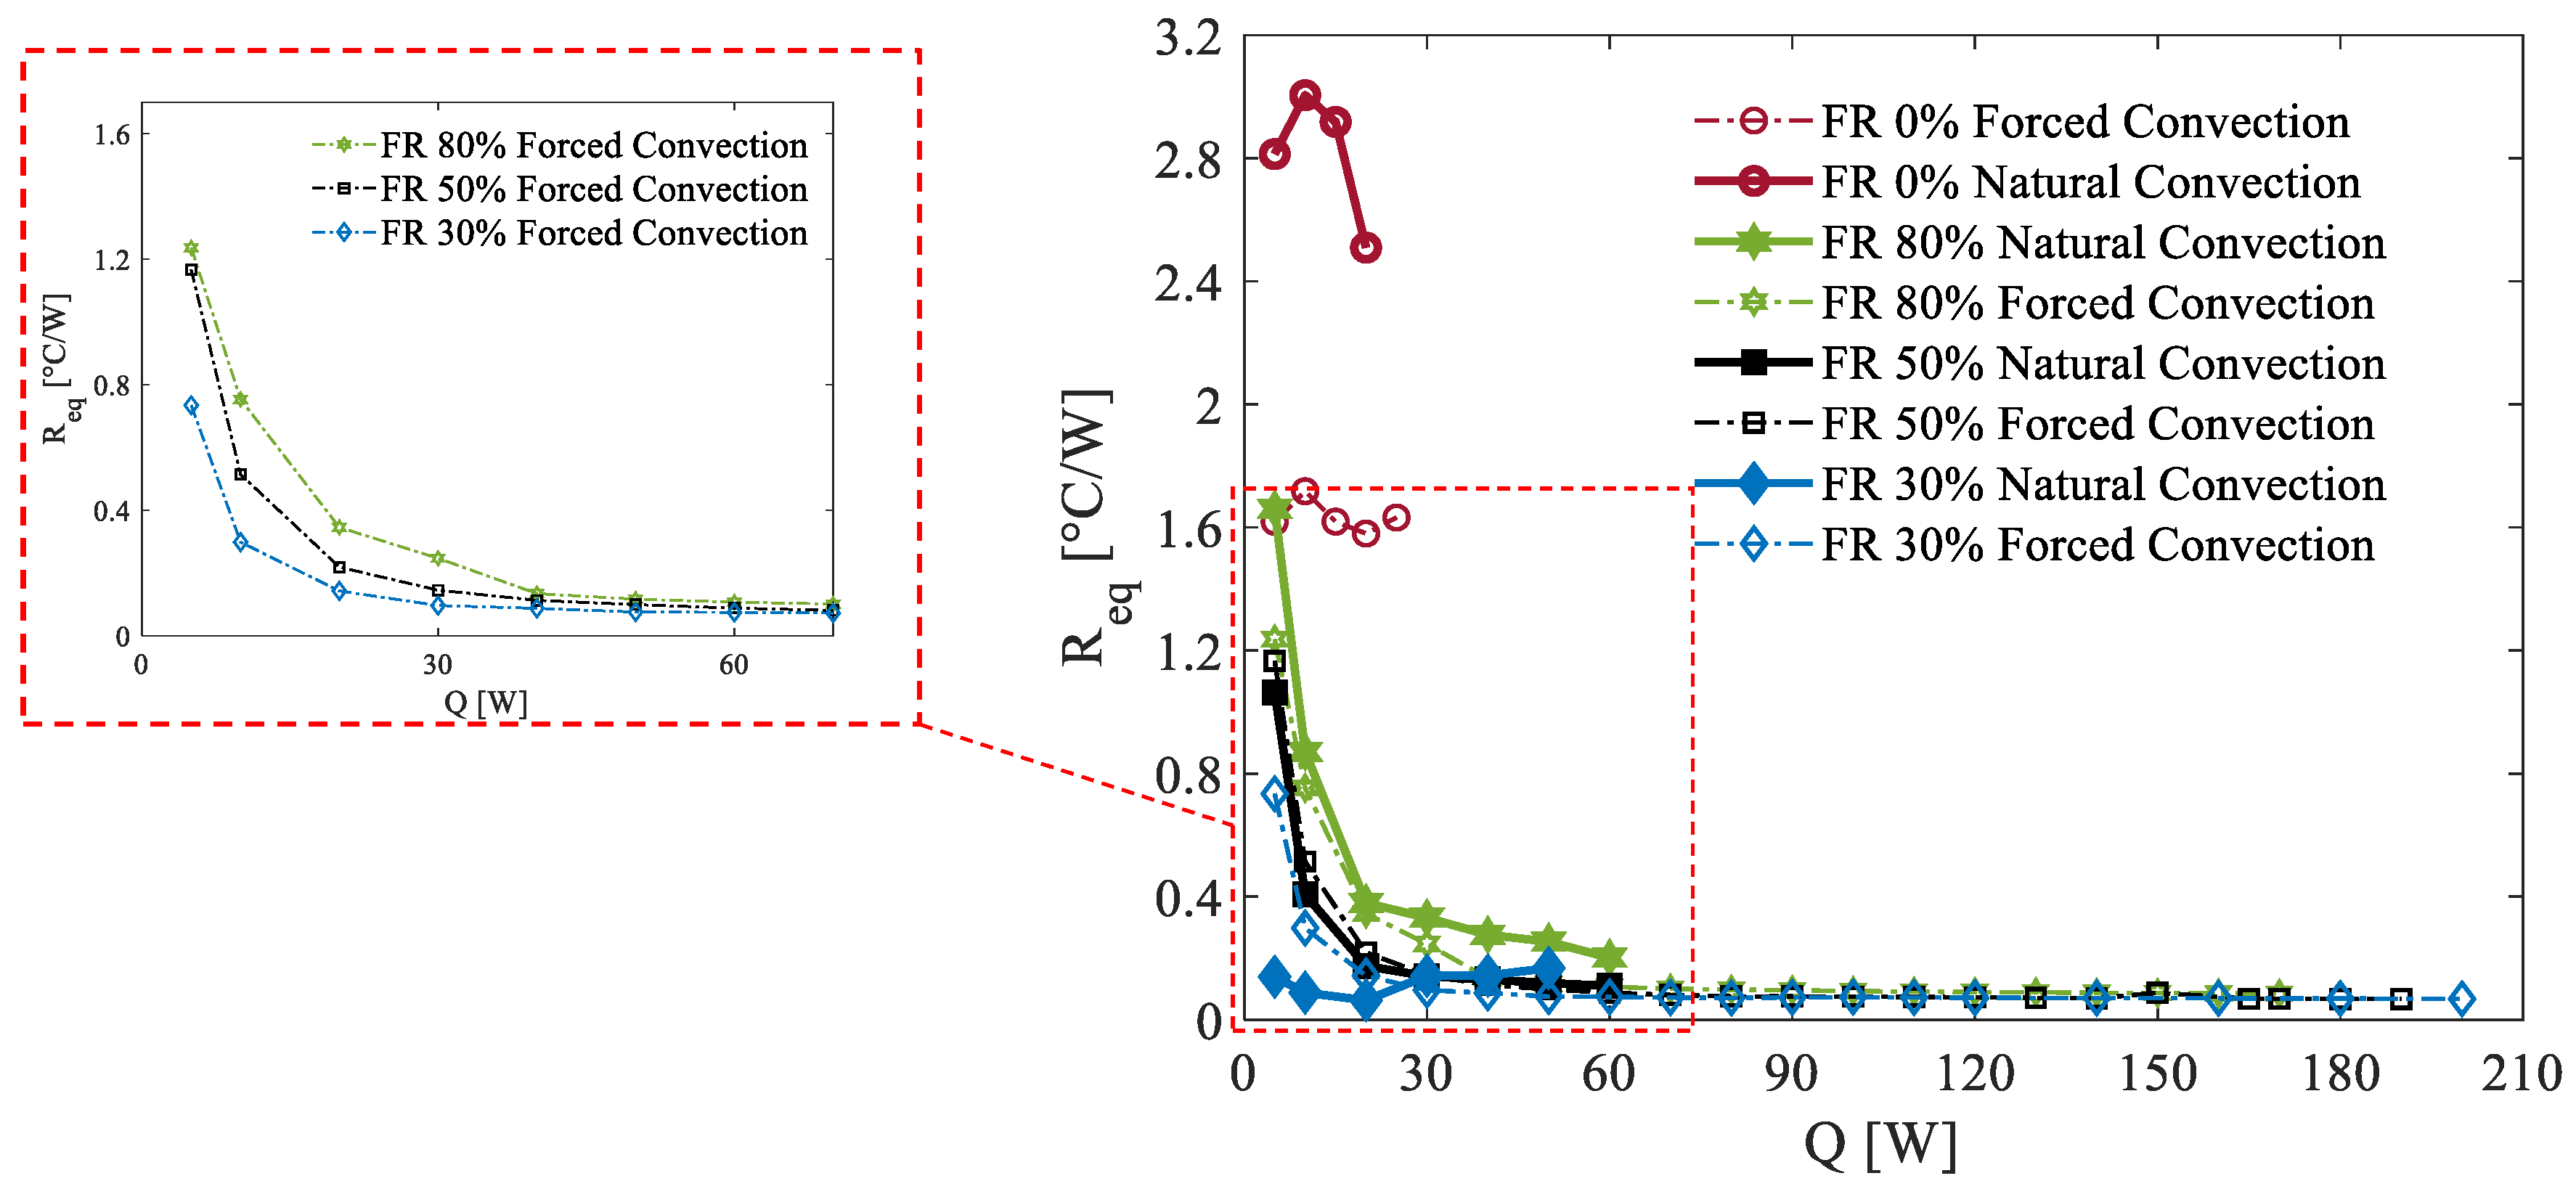
40]. The thermal resistance values computed for all of the investigated filling ratios are presented in
Figure 6. These results were obtained under ambient conditions of 20 °C, considering both natural convection and forced air convection cooling at the condenser section. This approach provides a comprehensive analysis of the thermal performance across different FR levels and cooling configurations, highlighting their impact on the PHP’s efficiency and stability.
For all the examined filling ratios, the performance under forced convection was consistently better than under natural convection, as expected. In the forced convection scenario, the thermal resistance for the three different FR values showed minimal variations, which can be attributed to differences in the startup behavior due to the varying quantities of liquid. During startup, the thermal energy supplied to the heated zone causes the liquid phase to vaporize, initiating a thermodynamic transition in the PHP system. This transition drives the system toward an equilibrium state characterized by higher pressure, elevated temperature, and increased vapor quality. The rate of this transition is notably faster at lower filling ratios [
42].
This behavior is clearly illustrated in the zoomed view of
Figure 6. For an FR of 30%, at low power input levels, the thermal resistance exhibits lower values. Additionally, the system achieves the flat trend associated with the fully oscillatory mode more quickly, typically before the 50% FR case. In contrast, for an FR of 80%, the transition to this state is slower, resulting in higher
Req values for comparable power inputs. A similar trend is observed under natural convection, albeit with more pronounced characteristics.
Then, to fully investigate the potential of the proposed device, it becomes essential to investigate its operational limitations. On the one hand, low environmental temperatures can hinder the activation of the PHP’s oscillating mode due to the increased viscosity of the working fluid. On the other hand, high environmental temperatures pose a challenge as the device relies on ambient air for cooling. Thanks to the thermal chambers described in
Section 2, it has been possible to simulate environmental conditions of
Tenv = 5 °C and
Tenv = 35 °C. In
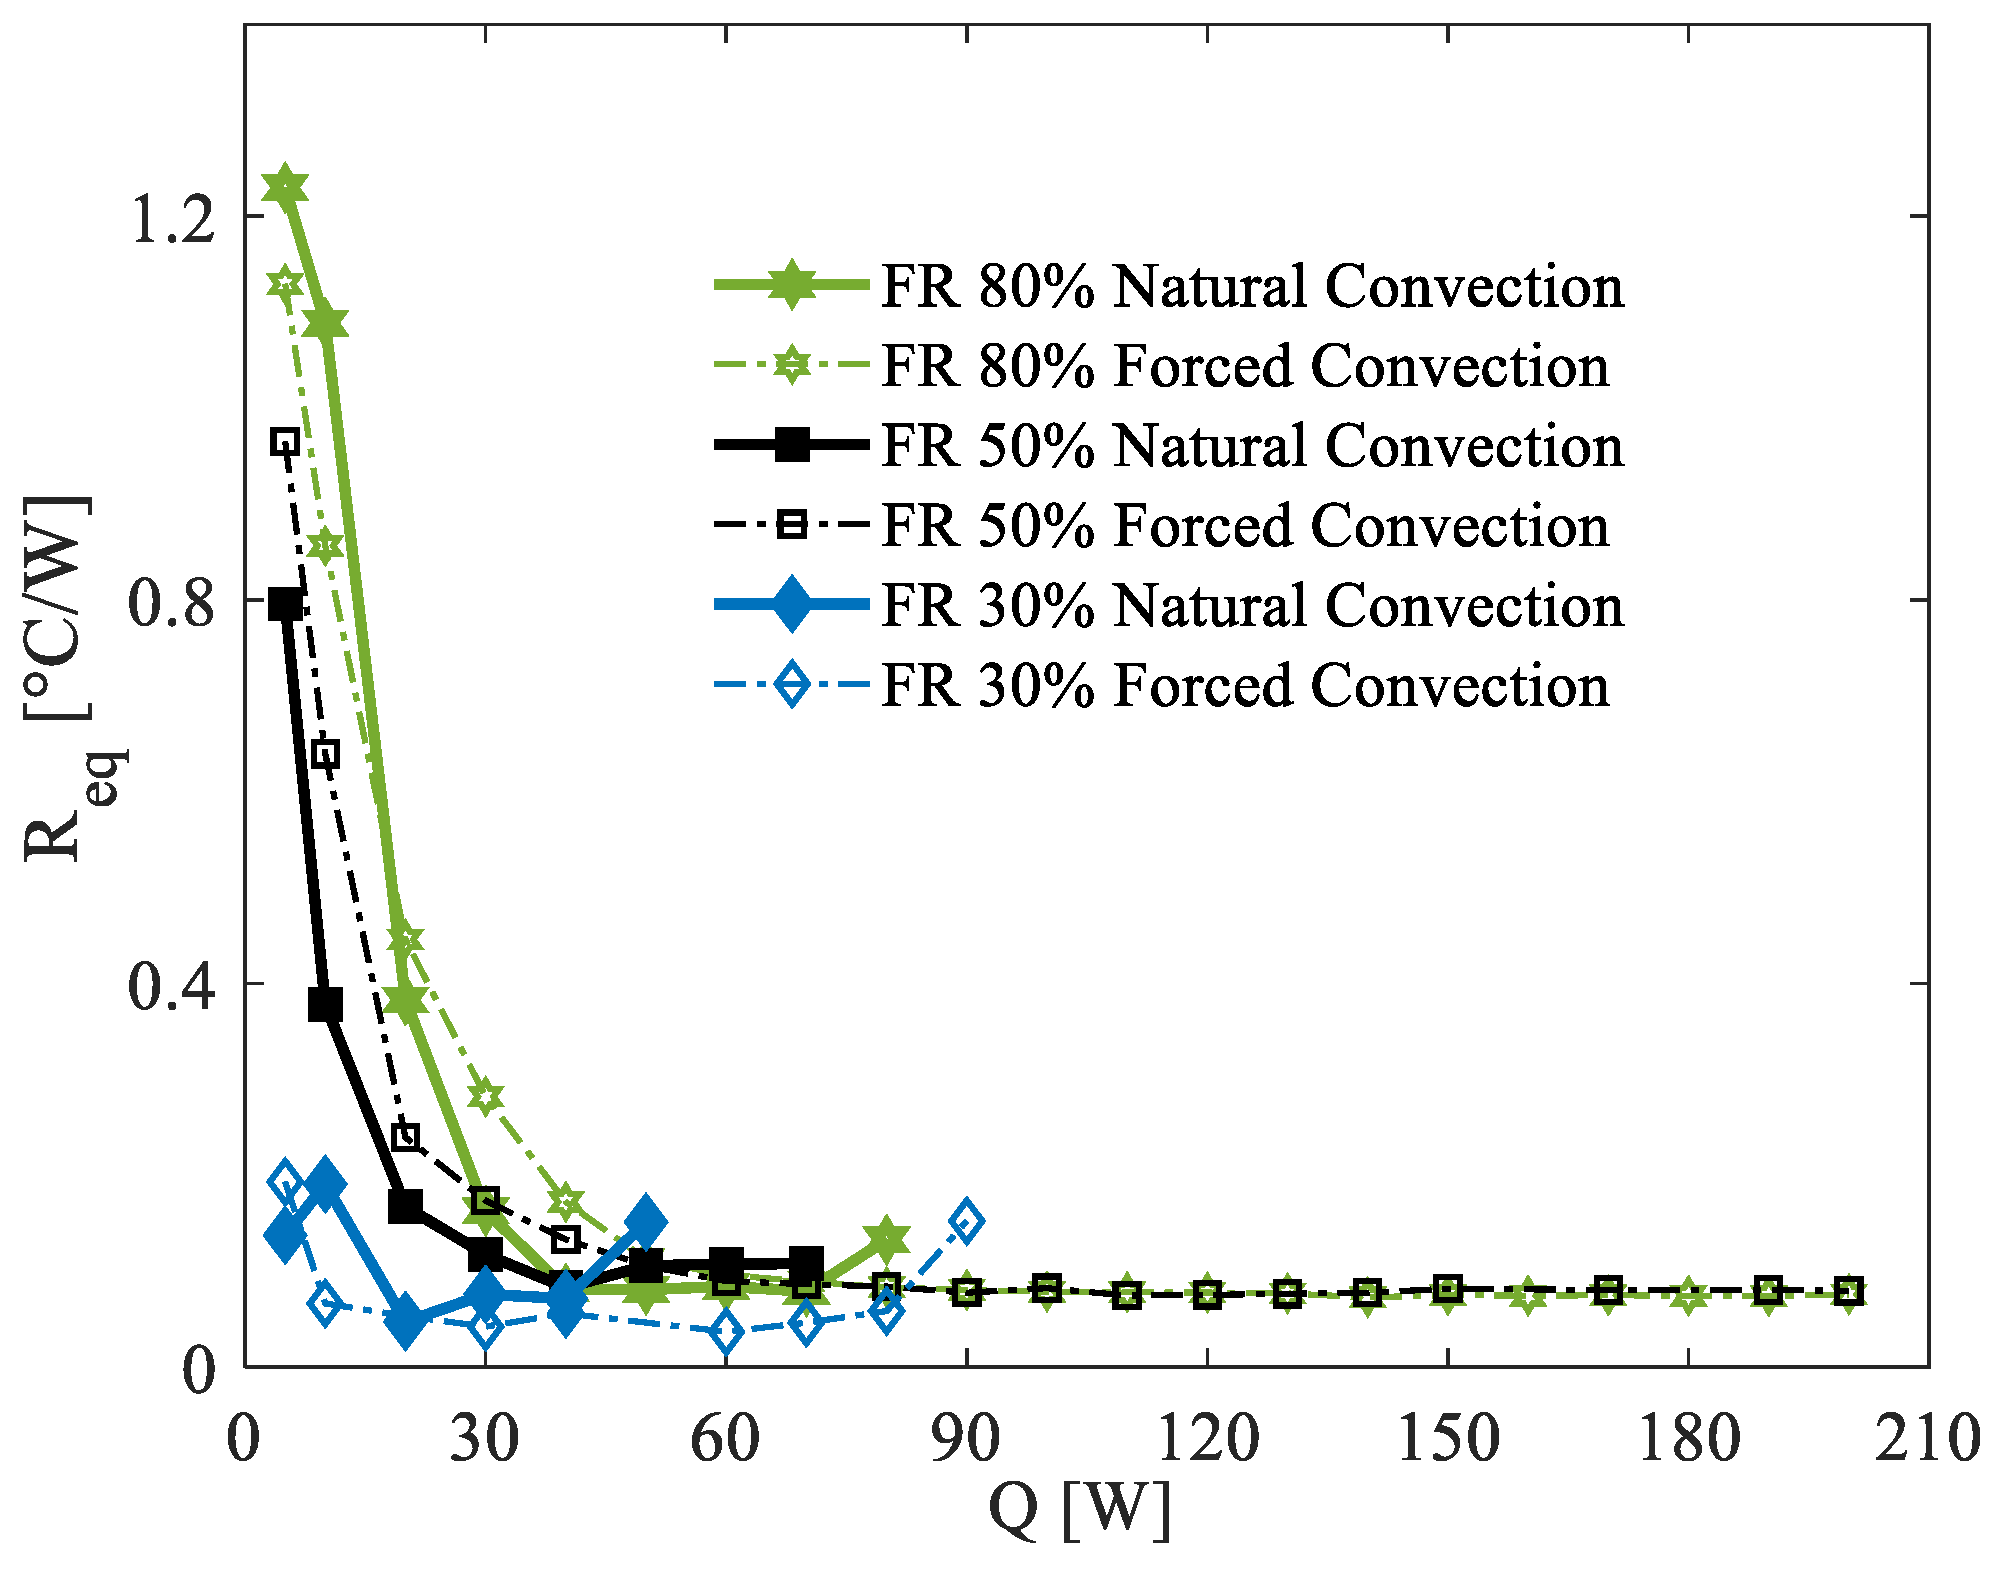
Figure 7, the thermal resistance is reported for both forced and natural convection at 5°C across all considered filling ratios (FRs: 30%, 50%, and 80%) as a function of the power load applied to the evaporation section. Like the observations at an ambient temperature of 20 °C, the 30% FR demonstrates the fastest startup process, while the 80% FR exhibits the slowest.
Under forced convection, the 30% FR also shows the best performance in terms of thermal resistance. However, unlike the previous case, the 30% FR configuration appears to reach its operational limit at power loads around 90 W. This behavior is likely due to the increased viscosity of the fluid at 5 °C, which restricts its mobility compared to the 20 °C scenario. As a result, the liquid tends to accumulate in specific branches, making it difficult to evenly distribute across all tubes. This leads to localized dry-out conditions in some tubes, resulting in significant temperature spikes. This phenomenon was observed repeatedly during testing, with the dry-out condition occurring in different tubes during each iteration. In contrast, the 50% and 80% FRs, which promote a more uniform liquid distribution among the branches, do not exhibit such issues. These configurations allow for experimental testing up to 200 W without exceeding critical temperature thresholds. Finally, even at an ambient temperature of 5 °C, the challenges associated with natural convection in managing higher heat loads and maintaining stable operation within safe temperature limits are evident. Lower thermal performance is observed under these conditions.
Similarly to
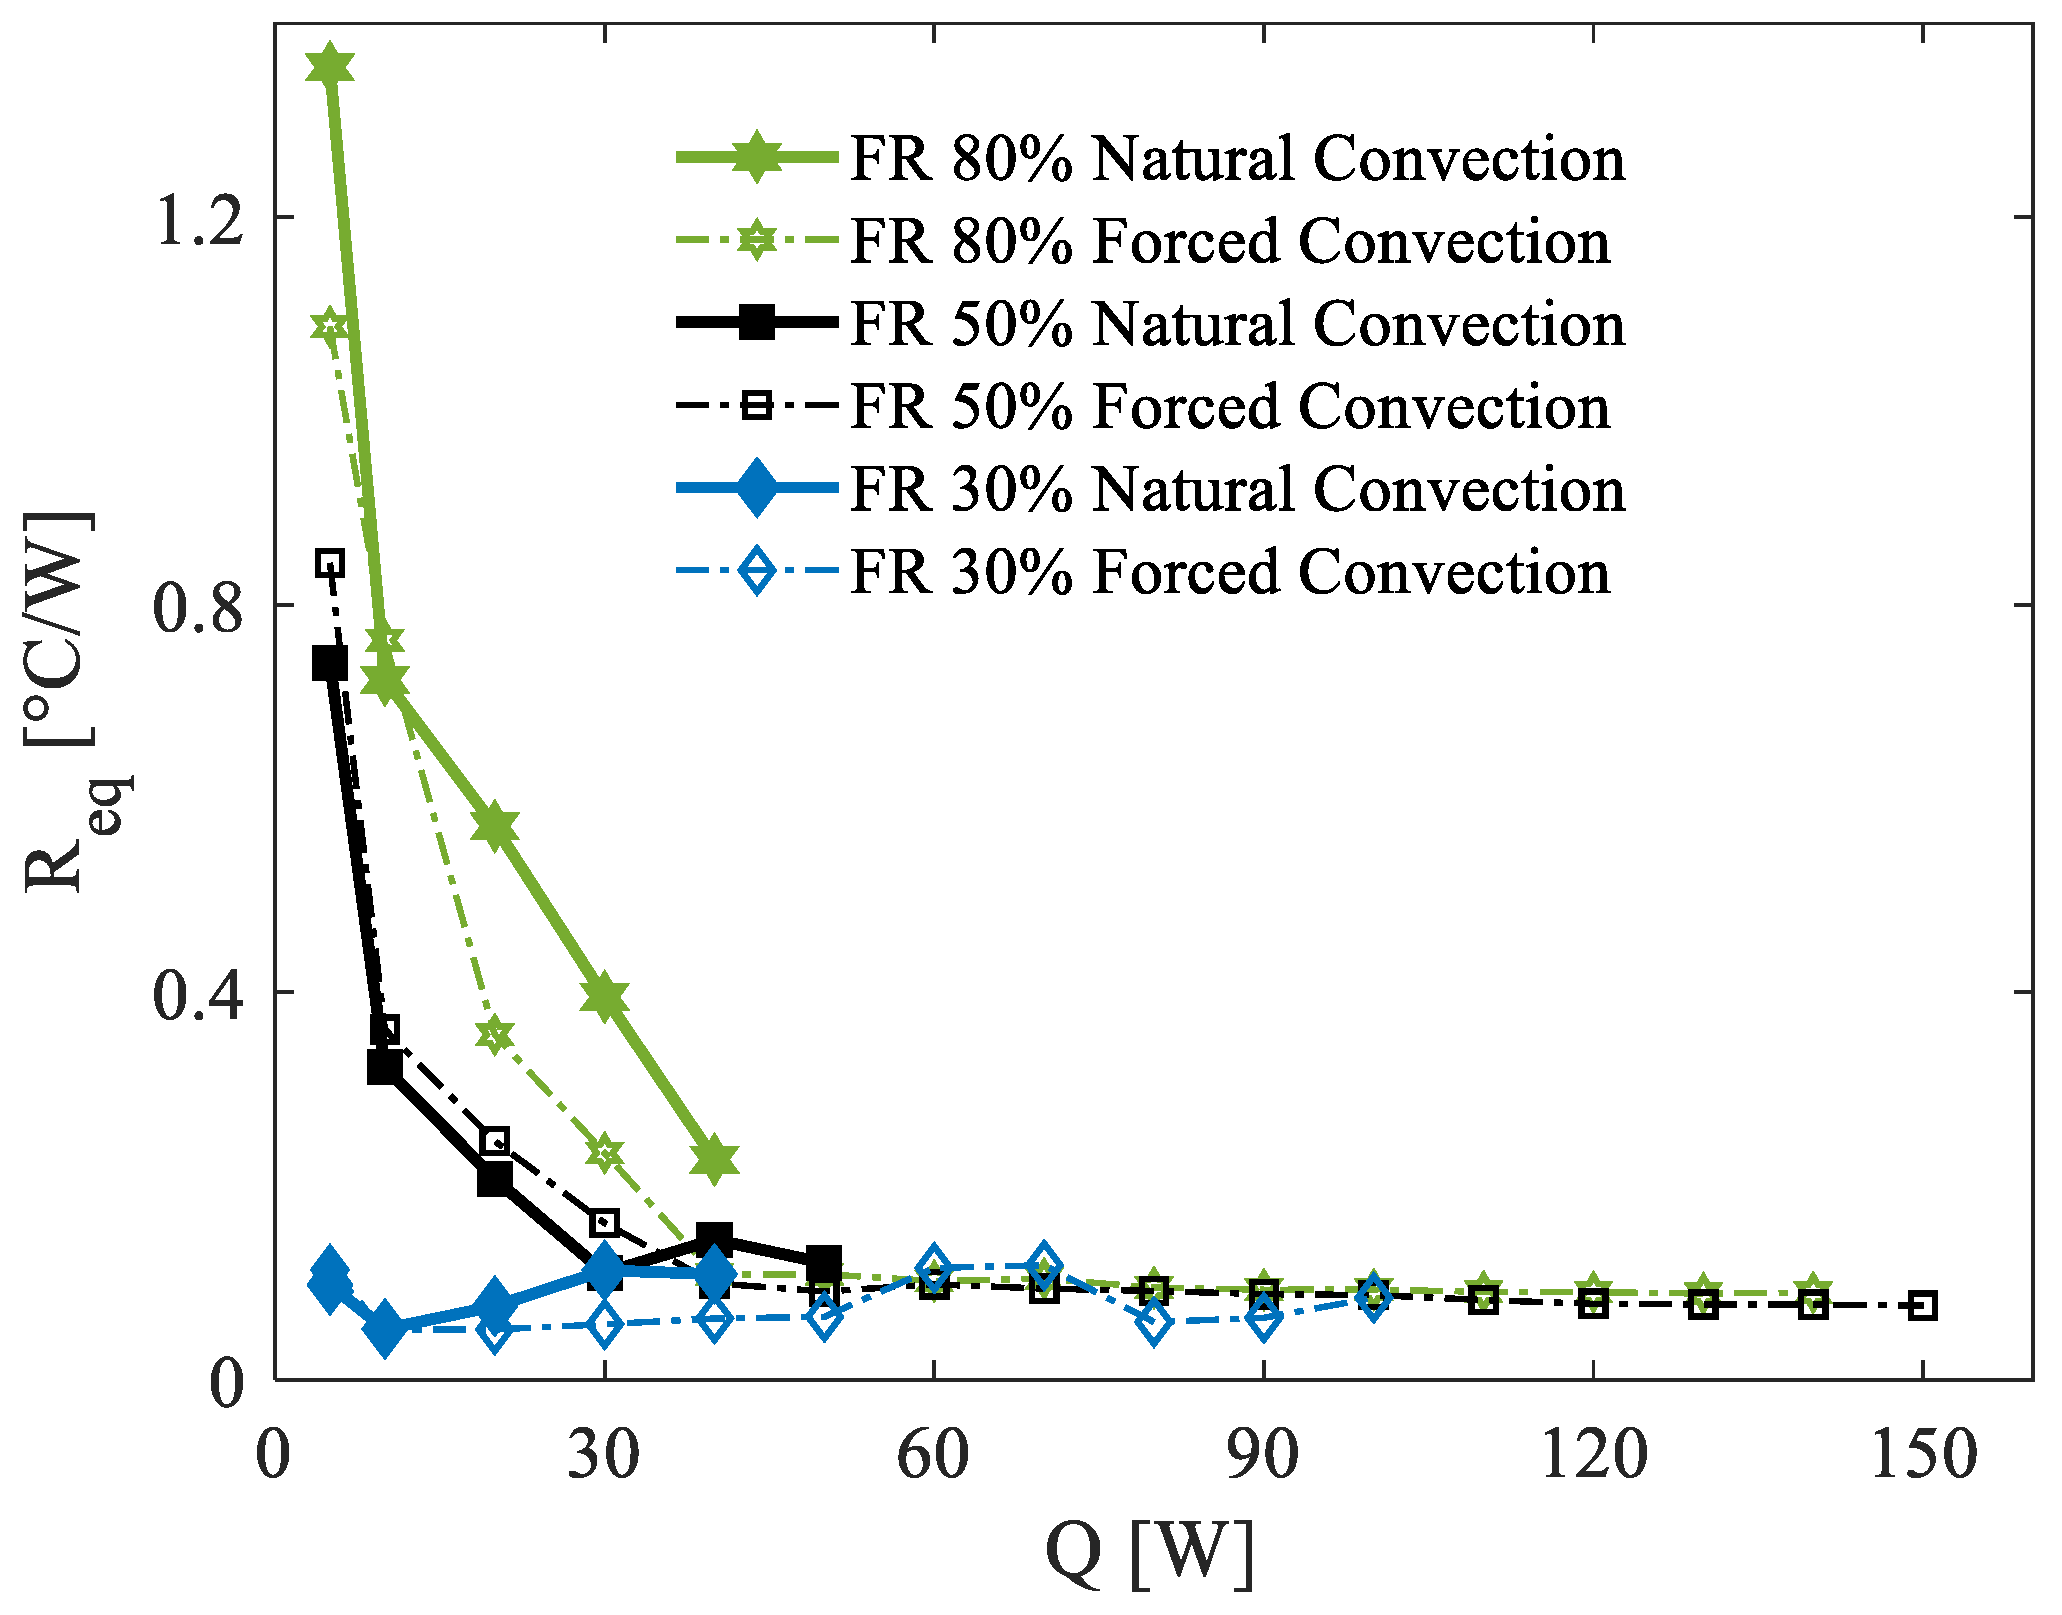
Figure 7,
Figure 8 presents the computed thermal resistance for all experimental tests conducted at an ambient temperature of 35 °C. The environmental conditions in this case are considerably harsher compared to the previous scenarios as the elevated ambient temperature facilitates the attainment of higher operating temperatures in the PHP, often necessitating the premature termination of tests to ensure safety. Consequently, the maximum power load tested under these conditions is significantly lower than in the 5 °C and 20 °C scenarios. Despite these limitations, similar trends in startup behavior are observed. Below 40 W, the 30% FR demonstrates significantly better performance compared to the other two filling ratios, with the 80% FR showing the worst thermal resistance.
Then, at power loads of 50 W and above, all filling ratios converge to practically identical thermal resistance values. This behavior indicates the onset of fully activated oscillation modes within the PHP, resulting in comparable thermal performance across configurations. As seen in the 5 °C scenario, the 30% FR at 35 °C also exhibits localized dry-out phenomena, characterized by high-temperature spikes in specific branches of the PHP. These dry-out events force the test to be interrupted at power loads of approximately 100 W. The underlying cause of these localized dry-out issues is likely linked to the uneven distribution of liquid within the device, a challenge exacerbated by the higher ambient temperature and increased power input. Finally, as observed under the other two ambient conditions, natural convection at 35 °C yields significantly lower thermal performance compared to forced convection.
In conclusion, these preliminary tests have identified that a filling ratio (FR) of 50% consistently exhibits the most stable behavior across all the tested environmental conditions. This stability is evident in its ability to maintain uniform liquid distribution, avoid localized dry-out phenomena, and achieve reliable performance even under varying ambient temperatures and power loads. Given these advantages, the 50% FR has been selected as the optimal configuration for the subsequent experimental tests detailed in the following sections. This choice ensures a balance between operational reliability and thermal performance.
3.2. Optimization Tests with Opteon SF33
Following the completion of tests conducted with R134a, further experiments were carried out using an alternative working fluid, Opteon SF33. This fluid has been previously utilized in battery cooling applications; however, its use within PHPs has not yet been explored. To enable a direct comparison of performance, experiments with both working fluids were conducted under identical flow rate conditions (FR = 50%).
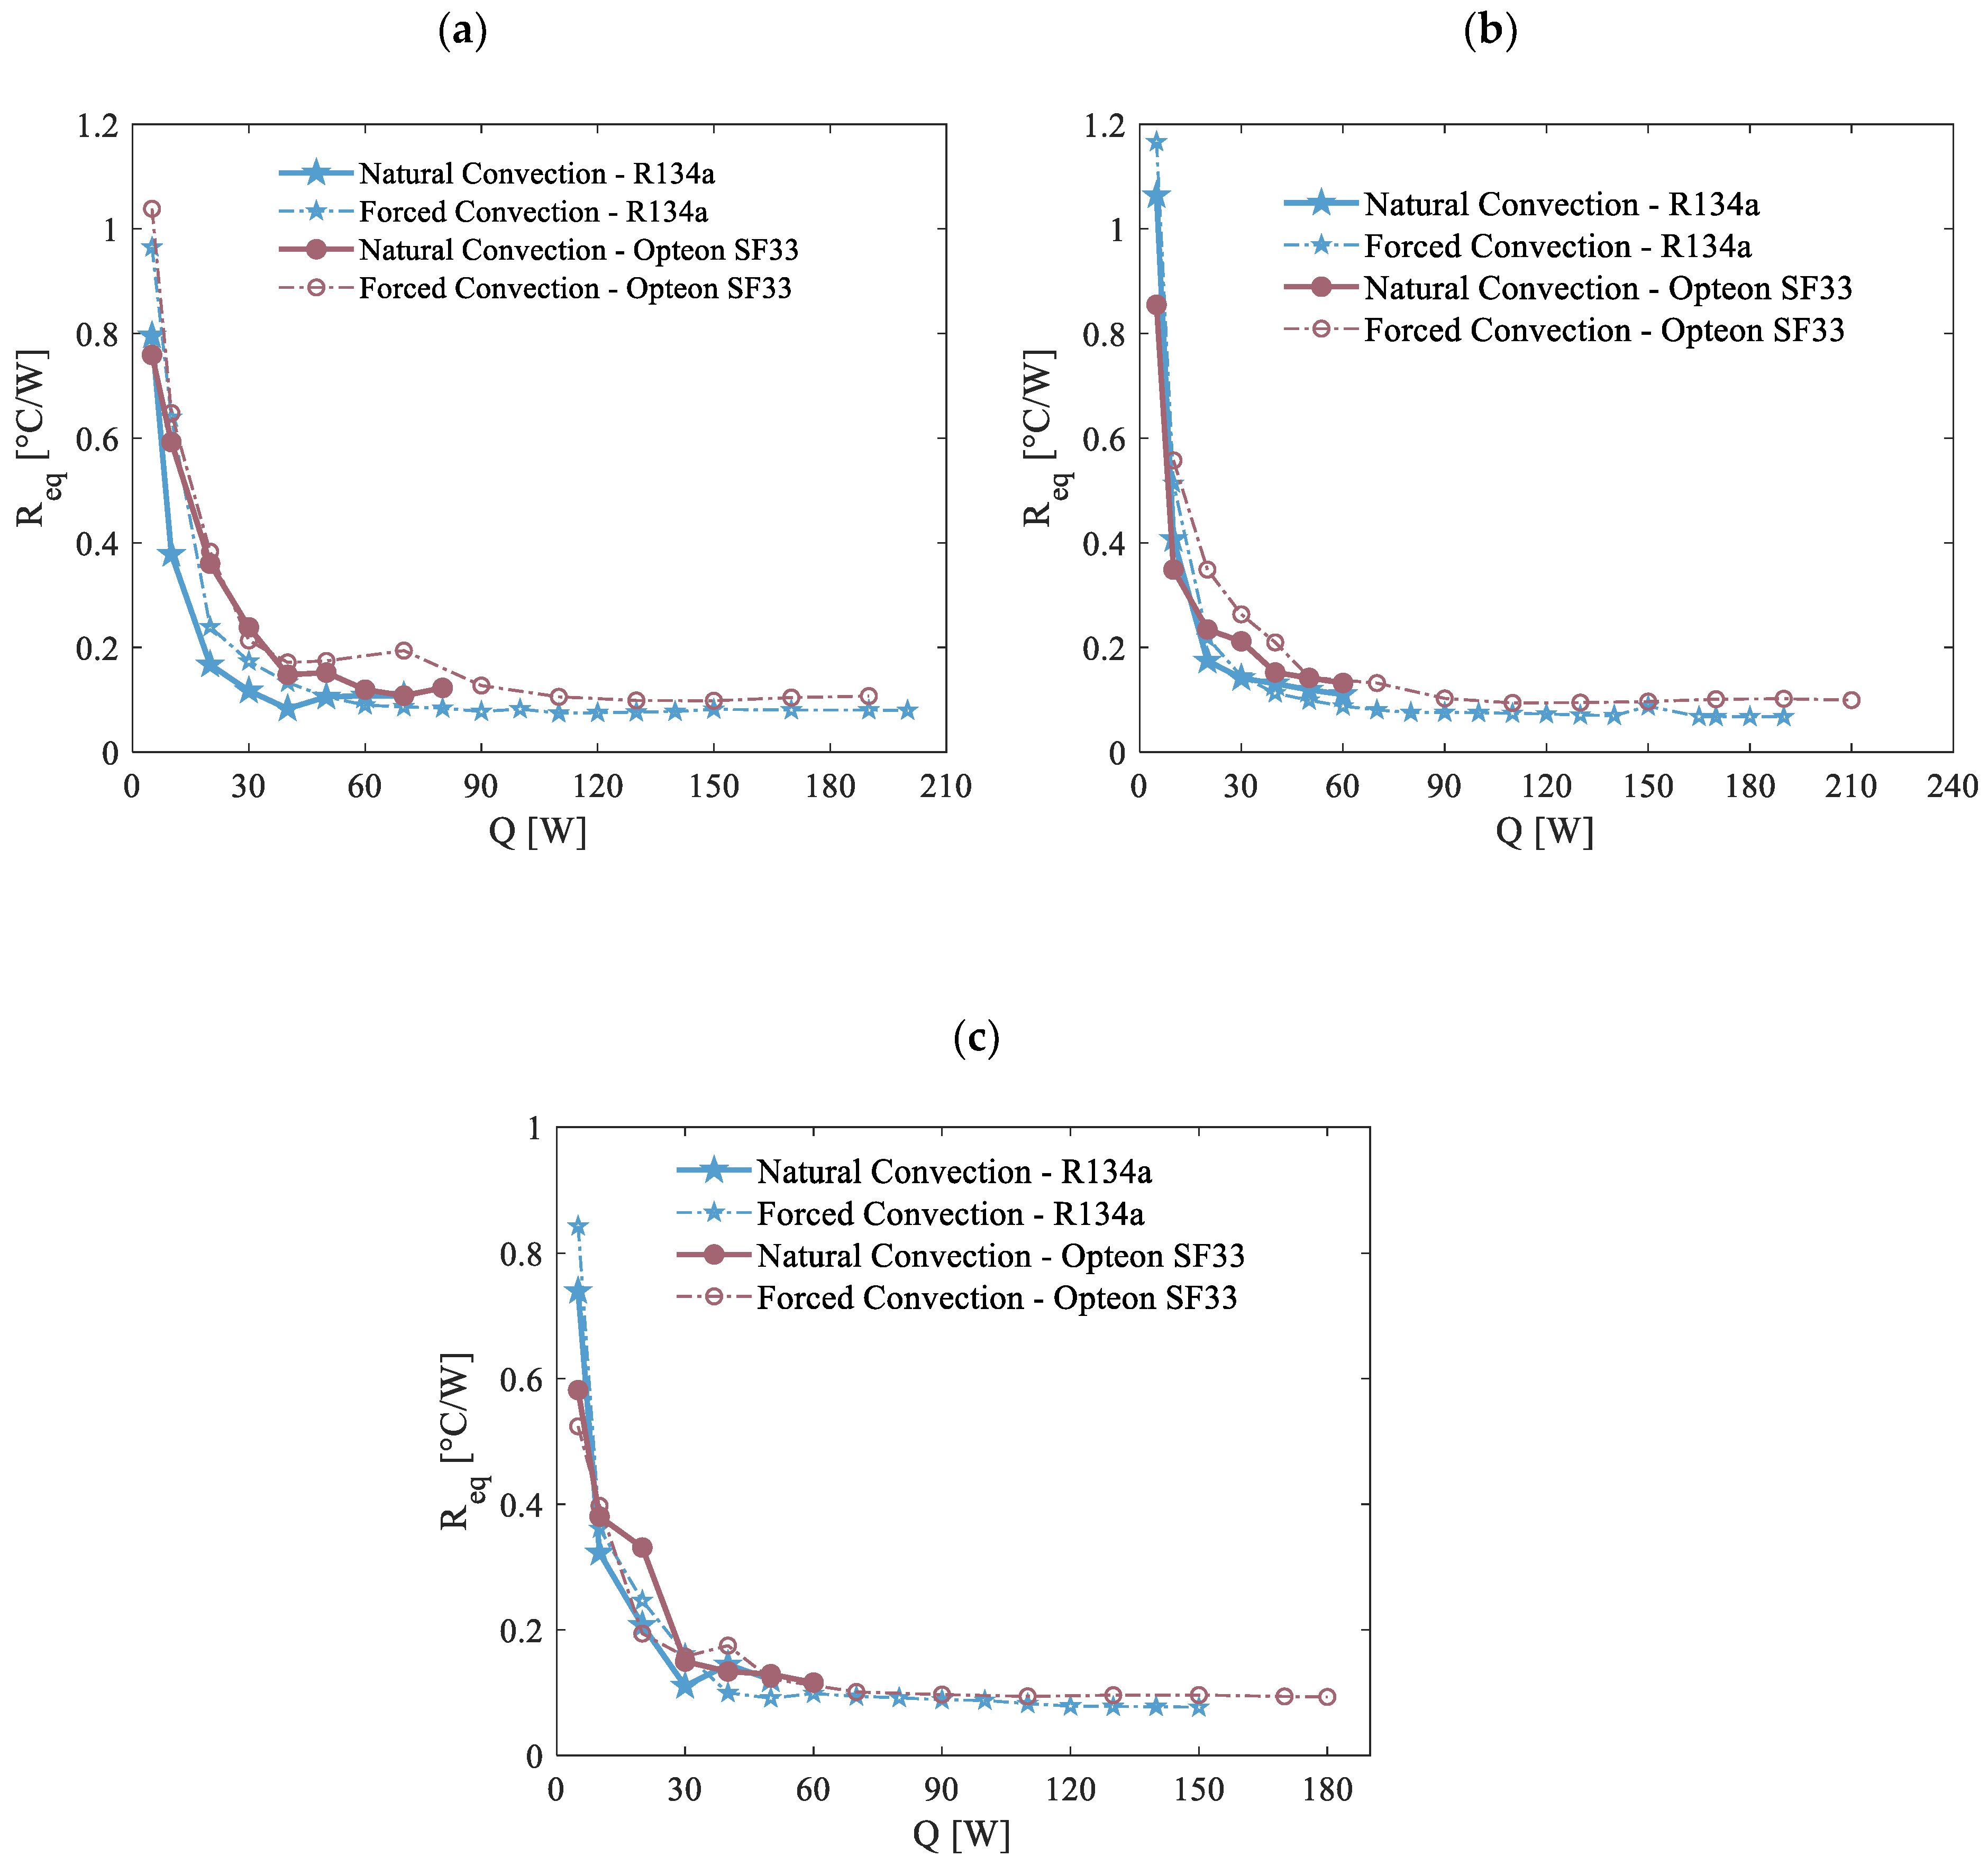
Figure 9 presents a comparison of the computed thermal resistance values for R134a and Opteon SF33 across varying input power levels. These comparisons were conducted under three different environmental temperature conditions: 5 °C, 20 °C, and 35 °C. From
Figure 9, it is evident that the PHP exhibits a similar overall behavior when using the two working fluids R134a and Opteon SF33. Across all three environmental temperatures, once the fully activated oscillation mode is achieved, the thermal resistance values are comparable. However, the results consistently show that R134a performs slightly better than Opteon SF33. Notable differences become more apparent at low input power levels, particularly during the startup phase and the intermittent flow regime. The startup process is objectively faster with R134a than with Opteon SF33, and this difference becomes more pronounced at lower temperatures. For instance, at 5 °C, a significant discrepancy is observed not only during the startup phase—approximately in the range of 5–30 W—but also during the intermittent oscillatory flow preceding full activation of the device. Full activation appears to occur around 60 W with R134a and around 90W for Opteon SF33. These differences can likely be attributed to two primary factors: the distinct boiling points of the fluids at atmospheric pressure and their differing viscosities. R134a has a boiling point of approximately −26 °C, whereas Opteon SF33 has a much higher boiling point of about 33 °C. A lower boiling point enables R134a to evaporate more readily at a given pressure, resulting in higher liquid slug oscillation velocities, which accelerates the transition from the startup regime to fully developed oscillations and consequently improves the heat transfer performance of the PHP. Additionally, the reduced viscosity of R134a minimizes flow resistance within the tubes, leading to a quicker establishment of consistent pulsating flow. As shown in
Table 1, the dynamic viscosity of R134a at 5 °C is approximately half that of Opteon SF33. A lower dynamic viscosity reduces shear stress along the walls of the tube, leading to lower pressure drops. This, in turn, decreases the heat input required to sustain pulsating flow, further enhancing the performance of R134a in comparison to Opteon SF33 [
40,
41,
42].
Similar differences were observed in the results obtained at 20 °C, where R134a continued to demonstrate slightly better performance than Opteon SF33. However, at an environmental temperature of 35 °C, the behavior of the PHP with the two working fluids became nearly identical, although R134a still maintained a marginal advantage. This similarity at 35 °C can be explained by the fact that the boiling point of both fluids is exceeded at this temperature. As a result, the startup behavior is nearly indistinguishable between the two fluids. Furthermore, the difference in viscosity between the fluids becomes less pronounced at higher temperatures. Specifically, at 35 °C, the viscosity of Opteon SF33 is no longer double that of R134a, leading to a reduction in the pressure drop disparity and, consequently, no significant difference in achieving the fully activated oscillation mode. In conclusion, the two working fluids deliver comparable performance, with R134a exhibiting slightly better results at medium to low environmental temperatures. However, once the boiling point of Opteon SF33 is surpassed, the performance differences become negligible, making both fluids equally viable for PHP applications under higher-temperature conditions.
3.3. Fluid Pulsation Analysis
An essential and unique feature of PHPs is the oscillatory flow. Heat transfer in PHPs occurs thanks to self-driven oscillations facilitated by high-velocity pressure waves created through alternating nucleate boiling and subsequent condensation of the inner fluid [
43]. The axial oscillations of the working fluid within the tube enable heat to be transferred from the evaporator to the condenser section. For this reason, analyzing the fluid pulsation in the PHP devices is important for understanding their governing mechanisms and for their optimization in the considered application. Various methods have been utilized to study the oscillatory behavior of the PHPs [
44,
45], starting from the signal of the fluid pressure [
46] or the wall temperature data [
47].
Recently, wavelet analysis has garnered significant attention between the methods employed for frequency investigation [
46,
47]. As described in [
46], a wavelet function can be any function
ψ(
t) ∈
L with real or complex values that satisfies the following tolerability criterion:
where
represents the Fourier transform of
|ψ(
t)
|. To guarantee the reversibility of the transform,
Cψ need to be finite, implying that
ψ(
t) has a zero-mean value. Respecting this acceptability condition, the wavelet transform
Wy(
a,
τ) of a signal
y(
t) can be computed using the following equation [
48]:
where a and τ represent the wavelet scale dilation and time translation factors, respectively. The choice of an appropriate wavelet mother function depends on the characteristics of the signal being analyzed. The Morlet wavelet ψ has been shown to be well-suited for transient localization [
48] and is outlined as:
where
η and
f0 represent the dimensionless time and frequency, respectively. Wavelet analysis results are typically interpreted in terms of the magnitude scalogram and the power spectrum. The magnitude scalogram is stated as the power associated with each frequency over the test interval, while the power spectrum denotes the time-integrated power of the magnitude scalogram for each frequency. Specifically, the scalogram, which measures the energy distribution of the signal (|
Wy(
a,τ)|), helps identify the primary oscillation frequencies of the analyzed oscillations—these are the frequencies exhibiting the greatest power over time. In contrast, the power spectrum determines the frequency with the greatest power through the entire analysis interval by integrating the wavelet spectra over time for each scale/frequency. As per [
46,
47], the dominant frequency is defined as the frequency corresponding to the maximum value of the wavelet power spectrum.
In the present investigation, wavelet analysis was performed on the wall temperature data. In particular, the temperature profile at the condenser was captured utilizing a FLIR SC7000 infrared camera equipped with a detector array of 640 × 512 pixels, enabling thermal imaging at a frame rate of 25 Hz. According to the device specifications provided by the manufacturer, its thermal resolution was 20 mK at 303 K and its measurement accuracy was ±1 K. The camera was positioned 40 cm directly opposite the PHP to encompass the entire condenser region in the field of view. In the condenser area, the pipes were coated with a thin layer of black paint to ensure consistent high surface emissivity without affecting the thermal conductivity of the pipe material. The viewing angle was restricted to less than ±30°, allowing the surface to be approximated as a diffuse gray emitter [
49]. The data corresponded to a power input range of 10–200 W for both Opeton SF33 and R134a, with a FR of 50% in case of forced convection with air at environmental temperature of 20 °C. The analysis concentrated on central pipes of the frontal row of the device (specifically the ones highlighted in
Figure 10).
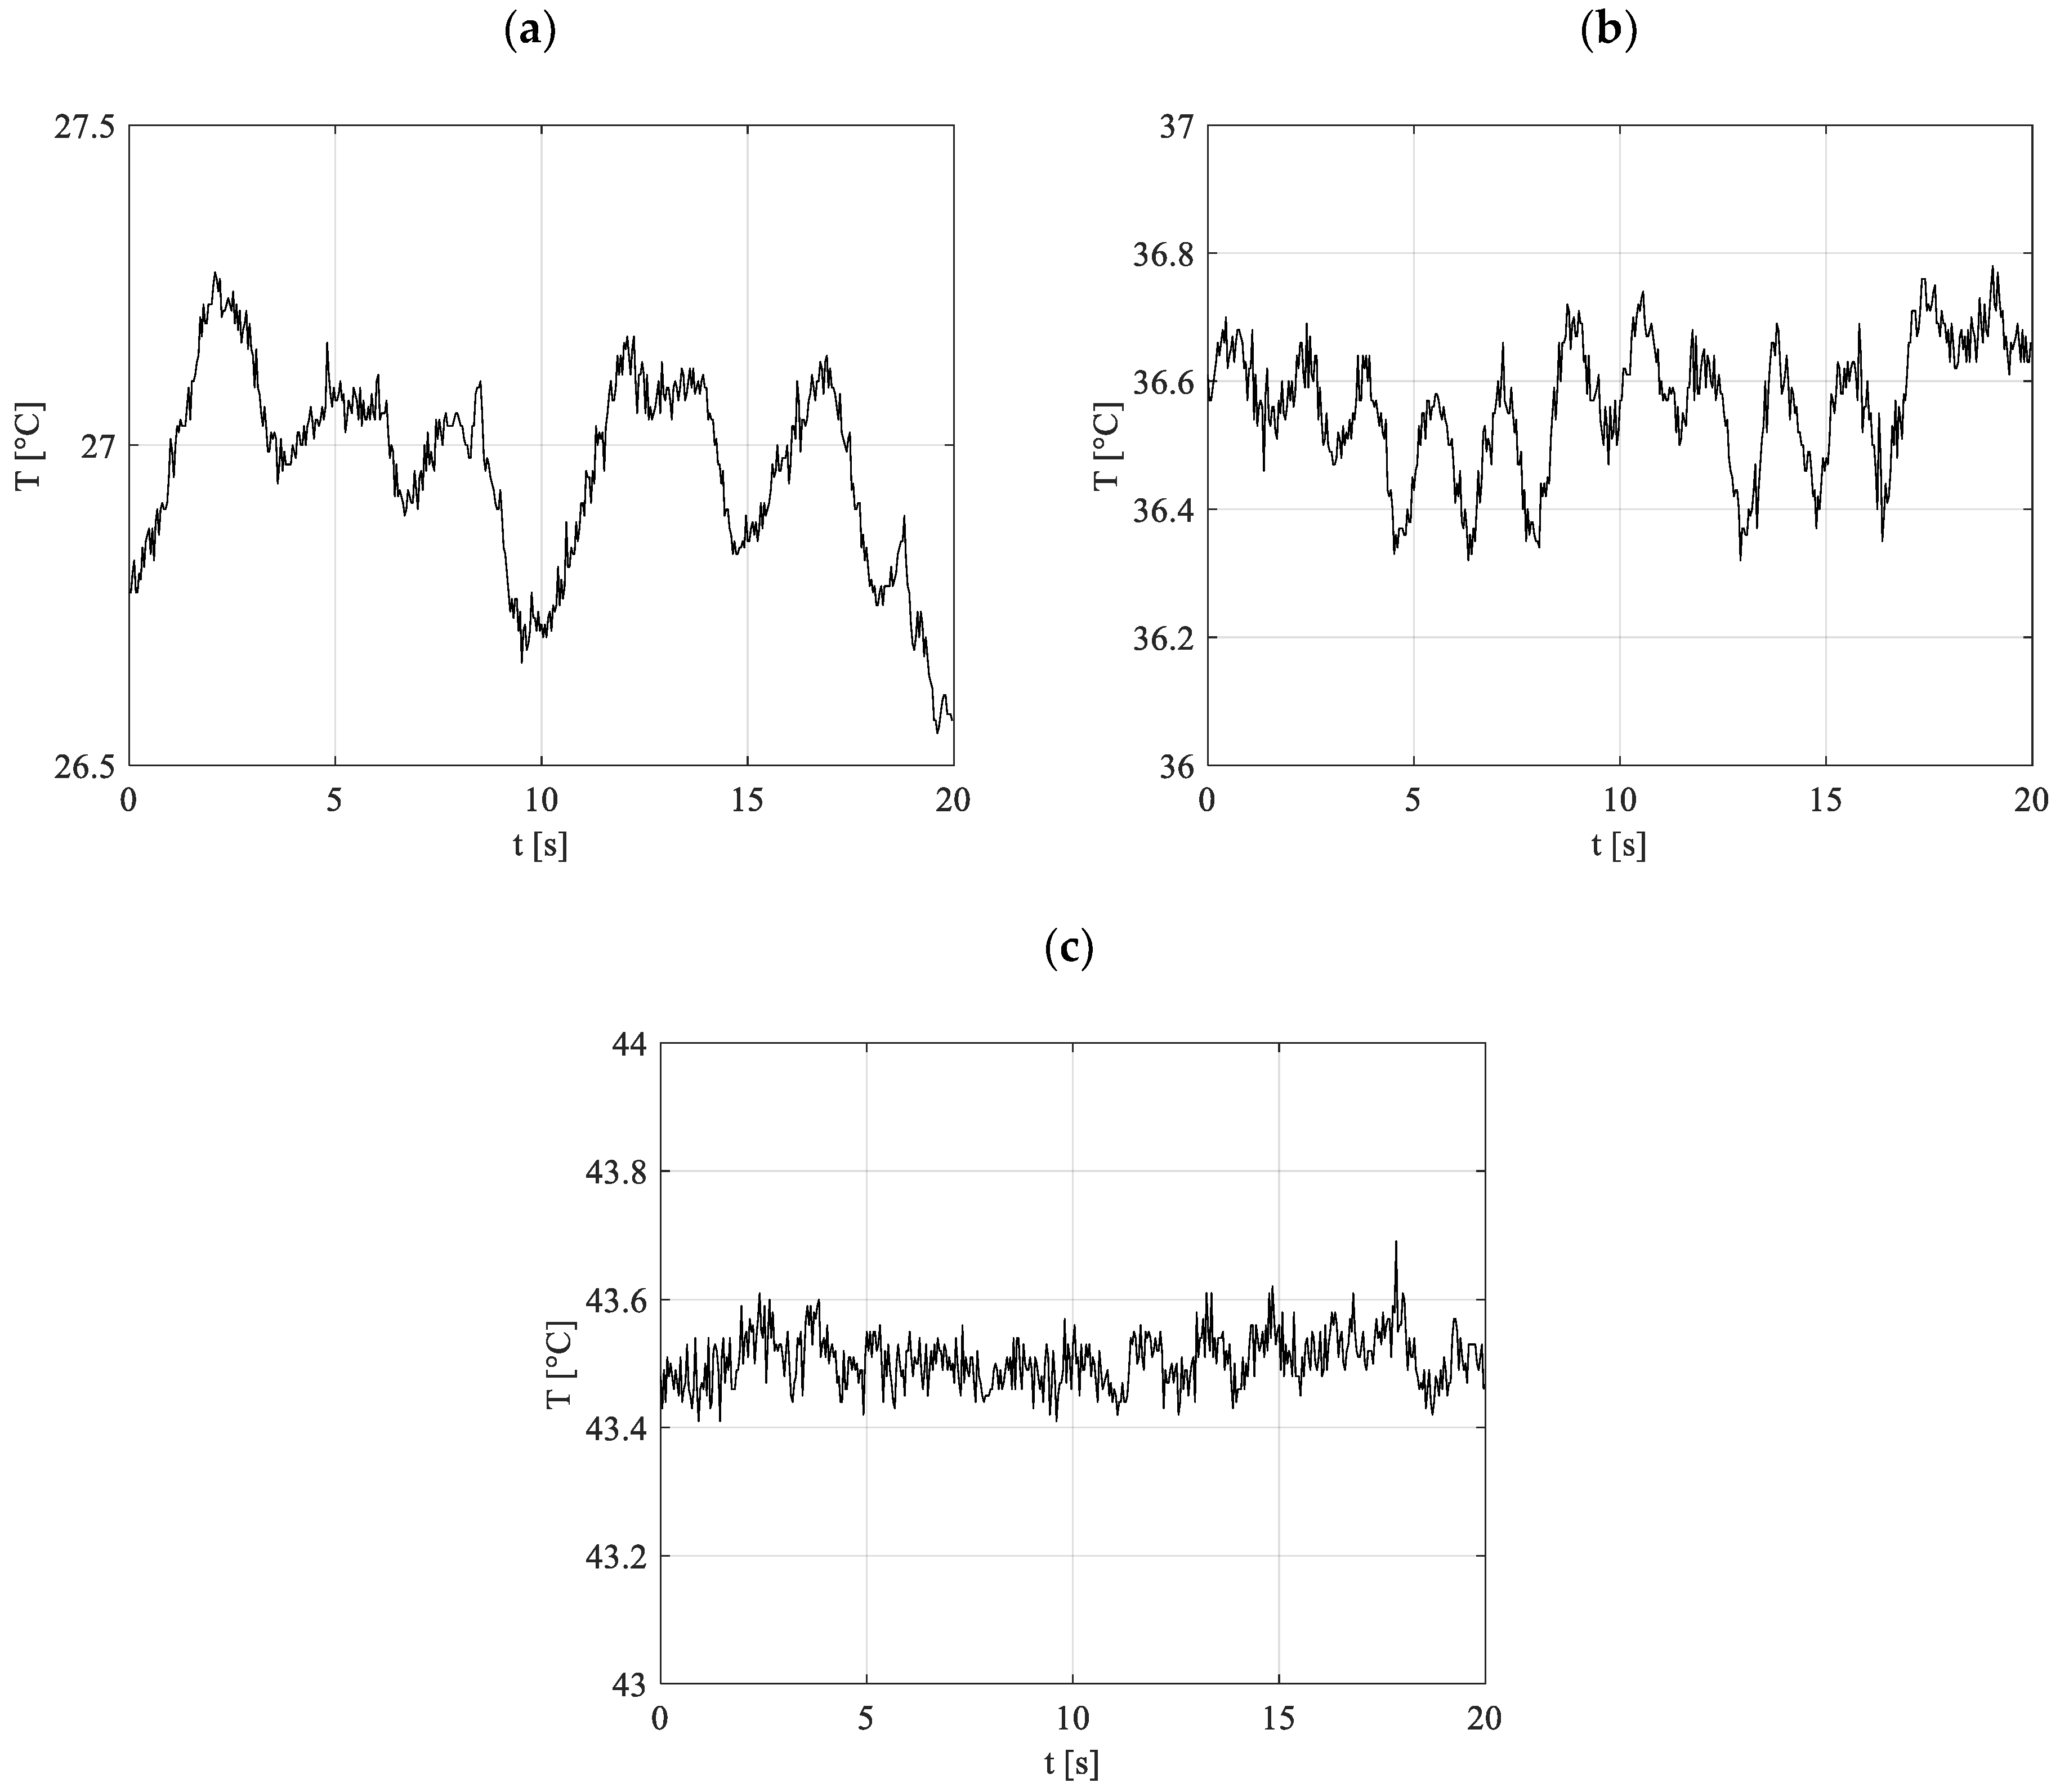
Figure 11 illustrates a selection of representative temperature data captured by the infrared camera at an acquisition frequency of 25 Hz. These readings correspond to a specific axial position along tube N°1 within the condenser region during experiments conducted with R134a as the working fluid. At a heating power of 30 W, low frequency thermal phenomena were observed, indicative of not completely stable pulsations. However, as the heating power exceeded 90 W, a consistent and sustained oscillatory field began to manifest, with its characteristics evolving progressively as the heating power increased. The detailed frequency analysis of temperature distributions obtained through infrared imaging offers a comprehensive insight into the thermal oscillations occurring throughout the entire system. This approach enables the identification and evaluation of oscillatory patterns with remarkable spatial and temporal resolution.
The results, depicted in
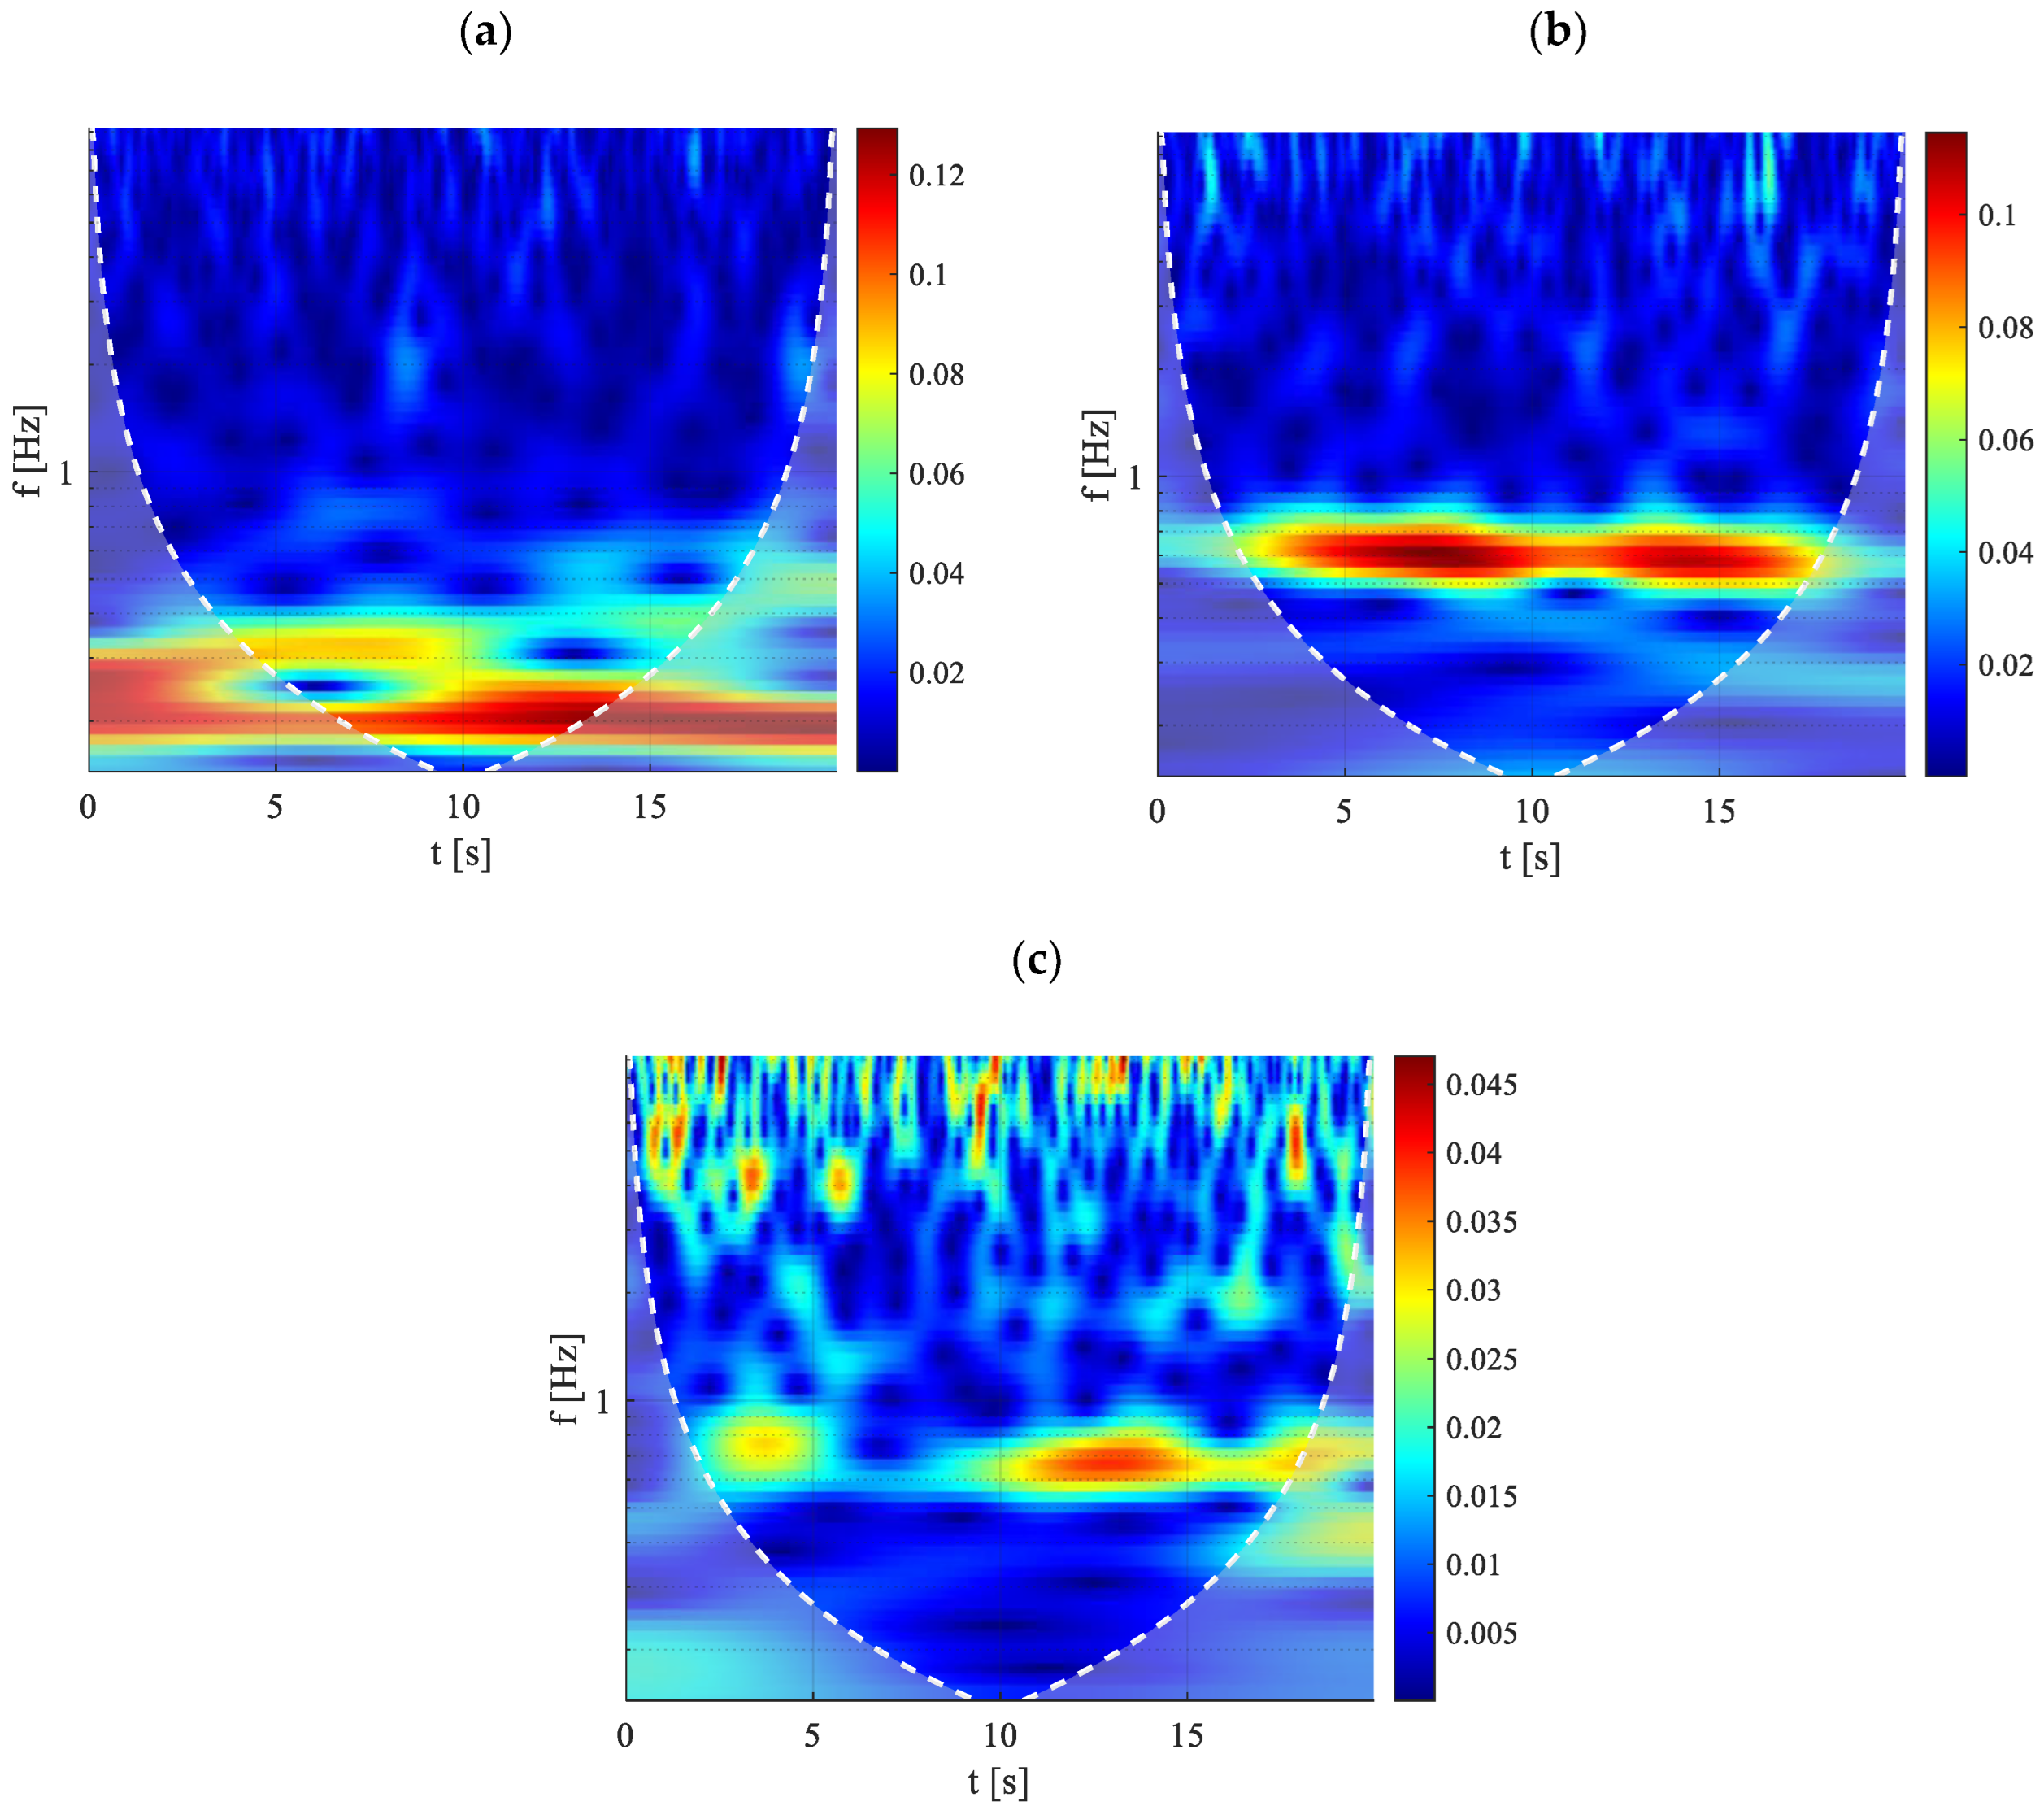
Figure 12, include scalograms that provide a visual representation of the frequency content of temperature signals over time. These scalograms allow for the precise assessment of localized energy variations within the thermal signal, facilitating a deeper understanding of the dynamic behavior of the system under different heating conditions.
Figure 12a (30 W) depicts very low characteristic frequencies, i.e., information about the duration required for a vapor plug and its neighboring liquid slug to pass over a defined surface region [
50]. At this low heating level, the pulsation pattern is defined by frequencies close to 0.05 Hz. This is corroborated by the information in
Figure 11a, where localized temperature readings exhibit merely occasional oscillatory patterns. The low frequency, as described by Xu and Zhang [
50], can be attributed to the presence of extended liquid slugs within the channels at reduced heating levels, where the movement of the fluid is minimal and mainly influenced by the merging of smaller vapor plugs that generate a slug flow with low pulsation magnitude. This phenomenon can be viewed as an indicator of the startup phase or of the transition from this phase to an intermittent oscillatory condition. Further evidence is provided by the data in
Figure 9b, where a notable drop in thermal resistance values signifies the emergence of pulsation activity within the system.
When the device is completely activated a fully oscillatory behavior could be observed with a progressive increase of the characteristic frequency, as it is possible to appreciate in
Figure 12b where for the case of 90W the characteristic frequency is about 0.65 Hz. Then, at elevated heat inputs, vertical peaks become apparent in the scalogram, representing high-energy pulsations originating from the evaporator and rapidly passing through the condenser section. These sporadic high-frequency, high-energy peaks are still embedded within a substrate characterized by much lower frequencies (e.g., at Q = 150W). As the heating power supplied to the evaporator increases further, the high-frequency pulsations not only become more frequent but also grow in energy intensity. Additional insights can be obtained from the power spectrum presented in
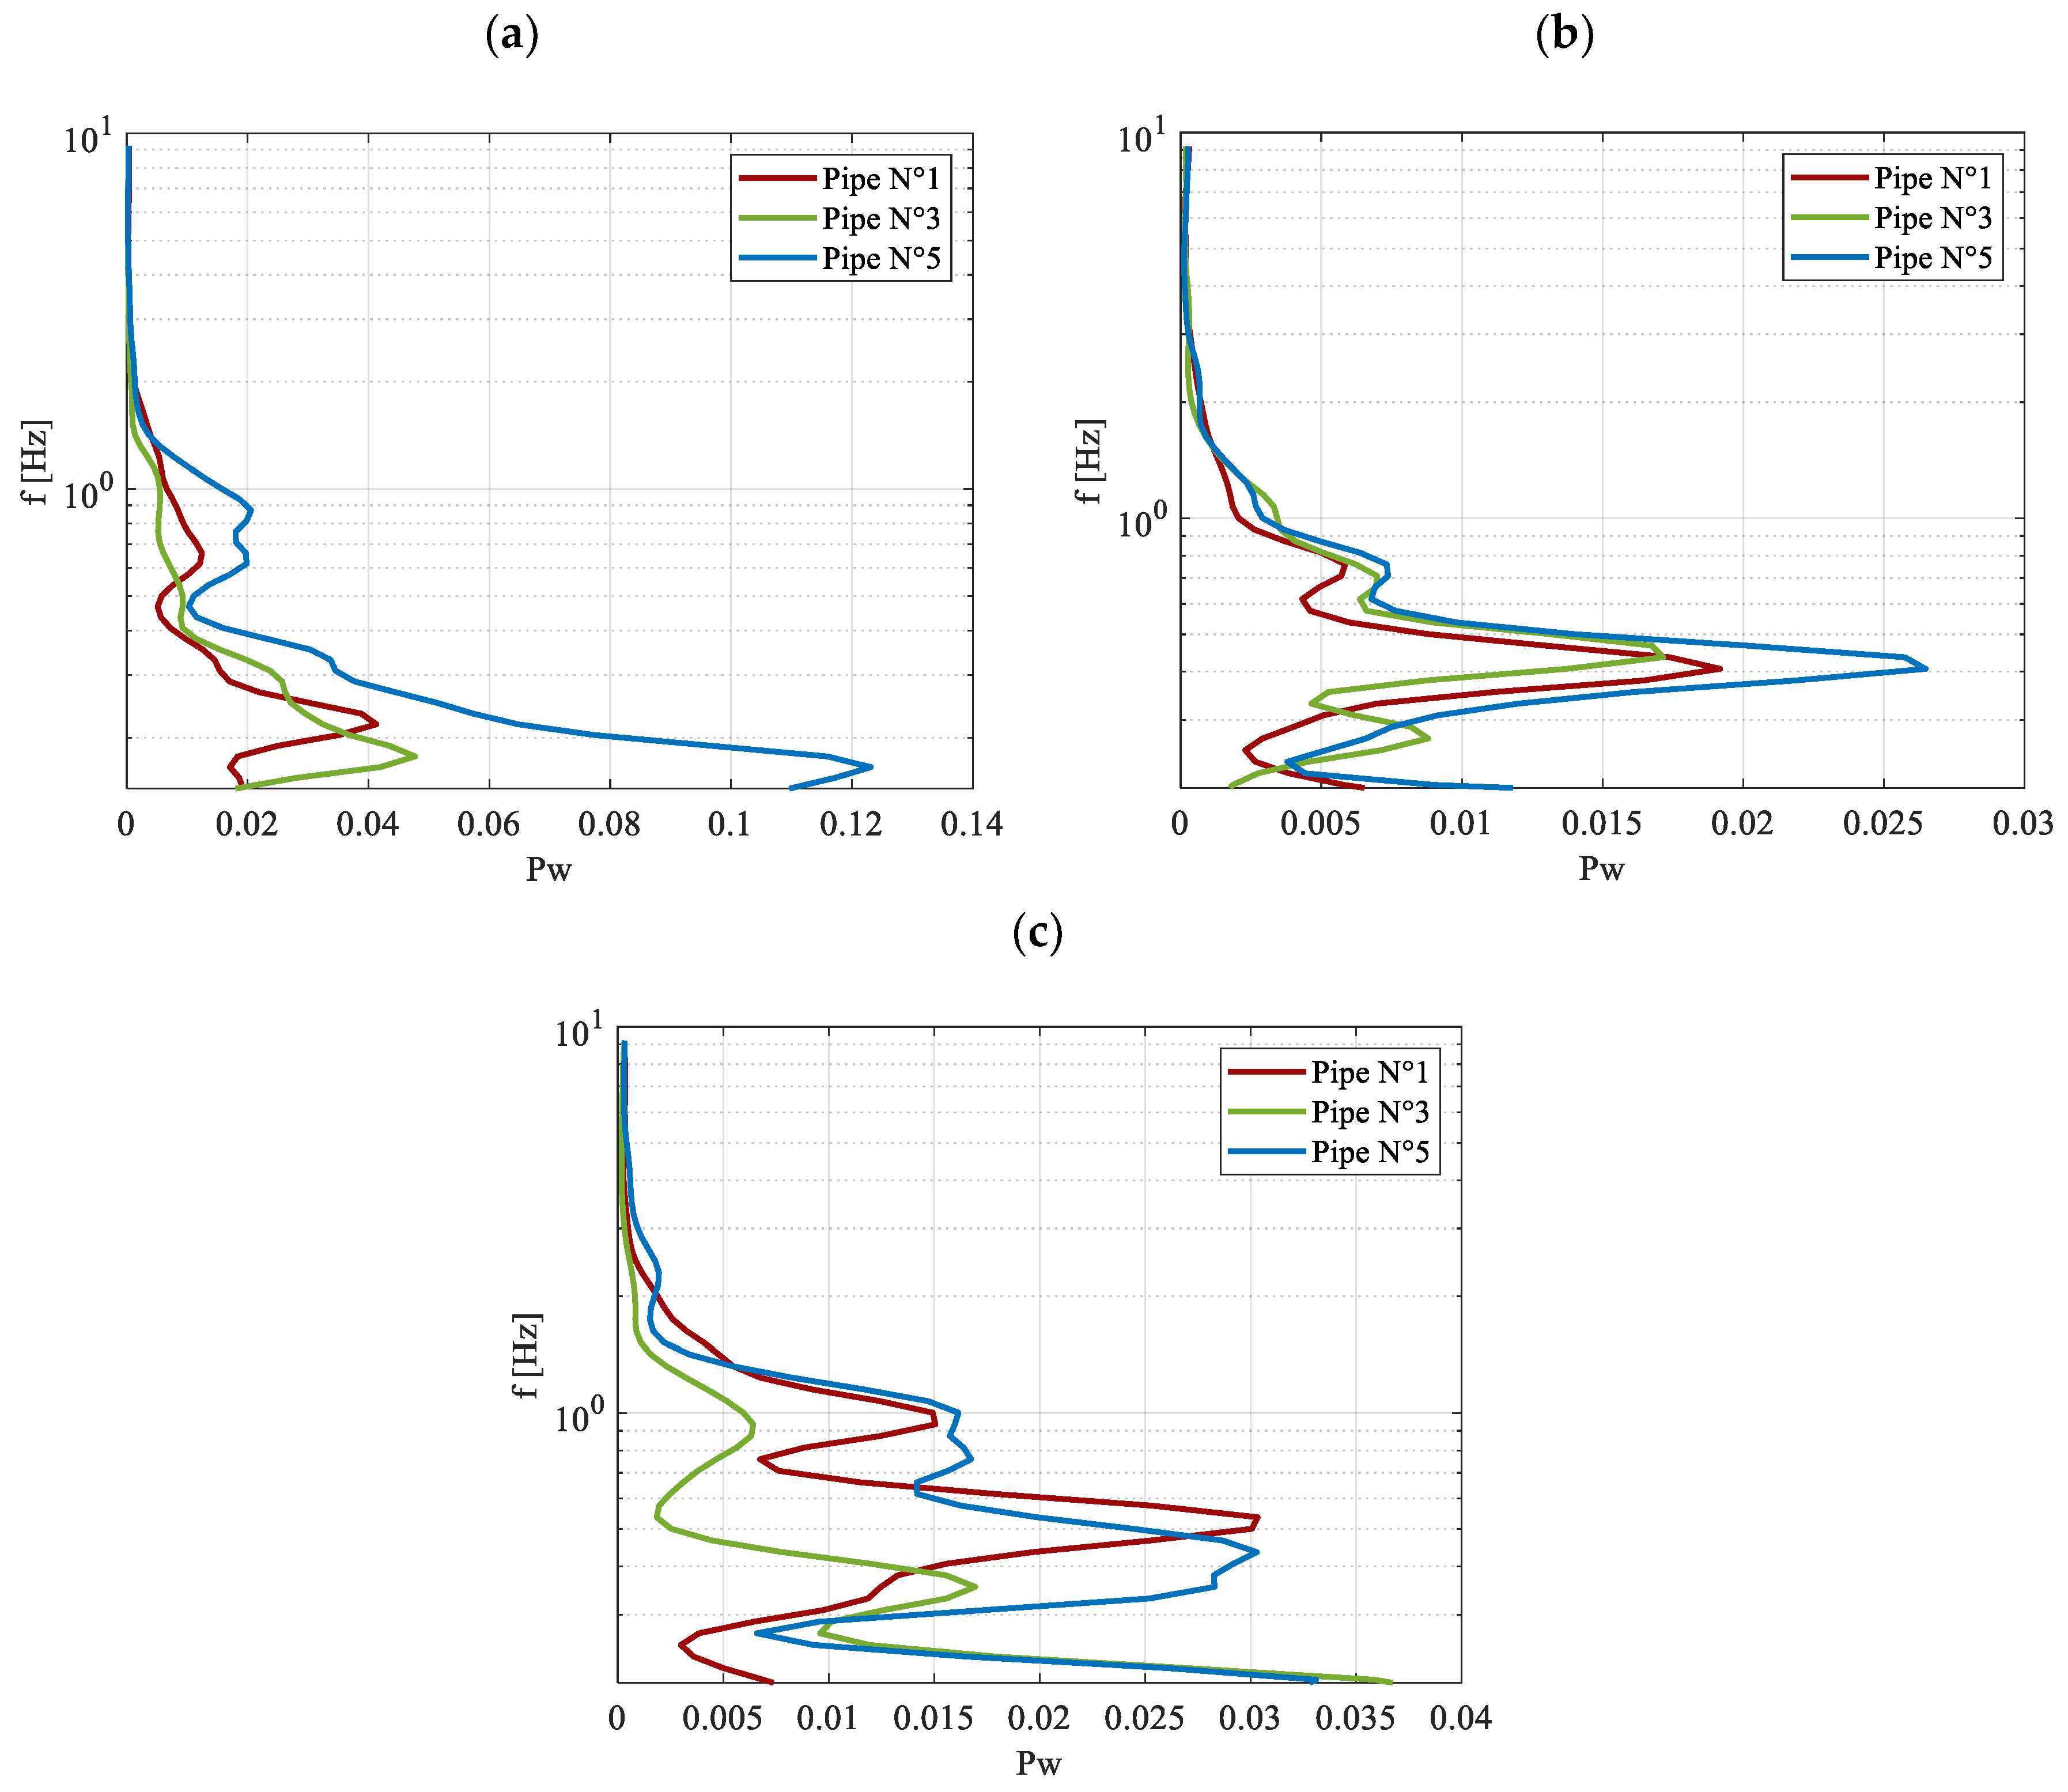
Figure 13, since, representing the signal’s power distribution across frequencies, it allows us to determine the predominant pulsation frequencies of the observed oscillatory behavior.
The results are shown for the same axial coordinate, not only for pipe No. 1 but also for pipes No. 3 and No. 5, to determine whether the observed behavior is consistent across other tubes in the device. This provides valuable information about the overall activation of the system. At 30W, as indicated by the scalogram, the characteristic frequency remains very low for all three pipes considered, with a value around 0.1 Hz. However, the behavior varies a little among the tubes, with pipes No. 3 and No. 5 presenting a significant secondary peak around 0.2 Hz. At this power level, the startup has already occurred but the flow regime probably is still not completely stable, with a behavior that still slightly varies between the different tubes. As the heat input increases, the dominant frequency stabilizes at approximately 0.65 Hz. For both Q = 90W and Q = 150W, the oscillatory behavior depicted by the power spectrum is identical across the three pipes. This observation aligns with
Figure 9b, which illustrates a fully oscillating regime established within the device at these power levels. Additionally, at Q = 150W, oscillations at very high frequencies begin to emerge, as shown in
Figure 13c.
The results obtained for similar power inputs but adopting Opteon SF33 are reported in
Figure 14 in terms of the power spectrum. They are consistent with those observed for R134a, with pulsations exhibiting an increasing dominant frequency as the power input is augmented. However, differences emerge at a power input of Q = 30 W, as previously highlighted in
Figure 9b. In this instance, a distinct behavior is observed during the startup phase—approximately within the range of 5–30 W. During this phase, Opteon SF33 appears to experience greater difficulty compared to R134a in initiating the first oscillations and transitioning to the intermittent oscillatory flow regime. This phase precedes the full activation of the device, and the observed behavior can be attributed to the differences in boiling points and viscosity values between the two fluids, as discussed earlier. For Q = 30 W, the dominant frequency for Opteon SF33 is lower than that of R134a, aligning with the observed delay in achieving full activation. This trend is also evident at Q = 90 W, where the dominant frequency for Opteon SF33 is approximately 0.35 Hz, compared to 0.65 Hz for R134a. Additionally, secondary peaks are observed, likely indicative of the final stages of transition from the intermittent oscillation regime to the fully activated state that seems to be almost reached.
Supporting this conclusion,
Figure 9b suggests that the fully activated regime for Opteon SF33 is achieved at power inputs near this range. As the heat input at the evaporator increases, the dominant frequency rises to approximately 0.6 Hz, accompanied by a significant secondary peak at 1 Hz. This secondary peak indicates the presence of high-frequency phenomena, which were also observed in the case of R134a.
These findings emphasize that, in terms of frequency behavior, the two fluids exhibit distinct characteristics. R134a demonstrates faster startup dynamics, reaching stable oscillations more quickly due to its rapid phase transition and circulation initiation. In contrast, Opteon SF33 provides more stable oscillatory motion over a broader range of operating conditions, making it a preferable choice for long-term performance stability.
3.4. Discharging Process
Having established the performance characteristics of the PHP under varying operational scenarios, it becomes essential to evaluate the performance of the presented cooling solution when subjected to realistic battery operating conditions. For this reason, the optimized PHPs were tested with power loads to replicate the heat produced during three different discharge procedures of the battery under consideration. These discharge scenarios were representative of complete discharge cycles conducted at constant currents, each defined by a specific C-rate. The selected C-rates—0.5C, 1C, and 2C—enabled an in-depth analysis of the cooling system’s capability to manage thermal loads across a spectrum of operational intensities. This approach ensures that the cooling system’s performance aligns with the thermal demands encountered during practical battery usage. To calculate the heat generation from an individual battery cell, the Bernardi equation [
51] was employed, which is as follows:
where, in this context,
I represents the discharge current,
V denotes the cell voltage,
T is the temperature measured at the battery surface,
UOC refers to the open-circuit voltage, and
∂UOC/∂T corresponds to the entropic heat coefficient. The calculated thermal generation values for the evaluated battery pack are visually presented in
Figure 15.
The discharge curves have been utilized as a benchmark to evaluate the viability and efficiency of the presented thermal management system. This approach is critical because Li-ion batteries often operate under highly demanding and stressful conditions during the discharge phase, which can significantly impact their performance and safety. The three distinct discharge curves were applied to the evaporator under the boundary conditions at the condenser, also previously considered, using both working fluids for comparison. The primary objective of the proposed BTMS is to keep the maximum battery temperature under 40 °C. Keeping the temperature within this threshold is essential to prevent operational malfunctions and mitigate the potential hazards associated with thermal runaway, which could lead to catastrophic outcomes. Consequently, a crucial metric for determining the performance and reliability of the cooling system is the peak temperature attained by the system during experimental tests. By analyzing these parameters, the study aims to ensure that the thermal management system not only preserves battery safety but also optimizes its operational lifespan and overall performance.
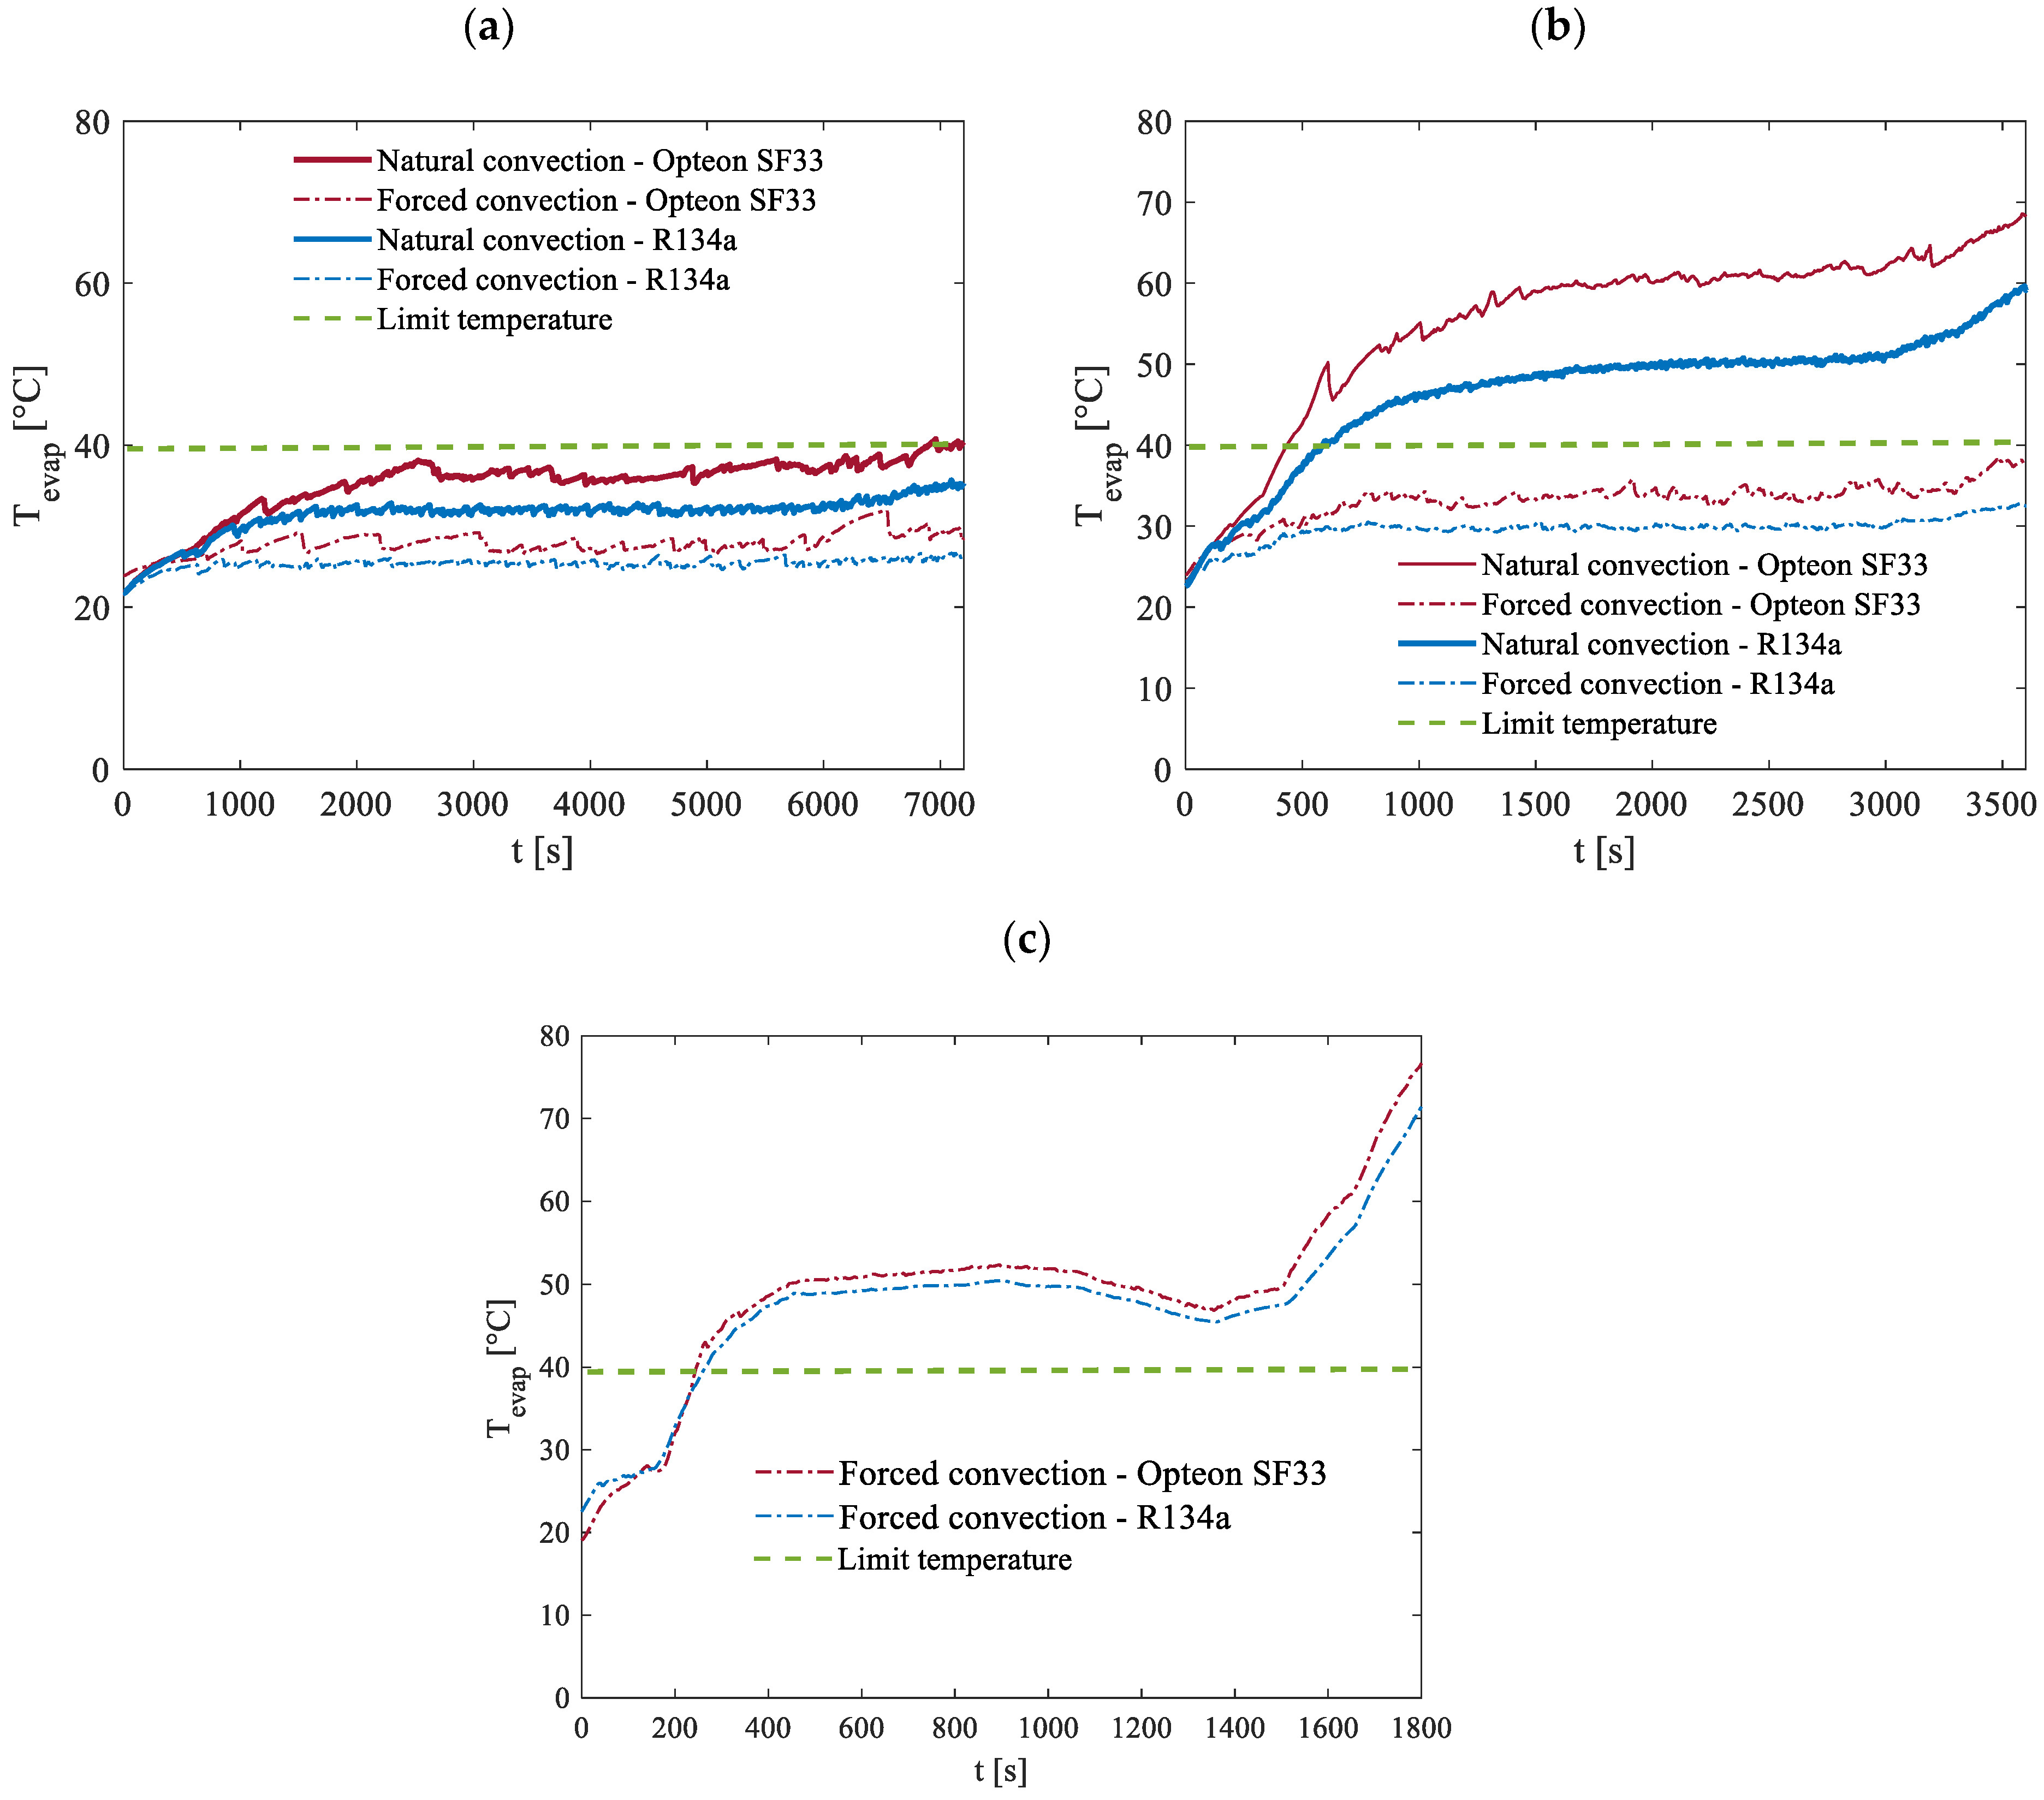
Figure 16 illustrates the maximum temperatures recorded at the evaporator for discharge rates of 0.5C, 1C, and 2C under environment temperature conditions of 20 °C. These tests were conducted to analyze the system’s performance across various operational scenarios considering both natural and forced air convection modes at the condenser, providing insight into the impact of different cooling strategies on thermal regulation and the two previously cited working fluids, R134a and Opteon SF33, to assess their relative effectiveness in maintaining optimal temperature levels.
As previously discussed, to prevent potential malfunctions or the risk of thermal runaway, the primary objective of the BTMS is to keep the peak temperature under 40 °C. This goal is successfully achieved under forced convection conditions for both working fluids studied at discharge rates of 0.5C and 1C. However, at a 2C discharge rate, where notably greater power levels need to be dissipated, the evaporator’s temperature surpasses the acceptable threshold. At the 0.5C-rate, the heat generated is minimal, allowing the system to effectively manage the temperature and remain within safe limits even under natural convection. Conversely, natural convection proves insufficient at higher discharge rates. At 1C natural convection fails to maintain thermal stability, and at 2C the temperature rapidly escalates beyond safe levels within seconds. Due to this, the experiments at 2C were prematurely halted, and no meaningful data could be obtained, as reflected in
Figure 16c. When comparing the performance of the two working fluids, similar overall behavior can be observed. However, it is notable that R134a demonstrated a slightly better thermal performance compared to Opteon SF33 for all the discharging processes considered. Specifically, under identical conditions, the use of R134a resulted in maintaining temperatures that were consistently a few degrees lower than those observed in the case of Opteon SF33.
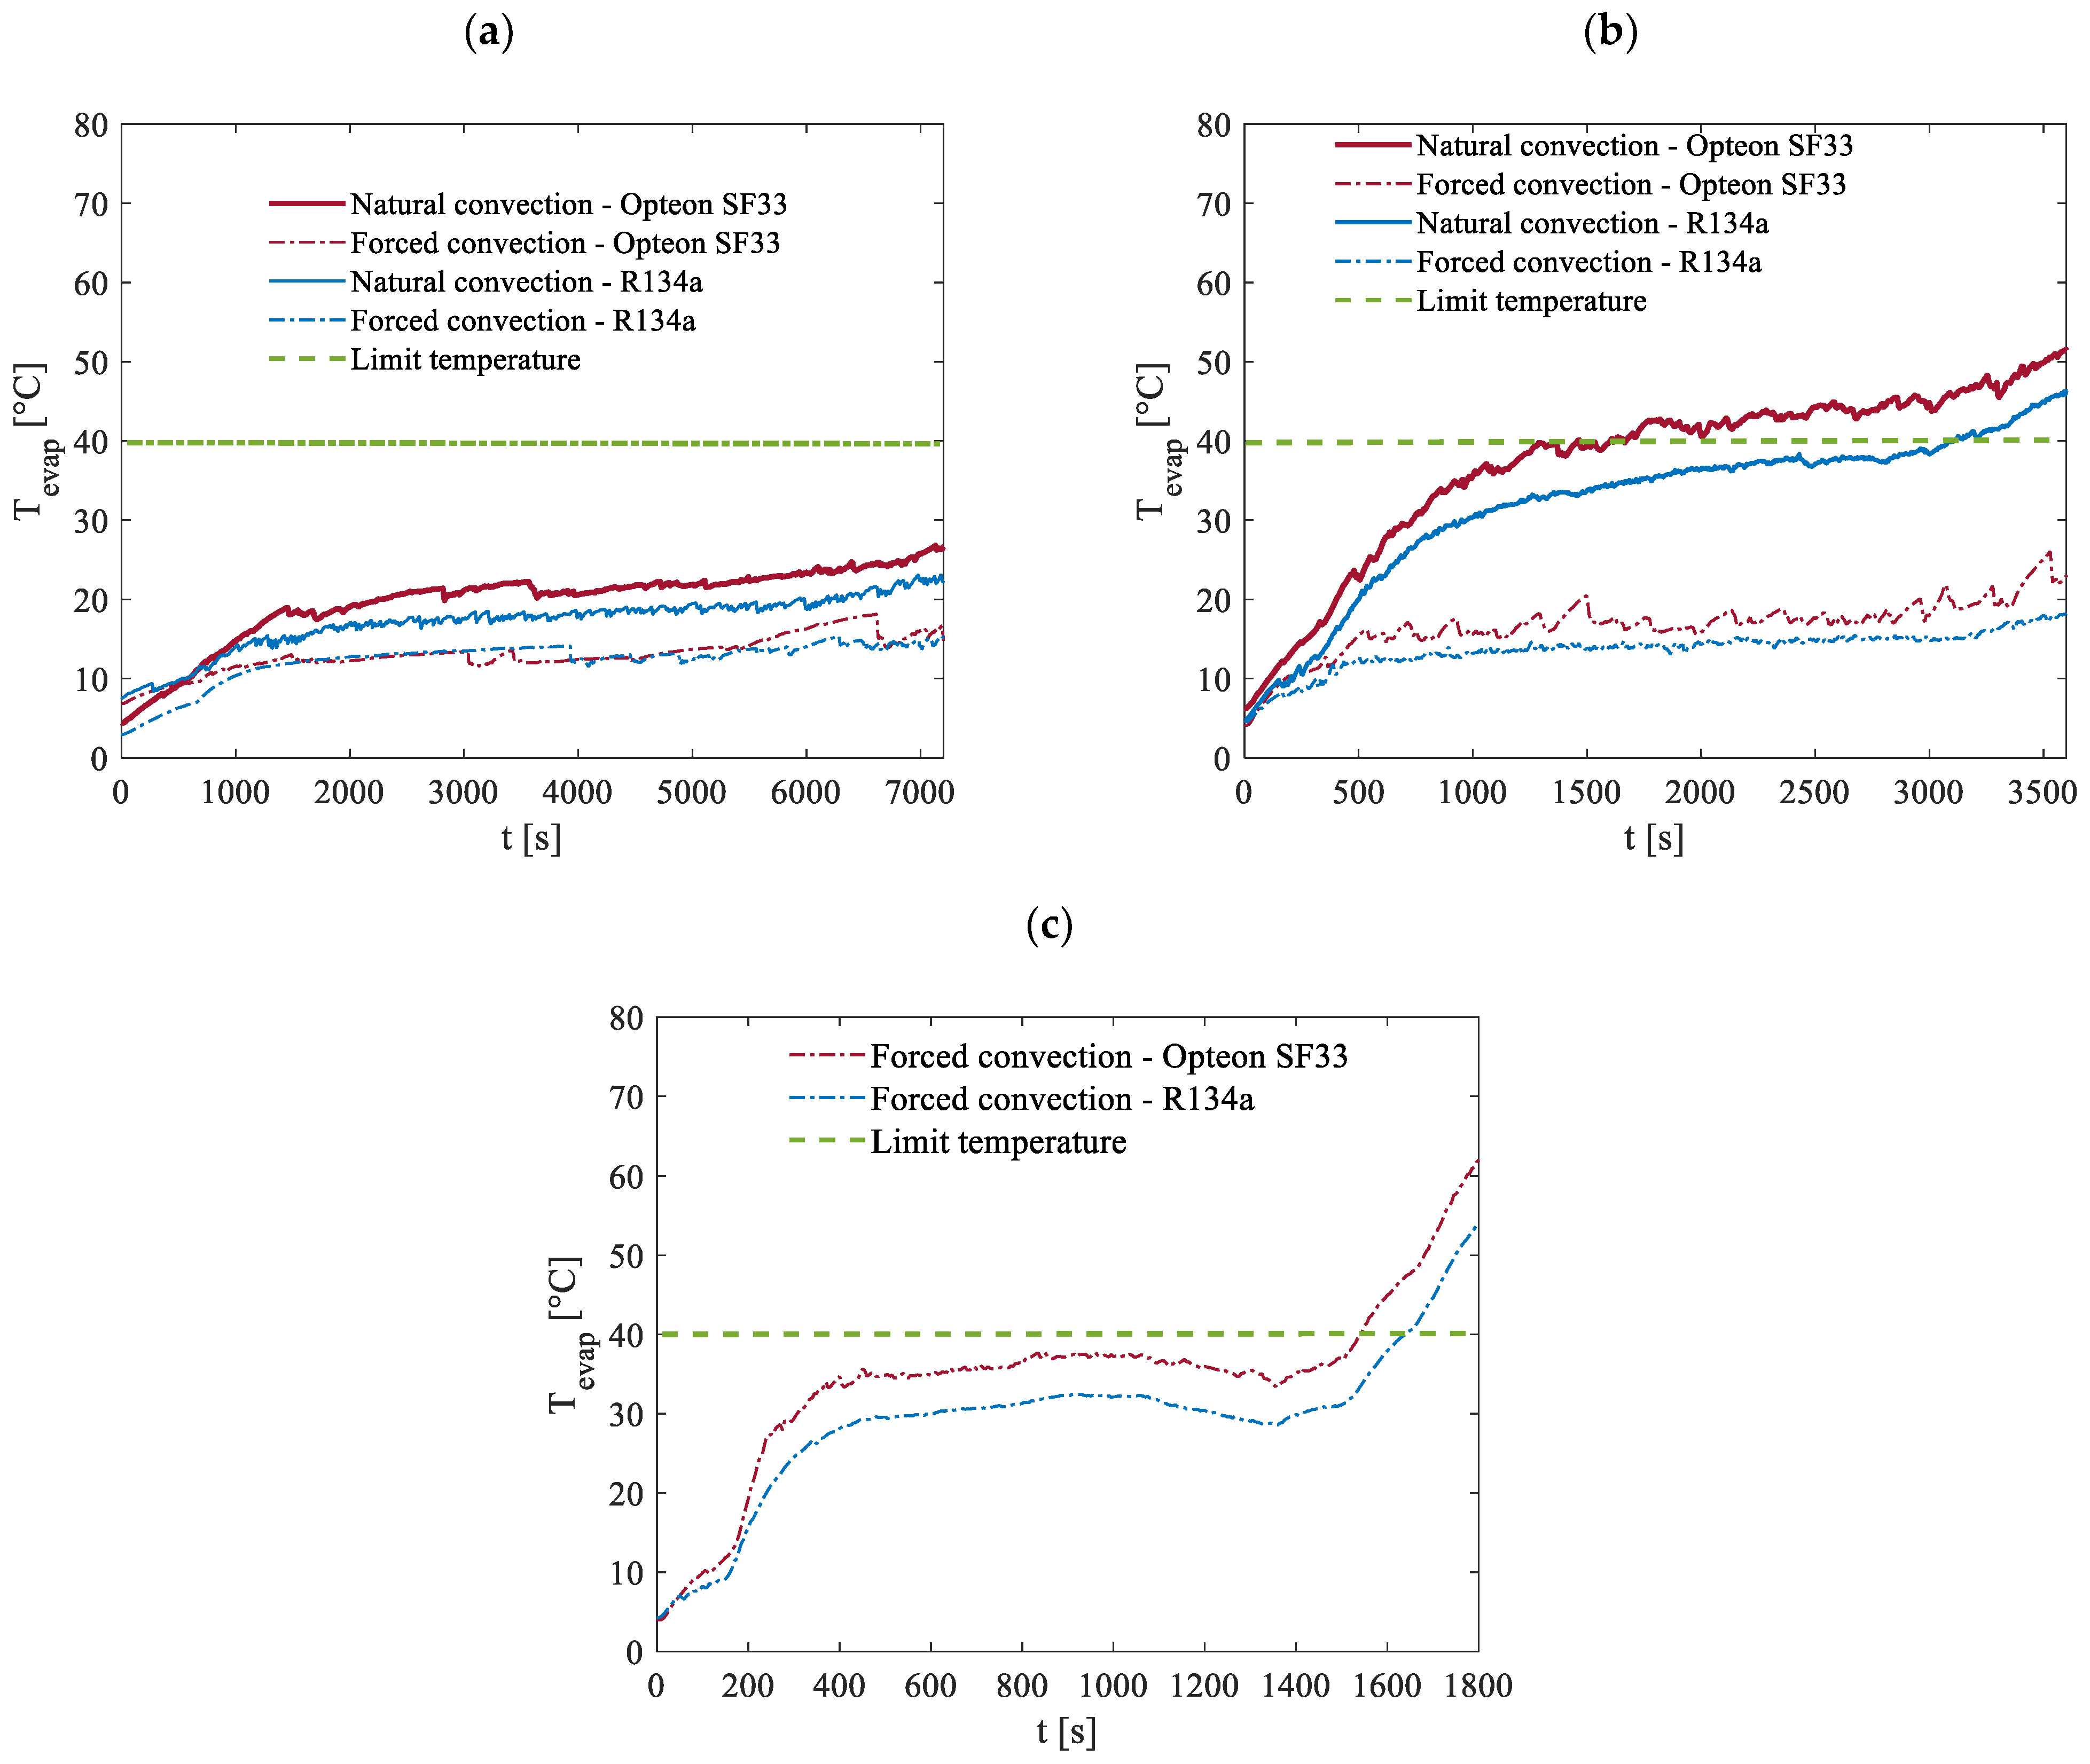
The maximum temperatures recorded at the evaporator during the tests conducted under an ambient temperature of 5 °C are shown in
Figure 17. Naturally, the reduction in ambient temperature plays a significant role in helping to maintain the battery temperature below the critical threshold of 40 °C. Under forced convection, this objective is achieved for both working fluids across all three discharge rates, except during the final 200 s of the 2C discharge process where the temperature slightly exceeds the limit.
The advantages of the lower ambient temperature are also evident in the case of natural convection. Specifically, the battery temperature remains below 40 °C throughout the entire 0.5C discharge process and for more than half of the 1C discharge process. These results clearly demonstrate the positive impact of the proposed device at these ambient conditions on the thermal management of the battery, even in less-efficient cooling scenarios like natural convection.
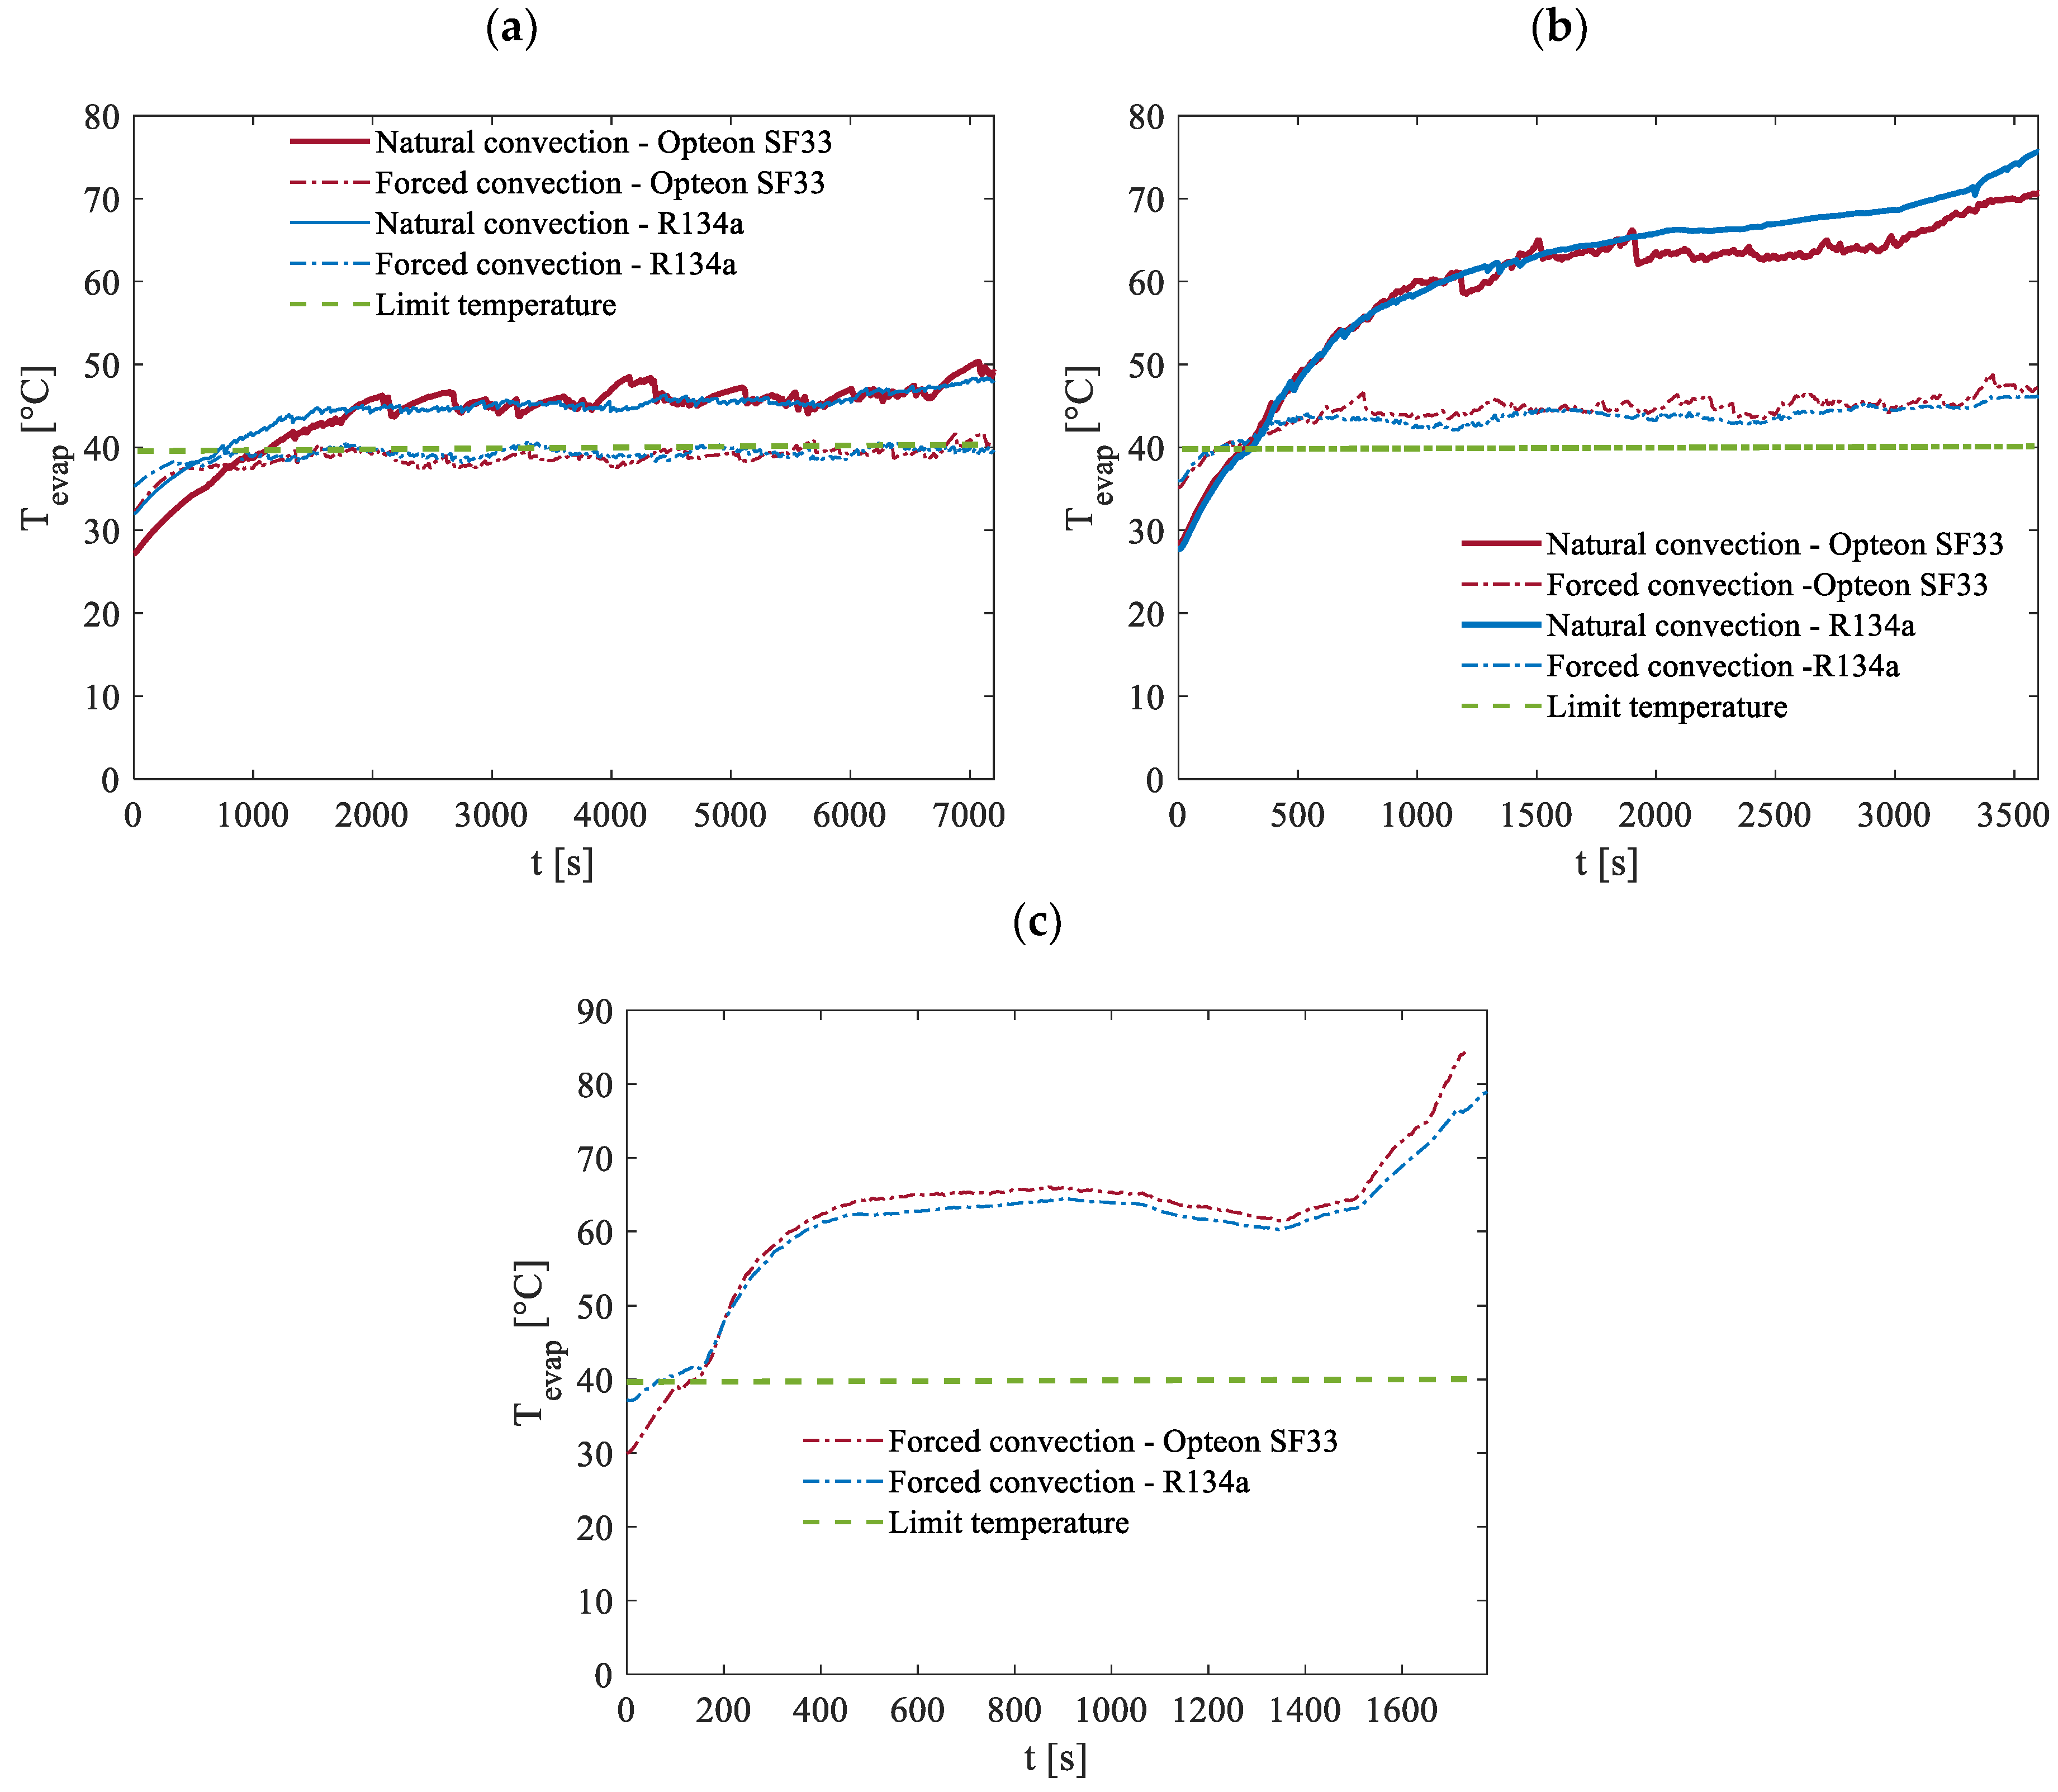
Conversely, raising the ambient temperature to 35 °C places the system under significantly more challenging operating conditions, as illustrated in
Figure 18. Under such circumstances, maintaining the battery temperature below the critical threshold of 40 °C becomes nearly impossible with natural convection alone. This limitation is particularly evident during the 2C discharge process, where even forced convection struggles to keep the temperature within safe limits. However, there are some notably positive findings. For the 0.5C discharge rate, the system successfully keeps the temperature below 40 °C when using forced convection. Additionally, during the 1C discharge rate, while the temperature slightly exceeds the threshold, the maximum temperature rise is limited to 9 °C for Opteon SF33 and 7 °C for R134a. These results are encouraging because, in most real-world scenarios, such as typical car operation, the battery is subjected to less demanding conditions than those simulated in the 1C discharge case for most of the working time. This suggests that the proposed thermal management system could meet the requirements under standard vehicle operating conditions.
Ultimately, the primary goal of the device introduced in this work is to deliver a reliable, energy-efficient, and entirely passive cooling solution for batteries across a wide range of operating conditions. To achieve this, it is essential to address the current limitation posed by the low heat transfer coefficient in the condenser section under natural convection. This can be accomplished by enhancing the heat exchange surface of the condenser. Such improvements are critical because the system must ensure the battery remains within its optimal temperature range even in scenarios where forced convection is unavailable. This requirement becomes particularly relevant during charging, a situation in which the vehicle is stationary, and airflow cannot be passively directed to the battery. Without a natural airflow source, a fan would need to be employed, which would result in additional energy consumption, contrary to the system’s passive design philosophy. One practical and straightforward solution to enhance the condenser’s performance is to increase its heat dissipation area by incorporating fins, as illustrated in
Figure 19. The introduction of an extended surface represents an additional weight on the system and so an optimization in the design of the fins is necessary. Furthermore, the integration of a finned surface with the coils of the PHP increases the complexity of the device as it requires careful attention to be paid to thermal contact continuity in order to minimize thermal resistance. Despite these considerations, this approach offers the potential for a significant improvement in thermal efficiency and ensures the device meets the stringent cooling requirements without relying on external power sources. Ultimately, it is important to emphasize that the integration of the proposed thermal management system within a vehicle remains a key aspect to be explored in future research activities. This will be approached from a product engineering perspective, considering that its dimensions are not expected to be significantly larger than those of current thermal management solutions—whether based on liquid cooling, which typically includes a battery case, fluid circuit, and radiator, or on air cooling, which involves a finned assembly. The revised setup (
Figure 19) will be analyzed in future research to assess its performance gains compared to the device presented in this study.


