Article

Automatic and Versatile Test Bench for Data Collection on Battery Cells

by
Esteban Marsal
1,†,
Nicolás Martínez
1,†,
Alfredo Pérez Vega-Leal
2,†,
Federico Barrero
2,*,†,
Mohamad Hamdan
1,† and
Manuel G. Satué
1,†
1
Systems Engineering and Automation Department, University of Seville, 41092 Seville, Spain
2
Electronic Engineering Department, University of Seville, 41092 Seville, Spain
*
Author to whom correspondence should be addressed.
Current address: Escuela Técnica Superior de Ingeniería, University of Seville, Camino de los Descubrimientos s/n, 41092 Seville, Spain.
Energies 2025, 18(9), 2304; https://doi.org/10.3390/en18092304
Submission received: 26 March 2025 / Revised: 13 April 2025 / Accepted: 28 April 2025 / Published: 30 April 2025
(This article belongs to the Section D2: Electrochem: Batteries, Fuel Cells, Capacitors)

Abstract

:
Rechargeable batteries are a key component of sustainable future systems, as their performance directly affects energy efficiency, maintenance costs, and system reliability. Assessing performance requires evaluating parameters such as the state of health (SoH) of the battery, which necessitates developing a system capable of efficiently gathering large amounts of data. This article presents a safe, simple, versatile, and automated system designed to test and characterize various types of battery cells. The system is conceived as a practical tool capable of automatically collecting the required data for analysis, thus enabling the determination of the performance parameters of a battery cell. The proposed system incorporates an innovative approach based on the concatenation of charge/discharge data, allowing for a more reliable evaluation of battery performance. Experimental tests show the interest and performance behavior of the proposed system.

1. Introduction

The transition from fossil fuels to natural energy sources and the growing global demand for sustainable energy solutions have led battery storage systems to gain research and industrial prominence [1]. The variability of renewable energy systems and their unpredictable performance, with a high dependence on weather conditions, make battery storage systems essential to ensure the stability of modern electrical grids [2]. Among the available storage technologies, lithium ion batteries improve the overall utilization and useful life of renewable energy due to their high energy density and efficiency, as well as their low self-discharge rate [3]. Their inherent characteristics, coupled with advances in power management strategies, have solidified their reputation as a reliable and cost-effective energy storage solution [4]. However, despite their benefits, these batteries degrade over time because of factors such as loss of active materials or a reduction in lithium inventory [5,6]. The degradation mechanisms affect their capacity and life span, and therefore new developments in battery design or management strategies must be developed to optimize battery cell performance and longevity [7].
A typical energy storage system consists of multiple battery cells that, despite manufacturers’ standardization efforts, may still operate under different conditions. This is the case in electric batteries based on lithium-ion battery cells, where varying effects depending on their application appear during continuous charge and discharge cycles [8]. To minimize these inconsistencies, it is essential to monitor and control the charging and discharging of each cell by measuring or estimating key variables such as voltage, current, and temperature. Comparing these variations with the overall performance of the system enables a more efficient energy management, ensuring reliable energy utilization [9].
The state of health SoH is the most critical indicator of battery degradation [10]. It can be estimated through continuous monitoring of the voltage, current and temperature using different alternatives as summarized in [11]. One of the simplest approaches is direct measurement, which assesses SoH on the basis of capacity transfer during charge and discharge cycles or by calculating the resistance from voltage drops. This method is straightforward, easy to implement, and enables real-time monitoring without the need for complex models or predictive algorithms [12]. Considering the importance of data availability and quality in SoH estimation, all methods for SoH estimation benefit from extensive data sets that capture various battery charge and discharge scenarios. Reliable data collection, covering varying operating conditions, ensures accurate SoH estimates. A versatile and automated test bench can effectively tackle this challenge by replicating charging and discharging cycles while enabling precise control and measurement of electric battery performance. Moreover, it enhances safety and extends service life through continuous monitoring and early failure detection, including overvoltage, undervoltage, and high-temperature measurements. Real-time data acquisition and logging provide deeper insights into performance and degradation factors, contributing to more effective battery management strategies [13]. However, implementing such a system poses several challenges, particularly in maintaining precise control over parameters such as voltage or current [14].
Many battery testing benches already exist and have been presented in different recent research works. For example, in [3], a trial system is proposed with the capacity to monitor the critical parameters of the battery cells. The proposal provides automated charge, discharge, and relaxation cycles, although it offers a limited number of configurations. It is based on open-source control software and is cost-effective, but the system is customized with a particular microcontroller, that lacks versatility because it is not easy to reproduce the proposal and it cannot test large battery banks or handle high current and voltage. A different test bench for specific aerospace applications is detailed in [8], where the battery cell is reproduced with a hardware in the loop technique. The proposal is not versatile due to the difficulty of reproducing the initial complex configurations of the system. The authors also report bugs in the software provided. In [3], a test bench that includes a set of procedures to investigate the performance of customized battery cells is presented, where a LabVIEW interface allows test selection, voltage and output control, real-time monitoring, and cutoff adjustment, supporting safety operation of the system. However, due to the programmable resistive load used, only a limited number of tests can be performed. Then, the versatility of the test bench provided is somehow doubtful. Finally, particular test benches are detailed in [15,16], where the works focus on the variable temperature control of individual cells in a battery pack and on the failure mechanisms that govern the durability of lithium-ion pouch cells under vibration. Both works present specific and customized test benches, with limited versatility.
This article presents an automated, controlled data acquisition system for testing lithium-ion batteries. The system incorporates an innovative approach based on the concatenation of charge/discharge data, enabling reliable evaluation of battery performance. It supports fully automated charge, discharge, and relaxation cycles, offering a high degree of configurability and versatility. The platform is easy to replicate, applicable to both individual battery cells and battery packs, and is not restricted to any specific application. Battery functionality is validated through continuous monitoring and recording of voltage, current, and temperature during charge-discharge cycles. This allows for accurate performance evaluation without the need for complex modeling. Users can define voltage and current limits, program automatic cycling routines, and access the collected data. Data is stored in a common format and hosted in an open-access repository, thereby contributing to ongoing research and development in the field. Overall, the proposed system provides an efficient and adaptable solution for battery monitoring and management, representing a valuable tool for future research and practical applications. The paper is structured as follows. Section 2 summarizes the fundamentals of how a lithium ion battery normally works, describing the charge and discharge processes. Section 3 describes the proposed battery test bench, detailing the designed hardware and application software. Section 4 describes some experimental procedures performed to validate the system, including the realization of charge-discharge cycles and the analysis of the collected data for the estimation of the SoH parameter. Conclusions are summarized in the last section.

2. Basics of Lithium-Ion Battery Degradation and Operation

SoH is defined as the ratio between the maximum capacity achieved during a charge or discharge cycle (Co) and the initial capacity of the battery (Ci), typically expressed as a percentage: SoH (%) = (Co/Ci) × 100. The development of SoH estimation methods for lithium-ion batteries has undergone significant transformation over the years, see Figure 1, driven by advances in battery technology, computational techniques, and data availability [17].
Although a common used approach is the direct and empirical method (previously referred to as direct measurement technique in the Introduction section), alternative techniques such as coulomb counting [18], internal resistance monitoring [19], and electrochemical impedance spectroscopy (EIS) [20] are used in laboratory environments as well. These methods also offered high accuracy under controlled conditions by directly measuring capacity fade or increases in internal resistance, both of which are indicative of battery aging [19]. However, despite their simplicity and physical interpretability, they proved impractical for real-time or field applications. For example, Coulomb counting requires full charge–discharge cycles and is prone to integration errors, while internal resistance is sensitive to temperature and load variations [21,22]. EIS, on the other hand, requires specialized equipment and stable environments. As a result, these methods were mainly limited to offline diagnostic [23].
Subsequently, the physics-based modeling technique was introduced to address the growing need for real-time SoH estimation in increasingly complex battery systems such as those found in electric vehicles and portable electronics [24]. These methods included electrochemical models and equivalent circuit models (ECM), which describe battery behavior using electrical analogs [25]. ECM became especially popular due to their simplicity and ease of implementation. Tracking changes in circuit parameters over time makes possible to estimate SoH, as stated in [21]. ECM provided more detailed information on internal degradation mechanisms, but they posed significant computational challenges and required precise parameter identification [26].
To improve robustness and adaptability, researchers then turned to stochastic estimation and filtering techniques, such as Kalman filters (extended, unscented, and others) and particle filters [17,27]. These methods enabled real-time estimation of battery states, including SoH, even in the presence of noisy and incomplete sensor data [28]. Stochastic filters adapt to varying operational conditions, manage measurement noise, and continuously update model parameters [29]. However, its effectiveness heavily depends on the accuracy of the underlying battery model and can entail high computational costs, particularly for nonlinear or high-dimensional systems [25].
Some researchers have explored the interest of so-called curve analysis techniques, including incremental capacity and differential voltage analysis methods (ICA and DVA, respectively) [30]. These techniques analyze voltage and capacity curves, particularly their time derivatives, to detect shifts related to degradation phenomena, such as loss of lithium inventory or active material. ICA and DVA provide valuable information on the internal condition of a battery without requiring full discharges. However, they are sensitive to noise and demand high-resolution data, limiting their practicality for real-time applications [17].
An interesting approach comes with the data-driven revolution technique, marked by the rise of machine learning (ML) methods. Algorithms such as support vector machines, random forests, artificial neural networks, deep learning models such as long short-term memory or gated recurrent units are also applied to large-scale battery datasets [31]. These approaches are capable of modeling complex and nonlinear relationships between input signals (voltage, current, temperature) and SoH, achieving high predictive accuracy and enabling real-time integration within battery management systems [18]. However, they require large and diverse data sets for effective training and often lack physical interpretability [32]. Issues such as overfitting and limited generalization remain today as ongoing challenges [33]. Ongoing challenges have also shifted toward hybrid and physics-guided approaches, which aim to combine the advantages of model-based and data-driven methods. These include physics-informed machine learning [34], multimodel ensemble learning [28], and hybrid filtering techniques [27]. Likewise, combining Kalman filters with ML models yields robust and adaptive estimation systems [24]. Although many of these methods are still under development, they hold significant promise for deployment in real-world applications, offering a compelling balance of accuracy, interpretability, and computational efficiency [22]. The pros and cons summary of the SoH estimation methods is detailed in Table 1.
There are several methods for charging and discharging lithium-ion battery cells, and choosing the right one greatly affects performance, lifespan, and safety. According to [35], three common charging methods are constant current-constant voltage (CC-CV), constant loss-constant voltage (CL-CV), and constant power-constant voltage (CP-CV). Among these, the CC-CV method is widely used due to its simplicity, reliability, and efficiency [36]. It helps reduce lithium plating and thermal problems, improves capacity retention, and allows accurate monitoring of the SoH of the battery.
The CC-CV method starts with a CC phase, where the battery charges at a fixed current until it reaches a set voltage. Then, it switches to a CV phase, where a constant voltage is applied while the current gradually decreases [37]. In comparison, the CL-CV method adjusts current based on battery impedance to control heat generation, while the CP-CV method keeps power constant before switching to CV mode.
In our case, a CC-CV charging method is applied with an initial charging stage at CC. During this initial stage, the battery voltage increases as it accepts charge. When the battery reaches a predefined voltage value, the charging continues using a CV, causing a gradual reduction in the charging current as the battery approaches full capacity. This process is illustrated in Figure 2. The procedure ends when the current reaches a certain lower threshold, known as the minimum charging current point, which is set to 0.5 A.
The discharging process consists of a continuous discharge at a predefined current. During discharge, the voltage remains nearly constant for most of the time before gradually decreasing. The discharge stops when the voltage reaches a predefined lower threshold, referred to as the minimum discharge voltage point. This behavior is depicted in Figure 3, where the minimum voltage is set to 2.5 V.

3. Proposed Framework for Testing Lithium-Ion Batteries

The proposed test bench is designed to perform charge and discharge cycles on individual battery cells. Although its scalability allows for the extension to a maximum number of cells, where the total charging voltage for series-connected cells can reach up to 20 V, and the maximum charging current for parallel-connected cells can reach up to 30 A, in a single battery pack. The main hardware components are the following:
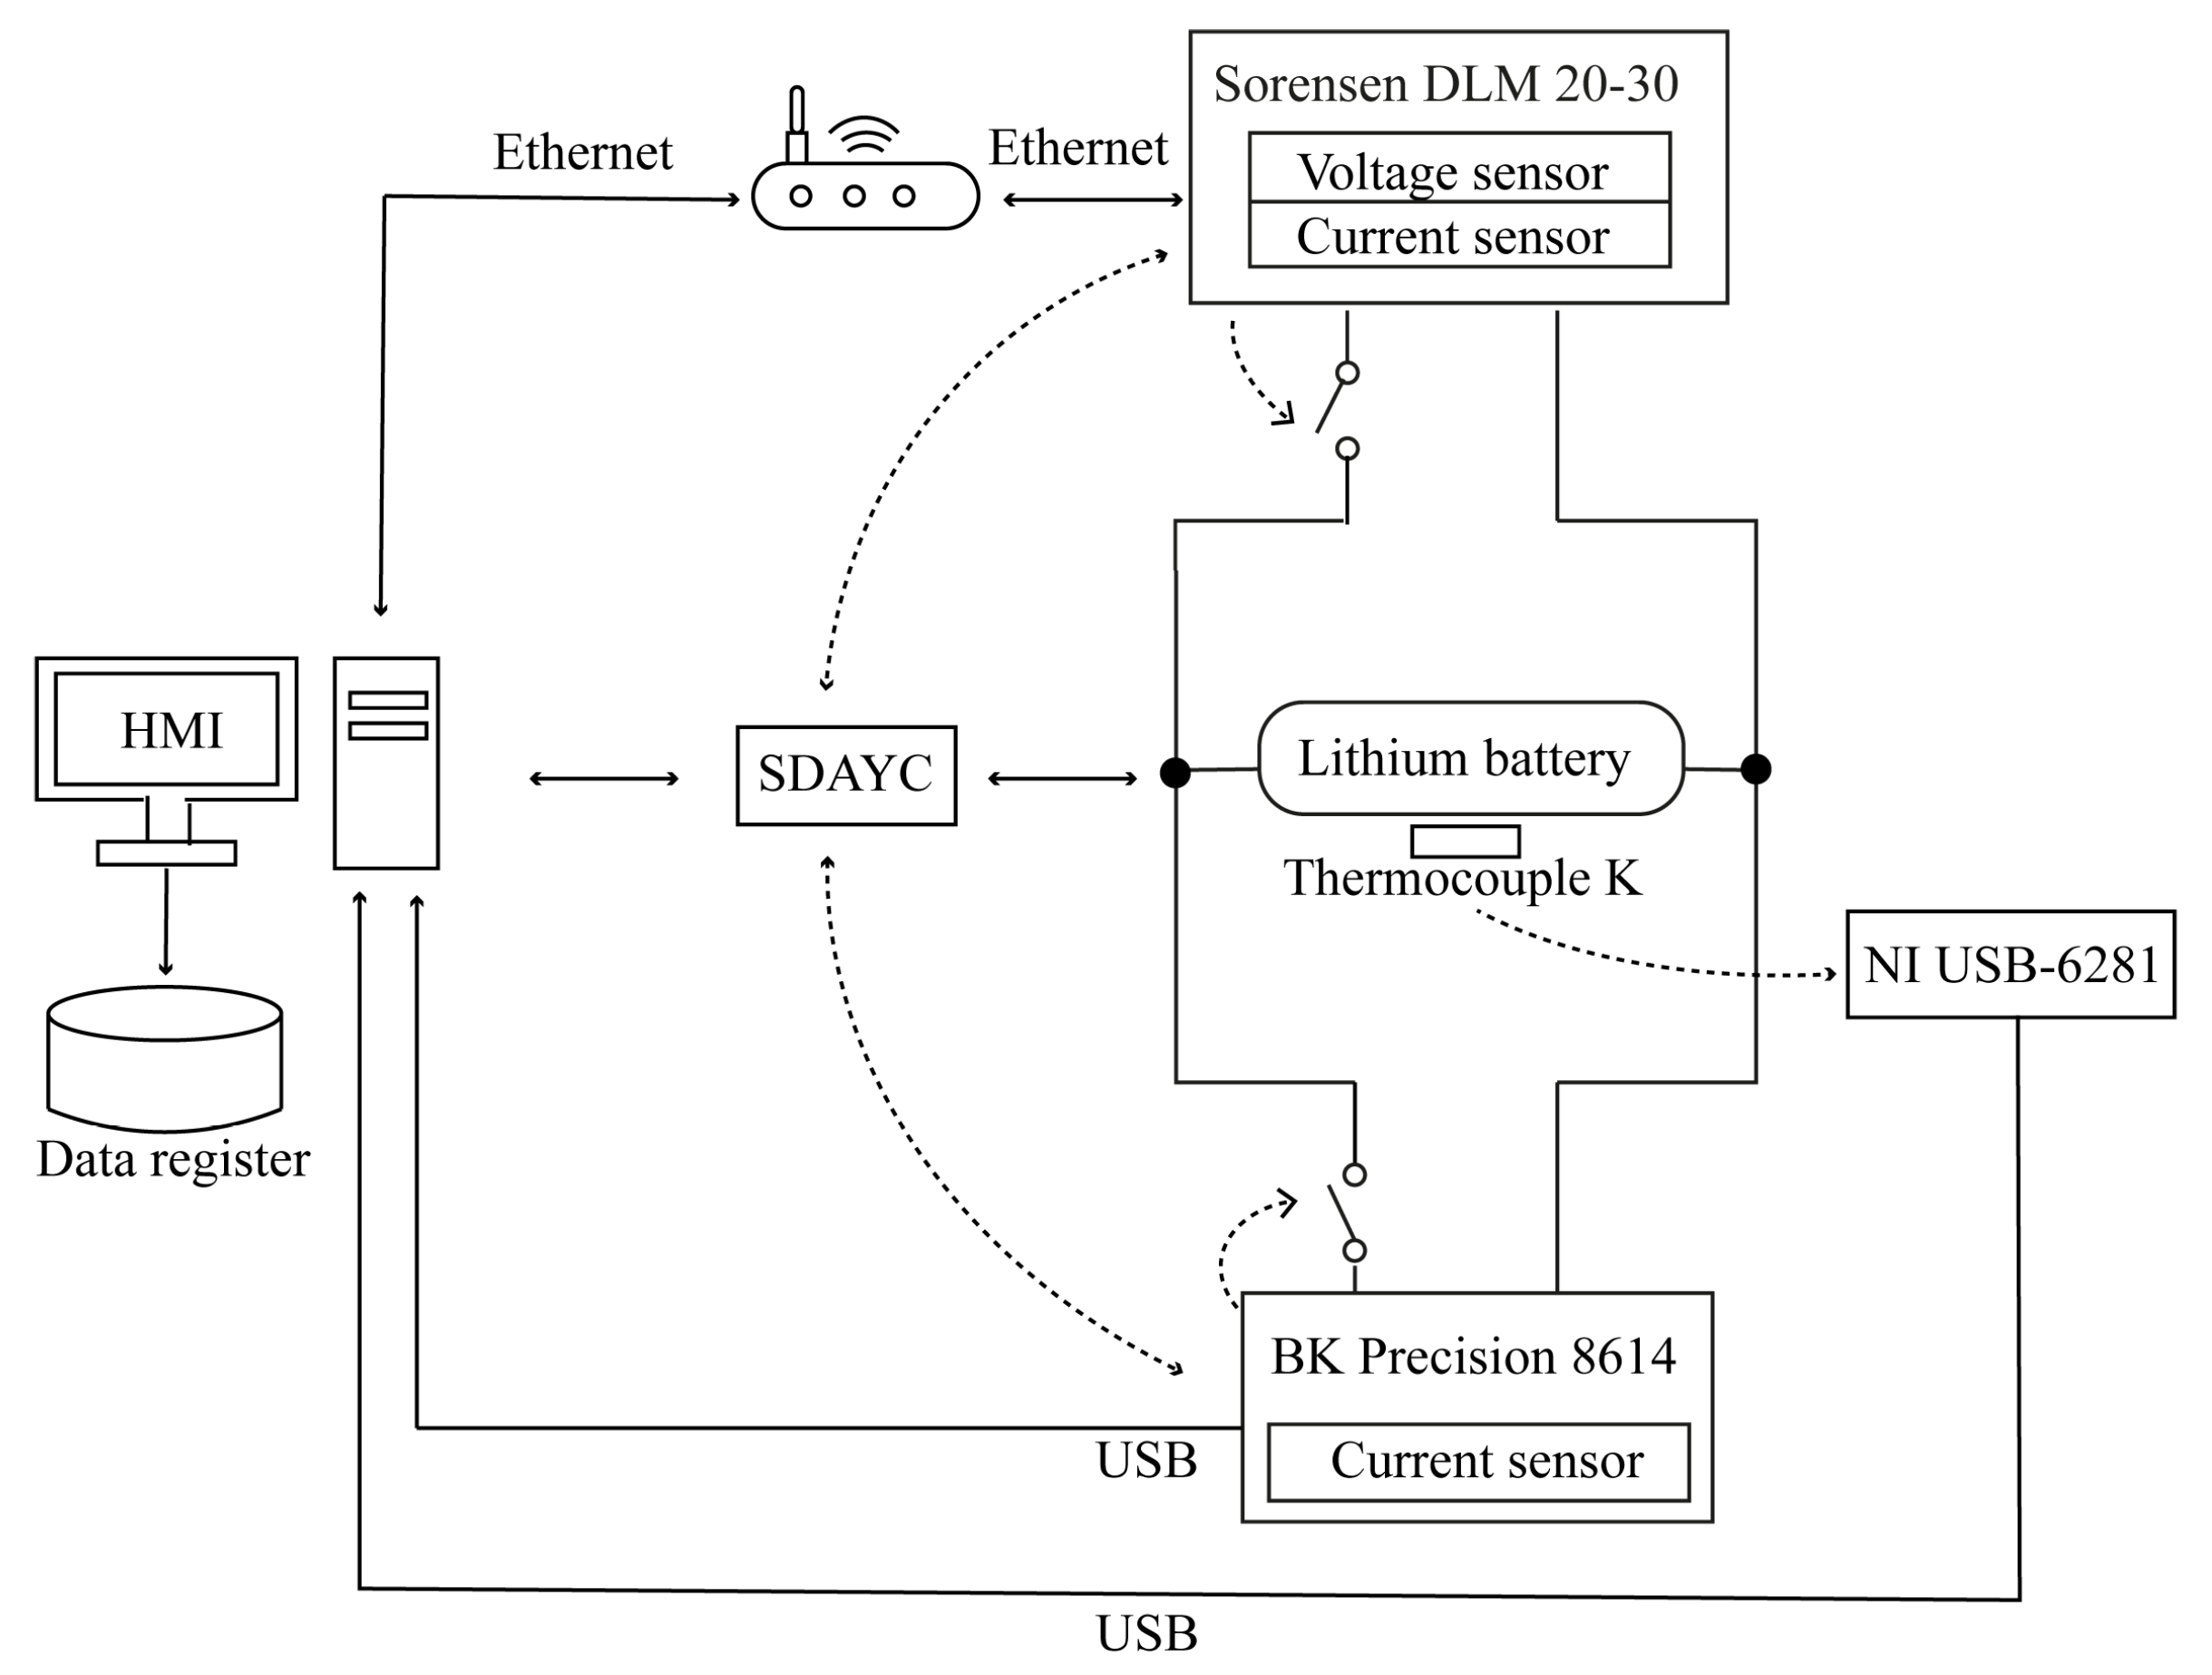
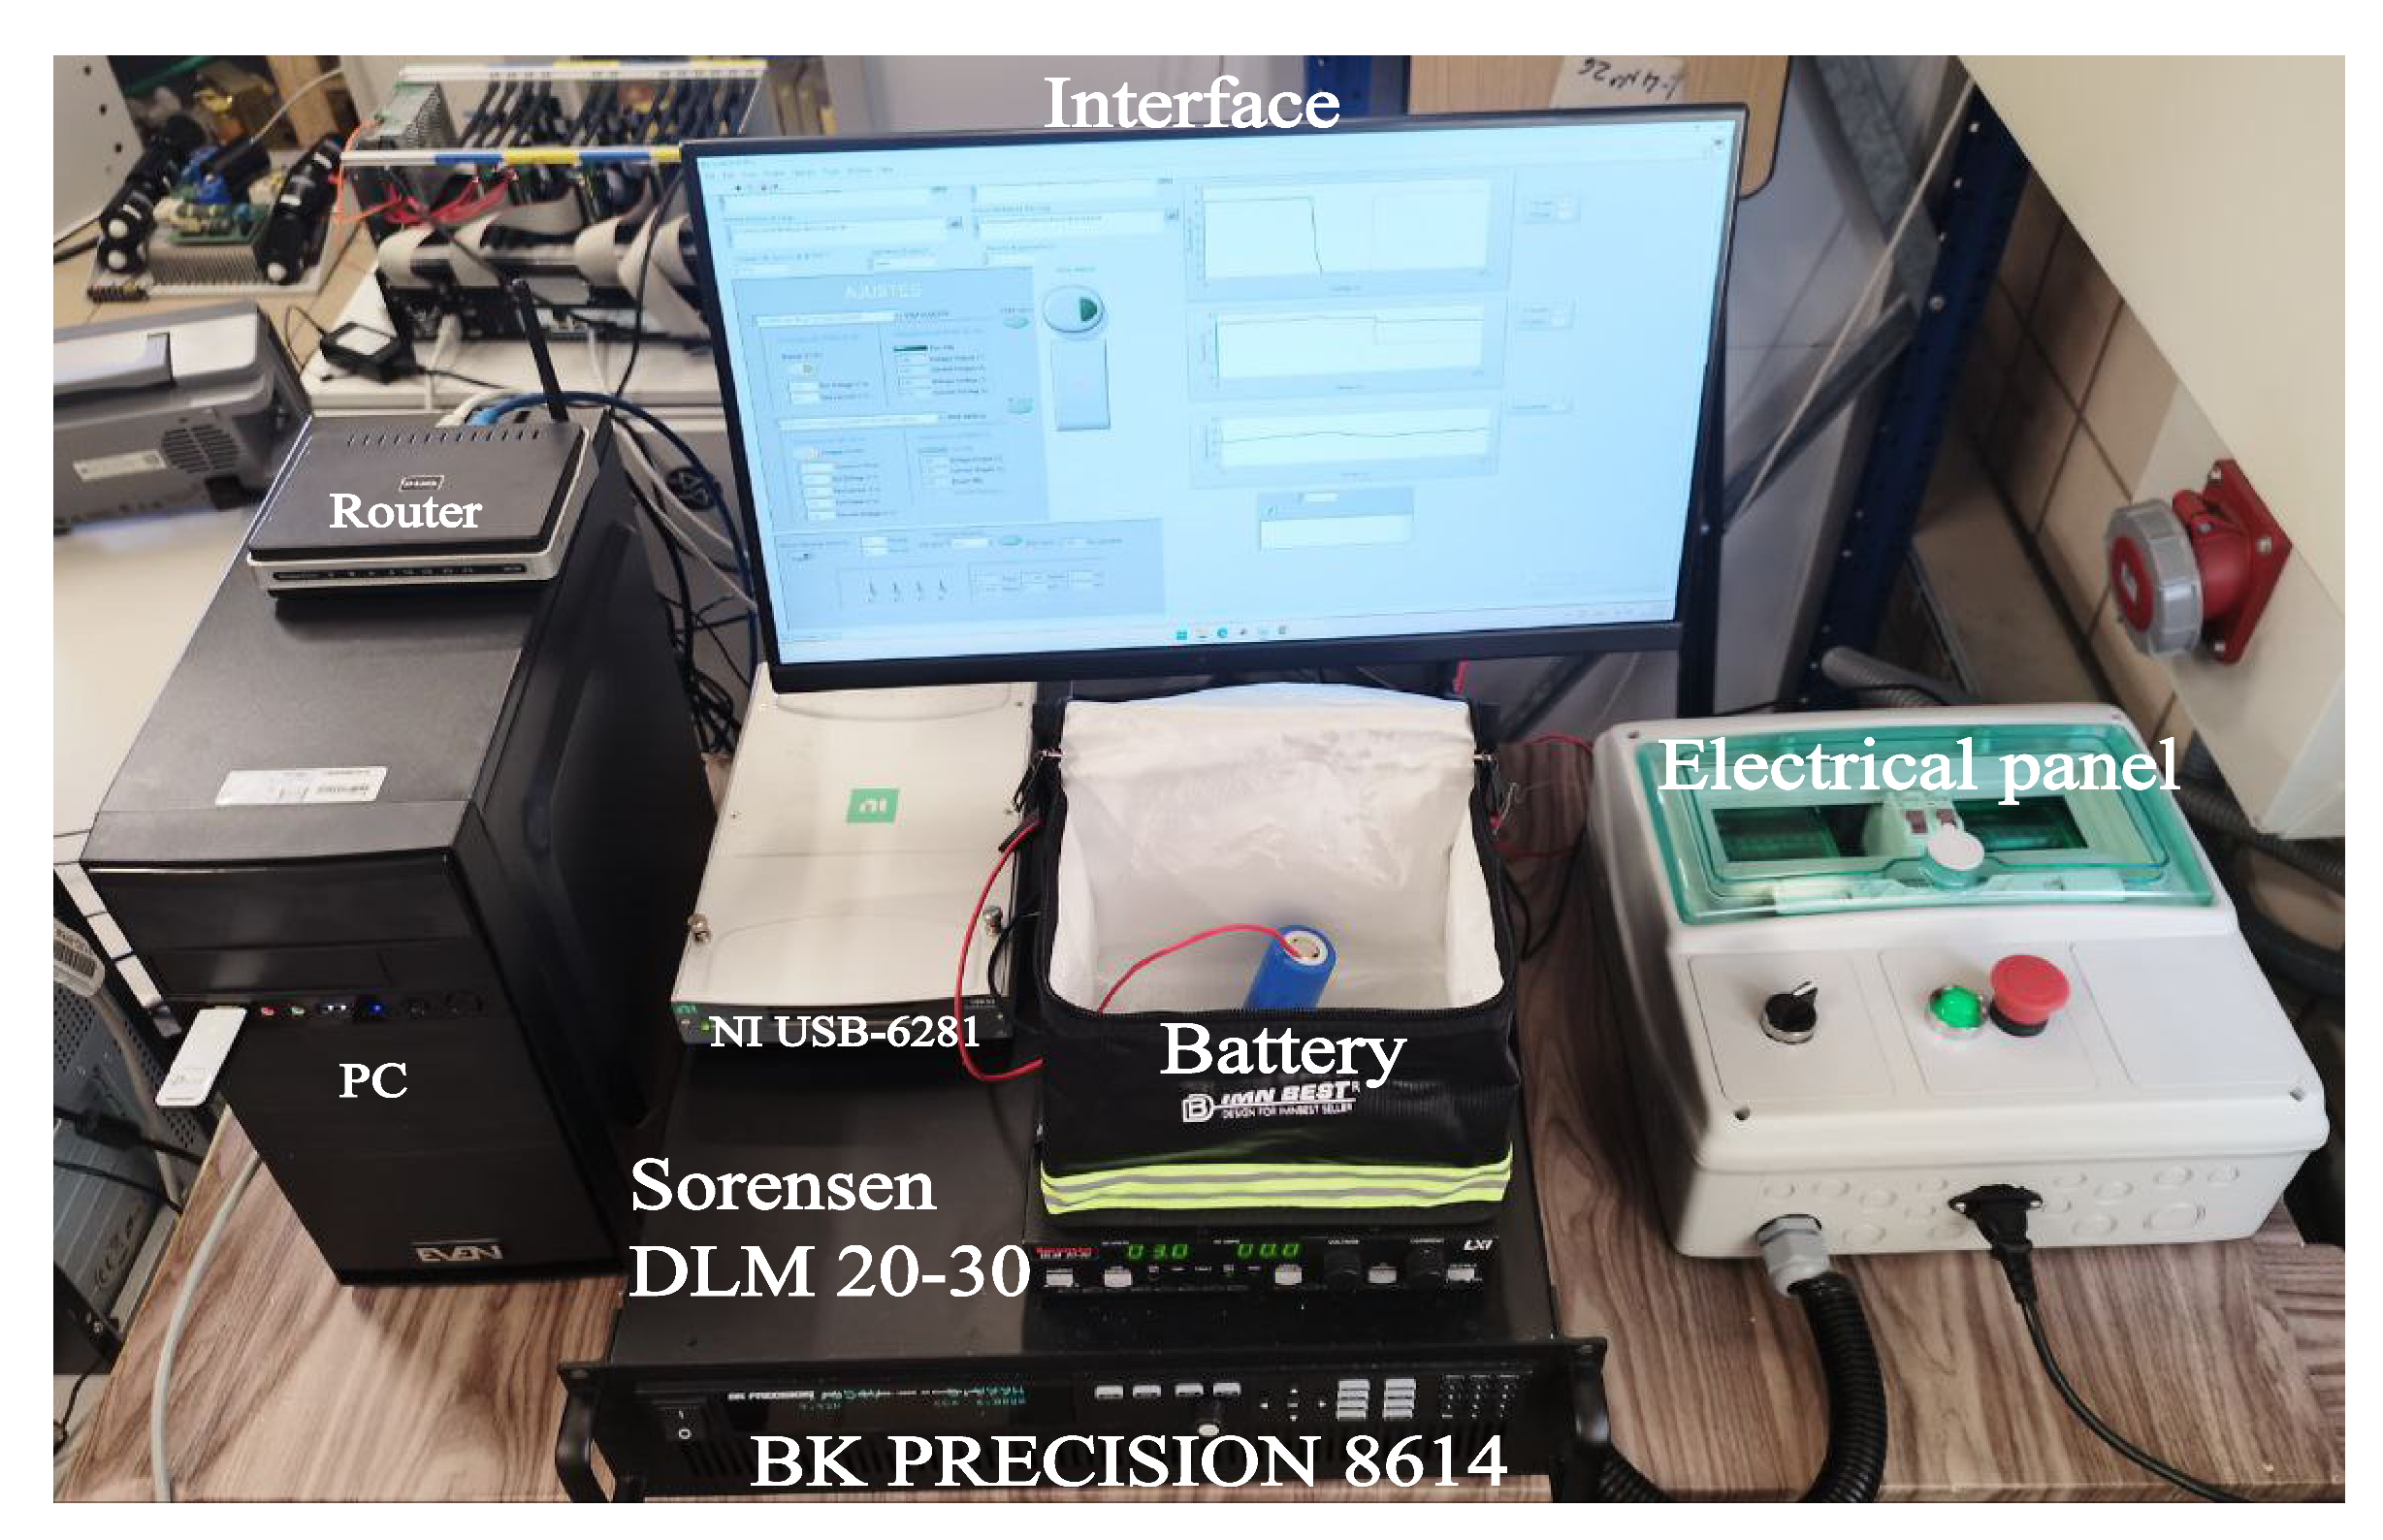
  • Personal Computer: manages and controls the test bench.
  • Power Supply: Sorensen DLM20-30, AMETEK, Inc., Berwyn, PA, USA (600 W), providing the necessary testing voltage. The system can handle the voltage and current required by the single battery pack (up to a maximum of 20 V and 30 A supplied by this electronic equipment). This is a major limitation of our system. Higher voltage or current testing values require another power supply.
  • Router: D-Link D-300, D-Link Corporation, Taiwan, facilitating communication between devices.
  • Electronic load: B&K Precision 8614, B&K Precision Corporation, Yorba Linda, CA, USA, designed to emulate battery charge and discharge conditions by dynamically adjusting voltage and current parameters. This allows accurate characterization of battery performance under various load scenarios.
  • I/O Device: National Instruments USB-6281, Emerson Electric Co., St. Louis, MO, USA, serving as the test bench’s monitoring platform. It enables battery temperature measurement and allows system expansion by integrating additional relays and external monitoring devices.
  • Thermocouple: K type, ensuring accurate thermal monitoring by measuring battery temperature during analysis.
These components are interconnected, as shown in Figure 4, which presents the schematic diagram of the developed system. The test system connects the battery in parallel with the power supply and the programmable electronic load. The thermocouple is positioned at an intermediate point on the external casing of the battery to monitor temperature variations. The power supply is integrated into the system via a local area network with Ethernet connectivity. The router dynamically assigns an IP address to the power supply through the Dynamic Host Configuration Protocol. A photo of the test bed, where all the components are identified, is shown in Figure 5. During charge and discharge cycles, the system captures current values using the internal sensors of the power supply (for charging) and the programmable load (for discharging). The voltage across the battery terminals is measured using the voltage sensor of the DLM20-30 power supply. Additionally, the thermocouple is connected to an analog input of the NI USB-6281 device, allowing for precise thermal data acquisition.
The main characteristics of the software tool developed to control the test bed are the following:
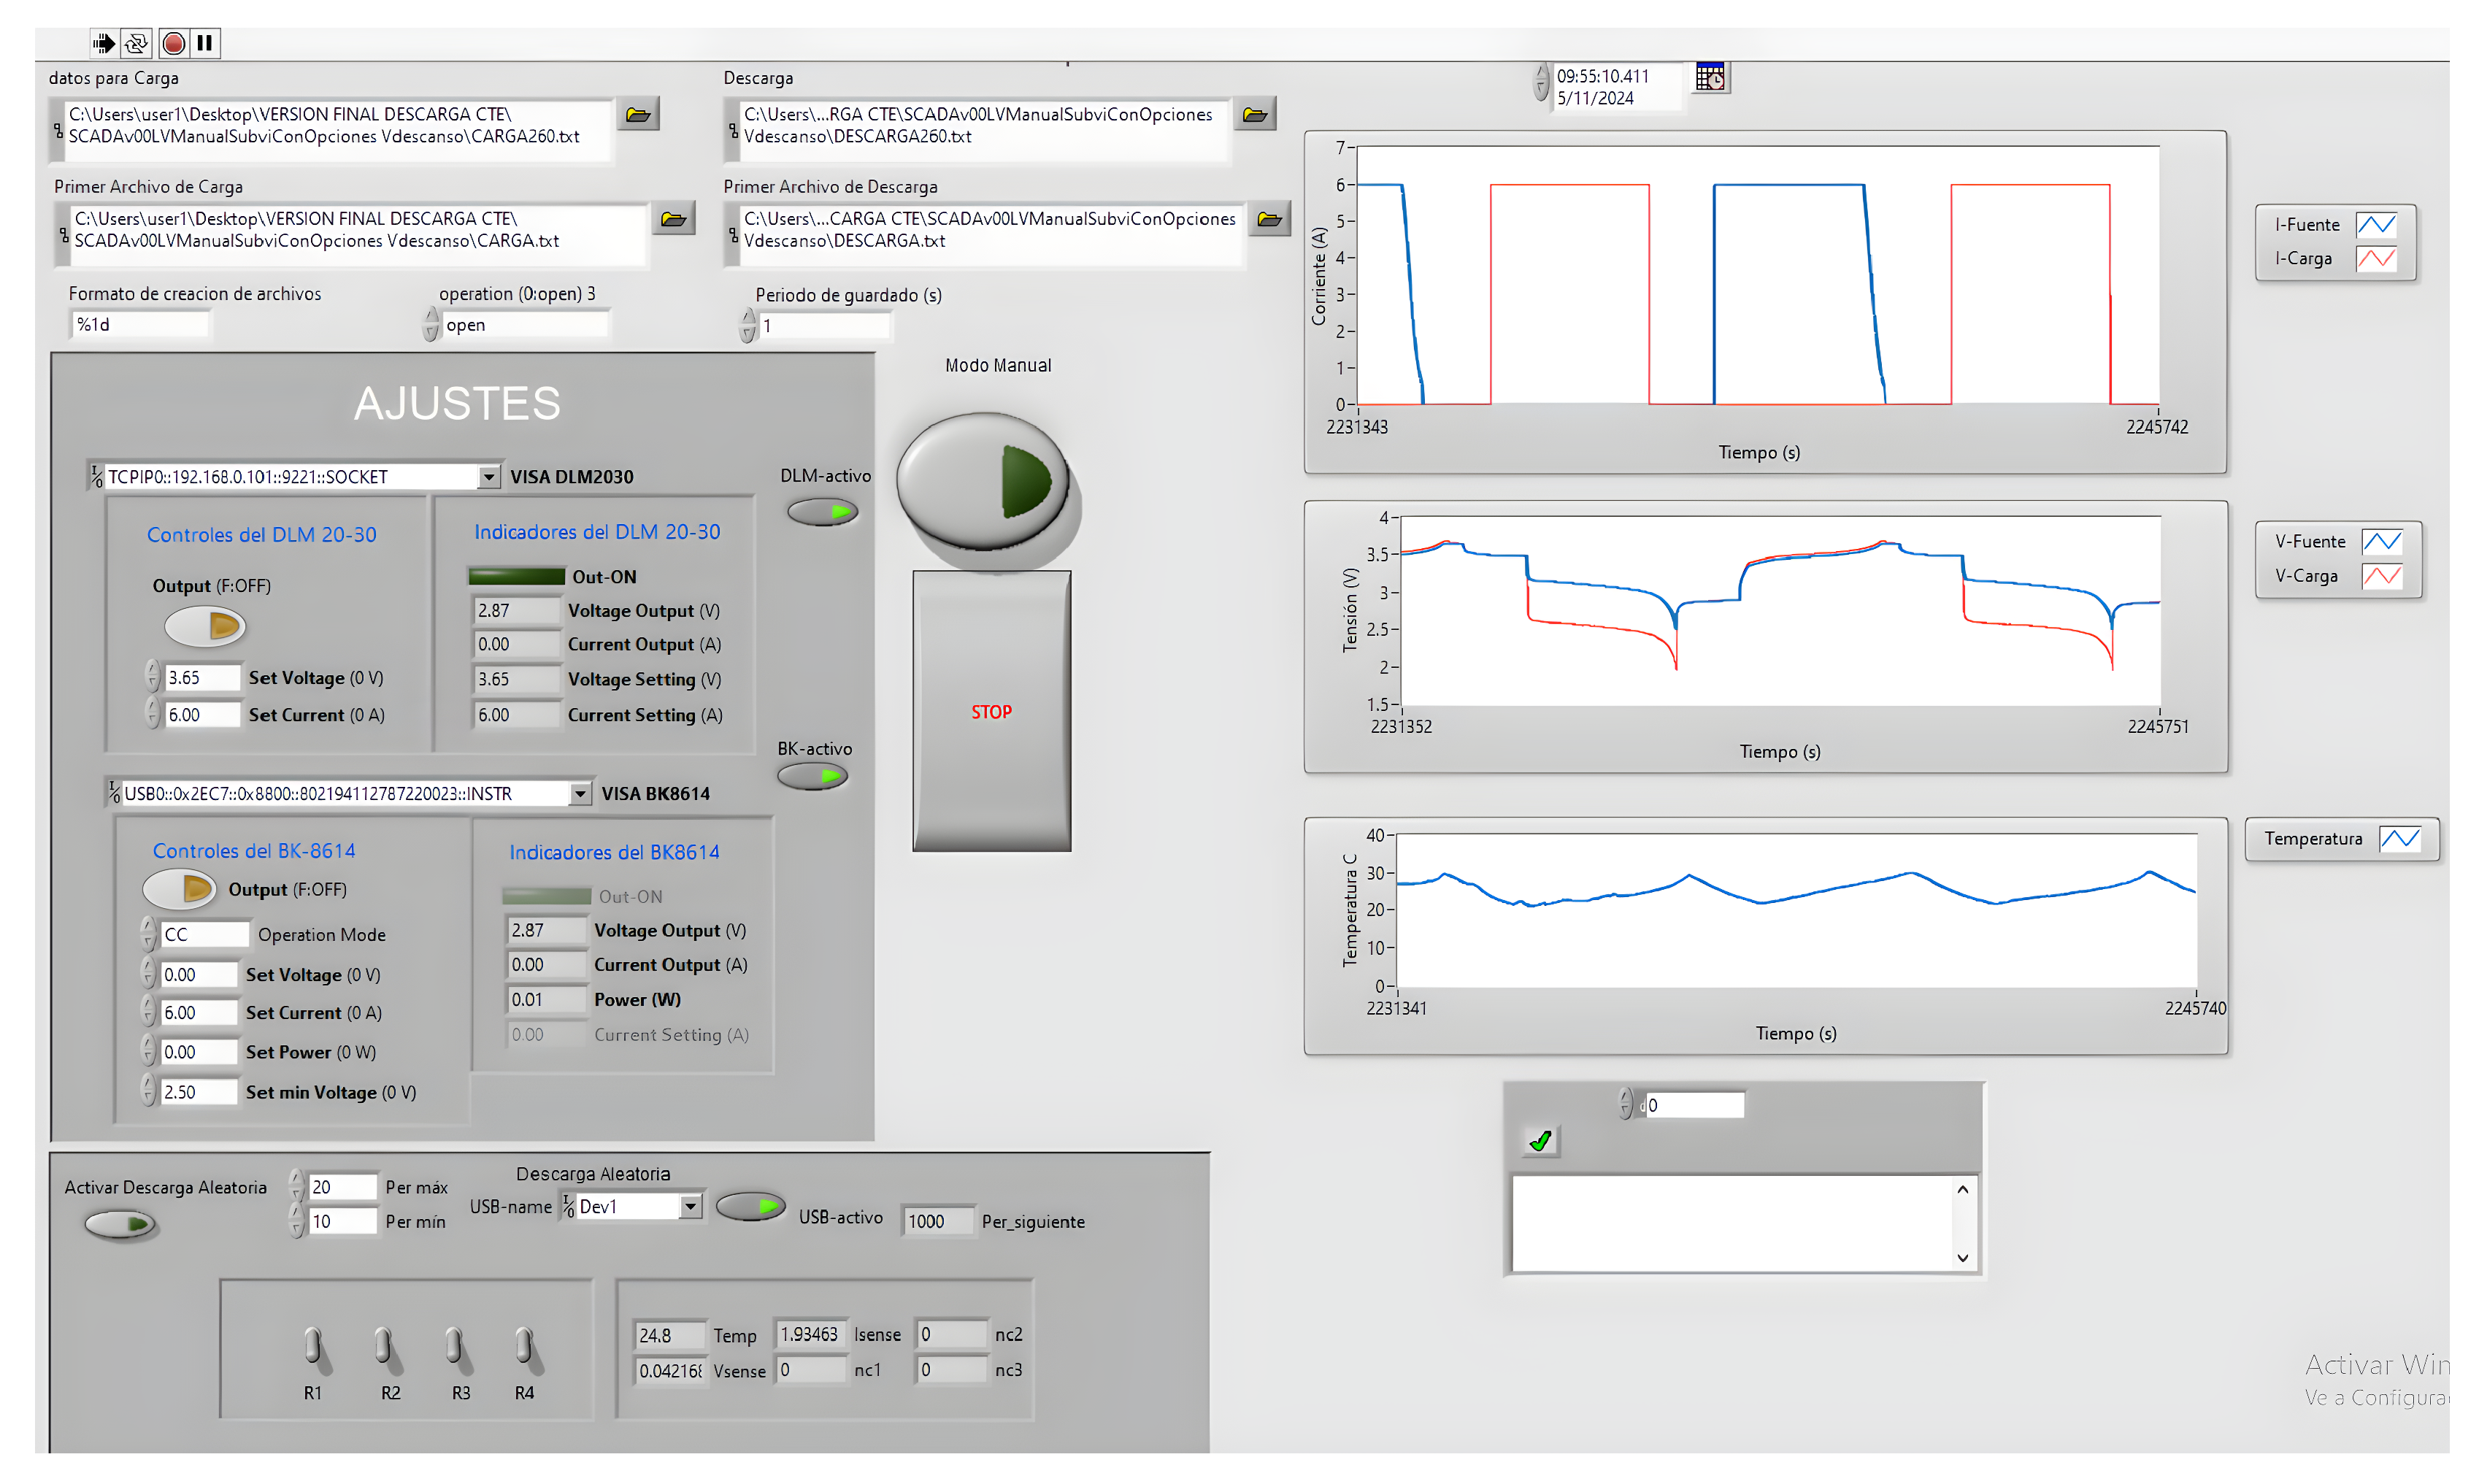
  • It uses a LabVIEW environment to control and monitor the test bench. The developed software package allows the programming of charge and discharge cycles, real-time tracking of battery parameters, and data storage in plain text format for further analysis.
  • Python (version 3.12.7) was used to develop a post-processing data tool and generate graphical representation of the results obtained.
The acquisition and control system (SDAYC from now on for simplicity) was developed in the LabVIEW graphical programming environment. This system enables control of both the power supply and the programmable electronic load. In addition to its control functions, SDAYC provides real-time monitoring of voltage, current, and temperature, allowing for a comprehensive analysis of the battery’s performance during testing. Figure 6 presents the SDAYC interface developed in LabVIEW. This interface not only controls the test bench but also facilitates real-time data acquisition from the battery under analysis.
The SDAYC includes two operating modes: manual and automatic. In manual mode, the user can access the front panel Figure 6 to manually perform charging and discharging operations. In this mode, specific parameters, such as charging voltage, charging current, and discharging current, can be adjusted at any time according to the requirements of the desired experimental process. In automatic mode, the user initially sets the values for charging voltage, charging current, discharging current, minimum discharge voltage, and data export time period in seconds. The minimum charging current is fixed at a constant value of 0.5 A. Once these parameters are configured, the program continuously executes charging and discharging operations until the user decides to end the process. In this mode, the charging process automatically stops when the current drops below 0.5 A, while the discharging process ends when the voltage reaches the predefined minimum discharge value. In addition, a resting period of 20 min is incorporated between each charge and discharge cycle, ensuring that the battery cools down properly before starting a new cycle. In automatic mode, two new independent text files are generated for each completed cycle: one for charging and the other for discharging. This means that every time a new charging or discharging period starts, the system automatically generates the corresponding files and begins recording data in them, depending on the process being carried out. Additionally, the SDAYC incorporates an interruption system that continuously monitors parameters such as temperature and cell voltage. If any of these values exceed an established range or if a manual stop button is pressed, the program is automatically interrupted to ensure system safety and protect the battery. In Figure 7, the general logic of the developed software is shown. In both operating modes, the following parameters are recorded: charging current, discharging current, battery cell voltage, and elapsed time. These data are periodically exported as text files (.txt) with an export interval predefined by the user.

4. Experimental Validation

To verify the correct operation of the battery test bench in conjunction with the automatic mode of the SDAYC that has been developed, automatic tests were performed. Using the data obtained from these tests, charge and discharge curves and parameters such as the SoH, which characterize the battery’s condition, were determined. Note that a strong point of our proposal is that there is no need for external data pre-processing for the reproducibility of the experiments. Our measurement system is based on the instruments utilized, which provide the voltage and current for the post-processing steps. The temperature is measured using a thermocouple, applying a first order hardware filter with a cut-off frequency of 1 Hz.
The main specifications and characteristics of the battery analyzed are shown in Figure 8. Taking into account these characteristics, a minimum charging current threshold of 0.5 A was selected. The tested battery has a nominal capacity of 6 Ah. Although 0.1 C (0.6 A) is commonly accepted as the standard current cut-off value, a slightly lower value of 0.5 A was chosen according to [38] to offer a conservative margin without significantly compromising efficiency or charging time. In our study, a 2.5 V cutoff voltage was selected, where a conservative criterion was applied in the selection to guarantee the integrity and lifespan of the cell analyzed. Finally, the interruption system uses practical threshold values (temperature > 45 °C, voltage > 4.2 V) also obtained from the cell specifications analyzed. Regarding overcharging, batteries can reach 4.8 V without the risk of explosion or fire, but a safety factor is applied and the threshold voltage is reduced to 4.2 V to ensure safe operation of the system. Additionally, the maximum recommended temperature ranges for most of the analyzed LiFePO4 cells vary between 55 and 65 °C. Then, the maximum system temperature in our system was limited to 45 °C, which somehow considers possible miscalibrations or measurement errors in the electronic equipment, including a thermal safety factor of 25% with respect to the maximum assumed temperature of 60 °C.
The first test sequence is as follows:
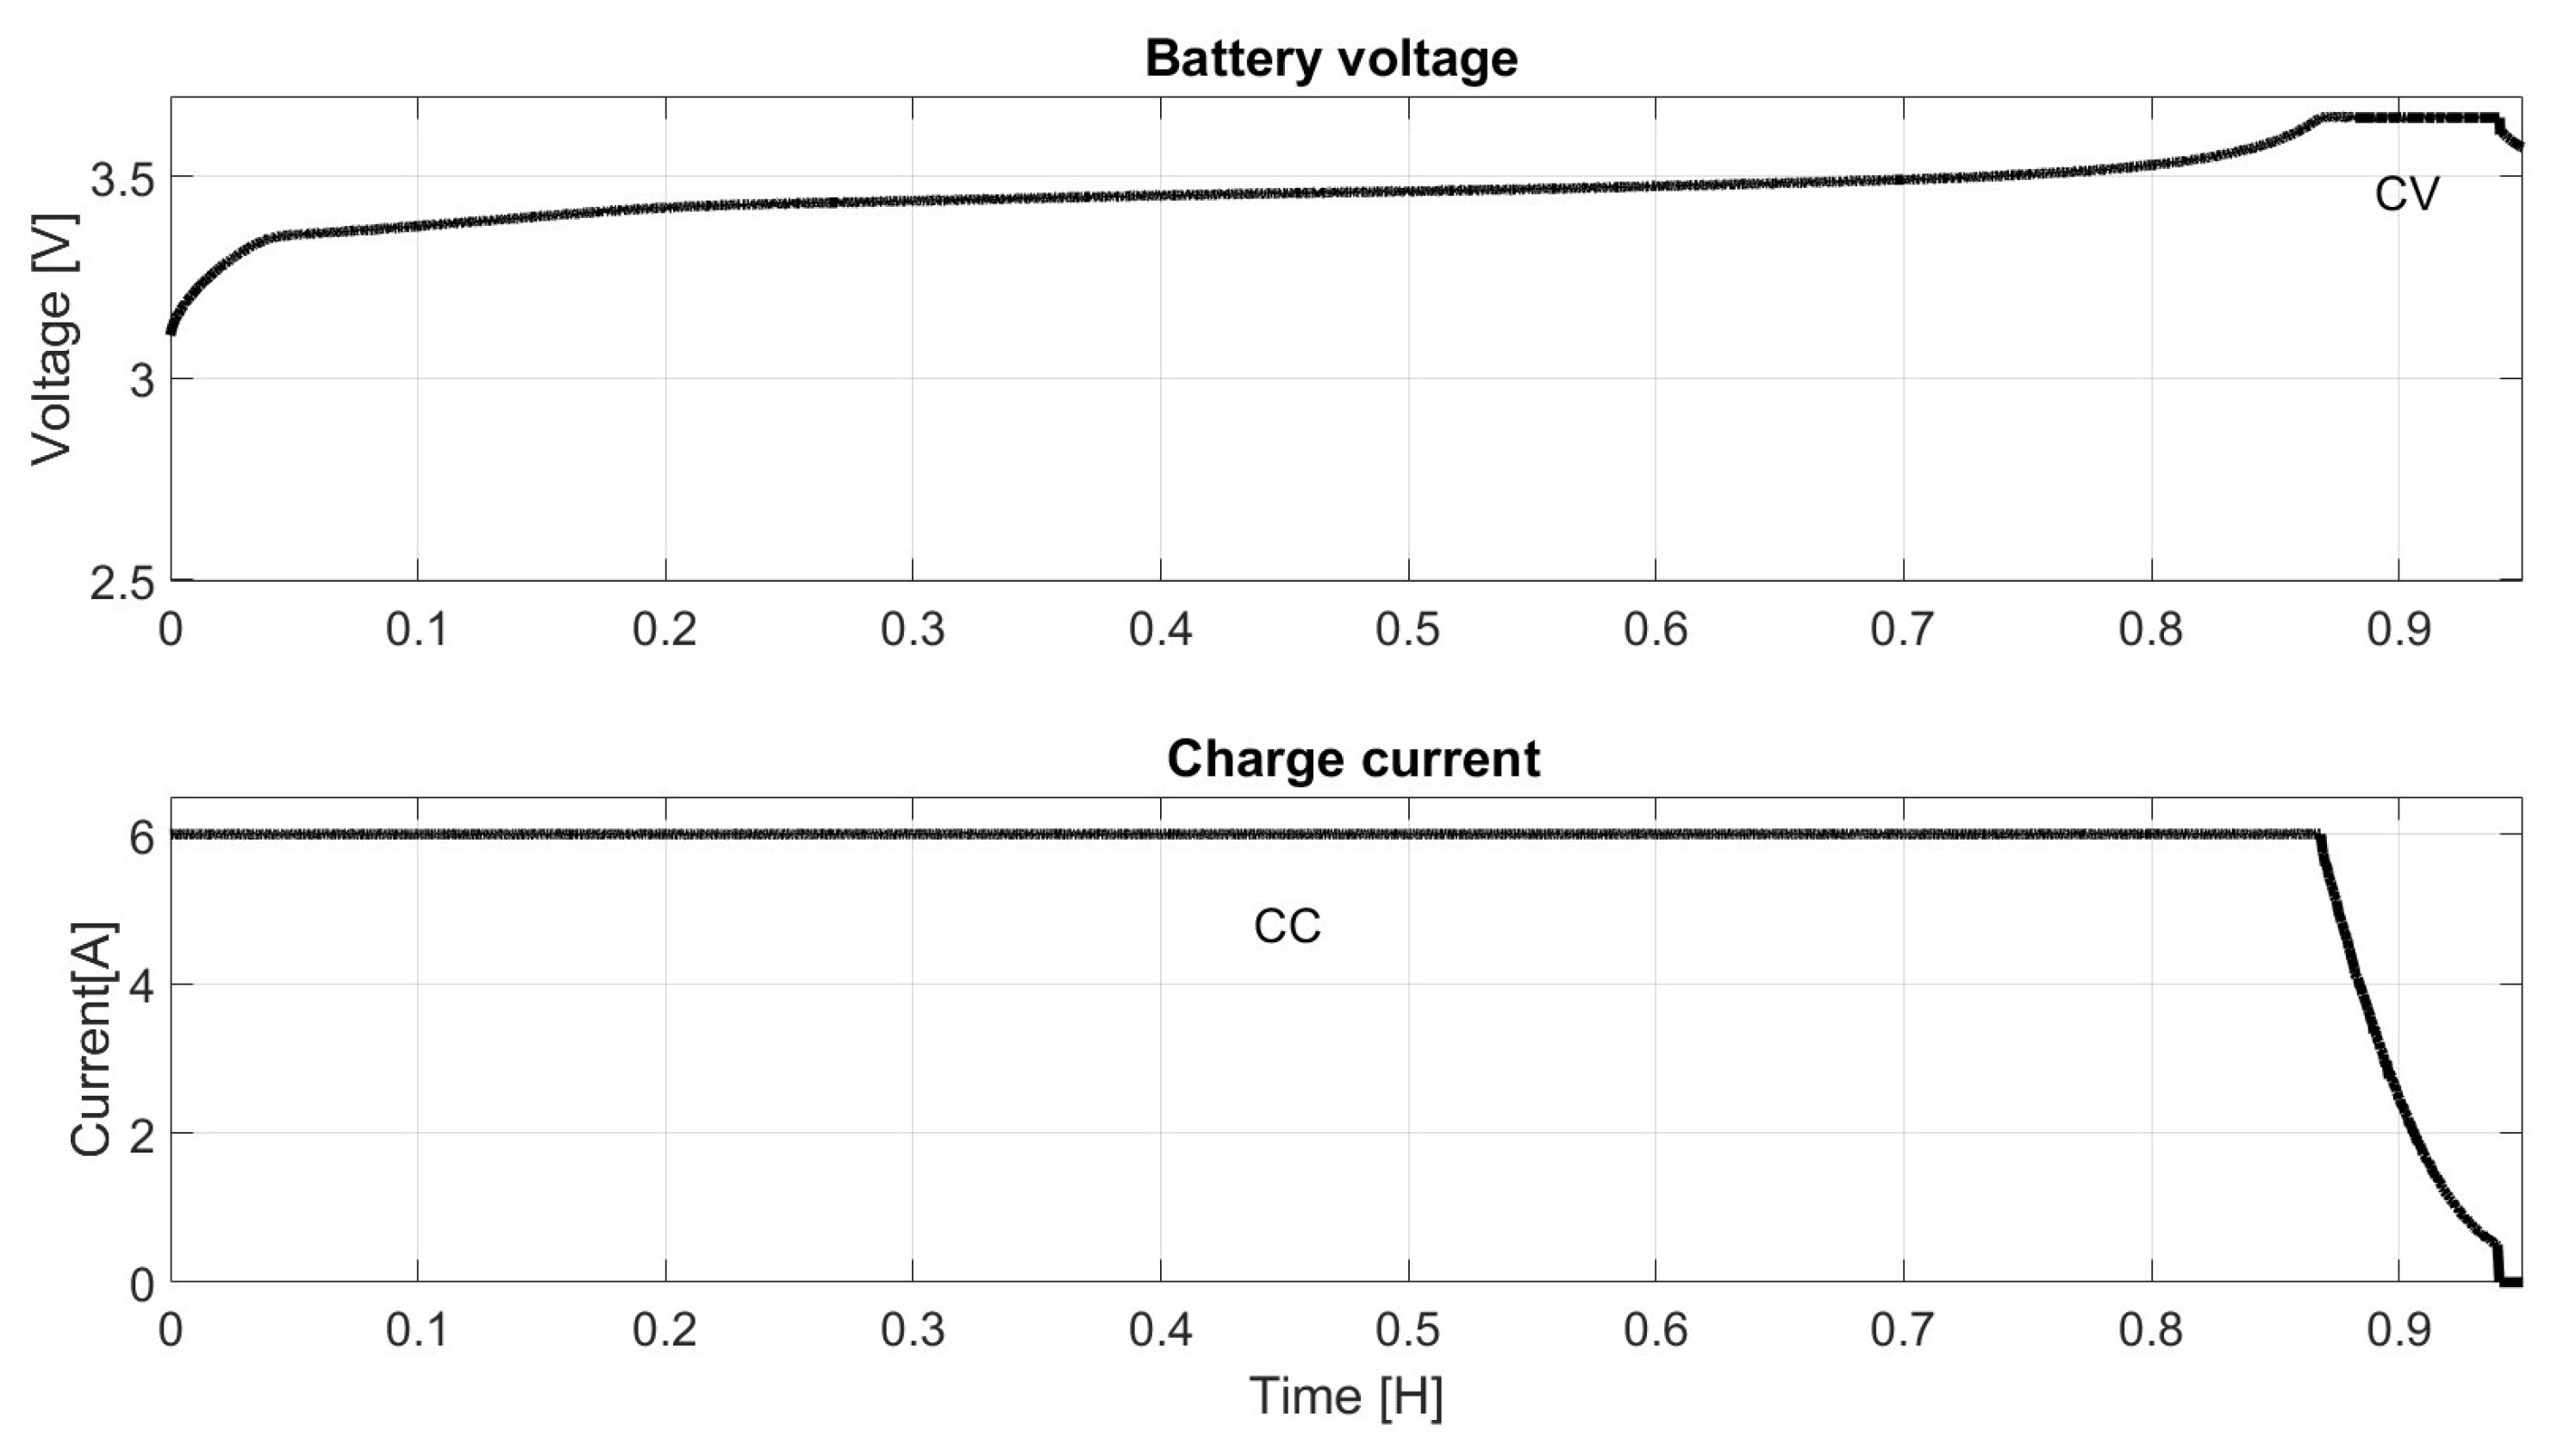
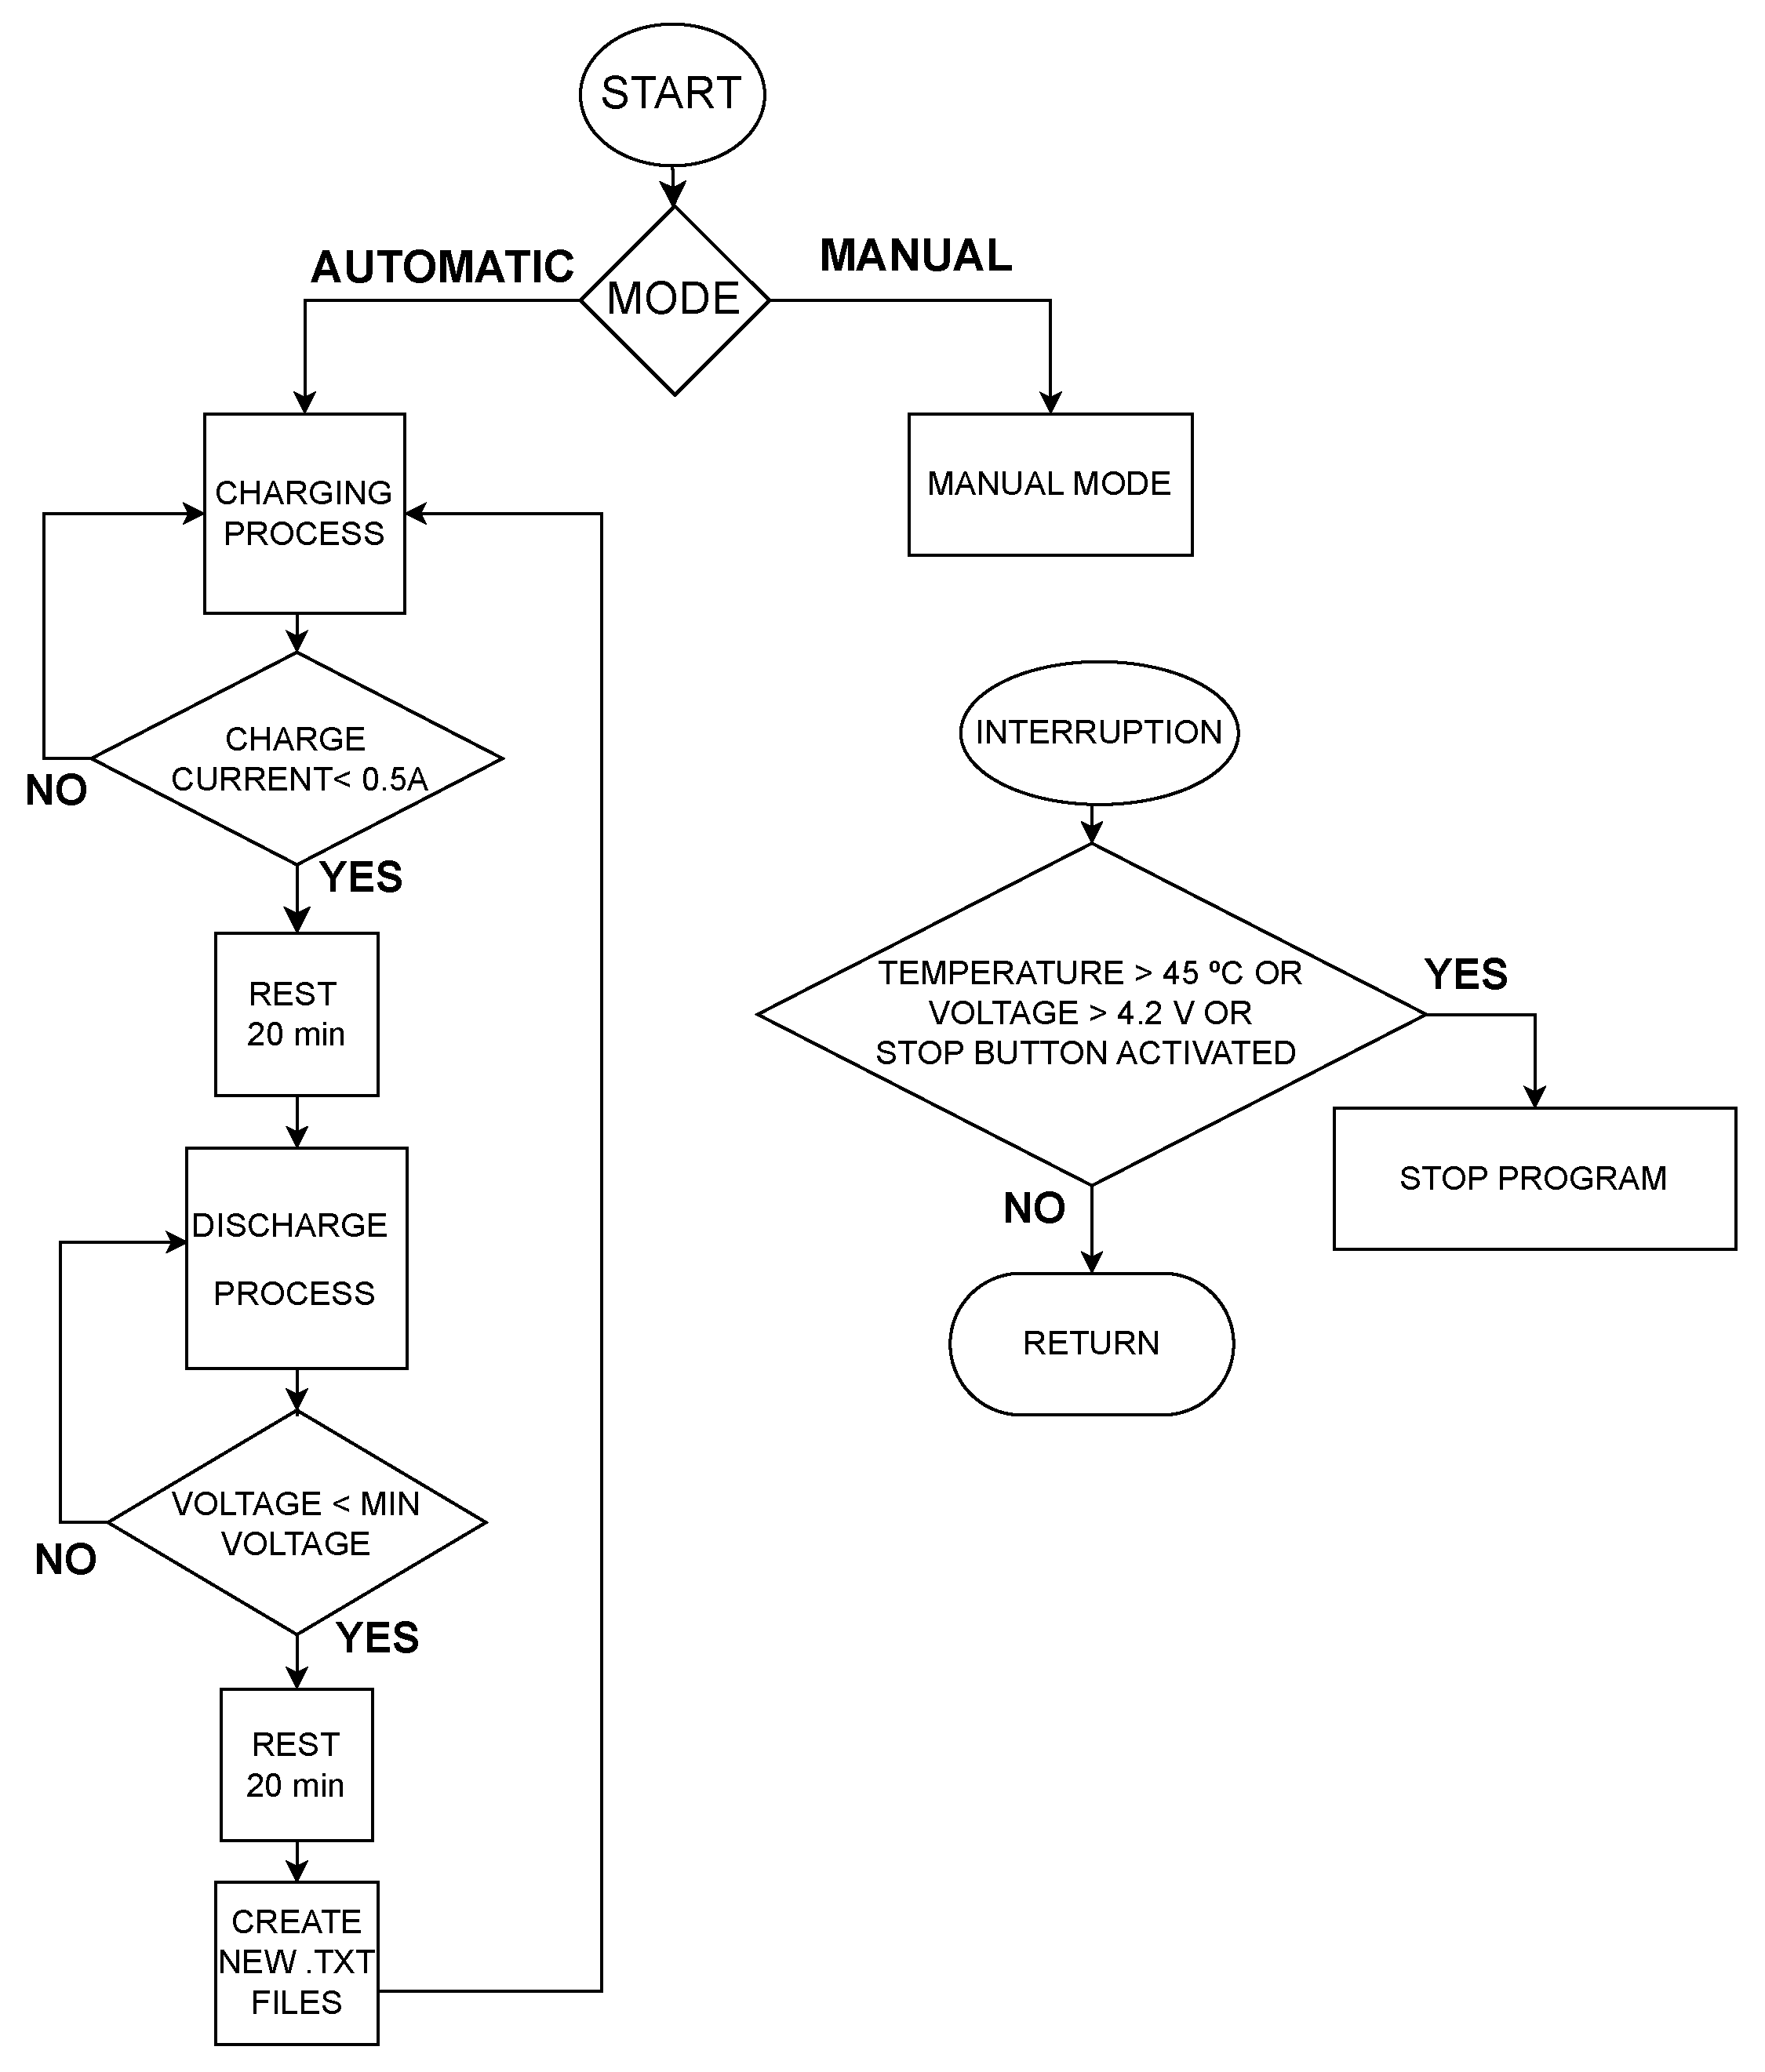
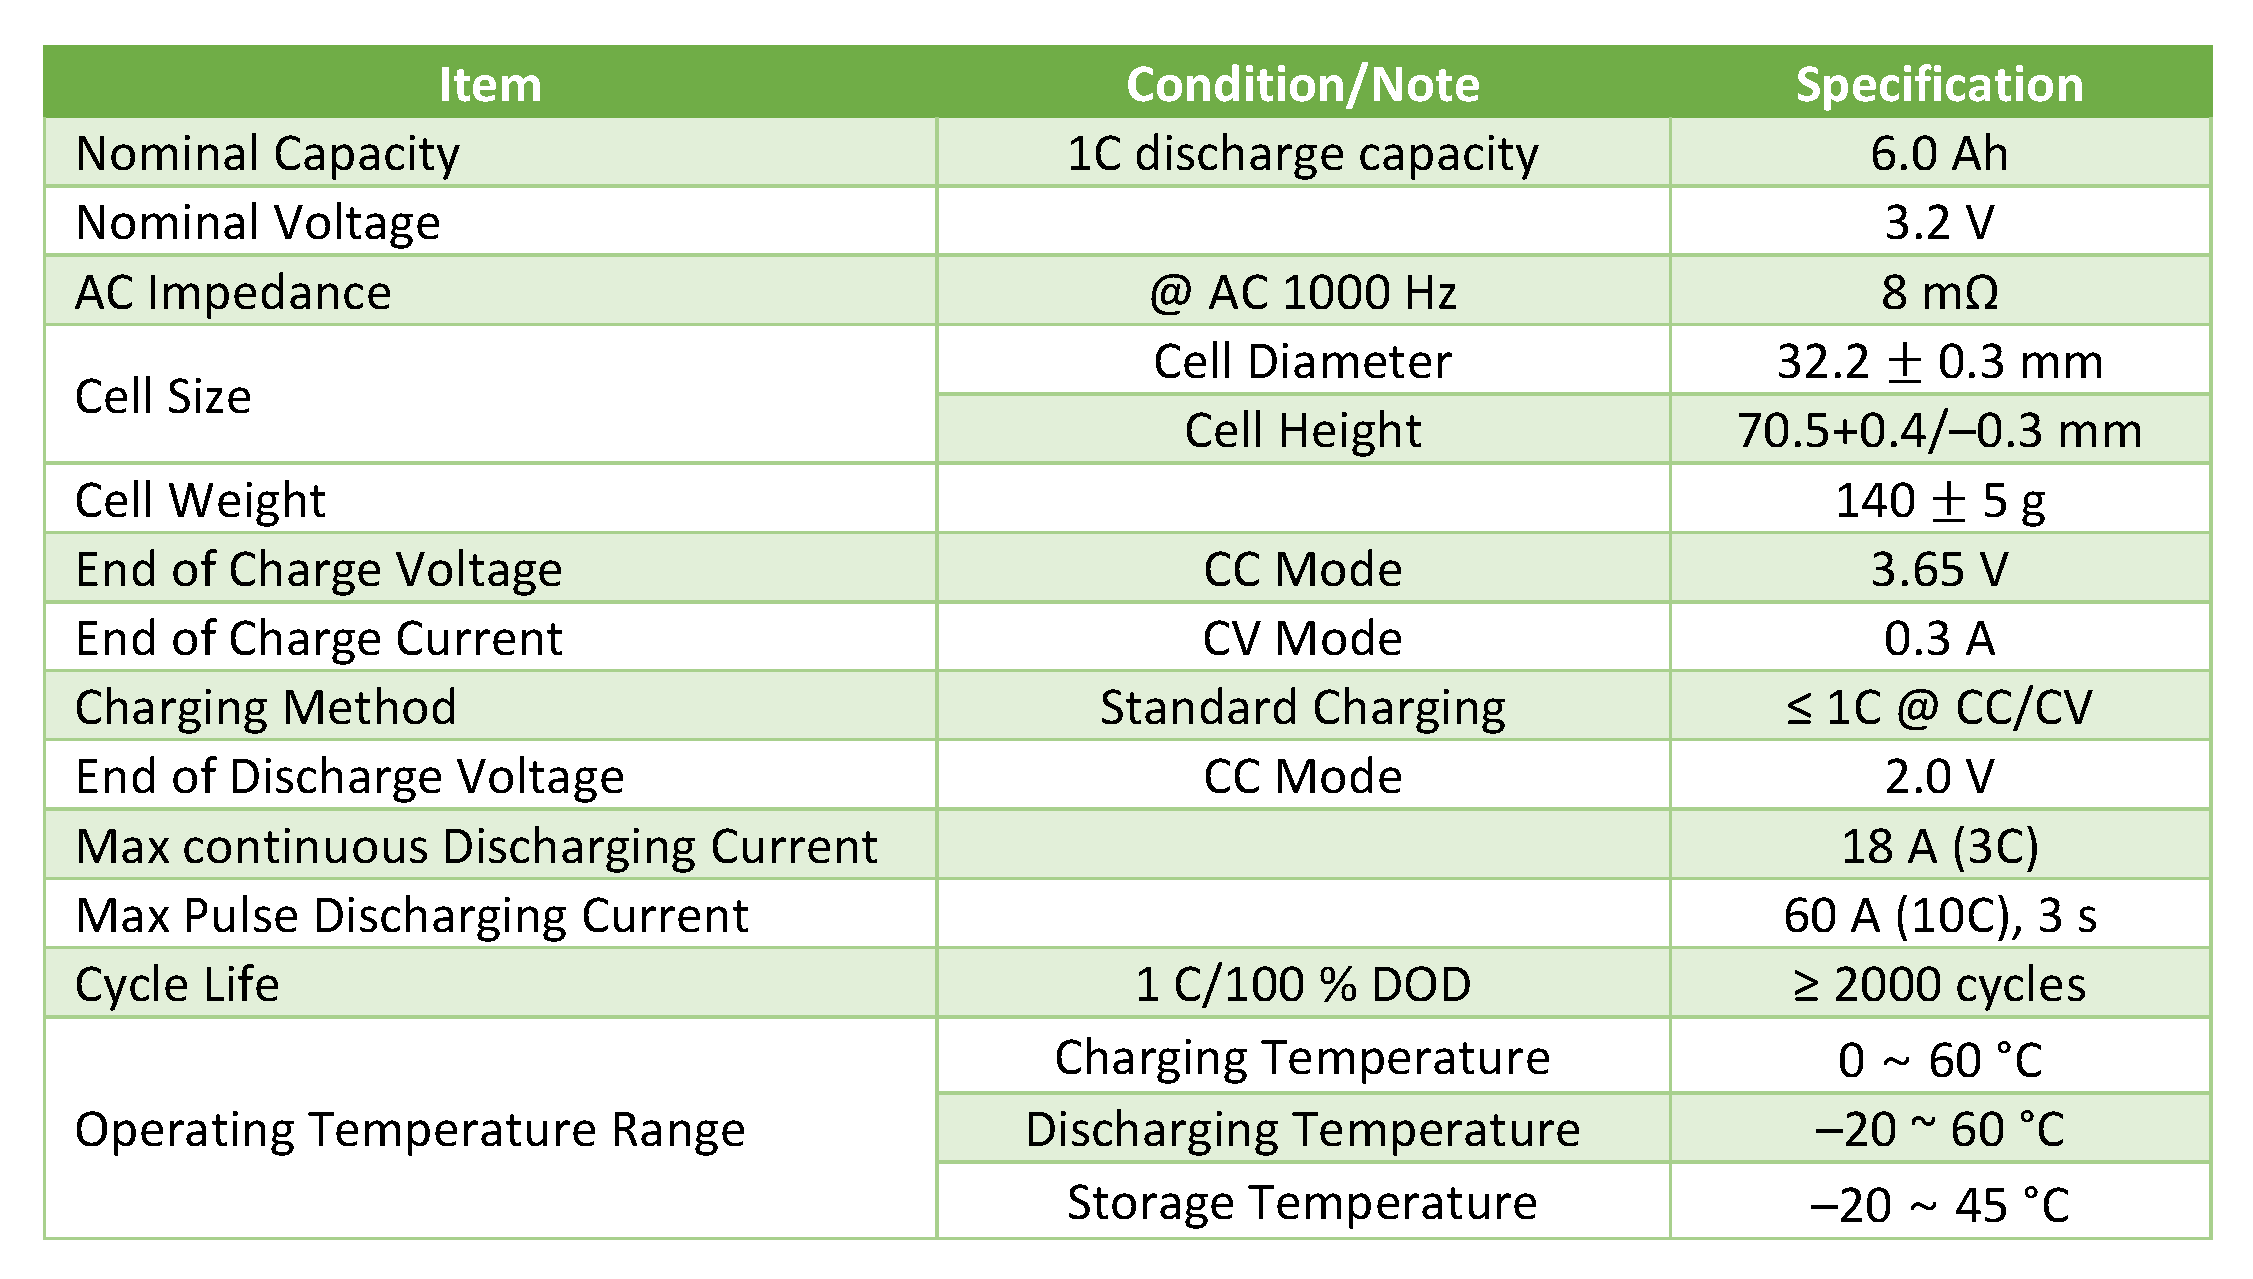
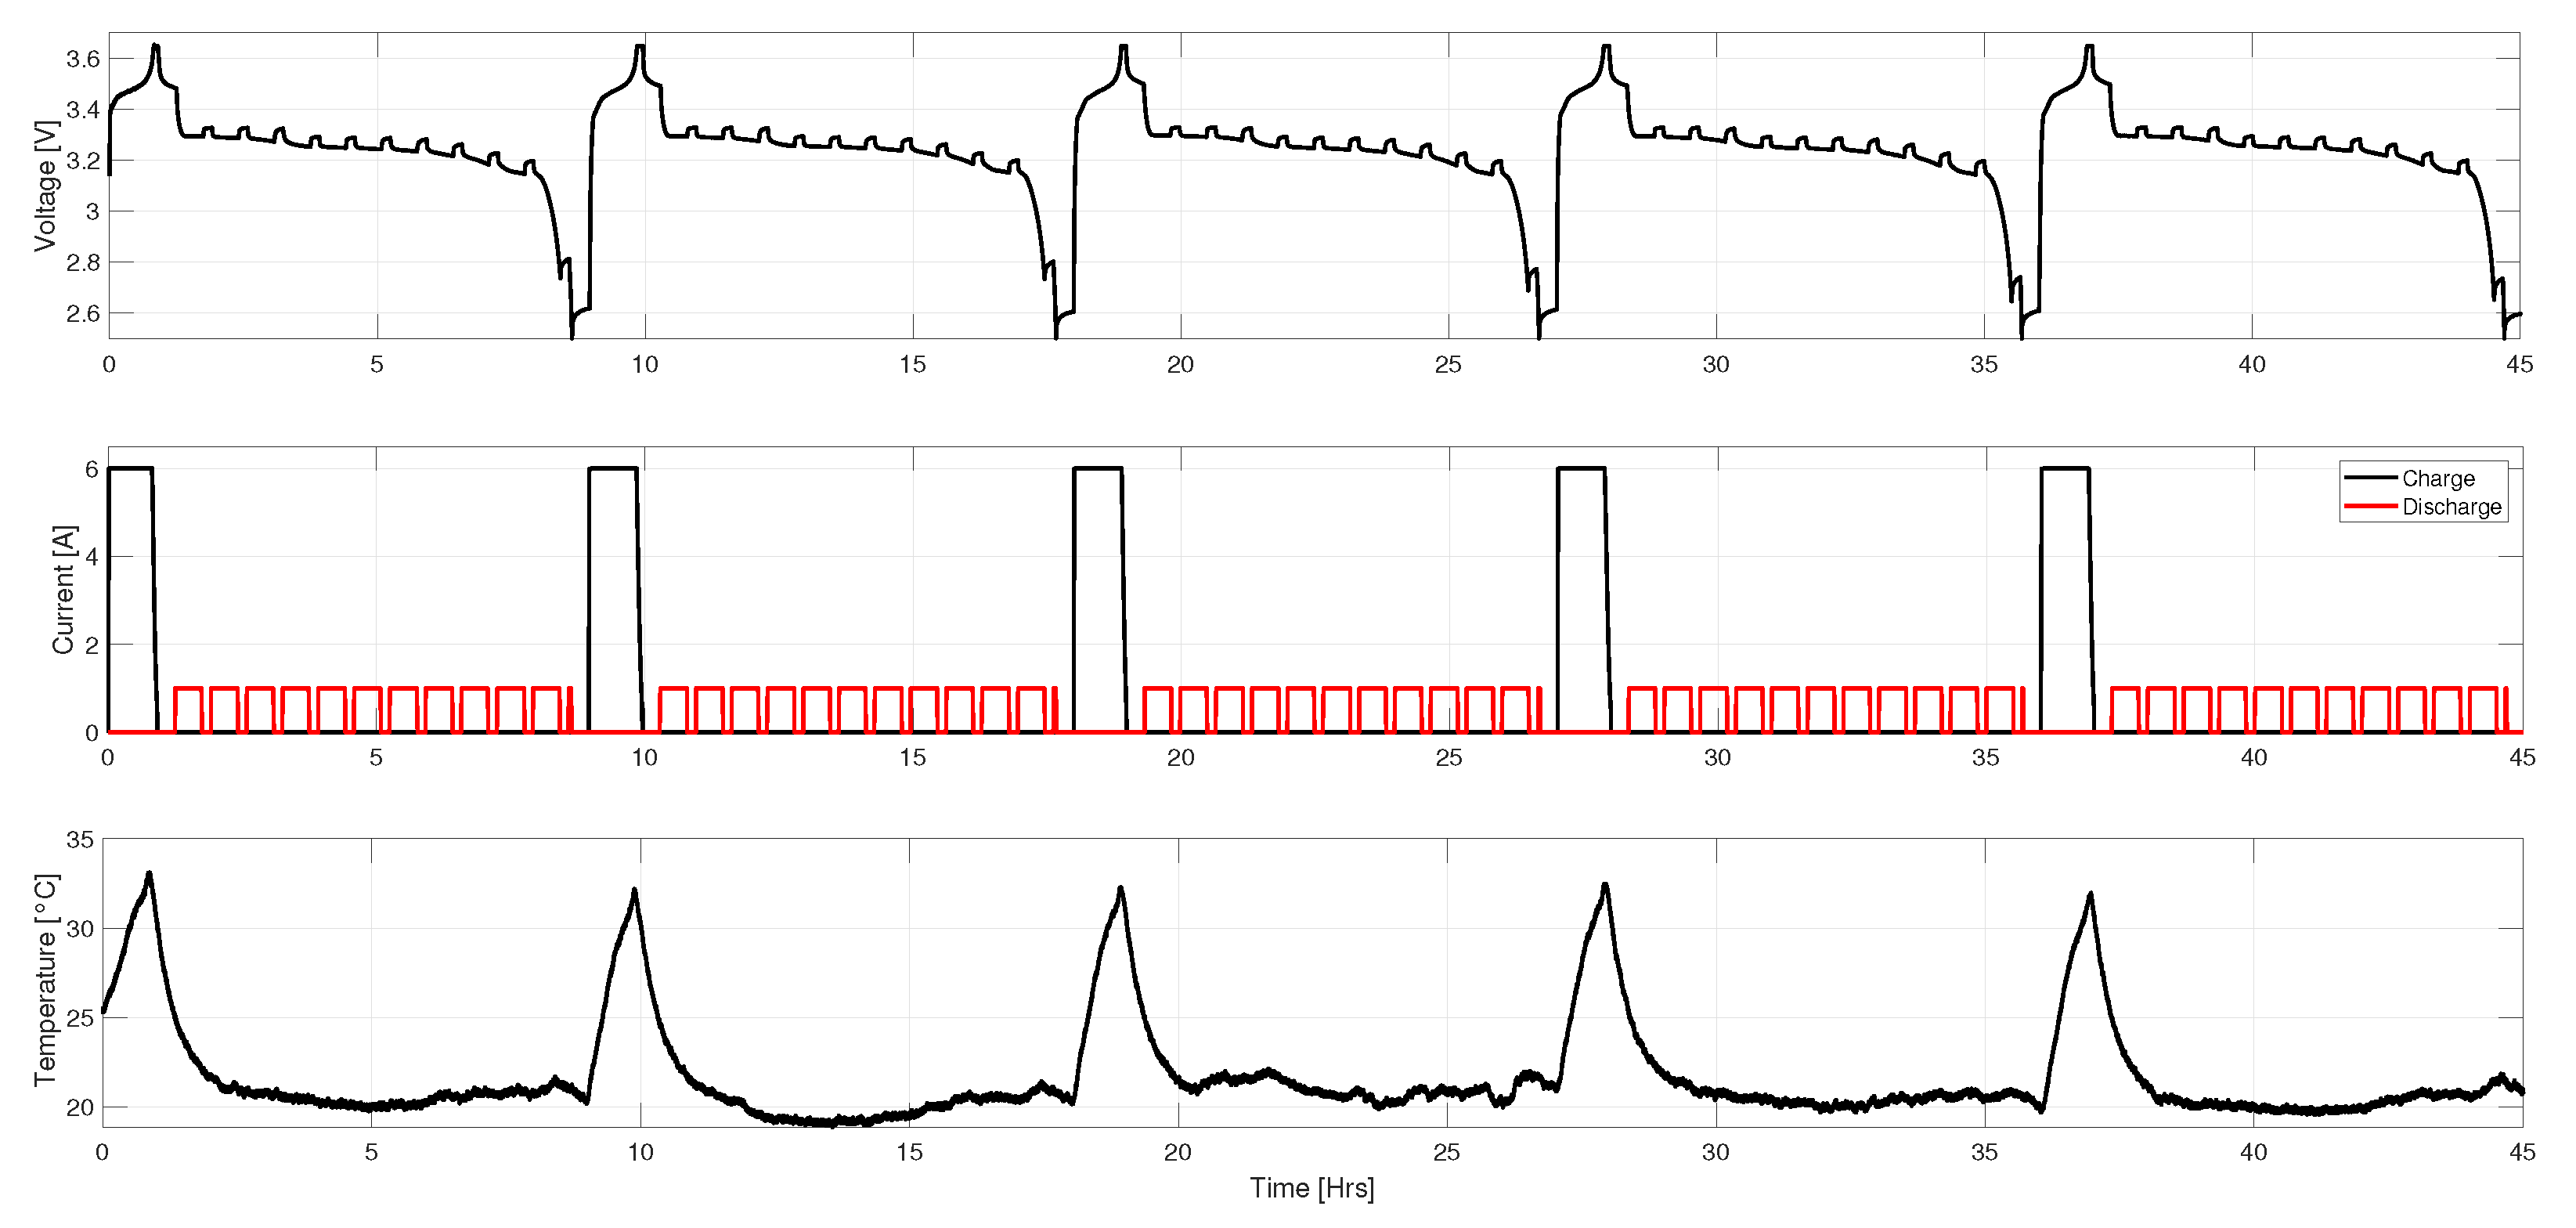
  • The initial configurations are established, where the file names for the first charge and discharge cycles are defined as “Charge1.txt” and “Discharge1.txt”. The charging voltage is set at 3.65 V, the maximum charging and discharging current is set at 6 A, the minimum discharge voltage is set at 2.5 V, and a data sampling period of 1 s is established.
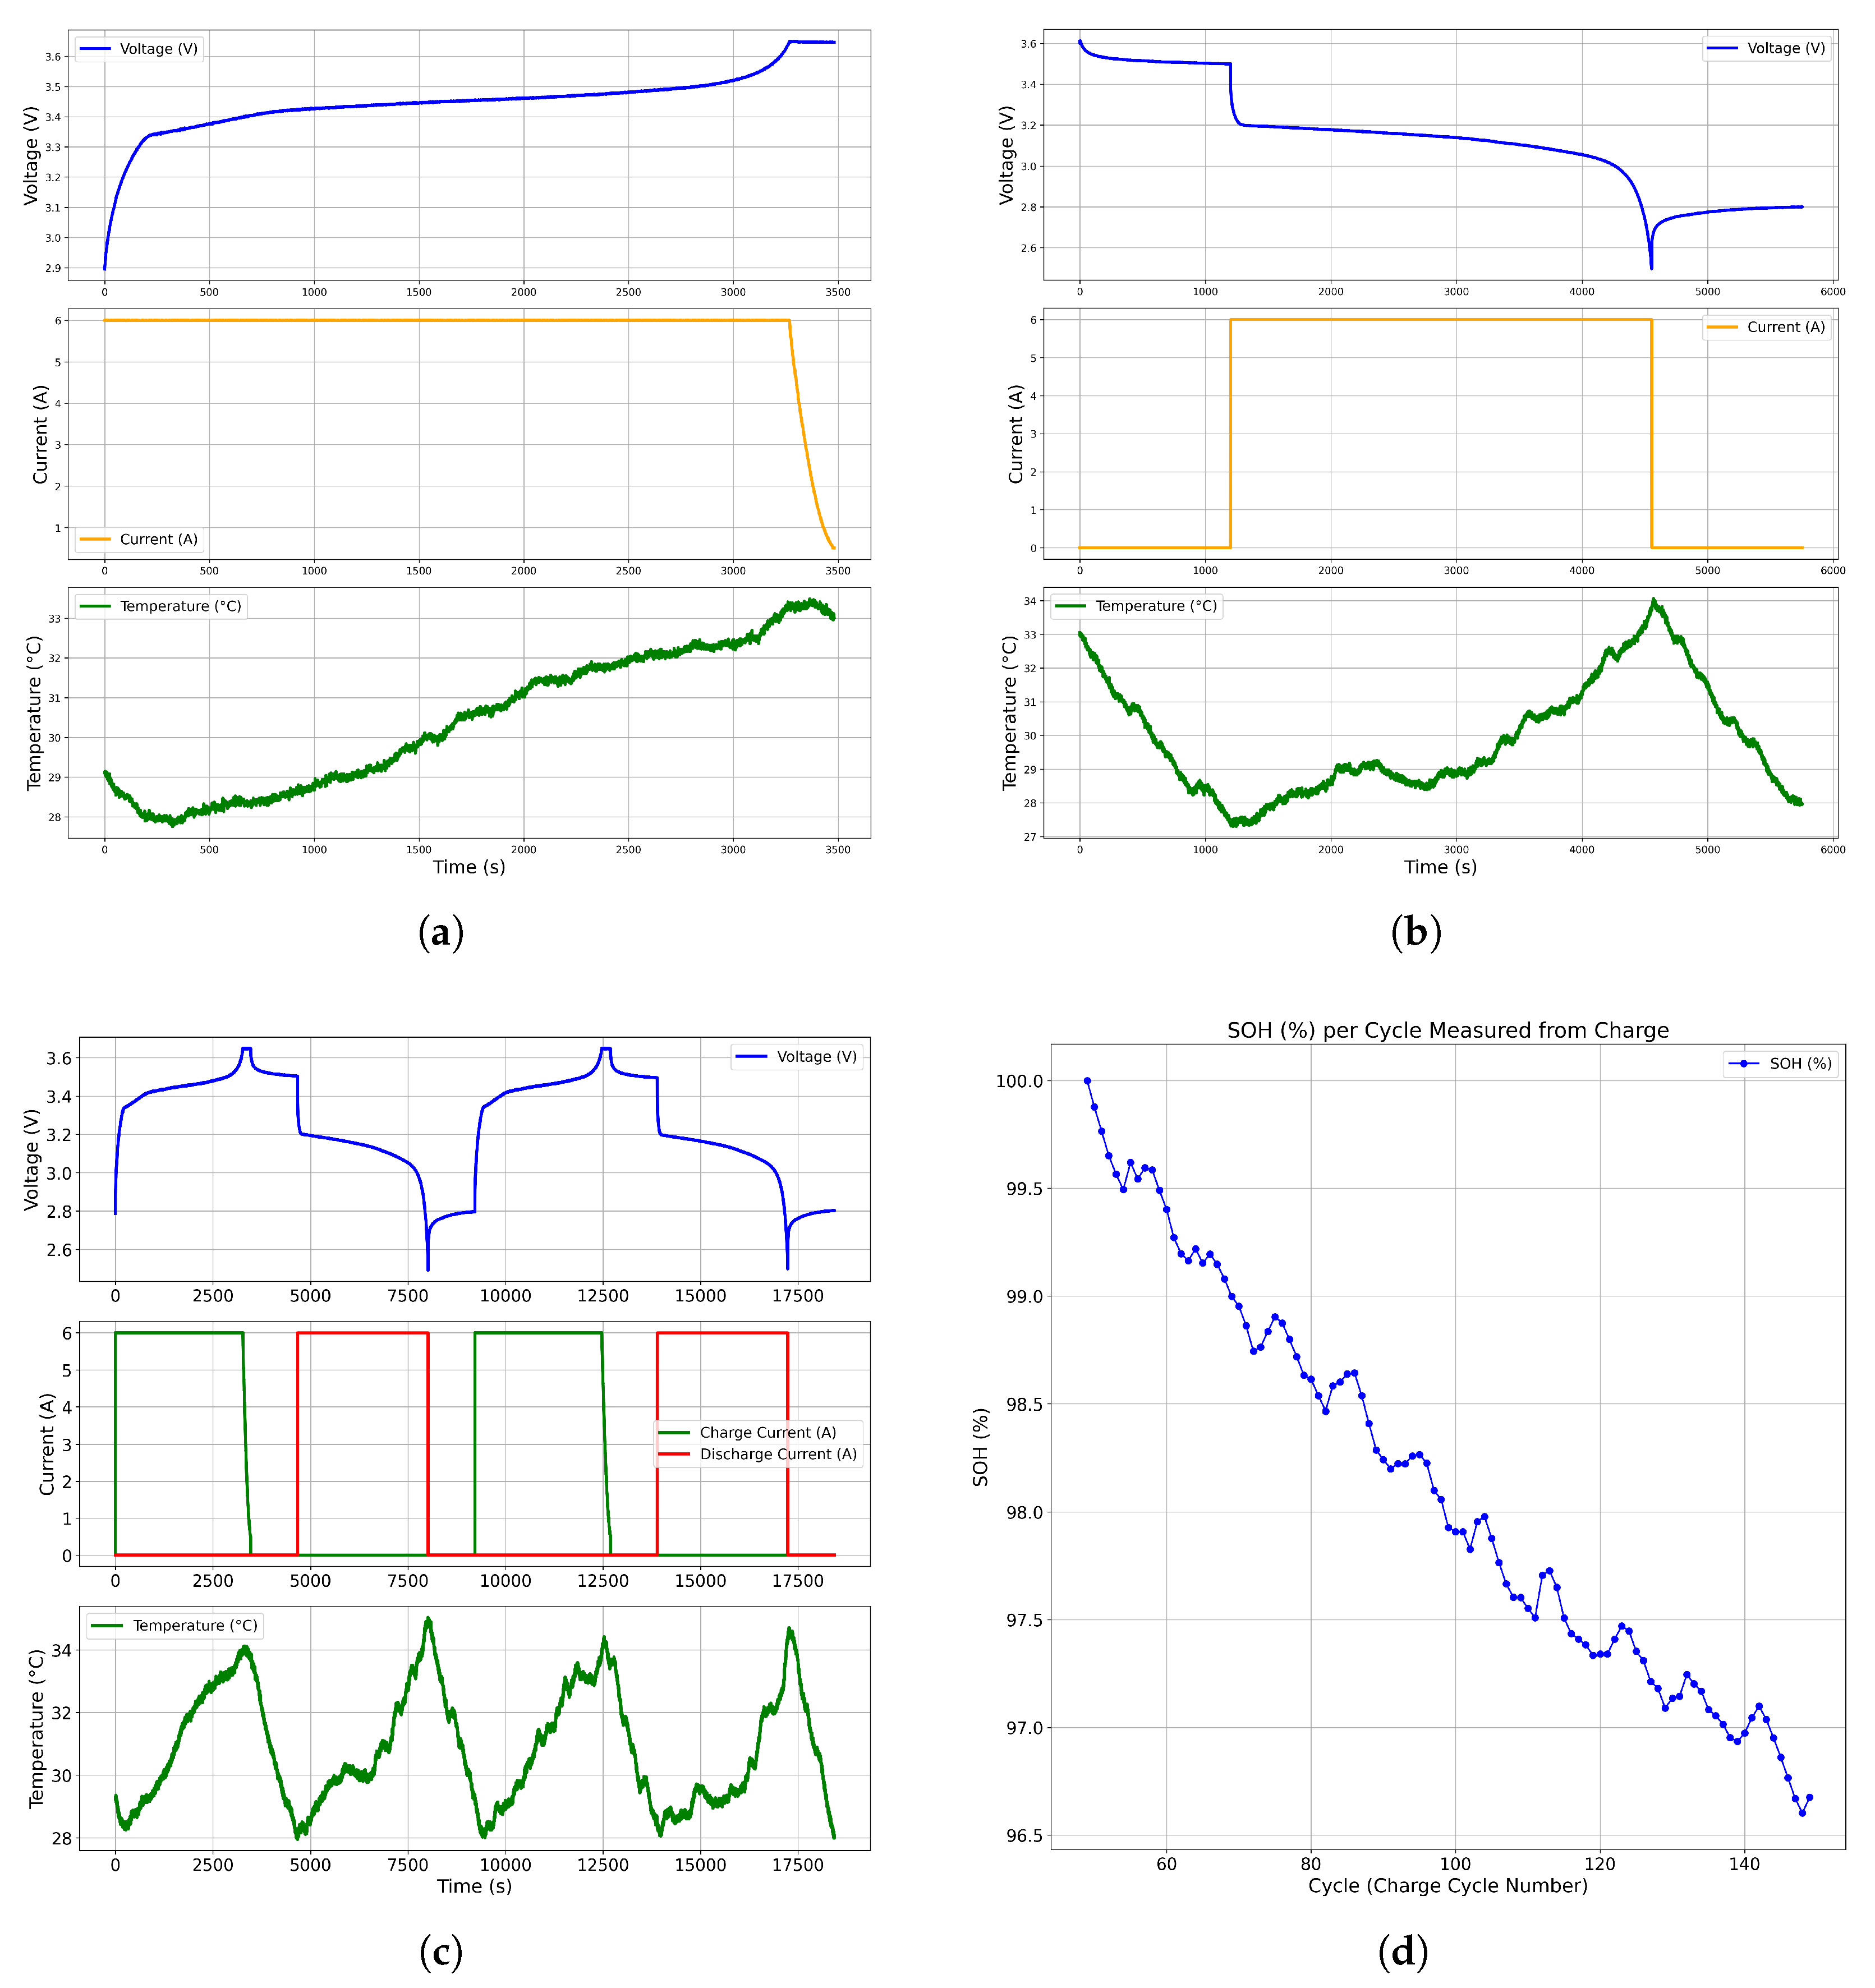
  • The battery charging process begins with a CC-CV profile. Initially, charging begins with a CC at a rate of 1 C (6 A) until the battery reaches a voltage of 3.65 V (maximum charging voltage). Subsequently, a CV phase is applied at 3.65 V until the current decreases to a threshold of 0.5 A or less, at which point the software automatically terminates the charging process Figure 9a. During this process, the charging data is recorded in a charging text file. The data include the charging current measured by the power supply, the voltage provided by the power supply, the temperature measured by the thermocouple, and the time recorded in LabVIEW. These data are continuously logged and periodically exported.
  • After a rest period of 20 min, the discharging process is initiated using a CC of 6 A, until the battery reaches a voltage of 2.5 V (minimum voltage). At this point, the discharging process is automatically stopped, see Figure 9b. During this process, discharge data are recorded in a discharge text file. These data include the discharging current measured by the programmable load, the voltage provided by the power supply, the temperature measured by the thermocouple, and the time recorded in LabVIEW. It is noteworthy that data during the resting periods are also stored in the discharging file, ensuring that all relevant information, including the intervals between charging and discharging cycles, is captured for further analysis Figure 9b.
  • Subsequently, a 20-min rest period begins. Once this period ends, new text files are generated for the next charging and discharging processes, and the cycle restarts from Step 1.
To analyze the complete charge and discharge cycle of the battery, a sequential concatenation of the data obtained from each process was performed. Data from each charging process were placed consecutively with those from the corresponding discharge process. For example, the data from the “Charge1.txt” file were concatenated with those from “Discharge1.txt”, followed by “Charge2.txt” and “Discharge2.txt”, and so on. This approach enables a continuous and sequential visualization of the battery’s behavior during the charging, discharging, and resting periods, as illustrated in Figure 9c. The relevant data from a set of 100 charging files were examined to evaluate the SoH of the battery. These files correspond to the charges performed between cycles 49 and 149. For each cycle, the SoH value was calculated using Equation (1), which establishes the relationship between the maximum achieved capacity of the battery and its nominal capacity. The results are presented in Figure 9d, which shows the obtained SoH for each analyzed charging cycle and a total SoH degradation of about 3.5 % in the battery under test. These results agree with the degradation of SoH obtained using the fading model proposed in [39].
SoH ( % ) = 0 t final i d t C nominal × 100
A second set of experiments is performed to evaluate the remaining capacity in relation to the full capacity of the battery, also called the state-of-charge (SoC) parameter of the battery. One common approach to SoC estimation involves analyzing voltage relaxation, a phenomenon in which the battery voltage gradually stabilizes after a period of charging or discharging. By observing the steady-state voltage, often referred to as the open-circuit voltage (Voc), researchers can establish a correlation between Voc and the SoC. This relationship helps to improve the accuracy of SoC estimation models [40]. To determine the relationship between Voc and SoC, this second test is conducted in two stages as stated in [40].
In the first stage, the battery undergoes charge and discharge cycles using an automatic constant current control and a modified test that includes an extra rest time during the discharge process, allowing the battery voltage to stabilize. The cycle operates as follows:
  • Charging procedure: a CC-CV profile is followed. Initially, a constant current of 1 C (6 A) is applied until the battery voltage reaches 3.65 V. Then, the process switches to constant voltage mode at 3.65 V, maintaining this level until the current decreases to 0.5 A.
  • Resting period: the battery is left to rest for 20 min once the charge is complete, allowing the voltage to relax.
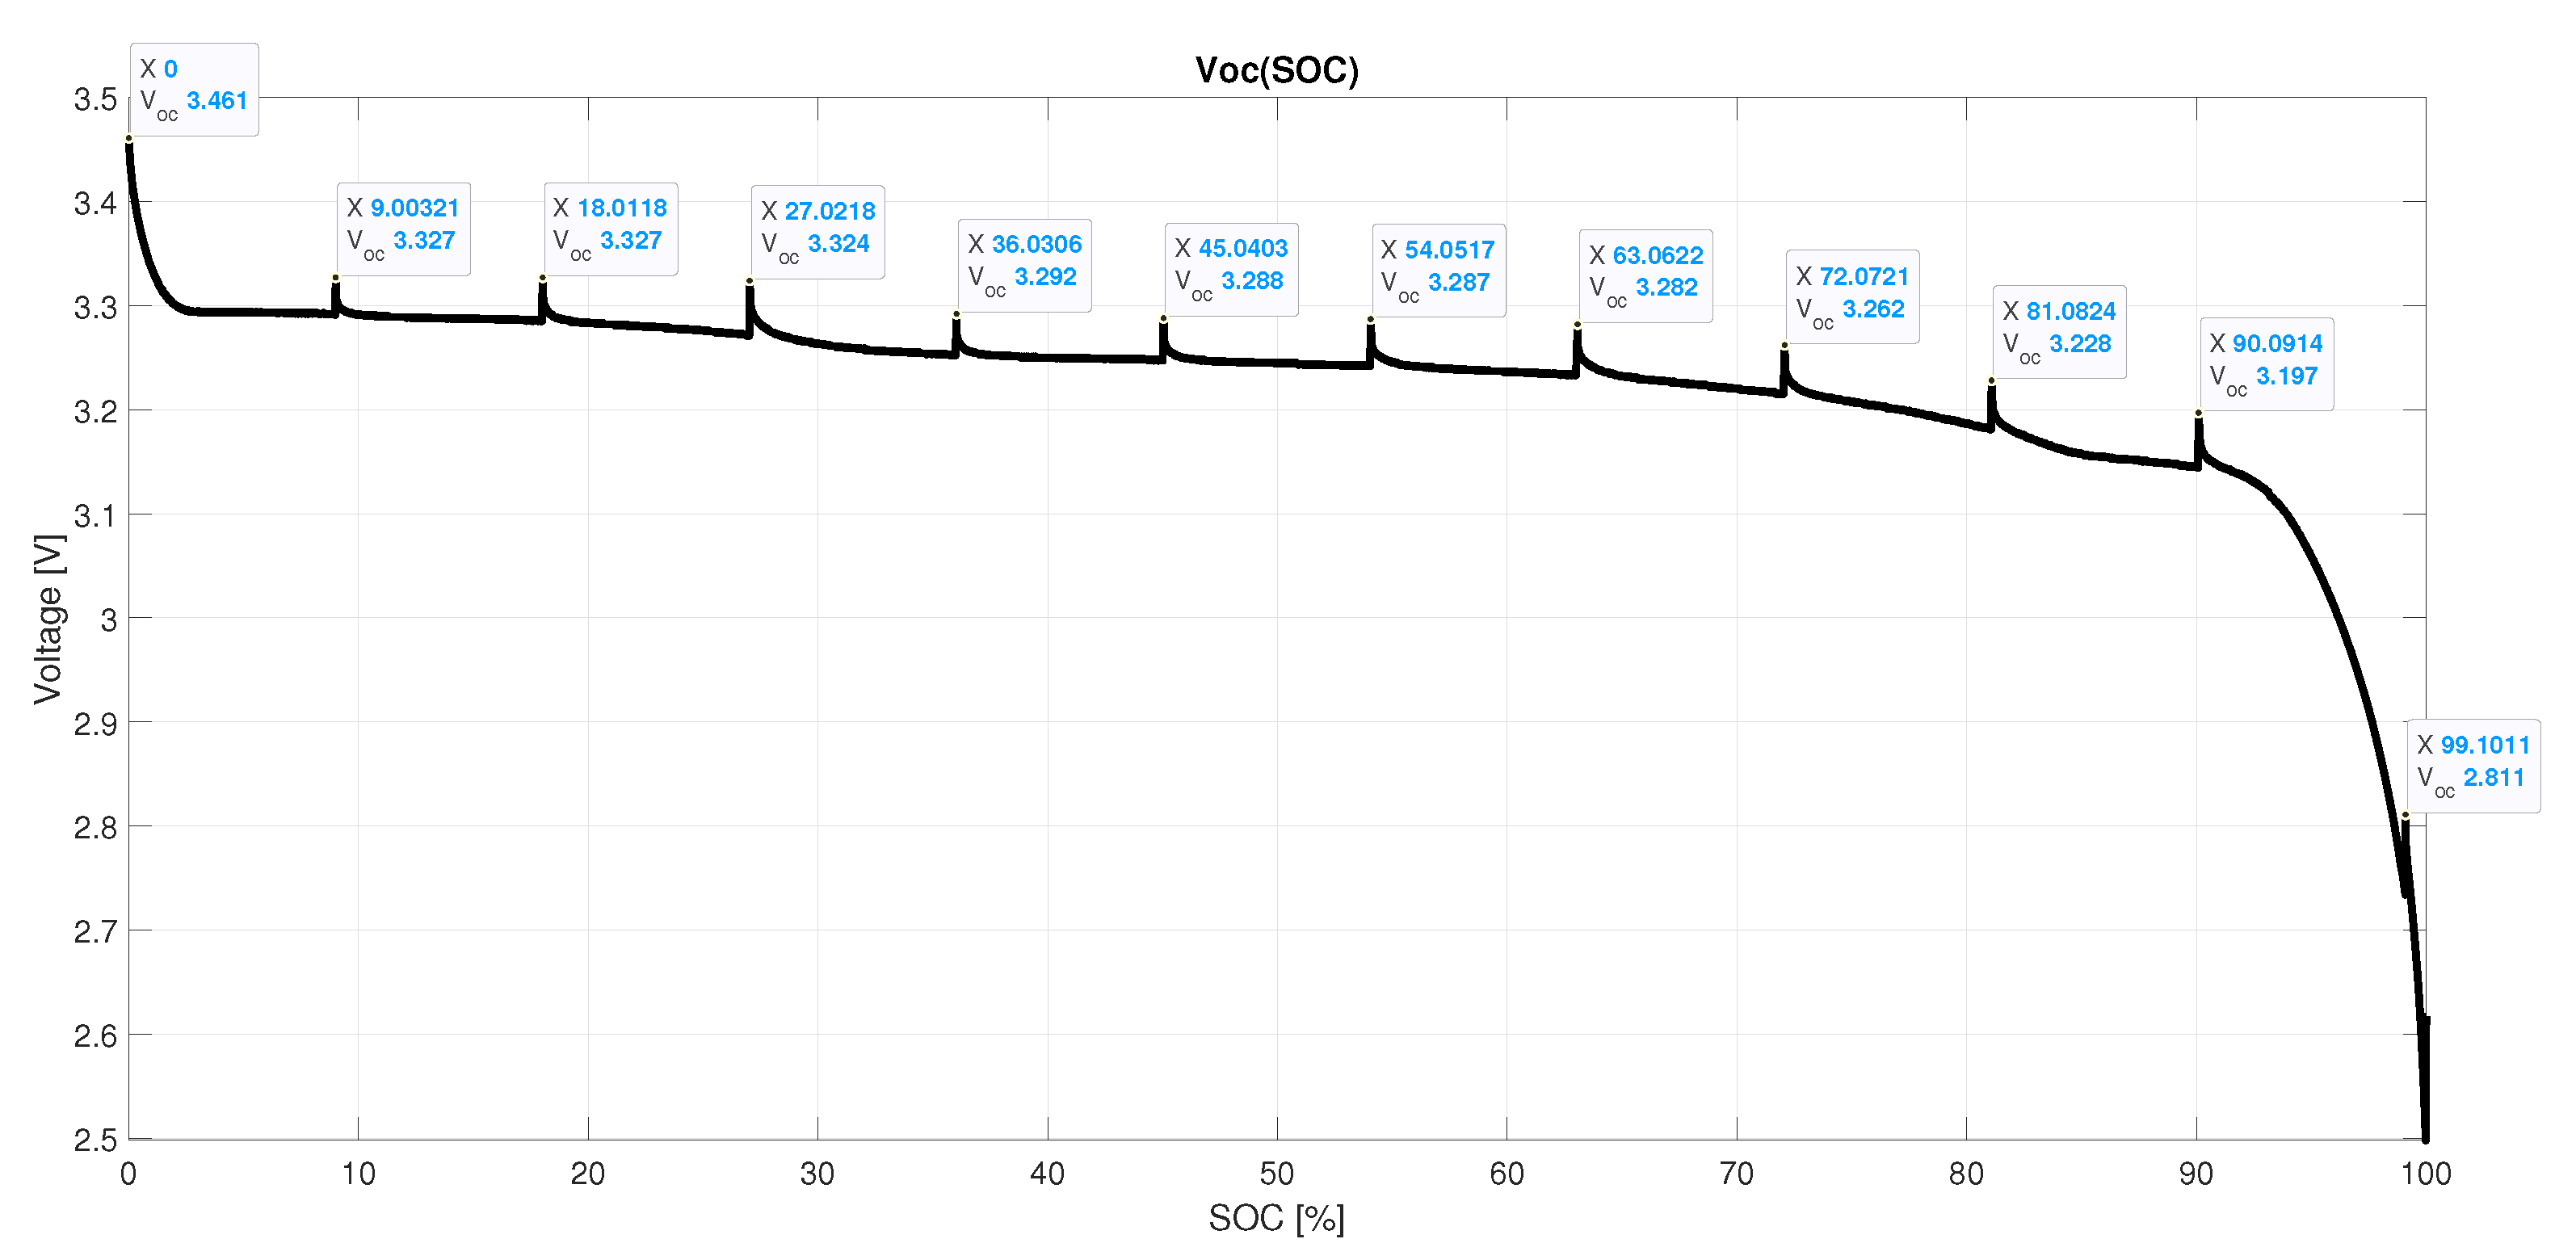
  • Discharging process: the discharge process begins after the resting period, applying a constant current of 1 A. During discharge, the process is paused every 30 min for 10 min to record multiple open-circuit voltage points. The discharge continues until the battery voltage drops to 2.5 V, which is the discharge cut-off voltage and causes the cycle to stop completely.
The entire procedure lasted approximately 45 h and consisted of five charge-discharge cycles. Data collected from each cycle was stored in text files which were then processed, filtered, and combined into a single file to plot graphs that represent the full procedure using MATLAB, R2024b version. Figure 10 shows the curves obtained during the procedure, where the following parameters were recorded: battery terminal voltage, charge and discharge current, and battery temperature. These curves show the number of cycles performed and the battery voltage behavior during the charging and discharging stages. In addition, voltage relaxations are identified during resting intervals, providing information for the curve V o c ( S o C ) .
In the second stage, the Voc is measured during the rest periods. The Voc-SoC relationship is then experimentally determined by analyzing the obtained measurements along with the recorded current curves, providing valuable insight into the battery’s behavior. Note that a sufficient rest period must be guaranteed to ensure that the measured terminal voltage corresponded to the actual open-circuit voltage. For this analysis, the discharge from the third cycle was arbitrarily selected. Figure 11 shows the voltage and current graphs recorded during this cycle, highlighting the Voc values reached after the battery remained at rest for 10 min. These rest points allow for the evaluation of open-circuit voltage and its relationship with the state of charge.
The state of charge was finally determined by calculating the percentage values during discharge using the Coulomb counting method (Equation (2)). This method evaluates the relationship between battery capacity at each moment of the discharge process and the maximum capacity reached at the end of the process. On the basis of this data, graphs were generated to show the variation of voltage as a function of the state of charge throughout the procedure. The resulting curve is presented in Figure 12. The observed peaks occur during intervals when the current is zero, indicating that the SoC remains constant while the voltage increases and reaches a value of Voc.
SoC ( % ) = 0 t i · d t · 100 0 t final i · d t

5. Conclusions

This work presents a comprehensive, versatile, automated, and safe test bench designed for electric battery characterization. The proposed system monitors key parameters such as voltage, current, and temperature while allowing for controlled charging and discharging using the CC-CV method. It also facilitates the collection of data for further analysis, including the estimation of SoH and SoC, where post-processing and filtering stages are not required for the reproductivity of the experiment. Then, by automating charge-discharge cycles and data acquisition, the system ensures accuracy and repeatability in battery testing. The integration of LabVIEW for control and monitoring, along with Python and Matlab for data processing, provides a versatile platform for research and development, where the collected data can be used to evaluate battery performance, optimize management strategies, and improve battery longevity. The data obtained are available at https://idus.us.es/items/65cc2934-ee3e-4b85-89a6-15d7f4f9db29 (accessed on 26 March 2025), making this dataset repository a novel tool for future research works in the field. In particular, the included dataset details charge and discharge cycle records from experiments designed to evaluate the durability, efficiency, and stability of the 32700 LiFePO4 battery analyzed in this work. In general, the developed system presents a valuable tool for battery testing, offering both precision and adaptability for various lithium-ion battery applications.

Author Contributions

Conceptualization, E.M., N.M., A.P.V.-L., F.B. and M.H.; Methodology, N.M., A.P.V.-L., F.B. and M.H.; Software, A.P.V.-L., F.B. and M.H.; Validation, E.M., N.M., A.P.V.-L., F.B. and M.H.; Formal analysis, N.M., A.P.V.-L., F.B. and M.H.; Investigation, E.M., N.M., A.P.V.-L., F.B. and M.H.; Resources, N.M. and F.B.; Data curation, N.M., F.B. and M.H.; Writing—original draft, N.M., F.B. and M.H.; Writing—review & editing, E.M., A.P.V.-L., F.B. and M.G.S.; Visualization, F.B.; Supervision, E.M., F.B. and M.G.S.; Project administration, F.B.; Funding acquisition, F.B. All authors have read and agreed to the published version of the manuscript.

Funding

This research was funded by the Grant TED2021-129558B-C22 funded by MCIU/AEI/1013039/ 501100011033 and by the “European Union NextGenerationEU/PRTR” and the project I+D+i/PID2021-125189OB-I00, funded by MCIU/AEI/10.13039/501100011033/ by “ERDF A way of making Europe”.

Data Availability Statement

The original contributions presented in the study are included in the article, further inquiries can be directed to the corresponding author.

Acknowledgments

This work is part of the Grant TED2021-129558B-C22 funded by MCIU/AEI/10. 13039/501100011033 and by the “European Union NextGenerationEU/PRTR”. Also, the authors want to thank the support provided by project I+D+i/PID2021-125189OB-I00, funded by MCIU/AEI/10.13039/501100011033/ by “ERDF A way of making Europe”.

Conflicts of Interest

The authors declare no conflicts of interest.

References

  1. Saw, L.H.; Poon, H.M.; Chong, W.T.; Wang, C.T.; Yew, M.C.; Yew, M.K.; Ng, T.C. Numerical Modeling of Hybrid Supercapacitor Battery Energy Storage System for Electric Vehicles. Energy Procedia 2019, 158, 2750–2755. [Google Scholar] [CrossRef]
  2. Nair, N.K.C.; Garimella, N. Battery Energy Storage Systems: Assessment for Small-Scale Renewable Energy Integration. Energy Build. 2010, 42, 2124–2130. [Google Scholar] [CrossRef]
  3. Zappettini, F.; Reyes-Chamorro, L.; Valencia, F.; Andrade, A.; Alarcón, M.; Lisoni, J. Design and Implementation of a Test Bench for Lithium-Ion Batteries. In Proceedings of the 2023 IEEE CHILEAN Conference on Electrical, Electronics Engineering, Information and Communication Technologies (CHILECON), Valdivia, Chile, 5–7 December 2023; pp. 1–5. [Google Scholar] [CrossRef]
  4. Wang, Y.; Yu, T.; Chen, J.; Gao, B.; Yu, M.; Zhu, J. Advances in Safety of Lithium-Ion Batteries for Energy Storage: Hazard Characteristics and Active Suppression Techniques. Energy Rev. 2025, 4, 100117. [Google Scholar] [CrossRef]
  5. Menye, J.S.; Camara, M.B.; Dakyo, B. Lithium Battery Degradation and Failure Mechanisms: A State-of-the-Art Review. Energies 2025, 18, 342. [Google Scholar] [CrossRef]
  6. Júnior, C.A.R.; Sanseverino, E.R.; Gallo, P.; Amaral, M.M.; Koch, D.; Kotak, Y.; Diel, S.; Walter, G.; Schweiger, H.G.; Zanin, H. Unraveling the Degradation Mechanisms of Lithium-Ion Batteries. Energies 2024, 17, 3372. [Google Scholar] [CrossRef]
  7. Han, X.; Lu, L.; Zheng, Y.; Feng, X.; Li, Z.; Li, J.; Ouyang, M. A Review on the Key Issues of the Lithium Ion Battery Degradation among the Whole Life Cycle. eTransportation 2019, 1, 100005. [Google Scholar] [CrossRef]
  8. Aissa, B.; Lakhdar, L.; Med, B.B.; Yazid, B.E.; Amirat, M.A.; Bensikaddour, E.H. Lithium-Ion Battery Test Bench Development for Aerospace Applications. In Proceedings of the 2022 2nd International Conference on Advanced Electrical Engineering (ICAEE), Constantine, Algeria, 29–31 October 2022; pp. 1–5. [Google Scholar] [CrossRef]
  9. Wei, P.; Abid, M.; Adun, H.; Awoh, D.K.; Cai, D.; Zaini, J.H.; Bamisile, O. Progress in Energy Storage Technologies and Methods for Renewable Energy Systems Application. Appl. Sci. 2023, 13, 5626. [Google Scholar] [CrossRef]
  10. Wang, L.; Jiang, S.; Mao, Y.; Li, Z.; Zhang, Y.; Li, M. Lithium-Ion Battery State of Health Estimation Method Based on Variational Quantum Algorithm Optimized Stacking Strategy. Energy Rep. 2024, 11, 2877–2891. [Google Scholar] [CrossRef]
  11. Ilies, A.I.; Pitica, D.; Chindris, G.; Fodor, A. Test Bench for Electrical and Performance Evaluation of Lithium-Ion Batteries. In Proceedings of the 2019 IEEE 25th International Symposium for Design and Technology in Electronic Packaging (SIITME), Cluj-Napoca, Romania, 23–26 October 2019; pp. 413–418. [Google Scholar] [CrossRef]
  12. Lipu, M.H.; Hannan, M.; Hussain, A.; Hoque, M.; Ker, P.J.; Saad, M.; Ayob, A. A Review of State of Health and Remaining Useful Life Estimation Methods for Lithium-Ion Battery in Electric Vehicles: Challenges and Recommendations. J. Clean. Prod. 2018, 205, 115–133. [Google Scholar] [CrossRef]
  13. Zhao, J.; Feng, X.; Tran, M.K.; Fowler, M.; Ouyang, M.; Burke, A.F. Battery Safety: Fault Diagnosis From Laboratory to Real World. J. Power Sources 2024, 598, 234111. [Google Scholar] [CrossRef]
  14. Khan, J. Challenges and Solutions for Hardware in the Loop Simulation - HILS Validation of Battery Management and Battery Monitoring System Modules. In Proceedings of the SAE 2016 World Congress and Exhibition, Detroit, MI, USA, 12–14 April 2016. [Google Scholar] [CrossRef]
  15. Fill, A.; Mader, T.; Schmidt, T.; Llorente, R.; Birke, K.P. Measuring Test Bench with Adjustable Thermal Connection of Cells to Their Neighbors and a New Model Approach for Parallel-Connected Cells. Batteries 2020, 6, 2. [Google Scholar] [CrossRef]
  16. Berg, P.; Soellner, J.; Jossen, A. Structural Dynamics of Lithium-Ion Cells—Part I: Method, Test Bench Validation and Investigation of Lithium-Ion Pouch Cells. J. Energy Storage 2019, 26, 100916. [Google Scholar] [CrossRef]
  17. Li, Q.; Song, R.; Wei, Y. A Review of State-of-Health Estimation for Lithium-Ion Battery Packs. J. Energy Storage 2025, 118, 116078. [Google Scholar] [CrossRef]
  18. Su, L.; Xu, Y.; Dong, Z. State-of-Health Estimation of Lithium-Ion Batteries: A Comprehensive Literature Review from Cell to Pack Levels. Energy Convers. Econ. 2024, 5, 224–242. [Google Scholar] [CrossRef]
  19. Wang, J.; Yang, H.; Wang, Z.; Zhou, Y.; Liu, P.; Hong, J. State of Health Analysis of Batteries at Different Stages Based on Real-World Vehicle Data and Machine Learning. J. Energy Storage 2024, 88, 111616. [Google Scholar] [CrossRef]
  20. Guerrero Cervera, T.; Vega-Leal, A.P.; Adame García, G.; Brey Sánchez, J. PEMFC Impedance Spectroscopy Using Synthetic Wide-Band Signals. Int. J. Hydrogen Energy 2014, 39, 4005–4008. [Google Scholar] [CrossRef]
  21. Gong, J.; Xu, B.; Chen, F.; Zhou, G. Predictive Modeling for Electric Vehicle Battery State of Health: A Comprehensive Literature Review. Energies 2025, 18, 337. [Google Scholar] [CrossRef]
  22. Zhang, J.; Li, K. State-of-Health Estimation for Lithium-Ion Batteries in Hybrid Electric Vehicles—A Review. Energies 2024, 17, 5753. [Google Scholar] [CrossRef]
  23. Lei, X.; Xie, F.; Wang, J.; Zhang, C. A Review of Lithium-Ion Battery State of Health and Remaining Useful Life Estimation Methods Based on Bibliometric Analysis. J. Traffic Transp. Eng. (English Ed.) 2024, 11, 1420–1446. [Google Scholar] [CrossRef]
  24. Liu, Y.; Chen, H.; Yao, L.; Ding, J.; Chen, S.; Wang, Z. A Physics-Guided Approach for Accurate Battery SOH Estimation Using RCMHCRE and BatteryPINN. Adv. Eng. Inform. 2025, 65, 103211. [Google Scholar] [CrossRef]
  25. Zhao, X.; Hu, J.; Hu, G.; Qiu, H. A State of Health Estimation Framework Based on Real-World Electric Vehicles Operating Data. J. Energy Storage 2023, 63, 107031. [Google Scholar] [CrossRef]
  26. Sedlařík, M.; Vyroubal, P.; Capková, D.; Omerdic, E.; Rae, M.; Mačák, M.; Šedina, M.; Kazda, T. Advanced Machine Learning Techniques for State-of-Health Estimation in Lithium-Ion Batteries: A Comparative Study. Electrochim. Acta 2025, 524, 145988. [Google Scholar] [CrossRef]
  27. Soyoye, B.D.; Bhattacharya, I.; Dhason, M.V.A.; Banik, T. State of Charge and State of Health Estimation in Electric Vehicles: Challenges, Approaches and Future Directions. Batteries 2025, 11. [Google Scholar] [CrossRef]
  28. Lin, C.; Xu, J.; Jiang, D.; Hou, J.; Liang, Y.; Zou, Z.; Mei, X. Multi-Model Ensemble Learning for Battery State-of-Health Estimation: Recent Advances and Perspectives. J. Energy Chem. 2025, 100, 739–759. [Google Scholar] [CrossRef]
  29. Tao, J.; Wang, S.; Cao, W.; Takyi-Aninakwa, P.; Fernandez, C.; Guerrero, J.M. A Comprehensive Review of State-of-Charge and State-of-Health Estimation for Lithium-Ion Battery Energy Storage Systems. Ionics 2024, 30, 5903–5927. [Google Scholar] [CrossRef]
  30. Li, Q.; Xue, W. A Review of Feature Extraction toward Health State Estimation of Lithium-Ion Batteries. J. Energy Storage 2025, 112, 115453. [Google Scholar] [CrossRef]
  31. Hong, J.; Li, K.; Liang, F.; Yang, H.; Zhang, C.; Yang, Q.; Wang, J. A Novel State of Health Prediction Method for Battery System in Real-World Vehicles Based on Gated Recurrent Unit Neural Networks. Energy 2024, 289, 129918. [Google Scholar] [CrossRef]
  32. Wentao, M.; Shizhuo, R.; Peng, G. Review of State of Power Estimation for Li-Ion Batteries: Methods, Issues, and Prospects. J. Electrochem. Sci. Technol. 2025, 16, 15–36. [Google Scholar] [CrossRef]
  33. Li, Y.; Zhang, X.; Li, Z.; Li, X.; Liu, G.; Gao, W. Accurate and adaptive state of health estimation for lithium-ion battery based on patch learning framework. Measurement 2025, 250, 117083. [Google Scholar] [CrossRef]
  34. Chen, J.; Li, K.; Liu, W.; Yin, C.; Zhu, Q.; Tang, H. A Novel State of Charge Estimation Method for LiFePO4 Battery Based on Combined Modeling of Physical Model and Machine Learning Model. J. Energy Storage 2025, 115, 115888. [Google Scholar] [CrossRef]
  35. Chen, G.J.; Chung, W.H. Evaluation of Charging Methods for Lithium-Ion Batteries. Electronics 2023, 12, 4095. [Google Scholar] [CrossRef]
  36. Liu, H.; Naqvi, I.; Li, F.; Liu, C.; Shafiei, N.; Li, Y.; Pecht, M. An Analytical Model for the CC-CV Charge of Li-Ion Batteries with Application to Degradation Analysis. J. Energy Storage 2020, 29, 101342. [Google Scholar] [CrossRef]
  37. Maheswaran, V.D.; Carter, S.B.R.; Vijay, V.; Raj, S.V. Study and Implementation of Constant Current-Constant Voltage(CC-CV) Charger for Lithium-Ion(Li-Ion) Battery Using Machine Learning(ML). In Proceedings of the 2024 IEEE 4th International Conference on Sustainable Energy and Future Electric Transportation (SEFET), Hyderabad, India, 31 July–3 August 2024; pp. 1–5. [Google Scholar] [CrossRef]
  38. Shen, W.; Vo, T.T.; Kapoor, A. Charging Algorithms of Lithium-Ion Batteries: An Overview. In Proceedings of the 2012 7th IEEE Conference on Industrial Electronics and Applications (ICIEA), Singapore, 18–20 July 2012; pp. 1567–1572. [Google Scholar] [CrossRef]
  39. Singh, P.; Chen, C.; Tan, C.M.; Huang, S.C. Semi-Empirical Capacity Fading Model for SoH Estimation of Li-Ion Batteries. Appl. Sci. 2019, 9, 3012. [Google Scholar] [CrossRef]
  40. Theuerkauf, D.; Swan, L. Characteristics of Open Circuit Voltage Relaxation in Lithium-Ion Batteries for the Purpose of State of Charge and State of Health Analysis. Batteries 2022, 8, 77. [Google Scholar] [CrossRef]
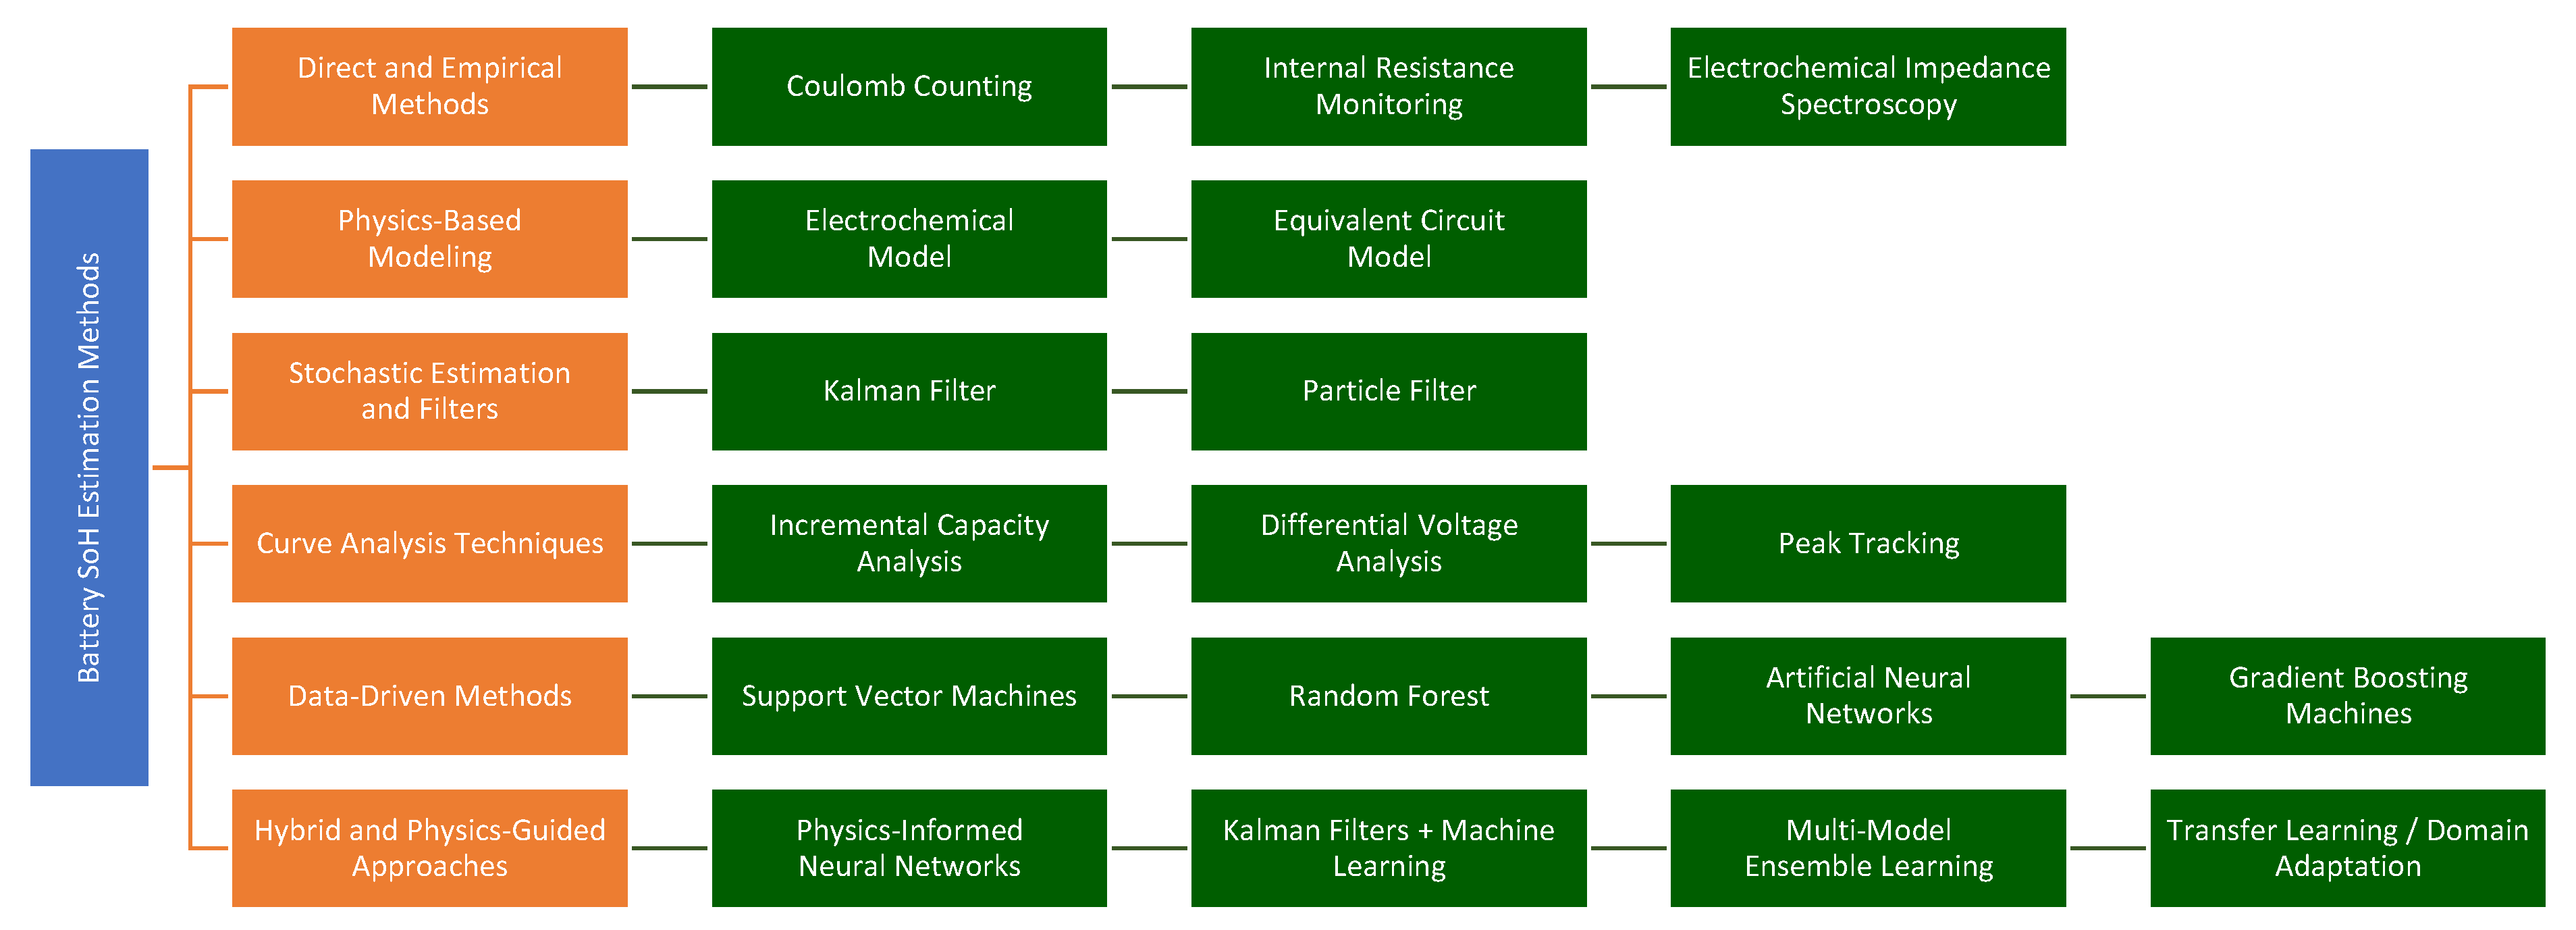
Figure 1. Classification of main SoH estimation techniques.
Energies 18 02304 g001
Figure 2. CC-CV method charging process: Voltage and current as a function of time.
Energies 18 02304 g002
Figure 3. CC method discharging process: Voltage and current as a function of time.
Energies 18 02304 g003
Figure 4. Schematic of the proposed system for the testing of rechargeable batteries.
Energies 18 02304 g004
Figure 5. Photograph of the designed test bench. The tested battery is placed in a fireproof box of the following dimensions: 21.5 × 15 × 17 cm.
Energies 18 02304 g005
Figure 6. Monitoring and control environment for the battery characterization.
Energies 18 02304 g006
Figure 7. Flowchart diagram of the software developed.
Energies 18 02304 g007
Figure 8. Main characteristics and specifications of the analyzed battery cell.
Energies 18 02304 g008
Figure 9. Experimental results obtained using the proposed system and a LiFePO4 rechargable battery cell. (a) Charging process: Voltage, current, and temperature as a function of time. (b) Discharging process: Voltage, current, and temperature as a function of time. (c) Two continuous cycles of charge and discharge. (d) SoH as a function of the number of cycles.
Energies 18 02304 g009
Figure 10. Charge and discharge process during the second set of experiments: voltage, current, and temperature as a function of time.
Energies 18 02304 g010
Figure 11. Third charge and discharge cycle: voltage, current, and temperature as a function of time.
Energies 18 02304 g011
Figure 12. Open-circuit voltage curve as a function of the state of charge.
Energies 18 02304 g012
Table 1. Summary of pros and cons of SoH estimation methods.
Category Representative MethodsProsCons
Direct and empiricalCoulomb counting, internal resistance, electrochemical impedance spectroscopySimple implementation; Physically interpretable; High accuracy under lab conditionsRequires controlled environments; Poor performance for online estimation; Sensitive to noise and aging
Physics-based modelsElectrochemical model, equivalent circuit modelMechanistic insight; Captures degradation mechanisms; Enables predictive modelingHigh computational cost; Difficult parameter identification
Stochastic filtersKalman filter, particle filterReal-time estimation; Handles noisy/incomplete data; Adaptable to system changesModel-dependent; Computationally intensive; Sensitive to initialization
Curve Analysis TechniquesIncremental capacity analysis, differential voltage analysis, peak trackingNon-invasive; Detects specific degradation modes; Useful for cell diagnosticsRequires high-resolution data; Sensitive to noise; Not suitable for real-time use
Machine LearningSupport vector machines, random forest, artificial neural networks, gradient boosting machinesLearns complex nonlinear patterns; Suitable for real-time applications; Can integrate into BMSNeeds large, labeled datasets; Risk of overfitting; Often lacks physical interpretability
Hybrid & Physics-GuidedPhysics-informed neural networks, Kalman filters + Machine learning, multi-model ensemble learning, transfer learning/domain adaptationCombines data and physics; High accuracy and generalization; Adaptive and robustComplex to design and tune; Synchronization of models is challenging; Often still in research phase
Disclaimer/Publisher’s Note: The statements, opinions and data contained in all publications are solely those of the individual author(s) and contributor(s) and not of MDPI and/or the editor(s). MDPI and/or the editor(s) disclaim responsibility for any injury to people or property resulting from any ideas, methods, instructions or products referred to in the content.

