1. Introduction
The first radiators, in the form we know today, began to appear in the 19th century. As technology progressed, radiators evolved and their design began to change to maximize the efficiency of heat transfer. Flexible radiators are modern solutions in the field of heat dissipation, and are characterized by the high flexibility of the materials from which they are made. Their adaptation to various shapes and sizes makes them an ideal solution in unusual applications [
1]. They can be used for thermal management, which is critical for several fast-growing markets, such as the lithium-ion battery market [
2]. The thermal performance of a heat radiator depends on its height, width, and fin design. Larger heat sinks with more surface area and better-designed fins can more effectively remove heat from components [
3,
4]. Therefore, for this purpose, an unconventional textile material was used, namely, 3D spatial knitted fabrics. Distance-knitted fabrics have been available on the market for a few years and still arouse the interest of users due to numerous properties. They are used in many areas of life. One of the directions of development and applications is personal and technical protective equipment, with a view to increasing work safety [
5]. Technical solutions using this material include, for example, seat covers of machine and device operators that dampen low-frequency vibrations and anti-vibration gloves. However, a novelty is the use of these materials in passive radiator structures, where the textile also acts as a barrier against burns and can be used, e.g., in thermal management in the military or air space sector [
6]. A good example could be their use as a support tool for multilayer insulation (MLI) blankets in space satellites, to maintain the insulation performance of MLI to retain the extremely low temperature of satellite sensors or fuel tanks [
7,
8].
This type of barrier is a basic method of technical collective protection [
9]. The development of materials engineering has led to the development of the multifunctional fiber industry. This has started a new era in textronics structures.
In the presented research, a yarn with good heat dissipation properties is selected. In the THS design assumptions, a yarn is selected whose thermal conductivity coefficient is higher than classic textile materials such as cotton or silk. Additionally, to intensify the heat release phenomenon, a spatial knitted structure is selected. The varied weave density facilitates heat exchange. Thanks to the connectors (multi ribs) in the spacer knit, the heat release surface is increased.
The tests are carried out in laboratory conditions in relation to existing boundary conditions and constitute the basis for further analysis in the topic of multilayer insulation in space [
10,
11]. MLI works in conjunction with other thermal control systems (e.g., radiators) to achieve thermal balance. The goal is to ensure that the satellite’s components operate within their specified temperature ranges between −10 and 40 °C, which are often much narrower than those of the external environment [
12,
13].
2. Materials
Monofilament yarns were used to produce spacer fabrics intended for a flexible THS. These yarns were composed of PES monofilaments covered with a thin layer of aluminum. The yarn was produced by a Chinese company, Changzhou Longma Polymer Technology Co., Ltd. (Changzhou, China). This is a material with an increased thermal conductivity λ, 200 W/(mK), which affects the efficiency of heat dissipation. The total thermal conductivity λ of the coated yarn—whose tex is 167, where the thickness of the aluminum coating (3 µm) is very small compared to the diameter of the PES monofilament—is equal to 16.4 W/(mK).
It is lightweight and corrosion-resistant. In addition, it is very well processed on knitting machines. As a result, the knitted, passive radiator is simple and cheap to produce. It is manufactured in a single production process, as a meter product. This allows for any optimization of shapes depending on requirements. Due to their versatility, flexible radiator panels can be used, e.g., in the automotive, aviation, and space industries [
14,
15,
16].
A spacer knitted fabric is also called a mesh 3D or distance-knitted fabric. This type of knitted fabric is modern and ensures a high air permeability and the minimal absorption of water and moisture. Due to their advantages, distance knitted fabrics are gaining popularity in many applications [
17]. Here, we use a knitted or a double-knit structure with a significant thickness, determined by the distance (3) between the outer layers (1) and (2) the knitted fabric (
Figure 1). The samples of knitted fabrics mentioned are warp knitted. The fabrics were made on an HD 6/20-65 EL machine from the Karl Mayer company with a gauge number E12. This machine operates in the range of knitted fabric thicknesses of 20 to 65 mm. It is equipped with 6 needle combs and its working width is 138 inches. The physical and mechanical parameters of distance fabrics and particular yarns that were tested are presented in
Table 1 and
Table 2. The thickness parameter was measured in accordance with PN-EN ISO 5084: 2008 (Determination of the thickness of textile products) [
18]. The exact amount of pressure during the thickness measurement “in discs” was 37.91 kPa.
The test sample was placed between the two reference surfaces exerting a specific pressure, and the distance between them was measured using an optical thickness gauge. The measurement results were determined in accordance with the standard, with an accuracy of 0.01 mm. The coefficient of variation was calculated as 0.1%. The areal density was determined based on standard PN-P-04613:1997 [
19]. Ten samples were tested for each variant of the knitted fabric. The measurement was made on the scale with an accuracy of 0.01 g. The compression stiffness was measured using the Chinese standard FZ/T01051.2-1998 [
20]. The tests were carried out on an Haunsfield H50K-S testing machine (Riedlingen, Germany).
The diameter of the tested samples was 120 mm. The compression process was carried out with a head speed v = 10 mm/min. Compression was carried out in three consecutive hysteresis loops for 25%, 50%, and 75% of the maximum forces. The linear mass of component yarns for spacer knitted fabrics are presented in
Table 1.
Apparatus Used in Research
- (1)
A climatic chamber stabilizing the humidity and temperature parameters.
- (2)
Matrix laboratory power supply model MPS-3003L-3 (Matrix Orbital, Calgary, AB, Canada).
- (3)
Insulated hob with a total power of 12 W; heating area 0.015 m2 (LUT, Lodz, Poland).
- (4)
Amprobe TMD90A thermometers (0.1% rdg + 0.5 °C) (Amprobe, Washington, DC, USA).
- (5)
AXIO MET AX 594 multimeter (Axiomet, Malmö, Poland).
- (6)
Moisture meter, range 0~100% RH; accuracy ≤ ±4% RH (Axiomet, Malmö, Poland).
- (7)
Infrared camera, Flir SC 5000, 320 × 256 pixel resolution, 0.02 K sensitivity, 150 Hz acquisition frequency (Flir, Portland, OR, USA).
- (8)
Haunsfield H50K-S testing machine (Riedlingen, Germany).
- (9)
Microscope interference and polarization companies PZO (Warsaw, Poland).
3. Methods
The designed textile radiators were subjected to a heat source to evaluate their performance as heat radiators. The following assumptions were considered:
- -
The heat source (max. power of 10 W) had the same dimensions as the base of the textile heat sink (THS).
- -
The connection between the heat source and the THS was tight. Thus, it allowed for an immediate and lossless transfer of thermal flow.
- -
The THS was oriented vertically without forced air circulation in the system.
- -
The dimensions of monofilaments diameter and height were much smaller than the dimensions of the sample radiator, so that the surface area perpendicular to the direction of airflow was negligible in relation to the entire THS surface.
- -
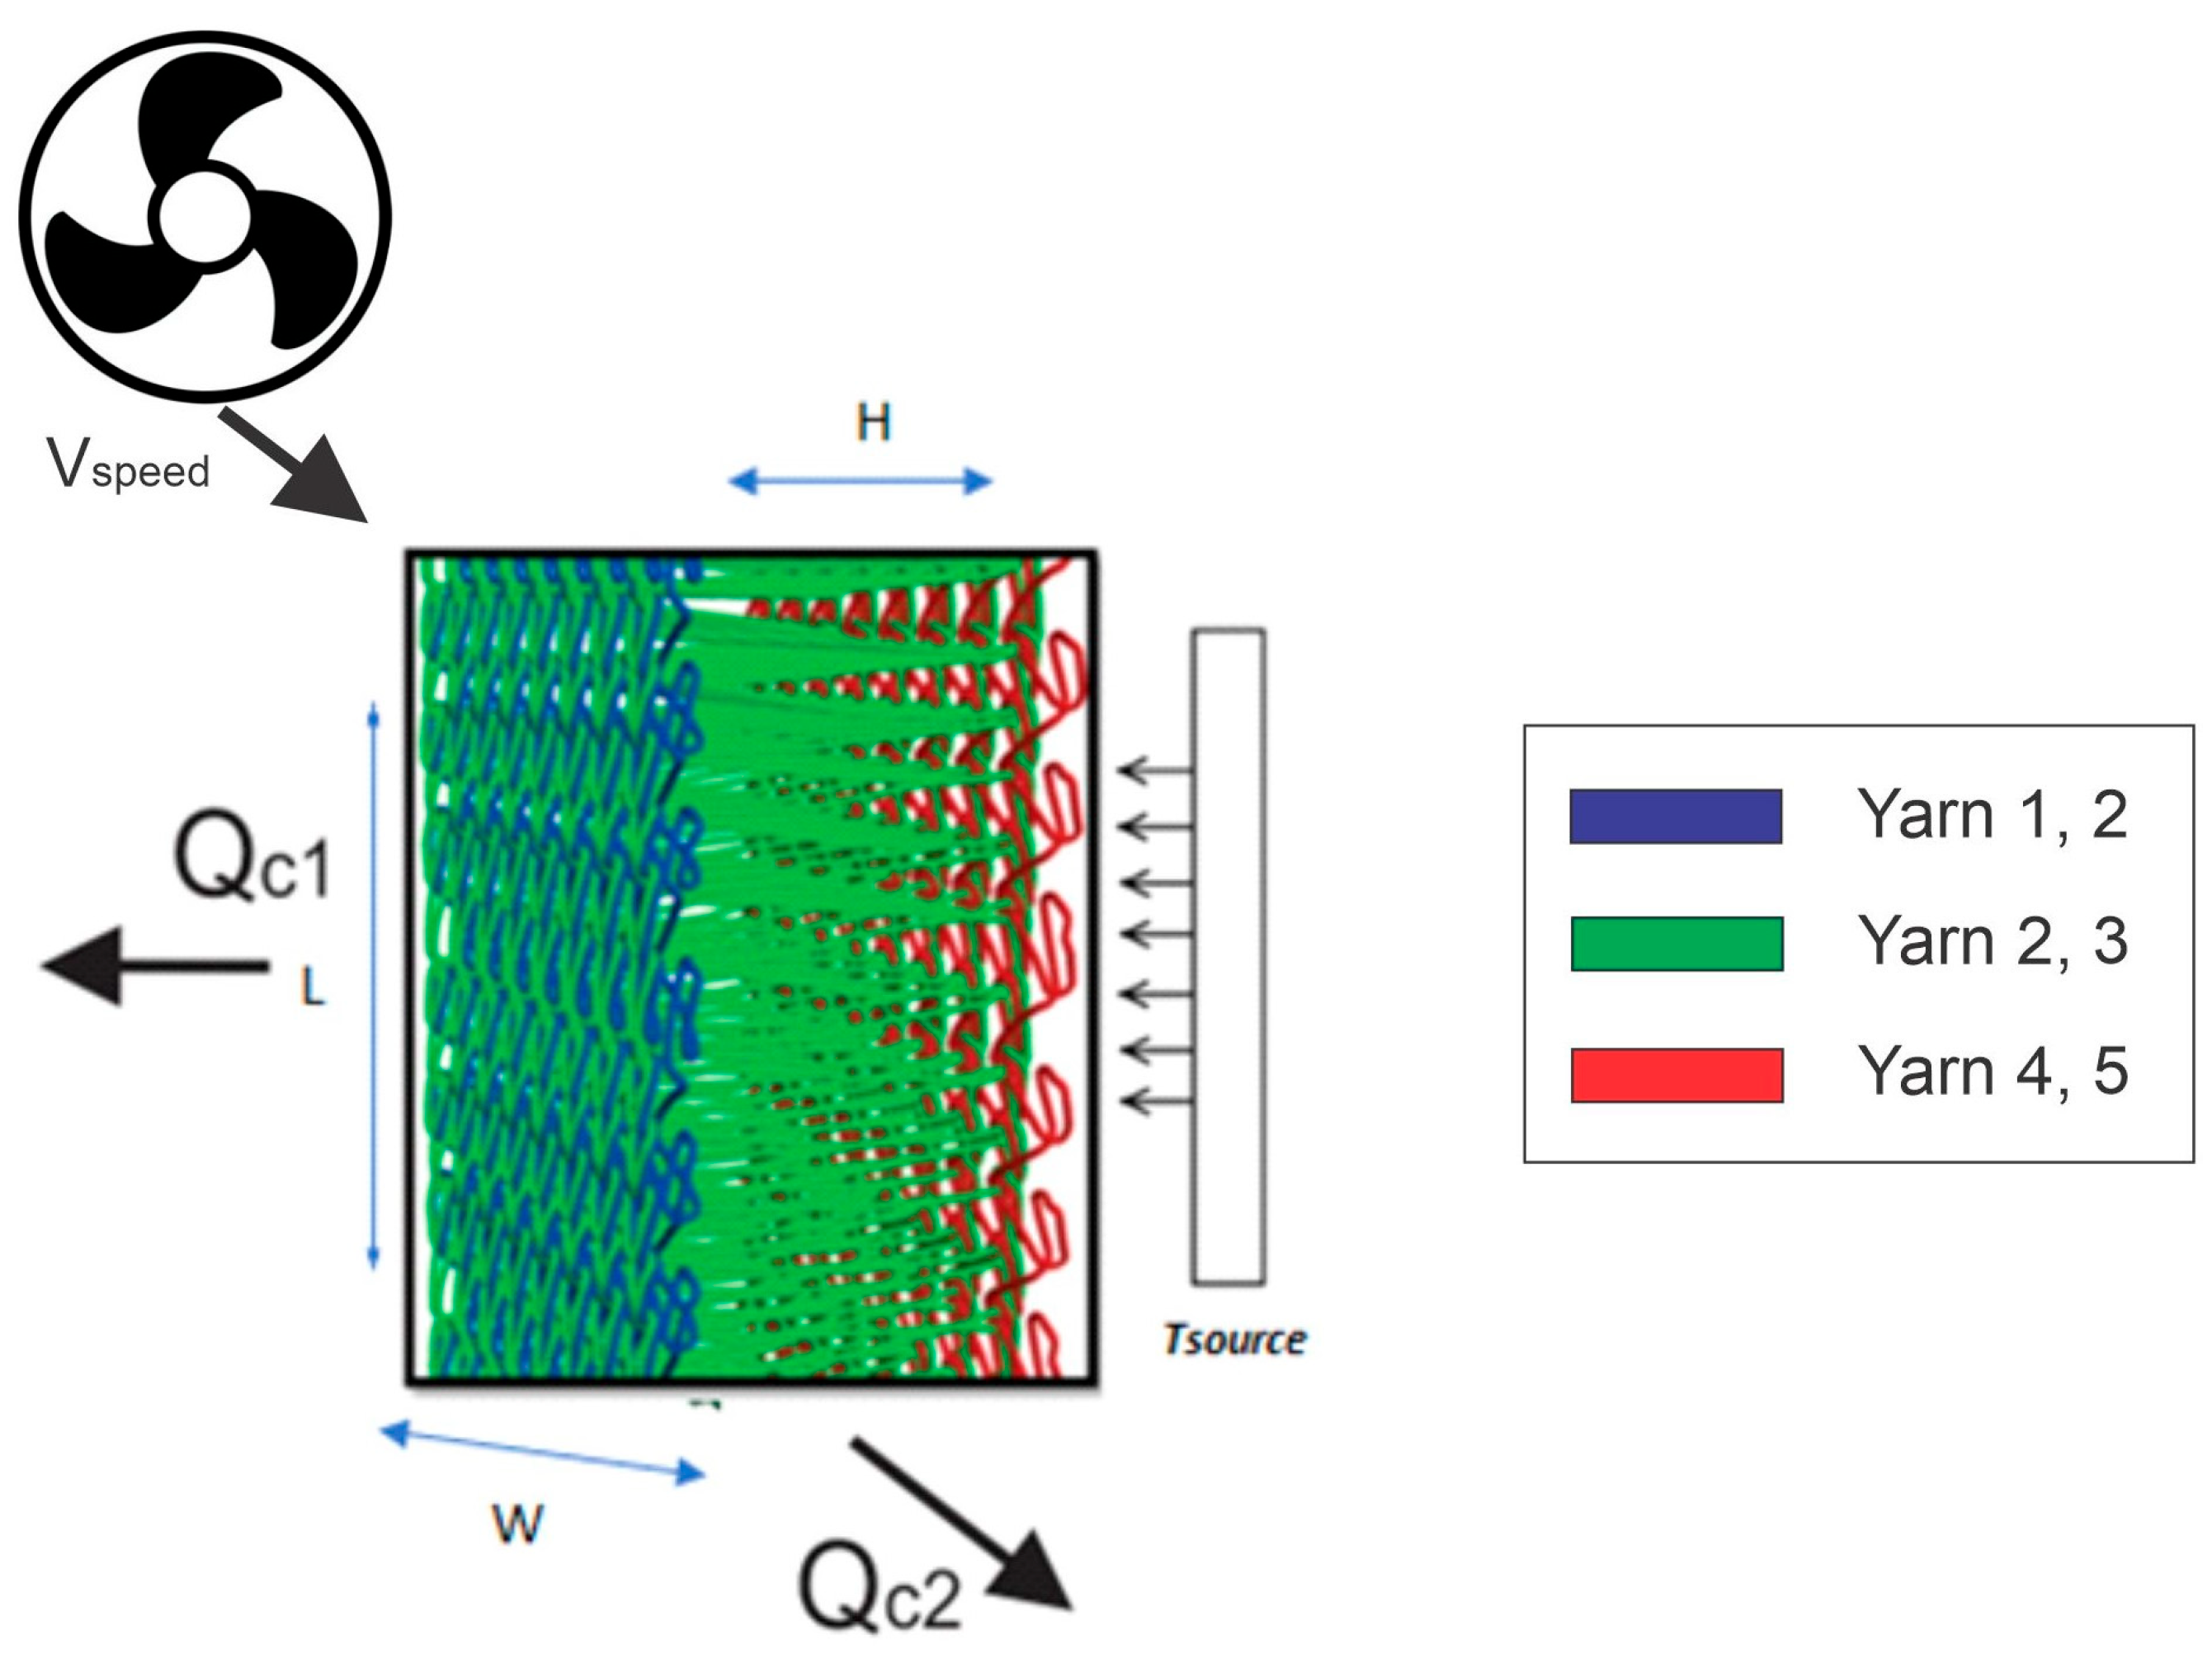
The thermal conductivity of the textile radiator was so high that the temperature distribution over the entire surface of this element was uniform and approximately equal to the temperature of the heat source. As depicted in
Figure 2, the impact of the airflow is only taken into account through the A2 surface of the THS.
- -
Ambient temperature is 21 ± 1 °C and relative humidity: 65 ± 2% according to ASTM D1776/D1776M-20 [
21].
The objective of the presented research is to determine the optimal dimensions of the textile construction to effectively remove the heat from the source at specific temperatures (50, 70 °C).
Heat exchange is the process of transferring energy from one system of bodies to another as a result of the temperature difference. The basic concept related to the heat exchange phenomenon is the amount of heat
Q transferred in the considered system limited by the surface F. In practice, the quantity
Q is calculated as the amount of heat transferred by this surface. Another concept describing heat exchange is the heat flux intensity
q. The measure of this quantity is the expression [
22,
23]:
where Δ
Qh—amount of heat transferred by the surface element
is related to the unit of time.
In the process of unsteady heat exchange, the temperature distribution and the amount of heat exchanged change over time. For this case, the quantity
q is a function of time, and the relationship for calculating
Q has the following form:
In the case of the prototype that was manufactured, the following calculation procedure was adopted. The heat convection
Qc1 through the
A1 surface can be calculated using the following formula:
where
h1 is the heat transfer coefficient through the
A1 surface and is equal to
The outer surface of the THS can be calculated:
The heat convection through the
A2 surface (i.e.,
Qc2 in
Figure 1) can be measured using the following equation:
where
and the heat transfer coefficient through the
A2 surface is
where
k is the thermal conductivity of air at
Tavg.
In the above relations,
Sopt is the optimal distance between the fins allowing the highest rate of natural heat convection, being
where
β defines the thermal expansion coefficient, approximately
α is the thermal diffusivity of air for Tavg;
γ is the kinetic viscosity of air at Tavg;
g is the acceleration due to gravity.
4. Textile Radiator Simulation Model
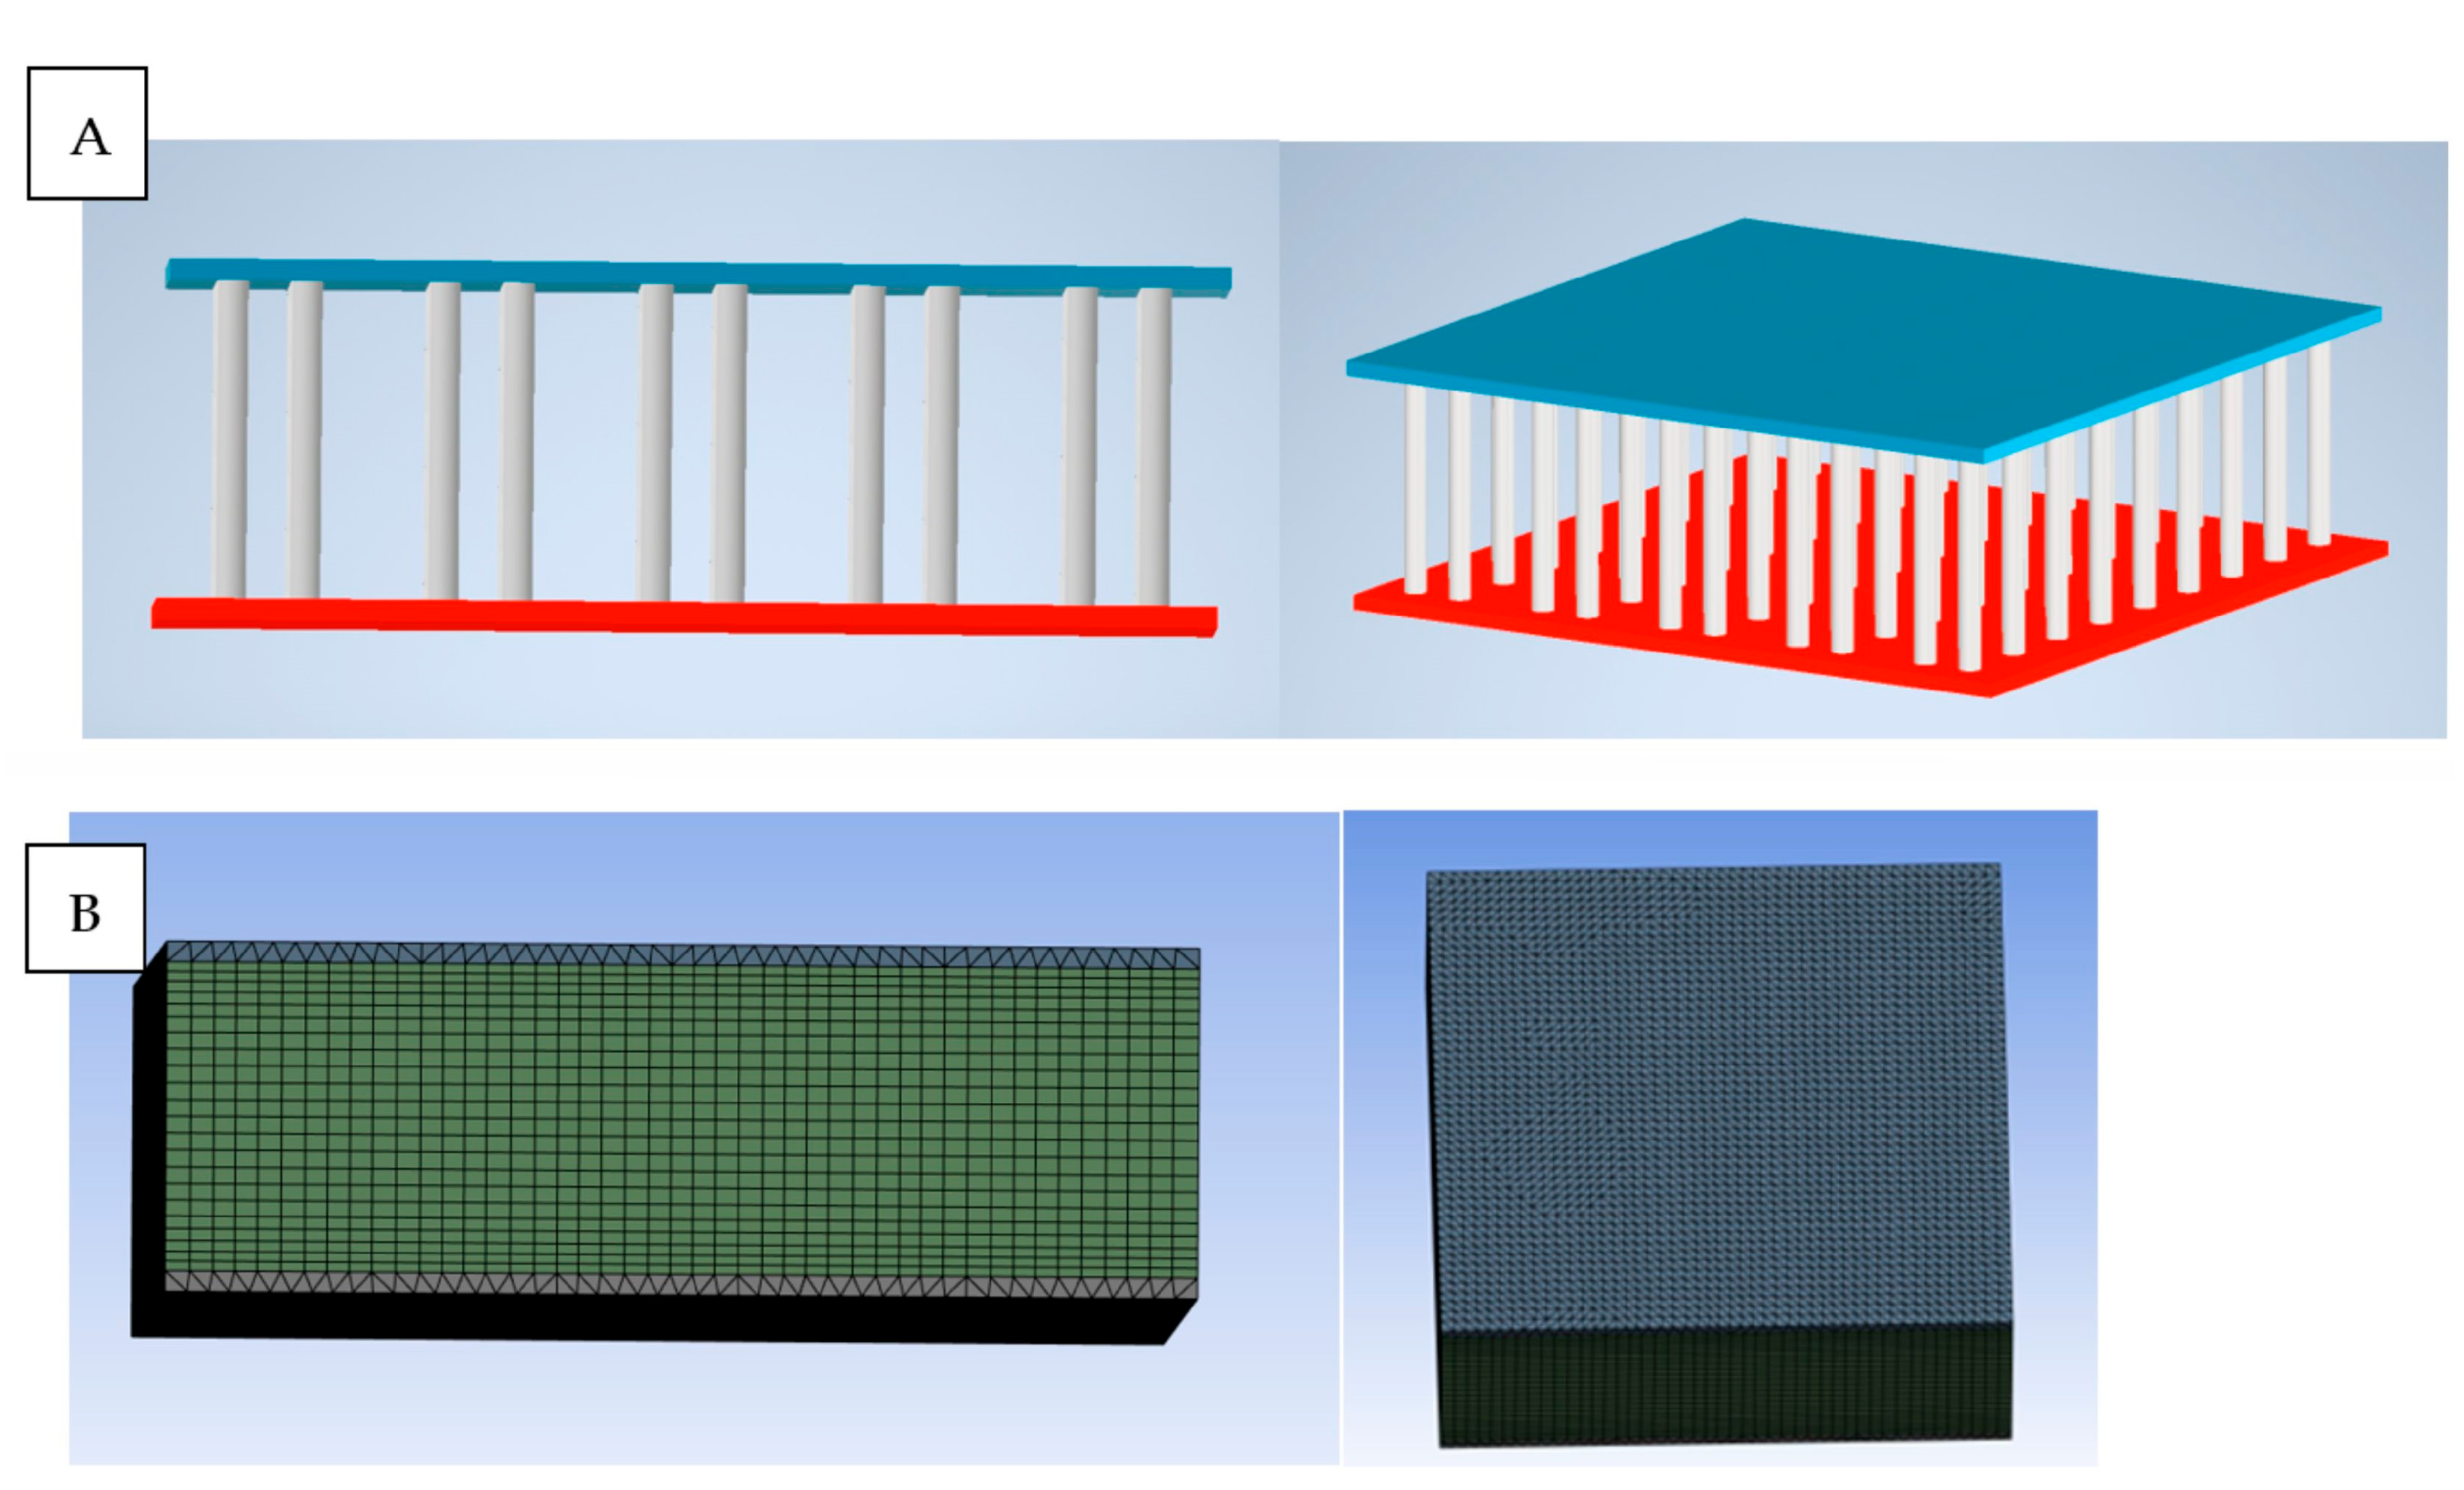
Ansys simulation software of dispersion of heat through the textile radiator was used. It was divided into two parts. The first one was the preparation of the 3D model in CAD software; in this particular case, it was performed in Autodesk Inventor. The second one was the implementation of the model into Ansys software and the analysis of heat dispersion. The first important thing was the shape and overall form of the radiator. It was decided that the radiator would be divided into three main parts: two plates and connectors between them. The first attempt was designed using real-life dimensions, so plates were around 0.3 × 0.3 m each, with small cuts for connector positions. Unfortunately, the size of the elements was improper for analysis and for computer device performance. The huge size of the plates in conjunction with the size of the connectors resulted in an enormous number of elements. The whole model consisted of thousands of elements. It was decided that some simplification was required. The second version was much smaller than the previous one. It is presented in the figures below. Unfortunately, this time, the number of elements was, again, enormous. Because of that, it was decided to take only one smaller piece for analysis in size, which was exactly the same as the radiator used in the laboratory test. Because of that, the final version of the 3D model was developed, and it is presented below in
Figure 3.
4.1. Airflow Simulation
After the 3D model was created, the flow simulation could be conducted. The first thing was the implementation of the model into the Ansys software. The first important thing was to model the flow through the solid body. To create flow through the solid body, an additional thing was performed. On each side of the radiator with the connectors, an additional domain was applied. This solution is presented in
Figure 4 and
Figure 5. After the addition of the planes, the mesh could be applied. It was performed with standard mesh with the application of the body sizing to concentrate the mesh. The last, but probably most important, thing was the setup of analysis. Whole analysis was conducted using a transient time step. Material properties were added to the model. Consequently, the hot part of the radiator was simulated as aluminum, while the cold part and the connector were simulated as polyester. The next step was boundary conditions. The inlet and outlet were applied on additionally added planes. Airflow velocity was set as 0.2, 0.5, and 1 m/s. Also, temperature conditions were applied. For CFX analysis, two temperature conditions were chosen: 50 °C and 70 °C. Analyses were conducted with timesteps of 600 steps at 2 s each. The environment temperature was equal to 20 °C. The results of the analysis are presented below.
4.2. Research and Results of Heat Convection Through the Surface of THS
The temperature of the heat source (TSource) and the temperature within the channels of the THS were measured using an AMD 9023 Thermocouple probe, type K. Accordingly, thermocouples were inserted on the heat source sink (10 W max. power) and within the channels of the THS. Furthermore, the temperature on the A1 and A2 surfaces of the textile heat sink were evaluated using an imaging technique and infrared camera, Flir SC 5000, 320 × 256 pixel resolution, 0.02 K sensitivity, 150 Hz acquisition frequency (Flir, Portland, OR, USA). To assess the impact of the air speed, a fan was placed next to the A2 surface of the composites, creating airflow with the set flow value. The fan had constant aerodynamic regulation with laminar airflow. The air velocity was measured in the central part of the THS channel using a Prandtl probe.
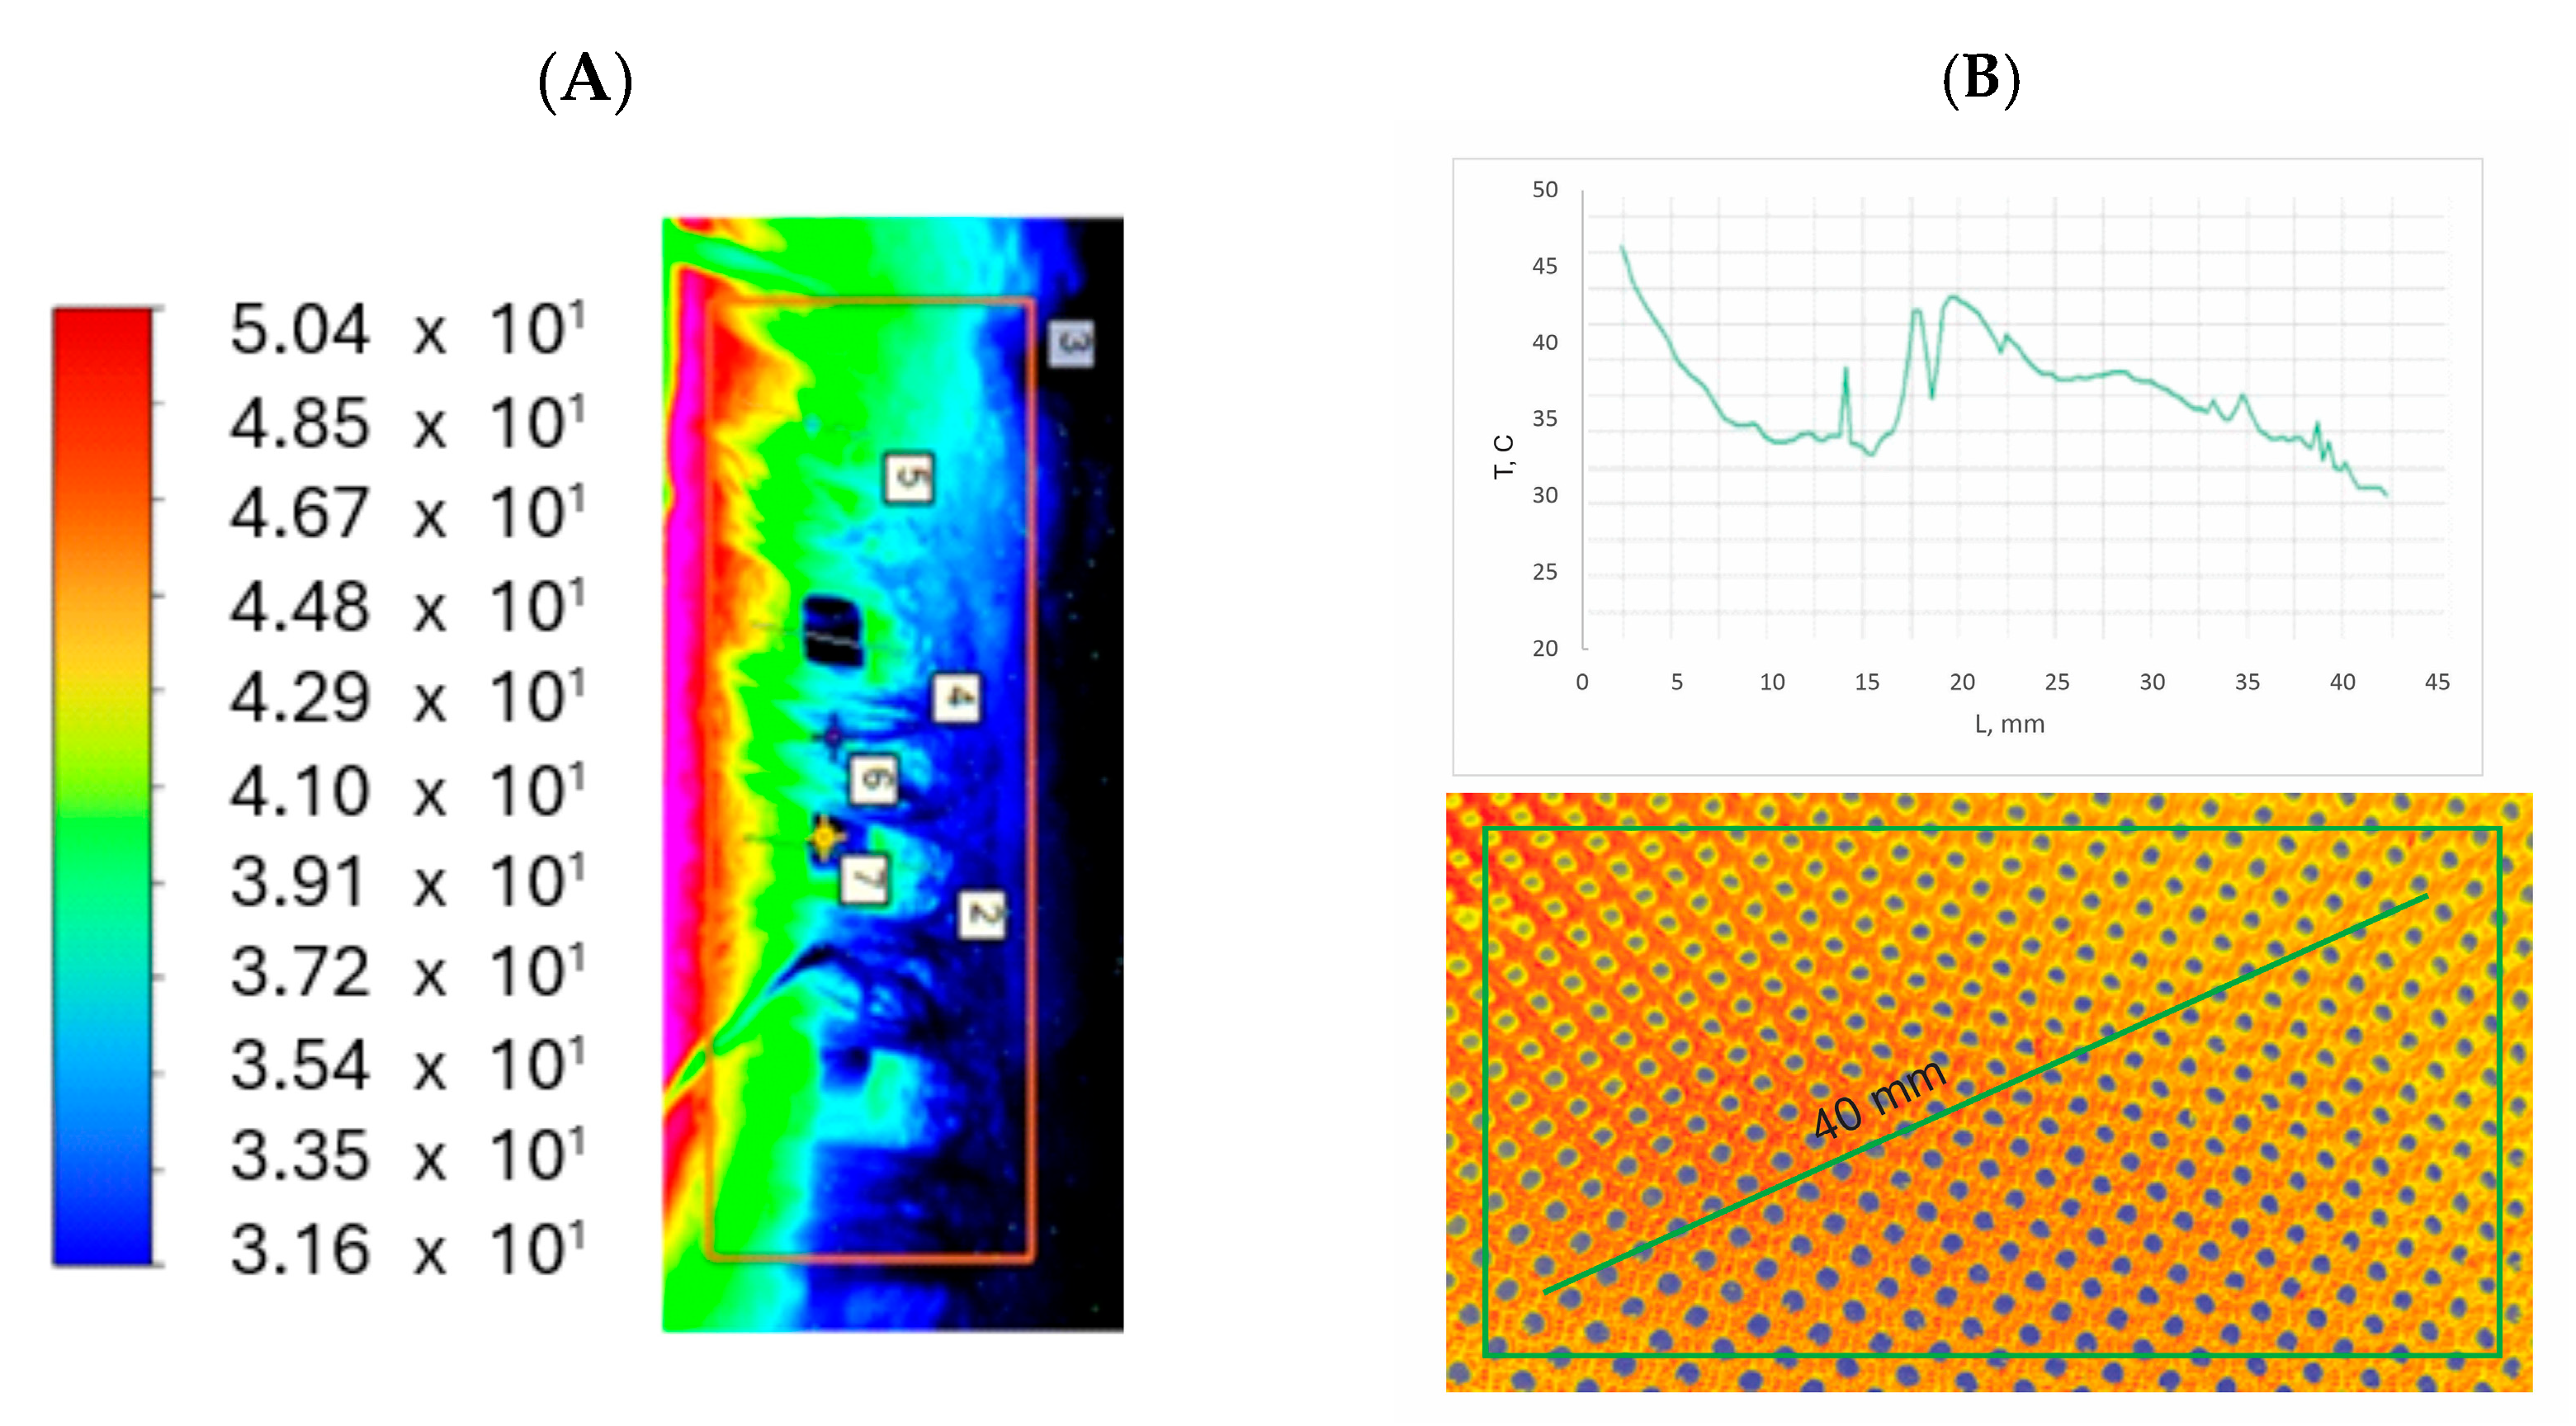
Figure 6B presents the simulated temperature distribution across the THS surface at a source temperature of 50.4 °C. The image reveals a clear temperature gradient, with the highest temperatures (approximately 50.4 °C, red/orange hues) concentrated near the heat source (left side). The temperature progressively decreases away from the source, transitioning through yellow, green, light blue, and, finally, dark blue (approximately 31.6 °C), indicating effective heat dissipation. The uniform color banding along each “channel” suggests homogenous heat conduction.
Figure 6B presents the simulated temperature profile along the THS channel axis. The temperature decreases sharply from approximately 50 °C (at −45 mm, near the heat source) to 38 °C within the first 5 mm (
Figure 6B).
Table 3 summarizes the recorded temperature at the middle of the channel’s radiator via the inserted thermocouples under various
TSource and air speeds. Based on such recordings,
Qc1 and
Qc2 were calculated through the
A1 and
A2 surfaces of THS, and noted in
Table 4.
A more gradual decrease to around 32 °C occurs between −40 mm and −20 mm, before stabilizing at this value. This indicates efficient heat dissipation near the source and subsequent temperature stabilization further along the channel. This profile confirms the THS’s effective heat dissipation. Both visualizations confirm the THS’s heat dissipation and validate the numerical model, which is shown in
Figure 7.
5. Discussion
Analysis of
Figure 4 reveals that the temperature profiles exhibit a clear dependence on airflow velocity. An increase in velocity induces a decrease in the radiator outlet temperature, which is consistent with the theory of convective heat transfer.
Figure 5 presents a temperature distribution map on the radiator surface, enabling visualization of the temperature gradient. It is observed that the area in the immediate vicinity of the heat source is characterized by the highest temperature, which gradually decreases as the distance from the source increases. The thermogram (
Figure 6) confirms these observations, providing visual evidence of the actual temperature distribution on the radiator surface. A comparison of data from
Table 3 and
Table 4 reveals that the heat convection coefficient values (
Qc2) increase proportionally with the increase in airflow velocity, both in simulation and experimental conditions. These quantitative data provide empirical confirmation of visual observations from the figures and highlight the crucial role of airflow velocity in the process of heat exchange intensification. This phenomenon is consistent with the laws of thermodynamics, where an increase in the velocity of the cooling medium leads to an intensification of convective heat transfer.
Optimizing the dimensions of the textile construction was a key objective of these preliminary studies. Due to the complexity of the model, including a large number of elements and computational difficulties, a series of simulations with various dimensions of preliminary samples were conducted. Initially, models with larger dimensions were tested, but their complexity prevented effective analysis. Ultimately, based on the simulations performed, the optimal dimensions of the preliminary sample are 12 × 12 cm. A sample with these dimensions provides effective heat dissipation at a relatively low mass. A sample with dimensions of 15 × 15 cm provides better heat dissipation, but its mass is already significantly greater, which may be disadvantageous in some applications. A sample with dimensions of 10 × 10 cm does not provide sufficient heat dissipation. Analysis of these preliminary results highlights the trade-off between heat dissipation efficiency and construction mass, which is crucial in the design of textile radiators. It should be noted that these are preliminary studies, and further analyses with more advanced models and simulations are necessary for full optimization of the construction.
When analyzing the temperature distribution simulation images for three different airflow velocities (0.2 m/s, 0.5 m/s, 1 m/s) with a constant heat source temperature of 50 °C, significant changes in thermal gradients along the radiator fins can be observed, reflecting the efficiency of convective heat dissipation. At the minimum airflow velocity of 0.2 m/s, the thermal gradient along the fins is relatively high. Based on the temperature scale analysis, the temperature in the immediate vicinity of the heat source is estimated to be 50 °C, while in the distal part of the fins, the temperature drops to values of around 29–32 °C. This indicates limited heat exchange capabilities at this velocity, resulting in a significant temperature drop deep into the structure.
As the airflow velocity increases to 0.5 m/s, the thermal gradient decreases. The temperature in the distal part of the fins rises to 28–31 °C, indicating an intensification of the convection process and better heat distribution.
At the maximum airflow velocity of 1 m/s, the thermal gradient is the lowest. The temperature in the distal part of the fins reaches values of 27–30 °C. This confirms that increasing the airflow velocity leads to the optimization of convection conditions, resulting in the most efficient heat dissipation and minimization of temperature differences along the fins. When comparing these values, it can be concluded that as the airflow velocity increases, the thermal gradients along the radiator fins gradually decrease, which is direct evidence of the increased efficiency of convective heat dissipation. Importantly, the temperature in the distal part of the radiator decreases with increasing airflow velocity, confirming that higher airflow velocities result in more efficient cooling of the entire radiator structure.
When analyzing the temperature distribution simulation images for three different airflow velocities (0.2 m/s, 0.5 m/s, 1 m/s) with a constant heat source temperature of 70 °C, significant changes in thermal gradients along the radiator fins can be observed, reflecting the efficiency of convective heat dissipation.
At the minimum airflow velocity of 0.2 m/s, the thermal gradient along the fins is relatively high. Based on the temperature scale analysis, the temperature in the immediate vicinity of the heat source is estimated to be 70 °C, while in the distal part of the fins, the temperature drops to values of around 35–38 °C. This indicates limited heat exchange capabilities at this velocity, resulting in a significant temperature drop deep into the structure.
As the airflow velocity increases to 0.5 m/s, the thermal gradient decreases. The temperature in the distal part of the fins rises to 33–36 °C, indicating an intensification of the convection process and better heat distribution.
At the maximum airflow velocity of 1 m/s, the thermal gradient is the lowest. The temperature in the distal part of the fins reaches values of 30–33 °C. This confirms that increasing the airflow velocity leads to the optimization of convection conditions, resulting in the most efficient heat dissipation and minimization of temperature differences along the fins. When comparing these values, it can be concluded that as the airflow velocity increases, the thermal gradients along the radiator fins gradually decrease, which is direct evidence of the increased efficiency of convective heat dissipation. Importantly, the temperature in the distal part of the radiator decreases with increasing airflow velocity, confirming that higher airflow velocities result in more efficient cooling of the entire radiator structure.
These observations are confirmed by the experimental data presented in
Table 3 and
Table 4, where an increase in the convective heat transfer coefficient (
Qc2) is observed with increasing airflow velocity.
6. Conclusions
This study serves as a preliminary investigation into the thermal performance of textile heat sinks for applications such as MLI support. A notable implication of the study is its validation of the textile radiator’s structural design, including the choice of materials such as aluminum-coated PES monofilaments, to effectively dissipate heat. The uniform temperature distribution, at both lower and higher heat inputs, underscores the composite’s capability as a passive heat radiator, reinforcing its applicability in various fields such as automotive and aerospace industries—domains that demand efficient thermal management solutions.
The preliminary results of this study demonstrate a promising correlation between theoretical simulations and empirical measurements. The temperature gradient across the radiator, both simulated and experimentally observed, exhibits similar characteristics, as evidenced by thermal images (
Figure 6). One of the crucial observations from the results comparison is the consistency in the temperature gradients across the textile radiator, as indicated by the uniformly distributed temperature measurements. In both the empirical and simulated environments, the temperature values at the composite channels closely approximate each other. This consistency establishes the reliability of the numerical model, showing its capability to faithfully reproduce the temperature profiles observed in real-world conditions. Particularly, at a source temperature of 50.4 °C, the differences between simulated and empirical heat convection values (
Qc1 and
Qc2) are minimal, reflecting slight variations likely attributable to minor discrepancies in material properties, boundary layer effects, or measurement inaccuracies inherent in either laboratory or software modeling. The same trend is observable at a higher source temperature of 70.2 °C. Such close alignment supports the robustness of the numerical simulation approach used, highlighting that the Ansys tool effectively simulates real-world performance of complex textile structures.
Furthermore, the simulated temperature profile along the channel axis shows a rapid temperature drop near the heat source, followed by a gradual decrease and eventual stabilization, consistent with the expected heat transfer behavior. The final temperature on the cold side, after twenty minutes of the laboratory test, closely aligns with the simulation results, reaching approximately 21 °C.
Furthermore, the simulation results emphasize the significance of air speed in enhancing heat dissipation. The increase in Qc2 values with higher air speeds in both tables illustrates the role of convective heat transfer mechanisms, particularly how augmenting air velocity over the A2 surface augments the radiator’s cooling efficiency. This insight has practical implications for optimizing airflow conditions to achieve desired thermal outcomes in application contexts.
While the initial results are encouraging and demonstrate the potential of this technology, further research is necessary to fully characterize the complex heat transfer phenomena involved. Future work will focus on refining the numerical model by incorporating more detailed material properties and boundary conditions, as well as conducting more extensive experimental investigations under various operational conditions, including vacuum conditions relevant to space applications. Further analysis of the influence of different textile structures, yarn types, and radiator geometries on thermal performance is also planned. This study provides a solid foundation for the future development and optimization of textile-based passive cooling solutions.


