Abstract
The reduction of harmful emissions is shaping trends across many industries, including architecture and building. With rising ecological awareness and the threat of climate change, architects, construction engineers, and developers are focusing on innovative solutions to minimize the construction sector’s environmental impact. This paper presents a technical and management approach system using renewable energy sources, based on an existing single-family house with known energy consumption. The aim is to achieve energy independence by relying solely on on-site electricity generation and storage, while remaining connected to water and sewage infrastructure. Utilizing renewable energy sources enhances self-sufficiency and investment profitability. The study evaluates the house’s energy consumption to optimally select electricity supply solutions, including a small wind farm and photovoltaic installation integrated with appropriate electricity storage. This is crucial due to the air heat pump used for heating and domestic hot water, which requires electricity. An hourly simulation of the system’s operation over a year verified the adequacy of the selected devices. Additionally, two different locations were analyzed to assess how varying climate and wind conditions influence the design and performance of off-grid energy systems. The analysis showed that solar and wind systems can meet annual energy demand, but limited storage capacity prevents full autonomy. Replacing the heat pump with a biomass boiler reduces electricity use by about 25% and battery needs by 40%, though seasonal energy surpluses remain a challenge. This concept aligns with the goal of achieving climate neutrality by 2050.
1. Introduction
In view of the climate emergency announced in 2019 by the European Parliament [1], the efforts of the European Union member states are focused on the transition of the energy sector from fossil-based energy to zero-emissions. The European Climate Law obliges community members to reduce overall greenhouse gas emissions by 55% (compared with 1990) by the end of the 2030s and to achieve climate neutrality by 2050 [2]. In the European Union, buildings are responsible for 40% of the total energy consumption of the member states and for 36% of EU greenhouse gas emissions related to energy supply [3]. It should be noted that environmental management in the context of energy consumption by buildings is a set of actions aimed at improving energy efficiency, utilizing renewable energy sources, and implementing intelligent energy management systems [4].
The direction of the development of the Polish energy sector is set out in the Polish Energy Policy (PEP) until 2040. One of the specific objectives of the PEP 2040 is the development of renewable energy sources (RES) allowing for the reduction of pollutant emissions from the entire energy sector. Poland has declared that it will increase the share of RES in the gross final energy consumption to 23% in 2030 [5]. Meeting the energy needs of Poles in a way that achieves net zero emissions requires the utilization of local potential through the use of distributed energy with small generators located close to consumers. At present, the share of households included in the national energy consumption in Poland does not exceed 20%. The structure of the use of energy carriers in households in Poland in 2021 showed the share of hard coal in covering the energy needs of homes to be at 21.9%. A further 20.6% of energy for households is obtained from natural gas and 2.9% from light fuel oil and LPG. Solid biomass provides 22.4% of energy, electricity: 11.9%, and district heating: 18.3%. Other energy carriers are responsible for 2.0% of household energy consumption [6]. These figures show that approx. 45.4% of energy in the residential sector in Poland still comes from the direct combustion of fossil fuels in local boilers. The energy transformation of this area [7] could therefore potentially have a significant impact on the structure of energy production in the country.
The share of energy from renewable sources in total primary energy consumption was 12.8% in 2022, the majority of which was accounted for by solid biofuels (64.7%). Heat pumps accounted for 3.8% of total energy obtained from renewable sources and solar energy for 6.0%. However, in 2022, households mainly used four sources of renewable energy: solid biofuels, solar energy, geothermal energy, and ambient heat obtained using heat pumps. The largest share went to solid biofuels and amounted to 89.1% (a decrease of 2.6 percentage points compared to the previous year). The next carrier was ambient heat with a share of 9.0% (an increase of 2.6 percentage points compared to 2021) [8].
Global action to prevent rapid climate change also concerns the construction industry [9,10], particularly in terms of its decarbonization [11,12,13]. As with the economy as a whole, the construction industry is obliged to use modern technologies to address the problem of reducing the environmental impacts of buildings [14,15,16]. It is also expected to apply relevant knowledge, including the digitalization of the construction processes [17,18]. As a consequence, this leads to the construction of smart buildings [19,20], residential areas [21,22], and entire cities [23,24,25]. The erection of such buildings already has technological and legal bases in European directives and technical standardization [26,27,28]. Therefore, for the construction sector, the coming years will be a period of widespread implementation of a new approach to building design and energy management [29].
Riding on the wave of the popularity of green and smart homes, other proposals are also emerging. These include autonomous buildings, which represent an extension of the passive building design [30,31,32], and near-zero energy buildings [33,34,35]. Autonomous buildings are defined in the context of a series of increasingly stringent standards for the energy performance of buildings. Context is then established within the broader framework of the changing energy system [36,37]. An important aspect in this case is independence from external suppliers of energy and water, as well as sewage disposal facilities [38]. Although this is not included in their definition, technologies using renewable energy sources are commonly used in the design and construction of autonomous buildings due to their self-sufficiency [31,39,40].
Considering the above, recent studies on energy efficiency and the optimization of thermal performance in smart and autonomous building systems deserve particular attention [41,42,43]. In the context of converting a building into an autonomous unit, improving its thermal characteristics is of key importance, as it significantly reduces heating demand [44]. One of the effective solutions supporting the use of renewable energy sources is the implementation of photovoltaic-thermal (PVT) modules, which enable the simultaneous generation of electricity and heat. Their application in buildings aiming for energy self-sufficiency plays a crucial role in enhancing the overall efficiency of the system [45].
The idea of energy-efficient buildings using renewable energy sources thus fits perfectly into the energy goals of the state and the international community, contributing to a further increase in the share of RES in the overall energy balance [46]. Not only do these buildings reduce energy demand, but some of them also enable on-site generation [47]. Of particular note is the use of the already popular photovoltaic (PV) systems [48,49]. Electricity can be generated by wind turbines [36,50,51]. The two solutions are often combined to create a hybrid power system [52,53,54,55]. Of crucial importance here is battery energy storage. This enables the use of surplus energy in the event of higher demand [56].
It should be emphasized that in today’s dynamic environment, characterized by growing energy demand and increasing environmental pollution, the concept of energy-efficient buildings is gaining strategic importance. These include low-energy buildings, passive houses, near-zero energy buildings (nZEBs), and plus-energy buildings (PEBs) [57,58]. Polish studies place particular emphasis on the energy potential of buildings, taking into account local climatic conditions and building regulations [59], as well as identifying factors that promote the adoption of net zero energy buildings [60].
In parallel with the concept of energy-efficient architecture, the idea of plus-energy buildings is being developed within the European Union. These buildings generate more energy over the course of a year than they consume, with the surplus fed back into the grid. Relevant studies and proposed definitions can be found in the following literature sources [61,62,63,64,65]. Additionally, beyond a positive energy balance, PEBs also take into account user comfort and support older, less energy-efficient structures. Thanks to their flexibility, they can function as active components of local energy systems. Despite growing interest, the lack of a unified definition hinders their broader implementation [66].
Although many studies have addressed buildings equipped with renewable energy sources, they typically focus on newly constructed low-energy buildings or model-based simulations. This study contributes scientifically by analyzing the modernization potential of an existing, conventionally built house and evaluating its full off-grid conversion based on real energy usage and climate conditions. The research highlights the practical feasibility of integrating hybrid RES and energy storage systems into existing structures, which remain underrepresented in the current literature.
The aim of this paper was to present a concept for an off-grid building powered entirely by renewable energy sources, based on an existing detached house with known energy consumption. The proposed modifications focus on the electricity supply and heating systems of the building and are designed to allow the house to operate independently from external energy infrastructure. As part of the concept, an energy storage system is also included to ensure a stable energy supply regardless of weather conditions or energy production variability.
The use of renewable energy sources (RES) not only reduces the emission of greenhouse gases, dust, and other pollutants into the atmosphere, but also increases user convenience due to the virtually maintenance-free operation of technologies such as photovoltaic panels, solar thermal systems, or heat pumps. For this reason, RES present an attractive solution for the design of off-grid buildings.
The subject of the analysis is a detached house with a usable (heated) area of approximately 240 m2, located in the Krakow region in southern Poland. Based on meteorological data, a comparative analysis of the same off-grid building concept was also carried out for an alternative location in Gdańsk, in order to assess the impact of different climatic conditions on system performance and investment effectiveness.
2. Materials and Methods
The analyzed building is a detached residential house constructed in the 1980s, located in the Kraków region in southern Poland. The building has a compact cuboid form with a nearly square floor plan and consists of three above-ground storeys. The shape factor (A/V) is about 0.86 m−1. The external walls are made of cellular concrete blocks (aerated concrete) and are additionally insulated with a 15 cm layer of expanded polystyrene (EPS). The windows are double-glazed plastic (PVC) units. The ratio of transparent to non-transparent elements is approximately 18–20%. Based on the electricity consumption data for space heating and domestic hot water preparation, the specific energy demand was calculated at 103 kWh/m2·year.
The building is currently equipped with an 8 kWp PV installation mounted on the roof of the building facing south with an inclination of approximately 20°. The pv installation is not shaded by surrounding objects at any time of the year. The house does not have any energy storage. The heat source for central heating (CH) and domestic hot water (DHW) is a 14 kW air source heat pump (A7W35) which can be assisted or replaced during the lowest temperatures by a solid fuel boiler that uses biomass (wood pellets). The bivalent point of the system was estimated empirically during the operation of the system. The current boiler is non-compliant, i.e., it does not meet the relevant requirements for solid-fuel boilers. The users of the building have installed a heat pump at their own expense and the boiler has been left mainly as an emergency source. There are plans to replace the boiler in the near future with a fireplace with a water jacket that meets the Ecodesign requirements. The central heating system is equipped with a 300 L buffer tank. The domestic hot water system is equipped with a tank specially designed for heat pumps with a surface area of the coil heat exchanger of 3.6 m2. The central heating system has several circuits distributing heat around the building using underfloor heating and radiators.
The building is equipped with a bi-directional electricity meter that records the amount of energy transferred to and supplied from the grid during each hour. The data on which this study is based are from the period 1 November 2021 to 31 October 2022. The house drew 8342.9 kWh from the power grid and the PV system returned 7685.2 kWh back to the grid. The building under analysis in its existing state does not meet the criteria for energy autonomy. This study focuses on the selection of equipment that would allow the building to become independent of the power grid.
The average daily electricity consumption (total consumption in the entire study period divided by the number of days per year) in the building was 22.9 kWh. The highest daily consumption was on 23 December 2021 and came to 90.5 kWh. The lowest daily consumption (0.9 kWh) was recorded on 19 June 2022. The highest amount of energy returned to the grid was measured on 18 May and was 53.8 kWh. No power was returned to the grid on 18 December 2021, 22 December 2021, 22 January 2022, and 23 January 2022. Due to the uneven distribution of electricity production and demand across the months, the balance of energy transferred to and taken from the grid varies significantly as shown in Figure 1. Over 6 months, i.e., November, December, January, February, March, and April, more energy was taken from the grid than was supplied to it. In the other months, the PV system produced more energy than the demand of the building.
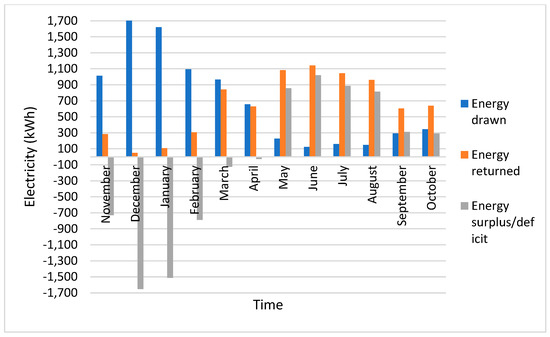
Figure 1.
Energy balance of the building in each month.
Increased electricity consumption occurs in months when the average monthly temperature and sunshine are low (Figure 2), i.e., during the heating season when electricity consumption by the heat pump is increased.
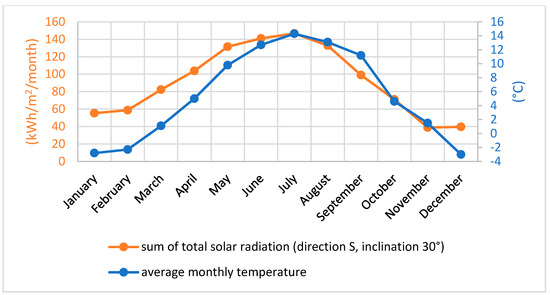
Figure 2.
Statistics for a typical meteorological year (own work based on [67]).
Figure 3 shows graphs of daily consumption of electricity from the grid and electricity returned to the grid during the first days of the calendar winter, spring, summer, and autumn for the year under review. The graphs for each season differ illustrating the trends in energy consumption and production at particular hours of the day at different times of the year. In winter (22 December 2021), no electricity was returned to the grid meaning that if any production occurred, it was consumed for the current needs of the residents. In summer (23 June 2022), electricity production was significantly higher than consumption, with 52.4 kWh of electricity being returned to the grid. On the other hand, in spring (21 March 2022) and autumn (23 September 2022), there is a noticeable surge in production, with electricity being returned to the electricity grid.
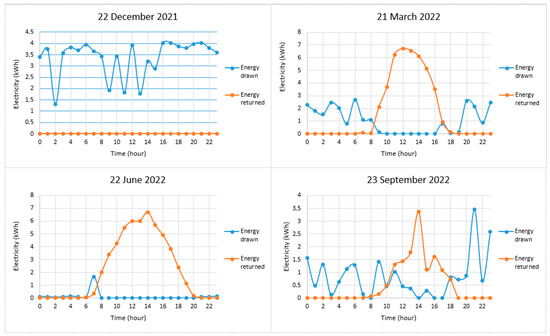
Figure 3.
Electricity consumption and production graphs.
The data series for the amount of energy fed into and taken from the grid shown in Figure 1 and Figure 3 do not reflect the total amount of energy produced and consumed. They only take into account the electricity produced by the PV system and then supplied to the grid while ignoring the energy produced and immediately self-consumed. The electricity consumed on an ongoing basis by the building is omitted from the study. During the period analyzed, the PV system produced 9442 kWh, while 7685 kWh of electric energy was returned to the power grid, which means that self-consumption was approx. 19%. In order to ensure higher energy production during the winter months, the capacity of the PV system should be increased. However, in order to use the electricity produced also during the night and on cloudy days, the building should be equipped with energy storage facilities of sufficient capacity. In order to ensure greater energy security, it is advisable to opt for diversification of energy sources, e.g., by selecting a small wind turbine.
In its existing state, the house is connected to the power grid, and the calculations carried out using the methodology presented here will enable the selection of electrical and thermal components in order to make it independent from the electricity grid. The calculations were based on hourly electricity consumption and production data (by the existing PV system) obtained from the owner of the house. As a result of the calculations, a simulation of the state of charge of the batteries in each hour of the year was obtained.
The calculations were performed for three variants:
- Variant 1–off-grid building heated by a heat pump and powered by a PV system and a wind power system;
- Variant 2–off-grid building heated by a modern solid biomass (pellets) boiler and a heat pump, powered by a PV system and a wind power system;
- Variant 3–off-grid building heated by a modern solid biomass (pellets) boiler and a heat pump, powered by a PV system and a wind power system as well as a power generator.
2.1. Variant 1–Off-Grid Building Heated by a Heat Pump
In order to determine the appropriate capacity of the power generation equipment and the compatible storage capacity, the appropriate calculations were carried out. The data used for this purpose comprised data on the power of the PV system in the existing state, the rated power of the selected wind turbine, the wind speed in each hour of the year, the electricity consumption in each hour of the year, and the PV energy production in the existing state in each hour of the year.
The calculations are aimed at obtaining parameter values that will allow the building to become energy independent, i.e., the power of the PV and wind systems and battery capacity. The result of the calculations is a simulation of the state of selected properties of the system with the set parameters for each hour of the year. The simulation includes the energy production of the PV and wind systems, the energy balance and the battery state of charge. In addition, the total energy production from the PV and wind systems and the total energy consumption were calculated for each month. The simulation was based on Equations (1)–(5). The calculations were carried out for the ith hour of the year (i ∈ [1;8760]).
The PV energy production [kWh] was calculated based on Equation (1).
where
- Epvp is the calculated PV energy production (for each hour of the year) [kWh];
- Epvc is the PV energy production in the existing state (for each hour of the year) [kWh];
- Ppvc is the power of the PV system in the existing state [kW];
- Ppvp is the planned power of the PV system [kW].
The energy production from the wind system [kWh] was calculated based on Equation (2).
where
- Ewt is the calculated energy production from the wind system (for each hour of the year) [kWh];
- a is the wind turbine power at a given wind speed [kW].
The energy balance [kWh] was calculated based on Equation (3).
where
- EB is the energy balance (for each hour of the year) [kWh];
- Epvp is the calculated PV energy production (for each hour of the year) [kWh];
- Ewt is the calculated energy production from the wind system (for each hour of the year) [kWh];
- EC is the energy consumption (for each hour of the year) [kWh].
The amount of energy in the battery [kWh] was calculated according to Equation (4).
where
- ES is the amount of energy in the battery (for each hour of the year) [kWh];
- EB is the energy balance (for each hour of the year) [kWh];
- SC is the battery capacity (for each hour of the year) [kWh].
The state of charge of the batteries [%] was calculated according to Equation (5).
where
- S is the state of charge of the batteries (for each hour of the year) [%];
- ES is the amount of energy in the battery (for each hour of the year) [kWh].
2.2. Variant 2–Off-Grid Building Heated by a Solid Biomass (Pellets) Boiler and a Heat Pump
In order to reduce the electricity demand, and thus reduce the power of the equipment, a simulation was carried out in which, during the heating season at night (when the PV system does not produce any energy), the heating of the building is provided by a solid biomass boiler with an automatic fuel feed system, meeting the requirements of Class 5 according to EN 303-5:2012 [68] and of Ecodesign. Such a type of biomass boiler fed by wood pellets guarantees the low emission of harmful substances [69].
It was assumed that the hourly electricity consumption at night (other than to power the heat pump) is equal to the average hourly electricity consumption at night in July, i.e., 0.318 kWh. The night-time hours were taken to be the time from 10 p.m. to 5 a.m. For the months of October to May (heating season), for the night-time period, if the hourly energy consumption exceeded 0.318 kWh, the electricity consumption was taken as 0.318 kWh, and the remaining demand was treated as energy used to power the heat pump. It was assumed that the SCOP of the pump was equal to 3. The amount of thermal energy to be supplied by the biomass boiler was calculated according to Equation (6).
where
- Ebbi is the energy that needs to be supplied by the biomass boiler in the ith hour of the heating season [kWh];
- EC’I is the electricity consumption for heating purposes in the ith hour of the year [kWh];
- SCOP is the Seasonal Coefficient of Performance of the heat pump used [-].
The amount of fuel (solid biomass) consumed during the heating season was calculated according to Equation (7).
where
- FCbb is the amount of fuel consumed by the solid biomass boiler during the heating season [kg];
- Ebb is the total amount of energy that needs to be generated by the biomass boiler during the heating season [MJ];
- ηbb is the efficiency of the biomass boiler [-];
- HVb is the calorific value of the fuel [MJ/kg].
The efficiency of the biomass boiler was assumed to be 0.9. The calorific value of the fuel was assumed to be 15.6 MJ/kg [70]. However, calculations were then performed as in Variant 1, using less electricity consumption than the electricity used to run the heat pump.
2.3. Variant 3–Off-Grid Building Heated by a Solid Biomass (Pellets) Boiler and a Heat Pump
In Variant 3, heating was similar to that in Variant 2. The electricity generation system was equipped with a generator in addition to the PV and wind turbine systems. The power output of the PV system was assumed to be 10 kW, the wind turbine power output 4 kW, and the energy storage capacity 50 kWh (for wind statistics from the Krakow Balice station); and the power output of the PV system was assumed to be 5 kW, the wind turbine power output 4 kW, and the energy storage capacity 50 kWh (for wind statistics from the Gdansk Port Północny station). The calculations were performed in the same manner as for Variant 1, but for the cases when it was not possible to generate electricity from renewable sources and there was no energy stored in the batteries, it was assumed that power was supplied from the generator.
The amount of fuel used to power the generator for one year was calculated according to Equation (8).
where
- FCpg is the amount of fuel used to power the generator for one year [L];
- Epg is the total amount of electricity that needs to be produced by the generator [kWh];
- ηpg is the efficiency of the generator [-];
- HVpg is the calorific value of the fuel [kWh/litre].
The efficiency of the generator was assumed to be 0.9. The calorific value of the fuel (diesel) was assumed to be 10.7 kWh/L [71].
2.4. Calculation of Electricity Production from the Wind System
The electricity production from the wind system was calculated based on the characteristics of the selected wind turbine from which the electrical power generated by the turbine (parameter ‘a’) can be read as a function of wind speed according to Table 1 (for Variant 1 and Variant 2) and Table 2 (for Variant 3). Due to the characteristics of the calculations, a wind turbine with a lower capacity was used in Variant 3. Table 1 and Table 2 show the correlation between the output power of the generator and the speed of the wind for the specimen wind turbines with rated power Pwtz = 10,000 W and Pwtz = 4000 W. In Table 1, for wind speeds between 10 m/s and 30 m/s, the parameter ‘a’ was taken as 10.14 kW. In Table 2, for wind speeds between 14 m/s and 30 m/s, the parameter ‘a’ was taken as 4.38 kW.

Table 1.
Generator output power of a specimen wind turbine as a function of wind speed (for Variants 1 and 2) [72].
Table 2.
Generator output power of a specimen wind turbine as a function of wind speed (for Variant 3) [73].
Calculations related to the choice of a wind turbine were carried out for wind data from the meteorological station Krakow Balice. In addition, in order to analyze the impact of the wind conditions on the operation of the system, the same calculations were performed for wind data from the meteorological station Gdansk Port Północny where wind parameters are more favorable for energy use. Statistical data on the prevailing wind conditions at selected meteorological stations are summarized in Table 3.
Table 3.
Wind statistics at selected meteorological stations (own work based on [67]).
The power outputs of the PV system and of the wind turbine, as well as the capacity of the energy storage, were then selected by analyzing the state of charge of the electricity storage.
3. Results and Discussion
The aim of the study was to select the optimum power output of a PV system and a small wind power plant which would be capable of producing and storing the required amount of energy while operating together with electricity storage facilities of adequate capacity and under given meteorological conditions. This is a key issue because of the air source heat pump used to heat the building and prepare domestic hot water, which requires an electrical supply. In order to verify that the parameters of the selected equipment are sufficient, hour-by-hour operation of the system was simulated for a full calendar year.
3.1. Variant 1
The installed capacities of the PV and wind power systems as well as the capacity of the batteries that are sufficient for off-grid building for the wind data from the selected locations, assuming there are no limitations of energy storage, are shown in Table 4. It is worth noting that this is not the only parameter configuration that makes it possible to generate enough electricity. In order to reduce the power rating of the PV system, the power rating of the wind turbine must be increased and vice versa.
Table 4.
Parameters of the system that enable achieving site-specific off-grid building for Variant 1, assuming there are no limitations on electricity storage.
Due to the more favorable wind conditions in Gdansk, the required power of the PV system, as well as the battery capacity at this location. have lower values. In order for the building to be considered as independent from the electricity grid, the electricity generating equipment must cooperate with huge energy storage facilities, with a capacity equal to 4.9% of the annual consumption for Krakow and 3.7% of the annual consumption for Gdansk.
Figure 4 and Figure 5 show the graphs of energy production and consumption for the parameters shown in Table 4 for each month in the selected locations. The energy consumption is the same for both cases while the PV and wind generation differ between the locations.
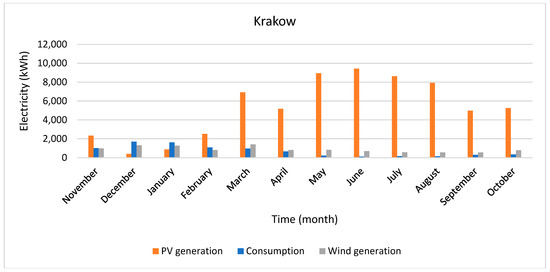
Figure 4.
Monthly energy consumption and generation for the parameters shown in Table 4 for wind statistics for Krakow (own work based on [67]).
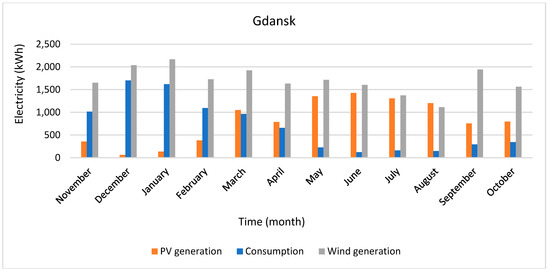
Figure 5.
Monthly energy consumption and generation for the parameters shown in Table 4 for wind statistics for Gdansk (own work based on [67]).
As can be seen in Figure 4 and Figure 5, the total energy production at the individual locations for the parameters shown in Table 4 is many times higher than the energy demand. The total annual energy consumption for the period under study was 8342.9 kWh. The calculations for the Krakow location indicate that 73,986.9 kWh were generated over the entire period for which the simulation was carried out, representing 886.8% of the annual demand. For the Gdansk location, the total production was 30,051.1 kWh or 360.2% of demand. The share of the wind power system in the total energy production was 14.3% for the Krakow data and 68.0% for the Gdansk data.
For the wind data from the Krakow station, the month in which energy independence is most difficult to ensure is December, while for the wind data from the Gdansk station, it is January. Figure 6 and Figure 7 thus present the results of the simulated operation of systems with the parameters presented in Table 4 in the locations analyzed for the least favorable months of the year.
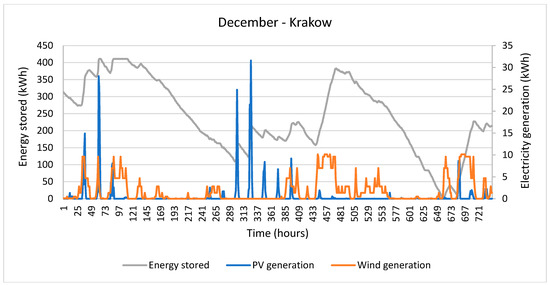
Figure 6.
Battery status and energy production for December in Variant 1—wind data from Krakow (own work based on [67]).
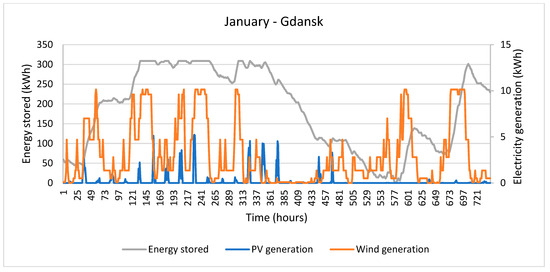
Figure 7.
Battery status and energy production for January in Variant 1—wind data from Gdansk (own work based on [67]).
As shown in Figure 6 and Figure 7, the parameters of the systems presented in Table 4 allow the building to achieve independence from the electricity grid in the month when this task is most difficult. The batteries are not empty at any time during the month. The energy stored in the preceding months, together with the electricity generated in December or January by the systems installed, allows the building to be independent from the electricity grid in that month. The building is, therefore, independent from the electricity grid throughout the year. Due to the high power ratings of the PV system and the huge battery capacities that would allow for the achievement of independence from the electricity grid, the concept presented in Variant 1 should be considered to be unrealistic.
3.2. Variant 2
The calculations carried out in Variant 1 showed that ensuring the energy independence of the building with the daily use of the heat pump during the heating season would require the installation of high-power electricity generating equipment and batteries with an enormous capacity. For this reason, in Variant 2, it was decided to run a simulation that assumes the use of a biomass boiler for the heating during the heating season.
As a result of replacing the heat pump with a biomass boiler during the night hours of the heating season, the total annual electricity demand decreased by 25.9% in Variant 2, i.e., down to 6184.2 kWh. To meet the heat demand of the building under study, the biomass boiler should produce 6476.2 kWh of thermal energy. The calculated annual fuel consumption of the boiler is 1660.6 kg.
The power ratings of the PV and wind systems that will allow the building to achieve independence from the electricity grid for the wind statistics from the selected locations, assuming there are no limitations of energy storage, are shown in Table 5. As in Variant 1, the values shown in Table 5 are not the only ones that will allow the target to be achieved.
Table 5.
Parameters of the system that enable the achievement of site-specific off-grid building for Variant 2, assuming there are no limitations on electricity storage.
Due to the decrease in electricity demand relative to Variant 1, the necessary capacity of the PV system for the calculations using wind data from Krakow was reduced accordingly. In order for the building to be considered as independent from the electricity grid, the electricity-generating equipment must cooperate with energy storage facilities with a capacity equal to 3.8% of the total annual consumption for the wind statistics from Krakow and 2.5% of the annual consumption for wind statistics from Gdansk. Although the required battery capacity is smaller than in Variant 1, these values are still unrealistic.
Figure 8 and Figure 9 show graphs of energy production and consumption for the values shown in Table 5.
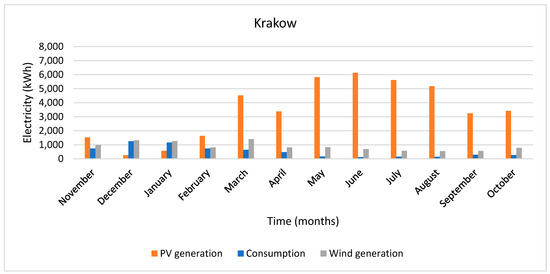
Figure 8.
Monthly energy consumption and generation for the parameters shown in Table 5 for wind statistics for Krakow (own work based on [67]).
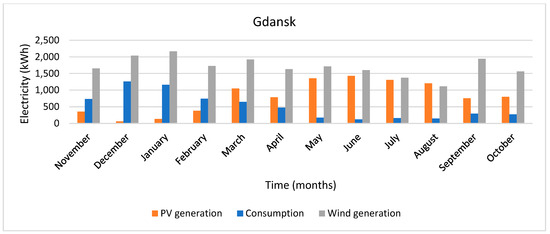
Figure 9.
Monthly energy consumption and generation for the parameters shown in Table 5 for wind statistics for Gdansk (own work based on [67]).
As in Variant 1, the total energy production at each location for the parameters shown in Table 5 is many times higher than the energy demand. The calculations for the wind data from Krakow indicate that 51,892.0 kWh were produced, which is 839.1% of the demand. For the wind data from Gdansk, the production was 30,051.1, i.e., 485.9% of the demand. The share of wind power in the total energy production was 20.4% for the wind data from Krakow and 68.0% for the wind data from Gdansk.
Similar to Variant 1, the operation of the system was simulated in December for the wind data from Krakow and in January for the data from Gdansk. The results of the calculations are presented in Figure 10 and Figure 11. Despite the use of a biomass boiler, the required energy storage capacity in Variant 2 also renders the concept presented unrealistic.
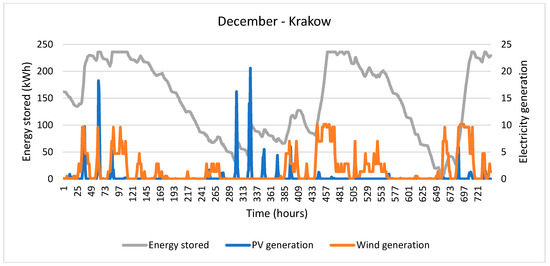
Figure 10.
Battery status and energy production for December in Variant 2—wind data from Krakow (own work based on [67]).
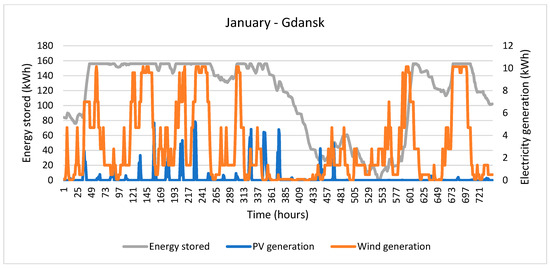
Figure 11.
Battery status and energy production for January in Variant 2—wind data from Gdansk (own work based on [67]).
3.3. Variant 3
In Variant 3, the heating system also relies on a biomass boiler during the night hours of the heating season, so the total annual electricity demand is 6184.2 kWh. The calculations were carried out for a 10 kWp PV system, a 4 kW wind turbine, and 50 kWh batteries (for the wind data from Krakow). For the wind data from Gdansk, a 5 kW PV system, a 4 kW wind turbine, and 50 kWh batteries were assumed. The deficient energy was supplied from a diesel generator. Table 6 shows the operating parameters of the generator calculated as a result of the simulation.
Table 6.
Analysis of generator operation in Variant 3.
In order to ensure sufficient electricity under the specified conditions, the building should be equipped with a generator with a capacity of no less than 8.7 kW for the wind data from Krakow, and no less than 6.5 kW for the wind data from Gdansk. Figure 12 and Figure 13 show the electricity production and consumption for Variant 3.
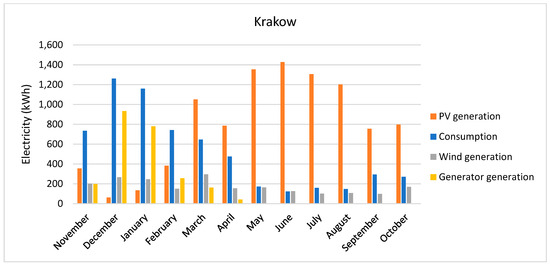
Figure 12.
Monthly energy consumption and production for Variant 3 for wind data from Krakow (own work based on [67]).
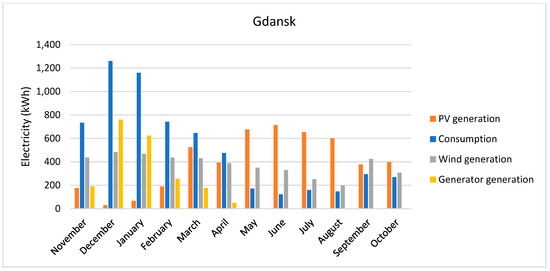
Figure 13.
Monthly energy consumption and production for Variant 3 for wind data from Gdansk (own work based on [67]).
The calculations for the wind data from Krakow indicate that a total of 11,683.1 kWh was generated from RES, which accounts for 188.9% of the demand. For the wind data from Gdansk, the production from RES was 9310.5 kWh, i.e., 150.6% of the demand. Considering production from RES alone and consumption during the heating season (October to May), the ratio of production to consumption is 120.2% for the wind data from Krakow and 105.5% for the wind data from Gdansk. There is still a surplus of energy, but it is smaller in comparison with Variant 1 and Variant 2. The share of wind energy in total renewable electricity production is 17.8% for the Krakow data and 48.4% for the Gdansk data. For all the wind statistics, more than 60% of the energy used comes from renewable sources. The generator is completely idle for 6 months of the year (May to October).
Figure 14 and Figure 15 show a simulation of operation in December or January for the two wind data sets analyzed. Unlike Variant 1 and Variant 2, the storage facilities are not full at all times. Despite this, the building does not need external energy suppliers, as it is equipped with a generator that covers the electricity demand during those hours when the batteries are empty.
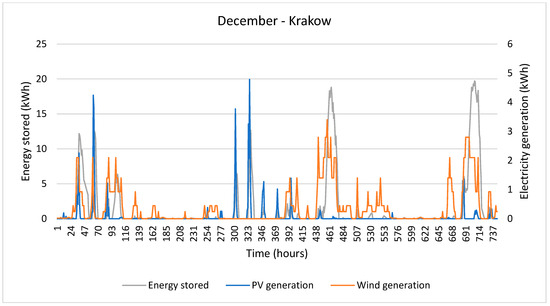
Figure 14.
Battery status and RES energy production for December in Variant 3—wind data from Krakow (own work based on [67]).
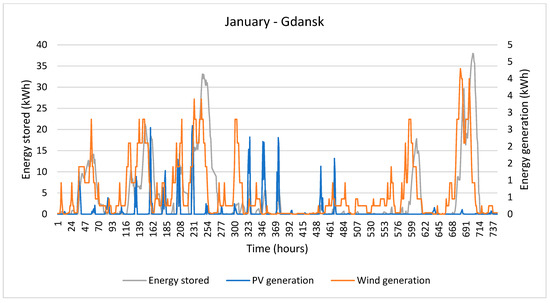
Figure 15.
Battery status and RES energy production for January in Variant 3—wind data from Gdansk (own work based on [67]).
Figure 16 and Figure 17 summarize the amount of stored energy, the electricity production from the batteries, and the energy balance (the difference between the energy produced and energy consumed). It can be seen that, for most of the month, the energy balance is zero, due to the ongoing generation of the required electricity by the generator. At times when the energy balance is negative (more electricity has been consumed than generated), the shortfall in production is covered by the batteries. The house, therefore, meets the conditions to be recognized as an off-grid building. The use of a generator allowed for a significant reduction in the necessary capacity of the energy storage and the PV system. As a result, the concept presented in Variant 3 was considered to be the best among those presented.
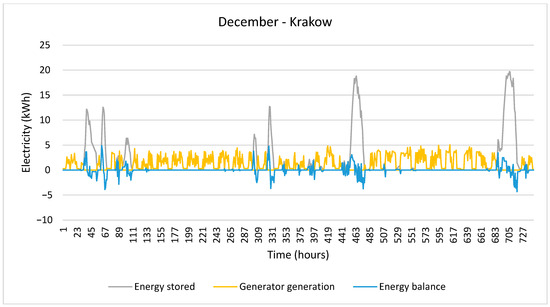
Figure 16.
Battery status, energy from the generator, and energy balance for December in Variant 3 —wind data from Krakow (own work based on [67]).
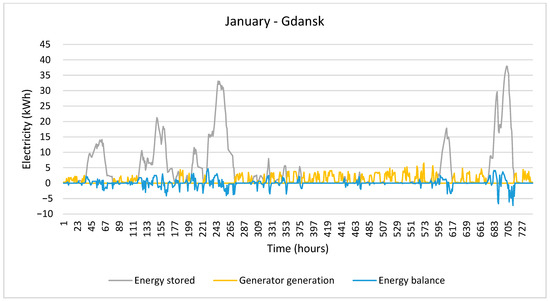
Figure 17.
Battery status, energy from the generator, and energy balance for January in Variant 3—wind data from Gdansk (own work based on [67]).
3.4. Economic Analysis
The economic analysis performed aimed to assess the profitability of investing in renewable energy systems in the context of transforming a building into an energy-independent facility. Variant 3 was chosen because it allows for the optimal sizing of energy installations, taking into account the specific conditions of two different locations: Krakow and Gdansk. In each of these locations, a photovoltaic (PV) system, wind turbine, energy storage, pellet boiler, and generator were considered, taking into account the costs of these components (Table 7) and the annual savings resulting from the production of energy from renewable sources.
Table 7.
List of installation components for economic analysis.
In the case of Krakow, a 10 kW photovoltaic system, a 4 kW wind turbine, a 50 kWh energy storage, and a pellet boiler were assumed. Additionally, a diesel generator was included as an extra energy source in case of energy shortages during periods when the renewable energy systems do not generate sufficient energy. The total cost of this installation was 283,500 PLN. For the location in Gdansk, a 5 kW photovoltaic system was assumed, which reduced the total installation cost to PLN 272,500. The parameters for other components of the installation, such as the wind turbine, energy storage, and pellet boiler, were the same as in the Krakow case.
Based on the data on the building’s annual energy demand (8342.9 kWh), savings resulting from energy production from renewable sources and the payback period for the investment were calculated for both locations (Table 8). The consumption of pellets (1660.6 kg) and diesel oil (246.0 L for Krakow and 213.8 L for Gdansk) were also taken into account. In both cases, the renewable energy systems generated more energy than the buildings’ demands, resulting in actual savings on electricity costs. It was assumed that the average cost of purchasing energy from the grid is 1 PLN/kWh. The price of pellets and diesel oil was also assumed to be at PLN 1000/ton and PLN 6/L
Table 8.
The calculation of annual savings and payback period for both Kraków and Gdańsk locations.
Variant 3 in both locations—Krakow and Gdansk—utilizes a combination of renewable energy sources and a generator to meet the building’s electricity demand. Installation costs in Krakow are slightly higher due to the larger photovoltaic system. Based on the calculations, the payback period for the investment in Variant 3 exceeds 50 years for both locations. These values suggest that the renewable energy system in Variant 3 is a very costly investment, with a return expected only after many years of operation. However, it is worth noting that these calculations do not take into consider potential subsidies, tax incentives, or increases in energy prices, all of which could shorten the payback period.
4. Conclusions and Remarks
A PV system operating together with a wind turbine can produce enough energy annually to power the building in question. However, due to the uneven distribution of this production over time, energy storage is necessary. To ensure energy independence using only renewable energy sources (solar panels, a wind turbine, and a heat pump—Variant 1), the house would need to be equipped with large energy storage facilities (calculations have indicated batteries with a capacity equivalent to as much as 4.9% of the annual electricity consumption), or large solar and wind systems. When attempting to use relatively small electricity-generating equipment and energy storage facilities with large capacities, one must account for energy loss associated with long-term storage, which has not been taken into account in the calculations presented.
Reducing the capacity of the batteries at the expense of increasing the capacity of the electricity-generating equipment would result in an enormous energy surplus. In the case where the electrically powered heat pump is replaced with a biomass boiler, as in Variant 2, it is possible to reduce the electricity demand of the building by approximately 25%. This decrease in demand allows for a reduction in the installed capacity of the generating equipment compared to Variant 1. Despite the decrease in energy-generating capacity during the summer period, production still exceeds demand by more than eight times. The necessary battery capacity drops by about 40% compared to Variant 1, but is still at a level of up to 3.8% of the annual consumption.
The use of a generator to power the house when weather conditions prevent the generation of renewable energy (Variant 3) significantly reduced the energy surplus and the utilization of the battery, with a capacity of 50 kWh. In this scenario, the electricity demand is primarily covered by renewable generation.
The house under study was built using traditional technology and was not designed as a low-energy or passive building. For this reason, it is more difficult to convert it into an off-grid building compared to houses that were originally designed and built as such.
The analysis of the operation of the power-generating systems in all the variants shows that, with an increased share of wind energy in the total production, the system can operate much more efficiently. However, due to the lack of wind measurements or data on the operation of existing wind turbines in the immediate vicinity of the building under study, it is difficult to determine the potential for wind generation.
Power-generating systems (solar panels and wind turbines) are capable of producing enough energy to cover the demand of the building under study, provided their output power is correctly selected. Moreover, it is possible to produce much more than the demand would indicate. However, this does not ensure energy autonomy for the building because of the limitations related to energy storage. Not only do modern batteries have limited capacity, but they also deteriorate over time and are manufactured using toxic substances. Therefore, it is not currently possible to completely cover the energy needs of the residents without a significant energy surplus.
Due to the need to install a PV system, a wind turbine, energy storage, and other components of the off-grid energy system (generator, inverter, operating regulators, and controllers, etc.), an environmental impact analysis of the development would be necessary. To estimate the scale of the environmental benefits of the concept presented, it would be necessary to calculate the environmental effect, understood as the difference between greenhouse gas emissions before and after the development, and to perform a Life Cycle Assessment (LCA).
To better exploit the production potential of the renewable energy sources used, residents can adjust their daily consumption profile to production by performing energy-intensive activities such as baking, ironing, laundry, cooking, etc., during those hours of the day when production is highest.
As the role of off-grid buildings grows in the urban landscape, understanding and effectively managing renewable energy become key elements in achieving sustainable development goals. The analyses and conclusions presented in this study are intended to initiate a discussion on the challenges and prospects related to energy management in off-grid buildings, addressed to both industry professionals and researchers interested in modern solutions in the field of building energy.
Author Contributions
Conceptualization, A.J., W.L. and Z.M.; methodology, D.D., W.L. and Z.M.; software, Z.M. and G.P.; validation, G.P., W.L. and P.J.; formal analysis, W.L.; investigation, Z.M. and W.L.; resources, A.J.; data curation, Z.M., W.L.; writing—original draft preparation, A.J., M.W., M.P. and P.W.; writing—review and editing, A.J., M.W., D.D., M.P. and P.W.; visualization, G.P.; supervision, W.L.; project administration, A.J.; funding acquisition, A.J., G.P. and P.J. All authors have read and agreed to the published version of the manuscript.
Funding
This research was funded by the statutory research programme at the Faculty of Geology, Geophysics and Environmental Protection, AGH University of Science and Technology in Krakow, Poland, Statutory Work No. 16.16.140.315/05, and the publication presents the result of Project no. 060/ZJE/2023/POT financed from the subsidy granted to the Krakow University of Economics.
Data Availability Statement
The original contributions presented in the study are included in the article; further inquiries can be directed to the corresponding author.
Conflicts of Interest
The authors declare no conflicts of interest.
References
- European Parliament Resolution of 28 November 2019 on the Climate and Environment Emergency (2019/2930(RSP)). Available online: https://eur-lex.europa.eu/legal-content/EN/TXT/?uri=CELEX%3A52019IP0078%2801%29 (accessed on 10 December 2024).
- Regulation (EU) 2021/1119 of the European Parliament and of the Council of 30 June 2021 Establishing the Framework for Achieving Climate Neutrality and Amending Regulations (EC) No 401/2009 and (EU) 2018/1999 (‘European Climate Law’). L243/1. Available online: https://eur-lex.europa.eu/legal-content/EN/TXT/?uri=CELEX:32021R1119 (accessed on 10 December 2024).
- Directive (EU) 2023/1791 of the European Parliament and of the Council of 13 September 2023 on Energy Efficiency and Amending Regulation (EU) 2023/955 (Recast) (Text with EEA Relevance). L 231/1. Available online: https://eur-lex.europa.eu/legal-content/EN/TXT/?uri=CELEX:32023L1791 (accessed on 12 December 2024).
- Yoon, S.; Lee, J. Perspective for waste upcycling-driven zero energy buildings. Energy 2024, 289, 130029. [Google Scholar] [CrossRef]
- Notice of the Minister of Climate and Environment of March 2, 2021 on the State Energy Policy Until 2040 (Item 264). Available online: https://isap.sejm.gov.pl/isap.nsf/download.xsp/WMP20210000264/O/M20210264.pdf (accessed on 20 January 2025). (In Polish)
- Statistics Poland. Energy; Statistics Poland: Rzeszów, Poland, 2023. Available online: https://stat.gov.pl/download/gfx/portalinformacyjny/pl/defaultaktualnosci/5485/1/11/1/energia_2023.pdf (accessed on 20 January 2025).
- Biernat-Jarka, A.; Trębska, P.; Jarka, S. The role of renewable energy sources in alleviating energy poverty in households in Poland. Energies 2021, 14, 2957. [Google Scholar] [CrossRef]
- Statistics Poland. Energy from Renewable Sources in 2022; Statistical Analyses; Statistics Poland: Warszawa, Poland; Rzeszów, Poland, 2023. [Google Scholar]
- Giesekam, J.; Tingley, D.D.; Cotton, I. Aligning carbon targets for construction with (inter) national climate change mitigation commitments. Energy Build. 2018, 165, 106–117. [Google Scholar] [CrossRef]
- Mercader-Moyano, P.; Esquivias, P.M. Decarbonization and circular economy in the sustainable development and renovation of buildings and neighbourhoods. Sustainability 2020, 12, 7914. [Google Scholar] [CrossRef]
- Zhang, Y.; Hu, S.; Guo, F.; Mastrucci, A.; Zhang, S.; Yang, Z.; Yan, D. Assessing the potential of decarbonizing China’s building construction by 2060 and synergy with industry sector. J. Clean. Prod. 2022, 359, 132086. [Google Scholar] [CrossRef]
- Arogundade, S.; Dulaimi, M.; Ajayi, S.; Saka, A.; Ilori, O. Decarbonization of construction projects: A review and interpretive structural modelling of carbon reduction drivers. J. Eng. Des. Technol. 2023. [Google Scholar] [CrossRef]
- Sbahieh, S.; Serdar, M.Z.; Al-Ghamdi, S.G. Decarbonization strategies of building materials used in the construction industry. Mater. Today Proc. 2023, 1–6. [Google Scholar] [CrossRef]
- Hossain, M.A.; Nadeem, A. Towards digitizing the construction industry: State of the art of construction 4.0. In Proceedings of the ISEC 2019, Chicago, IL, USA, 20–25 May 2019; ISEC Press: Fargo, ND, USA, 2019; Volume 10, pp. 1–6. [Google Scholar]
- Goger, G.; Bisenberger, T. Digitalization in infrastructure construction–Developments in construction operations. Geomech. Tunn. 2020, 13, 165–177. [Google Scholar] [CrossRef]
- Rahman, A.U.; Alam, S.M.; Dallasega, P.; Marengo, E.; Nutt, W. Increasing Control in Construction Processes: The Role of Digitalization. In Business Process Management Workshops, Proceedings of the BPM 2020 International Workshops, Seville, Spain, 13–18 September 2020; Revised Selected Papers 18; Springer International Publishing: Cham, Switzerland, 2020; pp. 263–275. [Google Scholar]
- Sezer, A.A.; Thunberg, M.; Wernicke, B. Digitalization index: Developing a model for assessing the degree of digitalization of construction projects. J. Constr. Eng. Manag. 2021, 147, 04021119. [Google Scholar] [CrossRef]
- Nikmehr, B.; Hosseini, M.R.; Martek, I.; Zavadskas, E.K.; Antucheviciene, J. Digitalization as a strategic means of achieving sustainable efficiencies in construction management: A critical review. Sustainability 2021, 13, 5040. [Google Scholar] [CrossRef]
- Adamuscin, A.; Golej, J.; Panik, M. The challenge for the development of Smart City Concept in Bratislava based on examples of smart cities of Vienna and Amsterdam. EAI Endorsed Trans. Smart Cities 2016, 1, e5. [Google Scholar] [CrossRef]
- Jopek, D. Intelligent urban space as a factor in the development of smart cities. Tech. Trans. 2019, 116, 5–15. [Google Scholar] [CrossRef]
- Apanaviciene, R.; Vanagas, A.; Fokaides, P.A. Smart building integration into a smart city (SBISC): Development of a new evaluation framework. Energies 2020, 13, 2190. [Google Scholar] [CrossRef]
- Froufe, M.M.; Chinelli, C.K.; Guedes, A.L.A.; Haddad, A.N.; Hammad, A.W.; Soares, C.A.P. Smart buildings: Systems and drivers. Buildings 2020, 10, 153. [Google Scholar] [CrossRef]
- Li, Y.W.; Cao, K. Establishment and application of intelligent city building information model based on BP neural network model. Comput. Commun. 2020, 153, 382–389. [Google Scholar] [CrossRef]
- Hałaj, E.; Kotyza, J.; Hajto, M.; Pełka, G.; Luboń, W.; Jastrzębski, P. Upgrading a District Heating System by Means of the Integration of Modular Heat Pumps, Geothermal Waters, and PVs for Resilient and Sustainable Urban Energy. Energies 2021, 14, 2347. [Google Scholar] [CrossRef]
- Komninos, N.; Kakderi, C.; Mora, L.; Panori, A.; Sefertzi, E. Towards high impact smart cities: A universal architecture based on connected intelligence spaces. J. Knowl. Econ. 2022, 13, 1169–1197. [Google Scholar] [CrossRef]
- Al Dakheel, J.; Del Pero, C.; Aste, N.; Leonforte, F. Smart buildings features and key performance indicators: A review. Sustain. Cities Soc. 2020, 61, 102328. [Google Scholar] [CrossRef]
- Economidou, M.; Todeschi, V.; Bertoldi, P.; D’Agostino, D.; Zangheri, P.; Castellazzi, L. Review of 50 years of EU energy efficiency policies for buildings. Energy Build. 2020, 225, 110322. [Google Scholar] [CrossRef]
- Fokaides, P.A.; Apanaviciene, R.; Černeckiene, J.; Jurelionis, A.; Klumbyte, E.; Kriauciunaite-Neklejonoviene, V.; Pupeikis, D.; Rekus, D.; Sadauskiene, J.; Seduikyte, L.; et al. Research challenges and advancements in the field of sustainable energy technologies in the built environment. Sustainability 2020, 12, 8417. [Google Scholar] [CrossRef]
- Myers, D. Construction Economics: A New Approach, 5th ed.; Routledge: London, UK, 2022. [Google Scholar] [CrossRef]
- Sartori, I.; Napolitano, A.; Voss, K. Net zero energy buildings: A consistent definition framework. Energy Build. 2012, 48, 220–232. [Google Scholar] [CrossRef]
- Chel, A.; Kaushik, G. Renewable energy technologies for sustainable development of energy efficient building. Alex. Eng. J. 2018, 57, 655–669. [Google Scholar] [CrossRef]
- Cuce, E.; Nachan, Z.; Cuce, P.M.; Sher, F.; Neighbour, G.B. Strategies for ideal indoor environments towards low/zero carbon buildings through a biomimetic approach. Int. J. Ambient. Energy 2019, 40, 86–95. [Google Scholar] [CrossRef]
- Omer, A.M. Design and operation of low energy consumption passive human comfort solutions. J. Commer. Manag. Thought 2020, 11, 40–62. [Google Scholar] [CrossRef]
- Wang, Y.; Hu, B.; Meng, X.; Xiao, R. A Comprehensive Review on Technologies for Achieving Zero-Energy Buildings. Sustainability 2024, 16, 10941. [Google Scholar] [CrossRef]
- Baghdadi, A.; Abuhussain, M. In-Depth Analysis of Photovoltaic-Integrated Shading Systems’ Performance in Residential Buildings: A Prospective of Numerical Techniques Toward Net-Zero Energy Buildings. Buildings 2025, 15, 222. [Google Scholar] [CrossRef]
- Mohammadi, S. Energy autonomous buildings: A review. In Proceedings of the 7th International Energy Conference, Kuwait City, Kuwait, 18–21 November 2019; Available online: https://www.proquest.com/docview/2501937301 (accessed on 16 December 2024).
- Taherahmadi, J.; Noorollahi, Y.; Panahi, M. Toward comprehensive zero energy building definitions: A literature review and recommendations. Int. J. Sustain. Energy 2021, 40, 120–148. [Google Scholar] [CrossRef]
- Grazieschi, G.; Gori, P.; Lombardi, L.; Asdrubali, F. Life cycle energy minimization of autonomous buildings. J. Build. Eng. 2020, 30, 101229. [Google Scholar] [CrossRef]
- Chen, S.Y.; Chu, C.Y.; Cheng, M.J.; Lin, C.Y. The autonomous house: A bio-hydrogen based energy self-sufficient approach. Int. J. Environ. Res. Public Health 2009, 6, 1515–1529. [Google Scholar] [CrossRef] [PubMed]
- Hemmati, R. Stochastic energy investment in off-grid renewable energy hub for autonomous building. IET Renew. Power Gener. 2019, 13, 2232–2239. [Google Scholar] [CrossRef]
- Farzaneh, H.; Malehmirchegini, L.; Bejan, A.; Afolabi, T.; Mulumba, A.; Daka, P.P. Artificial intelligence evolution in smart buildings for energy efficiency. Appl. Sci. 2021, 11, 763. [Google Scholar] [CrossRef]
- Karami, M.; Harvey, T. Autonomous Buildings Enable Energy Efficiency. ASHRAE Trans. 2022, 128, 208–216. [Google Scholar]
- Liu, Z.; Zhang, X.; Sun, Y.; Zhou, Y. Advanced controls on energy reliability, flexibility and occupant-centric control for smart and energy-efficient buildings. Energy Build. 2023, 297, 113436. [Google Scholar] [CrossRef]
- Khedher, N.B.; Mukhtar, A.; Md Yasir, A.S.H.; Khalilpoor, N.; Foong, L.K.; Nguyen Le, B.; Yildizhan, H. Approximating heat loss in smart buildings through large scale experimental and computational intelligence solutions. Eng. Appl. Comput. Fluid Mech. 2023, 17, 2226725. [Google Scholar] [CrossRef]
- Alsharifi, T.; Mahdi, J.M.; Togun, H.; Al-Najjar, H.M.T.; Khedher, N.B.; Cairns, A.; Talebizadehsardari, P. Design and optimization of a household photovoltaic/thermal collector with serpentine tube: Energy and exergy analysis. Appl. Therm. Eng. 2024, 246, 122983. [Google Scholar] [CrossRef]
- Jaysawal, R.K.; Chakraborty, S.; Elangovan, D.; Padmanaban, S. Concept of net zero energy buildings (NZEB)—A literature review. Clean. Eng. Technol. 2022, 11, 100582. [Google Scholar] [CrossRef]
- Franchini, G.; Brumana, G.; Perdichizzi, A. Monitored performance of the first energy+ autonomous building in Dubai. Energy Build. 2019, 205, 109545. [Google Scholar] [CrossRef]
- Luboń, W.; Pełka, G.; Marszałek, K.; Małek, A. Performance analysis of crystalline silicon and CIGS photovoltaic modules in outdoor measurement. Ecol. Chem. Eng. S 2017, 24, 539–549. [Google Scholar] [CrossRef][Green Version]
- Teixeira, G.P.L. Energy Autonomous Buildings-Housing Project; Faculdade de Engenharia da Universidade do Porto: Porto, Portugal, 2021; Available online: https://repositorio-aberto.up.pt/bitstream/10216/135091/2/485022.pdf (accessed on 14 December 2024).
- Fedak, W.; Anweiler, S.; Ulbrich, R.; Jarosz, B. The concept of autonomous power supply system fed with renewable energy sources. J. Sustain. Dev. Energy Water Environ. Syst. 2017, 5, 579–589. [Google Scholar] [CrossRef]
- Titkov, V.V.; Bekbayev, A.B.; Munsyzbai, T.M.; Shakenov, K.B. Construction of autonomous buildings with wind power plants. Mag. Civ. Eng. 2018, 4, 171–180. [Google Scholar]
- Akram, U.; Khalid, M.; Shafiq, S. An improved optimal sizing methodology for future autonomous residential smart power systems. IEEE Access 2018, 6, 5986–6000. Available online: https://ieeexplore.ieee.org/document/8255587 (accessed on 20 December 2024). [CrossRef]
- Zicmane, I.; Berzina, K.; Lomane, T.; Kasperjuks, K. Improving the energy efficiency of an autonomous power system with renewable sources. In Proceedings of the 2018 International Conference on Intelligent and Innovative Computing Applications (ICONIC), Mon Tresor, Mauritius, 6–7 December 2018; IEEE: Piscataway, NJ, USA, 2018; pp. 1–6. Available online: https://ieeexplore.ieee.org/abstract/document/8601288 (accessed on 20 December 2024).
- Chauhan, R.K.; Chauhan, K.; Subrahmanyam, B.R.; Singh, A.G.; Garg, M.M. Distributed and centralized autonomous DC microgrid for residential buildings: A case study. J. Build. Eng. 2020, 27, 100978. [Google Scholar] [CrossRef]
- Tazay, A.F.; Samy, M.M.; Barakat, S. A techno-economic feasibility analysis of an autonomous hybrid renewable energy sources for university building at Saudi Arabia. J. Electr. Eng. Technol. 2020, 15, 2519–2527. Available online: https://link.springer.com/article/10.1007/s42835-020-00539-x (accessed on 20 December 2024). [CrossRef]
- Knosala, K.; Kotzur, L.; Röben, F.T.; Stenzel, P.; Blum, L.; Robinius, M.; Stolten, D. Hybrid hydrogen home storage for decentralized energy autonomy. Int. J. Hydrogen Energy. 2021, 46, 21748–21763. [Google Scholar] [CrossRef]
- Kumar, G.M.S.; Cao, S. State-of-the-art review of positive energy building and community systems. Energies 2021, 14, 5046. [Google Scholar] [CrossRef]
- Cardoso, J.; Leal, V.; Azevedo, I.; Silva, M.C. Designing carbon neutral, net-zero, nearly-zero and positive energy districts or neighbourhoods: Current approaches and solutions. Adv. Build. Energy Res. 2024, 18, 602–640. [Google Scholar] [CrossRef]
- Barwińska-Małajowicz, A.; Banaś, M.; Piecuch, T.; Pyrek, R.; Szczotka, K.; Szymiczek, J. Energy and Ecological Concept of a Zero-Emission Building Using Renewable Energy Sources—Case Study in Poland. Energies 2024, 17, 5817. [Google Scholar] [CrossRef]
- Szymańska, E.J.; Kubacka, M.; Woźniak, J.; Polaszczyk, J. Analysis of residential buildings in Poland for potential energy renovation toward zero-emission construction. Energies 2022, 15, 9327. [Google Scholar] [CrossRef]
- Kolokotsa, D.E.K.D.; Rovas, D.; Kosmatopoulos, E.A.; Kalaitzakis, K. A roadmap towards intelligent net zero-and positive-energy buildings. Sol. Energy 2011, 85, 3067–3084. [Google Scholar] [CrossRef]
- Wronowski, M. Conceptual design of plus energy single family house in Warsaw, Poland. REHVA J. 2013, 50, 58–62. [Google Scholar]
- Ala-Juusela, M.; Crosbie, T.; Hukkalainen, M. Defining and operationalising the concept of an energy positive neighbourhood. Energy Conv. Manag. 2016, 125, 133–140. [Google Scholar] [CrossRef]
- Lavikka, R.; Rehman, H.U.; Reda, F.; Kazi, A.S. Positive Energy Buildings. Concepts, Challenges and Opportunities; Springer International Publishing: Cham, Switzerland, 2022. [Google Scholar]
- Barrutieta, X.; Gainza, J.; Irulegi, O.; Hernández, R. The zero building: An exemplary nearly zero energy office building (NZEB) and its potential to become a positive energy building (PEB). Archit. Sci. Rev. 2023, 66, 214–225. [Google Scholar] [CrossRef]
- Hawila, A.A.W.; Pernetti, R.; Pozza, C.; Belleri, A. Plus energy building: Operational definition and assessment. Energy Build. 2022, 265, 112069. [Google Scholar] [CrossRef]
- Data for Energy Calculations of Buildings. Available online: https://www.gov.pl/web/archiwum-inwestycje-rozwoj/dane-do-obliczen-energetycznych-budynkow (accessed on 10 December 2022).
- EN 303-5:2012; Heating Boilers—Part 5: Heating Boilers for Solid Fuels, Manually and Automatically Stoked, Nominal Heat Output of up to 500 kW—Terminology, Requirements, Testing and Marking. European Committee for Standardization: Brussels, Belgium, 2012.
- Pełka, G.; Jach-Nocoń, M.; Paprocki, M.; Jachomowski, A.; Luboń, W.; Nocoń, A.; Wygoda, M.; Wyczesany, P.; Pachytel, P.; Mirowski, T. Comparison of Emissions and Efficiency of Two Types of Burners When Burning Wood Pellets from Different Suppliers. Energies 2023, 16, 1695. [Google Scholar] [CrossRef]
- KOBiZE. Wskaźniki emisji zanieczyszczeń ze spalania paliw dla źródeł o nominalnej mocy cieplnej do 5 MW, zastosowane do automatycznego wyliczenia emisji w raporcie do Krajowej bazy za rok 2022; KOBiZE: Warszawa, Poland, 2023. (In Polish) [Google Scholar]
- MacKay, R.S. Sustainable energy storage–with hot air, or cold air or liquid air. Contemp. Phys. 2020, 61, 1–11. [Google Scholar] [CrossRef]
- Available online: https://www.enair.es/es/aerogeneradores/e200l (accessed on 10 December 2022).
- Available online: https://www.enair.es/es/aerogeneradores/e30pro (accessed on 12 January 2023).
- Available online: https://kratki.com/pl/blog/cena-pomp-ciepla (accessed on 5 April 2025).
- Available online: https://www.kolektory.com/instalacje-fotowoltaiczne-ceny/instalacje-fotowoltaiczne-ceny.html (accessed on 5 April 2025).
- Available online: https://www.kolektory.com/magazyny-energii/zestaw-pv-o-mocy-10-kw-z-akumulatorami.html (accessed on 5 April 2025).
- Available online: https://kobo-energy.pl/przydomowa-elektrownia-wiatrowa-jak-dziala-jakie-sa-koszty-i-komu-sie-oplaca/ (accessed on 5 April 2025).
- Available online: https://termikabieniek.pl/kategoria-produktu/technika-grzewcza/kotly/kotly-na-pellet/ (accessed on 5 April 2025).
- Available online: https://agregaty.sklep.pl/agregat-pradotworczy-barracuda-9500-3f-silent-ats-p-26899.html (accessed on 5 April 2025).
Disclaimer/Publisher’s Note: The statements, opinions and data contained in all publications are solely those of the individual author(s) and contributor(s) and not of MDPI and/or the editor(s). MDPI and/or the editor(s) disclaim responsibility for any injury to people or property resulting from any ideas, methods, instructions or products referred to in the content. |
© 2025 by the authors. Licensee MDPI, Basel, Switzerland. This article is an open access article distributed under the terms and conditions of the Creative Commons Attribution (CC BY) license (https://creativecommons.org/licenses/by/4.0/).