Article

Exploring Options for the Application of Azobenzene for Molecular Solar Thermal Energy Storage: Integration with Parabolic Trough Solar Systems

1
School of Energy and Environment, Inner Mongolia University of Science and Technology, Baotou 014010, China
2
School of Energy and Power Engineering, University of Shanghai for Science and Technology, Shanghai 200093, China
3
School of Building Services Science and Engineering, Xi’an University of Architecture and Technology, Xi’an 710055, China
4
Department of Mechanical Engineering, Faculty of Engineering and Architecture, Recep Tayyip Erdogan University, Zihni Derin Campus, Rize 53100, Turkey
5
Center for Research Impact & Outcome, Chitkara University, Rajpura 140401, Punjab, India
6
University Centre for Research and Development, Chandigarh University, Mohali 140413, Punjab, India
*
Author to whom correspondence should be addressed.
Energies 2025, 18(9), 2298; https://doi.org/10.3390/en18092298
Submission received: 20 February 2025 / Revised: 7 April 2025 / Accepted: 23 April 2025 / Published: 30 April 2025
(This article belongs to the Section A2: Solar Energy and Photovoltaic Systems)

Abstract

:
Molecular solar thermal (MOST) energy systems can be utilized for the absorption, storage, and release of energy from the ultraviolet (UV) band of the solar spectrum. In this study, we designed a molecular solar thermal energy storage and release device based on the photoisomerization reaction of azobenzene. The device was integrated with a parabolic trough solar system, broadening the absorption range of the solar spectrum. By utilizing a coated secondary reflector, the system achieved efficient reflection of ultraviolet (UV) light in the 290–490 nm range, while solid-state azobenzene enabled the conversion of photon energy into chemical energy for storage and release. Experimental results under winter outdoor conditions demonstrated that: the secondary reflector significantly enhanced UV light concentration; the molecular solar thermal energy device exhibited remarkable thermal efficiency. Under an average solar irradiance of 302.23 W·m−2, the device demonstrated excellent thermal performance, with the azobenzene reaching a peak temperature of 42.07 °C. The maximum heat release capacity was measured at 10.89 kJ·kg−1·m−1, while achieving a remarkable heat release power of 29.31 W·kg−1·m−1.

1. Introduction

Solar energy storage is abundant, and the total amount of solar radiation received on Earth’s surface each year is more than 7500 times the current total annual global primary energy consumption of 450 EJ [1]. The factors that limit the widespread application of solar energy are discontinuity and inhomogeneity. Therefore, solar energy storage and release technologies are crucial to the widespread application of solar energy [2]. Currently, various solar energy storage technologies are progressing rapidly, such as phase change material energy storage, air thermal energy storage, and chemical energy storage technologies [3,4,5]. Conventional solar thermal technologies typically adopt a simplistic approach to light utilization, primarily focusing on light intensity while neglecting the energy differentials across various wavelength ranges. This oversight results in inefficient thermal conversion for certain segments of the solar spectrum. To address these limitations in conventional solar thermal technologies, in recent years, a new solar energy storage technology called molecular solar thermal (MOST) energy storage system has attracted the attention of researchers [6]. It can capture the photon energy of specific wavelengths of sunlight, store it as chemical energy, and release the stored photon energy in the form of heat under external stimuli, such as catalysts, heat, and light. Moreover, the absorption range of the solar spectrum of MOST systems differs from the absorption range of the solar spectrum of photothermal systems and photovoltaic systems. Currently, one of the primary application approaches for MOST systems involves their integration with conventional solar utilization systems as complementary components to enhance overall solar energy conversion efficiency.
Swedish scholars Maria et al. investigated the feasibility of low-molecular-weight norbornadiene derivatives (193–260 g·mol−1) for molecular solar thermal energy storage [7]. Subsequently, Ambra designed a molecular solar thermal energy storage system using norbornadiene-tetracycline derivatives and combined it with a solar water heating (SWH) system, which can store energy up to 103 kJ/mol (396 kJ·kg−1) [8]. The combined efficiency of the system reached 80% after the combination of the systems. Wang et al. designed a solar energy device by hybridizing a solar PV system with a MOST device to solve the problem of heat overload after solar cells receive a large amount of solar radiation [9]. The device successfully cooled the solar cell by approximately 8 °C. Meanwhile, the device converted 2.3% of the solar energy into chemical energy storage. The device had a solar energy utilization of 14.9%. Wang et al. designed a compact chip-based device using thin-film MOST materials, representing a significant miniaturization advancement in solar thermal energy storage technology [10]. The device was integrated with an ultrathin thermoelectric chip to achieve thermal-to-electric conversion, generating a maximum output power of 0.1 nW with a volumetric power density reaching 1.3 W·m−3. This system demonstrates the potential for geographically unrestricted conversion of stored solar energy into electricity.
For MOST systems, the development of high-performance MOST fuels represents one of the critical factors determining their widespread adoption. MOST fuels are a variety of compounds that undergo reversible photoisomerization reactions, such as norbornadiene [11] and azobenzene [12]. Among many MOST fuel candidates, azobenzene-containing polymers are considered to have the greatest potential for application [13,14]. Although the half-life of pristine azobenzene (AZO) is up to 4.2 d, its energy density is low (49 KJ·mol−1) [15]. However, the advantages of pristine azobenzene in terms of functionalization, synthesis, and cost are outstanding [13].
Currently, the main challenges limiting MOST system applications extend beyond energy storage materials to include practical implementation in real-world scenarios. However, compared to the development of novel energy storage materials, research on MOST system engineering applications remains relatively scarce. This study developed a novel MOST device specifically designed for solid-state azobenzene and its derivatives, leveraging the heat storage/release phenomena during molecular photoisomerization. Unlike conventional MOST devices, which predominantly employ solution-phase thermal storage materials [16,17,18], the present work utilizes solid-state azobenzene as the energy storage medium, representing a significant advancement in system design. The MOST device based on solid-state energy storage materials offers significant installation advantages, making it particularly suitable for practical deployment. The novel MOST device enables efficient storage and release of ultraviolet energy from sunlight. When integrated with parabolic trough solar systems, it significantly expands the spectral utilization range of solar energy [19]. To validate the practical performance of the MOST device, we constructed a molecular solar thermal energy storage and release system based on a parabolic trough solar collector, demonstrating its real-world applicability.

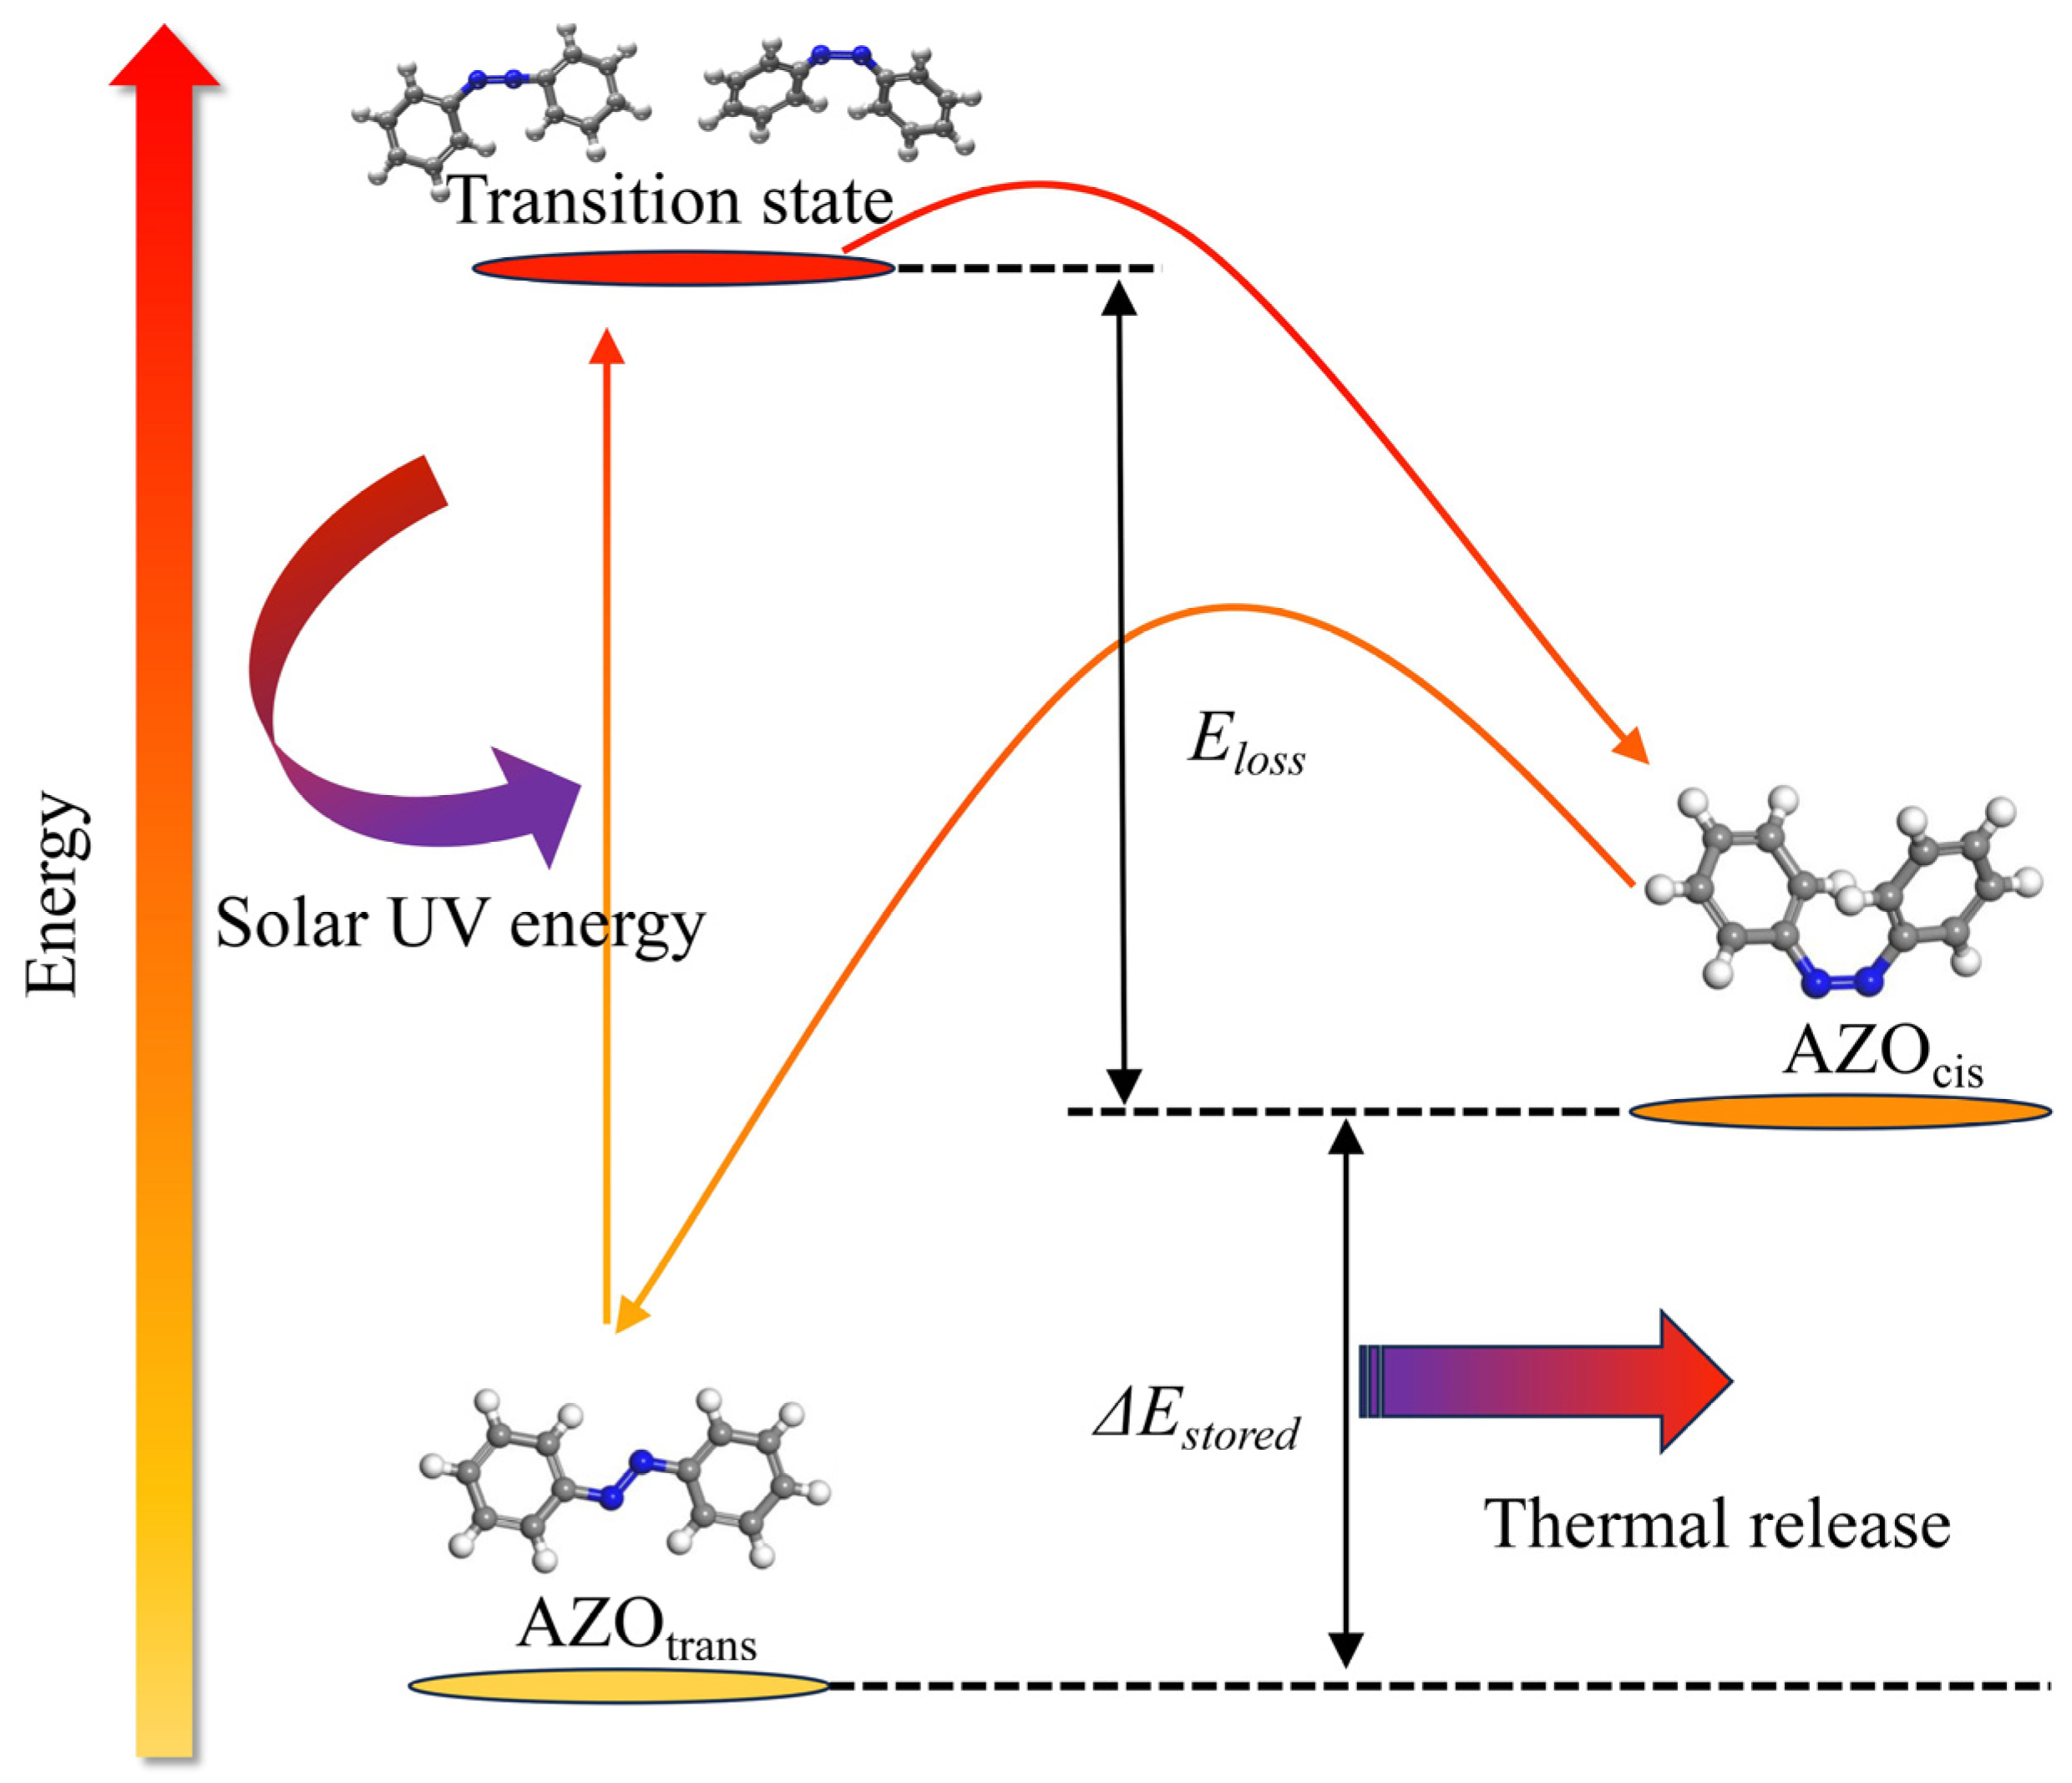
2. The Molecular Solar Thermal Energy Storage and Release System and Thermal Conductivity Model of the MOST Device

The molecular solar thermal energy storage and release system proposed in this paper is mainly composed of three parts: a parabolic trough solar system, a secondary reflector, and a MOST device, as shown in Figure 1.
The parabolic trough solar system serves as the structural and optical platform for the MOST device, with its precisely aligned primary and secondary reflectors ensuring optimal solar incidence. The parabolic trough solar system efficiently converts longer-wavelength solar radiation (visible and near-infrared light) into thermal energy through its optimized optical-thermal design.
The secondary reflector features a specifically engineered geometry combined with an advanced optical filter coating, enabling precise spectral control of incident sunlight. The solar rays reflected by the parabolic trough concentrator undergo precise spectral separation through the secondary reflector, achieving efficient wavelength-dependent energy distribution. The solar radiation with wavelengths below 475 nm is selectively reflected and concentrated onto the MOST device, while wavelengths above 490 nm are transmitted to the parabolic trough’s absorber tube, achieving spectrally resolved solar energy utilization.
The MOST device incorporates azobenzene (AZO) as the photoactive isomerization material. The primary function of AZO (azobenzene) is to absorb ultraviolet (UV) radiation from sunlight and convert it into releasable thermal energy through its photoisomerization properties. When exposed to the reflected ultraviolet (UV) light, the MOST device absorbs UV energy and converts it into chemical potential energy through molecular photoisomerization.

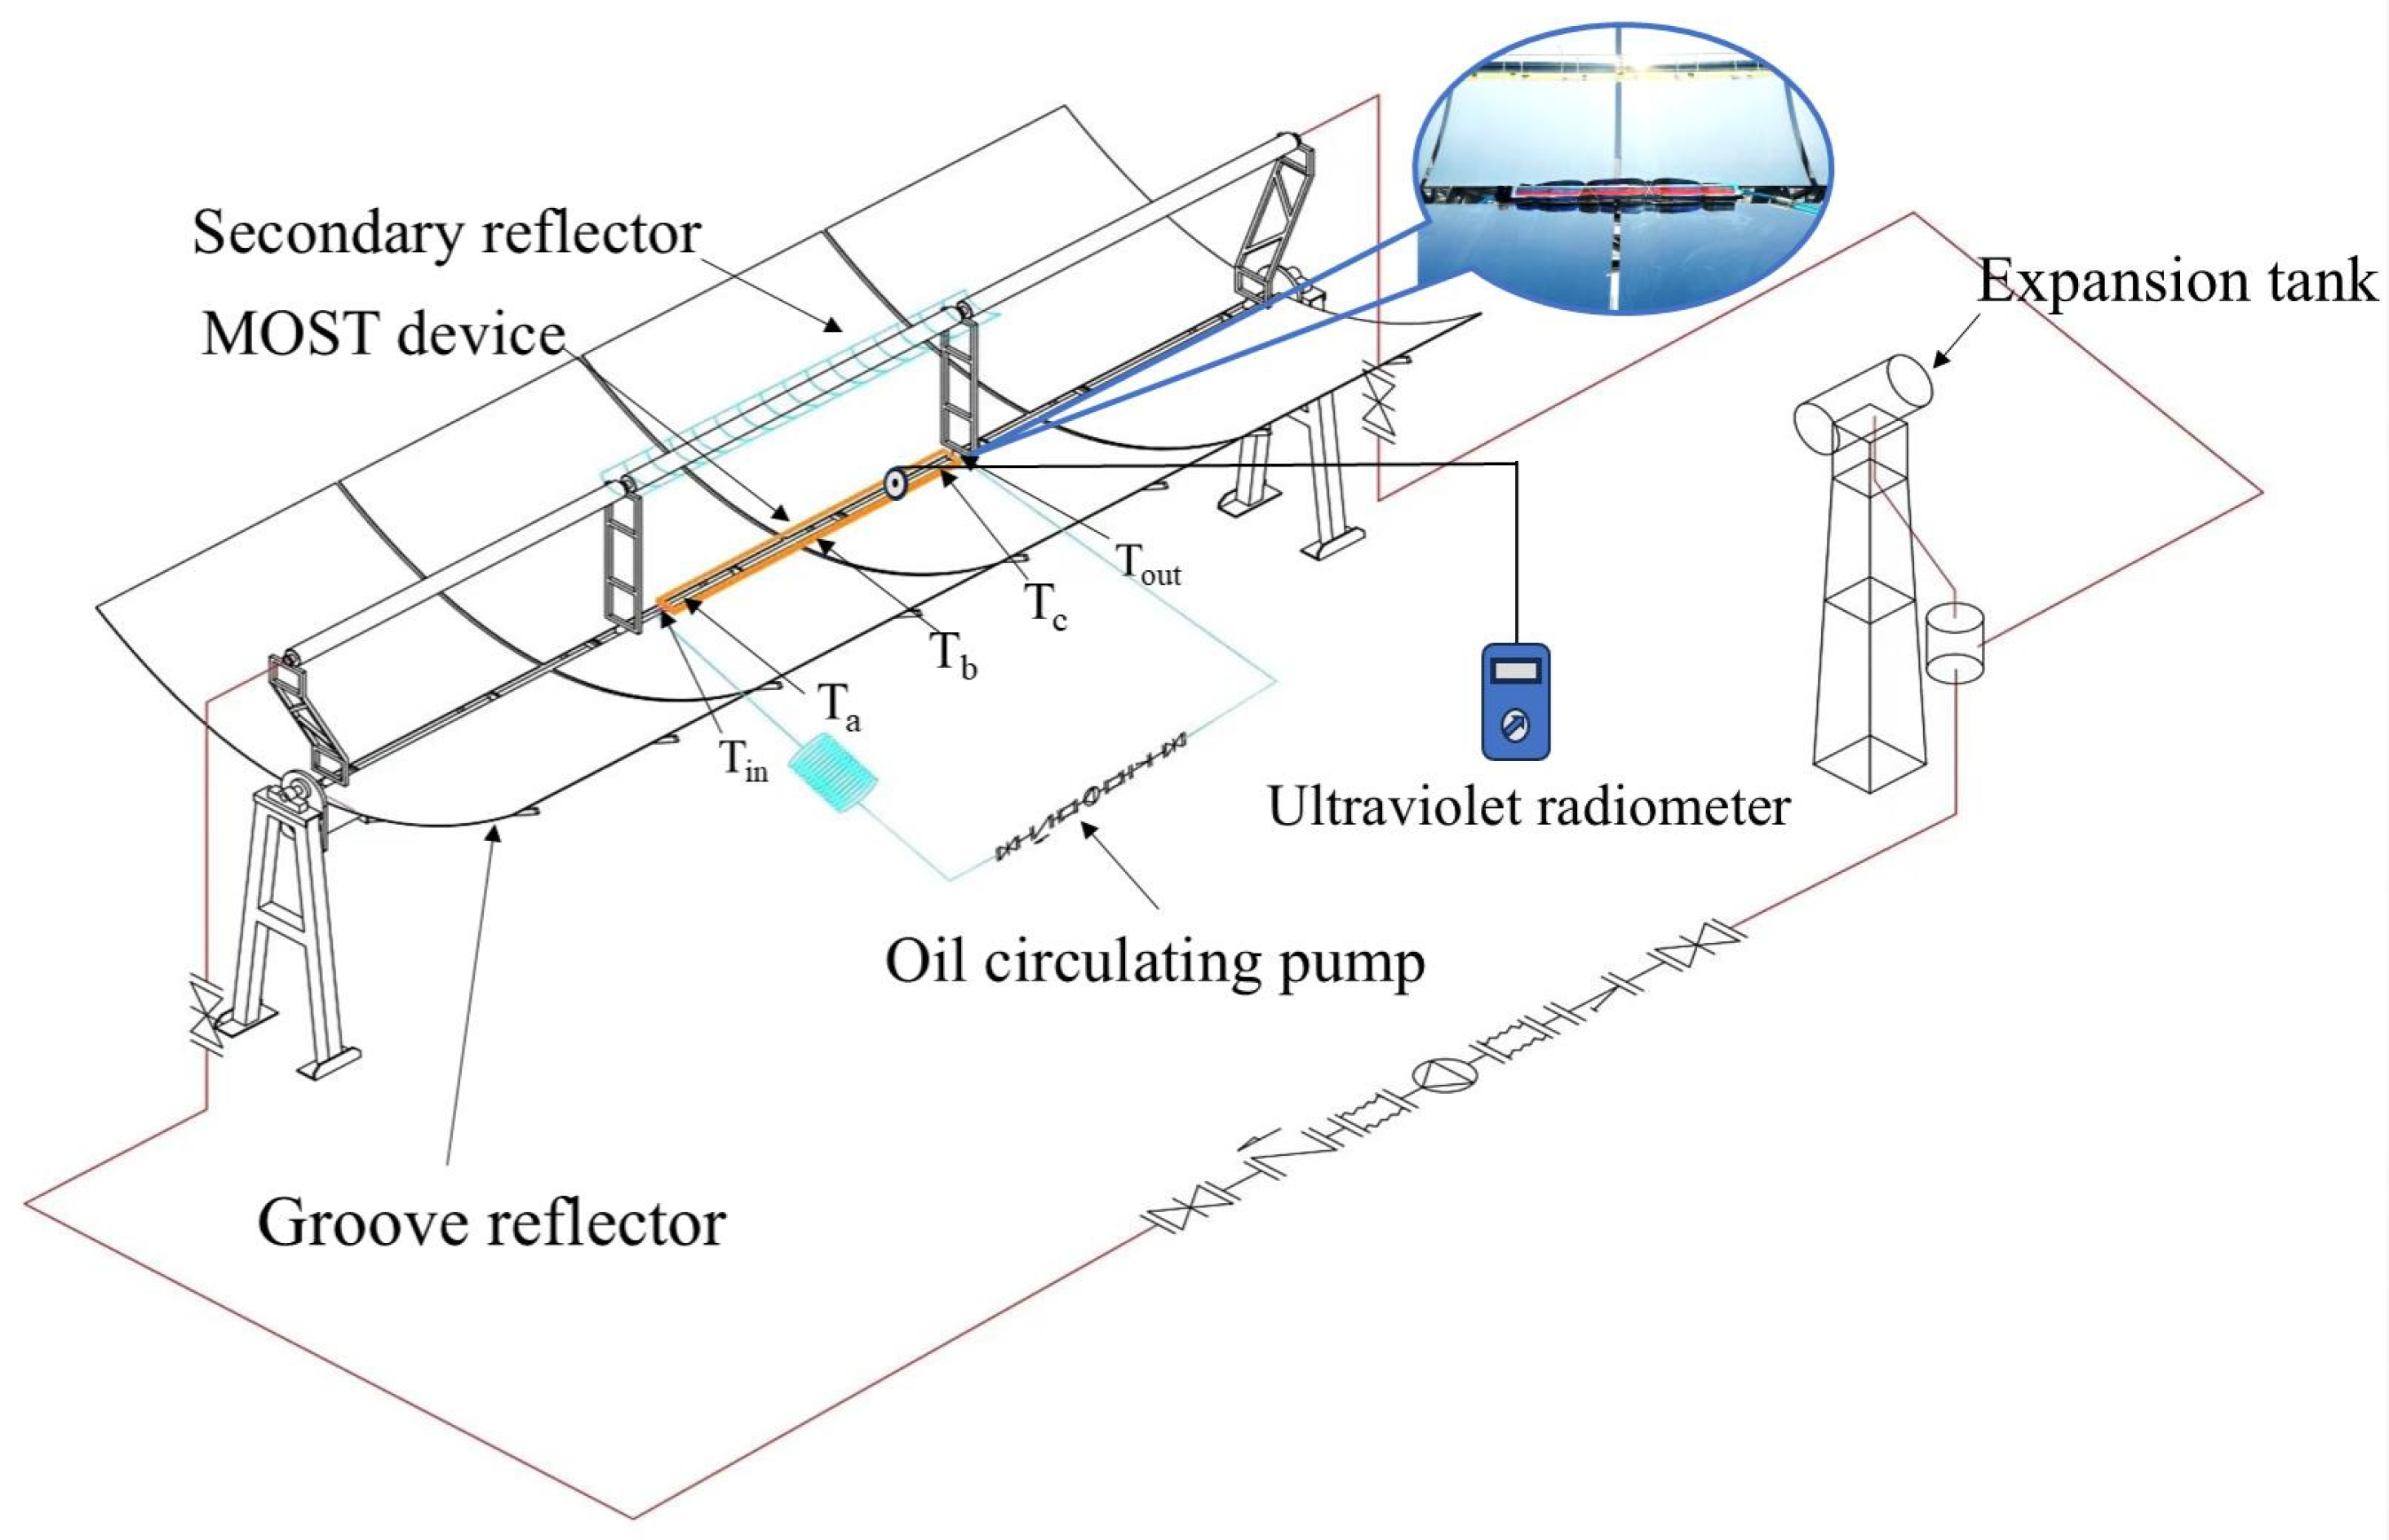
2.1. Parabolic Trough Solar

A pre-built 15.3 m2 parabolic trough solar system was used as the basic experimental bench, and the specific equipment parameters are listed in Table 1.

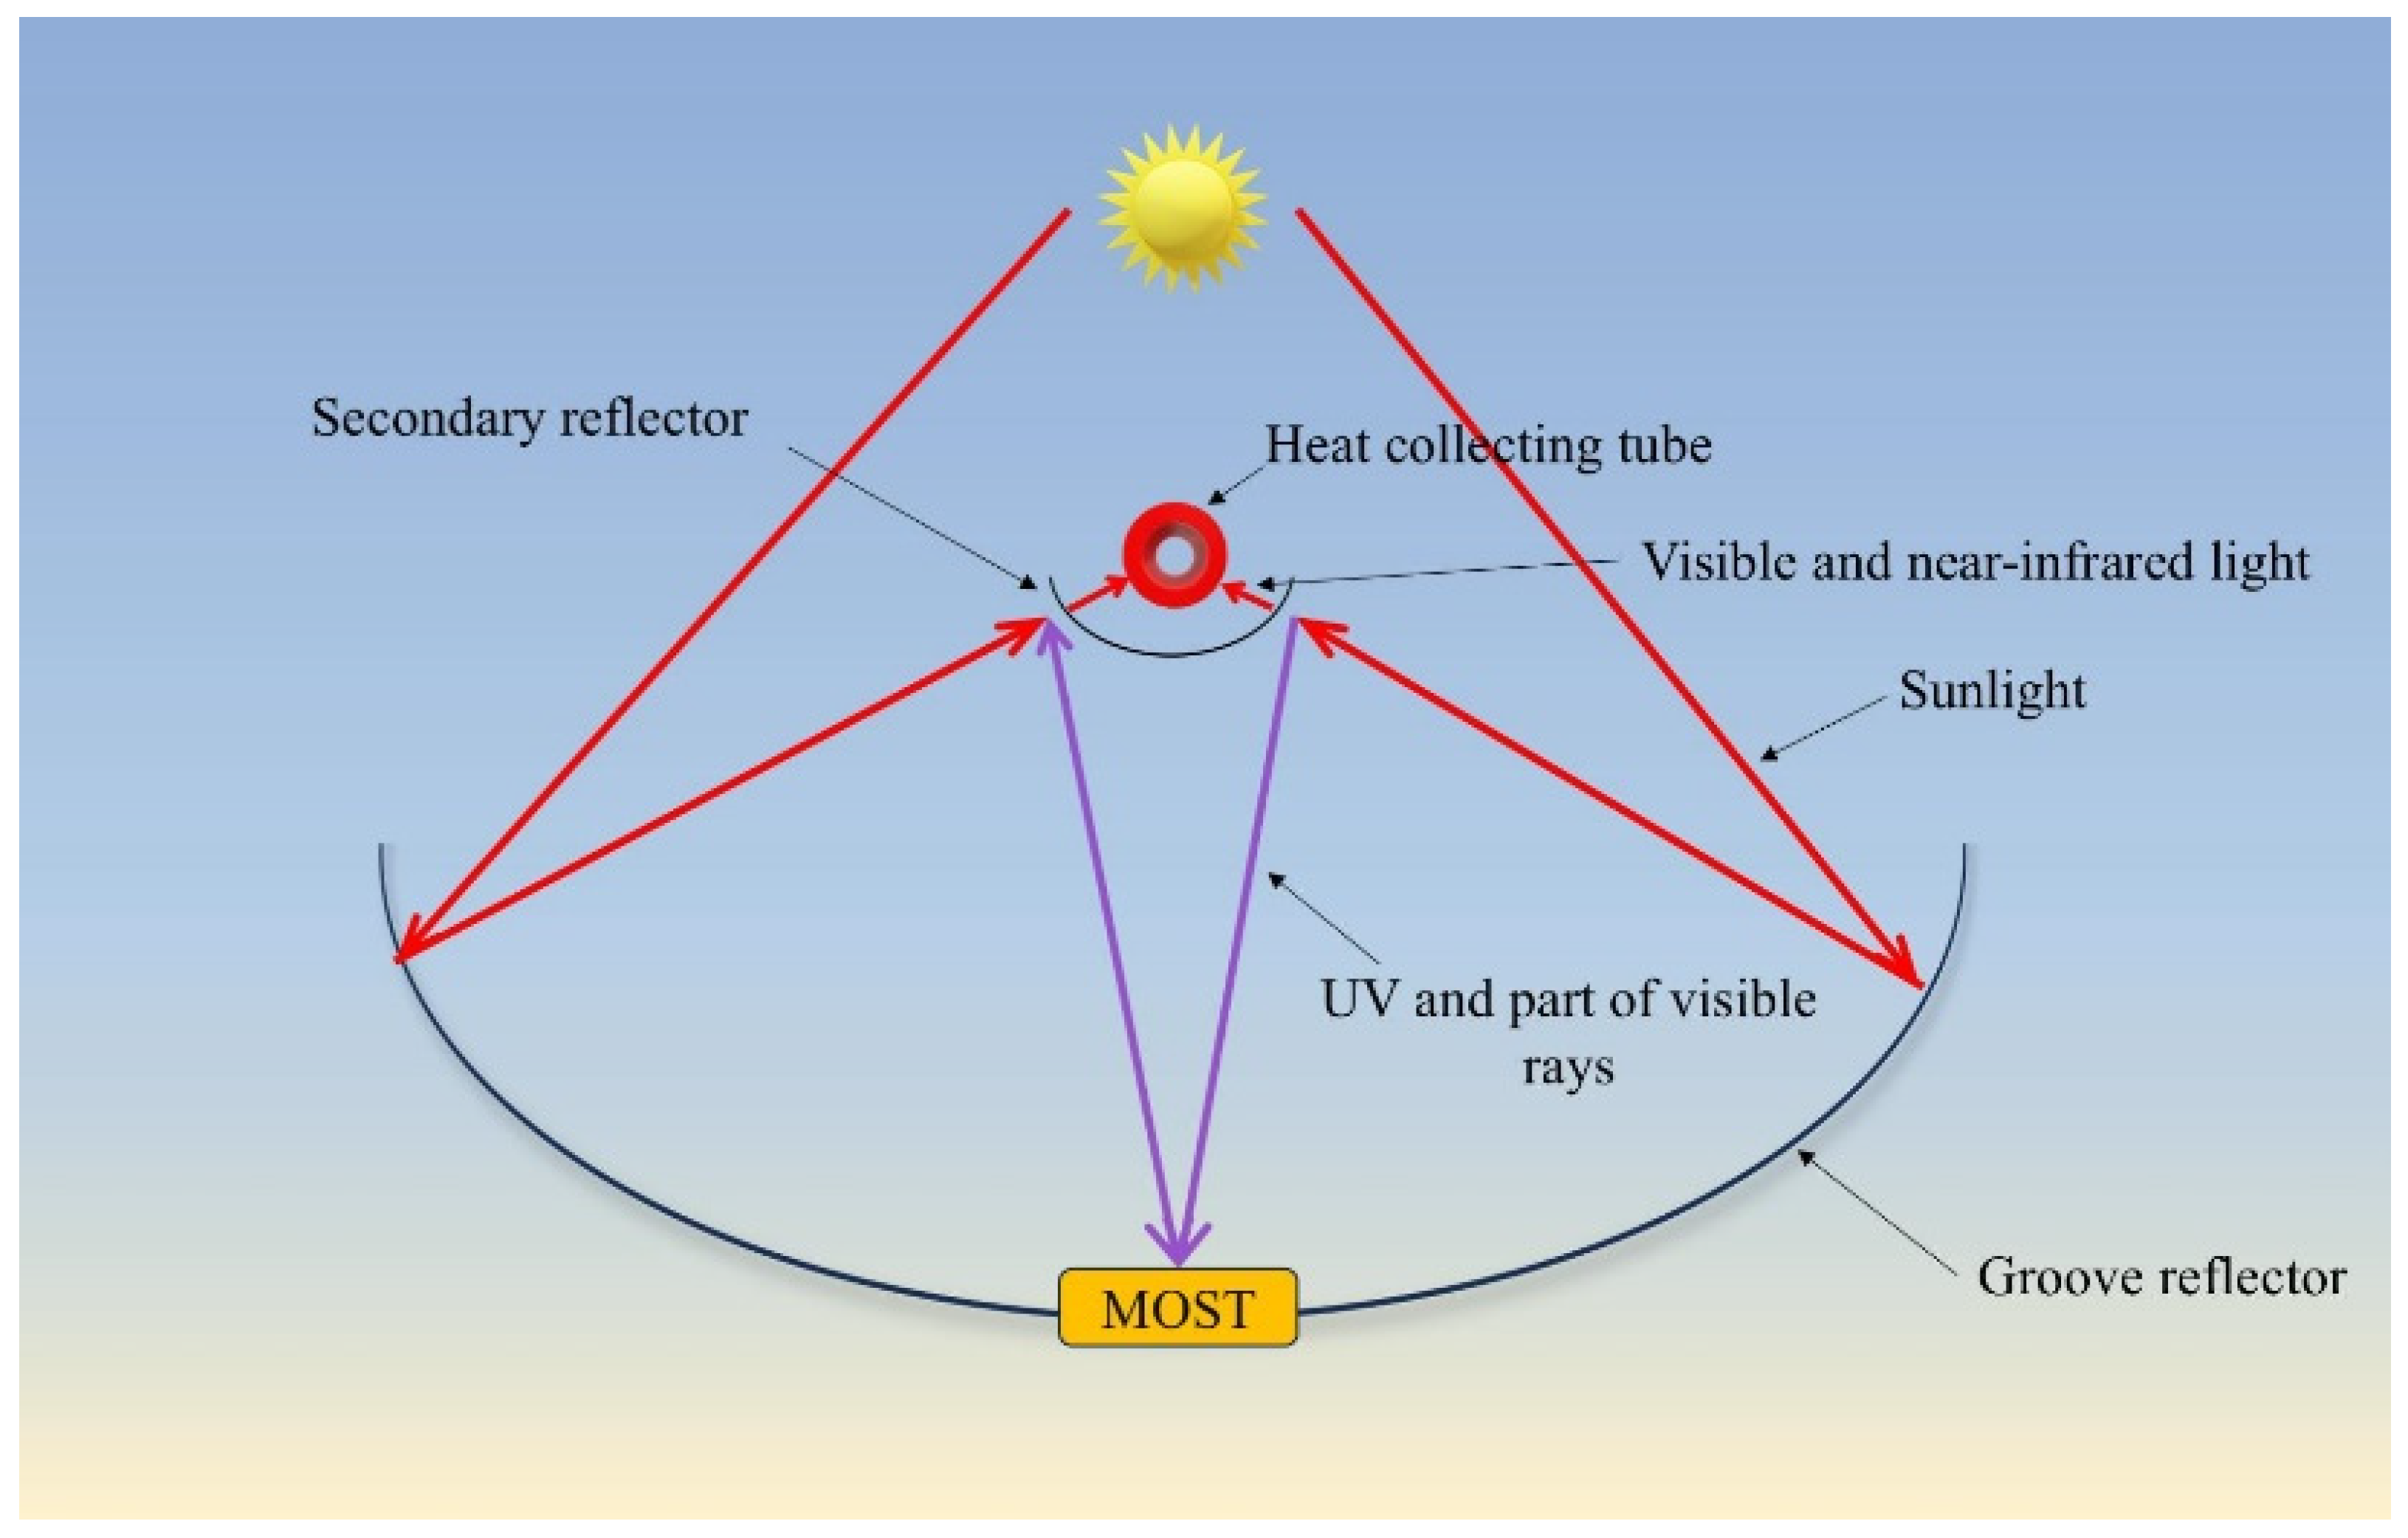
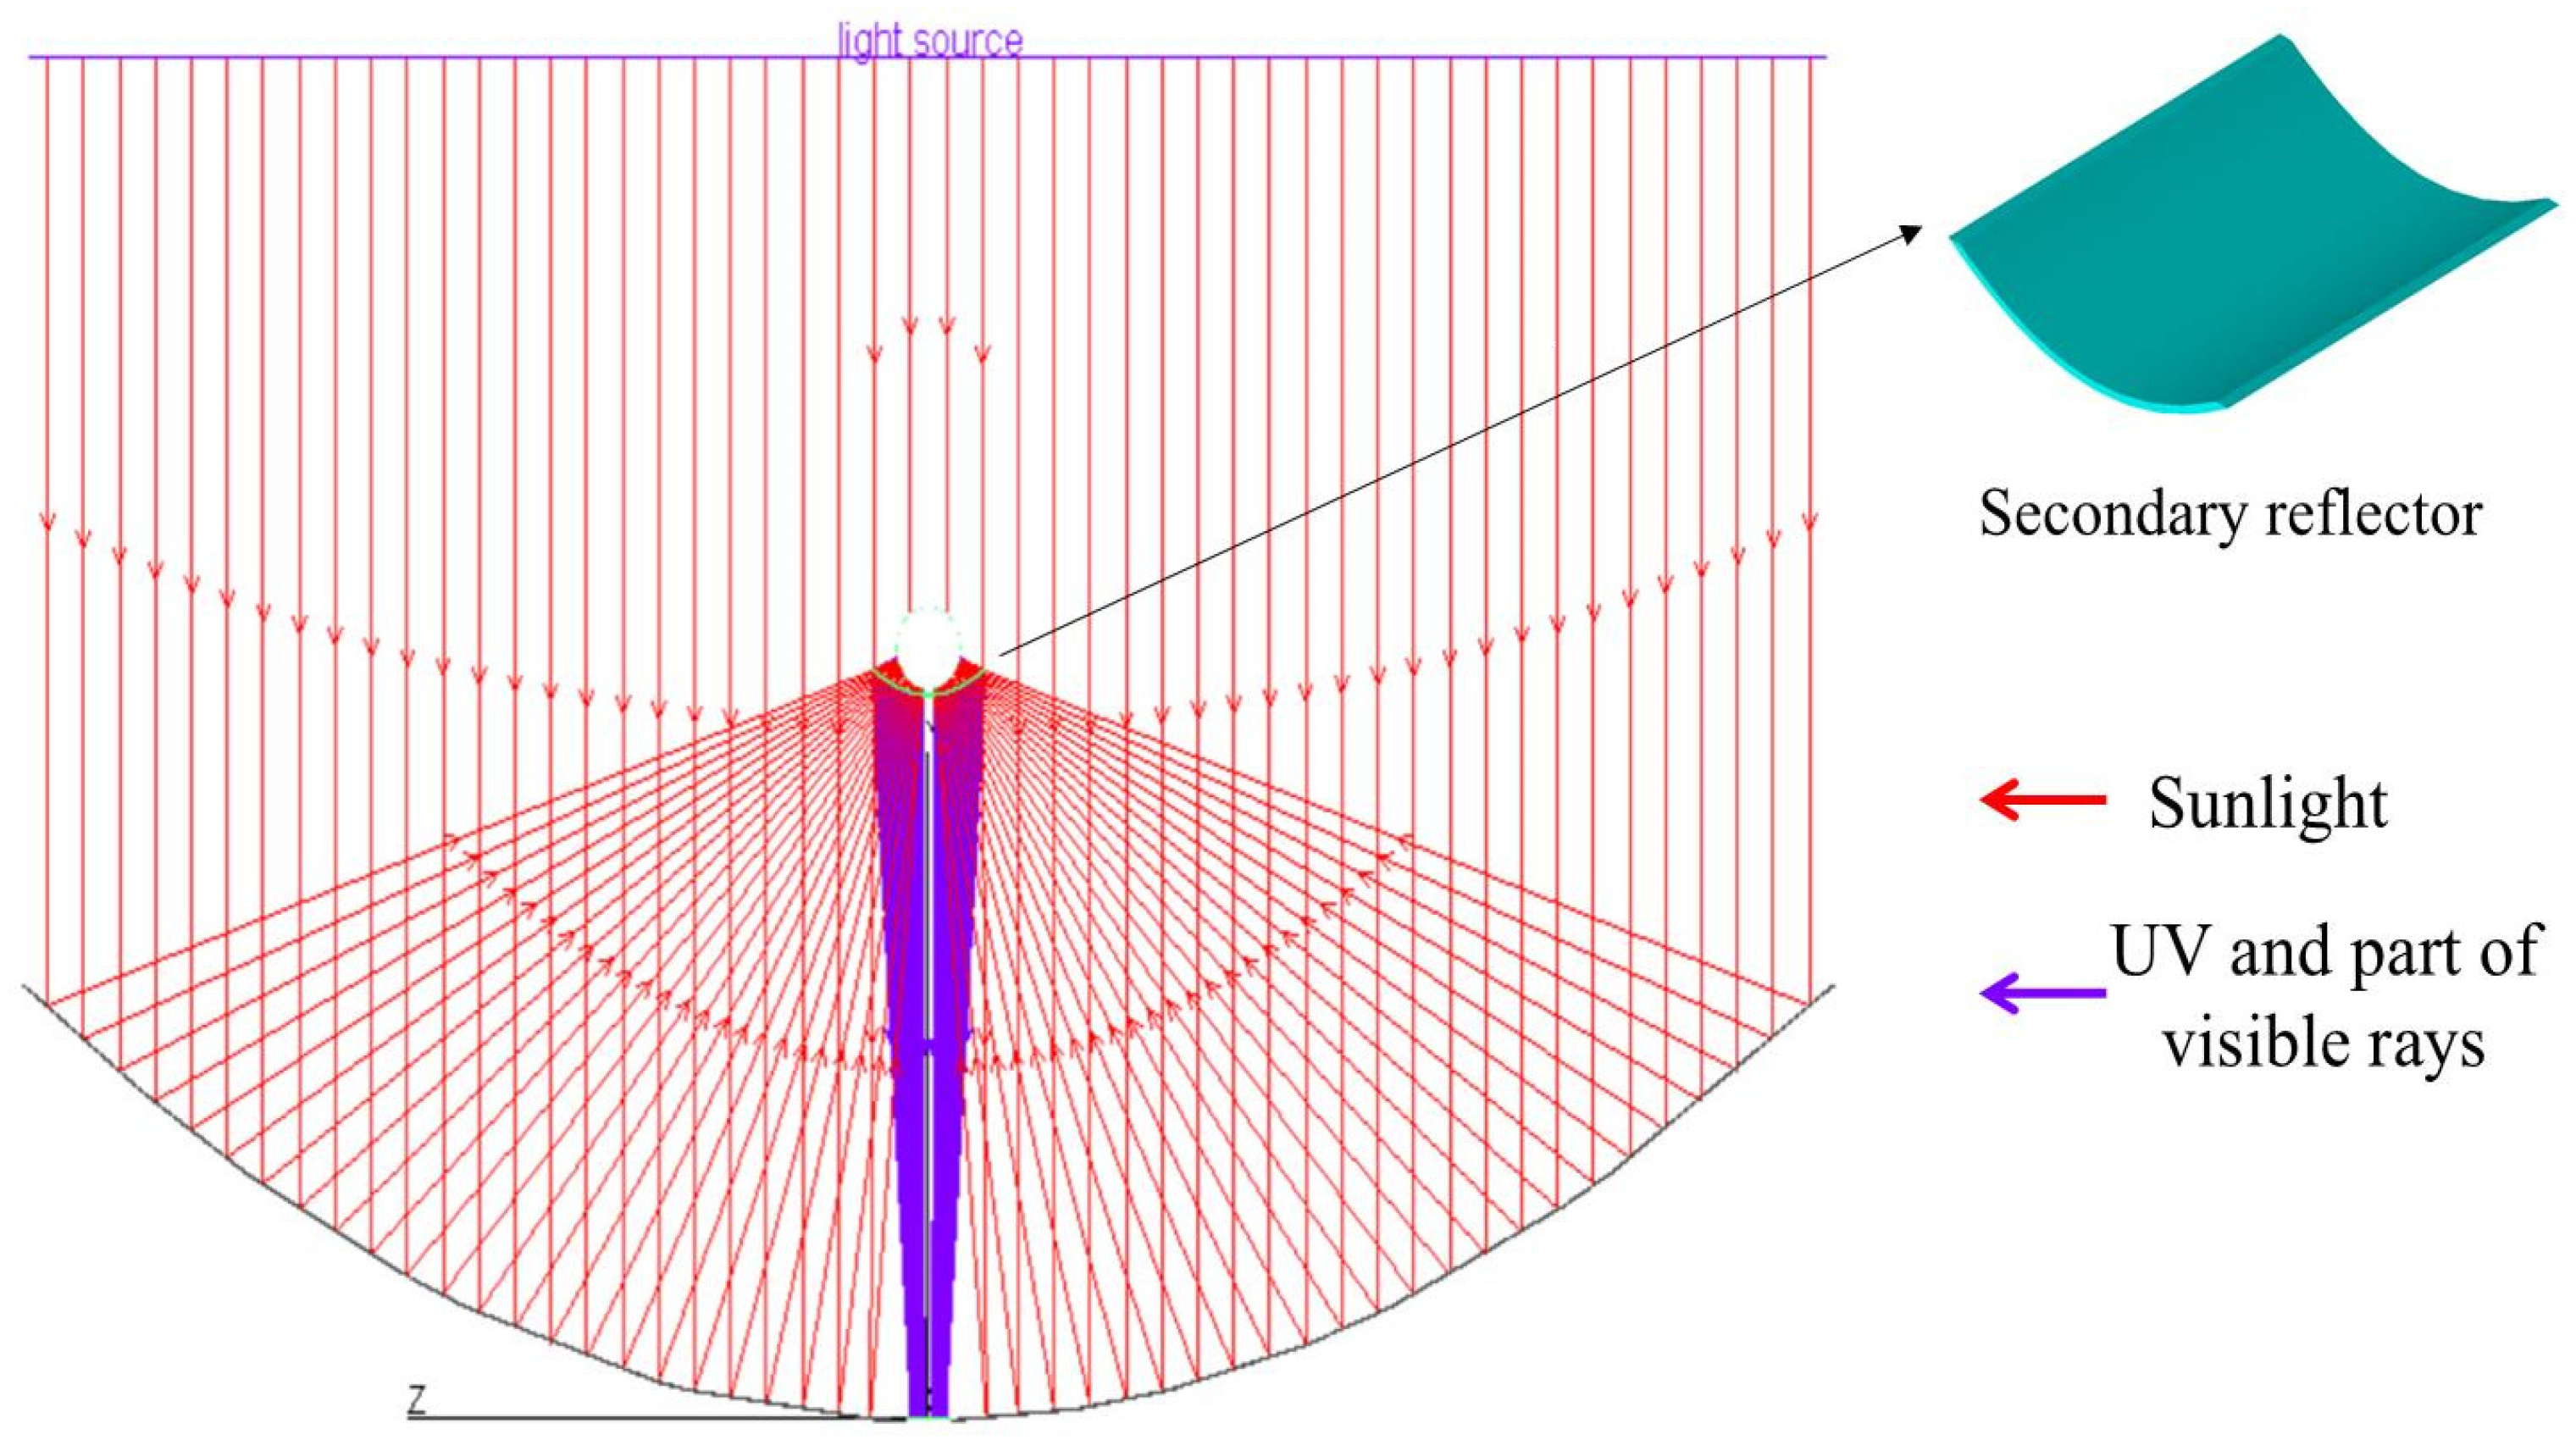
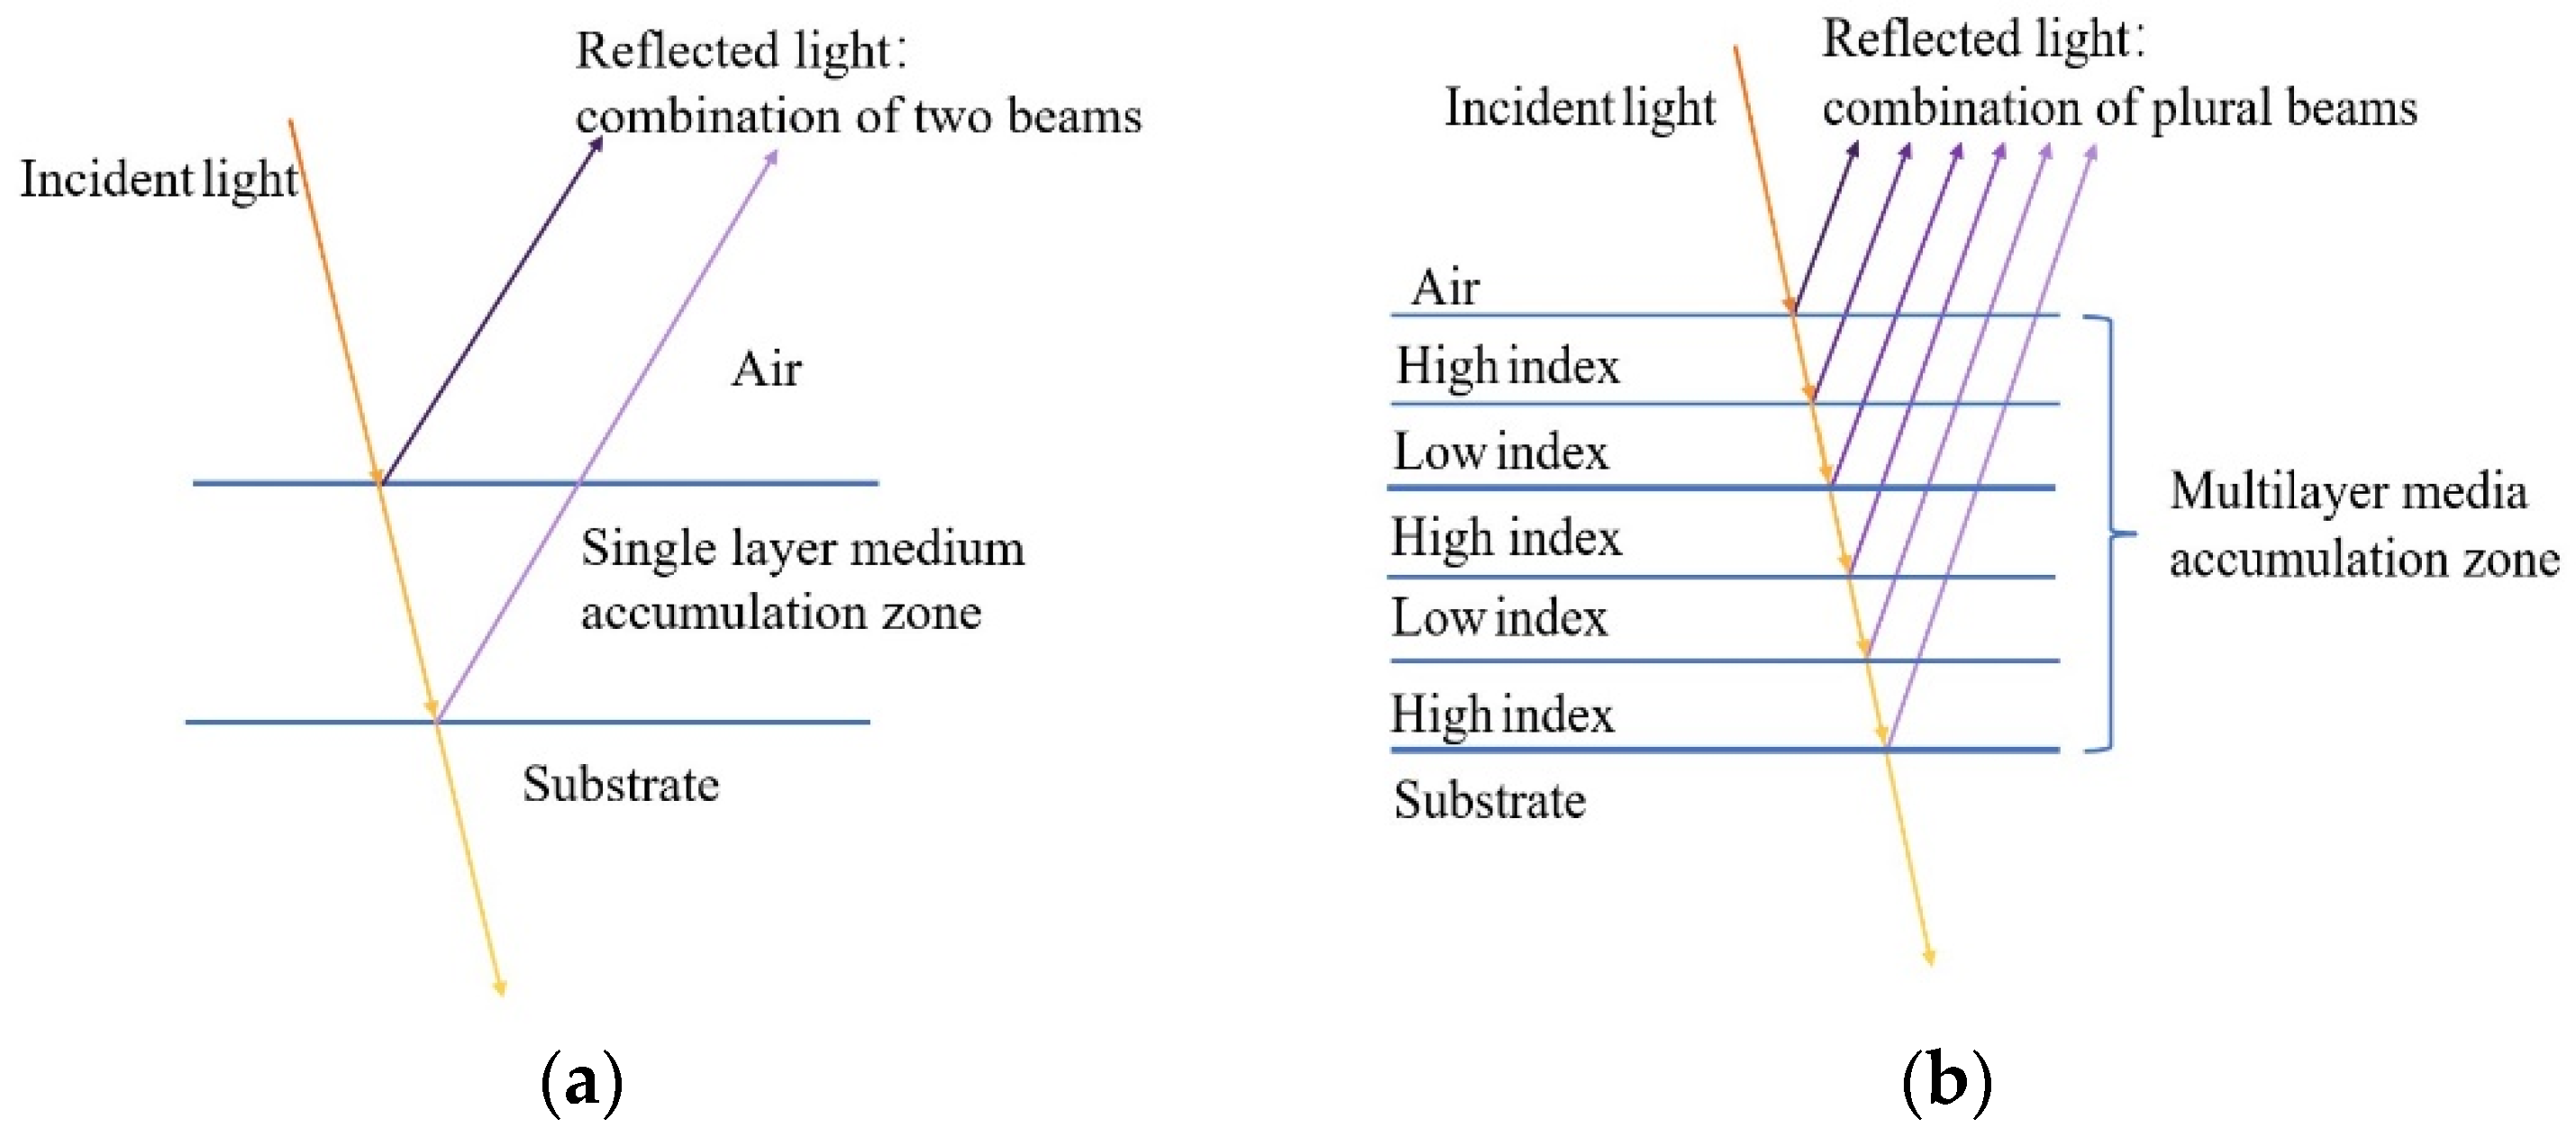
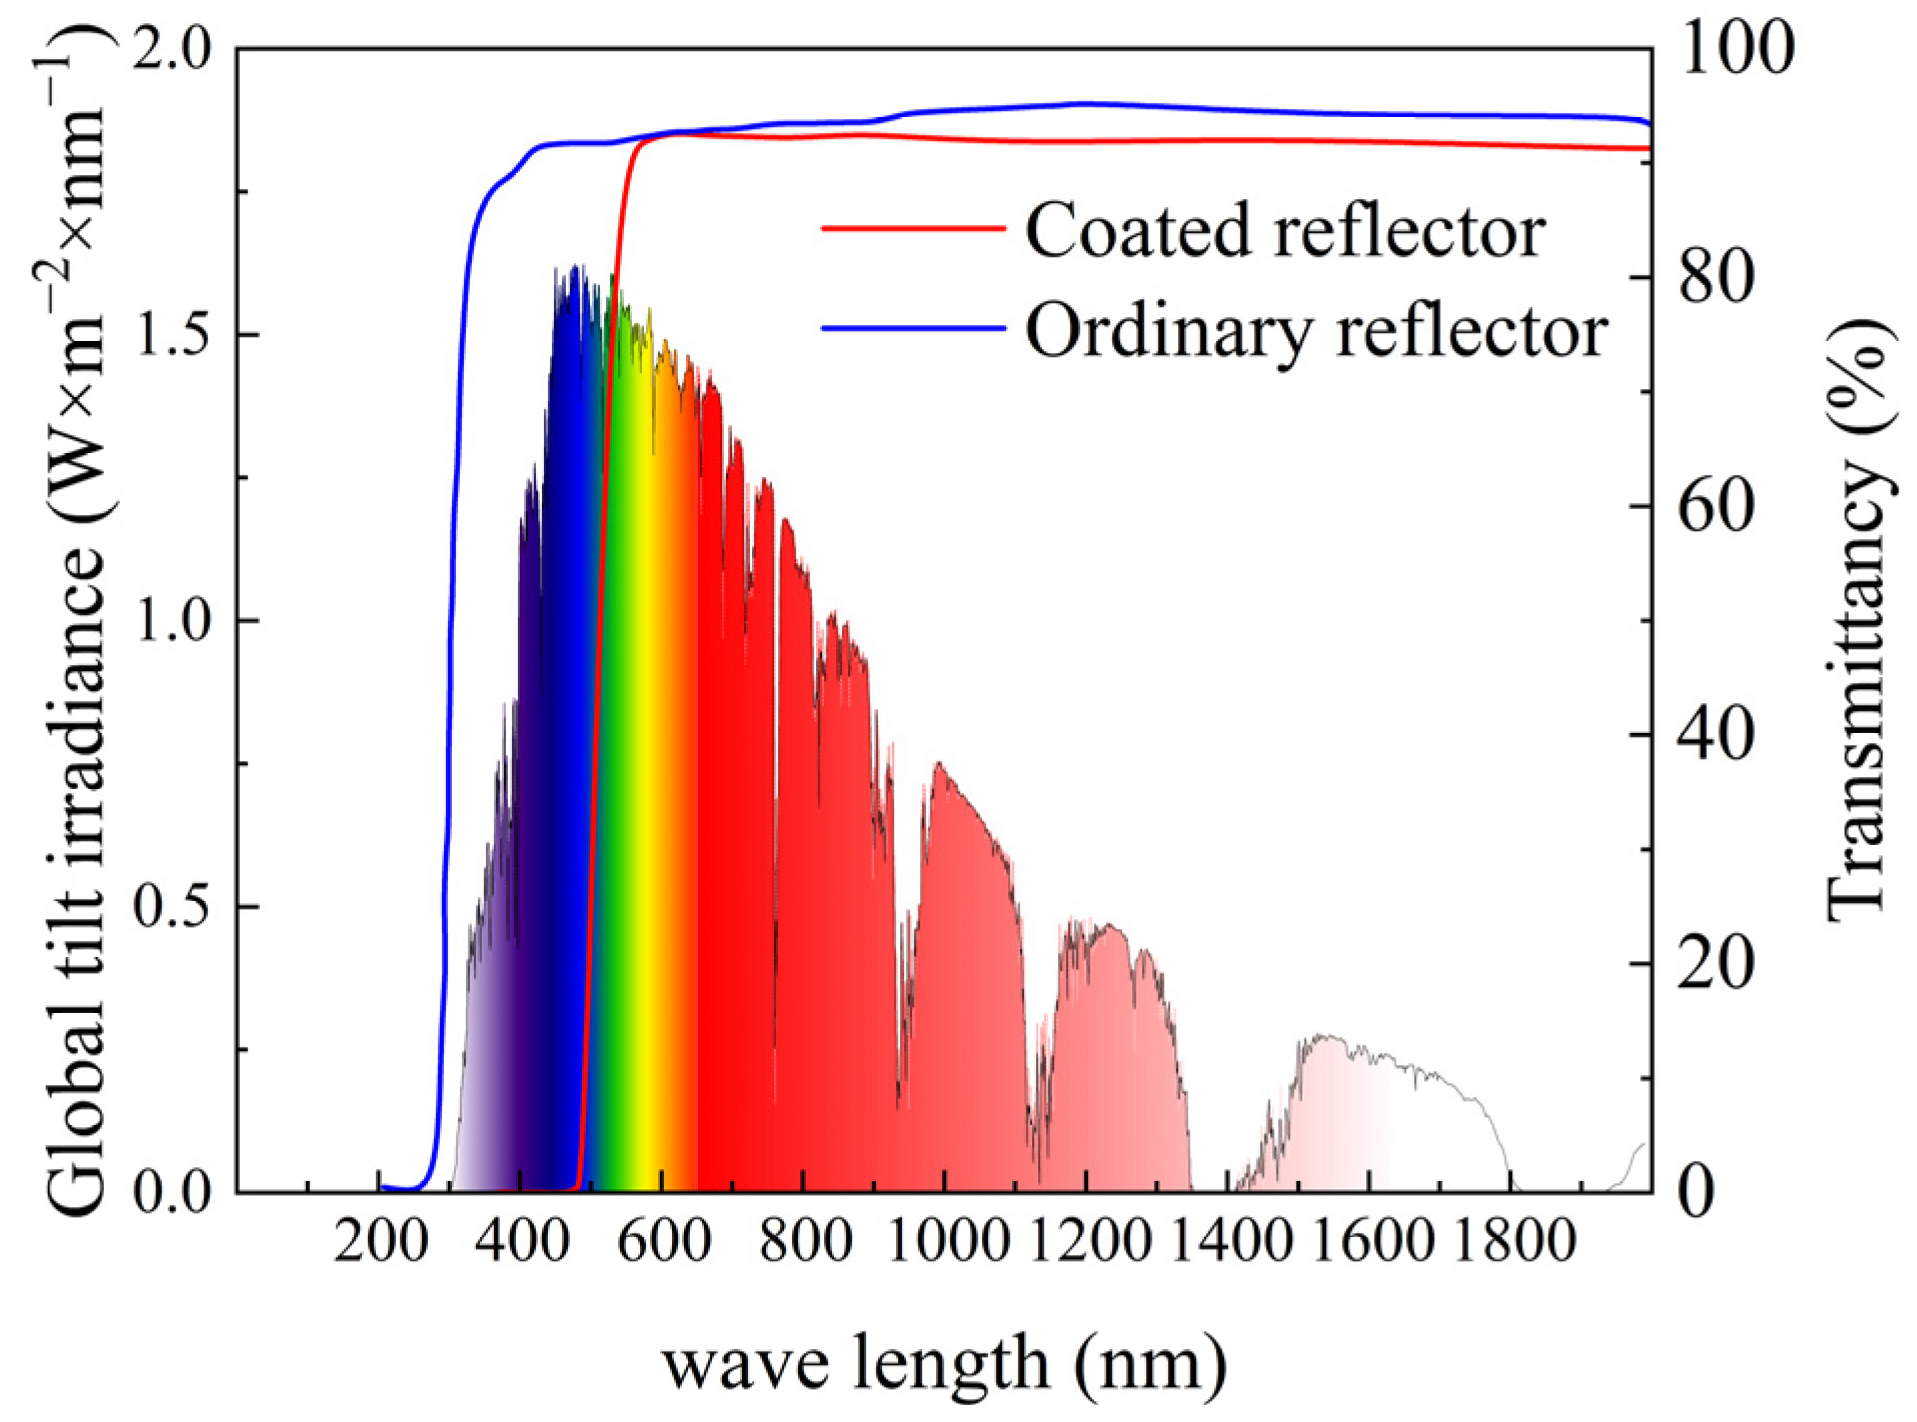
2.2. Design of the Secondary Reflector and Principle of Light Interference

The secondary reflector was the key equipment for realizing the frequency division of the solar spectrum. The secondary reflector needs to simultaneously possess the functions of solar spectral splitting and refracting light to a specified location. The secondary reflector must not only meet special optical path requirements but also separately satisfy the spectral band requirements of the MOST device and the parabolic trough solar collector tube for different solar spectra [20,21]. Therefore, the secondary reflector requires geometric design and surface coating.
The design of the secondary reflector was based on the reflection law of parabolic trough solar mirrors. The parabolic trough solar reflector has only one focal point for the reflection of natural light. As shown in Figure 1, the secondary reflector reflects and transmits the solar rays, then focuses them on the collector tube and the upper surface of the MOST device, respectively. Figure 2 shows the optical path of the molecular solar thermal energy storage and release system, based on the edge-ray principle [22]. In the figure, F1 and F2 are the focal points of the trough solar reflector and secondary reflector, respectively [23].
The design is based on the classical Cassegrain system [24]. The hyperbolic type is chosen as the basic surface type of the reflector. The hyperbola has two foci. Any light ray directed toward one focus will be reflected off the convex side of the hyperbola and pass through the other focus. Derive the hyperbolic equation of the lens in a two-dimensional rectangular coordinate system. The derivation process is as follows.
Set the hyperbolic equation as follows:
( x + α ) 2 a 2 y 2 b 2 = 1
where c 2 = a 2 + b 2 , and α is a real number.
In the 2D Cartesian coordinate system, the origin (0, 0) is set as one focus (F2) of the secondary reflector. Since the focal length of the parabolic trough solar collector is f = 850, the point (850, 0) in the x-y coordinate system represents the focal point (F1) of the parabolic trough reflector, which simultaneously serves as the other focus (F1) of the secondary reflector, with 2c = f. Therefore, the hyperbolic equation has α = −425 and c = 425. The right half branch of the hyperbola represents the secondary reflector. Let the intersection point of the hyperbola with the x-axis be at (d2, 0), where d2 satisfies 850 > d2 > 425. Substituting (d2, 0) α = −425, into Equation (1).
The d2 represents the installation position of the secondary reflector. According to Table 1, the parabolic trough solar collector tube has a diameter of 90 mm, with its center located at coordinates (850, 0). The actual installation position of the secondary reflector is located 5 mm directly below the collector, and the coordinate position is (800, 0). That is, d2 = 800. The reflector curve equation is calculated as follows:
( x     425 ) 2 375 2 y 2 200 2 = 1
where 0 < x < 825.
Import Equation (2) into the light simulation software. According to Table 1 and Table 2, the physical model of the slotted solar and the secondary reflector was established. The primary reflector of the parabolic trough solar collector has a surface reflectivity of 0.9, while the secondary reflector’s outer surface exhibits a UV reflectivity of 1 and visible light transmittance of 1. As shown in Figure 3, the simulation results satisfied the actual requirements.
The interferometric effect of the secondary reflector on the spectrum relies on interference cut-off filter film [25]. The filter film consists of an alternating stack of two media with near-zero absorption in a specified wavelength band. One medium has a low refractive index and the other has a high refractive index. The alternating stacks of two media with high and low refractive indices form a single or multi-layer interference film (Figure 4). Incident light of a specific wavelength is partially reflected at the interface of each layer. After the light passes through the interface of multiple layers, the transmitted light remains unchanged, and the light of a specific wavelength band is reflected and converged. The band control of the filter film is realized by changing the material or thickness of the media in each layer.
The UV-vis spectral absorption of AZO inside the MOST device is detected [26]. As shown in Figure 5, AZO had a strong absorption peak between 290–380 nm and a weaker absorption peak between 400–490 nm. The photothermal effect response bands of the parabolic trough solar system are visible and infrared light bands.
Therefore, for the sunlight irradiated to the surface, the secondary reflector was capable of reflecting light in the band of 290–490 nm and transmitting light in the band of more than 490 nm [27]. After processing using the relevant equipment, the secondary reflector was completed, as shown in Figure 6.

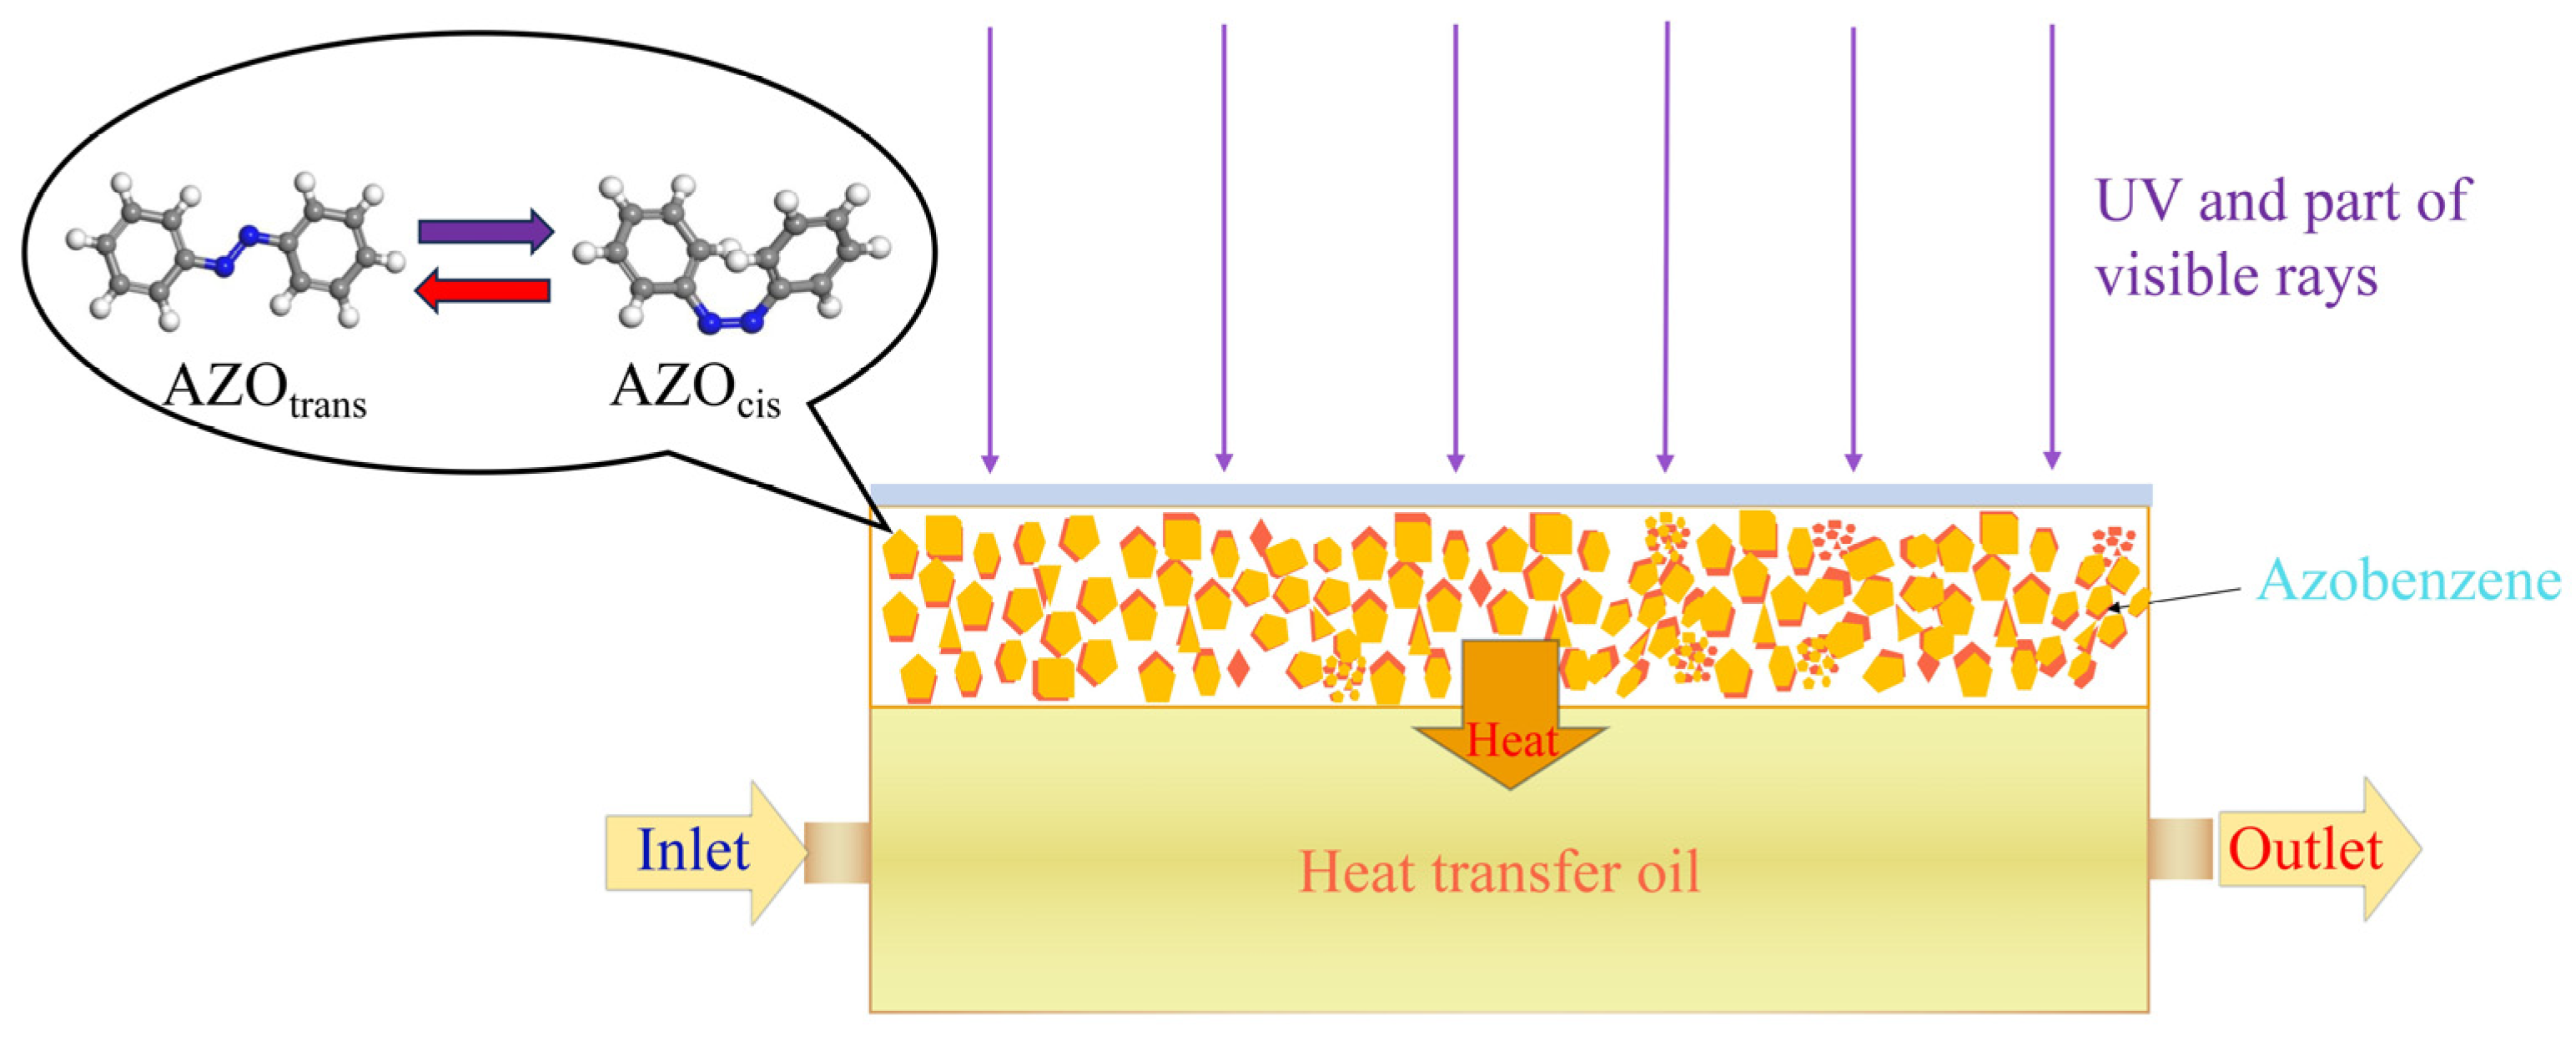
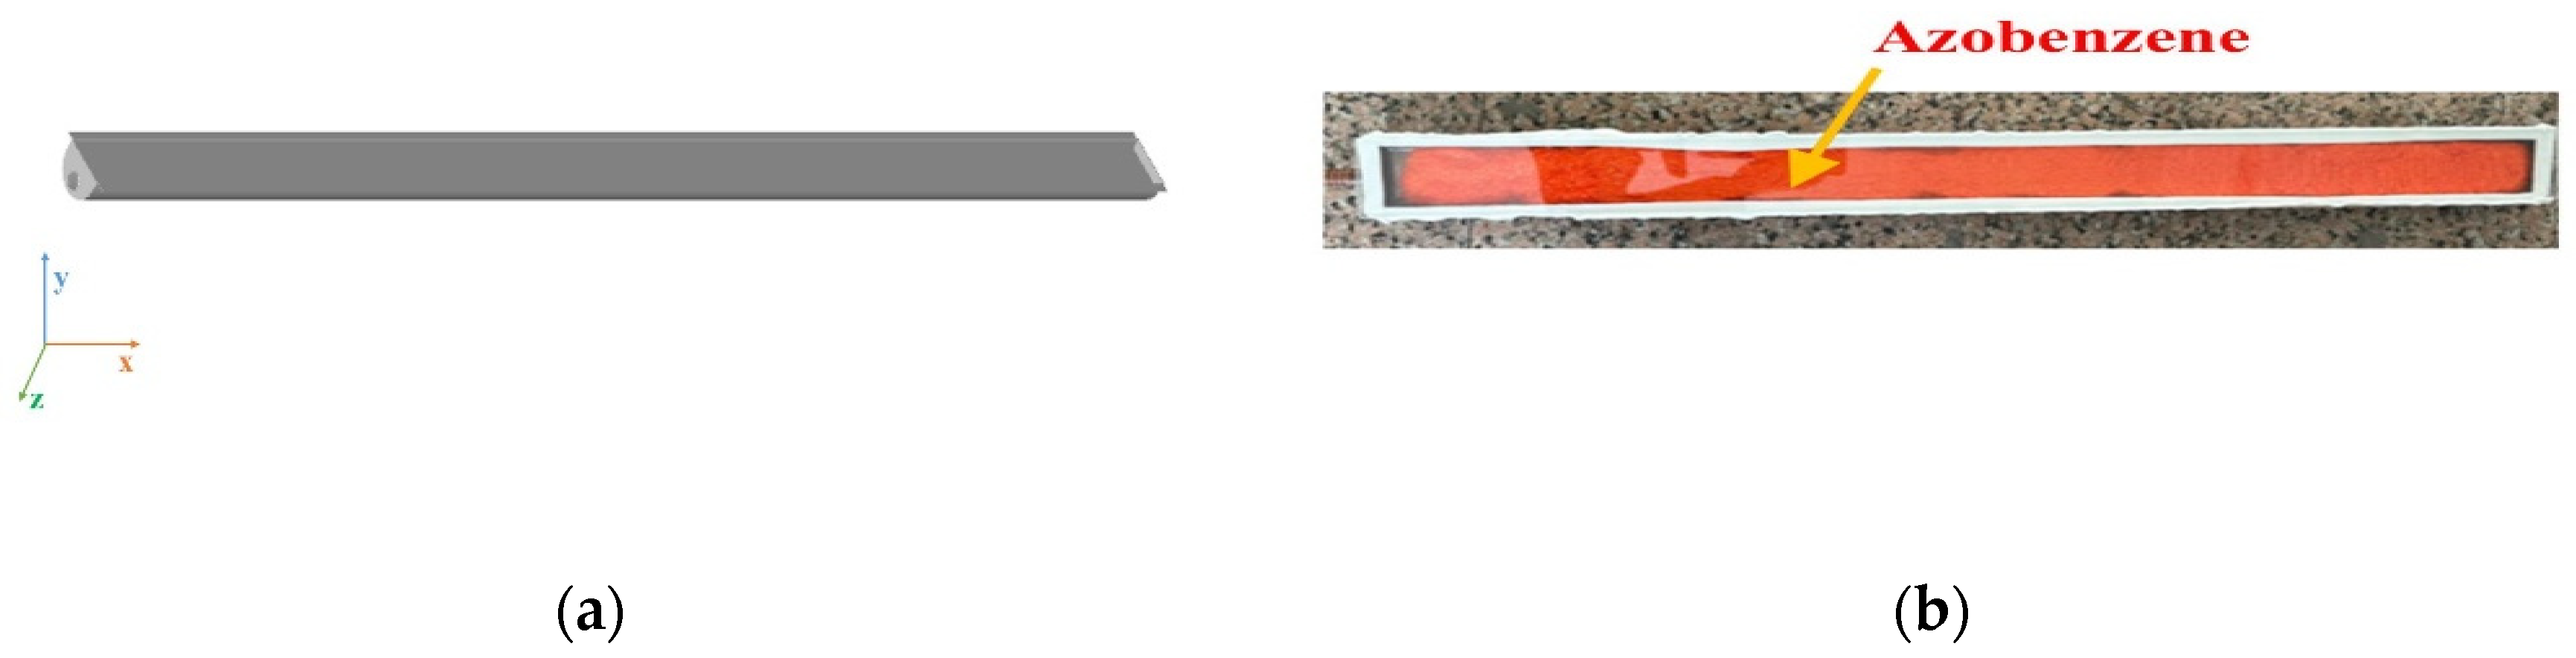
2.3. Design of the MOST Device

The MOST device was mounted on the bottom gap of a trough solar reflector. Cosine loss [28] and end-shadow loss [29] were influential factors in the design of MOST devices. To maximize the reception of UV irradiation, the height of the MOST device should not be too high. The main material of the MOST device was a copper plate with a thickness of 1 mm. The MOST device was divided into an AZO layer and a heat-transfer oil layer. The upper layer was a rectangular tank containing AZO. The AZO layer was encapsulated with BK7 glass (thickness: 2 mm). The lower half-cylinder structure was the heat-transfer oil flow channel. The design parameters of the MOST device were presented in Table 3. The relevant parameters of the azobenzene-based material are presented in Table 4 [30].

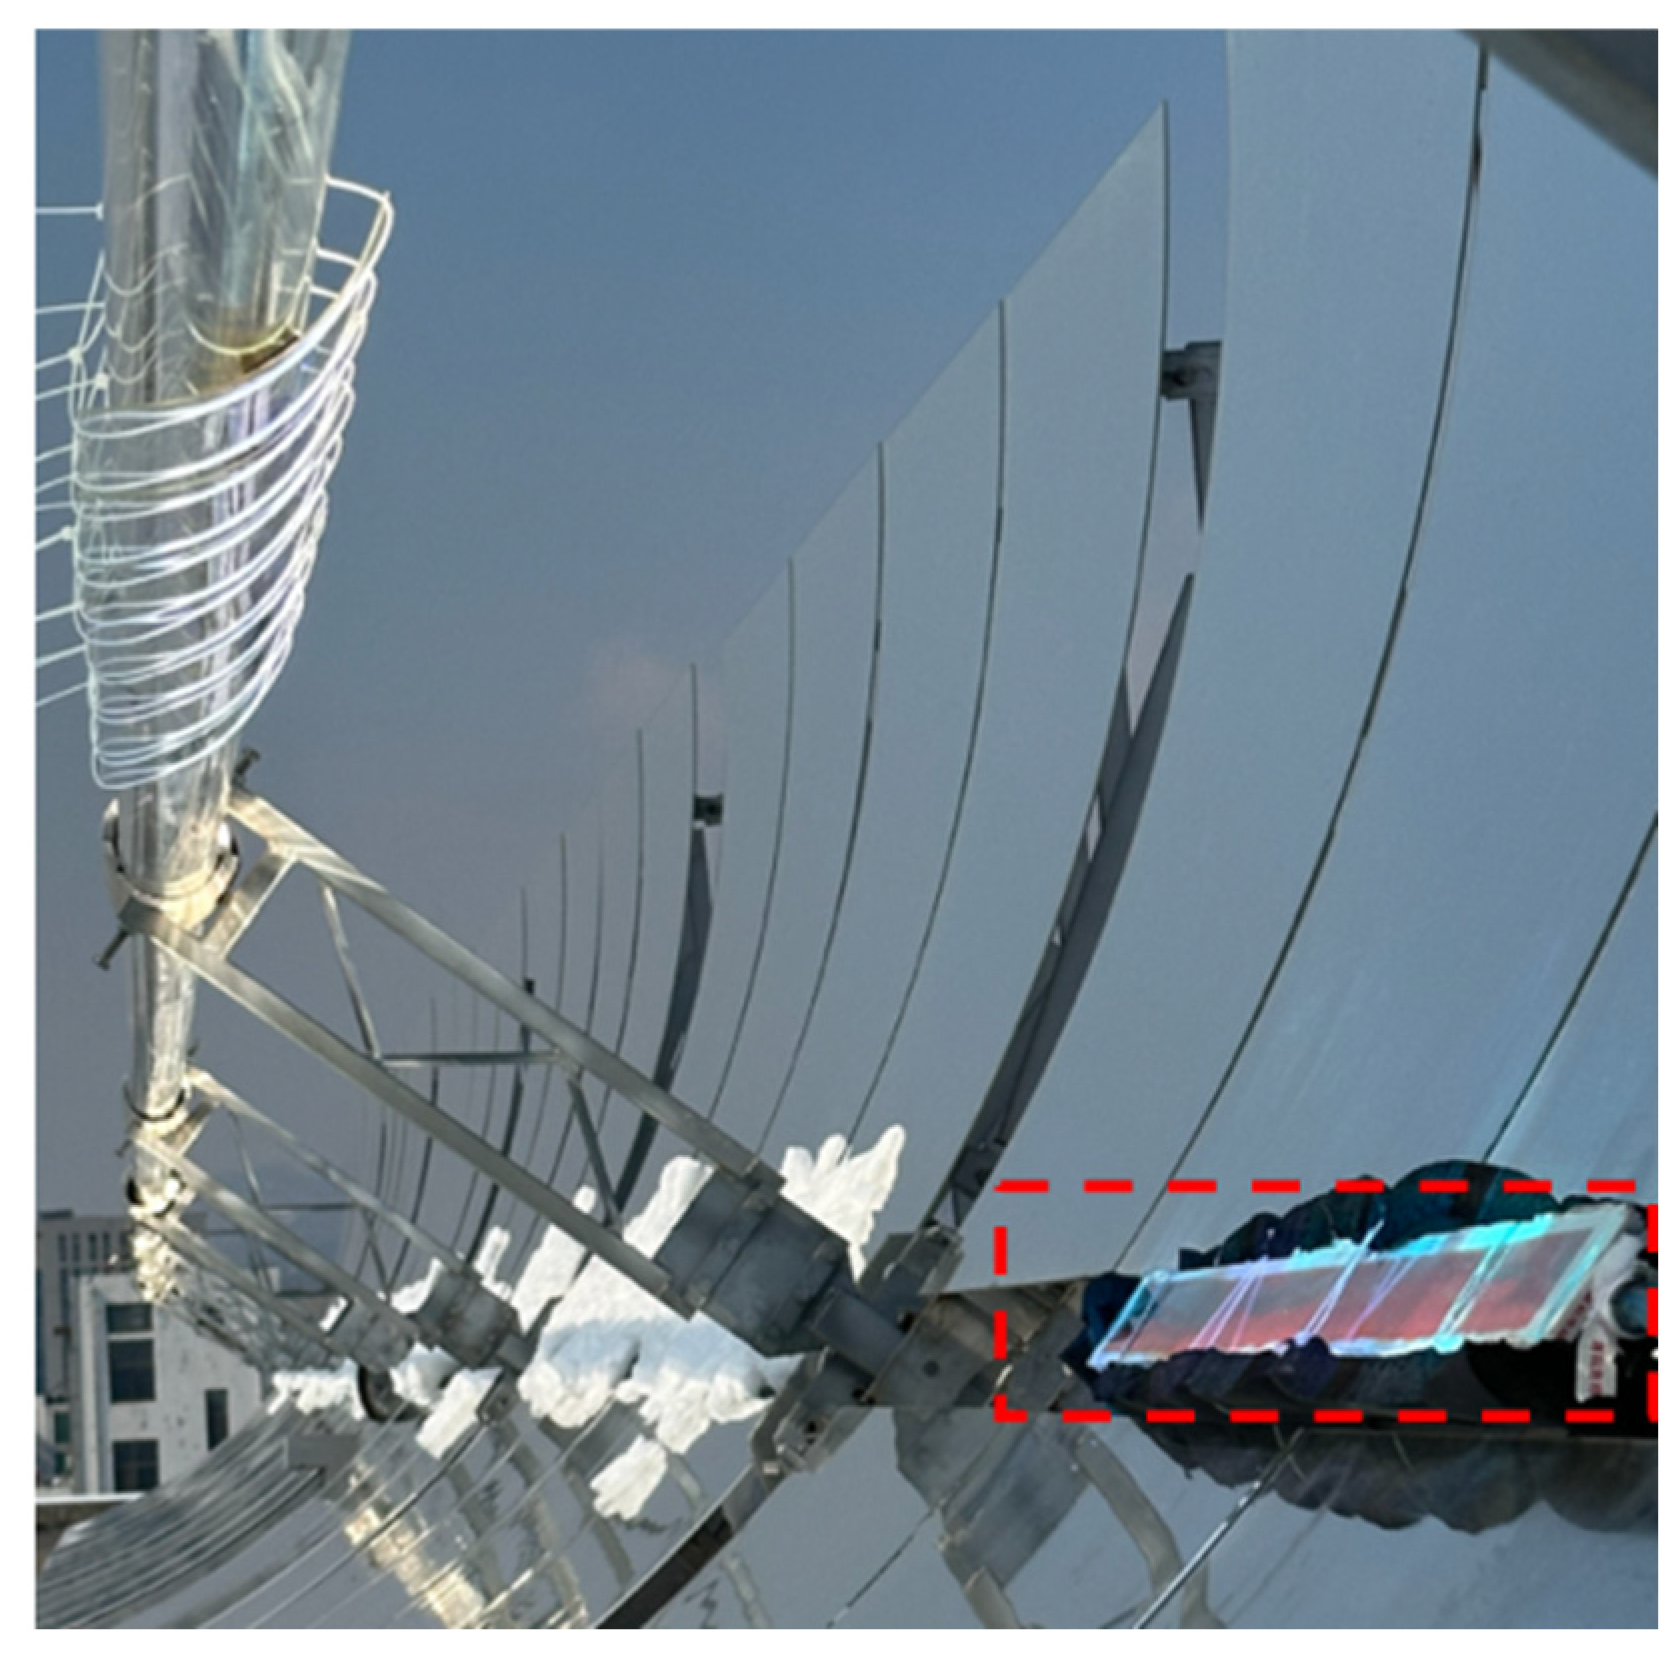
2.4. Laboratory Installation and Operation Monitoring System

The MOST device and its piping system were mounted on the reflector support of the trough solar system, as shown in Figure 7. The secondary reflector was mounted 5 mm directly below the parabolic trough solar collector. The secondary reflector consisted of multiple coated curved lenses. The length of the secondary reflector was 3.2 m. The MOST device was mounted at the bottom of the parabolic trough reflector. Because the experimental season was in winter, thermal insulation cotton was used for the insulation treatment. A polyvinyl chloride (PVC) plastic pipe is used as the heat transfer oil piping. The pipeline was directly exposed to the low temperature environment, using the external environment to simulate the end heat exchange device. The piping system contained circulation pumps (flow rate: 6.5 × 10⁻⁵ m3 · s−1), flow meters, valves, and other components.
In the experiment, the temperatures of the AZO and heat transfer oil in the MOST device were recorded using several K-type thermometers and a temperature recorder. The intensity of natural light irradiation and the intensity of UV irradiation were recorded using a fixed solar irradiator (full-spectrum monitoring) and a handheld UV irradiator (monitoring range 290–490 nm). In Figure 7, Ta, Tb, and Tc were the temperatures of AZO, and Tin and Tout were the import and export temperatures of heat transfer oil, respectively.
The experimental platform was located in a city in a temperate monsoon climate region (longitude and latitude: 117.15° N, 36.20° E), and the experimental average daily temperature ranged from −6 to 3 °C.
Because of the limited thermal storage capacity of the original AZO, the MOST device was monitored in the form of uninterrupted thermal storage and sporadic thermal release. During the experiment, the device was subjected to an exothermic cycle of heat storage every 30 min.

2.5. Thermal Conductivity Model of the MOST Device and Mathematical Model

The MOST device utilized the photoisomerization of AZO to convert solar radiation energy [30]. The stable trans-azobenzene underwent isomerization under UV irradiation to produce metastable cis-azobenzene. In this process, solar energy was absorbed and stored as chemical energy in the molecular bonds of the metastable cis-azobenzene. Metastable cis-azobenzene spontaneously reverted to stable trans-azobenzene when stimulated by visible light, temperature, and other factors. During the recovery process, the stored chemical energy was released as heat.
The molecular energy of AZO was the key to the energy conversion in the MOST device during the heat transfer process. The thermal calculation for the MOST (Molecular Solar Thermal) device requires the following assumptions [31]:
  • The AZO (azobenzene) molecules are assumed to behave independently without intermolecular interactions, and their mutual influences are neglected in the reaction system.
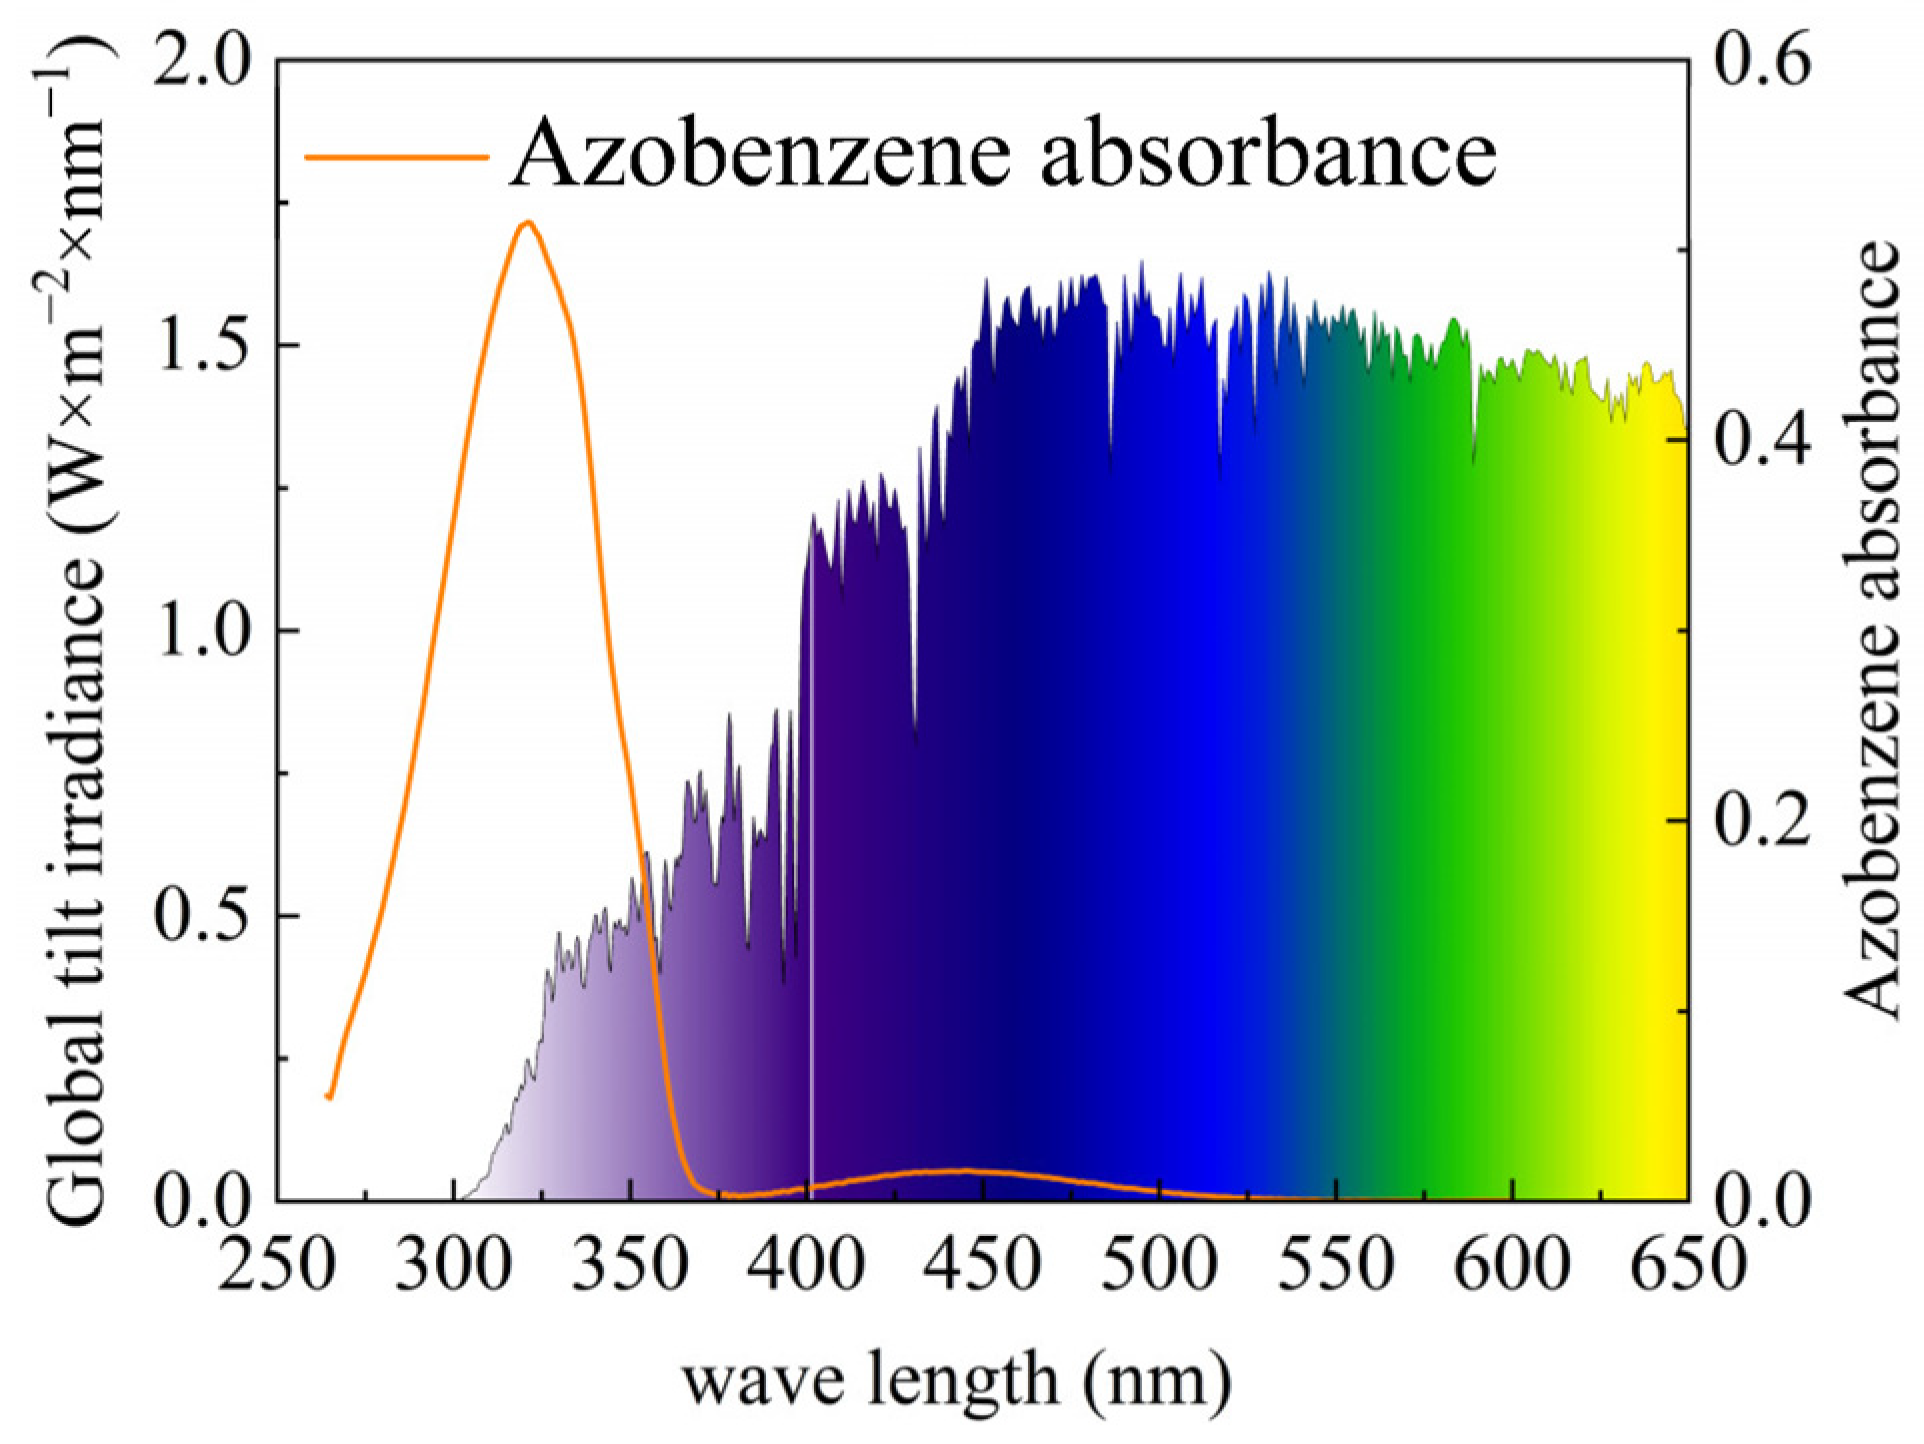
  • AZO molecules exhibit threshold-dependent spectral absorption characteristics: all photons with wavelengths below 490 nm are absorbed, with their energy being converted into stored chemical potential and subsequently released as thermal energy.
  • In the MOST device, all energy losses exclusively manifest as thermal dissipation, with no other forms of energy loss occurring.
The stored energy Estored of the MOST device could be calculated using the following equation [32]:
E s t o r e d = λ o n s e t λ c u t o f f n u m λ · ( E λ E l o s s N A ) · Ψ A Z O d λ
where numλ denotes the number of light quanta at wavelength λcutoff, s−1·m−2·nm−1; Eλ is the energy of the light quantum, J·nm−1; NA is Avogadro’s number, NA = 6.022 × 10²³; λcutoff and λonset are the cutoff and onset wavelengths, respectively, λonset = 290 [27]; and Eloss represents the thermal energy loss during the AZO cis-trans isomerization process, as illustrated in Figure 8.
The thermal efficiency η γ   of the MOST device is calculated as follows [33]:
η γ = E s t o r e d E U V   · 10 · 100 %
where EUV denotes the energy of UV irradiation on the MOST device, mW·cm−2.
The instantaneous heat release of MOST device Qr could be calculated using the following equation:
Q r = η γ c ˙ m H T F d T
where η γ is the integrated efficiency of the MOST device after heat loss and heat transfer efficiency, η γ = 0 . 9 ; c ˙ is the specific heat of the heat transfer oil, take 1.89 kJ·kg−1·K−1; mHTF is the mass flow rate of heat transfer oil, kg·s−1; and T is the temperature difference between the inlet and outlet of the storage heater, ℃. The typical working condition circulating heat transfer oil flow rate is 6.5 × 10⁻⁵ m3·s−1 during the experiment. The density of the thermal oil is 955 kg·m−3 (the temperature of the heat transfer oil was 26 °C).
The cumulative heat release Qa of the MOST device could be calculated from the instantaneous heat release Qr:
Q a = Q r d t
where t is exothermic time.
The exothermic power of the MOST device is one of the evaluation indicators that visually expresses its performance. The exothermic power of the MOST device is affected by the amount of solar radiation, in addition to the weight of AZO and the size of the MOST device.
P M O S T = Q a t · ( m A Z O · L M O S T ) 1
where mAZO, t, and LMOST represent the weight of AZO, the time of the experiment, and the length of the MOST device, respectively. Schematic of thermal conductivity of the MOST device is shown in Figure 9.

3. Experimental Analysis of the MOST Device

To clarify the various working characteristics of the MOST device, we built an experimental platform according to the experimental requirements, and collected and analyzed the experimental data.

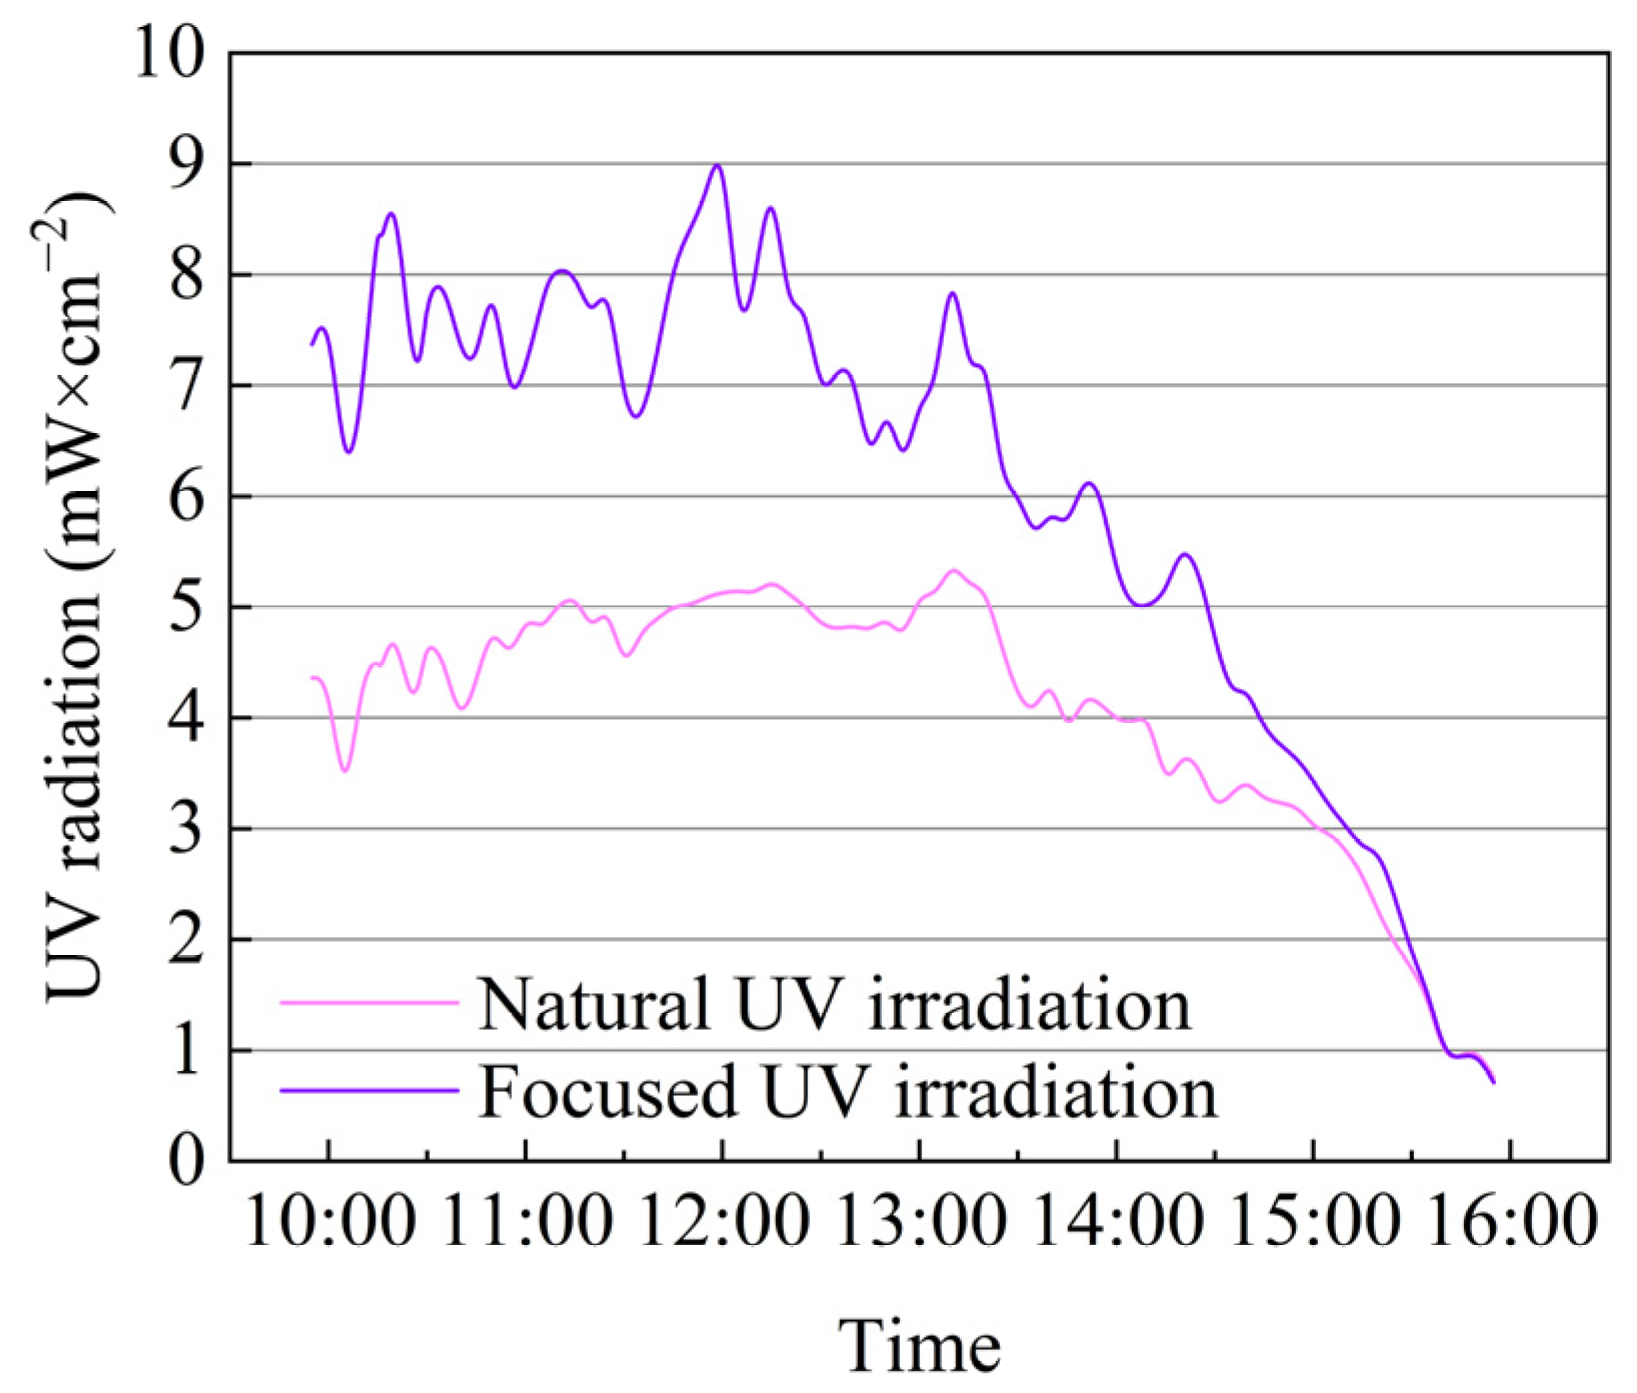
3.1. Convergence Effect of Ultraviolet Light

Solar UV radiation energy was the energy source for the MOST device, and the secondary reflector was crucial for its concentrating effect. The UV irradiation data were recorded at 5-min intervals.
Figure 10 shows the variations of natural UV irradiance values and focused UV irradiance values. Based on the recorded UV irradiation data during the experimental period, the following calculations were performed: the average natural UV irradiation value was 4.06 mW·cm−2, and the average focused UV irradiation value was 6.08 mW·cm−2. The peak of the focused UV irradiation occurred at 12:00, when the natural UV irradiation was 5.13 mW·cm−2 and the focused UV irradiation value was 9.31 mW·cm−2. The focused UV irradiation was significantly higher than the natural UV irradiation, and the trends of the two curves were nearly identical. The average enhancement of focused UV irradiation was 49.5% and the maximum enhancement was 81.5%.
This result demonstrates that the secondary reflector significantly enhances the solar UV radiation energy delivered to the MOST device surface. When the ambient UV irradiance exceeds 4 mW·cm−2, the secondary reflector demonstrates significantly enhanced focusing performance for ultraviolet light. During the period of declining ambient UV irradiance (from 13:00 until the end of the experiment), both the focused UV irradiance and the concentrating performance of the secondary reflector exhibited a corresponding decrease. During the declining phase of ambient UV irradiance (from 13:00 until experiment termination), both the focused UV irradiation and the secondary reflector’s light-concentrating performance exhibited synchronous attenuation. The light-concentrating performance of the secondary reflector demonstrates strong dependence on ambient UV irradiance intensity. When natural UV irradiance falls below 1 mW·cm−2, its focusing enhancement effect asymptotically approaches zero. Diminished ambient UV irradiance reduces the secondary reflector’s light-concentrating efficacy, ultimately causing negative net gain in focused UV flux—an anomalous energy depletion effect.
Figure 11 shows the convergence of light on the MOST device at some points during the experiment. Because the secondary reflector reflected wavelengths in the range of 290 to 475 nm, the surface of the MOST device converged not only UV light but also some of the visible light in the cyan range, as shown in Figure 12. The cyan spot remained stable throughout the experiment, and the secondary reflector and system optical path designs proved to be effective.

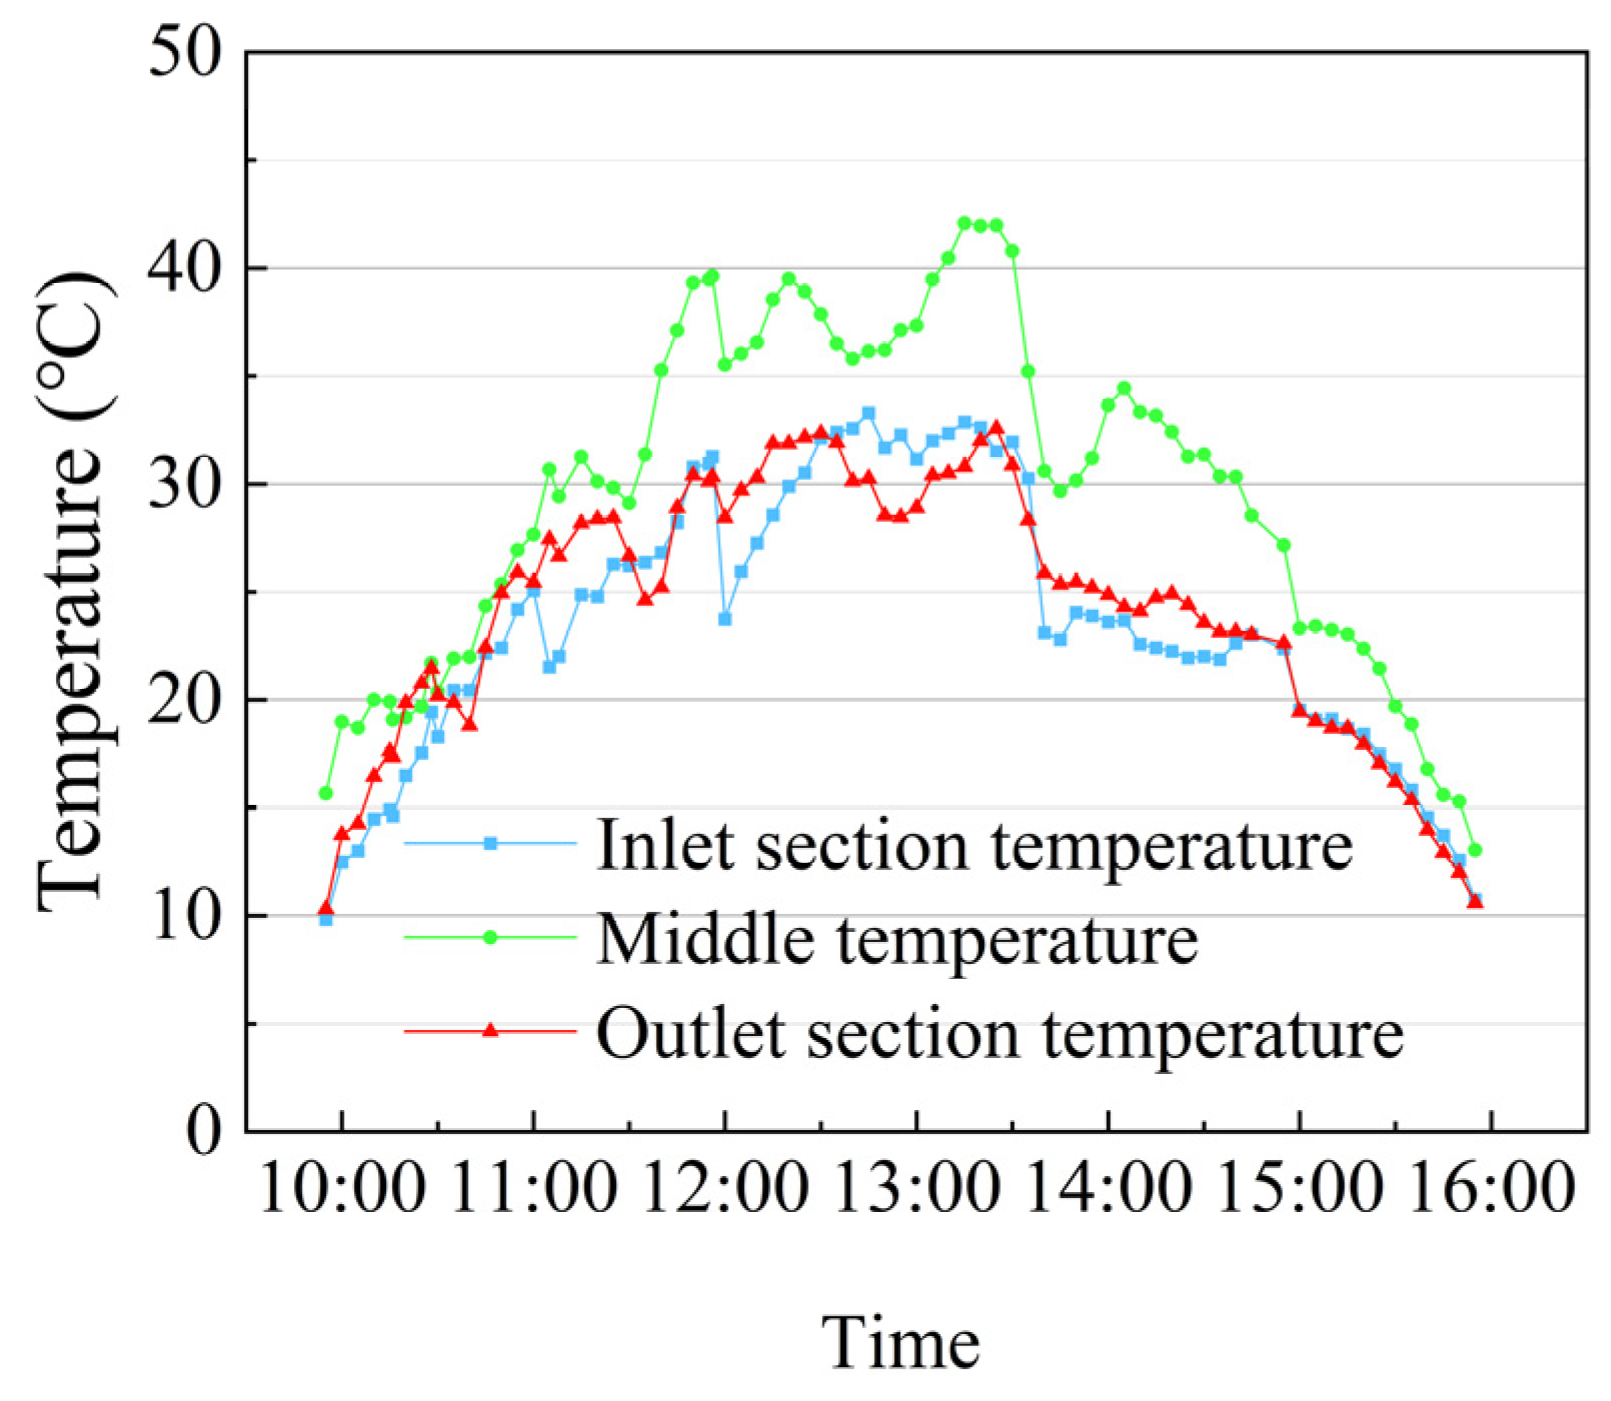
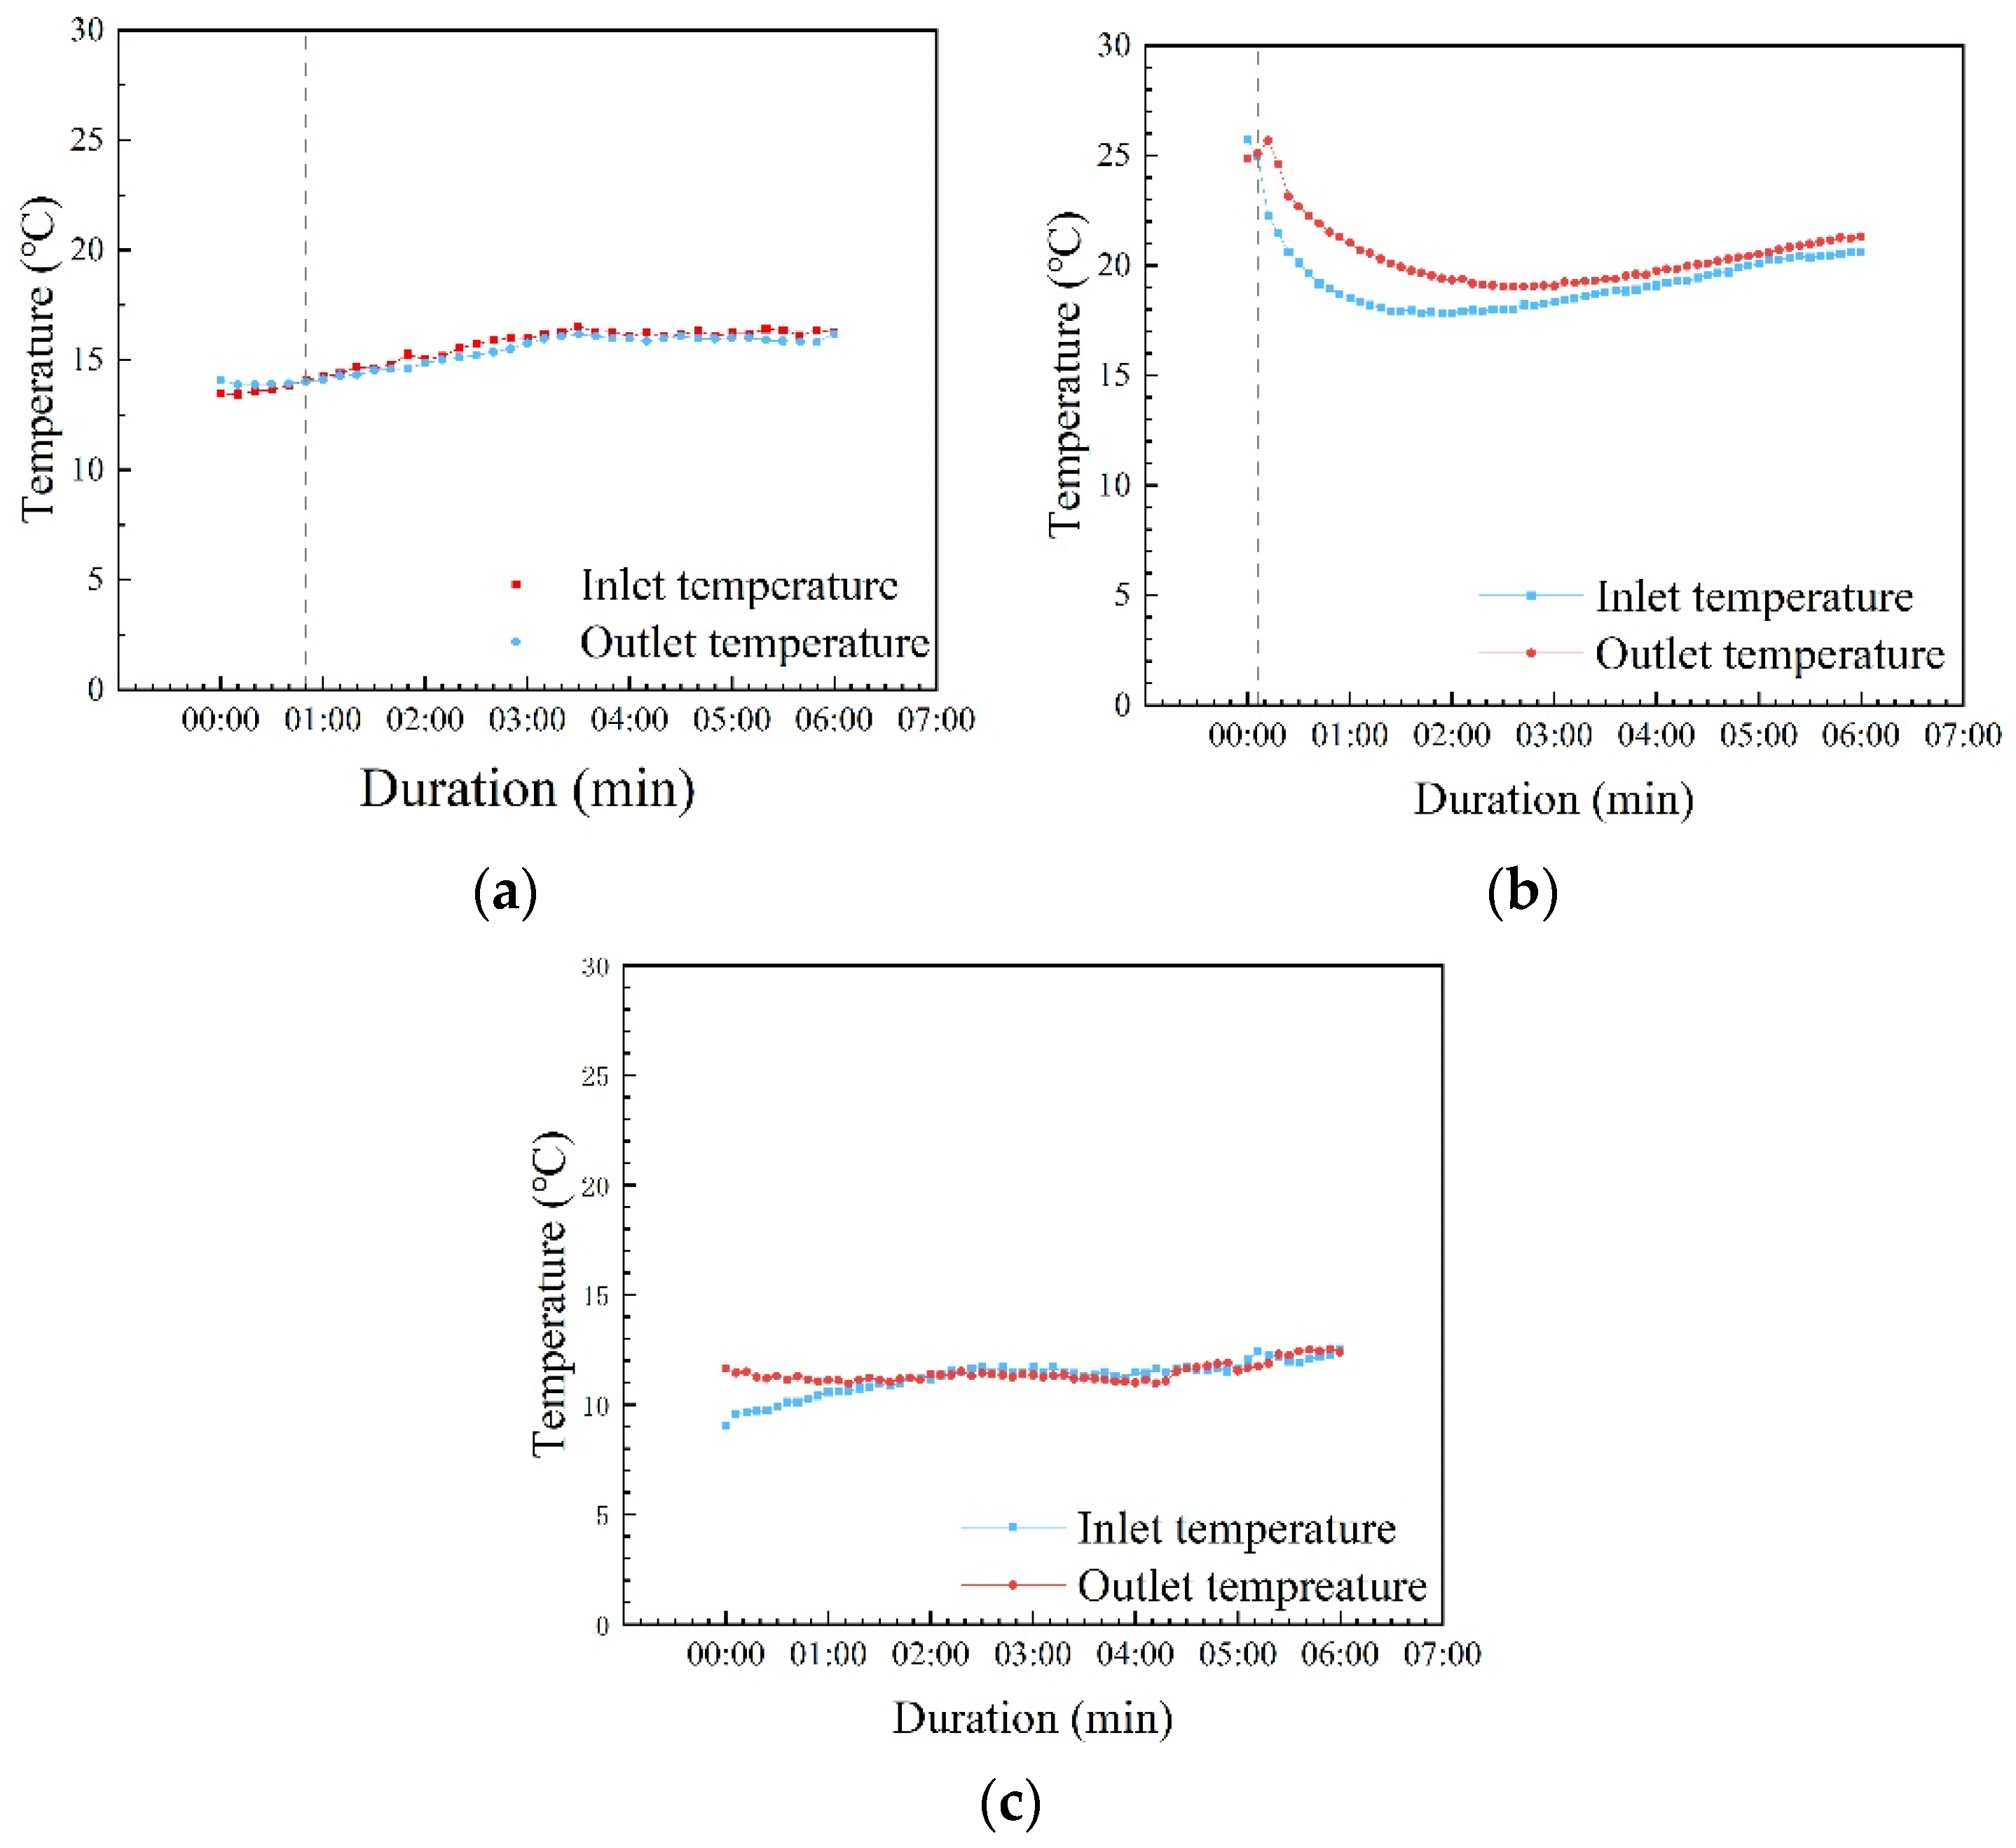
3.2. The Temperature of Heat Transfer Oil and AZO

The temperature of heat transfer oil and AZO were the direct reflection of the operating characteristics of the MOST device.
With five thermometers inside the MOST device, we recorded the temperature changes of the AZO and heat transfer oil. The environmental temperature fluctuated in the range of −6–3 °C.
Based on the recorded data in Figure 13, the temperature change of AZO was categorized into three stages. Before 11:00, the temperature of azobenzene at all three locations was below 25 °C but showed a warming trend, which is called the warming period. From 11:00–15:30, the temperature of azobenzene at all three locations fluctuated repeatedly, but the overall temperature was high, which is called the stabilization period. After 15:30, the temperature of the azobenzene was below 20 °C and showed a cooling trend, which is called the cooling period. The maximum temperature of the AZO material during the experiments was 42.07 °C. As shown in Figure 14, the AZO material exhibited a small temperature drop several times. On the one hand, it was caused by heat loss from the exothermic cycle; on the other hand, it was caused by the change of UV radiation value. In Figure 14, at the same moment, the AZO temperature curve representing the middle region was significantly higher than the AZO temperature curve representing the two end regions, with a maximum temperature difference of more than 10 °C. In addition to the temperature measurement points at both ends being more susceptible to the influence of cooler thermal oil, this phenomenon is also closely related to the smaller cosine loss of solar radiation in the central region. In subsequent experiments, photoisomerization materials could be considered for increased deployment in the central section while reducing material at both ends to mitigate the impact of the cosine effect.
Twelve exothermic cycles were performed on the day of the experiment. Starting at 10:30 am, the exothermic cycles were conducted every half hour. The experimental records of the average temperature of the heat transfer oil in different periods in Figure 14 were representative of the operational characteristics of the MOST device during the three periods. The dotted line in the figure indicated that the outlet temperature of the heat transfer oil was greater than the inlet temperature, and the device was exothermic to the outside.
The MOST device in Figure 14a belongs to the warming period. The interior of the MOST device continued to warm but did not enter a steady state. At the beginning of the exothermic cycle, the temperature of the inlet section was higher than that of the outlet end. At the sunrise orientation, the sun’s rays made a smaller angle with the surface. The sun’s rays were reflected by the groove reflector and secondary reflector, resulting in the end shadow at the exit end of the MOST device [29,34]. The end shadow caused a significant difference in temperature between the two sides of the device.
The MOST device in Figure 14b belongs to the warming period. During the exothermic cycle, the temperature of the heat transfer oil tended to cool down first and warm up later. The cooling phenomenon in the first half of the experiment was caused by the exothermic release of heat from the device. The warming in the second half of the experiment was caused by the continuous conversion of solar UV energy into heat by the MOST device. In the beginning and end phases of the experiment, the temperature of the heat transfer oil at the inlet and outlet were close to each other.
The MOST device shown in Figure 14c belongs to the cooling period, where the initial average temperature is below 15 °C. After releasing a small amount of heat, the temperatures of the heat transfer oil in the inlet and outlet converge and the MOST device was no longer significantly exothermic.

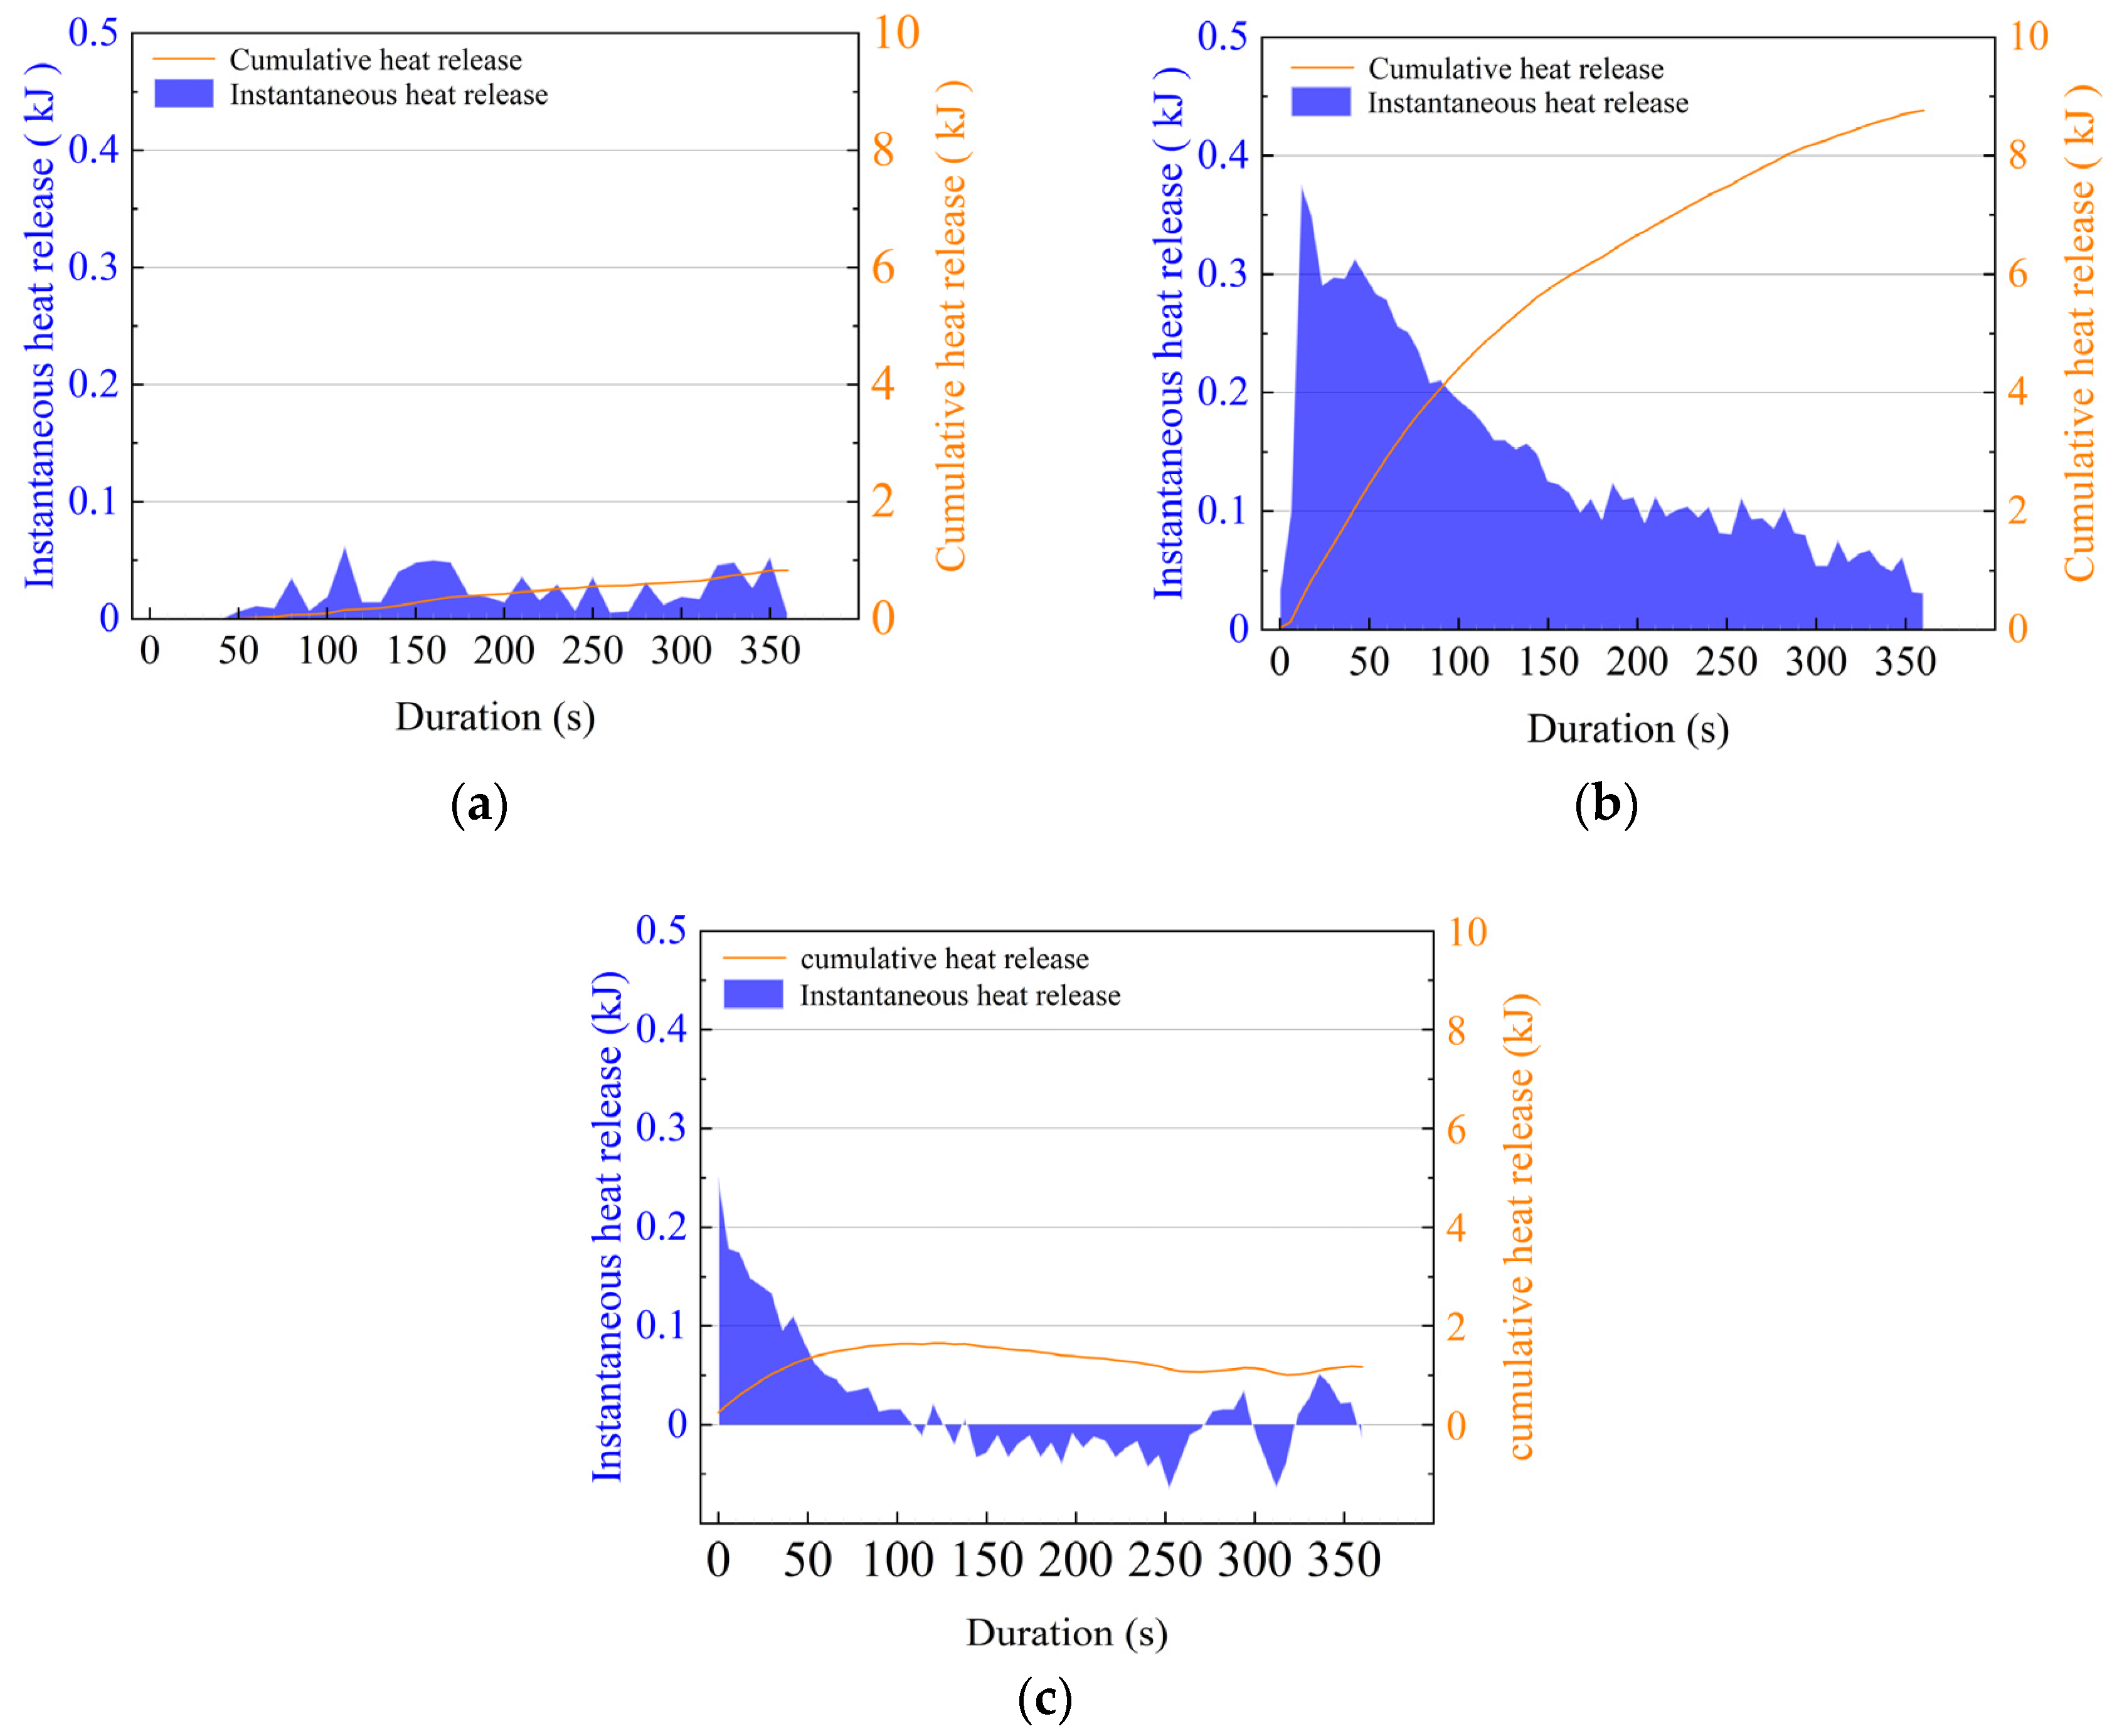
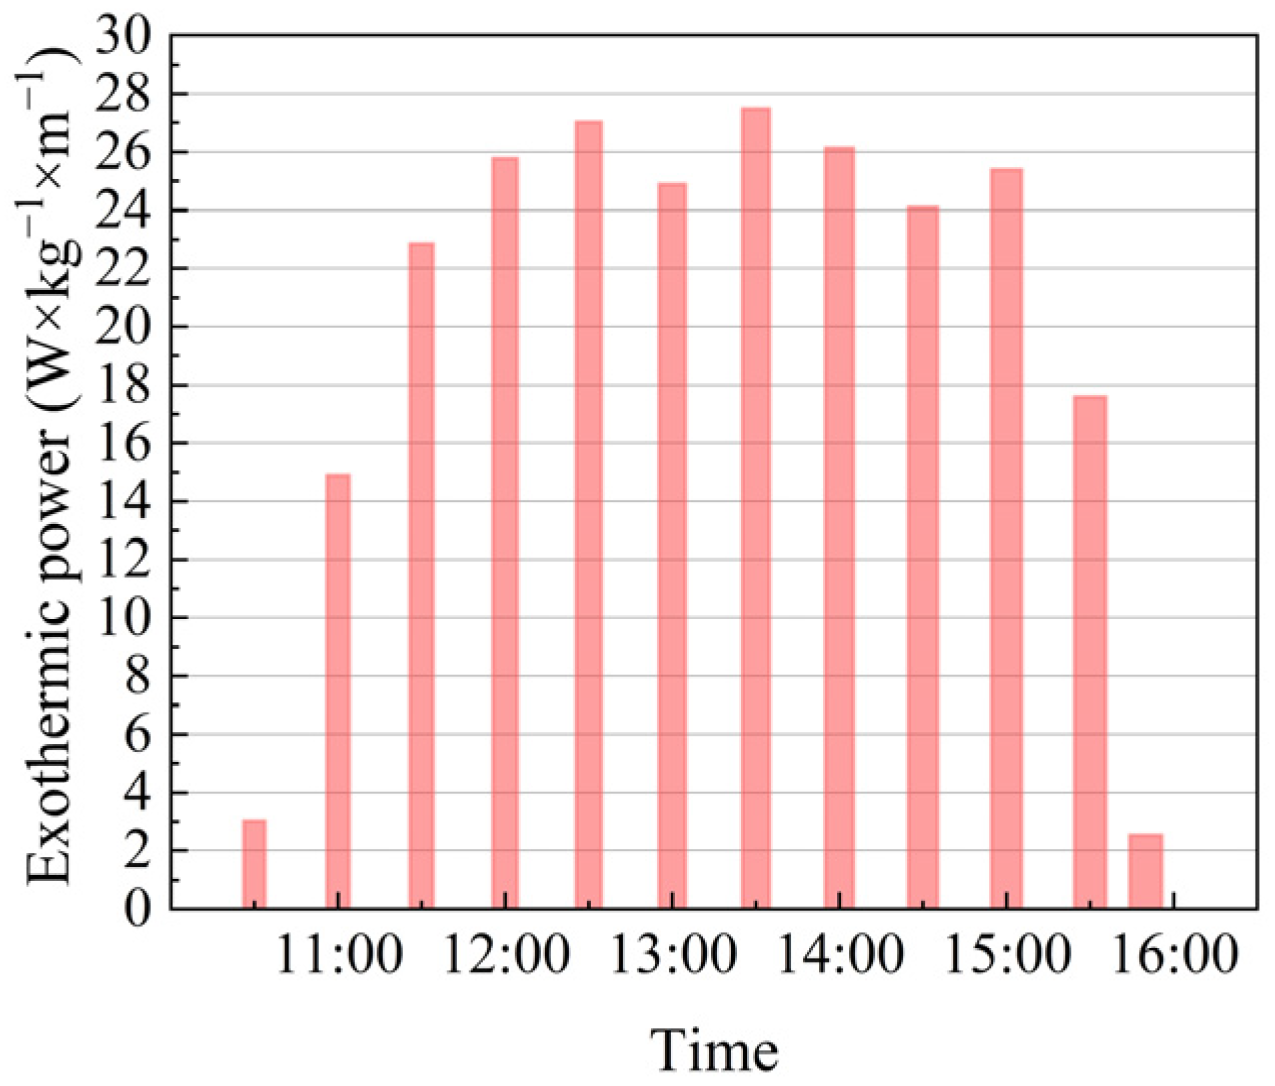
3.3. Exothermic Quantity and Exothermic Power

Exothermic quantity and exothermic power are data that characterize the thermal performance of the MOST device. The instantaneous heat release, cumulative heat release, and exothermic power in the exothermic cycle were calculated using Equations (5)–(7).
There was a clear correlation between changes in heat release from the MOST device and changes in AZO temperature within the device. The three time periods based on the AZO temperature also apply to the operating periods of the MOST device. The 1st, 10th, and 12th exothermic experiments were used as examples to show the difference in the exothermic quantities of the three periods. Figure 15a–c represented the instantaneous heat release and cumulative heat release of the MOST device, respectively.
In Figure 15a, the values of instantaneous and cumulative exotherms for the first experiment were low. The first exothermic experiment was in the warming period. The reason was analyzed: the internal temperature of the MOST device is low, and the heat storage capacity of the device is low. During the warming period, the exothermic MOST device was not only extremely inefficient but also affected the heat storage of the MOST device.
In Figure 15b, the instantaneous and cumulative exotherms of the MOST device during the stabilization period was significantly higher than that of the first exothermic experiment. During the stabilization period, the temperature of AZO in the MOST device tended to stabilize, and the heat release of the MOST device was stable. The cumulative heat released during the two exothermic cycles differed by a factor of nearly ten. During the stabilization period, the MOST device could normally release heat.
As shown in Figure 15c, the exothermic quantity of the MOST device during the cooling period was unstable. During the first 100 s of the exothermic cycle, the MOST device exotherms normally, but the instantaneous exothermic quantity showed a decreasing trend. The subsequent exothermic process fluctuated significantly and even appeared to show negative values. The reason was analyzed: the UV irradiation intensity in the environment was insufficient, the AZO photoisomerization yield was reduced, and the exothermic quantity was insufficient. At this point, the MOST device was no longer exothermic.
In Figure 15, the up and down trajectories of the instantaneous exothermic curves showed the self-recovery properties of AZO.
The variation in exothermic power of the MOST device was shown in Figure 16. The exothermic power in the stabilization period did not vary much and the exotherm was stable. The exothermic power fluctuated significantly between the warming and cooling periods. The first and the last exothermic cycles were more different than the other exothermic cycles. The reason was analyzed: the heat storage capacity of the original azobenzene molecule is weak, and it fails to meet the requirements of heat storage of the ideal photo-isomerized material.
The following table shows the exothermic statistics for the 12 experiments conducted on the experimental day.
In Table 5, the MOST device possesses a high exothermic power when the AZO temperature is in the stabilization period (experimental order 3–10). The 8 exothermic cycles in the stabilization period had significant exothermic phenomena, with an average exothermic power of 27.15 W·kg−1·m−2. During the experimental cycle, 12 exothermic cycles were performed with a total cumulative heat release of 78.35 kJ and an average exothermic power of 21.48 W·kg−1·m−1. Under winter operating conditions, the maximum thermal energy storage capacity of molecular solar thermal (MOST) devices utilizing solid-state azobenzene reaches 23.83% of that achieved by laboratory-scale hybrid MOST systems employing liquid-phase energy storage materials [35]. Through design optimization and operational management improvements, this solid-state energy storage system still demonstrates significant potential for enhancing its energy storage density.

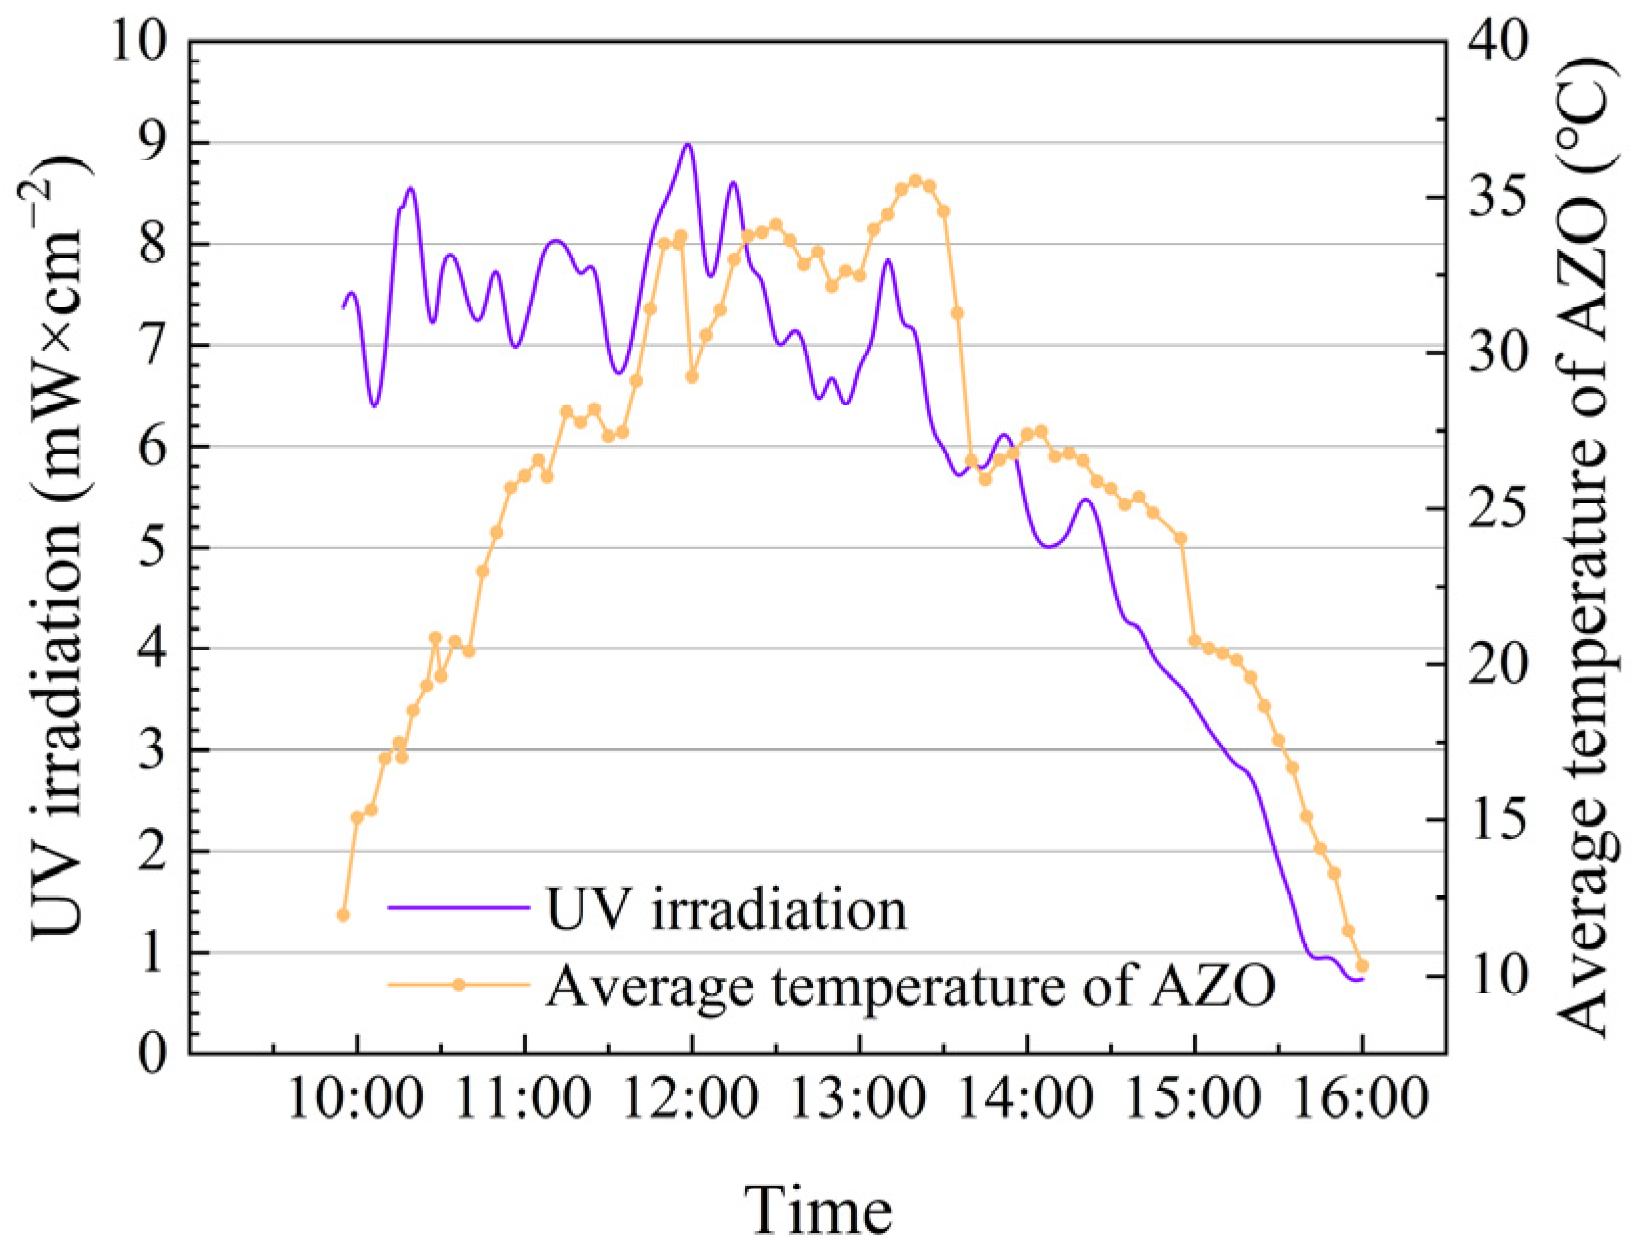
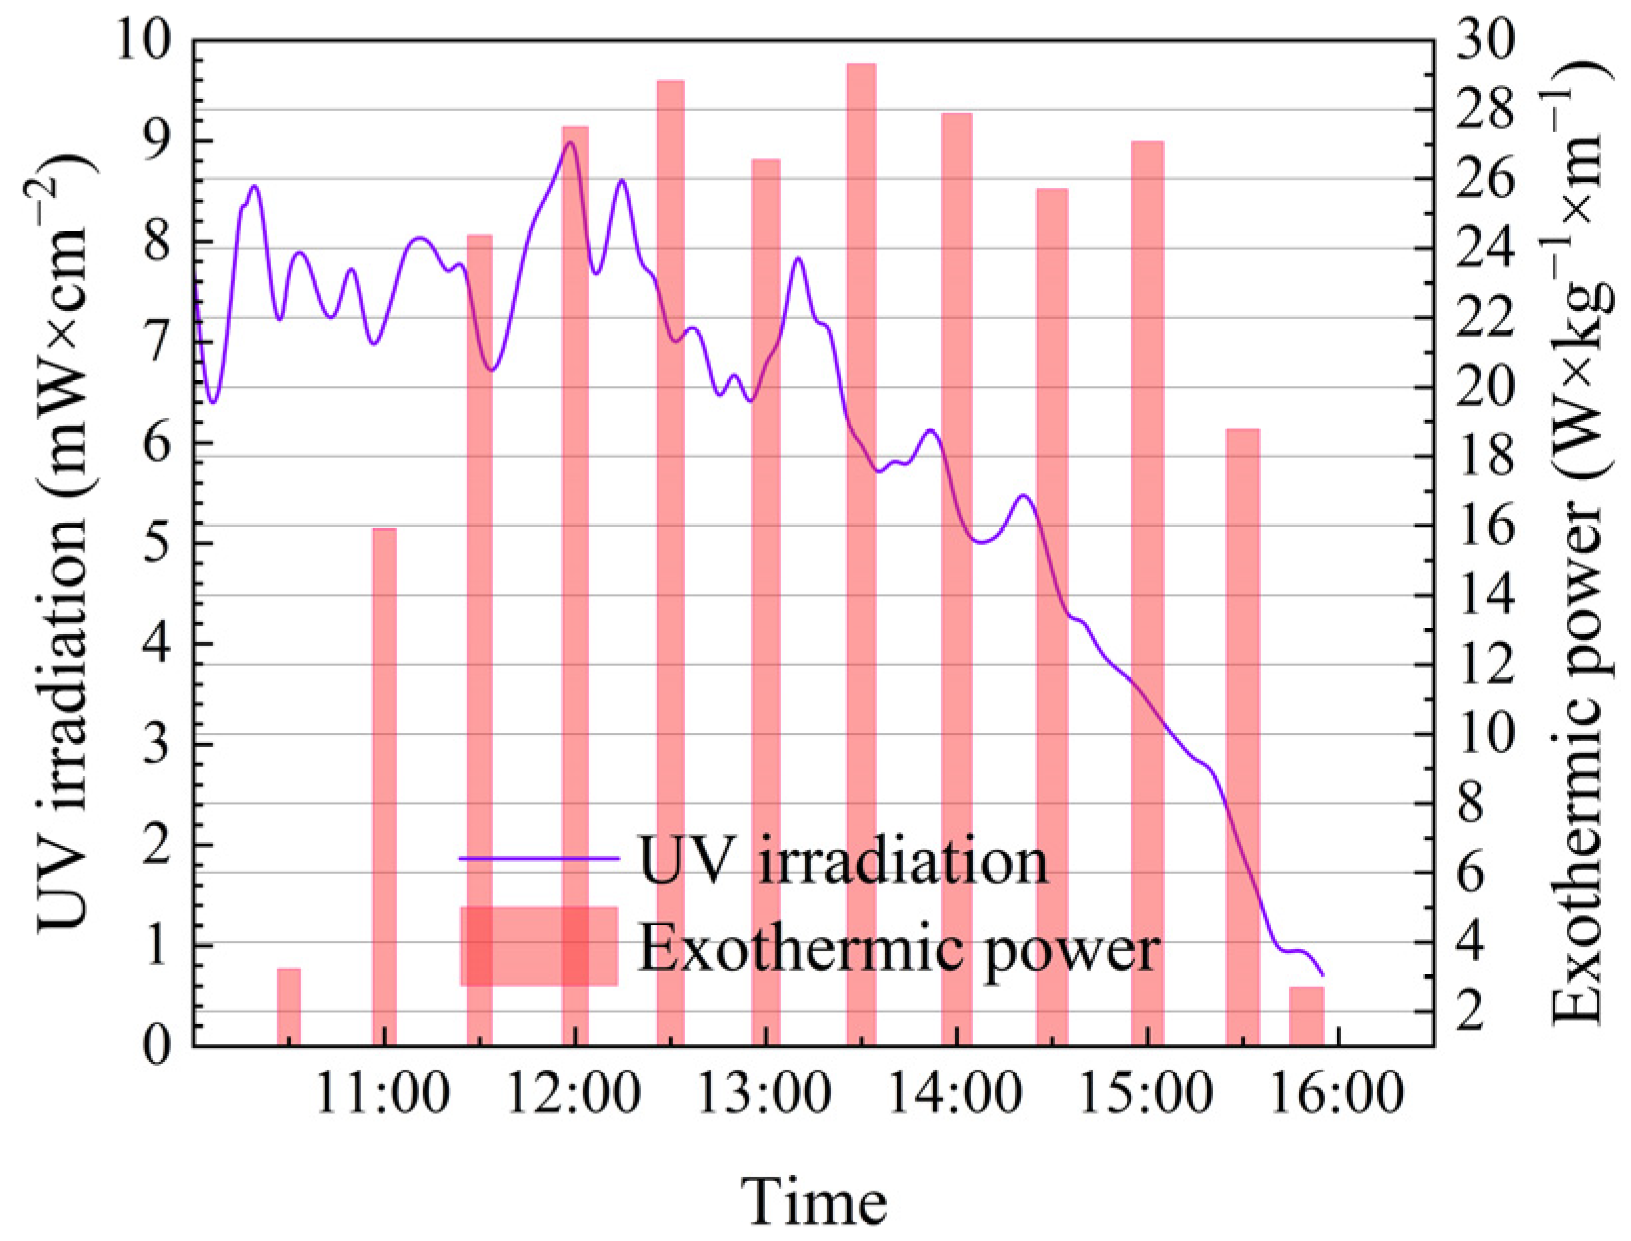
3.4. UV Irradiation and MOST Device

As a source of energy for the MOST device, UV irradiation inevitably affects the MOST device. Analyzing the effect of UV irradiation on the MOST device is important for understanding the operation of the device.
In Figure 17, the trend of the AZO temperature is basically the same as that of the focused UV radiation after approximately 2 h of heating. The AZO temperature was significantly affected by the focused UV irradiation, and the two maintained the same trend. During the warming period, the focused UV irradiation exhibits relatively minor fluctuations, while the temperature of azobenzene rises rapidly. This corresponds to the stage where azobenzene demonstrates highly efficient UV absorption and energy storage. A marked inflection point occurs at 11:30, after which the temperature profile of azobenzene demonstrates strong correlation with the focused UV irradiation curve. After this point, azobenzene reaches peak absorption of ultraviolet light, while the efficiency of converting photon energy into chemical energy remains low. During the stabilization phase, the temperature increase of azobenzene results from both the triggered release of its stored energy and the combined effects of intensified solar radiation and rising ambient temperatures in the environment. Under winter field-testing conditions, the maximum temperature attained by azobenzene reached 42.07 °C. This temperature represents 50.6% of the maximum recorded temperature achieved by norbornadiene-derived MOST devices under laboratory conditions [8].
Figure 18 shows the exothermic power and focused UV irradiation of the MOST device for exothermic experiments performed at different times.
In the first three experiments, the exothermic power increased successively, proving that the MOST device was in the heat storage phase. The fluctuation of the UV irradiation did not significantly affect the MOST device.
Subsequently, the MOST device entered the stabilization period. For the seven exotherms from 12:00 to 15:00, the variation in exothermic power of the MOST device fluctuated low, with an average power of 27.15 W·kg−1·m−1. The thermal power output of the MOST device demonstrates a substantial enhancement compared to its electrical power generation capacity, with significantly higher energy delivery performance [36].
When the value of the focused UV irradiation started to decrease from 5 mW·cm−2, the exothermic power of the MOST device did not show a decreasing trend, but the temperature of AZO showed a significant decreasing trend. When the UV irradiation value decreased to close to 2 mW·cm−2, the exothermic power of the MOST device decreased rapidly.
The working performance of the MOST device was affected by the UV irradiation, but the trend of the exothermic power of the MOST device did not completely coincide with the trend of the UV irradiation due to the effect of the energy storage property of the AZO molecule, and there was an obvious hysteresis. The above characteristics prove that the MOST device loaded with AZO had energy storage capacity.

4. Conclusions

The solid-state azobenzene-based Molecular Solar Thermal (MOST) device demonstrates exceptional performance in UV energy absorption, storage, and release processes. This technology’s integration with parabolic trough solar collectors exhibits significant scientific research value. The present study provides crucial reference data for both fundamental experimental investigations and engineering applications of MOST devices. Summary of research findings:
The secondary reflector demonstrates an average UV light concentration enhancement of 49.5%, significantly improving the MOST device’s solar UV energy absorption, storage, and release efficiency.
Based on the device’s temperature and power characteristics, the operational features of the MOST device are summarized as follows: During the heating and cooling phases, the MOST device is unsuitable for heat-release cycles. When the MOST device enters the stable phase, it becomes appropriate for heat-release cycles. During the experimental period, 12 heat-release cycles were conducted, cumulatively releasing 78.35 kJ of heat, with an average heat-release power of 21.48 W·kg−1·m−1.
The new MOST device designed in this study demonstrates high compatibility with parabolic trough solar systems, featuring low retrofit costs and rapid deployment potential for existing operational solar thermal plants. The thermal energy generated by the MOST device demonstrates excellent compatibility with domestic hot water supply applications.
The incorporation of pristine azobenzene represents the foundational step in exploring this class of MOST devices. In subsequent research phases, we will systematically replace it with various solid-state azobenzene derivatives to investigate device performance characteristics and develop solutions for mitigating solar energy intermittency through MOST technology.

Author Contributions

Methodology, L.Z.; Formal analysis, C.G.; Resources, S.G.; Writing—original draft, C.G.; Writing—review & editing, L.Z., Y.Z., H.W., W.L., J.J., S.G. and E.C. All authors have read and agreed to the published version of the manuscript.

Funding

The authors are grateful to the financial support from National Natural Science Foundation of China (NSFC) (No. 51966015).

Data Availability Statement

Data supporting the results of this study are available from the corresponding author upon request.

Conflicts of Interest

The authors declare that they have no conflicts of interest.

References

  1. Li, M.; Taylor, R.; Hao, Y.; Besagni, G.; Markides, C.N.; Li, G. Solar energy utilisation: Current status and roll-out potential. Appl. Therm. Eng. 2022, 209, 118285. [Google Scholar] [CrossRef]
  2. Wu, H.; Xie, G.; Jie, Z.; Hui, X.; Yang, D.; Du, C. Research progress about chemical energy storage of solar energy. IOP Conf. Ser. Earth Environ. Sci. 2018, 108, 052070. [Google Scholar] [CrossRef]
  3. Hinojosa, J.F.; Moreno, S.F.; Maytorena, V.M. Low-temperature applications of phase change materials for energy storage: A descriptive review. Energies 2023, 16, 3078. [Google Scholar] [CrossRef]
  4. Pachori, H.; Choudhary, T.; Sheorey, T. Significance of thermal energy storage material in solar air heaters. Mater. Today Proc. 2022, 56, 126–134. [Google Scholar] [CrossRef]
  5. Naveenkumar, R.; Ravichandran, M.; Mohanavel, V.; Karthick, A.; Aswin, L.S.R.L.; Priyanka, S.S.H.; Kumar, S.K.; Kumar, S.P. Review on phase change materials for solar energy storage applications. Environ. Sci. Pollut. Res. 2021, 29, 9491–9532. [Google Scholar] [CrossRef]
  6. Moth-Poulsen, K.; Ćoso, D.; Börjesson, K.; Vinokurov, N.; Meier, S.K.; Majumdar, A.; Vollhardtc, K.P.C.; Segalman, R.A. Molecular solar thermal (MOST) energy storage and release system. Energy Environ. Sci. 2012, 5, 8534. [Google Scholar] [CrossRef]
  7. Quant, M.; Lennartson, A.; Dreos, A.; Kuisma, M.; Erhart, P.; Börjesson, K.; Moth-Poulsen, K. Low Molecular Weight Norborna-diene Derivatives for Molecular Solar-Thermal Energy Storage. Chem. Eur. J. 2016, 22, 13265–13274. [Google Scholar] [CrossRef]
  8. Dreos, A.; Börjesson, K.; Wang, Z.; Roffey, A.; Norwood, Z.; Kushnir, D.; Moth-Poulsen, K. Exploring the potential of a hybrid device combining solar water heating and molecular solar thermal energy storage. Energy Environ. Sci. 2017, 10, 728–734. [Google Scholar] [CrossRef]
  9. Wang, Z.; Hölzel, H.; Fernandez, L.; Aslam, A.S.; Baronas, P.; Orrego-Hernández, J.; Ghasemi, S.; Campoy-Quiles, M.; Moth-Poulsen, K. Hybrid solar energy device for simultaneous electric power generation and molecular solar thermal energy storage. Joule 2024, 8, 2607–2622. [Google Scholar] [CrossRef]
  10. Wang, Z.; Wu, Z.; Hu, Z.; Orrego-Hernández, J.; Mu, E.; Zhang, Z.Y.; Jevric, M.; Liu, Y.; Fu, X.; Wang, F.; et al. Chip-scale solar thermal electrical power generation. Cell Rep. Phys. Sci. 2022, 3, 100789. [Google Scholar] [CrossRef]
  11. Bauer, U.; Fromm, L.; Weiß, C.; Bachmann, P.; Späth, F.; Düll, F.; Steinhauer, J.; Hieringer, W.; Görling, A.; Hirsch, A.; et al. Controlled Catalytic Energy Release of the Norbornadiene/Quadricyclane Molecular Solar Thermal Energy Storage System on Ni(111). J. Phys. Chem. C 2018, 123, 7654–7664. [Google Scholar] [CrossRef]
  12. Uda, M.; Momotake, A.; Arai, T. Synthesis and isomerization of azobenzene dendrimers. Photochem. Photobiol. Sci. 2003, 2, 845–847. [Google Scholar] [CrossRef] [PubMed]
  13. Xu, X.; Feng, J.; Li, W.Y.; Wang, G.; Feng, W.; Yu, H. Azobenzene-containing polymer for solar thermal energy storage and release: Advances, challenges, and opportunities. Prog. Polym. Sci. 2024, 149, 101782. [Google Scholar] [CrossRef]
  14. Dong, L.; Feng, Y.; Wang, L.; Feng, W. Azobenzene-based solar thermal fuels: Design, properties, and applications. Chem. Soc. Rev. 2018, 47, 7339–7368. [Google Scholar] [CrossRef]
  15. Adamson, A.W.; Vogler, A.; Kunkely, H.; Wachter, R. Photocalorimetry. Enthalpies of photolysis of trans-azobenzene, ferriox-alate and cobaltioxalate ions, chromium hexacarbonyl, and dirhenium decarbonyl. J. Am. Chem. Soc. 1978, 100, 1298–1300. [Google Scholar] [CrossRef]
  16. Giménez-Gómez, A.; Magson, L.; Merino-Robledillo, C.; Hernáez-Troya, S.; Sanosa, N.; Sampedro, D.; Funes-Ardoiz, I. State-of-the-art and challenges towards a Molecular Solar Thermal (MOST) energy storage device. React. Chem. Eng. 2024, 9, 1629–1640. [Google Scholar] [CrossRef]
  17. Wang, Z.; Losantos, R.; Sampedro, D.; Morikawa, M.A.; Börjesson, K.; Kimizuka, N.; Moth-Poulsen, K. Demonstration of an azobenzene derivative based solar thermal energy storage system. J. Mater. Chem. A 2019, 7, 15042–15047. [Google Scholar] [CrossRef]
  18. Wang, Z.; Moïse, H.; Cacciarini, M.; Nielsen, M.B.; Morikawa, M.A.; Kimizuka, N.; Moth-Poulsen, K. Liquid-based multijunction molecular solar thermal energy collection device. Adv. Sci. 2021, 8, 2103060. [Google Scholar] [CrossRef]
  19. Sun, W.; Shangguan, Z.; Zhang, X.; Dang, T.; Zhang, Z.Y.; Li, T. Solar Efficiency of Azo-Photoswitches for Energy Conversion: A Comprehensive Assessment. ChemSusChem 2023, 16, e202300582. [Google Scholar] [CrossRef]
  20. Öztürk, M.; Bezir, N.Ç.; Özek, N. Optical, Energetic and Exergetic Analyses of Parabolic Trough Collectors. Chin. Phys. Lett. 2007, 24, 1787. [Google Scholar] [CrossRef]
  21. Zhu, T.; Li, Q. A novel spectrum allocation method in the photovoltaic-thermochemical hybrid solar system. J. Power Sources 2021, 513, 230541. [Google Scholar] [CrossRef]
  22. Chen, F.; Chen, J. A novel solution method for reflector shape of solar Compound Parabolic Concentrator and verification. Renew. Energy 2022, 192, 385–395. [Google Scholar] [CrossRef]
  23. Canavarro, D.; Chaves, J.; Collares-pereira, M. A novel Compound Elliptical-type Concentrator for parabolic primaries with tubular receiver. Sol. Energy 2016, 134, 383–391. [Google Scholar] [CrossRef]
  24. Zhang, Y.; Xiao, G.; Luo, Z.; Ni, M.; Yang, T.; Xu, W. Comparison of different types of secondary mirrors for solar application. Optik 2014, 125, 1106–1112. [Google Scholar] [CrossRef]
  25. Lee, C.C. Optical interference coatings for optics and photonics. Appl. Opt. 2012, 52, 73–81. [Google Scholar] [CrossRef]
  26. Lednev, I.K.; Ye, T.Q.; Matousek, P.; Towrie, M.; Foggi, P.; Neuwahl, F.V.R.; Umapathy, S.; Hester, R.E.; Moore, J.N. Femtosecond time-resolved UV-visible absorption spectroscopy of trans-azobenzene: Dependence on excitation wavelength. Chem. Phys. Lett. 1998, 290, 68–74. [Google Scholar] [CrossRef]
  27. Paulescu, E.; Paulescu, M. A new clear sky solar irradiance model. Renew. Energy 2021, 179, 2094–2103. [Google Scholar] [CrossRef]
  28. Ramasamy, A.K.; Ganesh, M.; Rajamani, K.; Loganathan, A.K.; Rangaswamy, R. Investigation of concentrated solar collector with discretized flat mirrors in parabolic arrangement. Energy Sustain. Dev. 2021, 64, 25–34. [Google Scholar] [CrossRef]
  29. Bellos, E.; Tzivanidis, C.; Moghimi, M.A. Reducing the optical end losses of a linear Fresnel reflector using novel techniques. Sol. Energy 2019, 186, 247–256. [Google Scholar] [CrossRef]
  30. Leroux, Y.R.; Hapiot, P. Photo-modulation of the permeation in azobenzene derivatives monolayer films electrografted on carbon substrates. Electrochem. Commun. 2013, 33, 107–110. [Google Scholar] [CrossRef]
  31. Henzl, J.; Mehlhorn, M.; Gawronski, H.; Rieder, K.H.; Morgenstern, K. Reversible cis–trans Isomerization of a Single Azobenzene Molecule. Angew. Chem. Int. Ed. 2006, 45, 603–606. [Google Scholar] [CrossRef] [PubMed]
  32. Wang, J.; Han, Z.; Liu, Y.; Zhang, X.; Cui, Z. Thermodynamic analysis of a combined cooling, heating, and power system integrated with full-spectrum hybrid solar energy device. Energy Convers. Manag. 2021, 228, 113596. [Google Scholar] [CrossRef]
  33. Fang, J.; Liu, Q.; Guo, S.; Lei, J.; Jin, H. Spanning solar spectrum: A combined photochemical and thermochemical process for solar energy storage. Appl. Energy 2019, 247, 116–126. [Google Scholar] [CrossRef]
  34. Börjesson, K.; Lennartson, A.; Moth-Poulsen, K. Efficiency Limit of Molecular Solar Thermal Energy Collecting Devices. ACS Sustain. Chem. Eng. 2013, 1, 585–590. [Google Scholar] [CrossRef]
  35. Xu, L.; Sun, F.; Ma, L.; Li, X.; Lei, D.; Yuan, G.; Zhu, H.; Zhang, Q.; Xu, E.; Wang, Z. Analysis of optical and thermal factors’ effects on the transient performance of parabolic trough solar collectors. Sol. Energy 2019, 179, 195–209. [Google Scholar] [CrossRef]
  36. Wang, Z.; Roffey, A.; Losantos, R.; Lennartson, A.; Jevric, M.; Petersen, A.U.; Quant, M.; Dreos, A.; Wen, X.; Sampedro, D.; et al. Macroscopic heat release in a molecular solar thermal energy storage system. Energy Environ. Sci. 2019, 12, 187–193. [Google Scholar] [CrossRef]
Figure 1. Sketch of molecular solar energy storage and release system.
Energies 18 02298 g001
Figure 2. The optical path of molecular solar thermal energy storage and release system.
Energies 18 02298 g002
Figure 3. Simulation of optical path of curved reflector.
Energies 18 02298 g003
Figure 4. (a) Single-layer interference film, (b) Multiple-layer interference film.
Energies 18 02298 g004
Figure 5. Azobenzene absorbance graph.
Energies 18 02298 g005
Figure 6. Lens transmittance graph.
Energies 18 02298 g006
Figure 7. Schematic diagram of the experimental platform and detection device.
Energies 18 02298 g007
Figure 8. Principle of conversion of AZO molecular energy.
Energies 18 02298 g008
Figure 9. Schematic of thermal conductivity of the MOST device.
Energies 18 02298 g009
Figure 10. UV irradiation.
Energies 18 02298 g010
Figure 11. Pictures of the experimental site. The reflected light rays are shown within the red box.
Energies 18 02298 g011
Figure 12. (a) Three-dimensional schematic of the MOST device, (b) Physical drawing of the MOST device.
Energies 18 02298 g012
Figure 13. Temperature curve of AZO.
Energies 18 02298 g013
Figure 14. (a) Average temperature of the warming period. (b) Average temperature of the stabilization period. (c) Average temperature of the cooling period. The vertical dashed line in the figure indicates that the device subsequently enters its normal operating state.
Energies 18 02298 g014
Figure 15. (a) The 1st experiment; (b) The 10th experiment; (c) The 12th experiment.
Energies 18 02298 g015
Figure 16. Exothermic power of the MOST device.
Energies 18 02298 g016
Figure 17. Irradiation intensity vs. temperature.
Energies 18 02298 g017
Figure 18. Irradiation intensity vs. exothermic power.
Energies 18 02298 g018
Table 1. Partial parameters of parabolic trough solar.
ProjectData
Reflector area15.3 m2
Total length of collector tube6000 mm
Collector opening width2550 mm
focal length850 mm
Mirror emissivity0.9
Outer diameter of collector tube90 mm
Inner diameter of collector tube 45 mm
Thermal conductivity of collector tube54 W·m−1·K−1
Collector Absorption Rate0.9
Specific heat capacity of heat conducting oil (26 °C)0.76 kJ·kg−1·K−1
Table 2. Basic parameters of curved reflector.
ProjectNorm (mm)
reflector length200
reflector Thickness2
reflector Arc Length177.89
reflector diameter depth30
Mirror cutoff wavelength390
Focal length of transmitted light50
Focal length of reflected light800
Table 3. MOST device parameters.
ProjectNorm
structural materialcopper (pure copper, as opposed alloy)
thermal conductivity (W·m−1·K−1)401
length (mm)1000
high (mm)35
maximum width (mm)70
Fuel zone size (mm)1000 × 70 × 5
Diameter of heat conduction oil orifice (mm)10
Azobenzene charge (kg)0.83
Table 4. Experimental material: Solid azobenzene powder.
Chemical NameAbbreviationFormulaCASPurityMolar Mass
Azobenzene[AZO]C12H10N2103-33-3≥97%182.22
Table 5. Twelve exothermic cycles on a typical day.
Order of ExperimentsCumulative Heat Release (kJ)Peak Transient Exotherm
(kJ·kg−1·m−1)
Exothermic Power of the MOST Device (W·kg−1·m−1)
10.870.073.22
24.750.2515.89
37.280.4124.38
49.040.5427.50
58.610.5128.82
67.930.4526.55
78.760.4529.31
88.330.5827.88
97.680.3325.71
108.320.5127.08
115.610.3218.77
121.170.252.70
Disclaimer/Publisher’s Note: The statements, opinions and data contained in all publications are solely those of the individual author(s) and contributor(s) and not of MDPI and/or the editor(s). MDPI and/or the editor(s) disclaim responsibility for any injury to people or property resulting from any ideas, methods, instructions or products referred to in the content.

