1. Introduction
Global power consumption has been growing exponentially due to population growth, urbanization, and economic development in the commercial, industrial, and agricultural sectors. The power demand is also significantly influenced by the electrification of the transportation sector. Fossil fuel-powered power plants have several significant disadvantages, such as environmental pollution, depletion of limited natural resources, greenhouse gas emissions, etc., [
1]. Expanding the installed capacity of the presently operational fossil fuel-based power-generating plants is not feasible to fulfill the rapidly growing need for electric power. Microgrids provide a viable solution for this demand-generation mismatch by utilizing locally distributed energy resources (DERs), and energy storage systems (ESS). ESS significantly improves the reliability of microgrids by storing excess energy generated from renewable sources or the grid at a low grid tariff (LGT) and delivering the stored energy in an energy deficit or at a high grid tariff (HGT). Due to its ability to reduce power loss, increase reliability, minimize investment costs, and, most importantly, take advantage of renewable energy resources such as wind, photovoltaic, and microturbines, distributed generation has become increasingly attractive to the power industry [
2]. The past few decades have seen a global increase in interest in alternative and cleaner power generation methods due to factors such as global warming, rising energy costs, and the energy crisis. To facilitate the incorporation of DERs based on renewable energy, the power grid operator creates new policies and amends those that already exist [
3]. The necessity to maintain the balance between load and generation at all times presents technical issues as more variable renewable energy-based DERs, such as solar and wind, are introduced into electric power networks [
4]. One of the most important technologies for achieving high penetration is energy storage technology, which balances the intermittent nature of variable renewable energy [
5]. When these renewable energy sources are combined with the traditional electrical power grid, there are advantages and disadvantages to their effects. The benefits, however, overshadow the drawbacks because they come with unlimited, cost-free, and affordable resources [
6]. Reliability assessment is one of the most significant measures required for analyzing the effects of distributed generation (DG) units powered by renewable energy sources on distribution networks and reducing the expenses incurred by power outages [
7]. A microgrid is a group of interconnected loads and distributed energy resources with clearly defined electrical boundaries that acts as a single controllable entity with respect to the grid and can connect and disconnect from the grid to enable it to operate in both grid-connected or island modes [
8]. By scheduling the outputs of controllable DERs and ESS and prioritizing the load, the microgrid minimizes operational costs and guarantees a stable power supply for customers during outages [
9]. It is an innovative approach to distribution system management to establish several microgrids powered by DERs within the distribution system in real-time operations to recover critical loads from power outages. Utilities may accomplish this by progressively installing distributed energy resources (DERs) and remotely operated switches [
10]. Resilience-based planning is required to locate DERs, how large they should be, and how to configure the distribution network while considering factors such as the ability to withstand and recover from power outages or disruptions [
11].
Various communication techniques can be employed to facilitate effective communication between DERs, ESS, loads, and the controller for the efficient operation of a microgrid. One commonly used method is Supervisory Control and Data Acquisition (SCADA)-based communication; however, it suffers from limitations such as asynchronous measurements, latency, measurement errors, and low data resolution (every 4 to 10 seconds). An alternative approach is to use Phasor Measurement Units (PMUs), which offer a superior solution for microgrid communication by delivering high-resolution (every 20 milliseconds), time-synchronized data with minimal latency, thereby enhancing the precision and reliability of microgrid operations [
12]. The Wide-Area Measurement System (WAMS) comprises multiple Phasor Measurement Units (PMUs) interconnected to a central system, referred to as the Phasor Data Concentrator (PDC), through various communication links. The PDC receives time-synchronized measurements from all PMUs, aggregates them into a unified data packet with the same timestamp, and makes the information available for system monitoring and control [
13]. PMUs provide high-resolution, time-synchronized measurements that are transmitted to phasor data concentrator (PDC). By integrating PMUs with communication networks and data analytics tools, WAMS enables enhanced situational awareness, faster decision-making, and improved grid reliability and resilience in real-time operations [
14]. To ensure full observability and reliable data transmission, a suitable communication network is essential to transmit PMU data to the PDC effectively [
15]. Real-time monitoring in smart grids demands precise and rapid measurement tools. While traditional PMUs face limitations in unbalanced distribution systems due to their cost and technology, µ-PMUs provide a more accurate, faster, and cost-effective solution, making them well-suited for modern grid applications [
16].
Running a microgrid without a power management system (PMS) is not feasible because the PMS is essential for balancing supply and demand, maintaining voltage and frequency stability, and ensuring the efficient operation of DERs. Without a PMS, the microgrid cannot coordinate the various generation sources, storage systems, and loads, leading to potential power imbalances, instability, and system failures [
17]. Integrating an ESS with solar photovoltaic (PV) or wind farms enhances the dispatchability of these intermittent renewable energy sources [
18].
A problem-oriented review of energy management in microgrids is presented in [
19]. The review introduces an energy utilization model alongside a comprehensive energy management framework that focuses on stability, efficiency, and resilience. Additionally, it outlines a three-layer hierarchical architecture for managing microgrid systems and discusses key enabling technologies such as control, communication, forecasting, optimization, and performance evaluation. Hierarchical control in microgrids typically involves three distinct levels: primary, secondary, and tertiary control. Primary control ensures immediate, local management of generation and load to maintain system stability and voltage regulation. Secondary control addresses system-wide issues by coordinating and correcting the primary control’s deviations, ensuring smooth operation and stability. Tertiary control focuses on long-term optimization, including economic dispatch and energy management, coordinating with the central grid or other microgrids. This layered approach enhances the microgrid’s reliability, efficiency, and flexibility in island- and grid-connected modes [
20,
21].
Microgrid controllers are crucial for maintaining efficient and stable operations within a microgrid. They are categorized into decentralized and centralized types based on their management approach. Decentralized controllers like Droop Controllers manage local components independently, adjusting outputs based on local measurements without central oversight. In contrast, centralized controllers, such as Energy Management Systems (EMS), optimize the entire microgrid from a single point, integrating system-wide data to make coordinated decisions for overall efficiency and stability. Since the microgrid power management system (PMS) operates at the tertiary level of the hierarchical control structure, a centralized controller-based PMS is more suitable for microgrids with a small geographical area [
22,
23].
The power management strategy for a microgrid is discussed in [
24], where the microgrid comprises solar PV and a Battery Energy Storage System (BESS). The case studies are performed considering variations in solar PV generation, load demand, and the state of charge (SoC) of the BESS. However, the study has limitations as all utilities are connected to the same bus, lack a dispatchable generation source, and do not account for grid tariffs while operating only in grid-connected mode. In [
25], a heuristic approach for energy management is proposed for a test system comprising a fuel cell, solar PV, and a BESS. The results are analyzed based on variations in solar PV generation, BESS state of charge (SoC), and grid tariffs. However, the approach is limited to all utilities connected to a single bus. In [
26], a coordinated multilayer control strategy for the energy management (EM) of a grid-connected AC microgrid is presented, incorporating solar PV, a BESS, and electric vehicles. However, the strategy has drawbacks, as all utilities are connected to the same bus, and grid tariffs are not considered. An Energy Management System (EMS) based on a Fast Learner Optimizer (FLO) for a microgrid is proposed in [
27]. Although the microgrid model includes both dispatchable and non-dispatchable sources, as well as a Battery Energy Storage System (BESS), all components are connected to the same bus, limiting the system’s practical application. In [
28], a robust multi-agent system is proposed for efficient online energy management in a microgrid. The study utilizes an IEEE 33-bus balanced system-based microgrid, incorporating various DERs and ESS. A decentralized control scheme is employed for the Energy Management System (EMS); however, this approach lacks complete system observability from a central control point also limited to grid-connected mode only. A priority-based hierarchical operational management system for microgrids is proposed in [
29], incorporating a multiagent-based load-prioritization scheme. This method ensures efficient resource allocation during power deficits by dynamically prioritizing critical loads. However, the study is confined to islanded microgrid operation and does not address grid-connected scenarios. A frequency deviation-based load-shedding approach for islanded microgrids is presented in [
30]; however, frequency deviation alone is not a reliable parameter for load-shedding, as it can be influenced by multiple system events.
Power distribution systems are typically unbalanced and extend over wide geographical areas, it is crucial to design microgrids that operate under similar conditions to reflect real-world scenarios. However, the existing literature lacks a focus on power management strategies for microgrids modeled on real-time, unbalanced distribution systems. This study utilizes the modified IEEE 13-bus system as a microgrid test system, integrating DERs and ESS to enhance system performance and functionality. Each bus is equipped with a micro-Phasor Measurement Unit (µ-PMU) that collects voltage and current phasor data and transmits it to a Phasor Data Concentrator (PDC) for processing. Existing studies in the literature primarily focus on either grid-connected or islanded operations. Therefore, a robust algorithm utilizing reliable parameters is essential for ensuring effective PMS operation under both conditions.
This work proposes a PMS algorithm for both grid-connected and islanded modes of operation. The key contributions of this study are as follows,
A microgrid test system is developed by modifying the IEEE 13-bus system to simulate conditions typical of a real distribution system. This microgrid is equipped with µ-PMUs and PDC.
In grid-connected mode, the CPMS employs a Grid-Tariff based source allocation (GTSA) algorithm driven by system constraints, is implemented in the PDC to ensure effective coordination among DERs, ESS, loads, and the utility grid. The algorithm optimizes system performance based on DER generation, SoC of the ESS, and dynamic grid tariff (DGT).
In islanded mode, the CPMS employs a priority under priority-based consumer allocation (PPCA) algorithm to implement load-prioritization based on consumer weight.
In islanded mode, a weighted priority under priority-based consumer allocation (WPPCA) algorithm is also implemented, incorporating both load priority and consumer count to optimize load-shedding decisions.
In islanded mode, the WPPCA algorithm addresses the load restoration challenge by incorporating both the consumer priority index and weight to determine the restoration sequence when the available power surpasses the connected load.
A comparative analysis between PPCA and WPPCA is conducted to evaluate the effectiveness and superiority of the proposed algorithms.
The GTSA, PPCA, and WPPCA algorithms are designed to efficiently manage power transactions, ensuring that voltage and frequency remain within acceptable limits for stable and reliable microgrid operation.
The rest of the paper is organized as follows:
Section 2 introduces Power Management in Microgrids using WAMS, while
Section 3 describes Methodology and Results. A comparative evaluation with existing methods is conducted in
Section 4, and conclusions are drawn in
Section 5.
2. Power Management in Microgrids Using WAMS
2.1. Microgrid
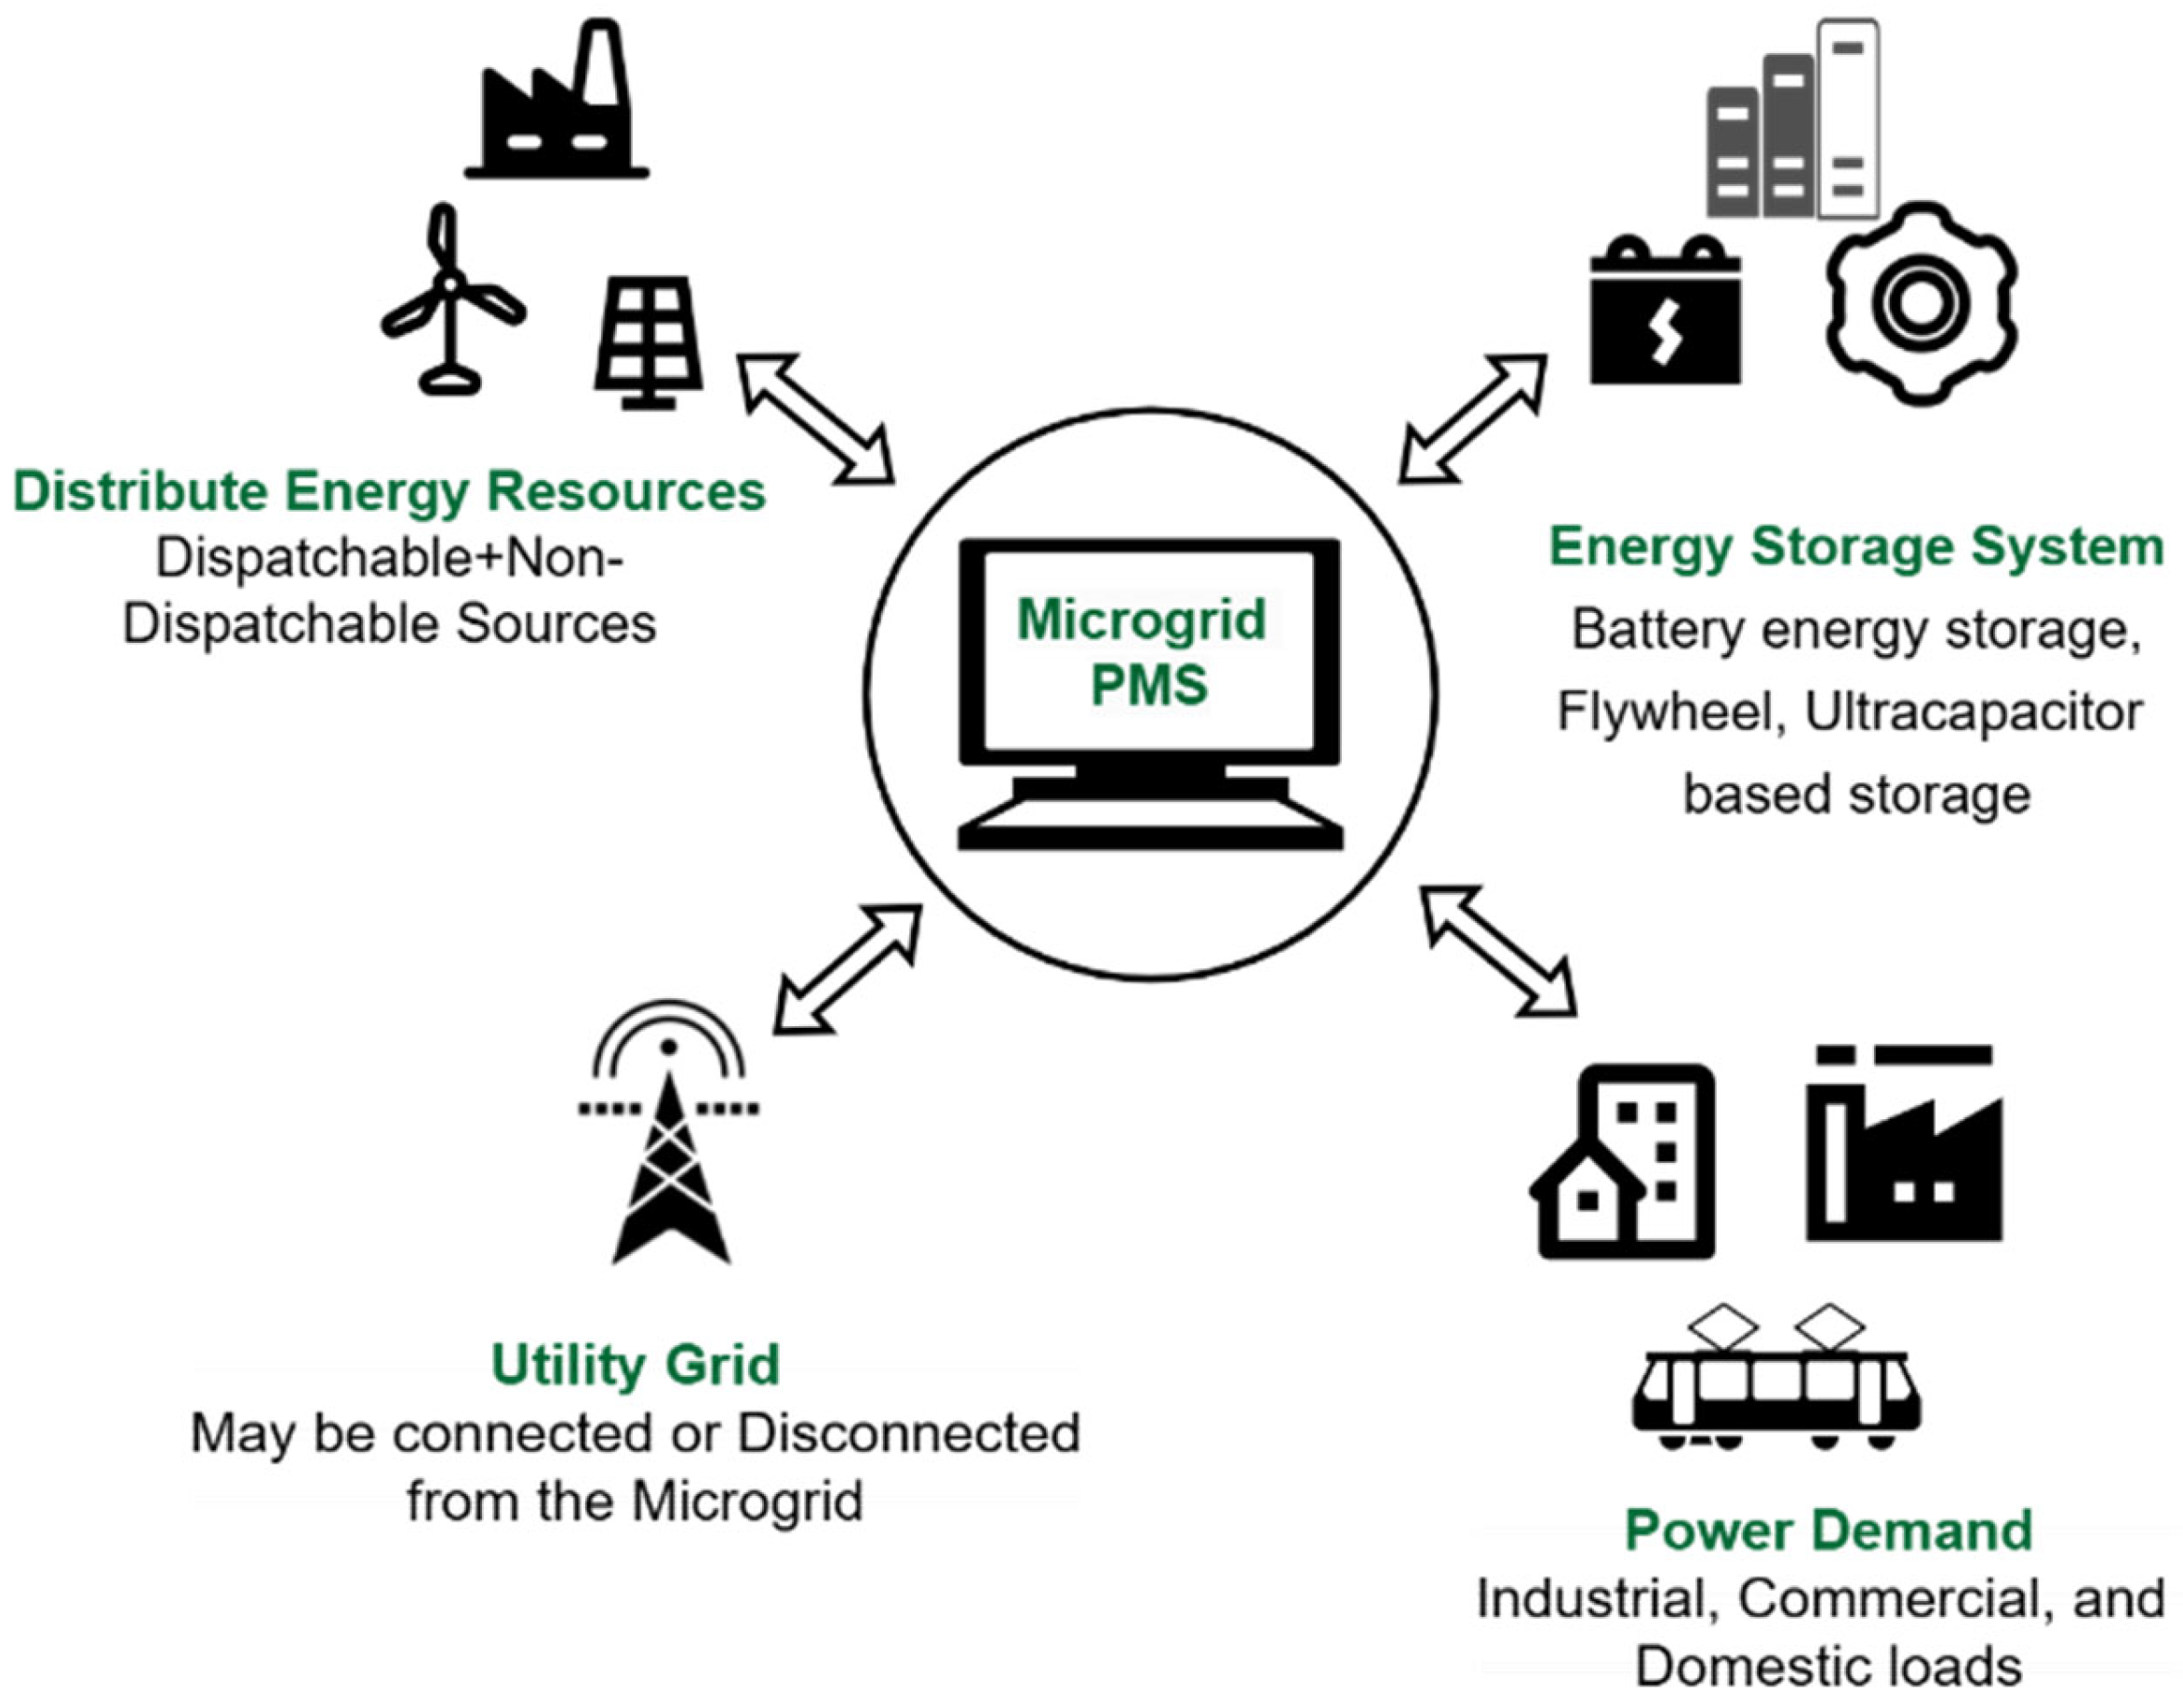
A microgrid integrates renewable and/or conventional energy-based DERs, ESS, and loads within clearly defined electrical boundaries. It incorporates both renewable and conventional DERs such as solar photovoltaics (PV), wind, natural gas-based generators, diesel generators, and various energy storage technologies, including batteries, flywheels, and ultracapacitors. The microgrid may serve a range of load types, including industrial, commercial, and residential, and is typically connected to the utility grid at a point of interconnection (POI).
Figure 1 illustrates a general schematic of a modern microgrid integrated with a Power Management System (PMS).
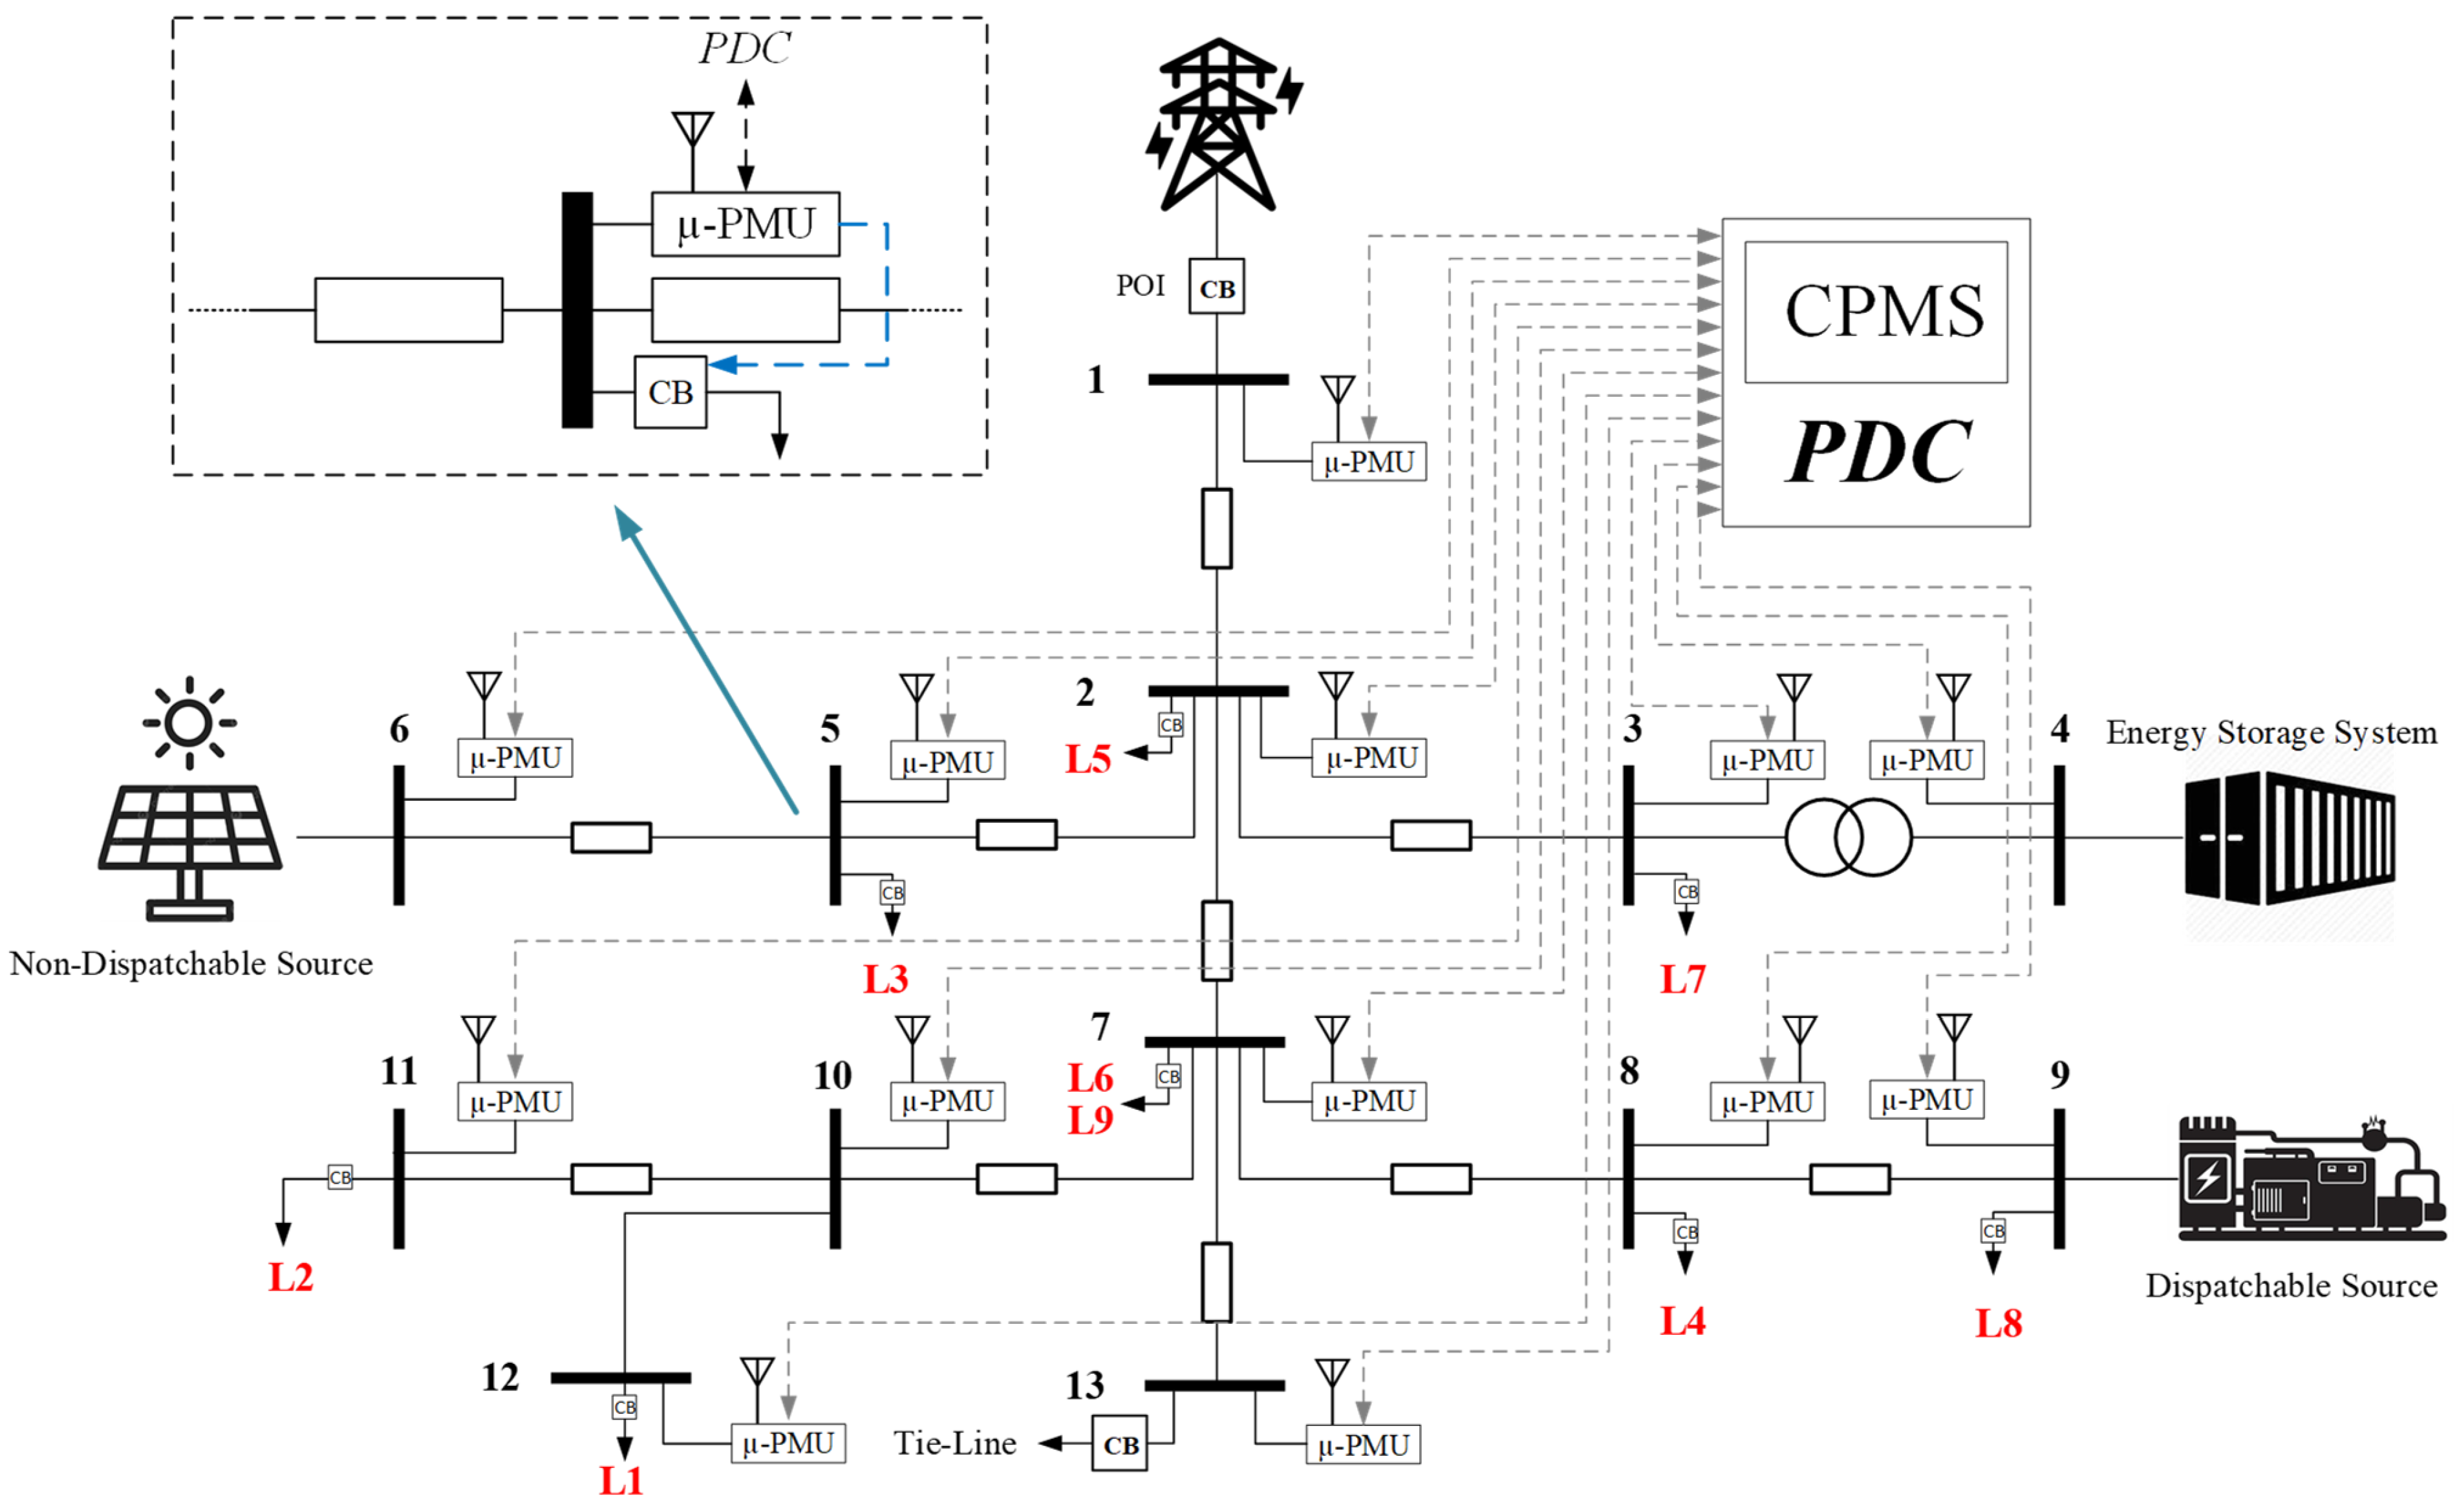
A modified IEEE 13-bus system [
31] is adapted as a microgrid by incorporating a solar PV generator, a natural gas-based generator (NGG), and an energy storage system (ESS) at strategically selected locations [
32], as illustrated in
Figure 2. The test system is designed for a medium voltage level of 4.16 kV and operates at a frequency of 60 Hz. Micro-phasor measurement units (µ-PMUs) were installed at all 13 buses to collect and transmit data to the phasor data concentrator (PDC) for further processing. The line data for the IEEE 13-bus test system are provided in the
Supplementary Materials of this paper. The following are the main components of the proposed microgrid.
2.1.1. Dispatchable Source
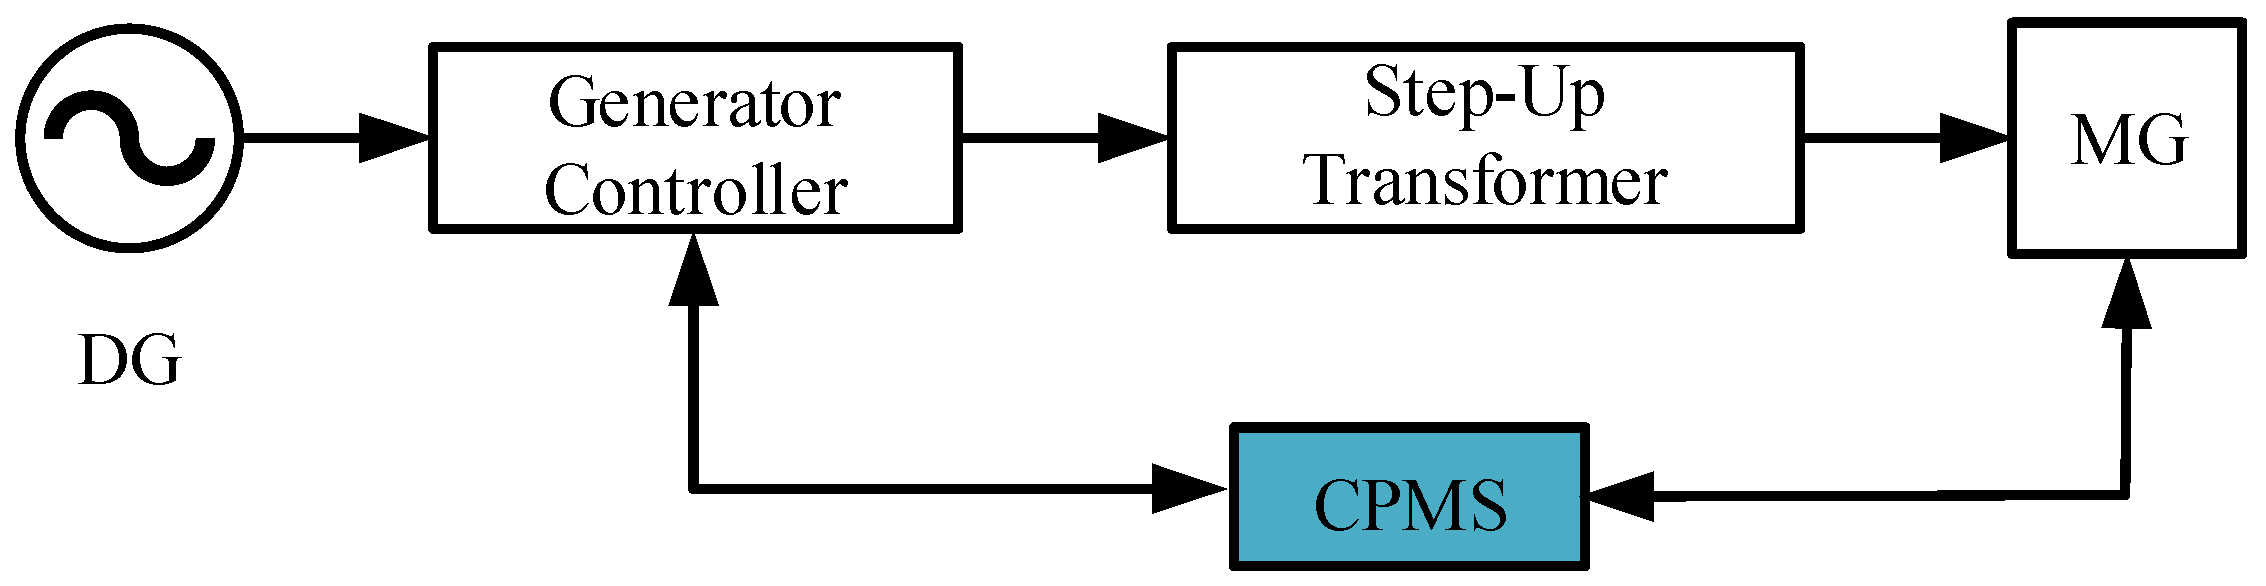
A dispatchable source in a microgrid (MG) can be turned on, turned off, or its output regulated based on requirements. Examples include diesel generators, fuel cells, and natural gas turbines [
33]. In the proposed microgrid, two natural gas-based generator (NGG) units of capacity 1 MW and 550 kW are installed at bus 9, as shown in
Figure 2. The 550-kW unit is designated exclusively for operation in Islanded mode. Dispatchable sources are essential for maintaining the reliability and stability of microgrids, particularly in managing the intermittency of renewable energy sources.
Figure 3 presents the control structure of the NGG managed by the CPMS.
Figure 2.
Structure of the IEEE 13-bus system based Microgrid with WAMS.
Figure 2.
Structure of the IEEE 13-bus system based Microgrid with WAMS.
2.1.2. Non-Dispatchable Sources
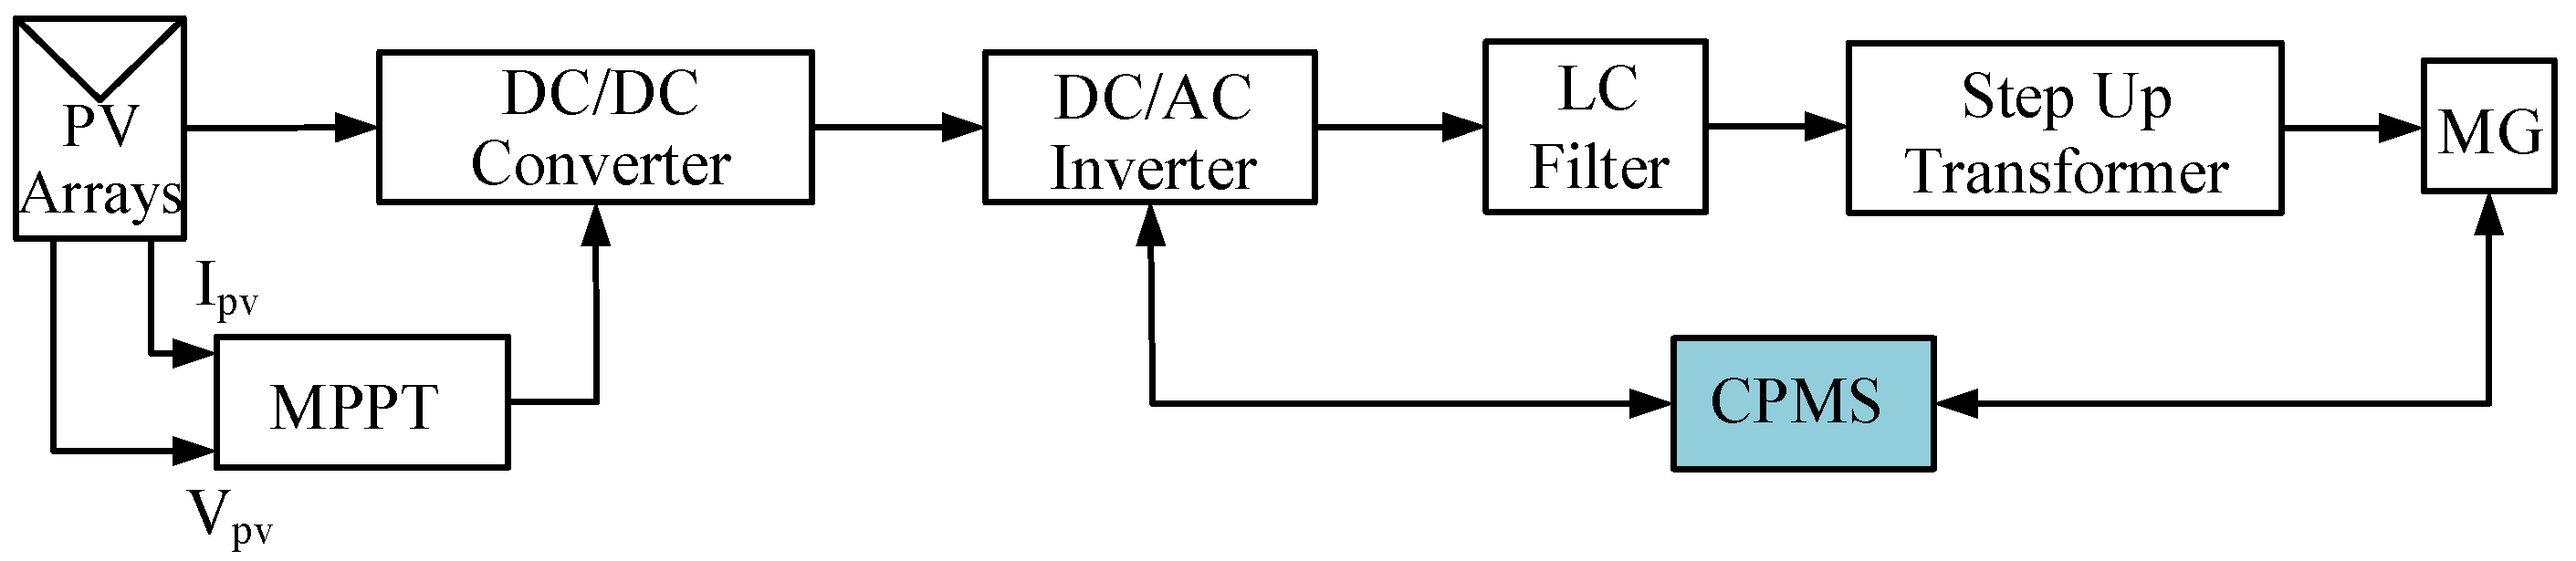
Non-dispatchable power sources are inherently unreliable due to their dependence on variable natural conditions. Examples include solar PV, wind, and run-of-river hydro plants [
33]. In the proposed system, a 1.5 MW solar PV generator is installed at bus 6 as shown in
Figure 2, the control structure is given in
Figure 4. While non-dispatchable sources offer clean energy, integrating dispatchable sources alongside them is preferred to ensure the reliable operation of the microgrid. The maximum power output from the solar PV system is achieved under standard test conditions (STC), corresponding to an irradiance of 1000 W/m
2 and a temperature of 25 °C.
2.1.3. Energy Storage System
To address the generation–demand gap and enhance system reliability and resilience, equipping the microgrid with an energy storage system (ESS) is essential [
33]. In the proposed system, an ESS with a total capacity of 1042 Ah and 480 Volts is installed at bus 4, as shown in
Figure 2. The ESS is configured to operate at a 1C charge/discharge rate, enabling full charging or discharging within one hour, and can deliver 500 kW of power for up to 1 h, depending on system requirements.
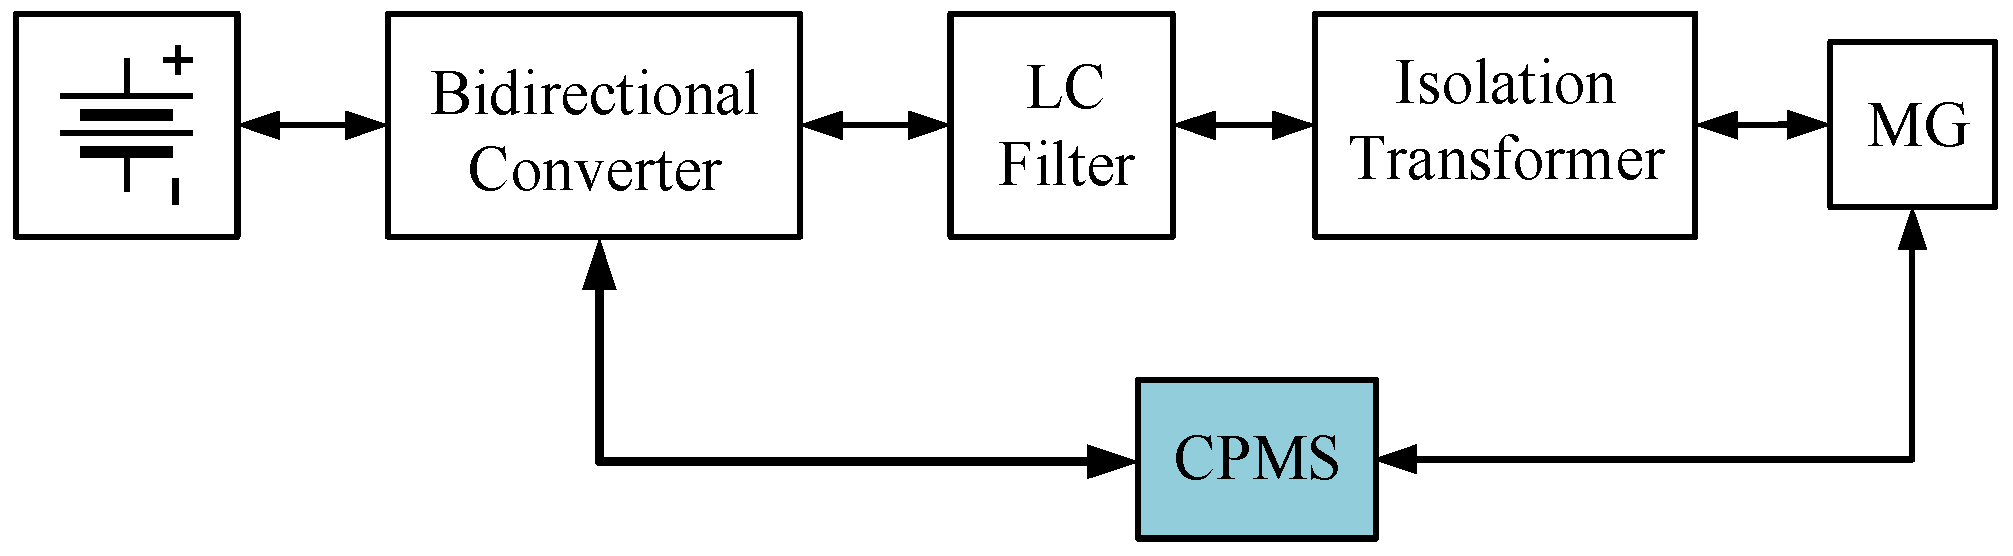
Figure 5 illustrates the control architecture of the ESS.
2.1.4. Loads
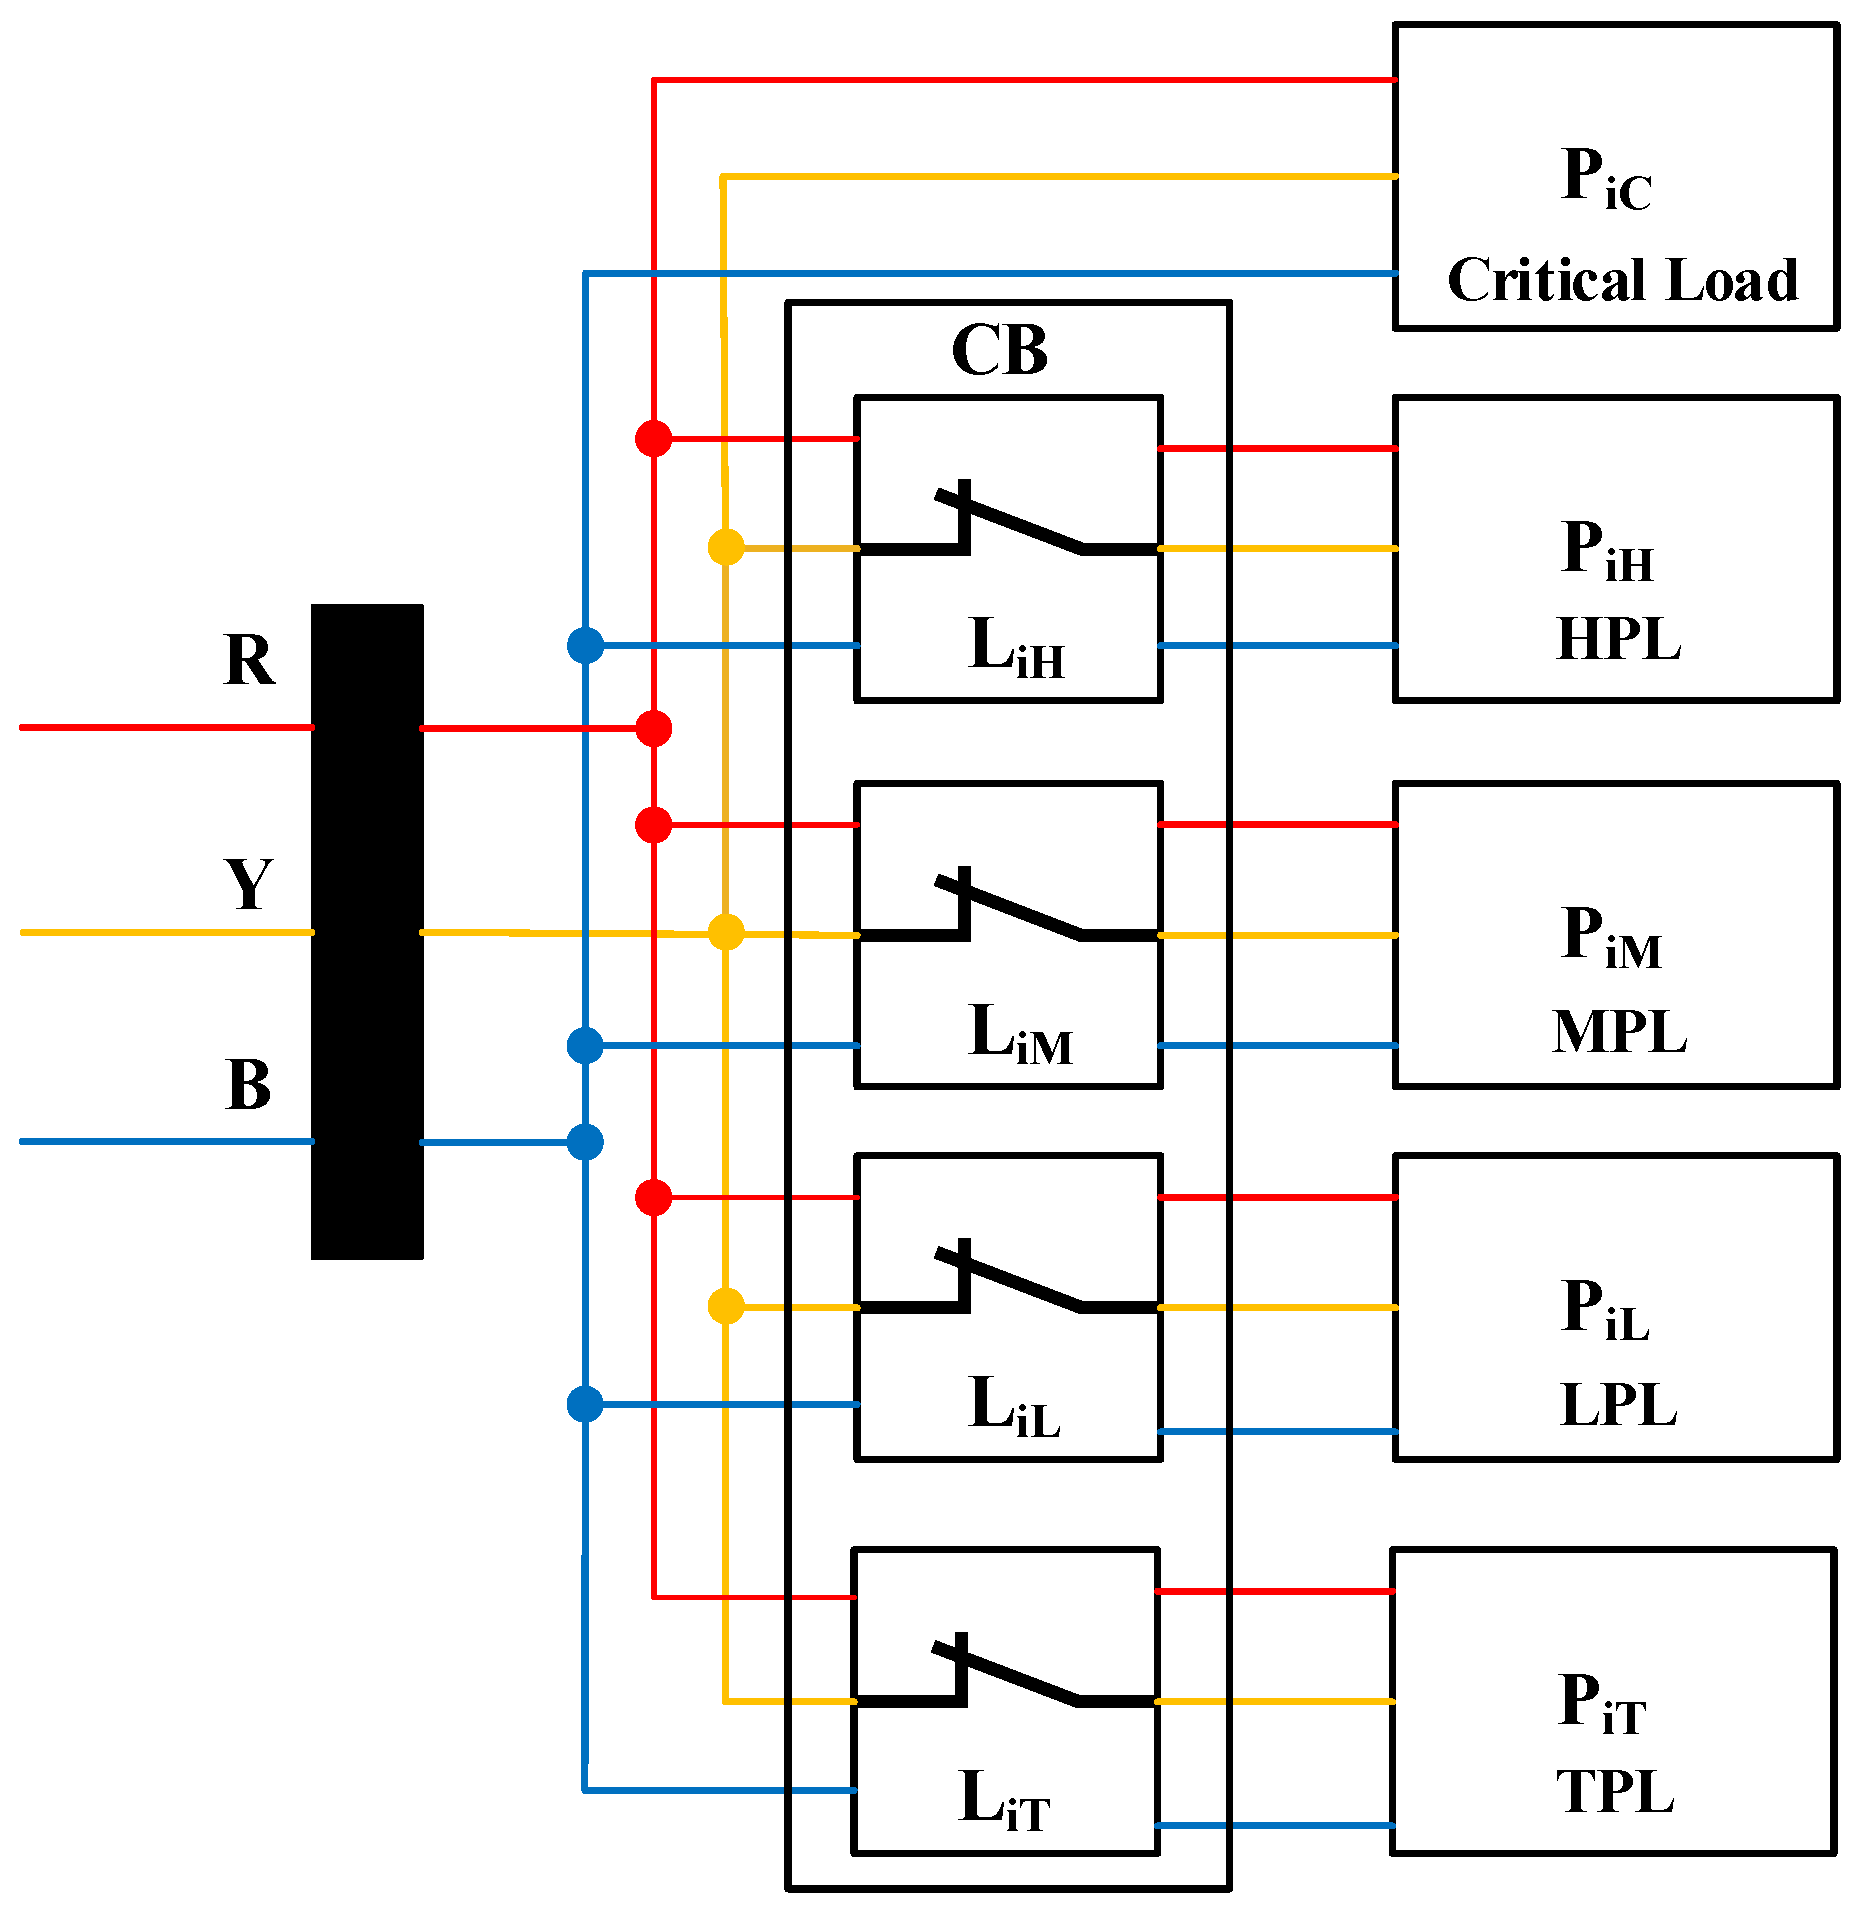
The connected load is categorized into nine priority-based categories, including hospitals, transportation, academic institutions, municipal services, residential, Government offices, commercial establishments, industrial facilities, and irrigation, in the specified priority order. Furthermore, each load is sub-classified into five priority levels, namely critical, high, medium, low, and trivial, facilitating a realistic representation of a practical distribution system. In grid-connected mode, load curtailment is not performed regardless of priority. In islanded mode, critical loads remain connected and cannot be disconnected under any operating conditions. The generalized structure for each load category is depicted in
Figure 6, highlighting the circuit breaker requirement for all load categories except critical loads. The proposed microgrid test system, comprising connected loads, DERs, and an ESS, is illustrated in
Figure 2. A time-dependent load demand is considered to accurately reflect the practical operation of a real-time power system as given in
Table 1.
Here, Pic represents the critical component (CL) of the ith load, while PiH, PiM, PiL, and PiT correspond to high-priority load (HPL), medium-priority load (MPL), low-priority load (LPL), and trivial-priority load (TPL), respectively. LiH denotes the load-connected circuit breaker (LCCB) associated with the high-priority segment of the ith load.
As illustrated in
Table 1, Load L4 represents a municipal load with a daily consumption of 170 kW/day. The load is further categorized into four priority levels: critical, high, medium, and low. The number of connected consumers in each category is 3, 8, 10, and 13, respectively, resulting in a total of 34 consumers connected to L4. Similarly, the total number of consumers connected to the microgrid across all priority levels and categories is 643.
It is also considered that a specific category of load draws power from the microgrid during the period specified in
Table 1.
For the remaining duration, these loads manage their power demand independently through local generation or energy storage.
As shown in
Figure 2, the connected microgrid utilities and their corresponding buses are detailed in
Table 2.
2.2. Wide Area Measurement System for Microgrid
A microgrid comprises multiple renewable energy-based DERs, which exhibit an intermittent nature, leading to frequent fluctuations in power generation. In real-time operation, load demand also fluctuates dynamically based on consumer requirements, resulting in a continuously varying imbalance between generation and demand. This dynamic imbalance between generation and demand must be accurately and rapidly measured to enable effective source regulation, load curtailment, and restoration, ensuring system stability.
SCADA-based monitoring and communication systems exhibit latency issues, which adversely impact the performance of the PMS. The inability to obtain complete and current data can result in delayed responses to system events or faults, compromising the overall reliability and efficiency of power system operations [
34]. Phasor Measurement Units (PMUs) offer significant advantages in terms of latency, which is crucial for real-time applications in power systems.
The advancements in PMU technology have led to methods that reduce reporting latency, enhancing their effectiveness in monitoring and control applications [
35].
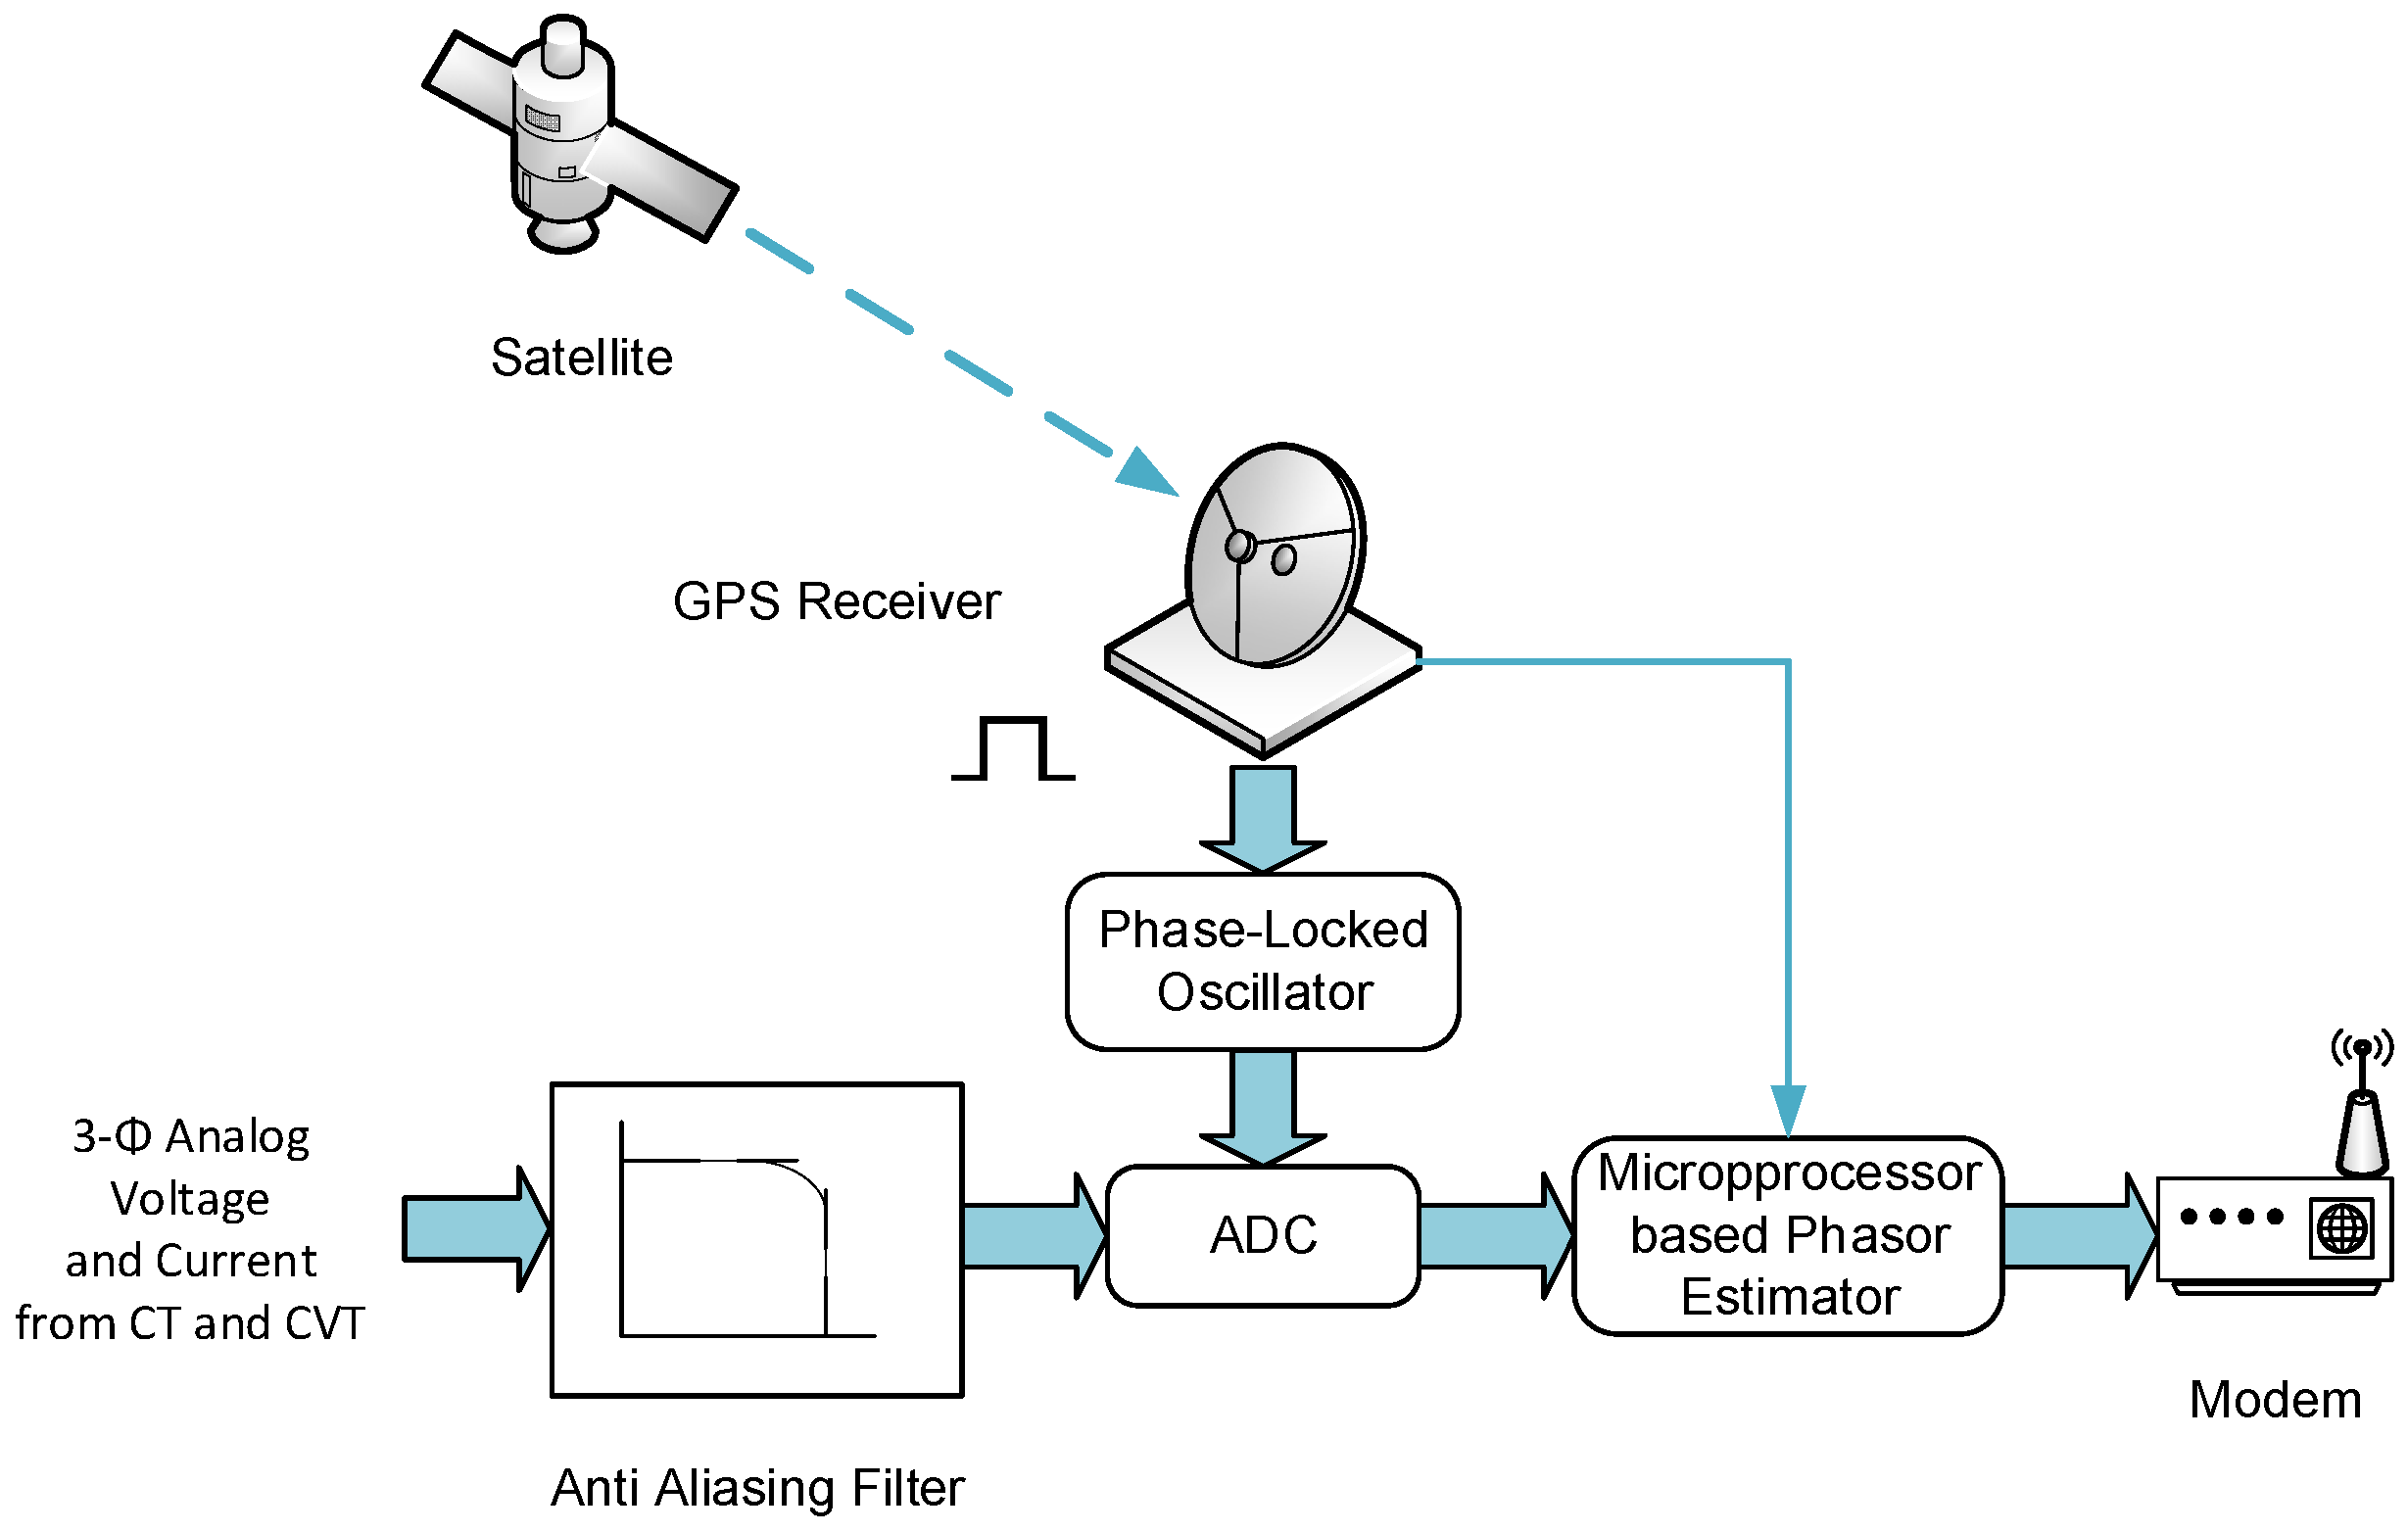
The primary components of a micro Phasor Measurement Unit (PMU) are depicted in
Figure 7. The three-phase analog voltage and current signals are initially processed through an anti-aliasing filter to mitigate aliasing effects. These filtered analog signals are then digitized using an Analog-to-Digital Converter (ADC). A phase-locked oscillator, in conjunction with a GPS receiver, ensures high-speed, time-synchronized sampling at a rate of 40–60 samples per second, achieving a time synchronization accuracy of 1 microsecond. The digitized signals are subsequently processed by a microprocessor-based phasor estimator, which employs the Discrete Fourier Transform (DFT) to compute the fundamental phasors of the three-phase voltage and current signals [
36]. In a μ-PMU-based Wide-Area Measurement System (WAMS), the μ-PMUs acquire voltage and current phasor data and transmit it to the Phasor Data Concentrator (PDC), where the Power Management System (PMS) is deployed. PMUs and μ-PMUs operate under predefined standards to ensure accurate, time-synchronized measurements and reliable data communication across the power system. These standards define the performance requirements for synchrophasor measurements and specify the communication protocols necessary for consistent and interoperable operation within wide-area monitoring systems [
37,
38]. The PMS processes the received data and, based on the analysis, generates control signals for Distributed Energy Resources (DERs) to regulate their power output. Additionally, it issues control commands to load-connected circuit breakers to enable opening or closing operations as required. PMUs are primarily designed for transmission systems, whereas μ-PMUs are for distribution systems. Fiber optic communication is considered crucial in applications like wide-area monitoring due to its low failure rate, high data transfer rates, immunity to electromagnetic interference, and resilience to cyber threats. Consequently, the communication channel is assumed to transmit the phasor data to PDC without any latency or data loss in this study. Advanced Phasor Data Concentrators (PDCs) are typically equipped with mechanisms to estimate or reconstruct lost data packets. However, in the present work, it is assumed that no data loss or unsynchronized packets occur at the PDC [
39,
40].
The key differences between these two are discussed in the next sub-section.
2.2.1. Difference Between PMU and µ-PMU
The main differences between the PMU and µ-PMU are their applications, cost, and operational characteristics [
41]. Phasor Measurement Units (PMUs) are primarily deployed in high-voltage transmission networks, whereas micro-PMUs are designed for lower-voltage distribution systems, providing higher data resolution and improved cost efficiency.
Table 3 further discusses these distinctions [
42,
43].
2.2.2. Power Measurement Using PDC Data
The power calculation is performed using voltage and current phasors obtained from μ-PMU measurements [
44]. The apparent (total) power calculated from μ-PMU measurements,
Here, and are the voltage and current phasors, respectively.
The real power at a given time instant
can be calculated as,
Here, , where is the sampling time and n is a positive integer used as a time index at each tn. is a multiple of 1/60 s for synchro phasor sampling. The next section is devoted to the microgrid system architecture.
2.3. Power Management in Microgrid
Power transactions between generation sources and loads must be carefully managed to meet operational limits and ensure that voltage and frequency remain within allowable ranges. The integration of a Power Management System (PMS) is crucial for optimizing and coordinating the operation of the microgrid [
45]. However, the mere inclusion of energy sources and storage in a microgrid does not automatically ensure reliable or cost-effective operation without careful planning and coordination.
Optimizing microgrid performance requires a comprehensive approach that considers key factors such as the intermittency of renewable energy-based DERs, the SoC of ESS, and the grid tariff. Therefore, an effective Power Management System (PMS) is crucial for a microgrid’s optimal and reliable operation. This system must handle uncertainties in power generation while prioritizing load demand, ensuring efficient and reliable power delivery. To achieve this, a robust monitoring and communication infrastructure is essential, continuously collecting data from various DERs and ESS. The PMS processes these data and, based on real-time load demands, issues control commands to the microgrid’s various components, factoring in system dynamics and optimization.
For successful power management, microgrids must address operational constraints such as demand-supply matching, operational costs, economic dispatch, frequency and voltage regulation, and the inherent uncertainties in DER output. Consequently, without an integrated and well-designed PMS, a microgrid cannot function optimally. From the consumer’s perspective, achieving high reliability and cost-effectiveness in power supply is paramount. A well-functioning PMS enhances reliability by optimizing DER generation and ensuring a balanced operation between supply and demand through the strategic use of ESS.
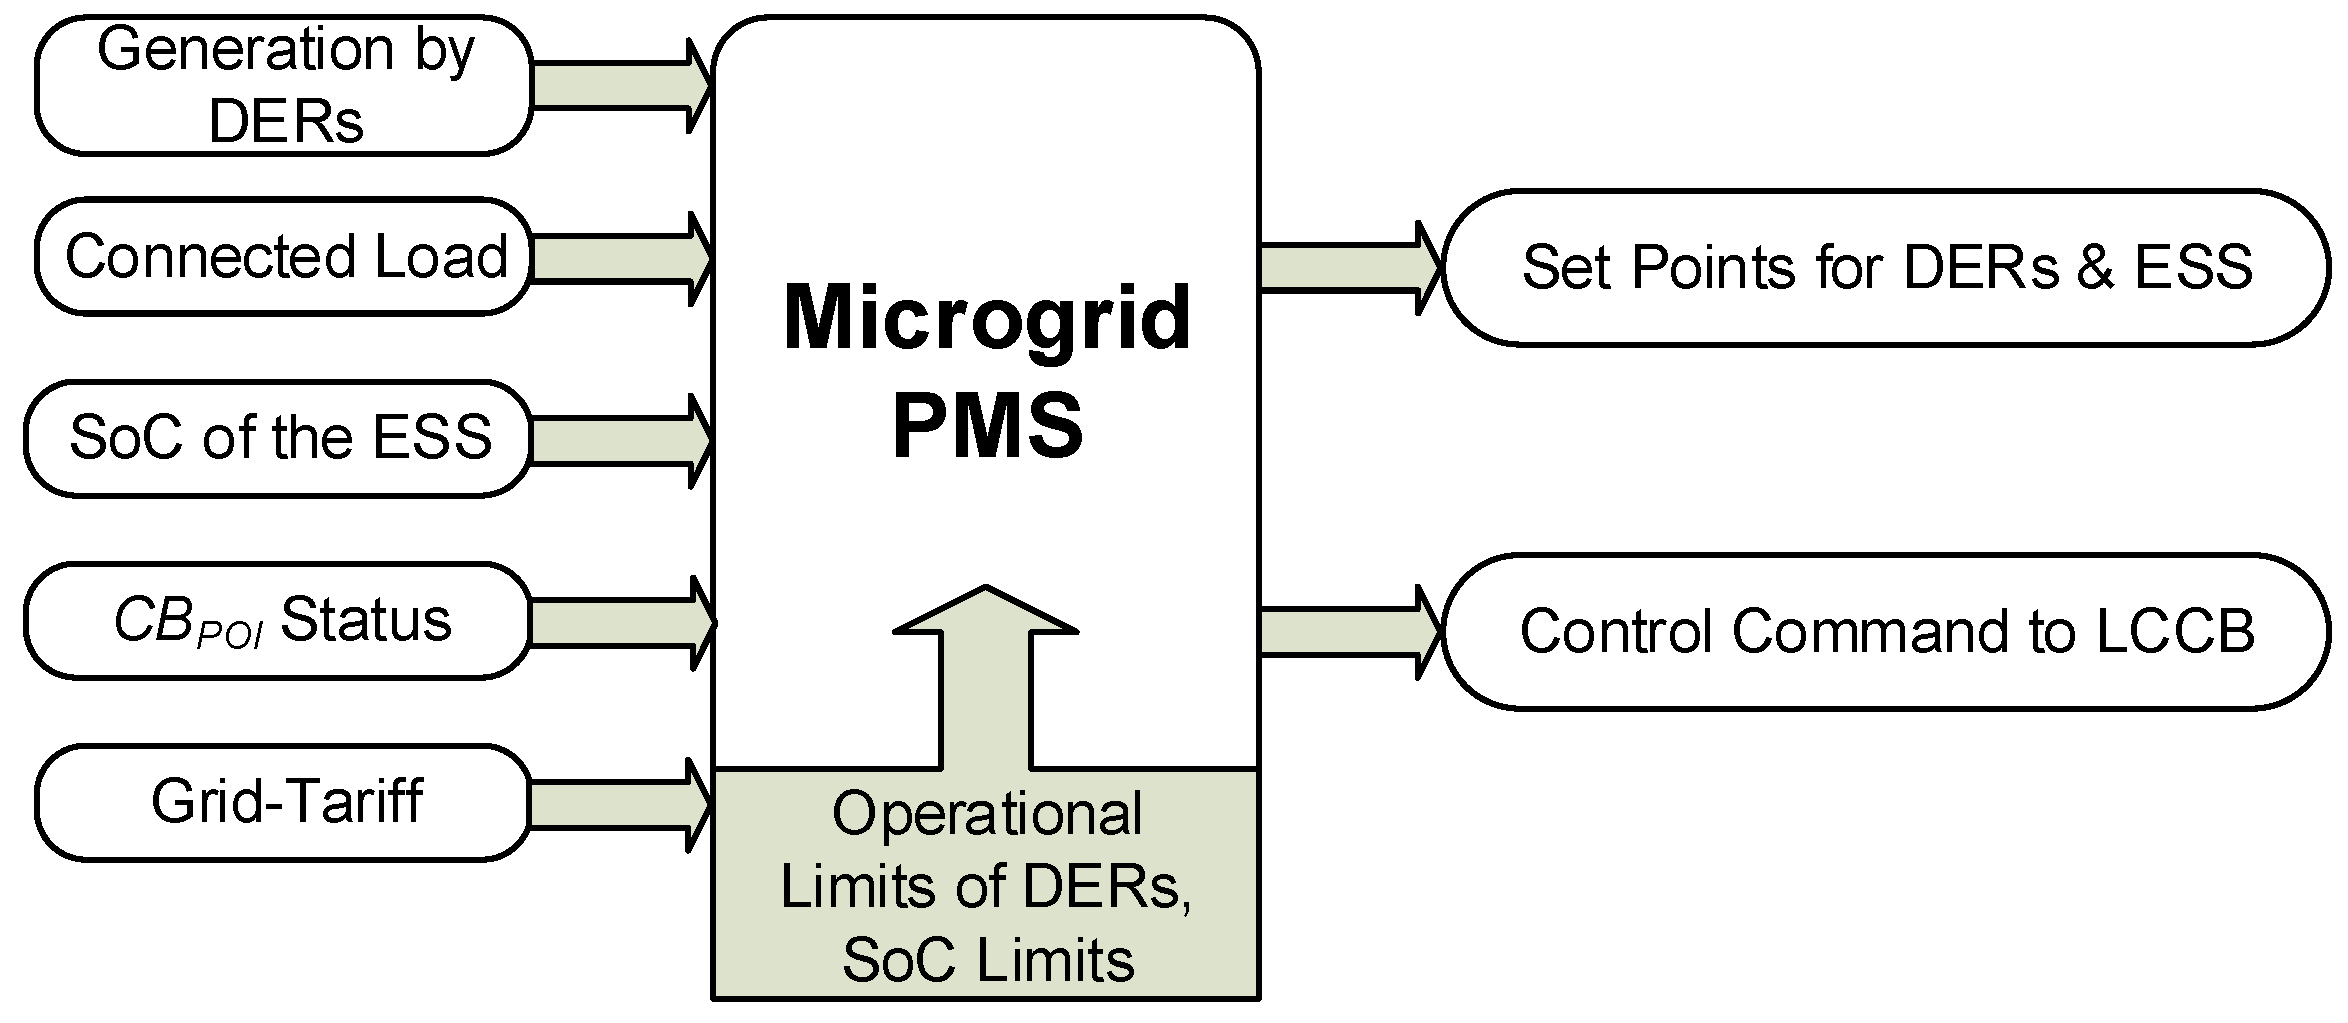
A schematic of the proposed power management system (PMS) for microgrid operation is depicted in
Figure 8. In this study, the term Power Mode is introduced to describe solar power generation relative to the connected load. When solar generation exceeds the connected load, it is termed Sufficient Power Mode (SPM), whereas Insufficient Power Mode (IPM) applies when solar generation is less than the connected load.
In this work, Micro-Phasor Measurement Units (µ-PMUs) are deployed at each bus in the microgrid to capture high-resolution phasor data, which is transmitted to the Phasor Data Concentrator (PDC) via a fiber optic communication system, as illustrated in
Figure 2. The CPMS within the PDC processes these data and generates control commands for DERs, the ESS, and loads, based on predefined constraints. Since the PMS operates at the tertiary control level [
20], the WAMS-based CPMS outperforms traditional SCADA-based systems, particularly in small microgrids. Additionally, the low latency of the µ-PMU communication system significantly improves microgrid performance during transient conditions.
2.3.1. PMS in Grid-Connected Mode
The PMS oversees real-time data, including power generation from DERs, power consumption, storage levels, system constraints, utility grid connections, and grid tariffs [
11]. The Centralized PMS optimizes microgrid operations by evaluating the market price of utility grid power, Natural gas costs, the SoC of the ESS, and the connected load. Based on these parameters, the CPMS determines the appropriate amount of power the microgrid should procure from the utility grid [
22]. Microgrid extracts the maximum possible power from the solar PV generator as it is clean energy available in abundance in the environment with very minimal cost. The supply of any additional required power is contingent on factors such as dynamic grid tariff (DGT), the cost of power from dispatchable sources, and the SoC of the ESS [
46,
47].
In this study, the term DGT is defined as a relative metric for the per-unit cost of power supplied by the utility grid compared to dispatchable sources. Due to the dynamic nature of grid tariffs, instances when the grid provides power at a lower cost than dispatchable sources are categorized as low grid tariff (LGT), while situations, where grid power is more expensive, are categorized as high grid tariff (HGT). The PMS is designed to operate such that the dispatchable source is utilized only under conditions of HGT, thereby ensuring economical system operation.
The operation of the ESS depends on both the DGT and the PM. The PMS is designed to charge the ESS only under SPM in both HGT and LGT scenarios and in IPM during LGT. This strategy optimizes power costs and enhances the efficiency of the ESS’s charge–discharge cycle. The discharging strategy of the ESS is governed by both the DGT and the PM. Under SPM and LGT, the ESS is not discharged. However, in IPM with HGT, the ESS is utilized before engaging any dispatchable sources, ensuring an optimized and cost-effective operation.
2.3.2. PMS in Islanded Mode
In islanded mode, the circuit breaker at the POI (
CBPOI) is opened either intentionally or due to unintentional islanding, resulting in the unavailability of the utility grid. In SPM, as solar power generation exceeds the connected load, load-shedding is not required. Excess power beyond the connected load can be utilized to charge the ESS when the SoC is low or transferred to other microgrids within the same cluster via a tie-line when the ESS is fully charged. However, in IPM, when the power generated by the solar PV system is insufficient to meet the connected load, the ESS and dispatchable sources are utilized to supply the required load. Due to the mismatch between generation and demand, system voltage and frequency deviate from their desired values, potentially leading to complete system failure [
29,
30]. If the connected load exceeds the total power generation, a priority-based load-shedding strategy is implemented to maintain system stability. In a practical distribution system, connected loads have varying priority levels, necessitating a priority-based load-shedding approach to ensure optimal system operation. A load restoration strategy is implemented to accommodate sudden increases in generation power.
Since the PMS operates based on a feedback control process, the monitoring and control mechanisms must be accurate and responsive enough to transmit real-time data to the PMS, ensuring rapid and accurate processing. In the proposed system, a µ-PMU-based communication system is employed for the microgrid’s Power Management. A centralized approach is adopted, as it is effective and advantageous for microgrids distributed over a small geographical area. The working mechanism and results for the µ-PMU-based measurement system for the proposed PMS are presented in the following section.
3. Methodology and Results
The proposed CPMS is implemented in Simulink/MATLAB, specifically using MATLAB R2022b. The simulations are carried out on a computational platform equipped with an Intel Core i7 processor, 32 GB of RAM, and a 500 GB hard disk as the primary storage, operating on Windows 10 OS. The microgrid was modeled using a modified IEEE 13-bus system, with a 1.55 MW dispatchable DER at bus 9, a 1.5 MW non-dispatchable DER at bus 6, and a 0.5 MW ESS positioned at bus 4 as shown in
Figure 2. µ-PMUs are deployed in the microgrid to collect bus voltage and current data, which is transmitted via an optical fiber communication channel to the PDC. The PDC, integrated with the CPMS and, processes the bus data to determine the variable load demand, with a maximum connected load of 3.25 MW, as well as the power generation from the various DERs and ESS. The PDC continuously collects the SoC of the ESS, and dynamic grid tariff. Based on the status of
CBPOI, the CPMS determines whether to employ the GTSA or WPPCA algorithm.
The Microgrid Power Management System (PMS) determines the operational mode of the microgrid, either grid-connected or islanded, based on the circuit breaker status at the Point of Interconnection (POI), as defined in Equation (3),
Based on the CB status the CPMS implements the appropriate algorithm. Microgrids necessitate the implementation of a resilient control mechanism to ensure their optimal operation. A general schematic for the proposed CPMS is given in
Figure 9.
All voltage and current phasor data from the buses are collected by µ-PMUs and sent to the PDC for processing.
Based on the status of CBPOI, the Power Management System (PMS) determines whether to implement the Grid-Tariff-Based Source Allocation (GTSA) algorithm or the Weighted Priority under Priority-Based Consumer Allocation (WPPCA) algorithm. Accordingly, the PMS generates control commands for microgrid utilities to ensure reliable and cost-effective microgrid operation. Since the non-dispatchable sources utilize renewable energy, they are extracted to the maximum extent possible. If demand is still not fulfilled, ESS can be an option based on the SoC level. The extraction of dispatchable sources and utility grid is dependent on the DGT.
3.1. System Constraints
To execute the optimization effectively, the following operational and system constraints are considered.
3.1.1. DER Output
The capacity of the DERs and ESS integrated into the microgrid is carefully selected based on the anticipated variations in load demand to ensure system stability. The output power of the DERs must be constrained within defined operational limits. Similarly, the SoC of the ESS must remain within practical boundaries to ensure reliable and sustainable operation.
The subscripts LL and UL denote the lower limit and upper limit, respectively. The upper limit of DERs output varies from zero to their respective maximum capacities, which are specified as 1.5 MW for Solar PV, 1 MW for Natural Gas Generator in grid-connected mode, 1.55 MW for NGG in islanded mode, and 500 kW for the Energy Storage System (ESS). Additionally, the lower and upper SoC limits for the ESS are set to 20% and 80%, respectively.
3.1.2. System Voltage and Frequency
During the operation of the CPMS, system voltage and frequency constraints are considered. In steady-state conditions, the maximum observed voltage deviation at any bus ranges from 0.9 to 1.15 p.u., while the frequency deviation remains within 59.9 to 60.1 Hz.
3.1.3. Power Mode
The power mode is declared by comparing the power generated by the solar PV generator with the connected load as given in Equation (10).
3.2. Grid-Connected Mode
3.2.1. Working of GTSA Algorithm
In grid-connected mode, the CPMS employs a Grid tariff-based source allocation (GTSA) algorithm driven by system constraints. The algorithm is designed to regulate the DER generation based on the dynamic grid tariff (DGT), power mode, and SoC of the ESS.
The CPMS continuously monitors the grid tariff and prioritizes the natural gas generator under high grid tariff (HGT) conditions due to its economic viability, whereas the utility grid is preferred under low grid tariff (LGT) conditions.
The objective of the GTSA is to optimize power allocation while ensuring economic efficiency, without necessitating any load curtailment as given in Equation (11).
where
is the connected load,
is the generation by Solar PV,
is the generation by natural gas-based generator,
is power contributed by the ESS,
is power imported from the grid, and
is power exported to the grid.
The proposed PMS is categorized into four distinct operational scenarios based on the DGT and the power produced by the solar PV generator, as outlined in
Table 4.
Scenario 1: High Grid Tariff; Sufficient Power Mode
Given the high grid tariff, the natural gas generator (NGG) is the preferred source over the utility grid, except when the power demand exceeds the maximum capacity of the NGG. The next steps of the GTSA are as follows,
Step 2 If the condition in (12) is true, ESS will be in a floating condition while excess power can be exported to the grid.
Step 3 If the condition in (12) is false, the ESS is charged until the SoC reaches the upper limit and exports the remaining power to the grid if any.
Scenario 2: High Grid Tariff; Insufficient Power Mode
In this scenario, the next steps of the GTSA are as follows,
where UL and LL are the upper and lower limits of the SoC of the ESS, respectively. If the SoC limits of the ESS fall under the condition given in (13), solar PV (PPV) and ESS (PESS) combinedly checked for demand (PLoad) matching as given in Equation (14).
If satisfied, the load can be met without any power transaction from the utility grid which makes the operation more economical, otherwise natural gas-based generator (NGG) delivers unmatched demand, based on the capacity of NGG.
Step 2 If, combinedly, all DERs and ESS are not sufficient to meet the demand, the utility grid is extracted to make the system reliable though it makes the system operation uneconomical.
Step 3 In case the SoC of ESS is less than the lower limit, only DERs are the available option to meet the demand if sufficient, as given in Equation (15), else the utility grid is extracted.
Scenario 3: Low Grid Tariff; Sufficient Power Mode
In this case, NGG is always in a floating condition. As the grid is in an LGT Situation. Based on the Soc level of ESS, it will be either in charging mode or in floating condition, as given in Equation (16).
Scenario 4: Low Grid Tariff; Insufficient Power Mode
In this case, the solar PV generator and utility grid together meet the load demand addition to this if the SoC level of the ESS is less than the upper limit, it is charged by extracting the utility grid as it provides cost-effective power in LGT. Power distribution is given in Equation (17).
The detailed pseudo-code for the GTSA algorithm is given in Algorithm 1.
| Algorithm 1: Grid tariff-based source allocation (GTSA) algorithm |
| 1 | Input:
Status of CB at POI (CBPOI)
Dynamic Grid Tariff (DGT)
Power Generation by Solar PV (PPV(t)) Connected load (PLOAD(t))
SoC level of the ESS |
| 2 | Output: Control command to NGG and ESS |
| 3 | Start |
| 4 | Status of the grid: Check the status of CBPOI and determine the mode of the microgrid according to Equation (9), proceed to the next step if the microgrid is in grid-connected mode, else signal the CPMS for Islanded mode. |
| 5 | Check for DGT: Check for the DGT. |
| 6 | If LGT, Stalls NGG and follows the next steps |
| 7 | Check for the Power Mode in LGT |
| 8 | If SPM, Check for the surplus power
If, surplus power, check for the SoC of the ESS
If SoC > (SoC)UL; ESS is in floating condition
Else do Charge the ESS
If still surplus power is available send it back to the grid.
Else End the if loop
Else Implement IPM condition and check for the SoC of the ESS
If SoC > (SoC)UL; ESS is in floating condition
Else charge the ESS until (SoC)UL
If power is balanced end the If loop
Else extract from the utility grid and end the If loop |
| 9 | If HGT, follows the next steps |
| 10 | Check for the Power Mode in HGT |
| 11 | If SPM, Check for the surplus power
If, surplus power, check for the SoC of the ESS
If SoC > (SoC)UL; ESS is in floating condition
Else do Charge the ESS
If still surplus power is available send it back to the grid.
Else End the if loop
Else Implement the IPM condition and check for the SoC of the ESS
If SoC > (SoC)UL; discharge the ESS and check for the power balance
If Power is balanced end the If loop
Else Start the NGG and check for the power balance
If Power is balanced end the if loop
Else extract power from the utility grid, end the If loop |
| 12 | End |
3.2.2. Results for Grid-Connected Mode
In grid-connected mode, the utility grid operates as the master, providing voltage and current references for all distributed energy resources (DERs) and energy storage systems (ESS). The 24 h load profile, as presented in
Table 1, is analyzed in the context of its connection with the microgrid. In grid-connected mode, power is supplied to consumers regardless of priority.
The generation from solar PV is modeled as a variable resource dependent on hourly solar irradiance. The Energy Storage System is permitted to supply power only when the SoC is within the range of 20% (lower limit) to 80% (upper limit). The natural gas-based generator supplies power only under HGT conditions; otherwise, it remains in a stalled state. The power balance is maintained such that all voltage and frequency constraints are satisfied.
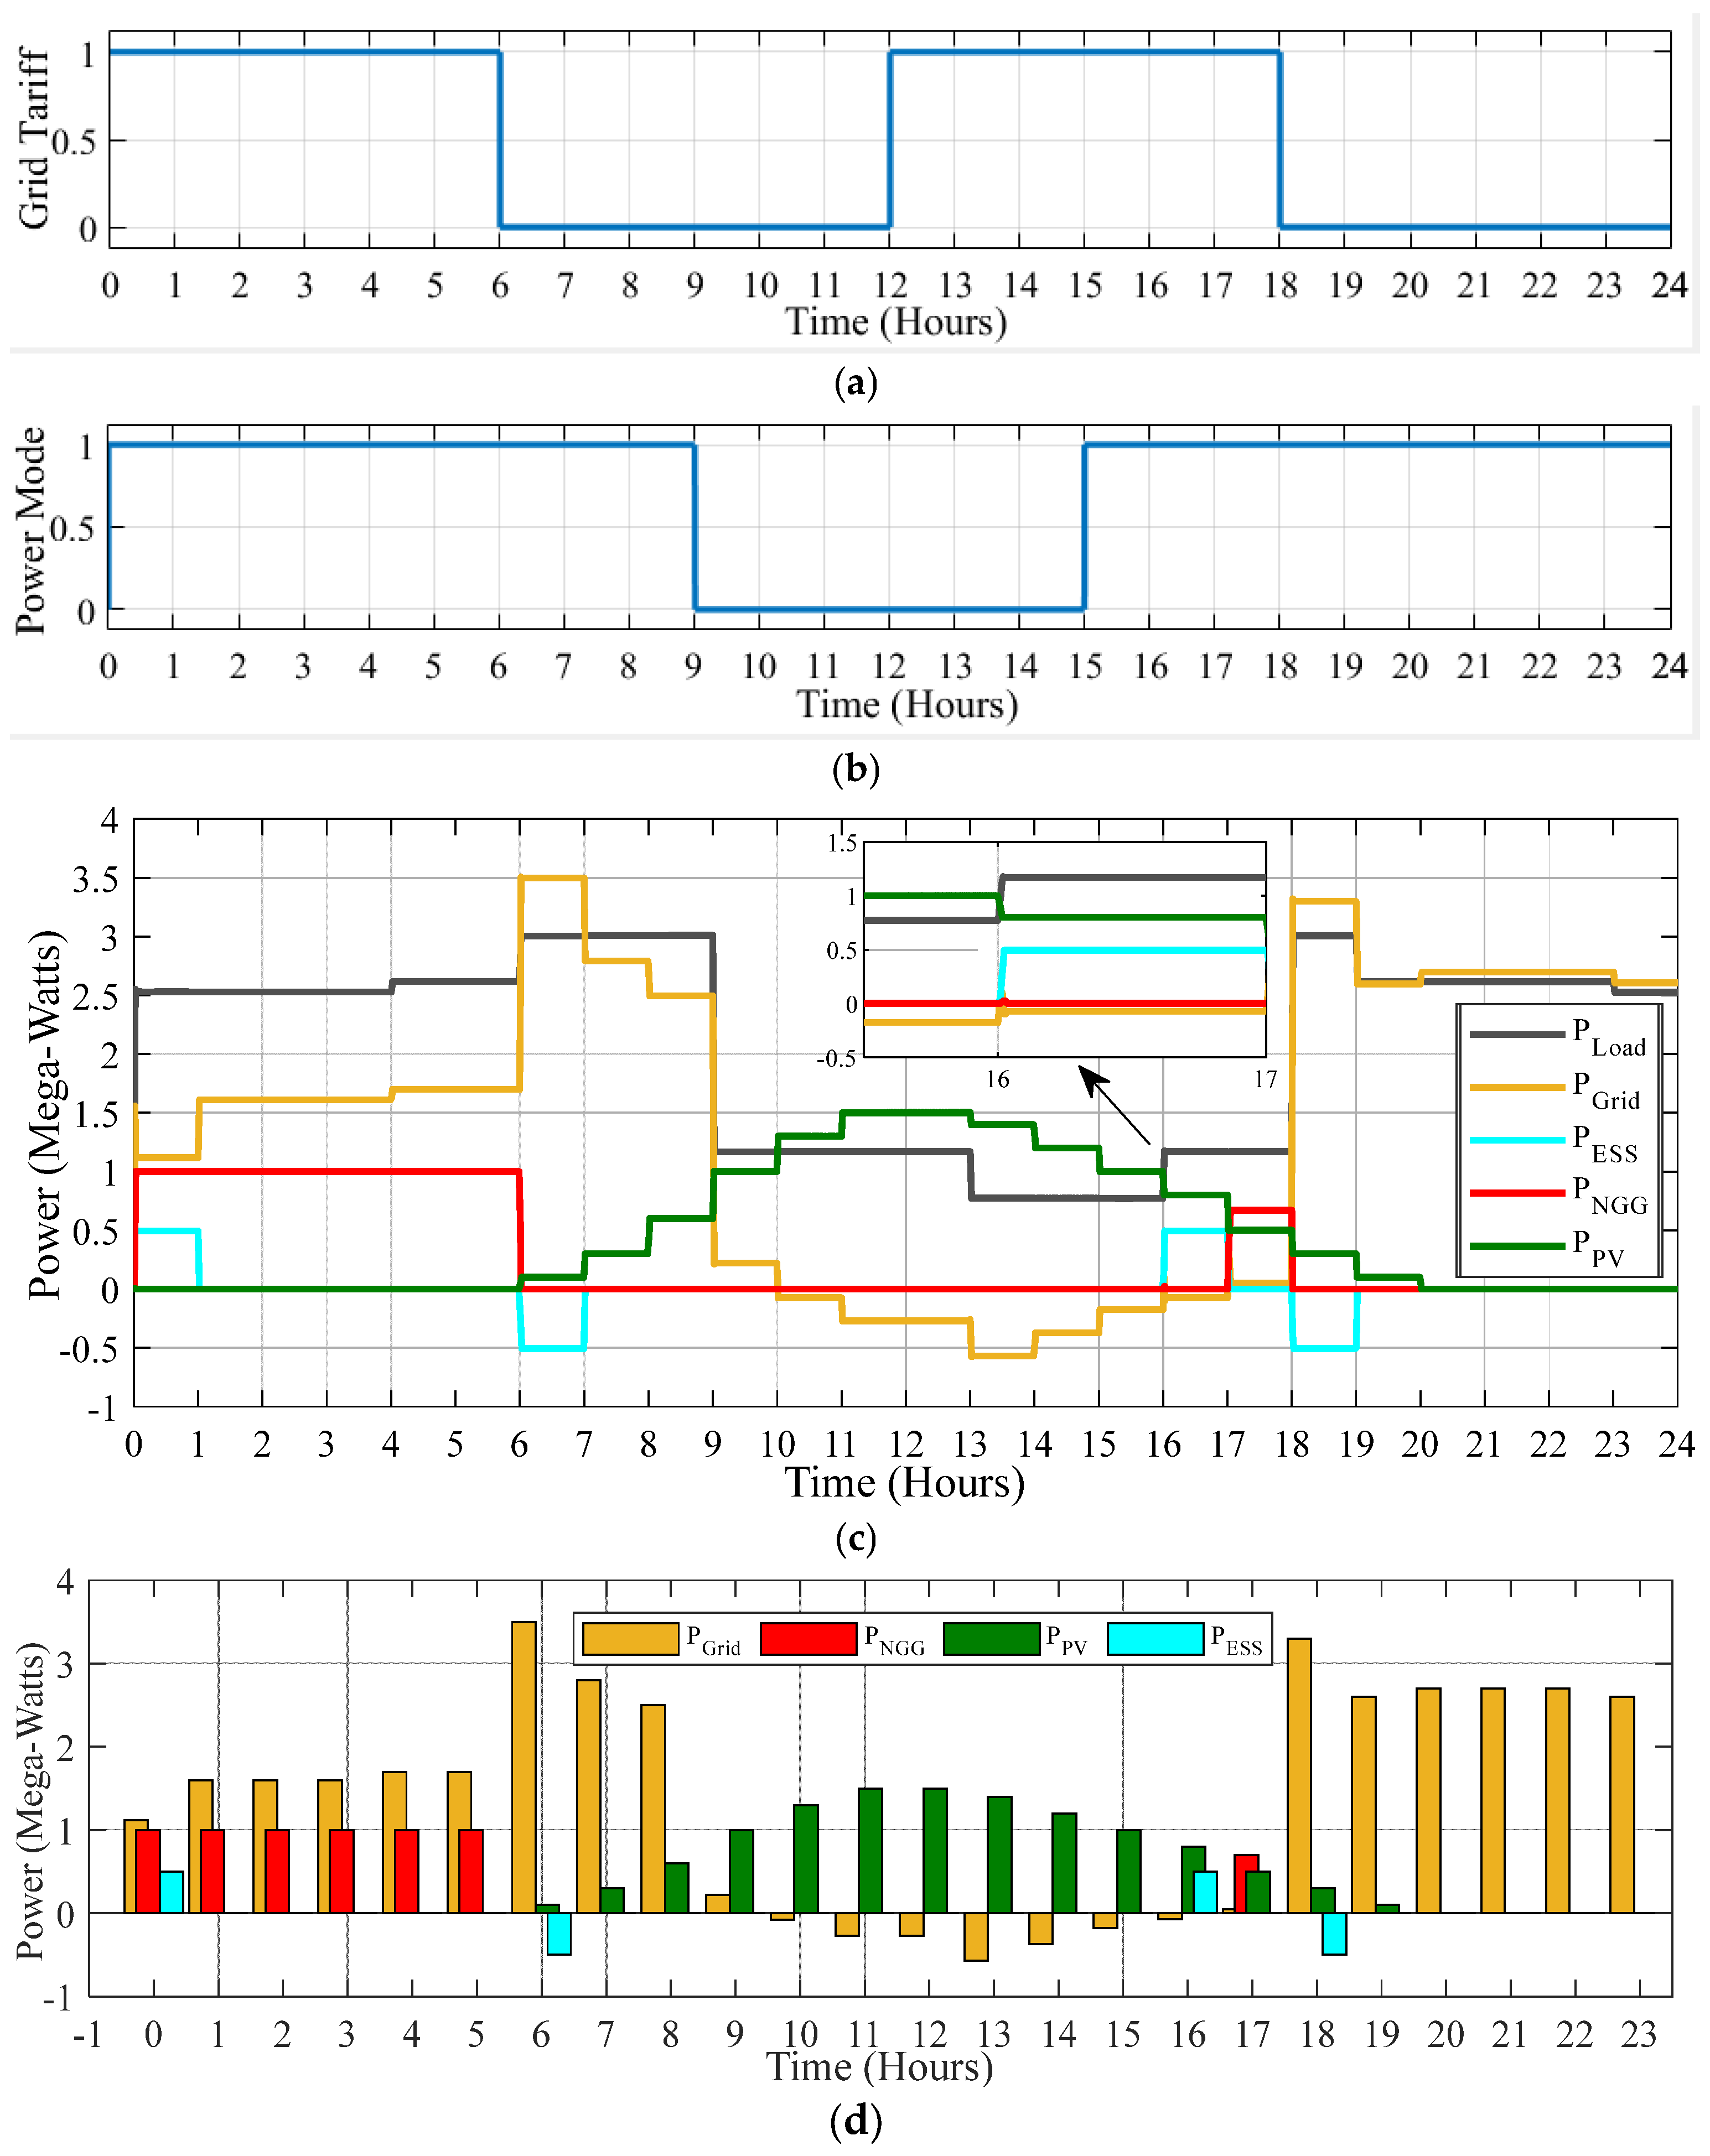
In the implementation of the GTSA algorithm in grid-connected mode, the HGT and LGT conditions are represented using logic values of 1 and 0, respectively, as shown in
Figure 10a. Similarly, based on the load demand and the power generation from the solar PV generator, the CPMS determines the operational mode between IPM and SPM. For a realistic microgrid analysis, this work incorporates real-time dynamic load profiles, enhancing its applicability to practical power system operations.
Once the CPMS detects that the CBPOI status is ON, it employs the grid tariff-based source allocation (GTSA) algorithm. The 24 h period is segmented into four regions, each spanning six hours, based on the DGT, as described below,
- ➢
From 00:00 h to 05:00 h
During this period, the tariff is high as shown in
Figure 10a, indicating that priority is given to the NGG before drawing power from the grid. During this period, which corresponds to the IPM case as shown in
Figure 10b the NGG is drained to its maximum limit of 1 MW as the load remains high, as expressed in Equations (14) and (15). At the beginning of the operation (00:00 h), ESS is initially assumed to be at the upper SoC level and delivers a constant power output of 500 kW over the subsequent one-hour interval to meet the load demand. The remaining power requirement of 1.15 MW is supplied by the utility grid, as illustrated in
Figure 10c, to ensure full load demand fulfillment.
The condition of all the microgrid utilities, DGT, and power mode in this scenario is given in
Table 5.
- ➢
06:00 h to 11:00 h
During this period, the grid tariff is low, and solar irradiance begins to increase. The ESS is fully charged within the first hour. The Natural Gas-based Generator (NGG) remains inactive. The remaining load demand of 3 MW is supplied by the utility grid as shown in
Figure 10c. During the 10th and 11th hours, the solar PV generation is 1.4 MW and 1.5 MW, respectively, and the connected load is 1.2 MW hence power mode transitions from IPM to SPM as shown in
Figure 10b, enabling the microgrid to export excess power to the grid.
- ➢
12:00 h to 17:00 h
During this period the grid tariff again becomes high, due to higher solar irradiance and reduced connected load (as in the case of SPM), and the excess generated power is exported to the utility grid. At the 16th hour, the power mode transitions to IPM, leading to the depletion of the ESS. Subsequently, at the 17th hour, the NGG is activated to compensate for the demand gap.
- ➢
18:00 h to 23:00 h
During this period, the grid tariff decreased again, leading to the stall of NGG operation, while the ESS began charging. The demand is exclusively met by solar PV and the utility grid for the 18th and 19th hours, and solely by the utility grid from the 20th to 23rd hour. During the complete grid-connected mode, the CPMS employs the GTSA algorithm to allocate power sources based on grid tariffs while ensuring no load curtailment.
The hourly condition of the microgrid during grid-connected mode is given in
Table 5.
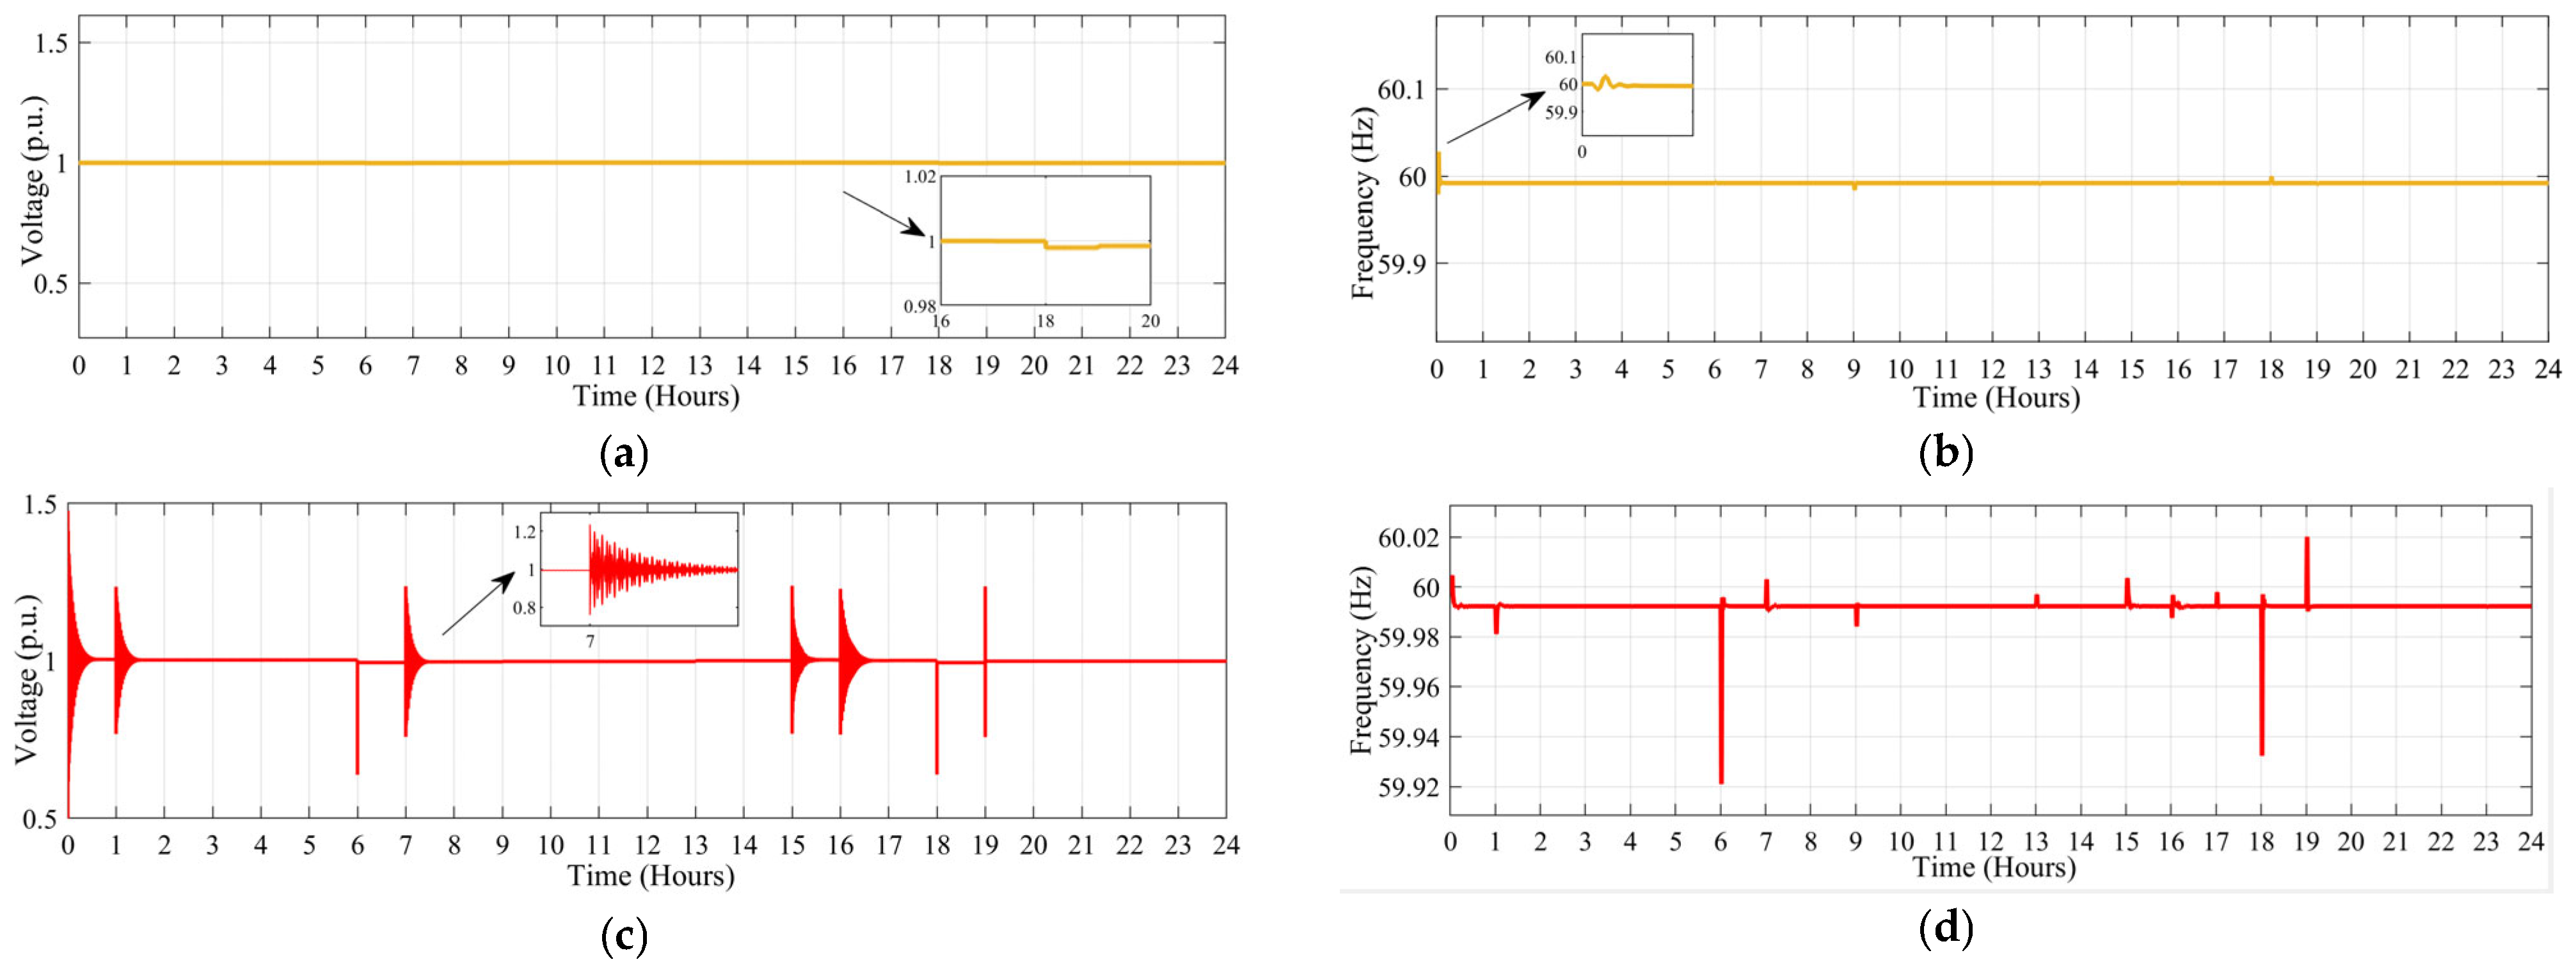
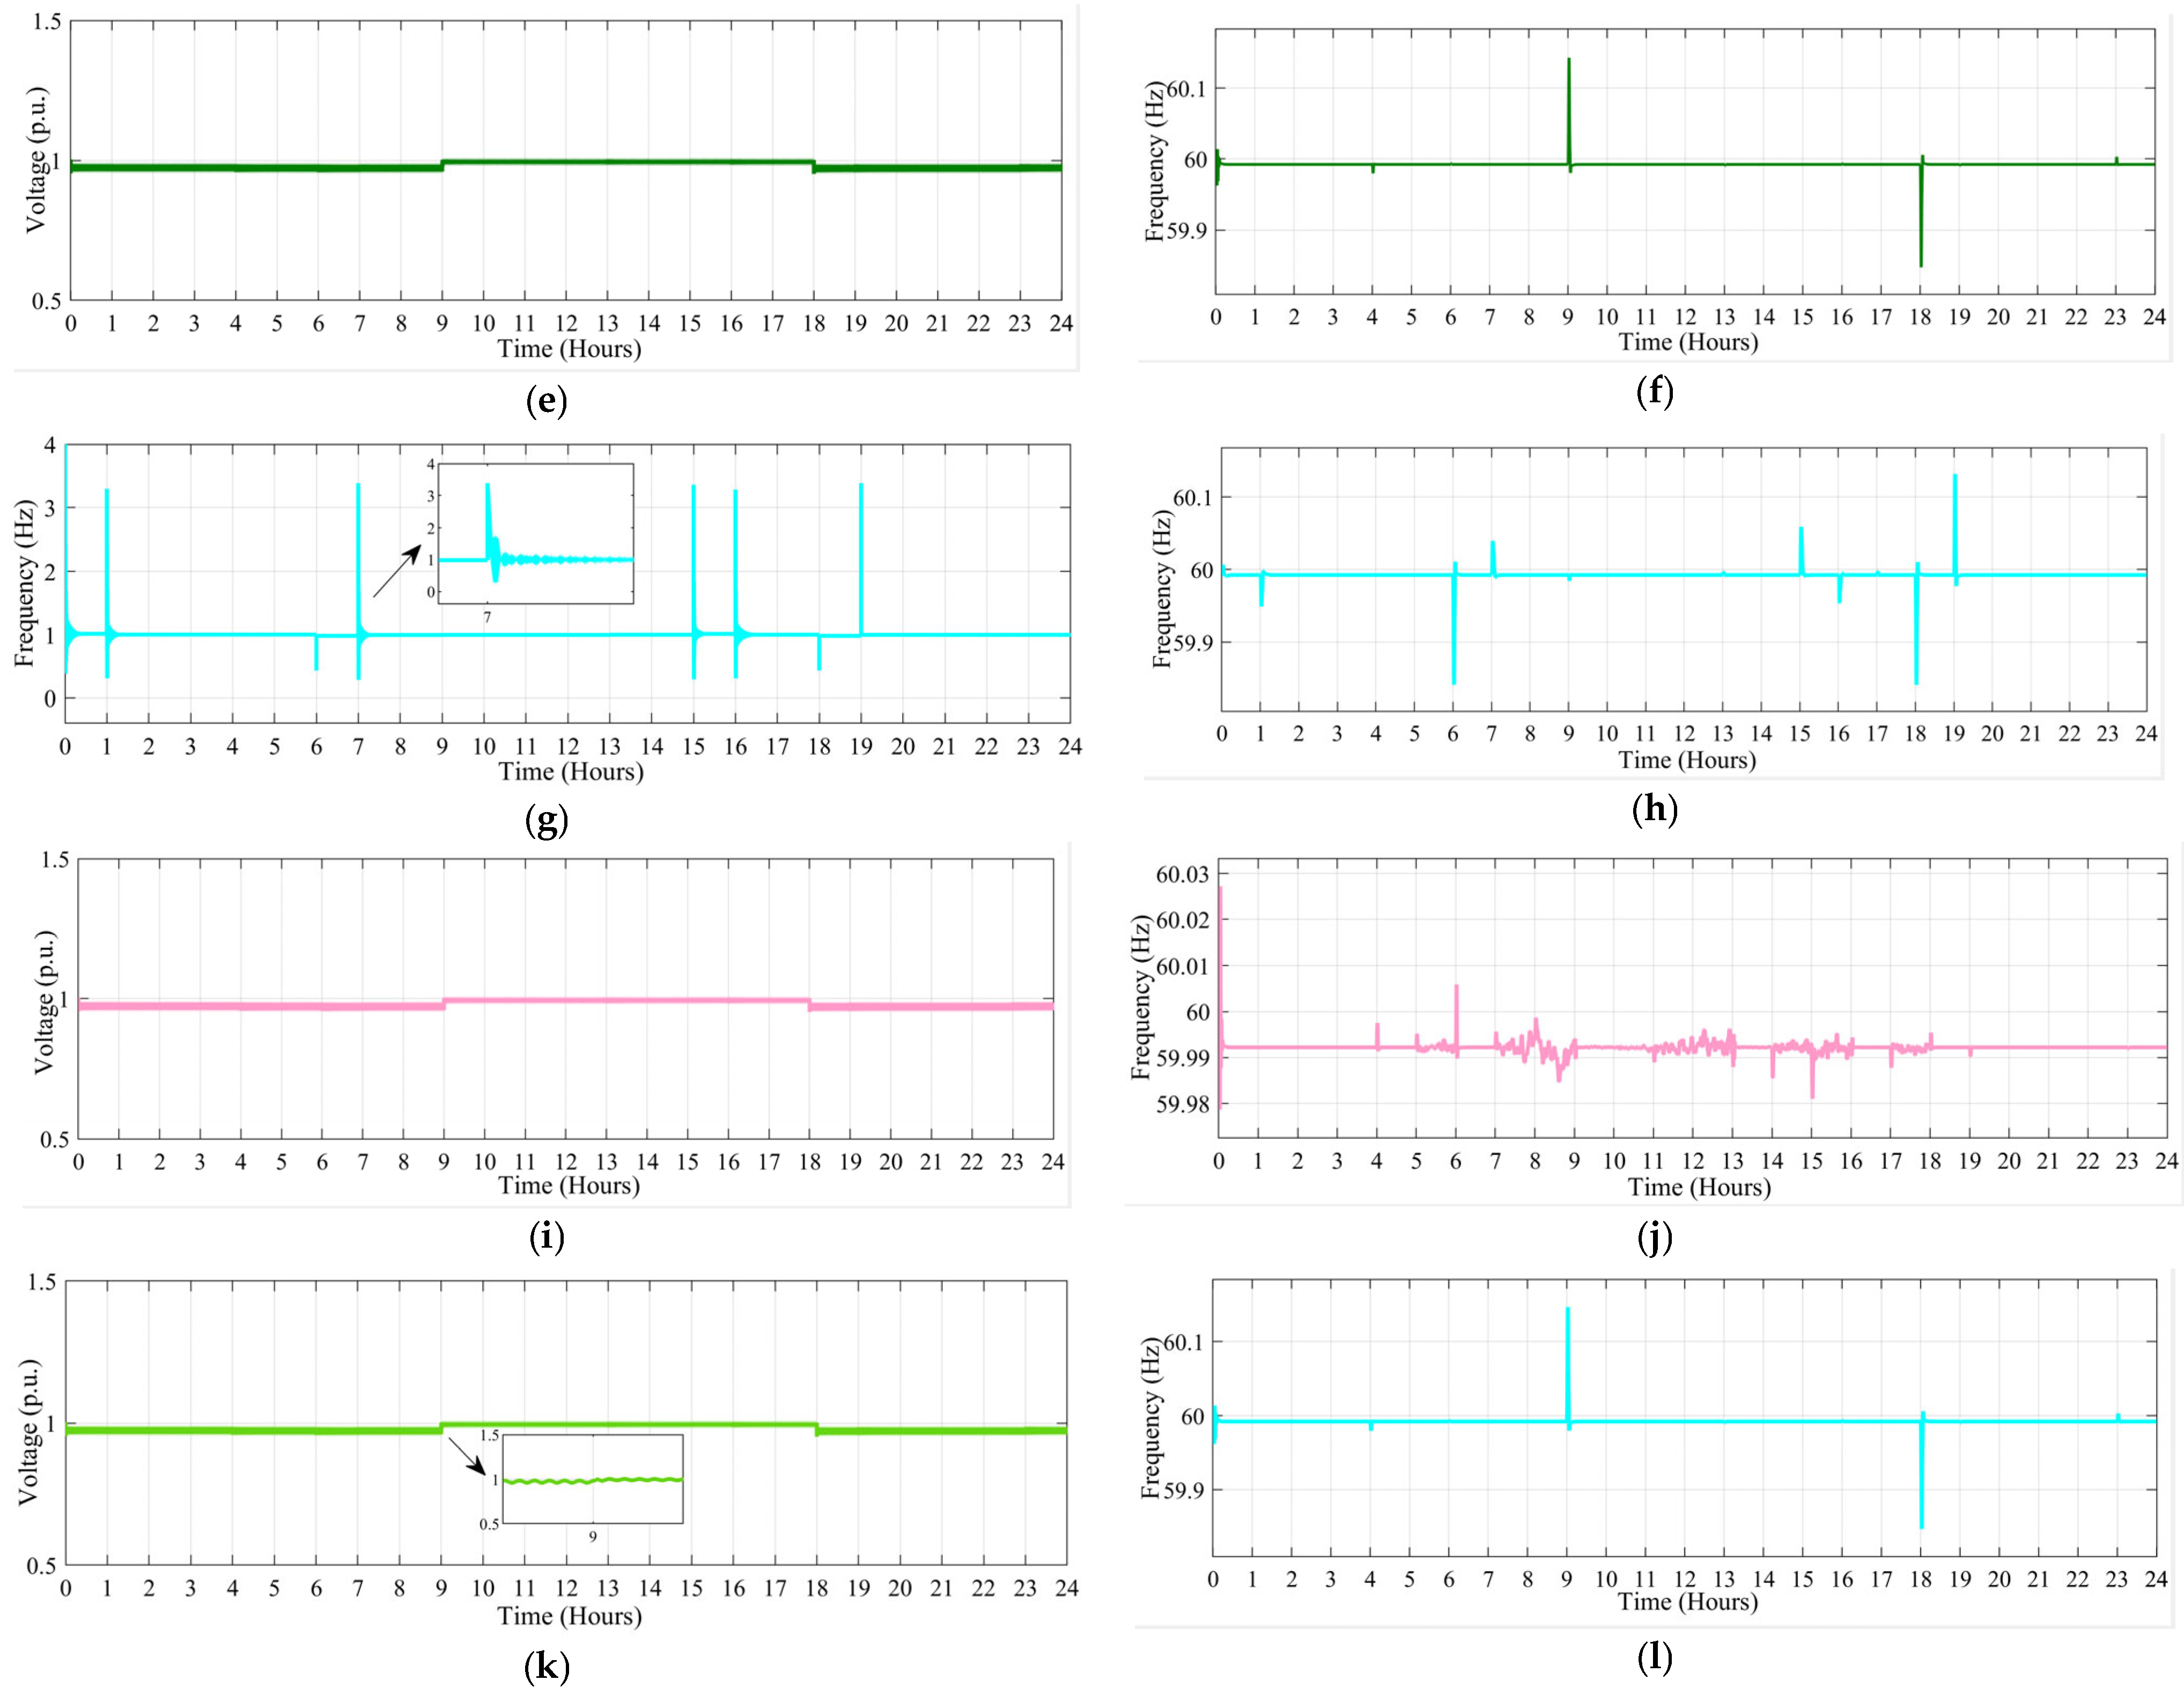
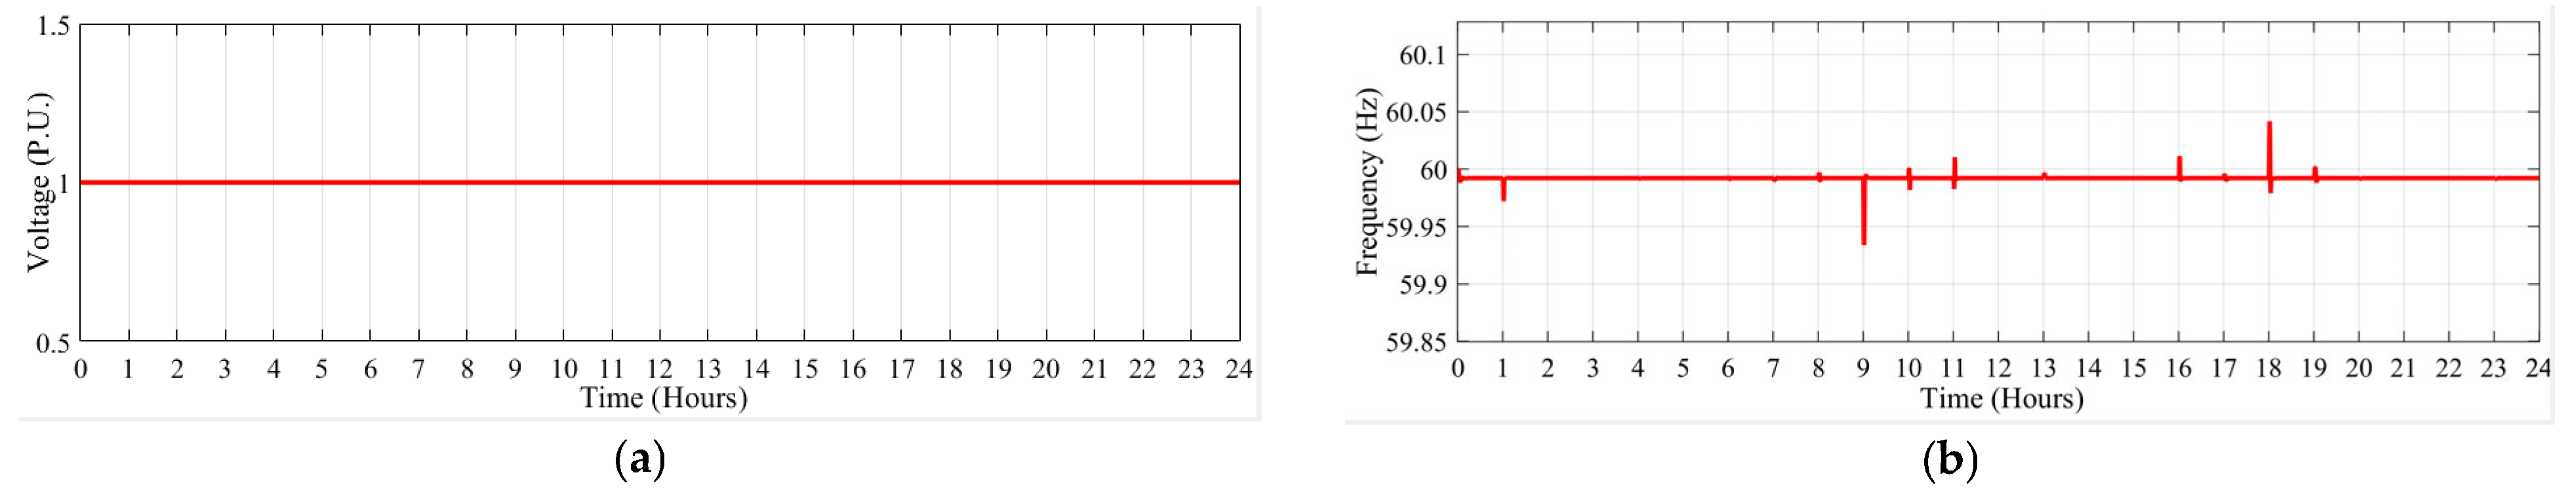
The voltage and frequency during the complete grid-connected mode remain within the specified limits, as shown in
Figure 11. For instance,
Figure 11c,d illustrate the 24 h variations in voltage and frequency at the bus where the Natural Gas Generator (NGG) is connected. Observing these figures, it is evident that both parameters stabilize within their permissible limits after an initial transient. Similarly, the voltage and frequency at the far-end load bus also converge to their final values, as depicted in
Figure 11i,
Figure 11j,
Figure 11k, and
Figure 11l, respectively.
3.3. Islanded Mode
3.3.1. Working of WPPCA Algorithm
During islanded mode, the total generation may be insufficient to meet the load demand. In the event of insufficient power availability, a priority-based load-shedding and restoration strategy is implemented to ensure optimal microgrid operation. By obtaining the circuit breaker status at the POI (CBPOI), the CPMS implements the WPPCA algorithm. In SPM, the microgrid operates without load curtailment, whereas in IPM, load shedding is performed based on priority to ensure optimal system operation. If the generation exceeds the connected load, the load restoration mechanism is initiated.
The WPPCA algorithm determines whether load shedding or restoration is required by evaluating the disparity between the total available power and the connected demand at a given time instant. The priority of the load is determined based on its importance, and load shedding is carried out in accordance with the assigned priority index. The load with the lowest priority index and consumer weight is shed first, whereas the load with the highest priority index and consumer weight is restored first.
where
is the total power generation in microgrid in islanded mode. The parameter α assumes a value −1 and 1, corresponding to the charging and discharging conditions, respectively. β adjusts its value based on the difference between PV generation, ESS conditions, and the connected load, ranging from 0 to 1.
The CPMS continuously evaluates the total power generation within the islanded microgrid at any given time instant as given in Equation (18) and determines the necessity of load shedding and restoration accordingly.
The instantaneous demand is defined as the aggregate of all connected loads at a given time and is expressed in Equation (19),
where
is the status of LCCB connected to
jth priority of
ith load and it is o and 1 for open and closed conditions, respectively.
is the power demand by the to
jth priority of
ith load WPPCA algorithm is formulated to prioritize the supply of all critical loads without any curtailment.
- ➢
Load Prioritization
The load-prioritization process is executed based on the Load Priority Factor (LPF), ensuring that critical loads are prioritized and served first. Subsequently, priority is assigned to loads in the high-priority category, giving precedence to those with the maximum number of connected consumers, followed by loads in descending order of consumer weight, where loads with the highest consumer weight receive the highest LPF.
Once the priority factor is assigned to all high-priority category loads, the same procedure is applied sequentially to medium- and low-priority category loads until all priority category loads are assigned a priority factor value. The LPF is formulated as a rule-based function of the consumer weight and priority index, as presented in Equation (20). Priority is first given to
in assigning the Load Priority Factor (LPF), followed by the Priority Index
. In cases where multiple loads have the same consumer weight, the load having a higher priority index will be assigned a higher LPF.
where
and
are the number of consumers connected and priority index of
jth priority of
ith load, respectively. The pseudocode for the WPPCA algorithm is presented in Algorithm 2 below.
An objective function is formulated based on the priority factor to maximize the number of consumers supplied as given in Equation (21).
| Algorithm 2: Weighted Priority under Priority-Based Consumer allocation (WPPCA) algorithm |
| 1 | Input:
Status of CB at POI (CBPOI)
Power Generation by Solar PV (PPV(t))
Connected load (PLOAD(t))
SoC level of the ESS
Load Shedding and restoration Factor, and number of consumers connected to each category of load. |
| 2 | Output: Control command to NGG and ESS, and Loads |
| 3 | Start |
| 4 | Island detection: Check the status of CBPOI and determine the mode of the microgrid according to Equation (9), proceed to the next step if the microgrid is in Islanded mode, else signal the CPMS for grid-connected mode. |
| 5 | Check for the Power Mode |
| 6 | If SPM, Check for the surplus power
If, surplus power, check for the SoC of the ESS
If SoC > (SoC)UL; ESS is in floating condition
Else do Charge the ESS
If still surplus power is available send it through the tie-line.
Else End the if loop
Else Implement IPM condition and check for the SoC of the ESS
If SoC > (SoC)UL; discharge the ESS, and check for the power balance by Equation (14)
If power is balanced, end the If loop
Else Connect the NGG, and check for the power balance.
If Power is balanced end the If loop
Else Start the Load shedding and follow the next step. |
| 7 | Weighted Priority-Based load shedding |
| 8 | Determine the order of the Priority factor from Equation (20) and connected consumer from Table 1
Shed the loads according to the previous step until the power is balanced
Restore the loads based on the restoration factor from Equation (20) until the power-balanced |
| 9 | End |
The priority factor according to consumer weight and priority index is given in
Table 6- ➢
Priority-Based Load Restoration
Load restoration follows the inverse sequence of load shedding, implying that the load shed first, as per Equation (21), will be restored last, whereas the load shed last will be restored first. The decision for load shedding or restoration is determined by sorting the elements of Equation (21) in descending order for load shedding and ascending order for load restoration.
The Load Priority Factors corresponding to various load priority levels and categories are presented in
Table 6. In the Weighted Priority under Priority-Based Consumer Allocation (WPPCA) algorithm, the Load Priority Factor (LPF) is assigned based on the load category, priority level of the loads, as specified in
Table 1, and the consumer weight, which represents the number of consumers connected to each category.
For instance, as shown in
Table 6, the highest number of consumers are connected to the high-priority segment of L8, and thus, it is assigned an LPF value of 4.0. This is followed by the high-priority segment of L9, which is assigned an LPF value of 3.9. Once all high-priority loads have been assigned an LPF, the medium-priority loads are assigned LPF values using the same procedure, as outlined in
Table 6. A similar approach is applied to determine the LPF values for low-priority loads. The WPPCA algorithm can be described through the following possible scenarios.
- ➢
Scenario 1: IPM; Priority-based load shedding
In this scenario, the combined capacity of all DERs and the ESS is insufficient to meet the load demand. Consequently, the load deficit, representing the shortfall between total generation and demand, must be curtailed, as expressed in Equation (22)
where
is the total connected load,
is the available power in islanded mode defined as per Equation (18), and
denotes the portion of load demand that must be curtailed to balance generation and demand, and determined as the direct difference between the connected load and the available generation at a given moment. This mismatch is resolved by curtailing loads based on their assigned priority levels to ensure the stable operation of the microgrid. The proposed algorithm curtailed the load according to the predefined Load Priority Factor, as detailed in
Table 6. The algorithm terminates further load shedding once the curtailed load equals the predefined threshold as per Equation (22).
- ➢
Scenario 2: IPM; Rise in Power generation
In this scenario, the microgrid continues to operate under the Insufficient Power Mode (IPM). However, a sudden increase in generated power such as a rise in solar irradiance, as given in Equation (18) results in excess available power which reduces the as per Equation (22). The proposed WPPCA algorithm optimally allocates excess available power among the loads following a priority-based load restoration strategy as given in Equation (21), ensuring efficient and reliable microgrid operation.
- ➢
Scenario 3: SPM; No load shedding
In the islanded mode of operation, the microgrid transitions from insufficient power mode (IPM) to sufficient power mode (SPM), where the load demand equals the generated power and hence according to Equation (22) is zero. This equilibrium condition can arise due to one of the following two scenarios,
Increase in Generated Power Without Load Variation—The DERs within the microgrid increase their power output while the connected load remains unchanged.
Reduction in Connected Load With Constant Generation—The total load demand decreases while the generated power remains unaltered.
When the microgrid operates in the Sufficient Power Mode (SPM), no load curtailment is required. Moreover, during the transition from the Insufficient Power Mode (IPM) to SPM, all loads are fully restored, irrespective of their priority levels.
3.3.2. Results for Islanded Mode
In islanded mode, an additional unit of the NGG with a capacity of 550 kW is deployed as the master unit, providing voltage and frequency reference signals to other DERs and the ESS. Once the CPMS detects the opening of the CBPOI, it immediately utilizes the WPPCA algorithm to optimize microgrid operation by maximizing the number of supplied consumers while minimizing load shedding.
The WPPCA algorithm optimally allocates the available power generation while curtailing no critical load. The algorithm prioritizes load distribution by first supplying high-priority loads, sorted in descending order based on the number of connected consumers. Subsequently, it allocates power to medium-priority loads, followed by low-priority loads, and finally to the trivial-priority loads, if any. The priority index based on consumer priority and weight is given in
Table 6. In islanded mode, there is a possibility of SPM. To address this, a circuit breaker
installed at Bus No. 13, facilitating the connection between the microgrid and another microgrid within the same cluster. This configuration enables power export through the tie-line to adjacent microgrids. The operation of the
depends on the status of
CBPOI and power mode.
In Equation (23), the circuit breaker (CB) connected to the tie-line () is activated (ON state) only when its binary status variable is equal to one. This condition is satisfied if and only if the status of the point-of-interconnection circuit breaker (CBPOI) is open and the microgrid operates in sufficient power mode.
Similarly to the study conducted in grid-connected mode, a 24 h load profile is also considered in islanded mode. The Weighted Priority-Based Consumer Allocation (WPPCA) algorithm is utilized to optimally allocate consumers, ensuring the maximum number of consumers receive power while operating within the constraints of the available generation capacity from the power sources. Based on the available generation and connected load, the day-wide status of all Load-Connected Circuit Breakers (LCCBs) determined using the WPPCA algorithm is presented in
Table 7. The operation of the microgrid in islanded mode, based on the scenarios described in
Section 3.3.1, is detailed below.
- ➢
00:00 h to 05:00 h
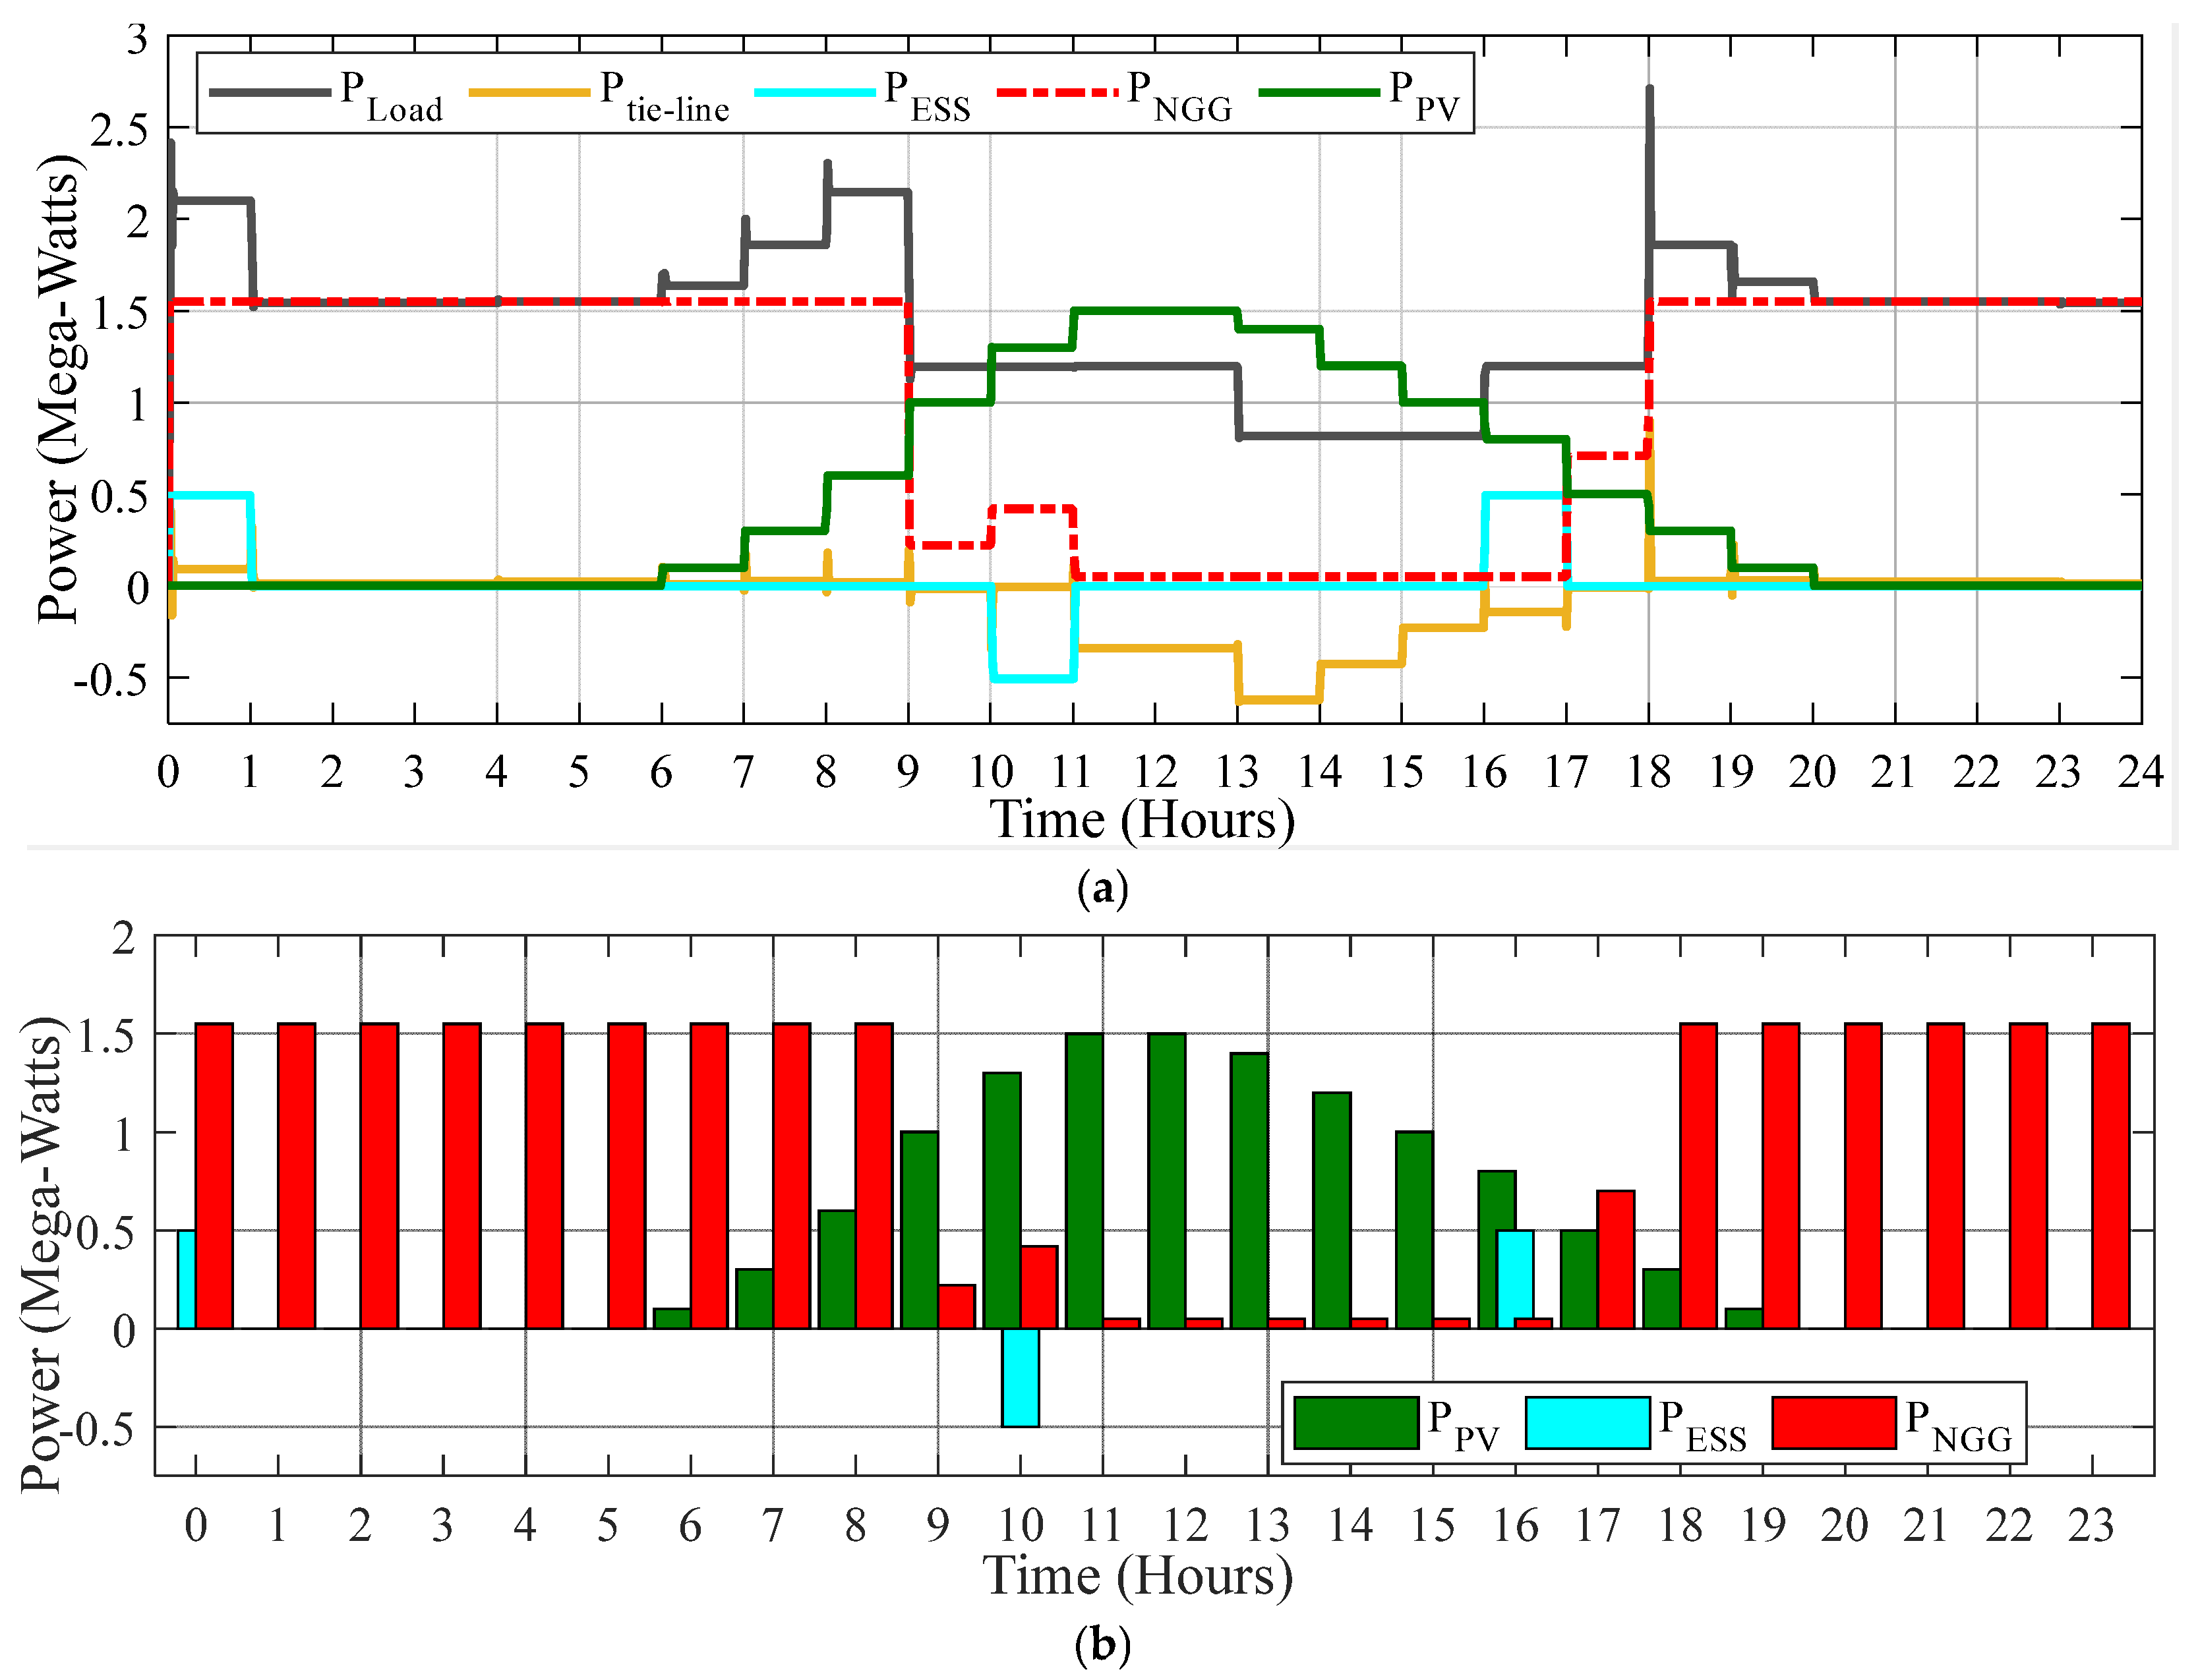
During the first hour, as depicted in
Figure 12a, the available power source is only the Natural Gas Generator (NGG), operating at its maximum capacity of 1.55 MW. This is due to the ESS having discharged to its lower SoC (20%) in the previous period, while the solar PV system remains non-operational due to zero irradiance during nighttime. According to Equation (18), the total available power during this period is 1.55 MW. From
Figure 12c, it is observed that the total connected load for this period is 2.55 MW. Based on Equation (22), a load shedding of 1.07 MW is required to maintain a power balance between generation and demand. The proposed Centralized Power Management System (CPMS) utilizes a Weighted Priority-Based Consumer Allocation (WPPCA) algorithm implemented at the PDC to optimize load-allocation sequences. The algorithm dynamically prioritizes seven load categories (L1–L5, L8, and L9), excluding L6 and L9 due to their zero-power demand during the observed operational period as given in
Table 1. When the WPPCA algorithm initiates load prioritization, it follows the Load Priority Factor (LPF) approach, starting with the high-priority load category that has the maximum number of connected consumers. In this scenario, the load prioritization process follows a predefined sequence. Initially, power is allocated to all critical loads (600 kW) and high-priority loads (350 kW). The remaining available power for allocation to medium, low, and trivial priority loads is 539 kW, determined as 1.55 MW-L
CL-L
HPL. The available power of 539 kW is first allocated to the medium-priority loads. However, since the total connected load of medium-priority demand is 713 kW, the available generation capacity is insufficient to fully supply all medium-priority loads, consequently leaving a subset of medium-priority loads unsupplied. Furthermore, under this power deficit condition, low-priority and trivial-priority loads remain entirely unsupplied. The allocation begins with the highest-LPF loads L8M (252.9 kW, LPF = 3.0), L9M (175 kW, LPF = 2.9), L3M (80 kW, LPF = 2.7), and L2M (68 kW, LPF = 2.6). After supplying power up to L2M, the remaining available power drops below 50 kW. Despite the higher LPFs of L4M (51 kW, LPF = 2.5) and L1M (64 kW, LPF = 2.4), the power constraint prevents their activation. The algorithm supplies L5M (22.5, LPF = 2.2) despite its lower LPF, due to its lower power demand (in the simulation, the actual power demand may exhibit slight deviations from its theoretical value due to voltage variations and line losses). By integrating both the Load Priority Factor (LPF) and power demand, the WPPCA algorithm optimizes power distribution, ensuring maximum consumer allocation while minimizing unutilized available power. During the first hour, the proposed WPPCA algorithm successfully supplied power to 322 out of 543 connected consumers.
- ➢
06:00 h to 09:00 h
The sixth, seventh, and eighth hours of this period correspond to Scenario 2 in
Section 3.3.1, wherein the microgrid operates under the IPM. However, as daylight progresses, the increase in solar irradiance enables the Solar PV system to initiate power generation as shown in
Figure 12a. The solar PV generates 100 kW, 300 kW, and 500 kW during the sixth, seventh, and eighth hour, respectively, as shown in
Figure 12b. Consequently, the proposed WPPCA algorithm facilitates priority-based load restoration during this interval, ensuring that either a subset of the previously curtailed load is reinstated or a new demand with a higher LPF is accommodated. As shown in
Table 7, during the sixth operational hour, load L7, which had remained inactive up to the previous hour, initiated a power demand, thereby altering the system’s load profile. The WPPCA algorithm prioritizes load restoration based on LPFs. Consequently, it restores the critical load L7C (80 kW) and the high-priority load L7H (80 kW, LPF = 3.8) due to their elevated LPFs. Meanwhile, the medium-priority load L2M (68 kW, LPF = 2.6) is shed owing to its comparatively lower LPF. The available power generation over the NGG comprising 100 kW from solar PV and an additional 68 kW obtained from shedding L2M is, thus, optimally allocated to supply the critical load L7C (80 kW) and the high-priority load L7H (80 kW). The operational states of DERs, ESS, and load conditions during this interval are summarized in
Table 8. To facilitate a clear interpretation of the algorithm’s performance. As illustrated in
Table 7, the number of consumers supplied with power during this period is 344, representing an increase compared to the preceding interval. The operational behavior of the microgrid for the remaining time intervals can be analyzed following an analogous methodology.
- ➢
10:00 h to 15:00 h
During this interval, solar power generation reaches its maximum output, while time-dependent loads L8, and L9 cease drawing power from the microgrid. This condition triggers a transition from IPM to SPM, as depicted in
Figure 12a. During this interval, since the photovoltaic power generation (
PPV) exceeds the load demand (
PLoad) during this period, ESS initiates charging at the 10th hour. The ESS continues charging until it attains its maximum SoC limit of 80% in this hour. The solar PV system generates 1.3 MW, while the connected loads (L1 through L7) demand 1.2 MW. Additionally, 500 kW is required to charge the energy storage system (ESS). Under these conditions, the NGG regulates its output by supplying only 400 kW to maintain system balance. Since this period corresponds to a sufficient power mode, no load curtailment is required. As indicated in
Table 7, all LCCBs maintain a closed status throughout the observed duration, ensuring uninterrupted power supply to all 243 connected consumers. From the 10th to the 16th hour the
CBtie-line is closed based on the condition given in Equation (23). Microgrid exports the surplus power through the tie-line, as illustrated in
Figure 12a.
- ➢
16:00 h to 23:00 h
During this interval, the decline in solar irradiance results in a proportional reduction in Solar PV power generation, necessitating additional load curtailment commencing from the 17th operational hour. As the ESS was charged in the preceding period, it discharges during the 16th hour under the given IPM scenario, while the NGG adjusts its output to the minimum value of 50 kW. During this specified hour, the combined generation from the solar PV system and ESS successfully supplied the total connected load of 1.2 MW, encompassing Loads L1 through L7, and fulfilled the power requirements for 243 connected consumers. However, load shedding becomes imperative beyond the 17th hour, as illustrated in
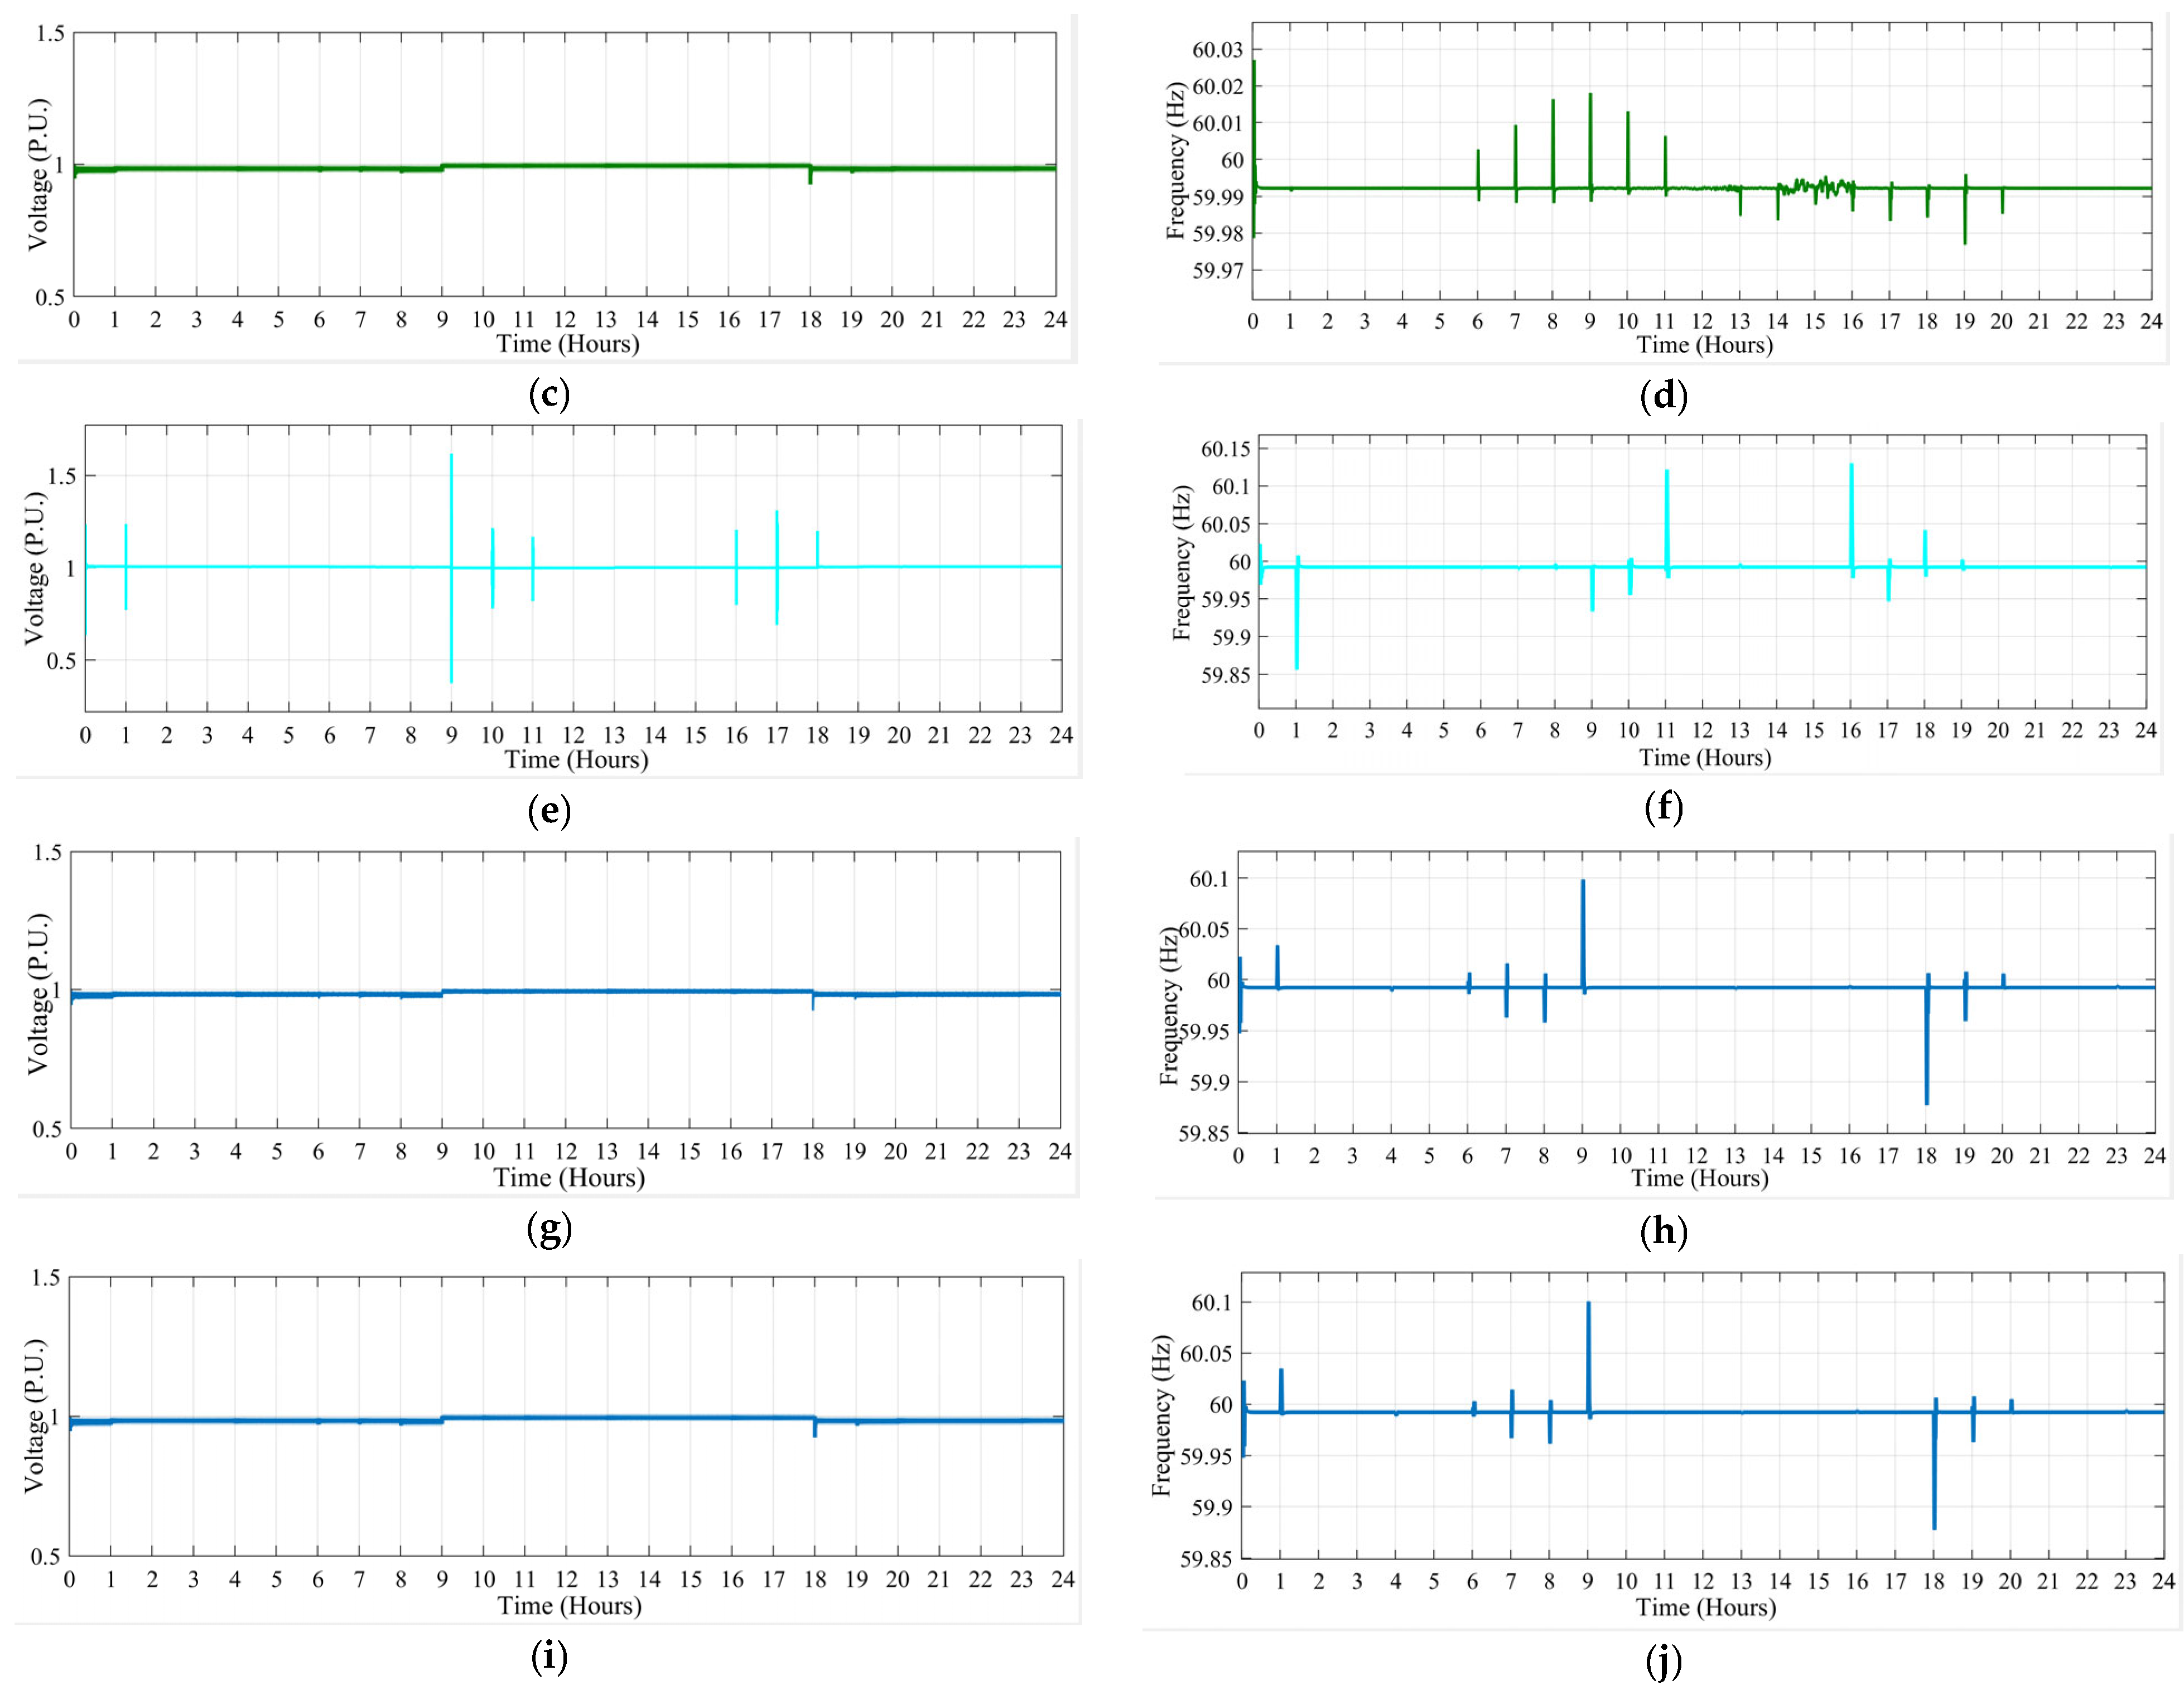
Figure 12a, due to the total load demand surpassing the available generation capacity. The voltage and frequency profiles across the distributed energy resources (DERs), energy storage systems (ESS), and far-end load buses (buses 11 and 13) were monitored over a 24 h period, as illustrated in
Figure 13. The results demonstrate that all parameters converge to their predefined nominal values following a brief transient period, validating the efficacy of the proposed WPPCA algorithm in maintaining system stability.
3.4. Comparison Between WPPCA and PPCA
The performance of the WPPCA algorithm is evaluated against the proposed PPCA algorithm, wherein the latter considers only the priority index without accounting for the number of consumers. Consequently, in the PPCA algorithm, the priority index alone serves as the determining Load Priority Factor (LPF). The results demonstrate that the WPPCA algorithm outperforms the PPCA approach in terms of the number of consumers supplied. This improvement enhances consumer satisfaction and facilitates efficient complaint handling related to outages, thereby benefiting the microgrid operator. The performance of the WPPCA is evaluated in comparison with PPCA. In the PPCA method, the loads are prioritized based on their priority index, as presented in
Table 6. In WPPCA, loads are prioritized based on their priority index and consumer weight, which is determined by the number of consumers connected to a particular priority load, as given in
Table 6.
The WPPCA is designed to meet the demand by prioritizing loads based on consumer priority levels. Initially, the available power is assigned to high-priority loads in descending order of consumer weight. Subsequently, the allocation process is extended to medium-priority loads, followed by low-priority loads, and finally, if any power remains, to the least-priority loads. In scenarios where the available generation capacity is insufficient to meet the total load demand, an optimal load-shedding strategy is implemented based on predefined LPFs. The status of load-connected circuit breakers (LCCB) for the WPPCA scenario is presented in
Table 7. Here, a
✓ symbol denotes a closed circuit breaker,
✗ a symbol indicates an open circuit breaker and a—symbol signifies that the demand for the load connected to the corresponding circuit breaker at that specific time is zero. The number of consumers receiving power is calculated hourly throughout the day concerning the number of consumers connected during each hour. The results of WPPCA are compared with that of PPCA. In PPCA, only consumer priority is considered, while consumer weight is not taken into account. The algorithm sequentially supplies power to high-priority loads in descending order based on the priority index, followed by medium-priority loads, low-priority loads, and finally, the least-priority loads, if any. The status of the LCCB and the number of consumers receiving power compared to the connected consumers for PPCA are presented in
Table 9. By comparing
Table 7 and
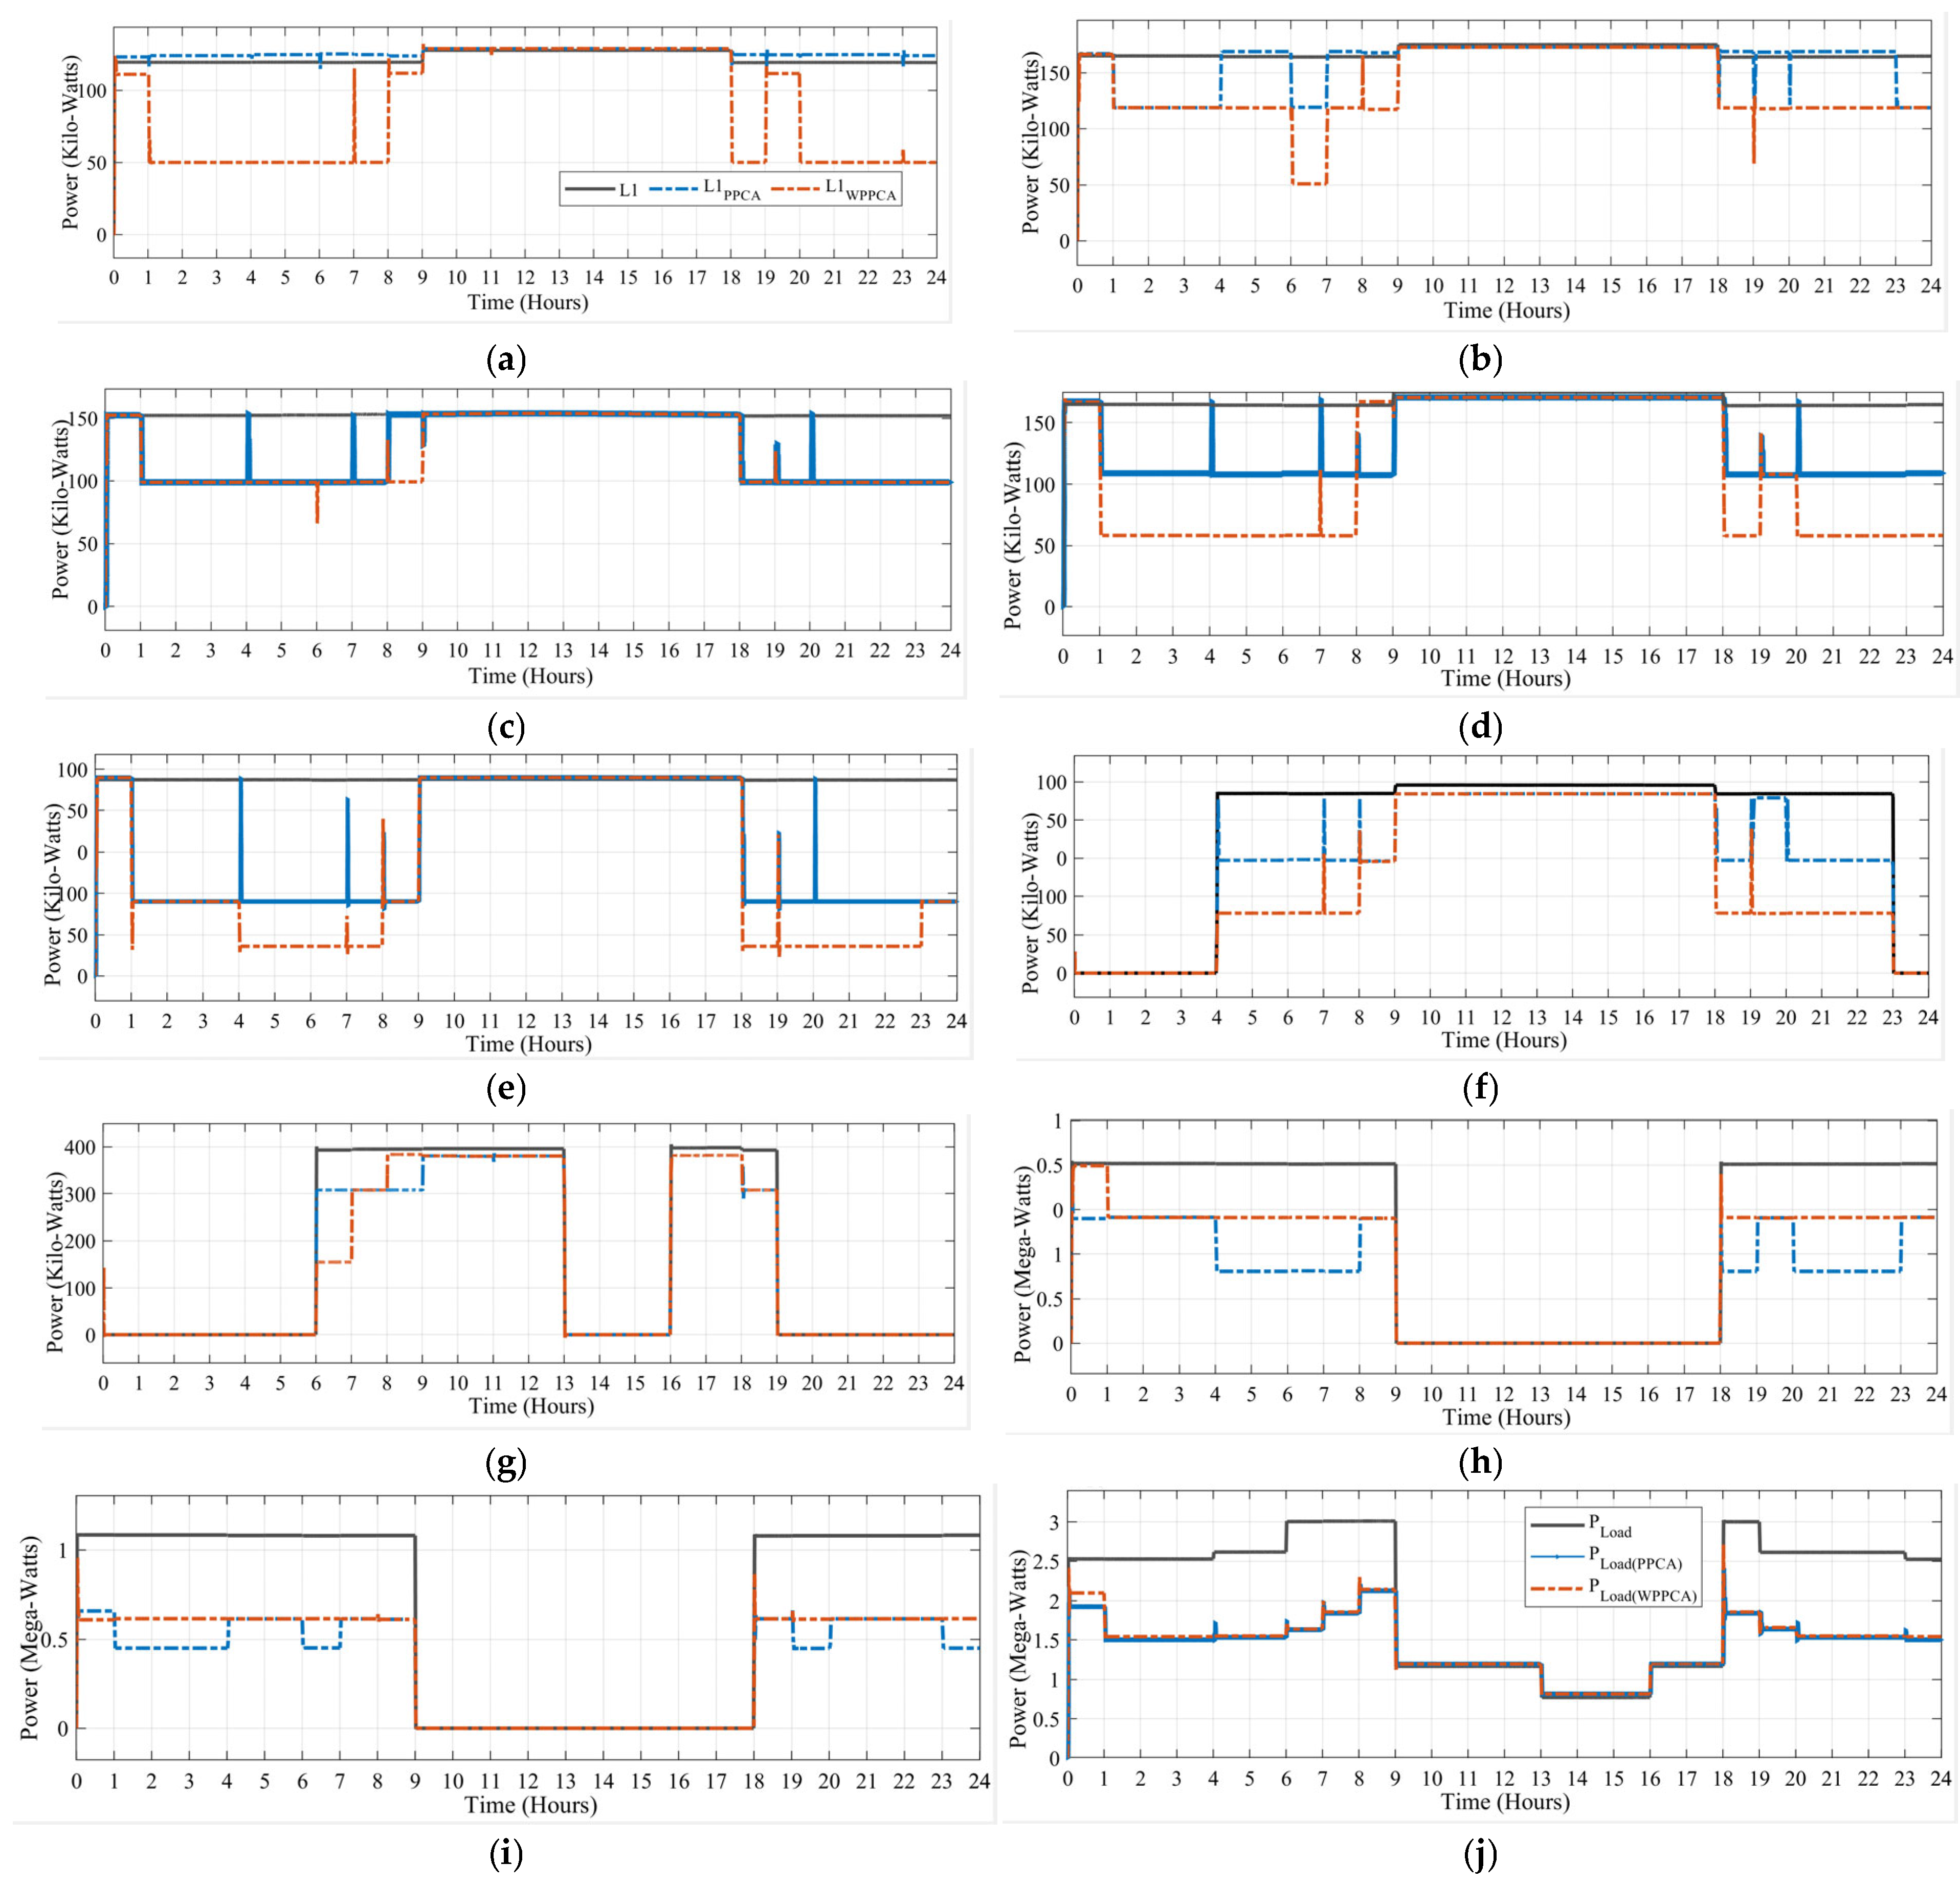
Table 9, it is observed that, for the same available power, the number of consumers receiving power through WPPCA is consistently higher than that in the case of PPCA, demonstrating the superiority of WPPCA. The comparative load profile for all connected loads is illustrated in
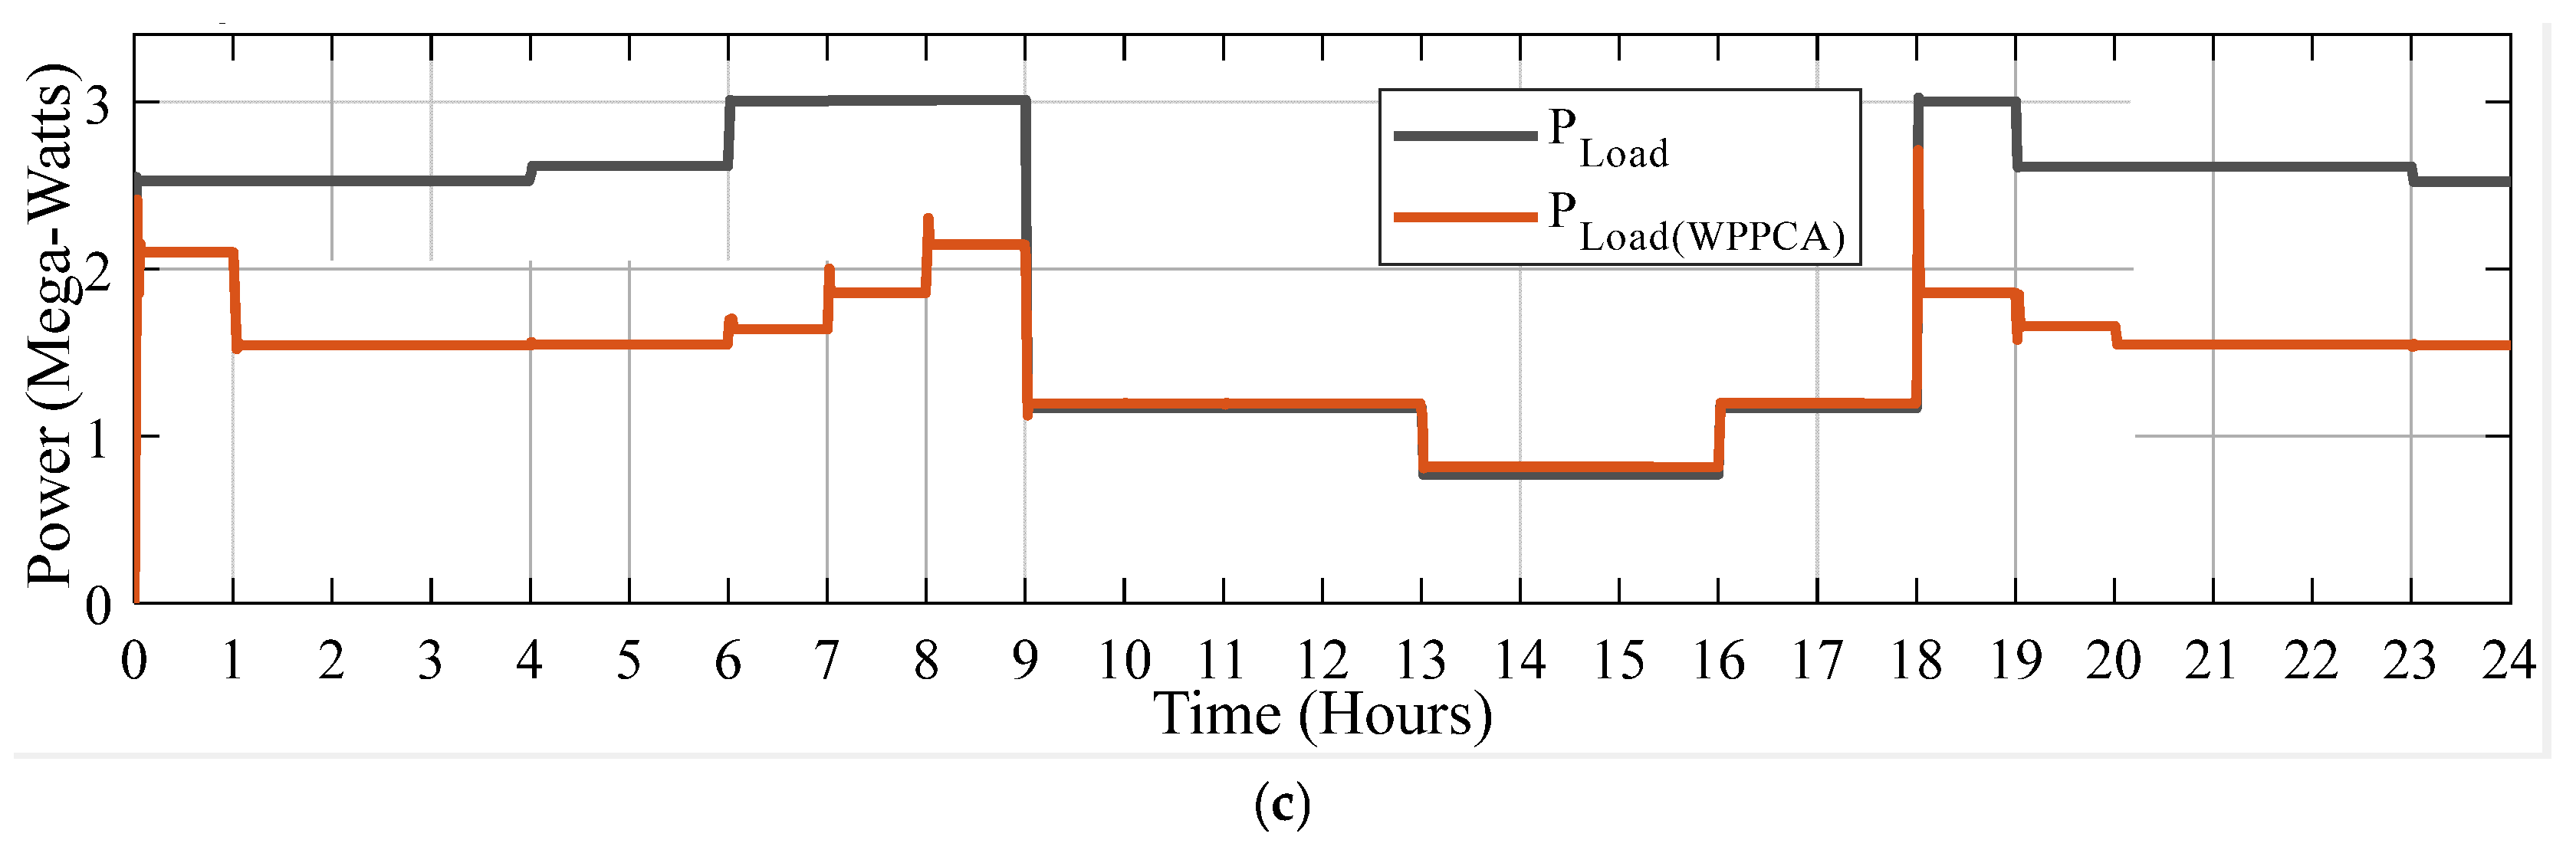
Figure 14, depicting the load demand, a demand met using the WPPCA approach, and a demand met using the PPCA approach.
From
Figure 14j, it can be observed that the microgrid is operating under load-shedding conditions from the 0th to the 8th and from the 18th to the 23rd hour. The available power remains the same for both the Priority-Based Consumer Allocation (PPCA) algorithm and the Weighted Priority-Based Consumer Allocation (WPPCA) algorithm. However, the power allocation in WPPCA is optimized to supply a greater number of consumers compared to PPCA. As the microgrid operates in Sufficient Power Mode (SPM) from the 9th to the 17th hour, no load curtailment is implemented during this period.
5. Conclusions
This paper presents a wide area measurement-based centralized power management system for microgrids, capable of efficiently managing both grid-connected and islanded modes of operation. The µ-PMUs acquire bus voltage and current phasor data and transmit it to the PDC, where the CPMS is integrated for advanced data processing and management. The microgrid is designed by integrating a solar photovoltaic (PV) system, a natural gas-based generator, and an energy storage system (ESS) into the IEEE 13-bus test system. In the grid-connected mode, the CPMS employs a grid tariff-based source allocation (GTSA) algorithm, which optimally allocates available power resources considering the dynamic grid tariff. The primary objective of GTSA is to optimize power extraction from the utility grid by maximizing consumption during periods of low grid tariffs and minimizing it during high-tariff periods. This objective is validated by the obtained results. In islanded mode, a Weighted Priority under Priority-Based Consumer Allocation (WPPCA) algorithm is utilized. To replicate the characteristics of a real-world distribution system, nine distinct load categories have been considered, including Hospitals, Transportation, Academic, Municipal, Residential, Government Offices, Commercial, Industrial, and Irrigation. These categories are assigned load priorities as high, medium, and low to facilitate efficient load management. The WPPCA algorithm, in conjunction with the available power, incorporates the load priority index and the weight of consumers associated with each priority level to formulate a Load Priority Factor. This factor determines load prioritization, disconnection, and restoration strategies, ensuring that the minimum number of consumers are affected during power insufficiency. The performance of the proposed WPPCA algorithm is evaluated against the PPCA algorithm, wherein consumer weight is not considered. The comparative analysis reveals that the WPPCA consistently ensures power delivery to a higher number of consumers at each time instant. This highlights the superiority of WPPCA. The proposed CPMS offers an effective solution for real-time power management in microgrids, operating seamlessly in both grid-connected and islanded modes. This system is particularly well-suited for urban deployment, ensuring reliable and optimized power distribution under varying operational conditions.
The proposed wide-area measurement-based CPMS possesses the flexibility to be extended to larger networks, such as the IEEE 33-bus system, IEEE 123-bus system, or practical microgrid configurations, by ensuring efficient data processing within the Phasor Data Concentrator (PDC) and deploying a robust communication infrastructure. Beyond real-time validation, the integration of electric vehicle charging stations represents a promising direction for future research. Moreover, the proposed methodology exhibits strong potential for practical implementation in real-world microgrid environments.


