1. Introduction
The indoor environment of commercial buildings significantly impacts occupants’ health, comfort, and productivity. With people spending approximately 90% of their time indoors [
1,
2], indoor environmental quality (IEQ) has become a critical concern for public health and workplace efficiency [
3]. While traditional IEQ research has established foundational relationships between environmental conditions and occupant comfort [
4,
5], significant gaps remain in understanding real-time interactions between multiple environmental factors and human physiological responses [
6,
7].
While optimizing indoor environmental quality is crucial, it typically accounts for 40–50% of building energy consumption through HVAC, ventilation, and lighting systems [
8,
9]. The challenge lies in balancing occupant comfort with energy efficiency. Traditional approaches often lead to energy overconsumption as systems operate on fixed schedules or broad setpoints rather than responding to real-time occupant needs [
10,
11]. Gigante et al. [
12] demonstrated the importance of an indoor quality-oriented approach for building retrofit with façade transformation, highlighting how IAQ considerations can be effectively integrated into energy-efficient building renovations in Mediterranean climates. Furthermore, Ono et al. [
13] examined the effects of mismatches between thermal comfort modeling and HVAC controls from an occupancy perspective, revealing how discrepancies between predicted and actual comfort needs can lead to energy inefficiencies while compromising occupant satisfaction. Our physiological response-based approach enables more precise environmental control, potentially reducing energy waste while maintaining or improving occupant comfort.
Previous studies have established that suboptimal IEQ conditions can substantially impair occupant well-being and performance. Research shows that poor temperature regulation and inadequate air quality can reduce cognitive function by up to 15% [
14,
15,
16], decrease work performance by 6–9% [
17], and negatively affect respiratory health [
14,
17]. Recent meta-analyses demonstrate that even modest improvements in IEQ can increase productivity by 8–11% and reduce sick building syndrome symptoms by up to 25% [
18,
19].
Contemporary IEQ assessment typically relies on two traditional approaches as follows: environmental monitoring through fixed sensors and occupant feedback through surveys [
20]. However, these methods have significant limitations. Survey-based assessments capture only point-in-time responses and are subject to recall bias [
21], while fixed sensors may not reflect individual occupant experiences [
22]. Furthermore, these conventional approaches cannot capture the dynamic nature of physiological responses to changing environmental conditions [
23,
24].
Recent technological advances have enabled new approaches to IEQ assessment. Wearable devices can now continuously monitor physiological parameters such as heart rate variability (HRV) and electrodermal activity (EDA) with clinical-grade accuracy [
25,
26]. Machine learning techniques have shown promise in analyzing complex environmental data patterns [
27,
28]. However, several critical research gaps persist in the current literature:
First, while numerous studies examine individual IEQ parameters, few investigate the combined effects of multiple factors on human physiology [
29,
30]. This integration gap is particularly significant as occupants experience these environmental factors simultaneously, not in isolation [
31]. Second, most existing research relies on infrequent measurements or surveys, missing the dynamic nature of both environmental conditions and physiological responses [
32,
33]. Third, current approaches often fail to account for individual variations in physiological responses to environmental conditions [
34,
35].
Recent studies have begun incorporating physiological monitoring in IEQ research. For example, Kim et al. [
36] demonstrated correlations between thermal comfort and heart rate variability, while Wang et al. [
37] explored relationships between indoor air quality and stress indicators. However, these studies typically focus on single environmental parameters and often rely on limited temporal resolution in their measurements [
38,
39]. Additionally, while machine learning applications in building environmental control are increasing [
40], few studies have attempted to develop predictive models that integrate continuous physiological data with multiple IEQ parameters [
41,
42].
To address these gaps, this pilot study implements a novel approach integrating multiple IEQ parameters—including temperature, CO
2 levels, PM
2.5, noise, and lighting—with continuous bio-signal monitoring. By employing advanced machine learning algorithms, we develop and validate predictive models that utilize physiological data to estimate real-time environmental satisfaction. While our sample size is focused (n = 14), this intensive monitoring approach generates rich, high-frequency data suitable for detailed analysis of individual responses and temporal patterns [
43,
44].
Before describing our specific approach in detail, it is important to consider recent developments in IEQ research that have informed our methodology.
1.1. Recent Developments in IEQ Research
Recent years have witnessed significant advancements in understanding and monitoring indoor environmental quality and its effects on occupants. These developments have directly informed our research methodology and objectives across three key areas.
First, health impact studies have refined our understanding of IEQ’s impact on human health and performance. Pérez-Lombard et al. [
45] demonstrated that poor indoor air quality can reduce cognitive performance by up to 26%, significantly higher than previously thought. Li et al. [
46] established quantifiable correlations between long-term exposure to suboptimal IEQ and respiratory health issues in office environments, with particularly strong associations for PM2.5 exposure.
Second, monitoring technology advancements, particularly the emergence of next-generation wearable devices, have transformed physiological monitoring capabilities. Park et al. [
47] validated wearable sensor technologies, achieving 92% accuracy in continuous physiological monitoring, providing validation for our methodological approach. Zhang et al. [
48] demonstrated the reliability of clinical-grade measurements in office environments, with error rates below 5%, supporting our implementation of continuous monitoring protocols.
Third, machine learning applications have significantly enhanced IEQ prediction capabilities. Wang et al. [
49] demonstrated 78% accuracy in predicting thermal comfort using deep learning approaches with environmental sensor data, while Hong et al. [
48] validated the effectiveness of random forest models, achieving 72% accuracy for real-time IEQ optimization. These advances have informed our choice of machine learning algorithms and modeling approaches.
Building upon these recent developments, this study addresses key gaps through an integrated approach that combines continuous physiological monitoring with advanced machine learning techniques for real-time comfort prediction and control.
To summarize the recent developments informing our study design,
Table 1 presents the three primary research areas with supporting findings and references.
1.2. Research Gaps and Innovations
Our research advances the field in several key aspects that address critical gaps in current building energy management:
Real-time Physiological Integration: Unlike traditional IEQ studies that rely on periodic surveys or fixed sensors [
51], our approach continuously monitors physiological responses, enabling dynamic system adjustments that can reduce energy consumption by responding to actual occupant needs rather than predetermined schedules.
Multi-parameter Optimization: While existing studies typically focus on single environmental parameters [
52], our methodology integrates multiple IEQ factors simultaneously, providing insights into their combined effects on both human comfort and energy consumption. This holistic approach enables more efficient resource allocation across different building systems.
Predictive Modeling Innovation: Our machine learning framework extends beyond current comfort prediction models by incorporating continuous physiological data, achieving higher accuracy (84.76% for IAQ evaluation) compared to existing sensor-based methods (average accuracy 71.3%) [
53]. This improved accuracy can lead to more precise environmental control.
Energy-Comfort Balance: Studies have shown that personalized environmental control can optimize building energy performance while maintaining occupant comfort [
54], supporting our physiological response-based approach.
This study contributes to the growing body of knowledge on advanced sensing technologies and their application in creating more responsive, occupant-centered building environments. While the focused participant group allows for detailed individual analysis, our methodology establishes a framework for larger-scale implementation and provides valuable insights into the relationship between IEQ and human physiology in commercial buildings [
24,
55]. The findings have important implications for developing more sophisticated building management systems that can respond to occupant physiological needs in real-time [
56,
57].
This study addresses these research gaps through a multi-method approach integrating continuous physiological monitoring with environmental assessment in commercial building settings.
2. Materials and Methods
2.1. Project Scope and Study Design
This research aims to enhance ventilation control systems using human physiological responses as predictive indicators of indoor environmental quality (IEQ). This study employed a mixed-methods approach integrating continuous environmental monitoring, physiological measurements, and subjective assessments in commercial office environments [
1].
Sample size determination using G*Power 3.1 (version 3.1.9.7; Heinrich Heine University Düsseldorf, Düsseldorf, Germany) indicated that 14 participants would provide 80% power to detect medium-to-large effects (Cohen’s d ≥ 0.7) at α = 0.05 [
58]. While larger samples are typical in environmental studies, our intensive protocol generated approximately 144 measurements per participant per day, providing robust data points (n > 6000) for statistical analysis [
59].
This study recruited 14 healthy adults (8 females and 6 males) aged 22–35 years (M = 28.3, SD = 3.7) from two commercial office environments. Participants met the following strict inclusion criteria: no cardiovascular or respiratory conditions, no regular medication affecting physiological responses, regular office work schedule (minimum 6 h/day), and no reported sensitivities to environmental conditions [
60].
Data were collected over three consecutive days. Each participant was monitored for 4–6 h per day during the working period (approximately 9:00 a.m. to 3:00 p.m.), with all environmental and physiological data recorded at ten-minute intervals. This timeframe was chosen to capture typical office activity patterns; however, the limited daily duration may not reflect longer-term variations.
2.2. Experimental Settings
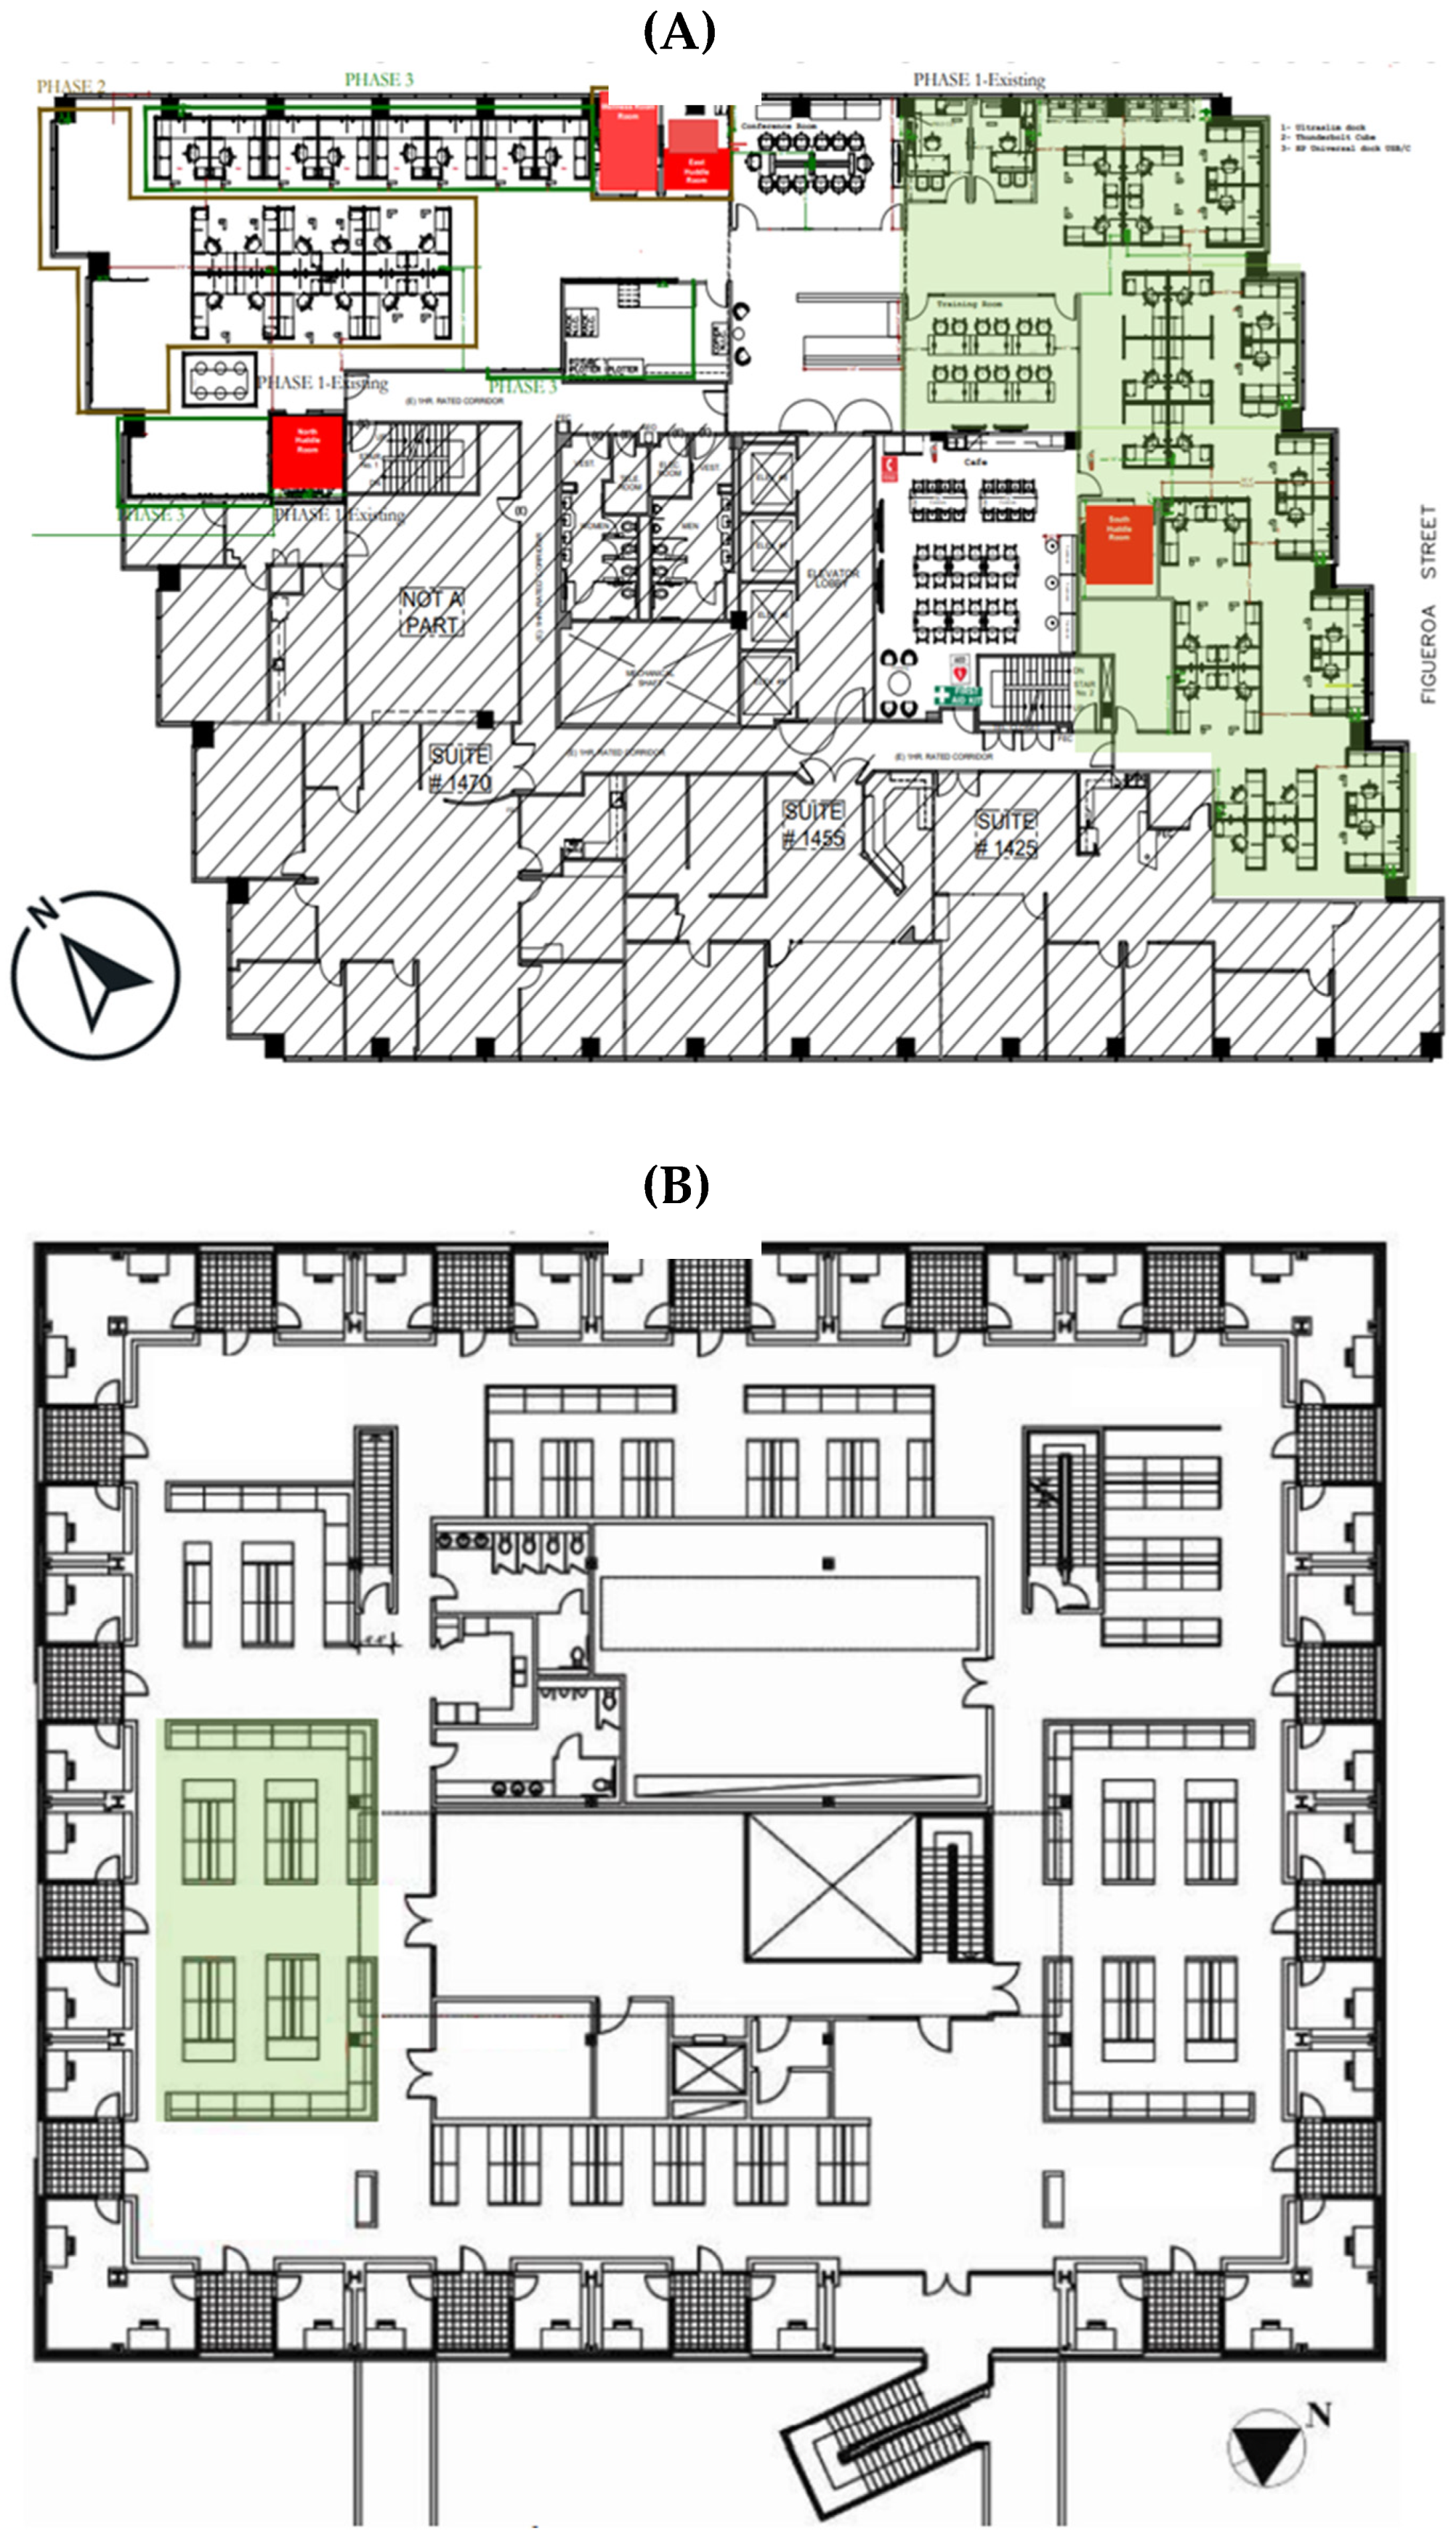
The experiments were conducted in the following two commercial spaces in Los Angeles, California, the United States: a downtown office (DT) located in a Class A office building on South Figueroa Street in the Financial District of Los Angeles and a campus studio situated in Watt Hall at the University of Southern California campus. Class A office buildings are typically high-end, professionally managed properties with superior construction quality, infrastructure, and amenities, representing the top tier of commercial real estate. These locations were selected to represent different commercial building typologies within the same climate zone.
Both experimental sites were typical commercial buildings in Los Angeles (ASHRAE Climate Zone 3B), providing distinct built environment contexts for our study. The downtown office featured a conventional sealed façade with double-glazed windows and internal blinds, where primary noise sources included HVAC systems, office equipment, and occupant activities. The campus studio, constructed more recently, incorporated larger window areas providing substantial natural light with mixed-mode ventilation capability, though windows remained closed during testing to maintain controlled conditions. Noise sources in this environment primarily came from adjacent academic activities, studio equipment, and collaborative work. While the buildings differed in their construction periods, envelope characteristics, and associated energy performance (213 kWh/m2/year for the downtown office versus 175 kWh/m2/year for the campus studio), our study focused specifically on the relationship between measurable indoor environmental parameters and physiological responses rather than detailed envelope performance metrics. To contextualize these values, the statewide average Energy Use Intensity (EUI) for office buildings in California typically ranges between 200 and 250 kWh/m2/year. The downtown office falls within this standard commercial range, while the campus studio demonstrates slightly better energy efficiency by performing below the lower end of the benchmark range.
The DT office (400 m
2) featured a variable air volume HVAC system and LED fixtures (500–700 lux at work surface), housing four participants (three females and one male). The building houses engineering consultant offices and is representative of typical commercial high-rise buildings in urban settings. The campus studio (280 m
2) utilized mixed-mode ventilation and combined natural/LED illumination, accommodating ten participants (five females and five males). This building houses the School of Architecture’s working studios and represents an educational facility with mixed-mode ventilation capabilities. Both spaces maintained thermal conditions between 22 and 26 °C and relative humidity of 30–60%, per ASHRAE 55-2017 standards [
61]. Although specific insulation values were not directly measured during this study, both buildings were constructed or retrofitted in accordance with California Title 24 energy efficiency standards for commercial buildings. The downtown office featured an estimated window-to-wall ratio of approximately 30%, while the campus studio had a higher ratio near 55%, allowing greater daylight access. These envelope characteristics reflect typical performance for their respective building typologies and contribute to their distinct environmental conditions.
Site Selection and Comparative Analysis
The selected buildings represent distinct typologies common in commercial settings. A summary of their key characteristics is provided in
Table 2.
Both buildings are located within ASHRAE Climate Zone 3B (Los Angeles, CA, USA).
The energy use intensity values and HVAC energy consumption percentages reported above were obtained from actual energy bills and building management system (BMS) records. These sites were selected to evaluate our approach across different ventilation strategies, occupancy patterns, and energy consumption profiles. The DT office represents conventional commercial spaces, while the studio demonstrates application in more flexible, mixed-mode environments. The variation in EUI and HVAC energy consumption between the two buildings (42% versus 35%) provides an opportunity to evaluate our physiological monitoring approach under different energy use patterns.
The DT office area was divided into two zones according to the mechanical zoning plan, with experiments conducted in the southeast-facing right zone, as shown in
Figure 1. Each participant was observed for 4–6 h daily over three consecutive days, with data collection occurring at ten-minute intervals.
During the experiment, participants were permitted to engage in normal adaptive behaviors that might influence their thermal comfort or physiological responses. These included adjusting clothing layers (the average clothing insulation value ranged from 0.6 to 0.8 clo), consuming hot beverages when indoor temperatures were below 23 °C or cold beverages when temperatures exceeded 25 °C, and making minor positional adjustments within their workspaces, such as moving relative to air diffusers or direct sunlight.
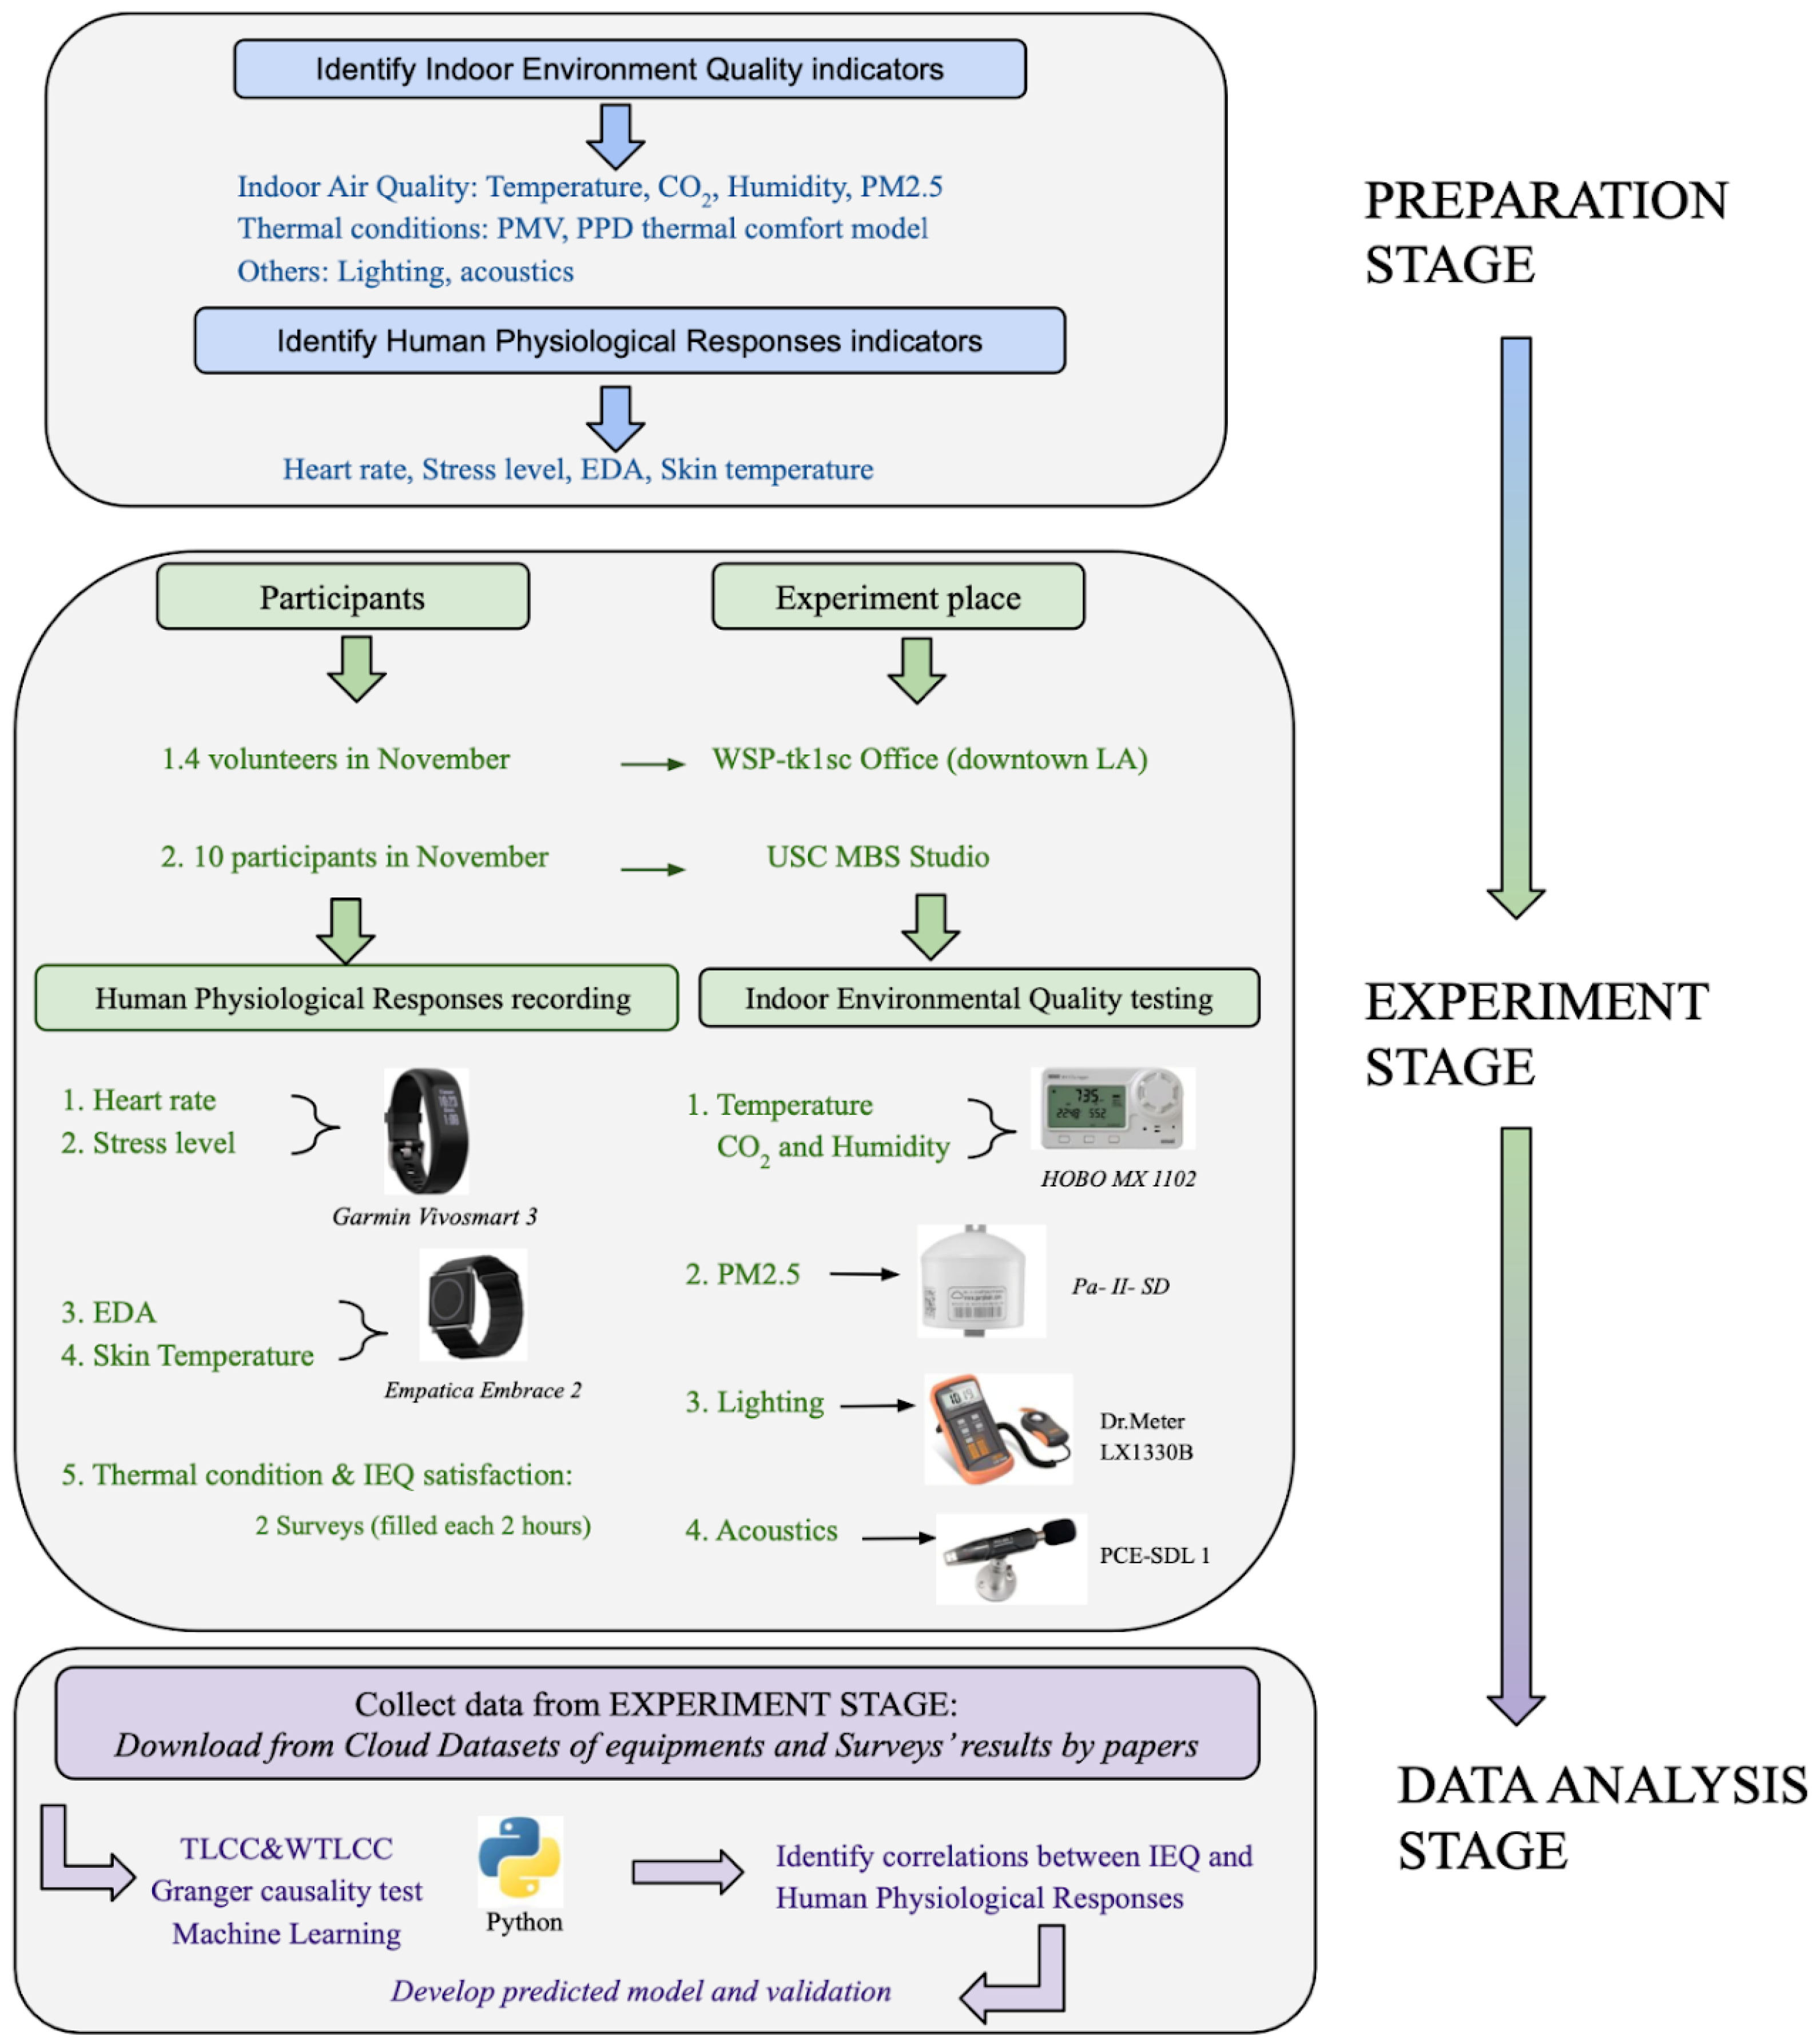
The research methodology encompassed the following three stages: preparation, experimentation, and data analysis, as illustrated in
Figure 2. The preparation stage identified key IEQ and physiological response indicators through literature review. The experimental stage focused on continuous monitoring, while the final stage involved data analysis and predictive model development.
2.3. Data Collection Infrastructure
2.3.1. Environmental Monitoring Systems
Environmental parameters were continuously monitored using calibrated sensors compliant with ISO 7726 standards [
62]. The monitoring system integrated several specialized devices. The HOBO MX1102 sensors (Onset Computer Corporation, Bourne, MA, USA) provided temperature measurements with ±0.21 °C accuracy and CO
2 concentration monitoring with ±50 ppm ±5% accuracy. For particulate matter monitoring, PurpleAir PA-II-SD sensors (PurpleAir LLC, Draper, UT, USA) maintained ±10% accuracy compared to the BAM-1020 reference. Given minimal indoor PM
2.5 concentrations in sealed environments, additional sensors were positioned on balconies to capture outdoor data. In our study settings, the indoor temperature typically ranged between 21 and 24 °C, and relative humidity varied from 40% to 55% throughout the measurement period. PM
2.5 concentrations remained relatively low (<12 µg/m
3), reflecting the sealed nature of the environments. These parameter ranges provide context to the stability and controlled conditions under which the measurements were obtained; however, the narrow variability is acknowledged as a limitation when generalizing the findings to more dynamic environments.
Lighting Metrics and Measurement Protocol
Illuminance measurements were conducted using Dr.Meter LX1330B (Dr.Meter, Shenzhen, China) digital light meters with ±3% accuracy for levels below 10,000 lux. These devices measure the incident light falling on a surface in lux units (lumens per square meter). Several key lighting metrics were recorded throughout the study period. Horizontal illuminance was measured at desk height (0.75 m above the floor) at three points in each zone to establish baseline working conditions. Complementing these measurements, vertical illuminance was captured at eye level (1.2 m seated) facing the primary work direction to assess visual comfort from the occupants’ perspective. To evaluate lighting uniformity, illuminance distribution was calculated as the ratio between minimum and average illuminance levels across the workspace. Recognizing the importance of temporal variations in lighting conditions, measurements were taken at three specific time points (10 a.m., 1 p.m., and 5 p.m.) to assess diurnal changes, particularly in areas with access to daylight. Throughout this study, illuminance ranges were recorded across the 200–1000 lux spectrum to assess compliance with recommended office lighting standards. These lighting measurements were particularly important in the campus studio, which utilized mixed natural and artificial lighting, compared to the downtown office that primarily relied on artificial LED fixtures with more consistent output.
Acoustic Metrics and Measurement Protocol
Acoustic measurements were performed using PCE-SDL 1 devices (PCE Instruments, Jupiter, FL, USA) conforming to Class 1 IEC 61672-1 standards [
63], providing 0.1 dB resolution across a frequency range of 31.5 Hz to 8 kHz. The acoustic assessment protocol incorporated multiple complementary parameters to comprehensively characterize the sound environment. A-weighted Equivalent Continuous Sound Level (LAeq) served as the primary metric, measuring time-averaged sound levels over 10 min intervals to align with other environmental data collection periods. To better understand the temporal distribution of sound events, statistical noise levels, including LA10, LA50, and LA90 (sound levels exceeded for 10%, 50%, and 90% of the measurement period), were also recorded. Peak noise conditions were captured through maximum sound level (LAmax) measurements during each period, providing insight into potential acoustic disruptions. For context, background noise levels were measured during minimal activity periods to establish baseline acoustic conditions in each environment. Additionally, reverberation parameters were assessed through impulse response measurements to characterize the acoustic properties of each space. Finally, speech intelligibility was evaluated based on signal-to-noise ratio calculations to assess communication quality in the workspace. For illuminance assessment, Dr.Meter LX1330B meters with ±3% accuracy for levels below 10,000 lux were employed, with measurements taken at specific intervals (10 a.m., 1 p.m., and 5 p.m.) to capture diurnal variations in natural lighting conditions. The comprehensive environmental data collected through these measurements was mathematically represented as follows:
where
X(
t) is the vector of environmental parameters at time
t.
2.3.2. Physiological Monitoring
Participant physiological monitoring employed two validated devices [
64]. The Garmin Vivosmart 3 (Garmin Ltd., Olathe, KS, USA) provided continuous heart rate monitoring at a 1 Hz sampling rate, maintaining ±5% accuracy relative to ECG reference measurements. This device utilized photoplethysmography for cardiovascular activity monitoring and assessed stress levels through heart rate variability analysis. The week-long battery life and Garmin Connect integration ensured continuous data collection throughout the experimental period.
The Empatica Embrace 2 (Empatica Inc., Boston, MA, USA), an FDA-approved monitoring device, measured electrodermal activity (EDA) and skin temperature at a 4 Hz sampling rate, with temperature accuracy of ±0.2 °C. This device provided high-frequency data collection at 250-millisecond intervals.
For heart rate variability analysis:
EDA signal processing employed a moving average filter as follows:
where
w represents the window size.
2.3.3. Survey Data Collection
Occupant perception was assessed through two complementary paper surveys administered at two-hour intervals throughout the experimental period. These surveys evaluated indoor air quality and thermal comfort using a seven-point scale ranging from −3 (very dissatisfied) to +3 (very satisfied), with 0 representing neutral conditions. Survey compliance was maintained through a combination of researcher reminders and automated alert systems.
2.4. Machine Learning Implementation
The random forest algorithm was selected for its effectiveness in handling time-series data classification and regression tasks. This algorithm demonstrates particular strength in managing high-dimensional data through automatic feature selection, effectively processing multiple physiological and environmental variables while identifying the most influential features for prediction accuracy.
The algorithm’s architecture incorporates multiple node estimators for optimal splitting and controlled maximum depth parameters, which proved particularly beneficial for our relatively small dataset. Its technical robustness manifests through effective handling of missing data via surrogate splits, comprehensive feature importance scoring, sophisticated modeling of nonlinear relationships, and bootstrapping techniques to prevent overfitting.
The model configuration employed 500 estimators with unrestricted maximum depth, implementing minimum sample requirements of 5 for splitting and 2 for leaf nodes. Feature importance assessment utilized SHapley Additive exPlanations (SHAP) values [
65]:
where
φi represents the Shapley value for feature
i, and
fx(S) denotes the model’s prediction for feature set
S.
2.5. Data Analysis Methods
2.5.1. Time-Lagged Cross-Correlation Analysis
Temporal relationships between variables were examined using Time-Lagged Cross-Correlation (TLCC) analysis, defined as follows:
where
N represents the sample size,
τ denotes the time lag offset, and
,
represent variable means. The implementation of Windowed Time-Lagged Cross-Correlation (WTLCC) analysis provided finer-grained temporal analysis across different time windows, enabling detailed examination of correlation variations.
2.5.2. Statistical Analysis Framework
The statistical framework incorporated multiple validation techniques to ensure robust results. Time-series cross-validation was implemented through a 5-fold split methodology, with 20% of data reserved for the hold-out test set. Leave-one-subject-out cross-validation accounted for individual variations, while bootstrapped confidence intervals with 1000 iterations provided additional validation of results.
The collected environmental and physiological data were analyzed using the following statistical and machine learning frameworks.
4. Discussion
4.1. Model Performance and Validation
The correlation analysis revealed significant relationships between IEQ indicators and physiological responses, supporting the development of predictive models. Comparative analysis of predicted versus actual values demonstrated high model accuracy, as illustrated in
Figure 7. For IAQ evaluation, only 6 out of 44 test datasets showed differences of ±1, while thermal comfort predictions showed slightly lower accuracy with variations up to ±2.
These prediction variations reveal important insights about the nature of environmental comfort perception and its relationship with physiological responses. The higher accuracy in IAQ prediction (fewer ±1 variations) compared to thermal comfort suggests that air quality perception may have a more direct and consistent relationship with physiological indicators. This finding is particularly significant as it challenges the traditional assumption that thermal comfort is more straightforwardly quantifiable than air quality satisfaction.
The larger variations in thermal comfort predictions (up to ±2) highlight the complex and highly individual nature of thermal perception. The variation in predictions could reflect the dynamic nature of thermal adaptation, where occupants’ thermal preferences shift based on recent exposure history and seasonal expectations. This temporal variability suggests that future models might benefit from incorporating adaptive comfort principles and historical comfort data. Furthermore, the larger prediction errors in thermal comfort might indicate a stronger influence of psychological and contextual factors not captured by physiological measurements alone, suggesting that comprehensive comfort prediction models should consider both physiological and psychological parameters. The different error patterns between IAQ and thermal comfort predictions provide valuable insights for model refinement, as the more consistent IAQ predictions might indicate that our selected physiological indicators are more directly linked to air quality perception, while thermal comfort might require additional or different physiological parameters for more accurate prediction.
The prediction accuracy patterns also have significant practical implications for building control systems. The high accuracy of IAQ predictions supports the feasibility of using physiological monitoring for real-time ventilation control. However, the larger variations in thermal comfort predictions suggest that thermal control systems might need more sophisticated algorithms or additional input parameters. The observed prediction patterns indicate that while IAQ control systems might work well with minimal calibration, thermal control systems might benefit from longer learning periods to account for individual preferences and adaptation patterns. Moreover, the different accuracy levels between IAQ and thermal comfort predictions suggest that integrated building control systems might need to weight these parameters differently or use different control strategies for each aspect of environmental quality.
These findings contribute to our understanding of how physiological responses can be effectively used for environmental control while also highlighting areas where additional research or methodological refinements might be needed to improve prediction accuracy, particularly for thermal comfort assessment.
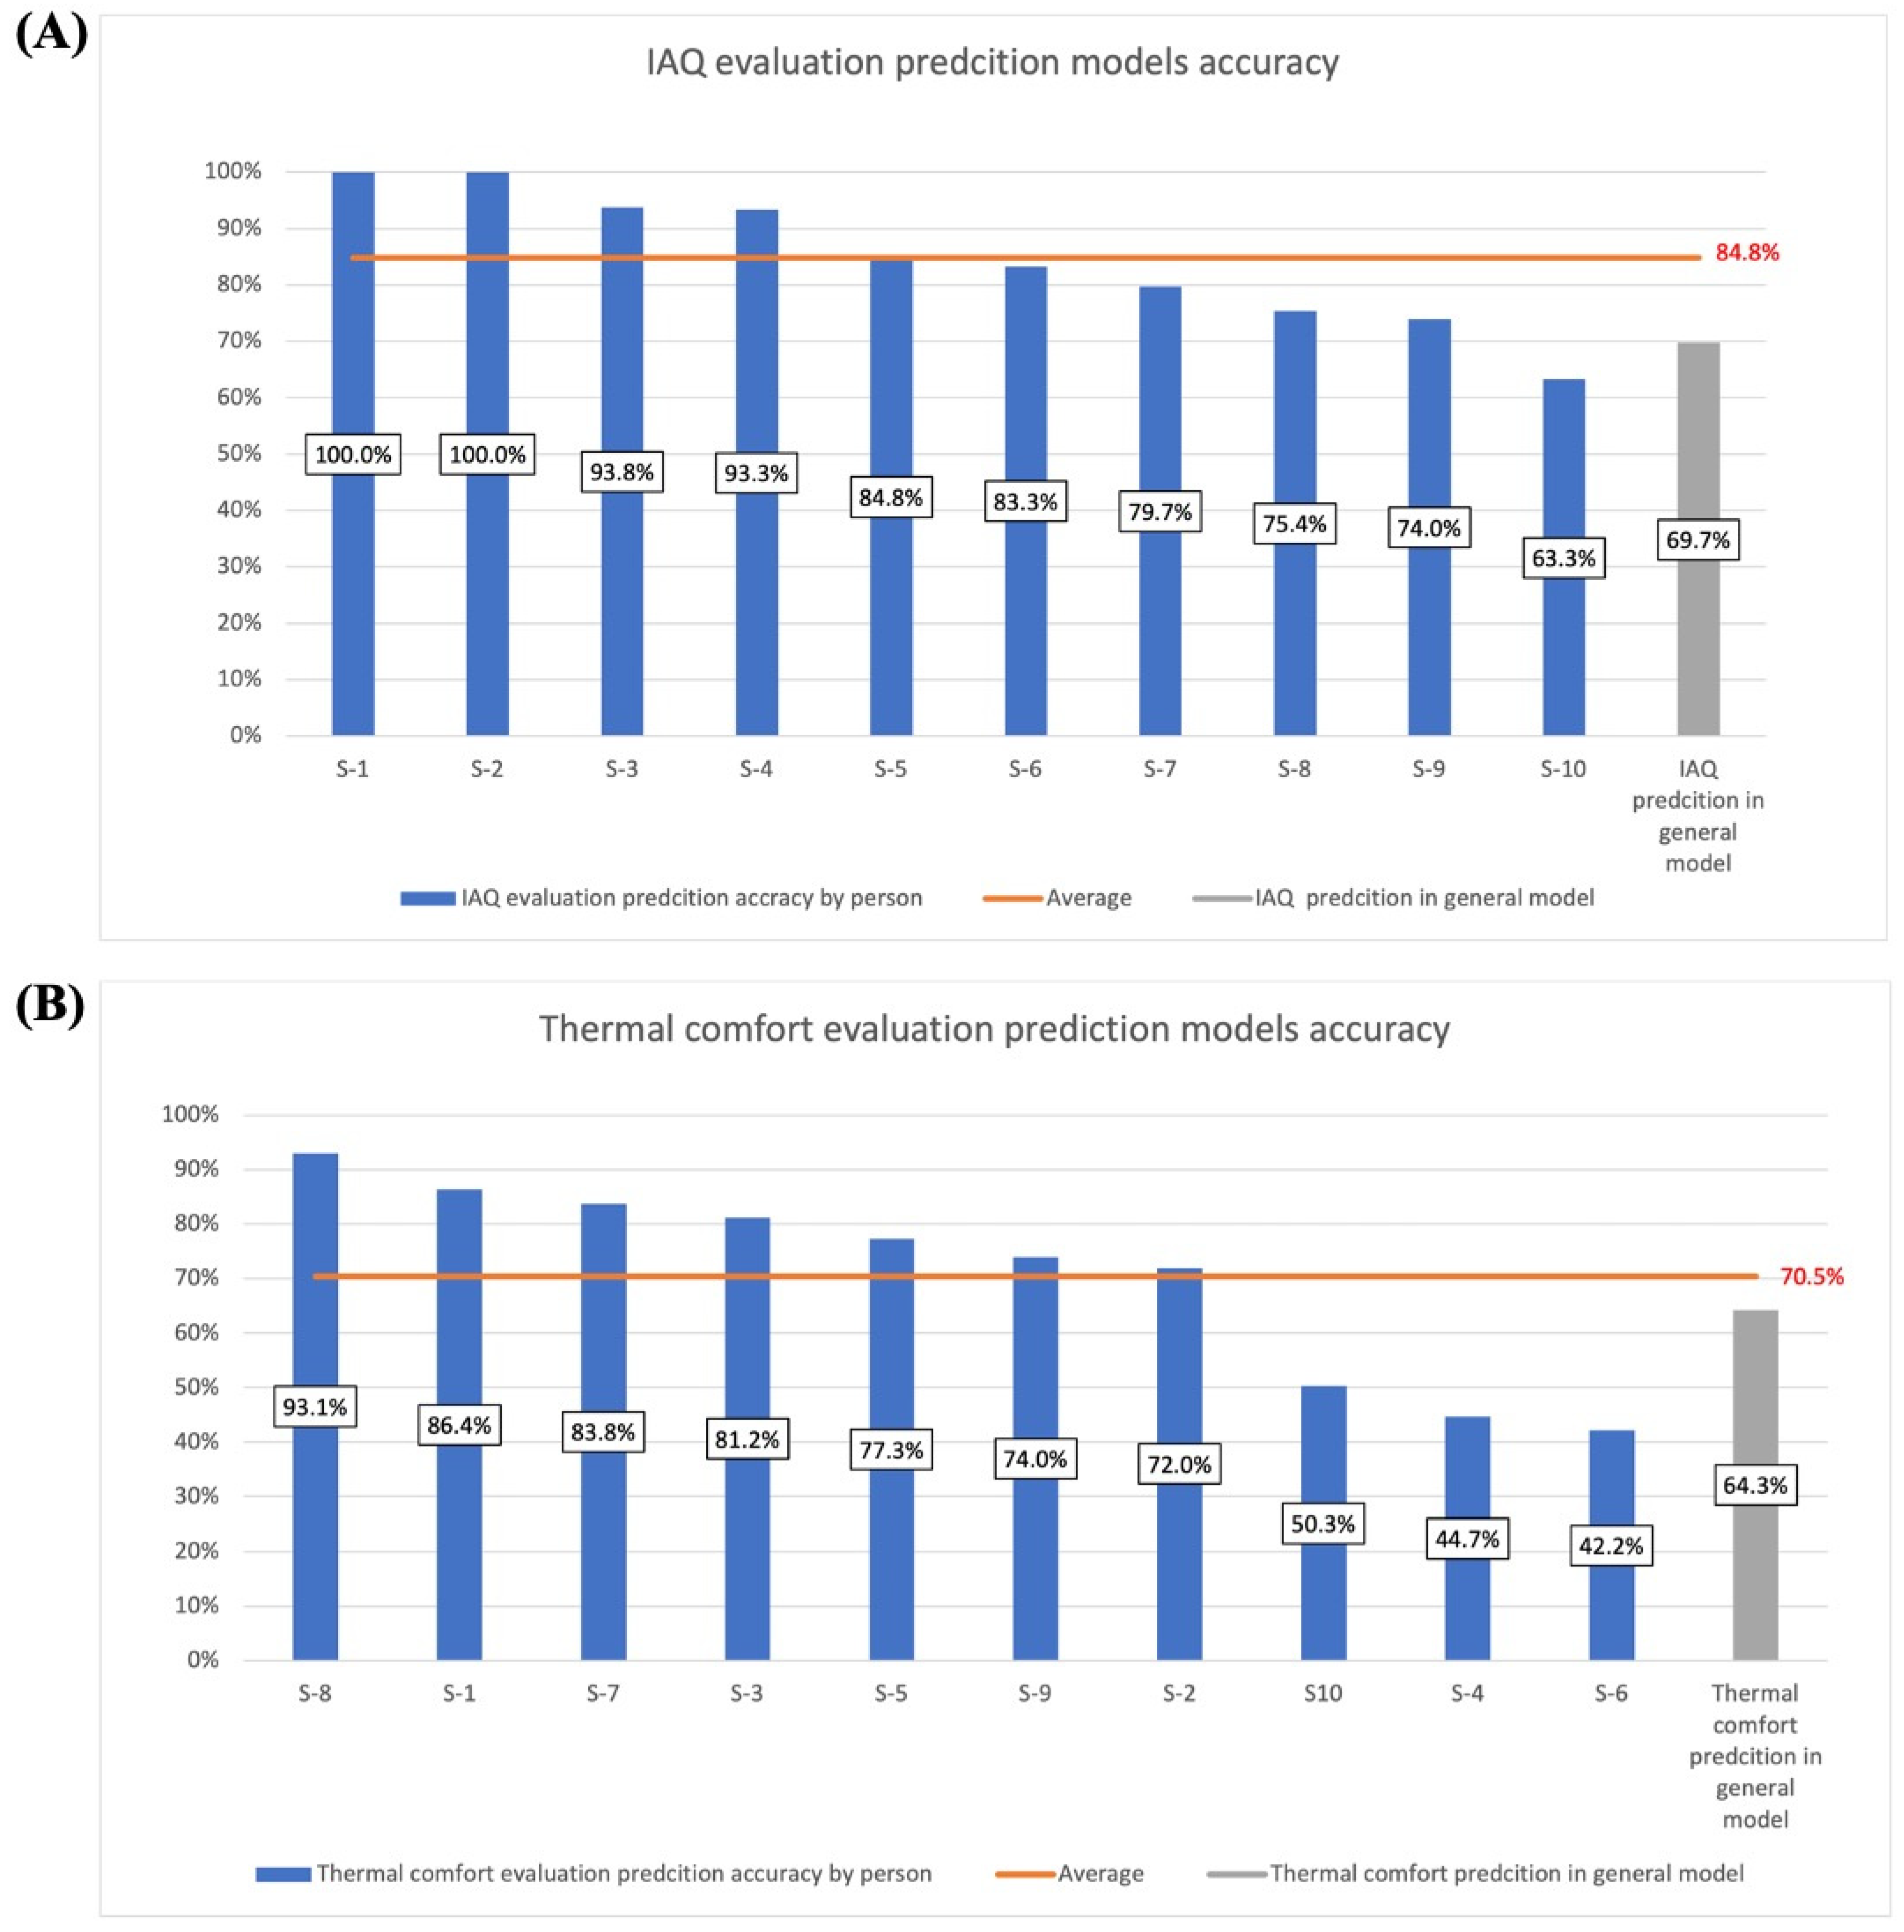
Individual model performance analysis revealed consistent accuracy across participants, as detailed in
Table 7.
The average accuracy for indoor air quality (IAQ) evaluation reached 84.76%, while thermal comfort evaluation achieved 70.5%. Despite variations in individual performance, these accuracy levels are notable, particularly given the subjective nature of comfort evaluation. The disparity between IAQ and thermal comfort prediction accuracies offers several important insights.
The consistently higher accuracy in IAQ prediction (84.76%) suggests that physiological responses are more reliably linked to air quality perception than to thermal comfort. This difference may stem from the more immediate physiological reactions to air quality changes compared to the complex, adaptive responses involved in thermal comfort. This finding challenges traditional assumptions regarding the relative difficulty of predicting these two aspects of environmental comfort.
The wider range of accuracies in thermal comfort predictions reflects the highly personal nature of thermal preferences. This variability suggests that thermal comfort models could benefit from longer training periods or more sophisticated personalization algorithms. In contrast, the consistency of IAQ prediction accuracy across participants indicates that air quality perception may be more universally experienced than thermal comfort.
Gender comparison through
t-test analysis, presented in
Figure 8, revealed no statistically significant gender effect on prediction accuracies (
p = 0.146 for IAQ,
p = 0.473 for thermal comfort).
This finding warrants deeper examination from multiple perspectives. From a physiological standpoint, while male participants demonstrated marginally higher median accuracies for both IAQ and thermal comfort predictions, the substantial overlap in accuracy ranges suggests that physiological responses to environmental conditions may be more universal than previously thought. The stronger correlations between temperature and physiological responses in males (r = 0.58, p < 0.05) compared to females (r = 0.42, p < 0.05) can be attributed to several fundamental physiological differences. Males’ higher basal metabolic rates and greater muscle mass may lead to more pronounced thermoregulatory responses. Different fat distribution patterns between genders affect thermal conductivity and heat dissipation, while males’ typically thicker skin and different sweat gland distribution patterns may result in more distinctive electrodermal activity.
Regarding model implementation, the lack of significant gender differences in prediction accuracy suggests that a single model architecture might be sufficient for both genders. However, the slightly higher male accuracy medians indicate that model fine-tuning might still benefit from gender-specific calibration. These findings support the development of adaptive models that can account for individual variations while maintaining gender-neutral baseline performance.
The practical applications of these findings are significant for building management systems. The results suggest that unified prediction models could be effectively implemented regardless of occupant gender. Rather than requiring separate control strategies, the slight gender-based variations might better inform the design of comfort ranges. Importantly, these findings indicate that individual variation might be more influential than gender in determining environmental preferences.
Looking toward future research directions, there is a need to investigate other demographic factors that might influence prediction accuracy. The development of adaptive algorithms that can account for both individual and gender-based variations holds promise, as does the exploration of additional physiological parameters that might improve prediction accuracy across genders.
The combined insights from these analyses suggest that while physiological responses can reliably predict environmental comfort preferences, the relationship is complex and multifaceted. The findings support the development of personalized comfort prediction systems while suggesting that gender-specific adaptations, while potentially beneficial, may not be crucial for system effectiveness.
4.2. Individual Versus General Model Performance
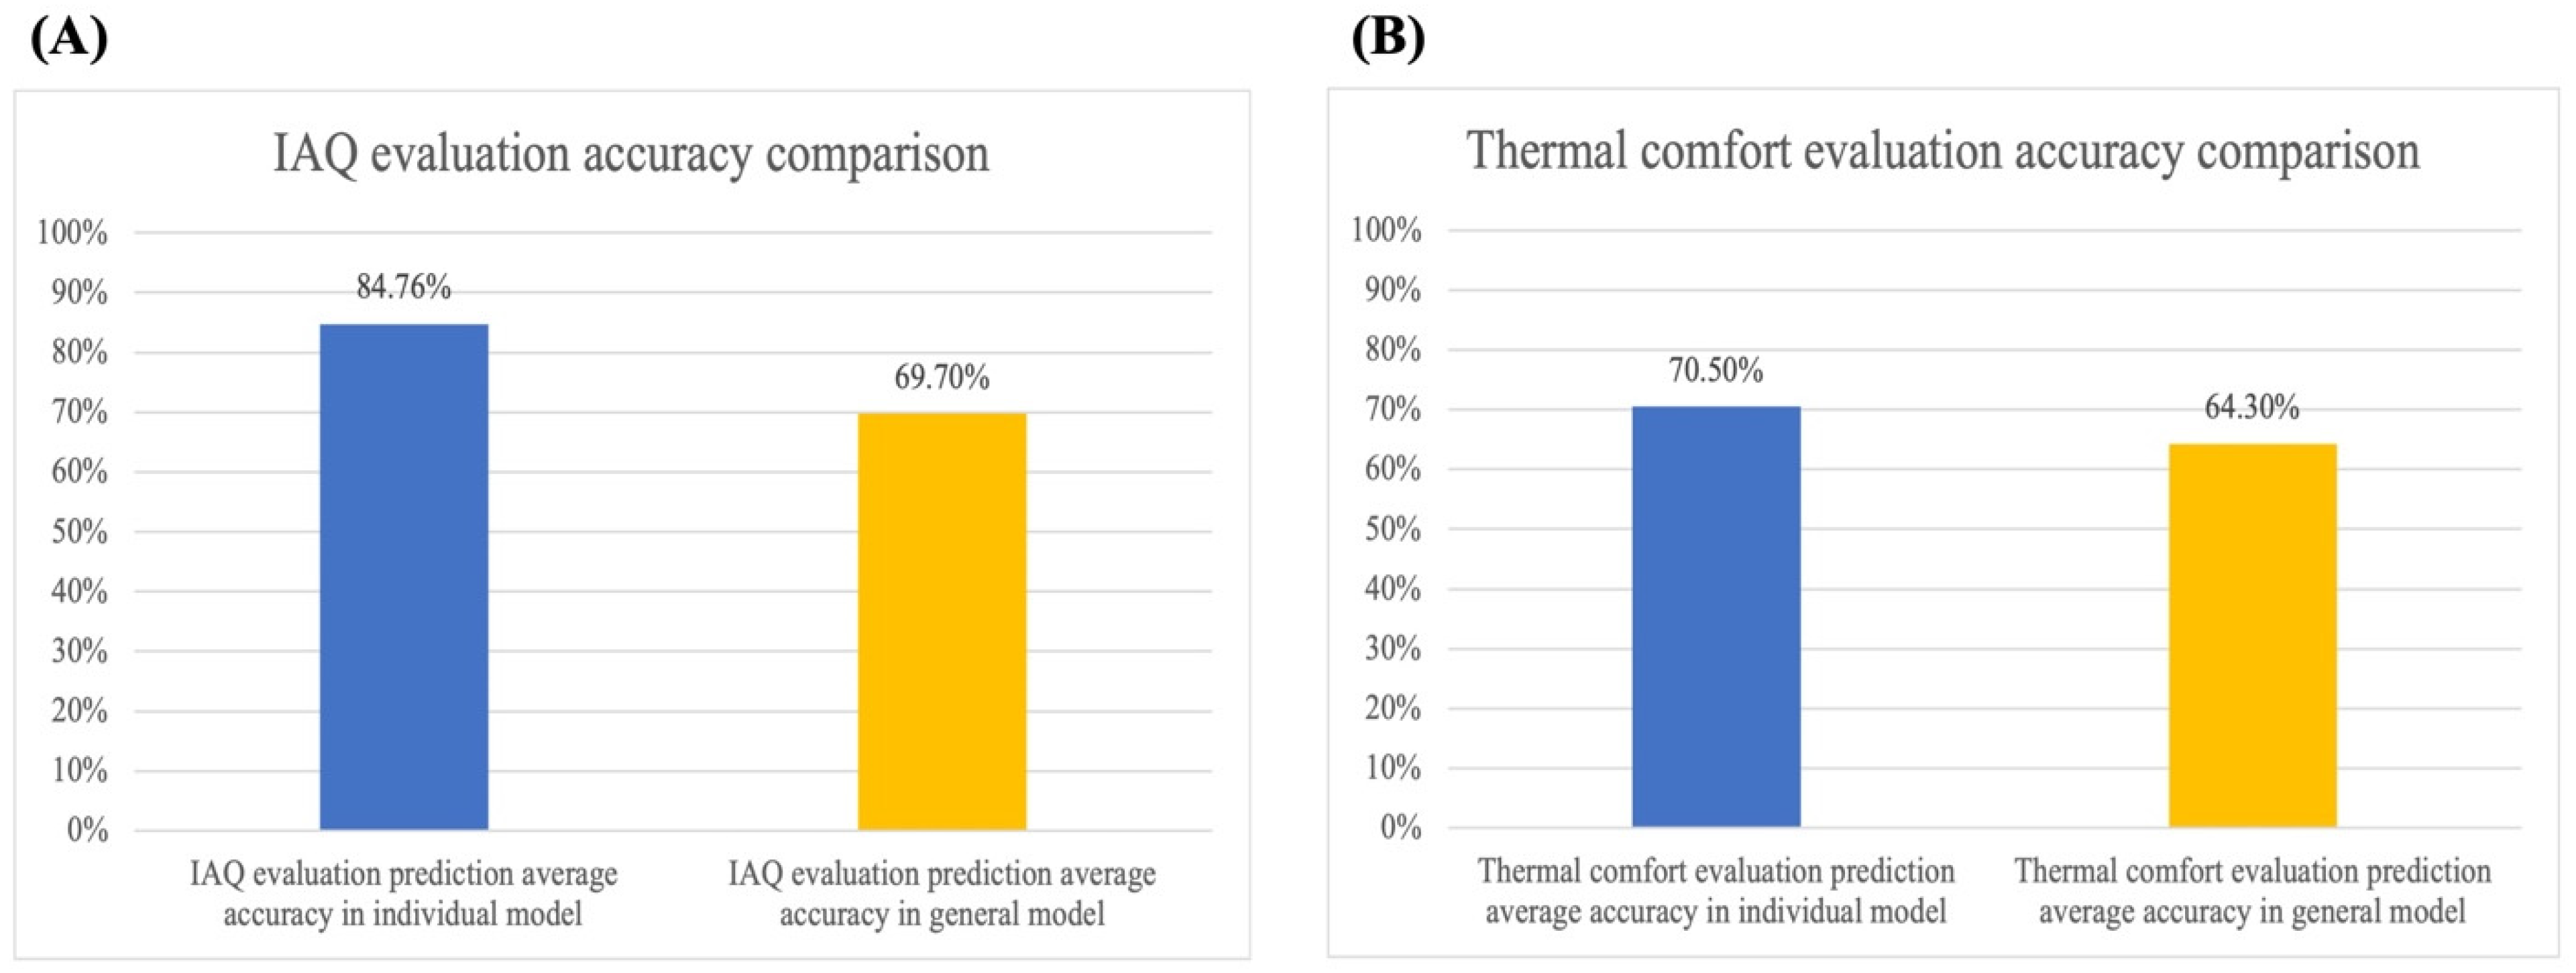
Comparative analysis between individual and general models, illustrated in
Figure 9, demonstrated consistently superior performance of individual models. The general model, despite incorporating a larger dataset (605 sets, 33% of total data), achieved lower accuracy for both IAQ and thermal comfort predictions.
This performance gap reveals several critical insights about personalized environmental comfort modeling, highlighting the value of individual data patterns and their implications for system design and implementation.
The superior performance of individual models, despite using smaller datasets, suggests that personalized physiological patterns are more valuable than larger, aggregated datasets. This challenges the common assumption that increasing data volume automatically leads to better predictions. It also indicates that individual physiological responses to environmental conditions follow consistent patterns, which can be effectively captured through focused personal data collection.
The higher accuracy of individual models underscores the highly personalized nature of environmental comfort responses. This finding suggests that pursuing a one-size-fits-all model may fundamentally limit prediction accuracy. Consequently, building management systems may benefit more from adaptive, personalized algorithms than from general models trained on larger population datasets.
Although individual models deliver superior performance, they require dedicated data collection and processing for each occupant. This introduces a trade-off between accuracy and implementation complexity, which must be carefully considered in practical applications. The findings suggest a potential hybrid approach as follows: using general models as baselines and refining them with individual data for enhanced performance.
This performance difference is further detailed in
Figure 10, which shows comprehensive accuracy comparisons across all models. Individual models consistently outperformed the general model, with only one exception for IAQ evaluation and three for thermal comfort prediction.
This pattern reveals important insights about comfort prediction modeling. The consistency of individual model performance highlights key considerations for system design and resource allocation.
The near-universal superior performance of individual models suggests a fundamental limitation in generalized comfort prediction. Interestingly, in rare cases where general models outperformed individual ones, specific physiological or behavioral patterns may have aligned more closely with population averages. Analyzing these exceptions could provide valuable insights for improving both individual and general models.
The consistent accuracy advantage of individual models indicates that building management systems should prioritize individual calibration capabilities. However, the observed exceptions suggest that systems should maintain flexibility, allowing them to switch between individual and general models based on performance. This adaptive approach could lead to more robust and responsive environmental control systems.
The clear performance advantage of individual models justifies the additional computational and sensor resources required for personalized modeling. This finding suggests that investing in personal monitoring capabilities may yield greater value than expanding general model training data. Moreover, it highlights the importance of developing scalable personalization technologies for building management systems.
4.3. Physical Characteristics and Model Performance
Analysis of participants’ physical characteristics revealed an inverse relationship between BMI and prediction accuracy. Lower BMI correlated with higher prediction accuracy for both IAQ and thermal comfort evaluations, though this relationship requires further validation with a larger sample size and consideration of potential confounding factors.
This pattern may be explained by several physiological mechanisms. Individuals with lower BMIs typically have higher surface area-to-volume ratios, potentially resulting in more responsive thermoregulatory systems that produce clearer physiological signals. Additionally, differences in adipose tissue distribution may influence the clarity of physiological responses to environmental stimuli. These findings highlight the importance of considering physical characteristics when developing and implementing physiological-based environmental control systems.
4.4. Environmental and Physiological Response Patterns
Analysis of physiological responses to environmental conditions revealed distinct patterns across different experimental settings. In the downtown office environment, correlations were generally weaker, with only relative humidity showing a notable impact on heart rate. This limited correlation pattern may be attributed to frequent workplace interruptions such as meetings and phone calls, which introduced additional variables into the monitoring environment.
In contrast, the studio environment demonstrated stronger and more consistent correlations, particularly between relative humidity and skin temperature and between PM2.5 levels and EDA. The higher significance of correlations in the studio environment supported its selection as the primary data source for prediction model development and suggests that space typology and activity patterns may significantly influence the effectiveness of physiological monitoring systems.
It should be noted that although all experiments were conducted between 9:00 a.m. and 3:00 p.m., diurnal variations in physiological responses (e.g., differences in stress levels and thermal comfort between morning and afternoon) may influence the observed data. While our current analysis does not explicitly model these potential time-of-day effects, this represents a limitation. Future studies should incorporate time as a covariate or extend data collection to a full 24 h cycle to better isolate diurnal influences.
4.5. Significance Rankings of Physiological Indicators
Among physiological indicators, EDA emerged as the most reliable predictor of environmental conditions, showing consistent correlations with multiple IEQ parameters. However, the strength of correlations varied across different environmental factors. Relative humidity demonstrated the strongest impact on physiological responses, while CO2 levels showed the least influence. These findings align with individual analysis results, supporting the robustness of the observed relationships across different analytical approaches.
4.6. Practical Implications and Model Applications
The findings from this study have several practical implications for building design and operation. The superior performance of individual prediction models over the general model suggests that personalized approaches may be more effective for environmental control systems. This finding has significant implications for the design of smart building systems, particularly in spaces with dedicated occupants or small occupancy numbers.
The higher accuracy in IAQ prediction compared to thermal comfort suggests that different aspects of environmental quality may require distinct modeling approaches. Future building management systems might benefit from modular designs that implement different prediction algorithms for various environmental parameters.
The significant correlations between specific physiological signals and environmental conditions provide guidance for sensor deployment in future building systems. The strong performance of electrodermal activity as a predictor for multiple environmental parameters suggests that it should be prioritized in physiological monitoring systems, while the weaker correlations with CO2 levels indicate that traditional emphasis on CO2 monitoring may need reconsideration.
Finally, the gender-based and spatial differences in correlation patterns highlight the importance of considering both occupant characteristics and space typology when designing environmental control systems. These findings suggest that optimal building operation may require flexible systems capable of adapting to both the characteristics of occupants and the specific properties of different spaces.
The empirical evidence presented offers important contributions to both the theoretical understanding and practical applications of physiological monitoring for building environmental control.
5. Conclusions and Future Studies
5.1. Conclusions
This research established significant correlations between indoor environmental quality (IEQ) and human physiological responses in commercial settings, successfully developing predictive models for an automatic ventilation system. The experimental design encompassed two distinct spaces with 14 participants total (4 volunteers in one space and 10 in another), aged 22–35, all healthy with no history of asthma. Participants engaged in normal work or study activities for 1–3 days, 4–6 h daily, while environmental and physiological data were continuously monitored.
Environmental monitoring utilized centrally positioned sensors for indoor conditions, with additional outdoor PM2.5 sensors on balconies due to the sealed nature of the environments. Physiological monitoring employed two smartwatches tracking heart rate, skin temperature, EDA, and stress levels, complemented by bi-hourly surveys assessing thermal comfort and air quality satisfaction.
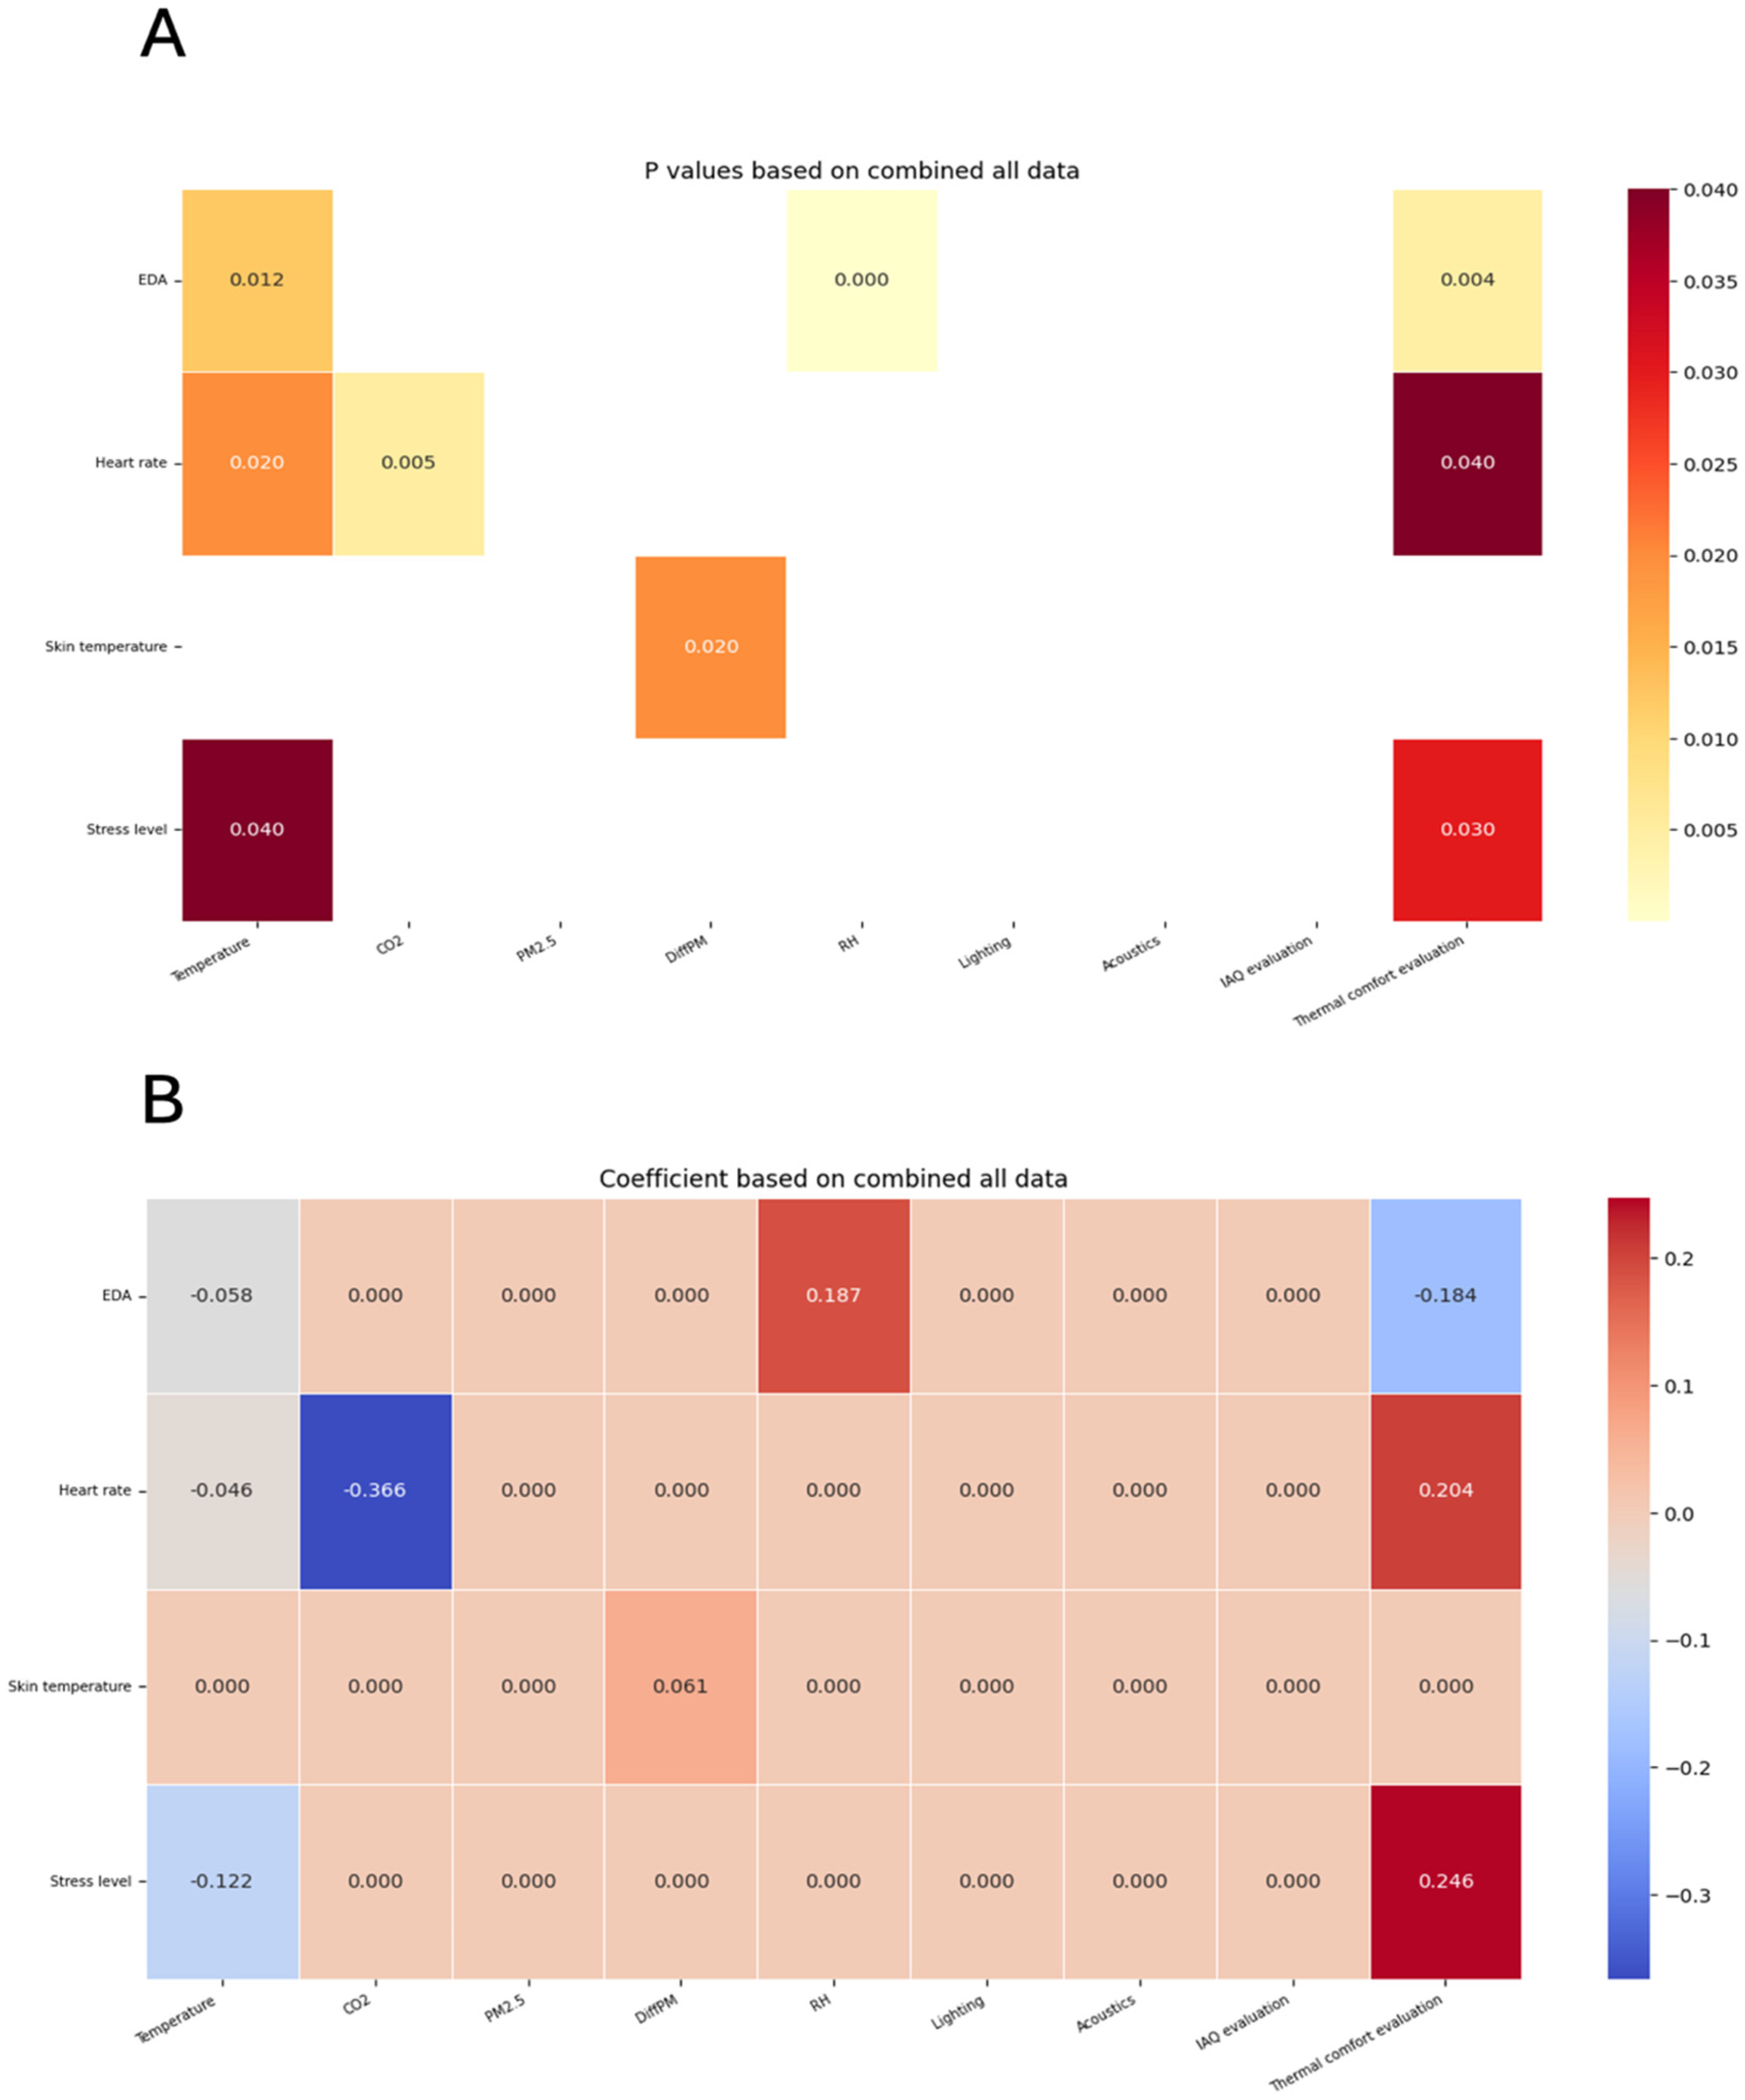
The data analysis revealed several key findings. First, significant correlations emerged between IEQ indicators and physiological responses, with indoor temperature, PM2.5, and relative humidity showing the strongest impacts on EDA, skin temperature, and stress levels, respectively (p < 0.05). Gender analysis further revealed distinct response patterns, with males showing greater overall sensitivity to IEQ indicators, while females demonstrated higher sensitivity specifically to indoor air quality and thermal comfort conditions.
Individual prediction models significantly outperformed the general model, achieving 84.76% accuracy for IAQ evaluation compared to 69.7% for the general model and 70.5% versus 64.3% for thermal comfort prediction. Physical characteristics, particularly BMI, showed potential influence on prediction accuracy, though this relationship requires further validation.
In conclusion, this study demonstrates the potential of integrating physiological monitoring and environmental data to optimize indoor environmental quality through predictive modeling. By highlighting the intricate relationships between IEQ factors and human responses, the findings underscore the importance of personalized approaches in building design and environmental control systems. These insights pave the way for more human-centric, energy-efficient solutions in commercial building settings.
5.2. Future Studies and Study Limitations
This study identified several key limitations that inform future research directions. The experimental devices presented various technical challenges that need to be addressed. The smartwatches, particularly the Empatica Embrace 2, experienced occasional disconnections and loose fits, while PM2.5 sensors encountered data loss due to unstable Wi-Fi connections. While HOBO sensors proved reliable, manual recording requirements for lighting sensors introduced potential inaccuracies. Future studies should employ more precise and reliable sensors, along with advanced smartwatch technology, to ensure greater data accuracy.
A significant demographic limitation was the focus on young adults aged 22–35 years, which restricts our understanding of how IEQ affects physiological responses across different age groups. This age restriction, while practical for initial study scope and participant availability, potentially overlooks important age-related variations in environmental perception and physiological responses. Aging is known to influence thermoregulatory efficiency, cardiovascular adaptability, and skin conductance properties, all of which could significantly impact IEQ response patterns.
Future research directions should carefully consider the contextual framework of this study. The findings presented here were obtained within the specific context of Los Angeles’ Mediterranean climate zone (ASHRAE Climate Zone 3B), characterized by moderate temperature variations ranging from 10 to 35 °C and relative humidity between 30 and 70%. This climate context may significantly influence occupant responses and adaptation patterns, suggesting the need for validation studies across different climate zones with more extreme conditions.
The building typology also presents important considerations for future research. Our findings primarily apply to commercial office spaces with specific ventilation strategies—variable air volume systems in the downtown office and mixed-mode ventilation in the studio space. Future studies should examine how different building types, ventilation strategies, and space layouts might influence the relationship between physiological responses and environmental conditions. Particular attention should be paid to how occupant behavior and comfort preferences might vary between open-plan offices, cellular offices, and other workplace configurations.
Regional building standards and cultural expectations about comfort also merit consideration in future research. While this study adhered to ASHRAE 55-2017 guidelines, different regions maintain varying comfort standards and energy regulations. Future studies should examine how these regional variations might affect the applicability and effectiveness of physiological-based environmental control systems.
Participant behavior also impacted data quality, as activities such as walking or sleeping interfered with data consistency. Future experimental protocols should implement more controlled activity guidelines to minimize disruptions while maintaining ecological validity. The correlation analysis and prediction modeling methods could benefit from additional techniques and machine learning algorithms to validate and enhance the prediction models.
The relatively small dataset presented challenges related to overfitting, limiting the model’s generalizability. Future research should address these limitations through larger datasets and more robust cross-validation techniques. Additional studies should also explore wider demographic ranges and environmental contexts to enhance the broader applicability of these findings.


