
The Impacts of Water Policies and Hydrological Uncertainty on the Future Energy Transition of the Power Sector in Shanxi Province, China


Abstract
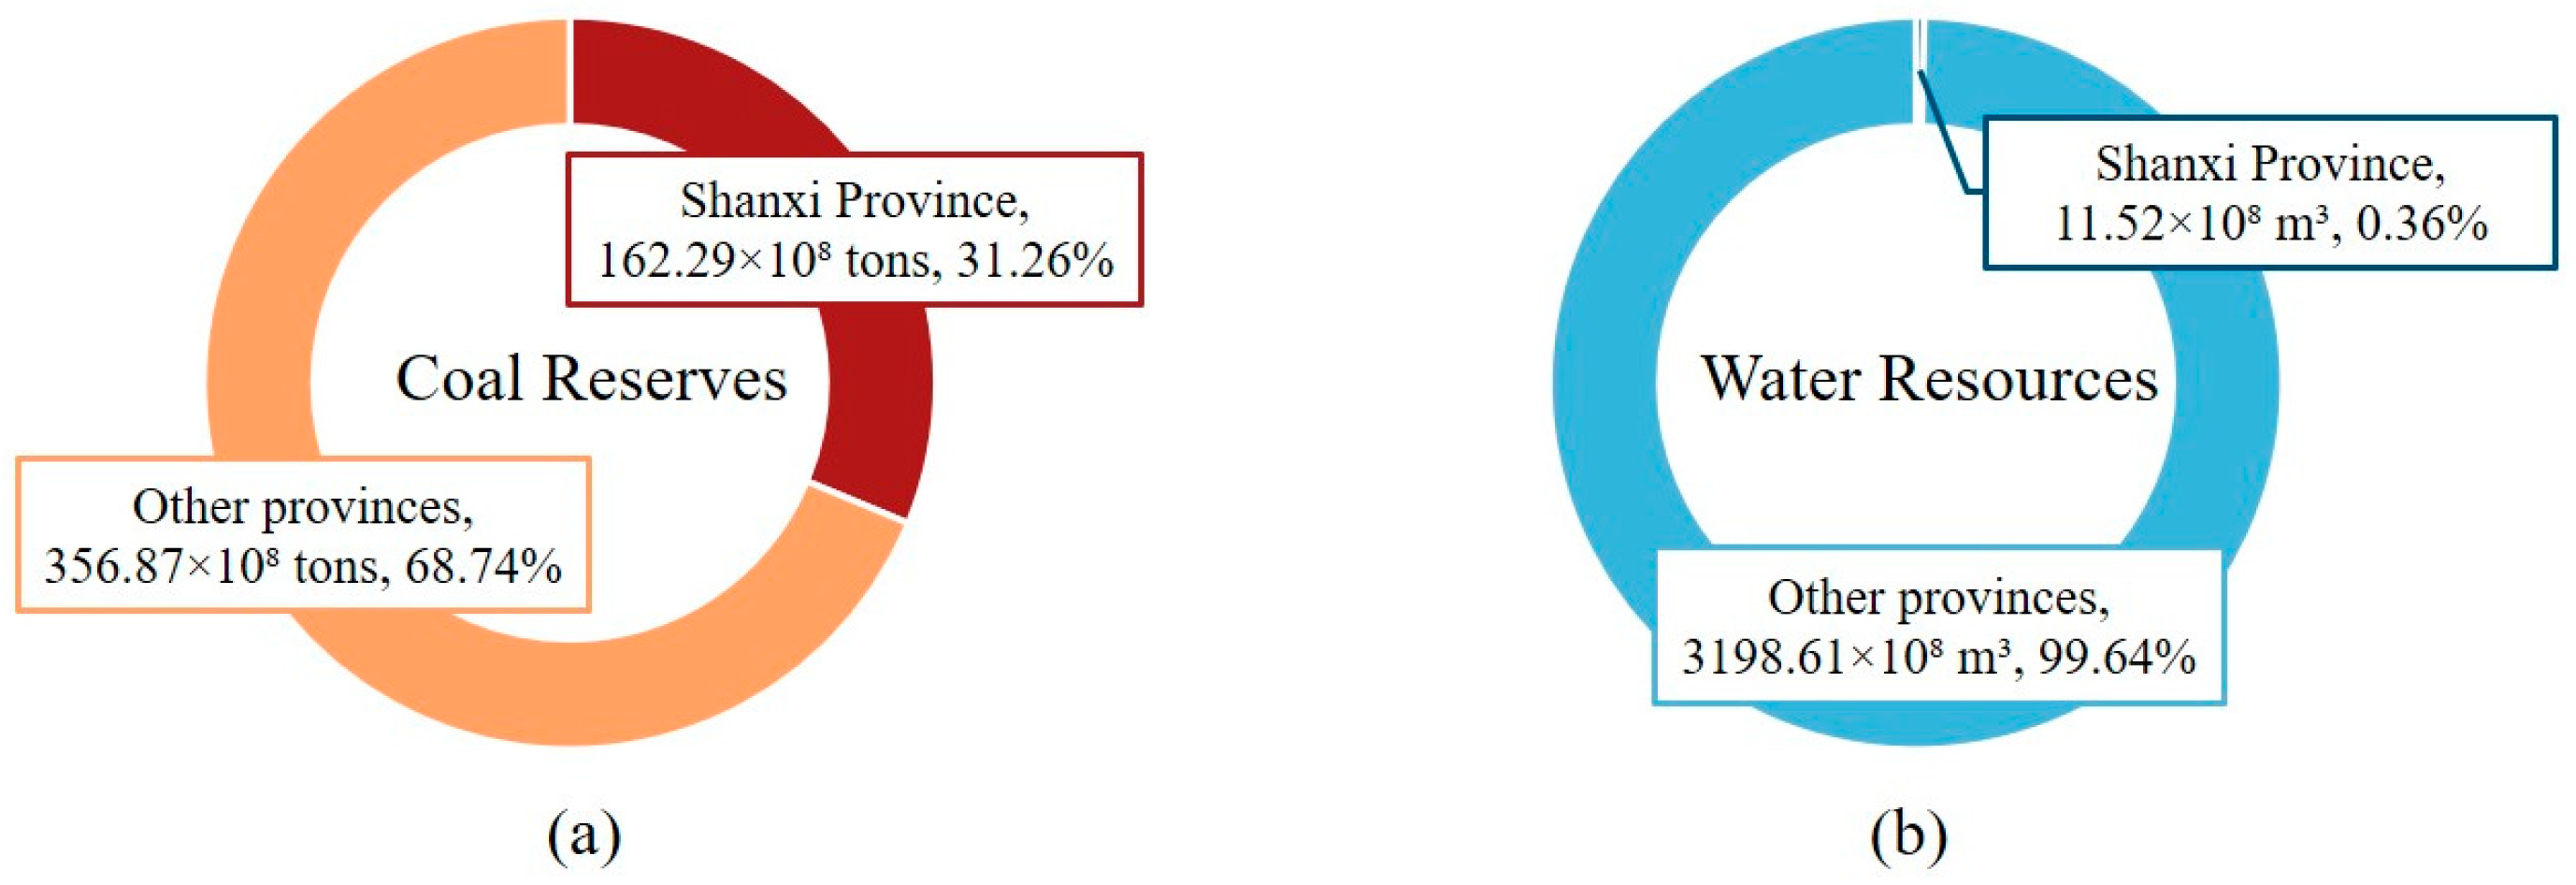
1. Introduction
2. Research Methodology
2.1. Optimization Model
2.2. Hilbert–Huang Transform
2.3. Water Resource Projection
3. Data Analysis and Scenario Design
3.1. Data
3.2. Scenario Design
4. Results and Discussion
4.1. Optimization Results Considering Water Conservation Policies
4.2. Optimization Results Under Changing Water Resource Conditions
4.2.1. Characteristics of Regional Water Resources
4.2.2. Projections of Regional Water Resources
4.2.3. Optimization Results
4.2.4. Water Allocation Scheme Discussion
5. Conclusions
Supplementary Materials
Author Contributions
Funding
Data Availability Statement
Conflicts of Interest
References
- Zhang, S.; Yu, Y.; Kharrazi, A.; Ren, H.; Ma, T. Quantifying the synergy and trade-offs among economy-energy-environment-social targets: A perspective of industrial restructuring. J. Environ. Manag. 2022, 316, 115285. [Google Scholar] [CrossRef] [PubMed]
- Wang, X.; Yao, S.; Dou, M. Quantifying the economic-energy-carbon synergy and trade-offs induced by China’s water supply constraints. J. Clean. Prod. 2024, 467, 143011. [Google Scholar] [CrossRef]
- Wang, Y.; Zhou, Z.; Betrie, G.; Zhang, K.; Yan, E. Power generation-cooling water Nexus: Impacts of cooling water shortage on power system operation—A simulation case study in Illinois, U.S. Appl. Energy 2025, 377, 124440. [Google Scholar] [CrossRef]
- Zhao, X.; Liao, X.; Zhang, C.; Zhang, X.; Mao, G.; Zhang, S.; Tillotson, M.R. Unveiling the dynamic of water-electricity conflict within and beyond megacity boundary. J. Environ. Manag. 2021, 286, 112259. [Google Scholar] [CrossRef]
- Tang, B.; Wu, Y.; Yu, B.; Li, R.; Wang, X. Co-current analysis among electricity-water-carbon for the power sector in China. Sci. Total Environ. 2020, 745, 141005. [Google Scholar] [CrossRef]
- Zhang, B.; Li, Y.; Zhang, C.; Hu, C.; Fu, G.; Cai, X. Dual water-electricity cooperation improves economic benefits and water equality in the Lancang-Mekong River Basin. Nat. Commun. 2023, 14, 6228. [Google Scholar] [CrossRef]
- Afsari Mamaghani, F.; Omidvar, B.; Avami, A.; Nabi-Bidhendi, G. An optimal integrated power and water supply planning model considering Water-Energy-Emission nexus. Energy Convers. Manag. 2023, 277, 116595. [Google Scholar] [CrossRef]
- Obringer, R.; Nateghi, R.; Knee, J.; Madani, K.; Kumar, R. Urban water and electricity demand data for understanding climate change impacts on the water-energy nexus. Sci. Data 2024, 11, 108. [Google Scholar] [CrossRef]
- Szinai, J.K.; Deshmukh, R.; Kammen, D.M.; Jones, A.D. Evaluating cross-sectoral impacts of climate change and adaptations on the energy-water nexus: A framework and California case study. Environ. Res. Lett. 2020, 15, 124065. [Google Scholar] [CrossRef]
- Lin, G.; Jiang, D.; Fu, J.; Dong, D.; Sun, W.; Li, X. Spatial Relationships of Water Resources with Energy Consumption at Coal Mining Operations in China. Mine Water Environ. 2020, 39, 407–415. [Google Scholar] [CrossRef]
- Jin, Y.; Wang, L.; He, D. Water consumption of electric power system in China: From electricity generation to consumption. Environ. Sci. Pollut. Res. 2023, 30, 101903–101910. [Google Scholar] [CrossRef] [PubMed]
- Zhu, Y.; Jiang, S.; Zhao, Y.; Li, H.; He, G.; Li, L. Life-cycle-based water footprint assessment of coal-fired power generation in China. J. Clean. Prod. 2020, 254, 120098. [Google Scholar] [CrossRef]
- Wang, X.; Lu, Z.; Li, T.; Zhang, P. Carbon-neutral power system transition pathways for coal-dominant and renewable Resource-abundant regions: Inner Mongolia as a case study. Energy Convers. Manag. 2023, 285, 117013. [Google Scholar] [CrossRef]
- Zhang, C.; Zhong, L.; Liang, S.; Sanders, K.T.; Wang, J.; Xu, M. Virtual scarce water embodied in inter-provincial electricity transmission in China. Appl. Energy 2017, 187, 438–448. [Google Scholar] [CrossRef]
- Xu, Z.; Tan, S.; Yao, L.; Lv, C. Exploring water-saving potentials of US electric power transition while thirsting for carbon neutrality. Energy 2024, 292, 130566. [Google Scholar] [CrossRef]
- Zohrabian, A.; Sanders, K.T. Assessing the impact of drought on the emissions- and water-intensity of California’s transitioning power sector. Energy Policy 2018, 123, 461–470. [Google Scholar] [CrossRef]
- Xi, S.; Zhang, Y.; Liu, J.; Zhang, C.; Zhang, K.; Wang, J. Evolution of interprovincial virtual water flows along with electricity transmission and its impact on water scarcity in China. J. Clean. Prod. 2021, 322, 128957. [Google Scholar] [CrossRef]
- Chini, C.M.; Nugent, J.; Stillwell, A.S.; Peer, R.A.M. A critical review on the accounting of energy in virtual water trade. J. Clean. Prod. 2022, 379, 134558. [Google Scholar] [CrossRef]
- van Huyssteen, T.; Thiam, D.; Nonhebel, S. The water, land, and carbon intensity of electricity production: The case of South Africa. J. Clean. Prod. 2023, 411, 136945. [Google Scholar] [CrossRef]
- Nair, S.; Timms, W. Freshwater footprint of fossil fuel production and thermal electricity generation and water stresses across the National Electricity Market (NEM) region of Australia. J. Clean. Prod. 2020, 267, 122085. [Google Scholar] [CrossRef]
- Fan, J.; Kong, L.; Zhang, X. Synergetic effects of water and climate policy on energy-water nexus in China: A computable general equilibrium analysis. Energy Policy 2018, 123, 308–317. [Google Scholar] [CrossRef]
- Lv, J.; Li, Y.; Huang, G.; Nie, S.; Gong, J.; Ma, Y.; Li, Y. Synergetic management of energy-water nexus system under uncertainty: An interval bi-level joint-probabilistic programming method. J. Clean. Prod. 2021, 292, 125942. [Google Scholar] [CrossRef]
- Li, M.; Dai, H.; Xie, Y.; Tao, Y.; Bregnbaek, L.; Sandholt, K. Water conservation from power generation in China: A provincial level scenario towards 2030. Appl. Energy 2017, 208, 580–591. [Google Scholar] [CrossRef]
- Huang, J.; Tan, Q.; Zhang, T.; Wang, S. Energy-water nexus in low-carbon electric power systems: A simulation-based inexact optimization model. J. Environ. Manag. 2023, 338, 117744. [Google Scholar] [CrossRef]
- Liao, X.; Huang, L.; Xiong, S.; Ma, X. Optimizing future electric power sector considering water-carbon policies in the water-scarce North China Grid. Sci. Total Environ. 2021, 768, 144865. [Google Scholar] [CrossRef]
- Xu, J.; Lv, C.; Yao, L.; Hou, S. Intergenerational equity based optimal water allocation for sustainable development: A case study on the upper reaches of Minjiang River, China. J. Hydrol. 2019, 568, 835–848. [Google Scholar] [CrossRef]
- Jin, Y.; Scherer, L.; Sutanudjaja, E.H.; Tukker, A.; Behrens, P. Climate change and CCS increase the water vulnerability of China’s thermoelectric power fleet. Energy 2022, 245, 123339. [Google Scholar] [CrossRef]
- Wasko, C.; Stephens, C.; Peterson, T.J.; Nathan, R.; Pepler, A.; Hettiarachchi, S.; Vogel, E.; Johnson, F.; Westra, S. Understanding the implications of climate change for Australia’s water resources: Challenges and future directions. J. Hydrol. 2024, 645, 132221. [Google Scholar] [CrossRef]
- Li, H.; Cui, X.; Hui, J.; He, G.; Weng, Y.; Nie, Y.; Wang, C.; Cai, W. Catchment-level water stress risk of coal power transition in China under 2 °C/1.5 °C targets. Appl. Energy 2021, 294, 116986. [Google Scholar] [CrossRef]
- Zhu, Y.; Zhao, Y.; Li, H.; Wang, L.; Li, L.; Jiang, S. Quantitative analysis of the water-energy-climate nexus in Shanxi Province, China. Energy Procedia 2017, 142, 2341–2347. [Google Scholar] [CrossRef]
- Wu, B.; Zeng, H.; Zhu, W.; Yan, N.; Ma, Z. Enhancing China’s Three Red Lines strategy with water consumption limitations. Sci. Bull. 2021, 66, 2057–2060. [Google Scholar] [CrossRef] [PubMed]
- Liu, L.; Brough, C.B.; Wu, W. When water conservation matters: Examining how water scarcity experiences create windows of opportunity for effective water-saving policy initiatives. Environ. Sci. Policy 2022, 137, 61–69. [Google Scholar] [CrossRef]
- National Development and Reform Commission. National Water Conservation Action Program; National Development and Reform Commission: Beijing, China, 2019. (In Chinese)
- Findanis, E.; Loukas, A. The implication of information theory for estimating and detangling hydrological modelling uncertainty. J. Hydrol. 2024, 643, 131941. [Google Scholar] [CrossRef]
- Chen, X.; Wang, X.; Lian, J. Applicability Study of Hydrological Period Identification Methods: Application to Huayuankou and Lijin in the Yellow River Basin, China. Water 2021, 13, 1265. [Google Scholar] [CrossRef]
- Feng, C.; Tang, X.; Jin, Y.; Guo, Y.; Zhang, X. Regional energy-water nexus based on structural path betweenness: A case study of Shanxi Province, China. Energy Policy 2019, 127, 102–112. [Google Scholar] [CrossRef]
- Huang, N.E.; Shen, Z.; Long, S.R.; Wu, M.C.; Shih, H.H.; Zheng, Q.; Yen, N.C.; Tung, C.C.; Liu, H.H. The empirical mode decomposition and the Hilbert spectrum for nonlinear and non-stationary time series analysis. Proc. R. Soc. A 1998, 454, 903–995. [Google Scholar] [CrossRef]
- Wang, T.; Zhang, M.; Yu, Q.; Zhang, H. Comparing the applications of EMD and EEMD on time–frequency analysis of seismic signal. J. Appl. Geophys. 2012, 83, 29–34. [Google Scholar] [CrossRef]
- Giarnetti, S.; Leccese, F.; Caciotta, M. Non recursive Nonlinear Least Squares for periodic signal fitting. Measurement 2017, 103, 208–216. [Google Scholar] [CrossRef]
- Ministry of Natural Resources of the People’s Republic of China. Standard Map Service. Available online: http://bzdt.ch.mnr.gov.cn/ (accessed on 12 August 2024).
- Ministry of Natural Resources of the People’s Republic of China. China Mineral Resources 2021; Geological Publishing House: Beijing, China, 2021. (In Chinese) [Google Scholar]
- Ministry of Water Resources of the People’s Republic of China. China Water Resources Bulletin 2020; China Water & Power Press: Beijing, China, 2021. (In Chinese)
- Department of Ecology and Environment of Shanxi Province. List of Key Emission Units in the Power Generation Sector of Shanxi Province for 2019–2020; Department of Ecology and Environment of Shanxi Province: Taiyuan, China, 2022. (In Chinese)
- National Bureau of Statistics of China. China Statistical Yearbook-2021; China Statistics Press: Beijing, China, 2021. (In Chinese)
- China Electricity Council. China Electric Power Statistical Yearbook 2021; China Statistics Press: Beijing, China, 2021. (In Chinese) [Google Scholar]
- Shanxi Provincial Energy Administration. Shanxi Electric Power Industry “14th Five-Year” Development Plan; Shanxi Provincial Energy Administration: Taiyuan, China, 2023. (In Chinese)
- DB14/T 1049.2-2021; Shanxi Provincial Administration for Market Regulation. Shanxi Provincial Norm of Water Intake—Part 2: Industry. Shanxi Provincial Water Conservancy Standardization Technical Committee: Taiyuan, Shanxi, 2021. (In Chinese)
- GB/T 18916.1-2021; State Administration for Market Regulation. Norm of Water Intake—Part 1: Thermal Power Production. National Standards Committee: Beijing, China, 2021. (In Chinese)
- Shanxi Provincial Department of Water Resources. Shanxi Water Resources Bulletin (1994–2022); Shanxi Provincial Department of Water Resources: Taiyuan, China, 1995–2023. (In Chinese)
- Zuo, Q.; Wu, Q.; Jin, J.; Ma, J.; Tao, J. The basic principle and theoretical system of regional water balance. Adv. Water Sci. 2022, 33, 165–173. (In Chinese) [Google Scholar]
- Ding, S.; Hipel, K.W.; Dang, Y. Forecasting China’s electricity consumption using a new grey prediction model. Energy 2018, 149, 314–328. [Google Scholar] [CrossRef]


| GDP Growth Rate | The Water Intensity Reduction Target | ||
|---|---|---|---|
| 20% (XS) | 25% (YS) | 30% (ZS) | |
| 6% (LS) | 0.480 | 0.450 | 0.420 |
| 7% (MS) | 0.527 | 0.494 | 0.461 |
| 8% (HS) | 0.579 | 0.542 | 0.506 |
| GDP Growth Rate | Water Intensity Reduction Target | |||
|---|---|---|---|---|
| 20% (XS) | 25% (YS) | 30% (ZS) | 0% (NS) | |
| 6% (LS) | 143.1% | 132.2% | 122.7% | 145.8% |
| 7% (MS) | 157.7% | 145.8% | 135.2% | 158.2% |
| 8% (HS) | 171.6% | 160.6% | 148.8% | 171.6% |
| GDP Growth Rate | Water Intensity Reduction Target | |||
|---|---|---|---|---|
| 20% (XS) | 25% (YS) | 30% (ZS) | 0% (NS) | |
| 6% (LS) | 79.7% | 73.7% | 68.4% | 81.2% |
| 7% (MS) | 82.2% | 76.0% | 70.5% | 82.4% |
| 8% (HS) | 83.6% | 78.2% | 72.5% | 83.6% |
Disclaimer/Publisher’s Note: The statements, opinions and data contained in all publications are solely those of the individual author(s) and contributor(s) and not of MDPI and/or the editor(s). MDPI and/or the editor(s) disclaim responsibility for any injury to people or property resulting from any ideas, methods, instructions or products referred to in the content. |
© 2025 by the authors. Licensee MDPI, Basel, Switzerland. This article is an open access article distributed under the terms and conditions of the Creative Commons Attribution (CC BY) license (https://creativecommons.org/licenses/by/4.0/).
Share and Cite
Chen, X.; Lian, J.; Guo, Q. The Impacts of Water Policies and Hydrological Uncertainty on the Future Energy Transition of the Power Sector in Shanxi Province, China. Energies 2025, 18, 2281. https://doi.org/10.3390/en18092281
Chen X, Lian J, Guo Q. The Impacts of Water Policies and Hydrological Uncertainty on the Future Energy Transition of the Power Sector in Shanxi Province, China. Energies. 2025; 18(9):2281. https://doi.org/10.3390/en18092281
Chicago/Turabian StyleChen, Xingtong, Jijian Lian, and Qizhong Guo. 2025. "The Impacts of Water Policies and Hydrological Uncertainty on the Future Energy Transition of the Power Sector in Shanxi Province, China" Energies 18, no. 9: 2281. https://doi.org/10.3390/en18092281
APA StyleChen, X., Lian, J., & Guo, Q. (2025). The Impacts of Water Policies and Hydrological Uncertainty on the Future Energy Transition of the Power Sector in Shanxi Province, China. Energies, 18(9), 2281. https://doi.org/10.3390/en18092281