1. Introduction
Photovoltaic (PV) systems are increasingly vital for meeting global energy demands and promoting sustainable development [
1,
2], The global installed capacity of PV systems has reached an estimated 2 TW gigawatts (GWs) as of 2024, demonstrating a remarkable compound annual growth rate (CAGR) of 26% over the past decade; this rapid expansion in PV capacity is driven by the increasing global demand for sustainable energy solutions and the urgent need to transition towards cleaner energy sources to mitigate climate change [
3]. As PV technology advances and deployment expands, particularly in regions with abundant solar resources like the Peruvian Altiplano [
4], the need for efficient and cost-effective monitoring solutions becomes paramount [
5]. Monitoring systems provide valuable insights into PV system performance, enabling optimization, fault detection, and informed decision-making for maximizing energy yield and ensuring long-term reliability [
6,
7,
8]. There are several examples of low-cost wireless monitoring systems for PV systems in the previous literature. Researchers at Tanta University in Egypt developed a low-cost IoT-based system using NodeMCU Wi-Fi modules and a Raspberry Pi to monitor electrical data and environmental conditions. The system uses the MQTT protocol for secure data transfer and open-source software for data analysis and visualization [
9]. Another example is a system that utilizes an Arduino platform with wireless ZigBee connectivity to collect electrical and environmental data at the PV-module level. This system is designed to meet the IEC-61724 standard requirements for PV system monitoring [
10]. Other researchers have proposed systems using ZigBee for online monitoring of grid-connected PV power plants and a wireless ZigBee microcontroller for remote monitoring of current, power, and voltage [
11].
This study focuses on the development and implementation of a low-cost wireless monitoring system for PV systems, designed for comprehensive performance analysis and with the potential for application in DC nanogrids [
12,
13]. The system, based on an Arduino Nano and Raspberry Pi architecture, captures real-time data on key electrical parameters (voltage, current, and power) and environmental conditions (temperature and irradiance) that influence PV system behavior.
Deployed on a 3kW grid-connected PV system [
14] in the Peruvian Altiplano, a region characterized by high solar irradiance and unique climatic conditions [
15], the monitoring system reveals significant variability in solar irradiance, including extreme events that can impact energy generation and system stability. This variability underscores the importance of continuous monitoring for understanding and optimizing PV system operation in challenging environments.
This research aims to
Present the design and implementation of a low-cost wireless monitoring system for PV systems.
Analyze the performance of a 3kW grid-connected PV system in the Peruvian Altiplano, focusing on the impact of solar irradiance variability.
Evaluate the system’s capabilities for capturing and analyzing extreme-irradiance events.
Discuss the application of the monitoring system in DC nanogrids, highlighting its adaptability and relevance for future PV deployments in remote areas.
This study contributes a practical and versatile tool for advancing sustainable energy solutions, with implications for both grid-connected PV systems and the emerging field of DC nanogrids. By providing insights into PV system performance under variable irradiance conditions, this research supports the development of more efficient and resilient solar energy solutions in diverse applications.
2. Design and Implementation of the Low-Cost Wireless Monitoring System
This section details the development and implementation of the low-cost wireless monitoring system for capturing and analyzing the performance of a 3 kW grid-connected photovoltaic (PV) system [
14]. The design prioritizes affordability and accessibility, utilizing readily available hardware and open-source software components. The system comprises an Arduino Nano microcontroller for data acquisition, a Raspberry Pi 3B+ for processing and communication, and a suite of sensors to measure key electrical and environmental parameters. This section will elaborate on the hardware and software components, system integration, configuration, and calibration procedures, providing a comprehensive overview of the monitoring system’s architecture and functionality.
2.1. Components: A Synergistic Blend of Hardware and Software
The monitoring system relies on a combination of hardware and software components to effectively capture and analyze data from the photovoltaic system. These components are detailed below:
2.1.1. Hardware Infrastructure
The hardware infrastructure forms the backbone of the monitoring system, providing the physical interface for capturing data from the PV system and transmitting them for further processing. We use the following items: Arduino Nano, Raspberry Pi 3B+, and sensors: PT100 temperature sensors (ZIEHL, Künzelsau, Germany), voltage divider (Haefely AG, Basel, Switzerland), ACS758 current sensor (Allegro MicroSystems, Manchester, NH, USA) and calibrated solar cell (Newport Corporation, Irvine, CA, USA).
2.1.2. Software Ecosystem
The software ecosystem complements the hardware infrastructure, providing the tools for data processing, visualization, and analysis. It comprises Arduino IDE 1.8.3 (to program Arduino Nano), Python 3.10 (for communication between Arduino Nano and the LabVIEW 5.0 NXG interface), and LabVIEW NXG 5.1 (for interface visualization).
This synergistic combination of hardware and software components provides a robust and versatile platform for capturing, analyzing, and visualizing the performance of the PV system. The careful selection and integration of these components ensure the accuracy, reliability, and efficiency of the monitoring system.
2.2. Connection and Configuration: Integrating Hardware and Software for PV System Monitoring
This subsection details the meticulous process of connecting and configuring the hardware and software components of the low-cost wireless monitoring system. This integration process is crucial for ensuring accurate data acquisition, reliable communication, and seamless visualization of the PV system’s performance.
2.2.1. Sensor Integration and Placement
The sensors are connected to the Arduino Nano, ensuring proper wiring and pin assignments. The PT100 temperature sensors are attached to the PV modules and the ambient environment using thermal paste and adhesive to ensure good thermal contact. The voltage divider circuit is connected to the PV system’s output, and the ACS758 current sensor is placed in series with the PV array’s wiring. The calibrated solar cell is positioned for optimal exposure to sunlight.
2.2.2. Establishing Wireless Communication
The Arduino Nano, responsible for data acquisition, is connected to the Raspberry Pi 3B+ via a USB cable. The Raspberry Pi, acting as the central processing unit, runs a Python script that establishes a wireless communication link between the Arduino and the LabVIEW interface on a separate computer. This wireless connection utilizes the Raspberry Pi’s built-in Wi-Fi capabilities, enabling remote monitoring and data acquisition without the constraints of physical tethering.
2.2.3. Configuring the LabVIEW Interface
The LabVIEW program, installed on a separate computer, is configured to receive data wirelessly from the Raspberry Pi. The interface is designed to provide real-time visualization of the acquired data, displaying them in user-friendly formats such as graphs and charts. It also includes functionalities for data logging, storage, and analysis, allowing for comprehensive assessment of the PV system’s performance.
2.2.4. Calibration and Validation
To ensure the accuracy and reliability of the monitoring system, each sensor undergoes a calibration process using appropriate reference instruments and methodologies. Calibration equations are established to correct for any deviations from ideal sensor behavior. The integrated system is then validated by comparing its measurements to those obtained from independent calibrated instruments, ensuring the overall integrity of the data acquisition and processing chain.
By meticulously connecting and configuring the hardware and software components and ensuring proper calibration, the monitoring system is primed to capture and analyze data from the PV system, enabling a comprehensive evaluation of its performance under various operating conditions.
Figure 1 depicts an electronic schematic diagram for a signal acquisition system. The design incorporates an Arduino Nano microcontroller as its central processing unit. Various sensors are interfaced with the Arduino Nano: temperature sensors (PT100 RTDs), voltage sensor, current sensor (ACS712), and solar irradiance sensor. The schematic also includes signal conditioning circuitry, such as operational amplifiers (likely LM324s based on the label “LM324NNDES” from Texas Instrument, Dallas, TX, USA), which are used to amplify or filter the sensor signals before they are fed into the Arduino Nano’s analog input pins.
2.3. The LabVIEW Interface: A Platform for Real-Time Visualization and Analysis
The LabVIEW interface plays a crucial role in this research, serving as the central hub for real-time data visualization, analysis, and storage. Designed with user-friendliness and versatility in mind, the interface facilitates a comprehensive understanding of the photovoltaic (PV) system’s performance under various operating conditions.
2.3.1. Real-Time Visualization
The interface displays real-time data from the PV system in various graphical formats, such as charts, graphs, and numerical displays. This allows for immediate observation of the system’s behavior and performance under different conditions.
2.3.2. Data Analysis
The LabVIEW interface incorporates tools for analyzing the acquired data. These tools may include statistical functions, filtering options, and signal processing techniques. This enables in-depth analysis of the PV system’s performance, including the identification of trends, anomalies, and potential areas for optimization.
2.3.3. Data Storage
The interface facilitates data logging and storage for future reference and analysis. The acquired data can be stored in various formats, such as text files, spreadsheets, or databases. This allows for long-term monitoring and evaluation of the PV system’s performance over extended periods.
2.3.4. Display and Analysis of Relevant Parameters
The interface is adapted to display and analyze specific parameters relevant to photovoltaic system performance, including
Energy Efficiency: The interface calculates and displays the energy efficiency of the PV system, providing insights into the system’s ability to convert solar energy into electrical energy.
Power Generation: The interface monitors and displays the power generation of the PV system in real time, allowing for assessment of the system’s output under various conditions.
Voltage and Current Fluctuations: The interface tracks and displays voltage and current fluctuations, enabling the identification of potential issues or anomalies in the PV system’s operation.
Figure 2 displays the graphical user interface (GUI) of the monitoring and data acquisition system, designed using LabVIEW software. This interface provides a visual platform for users to observe and analyze the performance of the photovoltaic (PV) system in real time. The GUI likely includes various displays and controls to monitor parameters such as voltage, current, power, temperature, and irradiance, allowing for comprehensive assessment and management of the PV system’s operation.
3. Data Acquisition from the Grid-Connected Photovoltaic System
This section outlines the procedures for collecting data from the 3 kW grid-connected photovoltaic (PV) system using the low-cost wireless monitoring system described in the previous section. The data acquisition process focuses on capturing key electrical and environmental parameters that influence the PV system’s performance, with particular attention paid to the variability in solar irradiance and the occurrence of extreme-irradiance events. These data will be crucial for analyzing the system’s behavior under different operating conditions and evaluating its overall efficiency and stability.
3.1. Photovoltaic System: A Case Study in the Peruvian Altiplano
This study focuses on a 3 kWp grid-connected photovoltaic (PV) system installed in the Peruvian Altiplano, a region characterized by high altitude, abundant solar resources, and unique climatic conditions. The system serves as a case study to investigate the performance of PV technology under the specific environmental challenges and opportunities presented by this region.
The PV system comprises the following key components:
3.1.1. PV Modules
The photovoltaic array of this system is composed of 12 modules in series, each with a power output of 270 watts-peak. With a total open-circuit voltage (Voc) of 462 volts and applying a safety factor of , we obtain a working voltage of volts. Therefore, we choose to assume a working voltage of 500 volts DC as this is the maximum voltage supported by the string inverter. These modules are responsible for converting solar irradiance into direct current (DC) electricity. The selection of module type and quantity is based on factors such as the desired power output, available space, and local climatic conditions.
3.1.2. Mounting Structure
The PV modules are mounted on a cabinet. This cabinet, designed to house the monitoring system, will contain the following components: Raspberry Pi 3B+, Arduino Nano, power supply module, step-down converter, lithium polymer battery, boost converter, OLED screen connectors, and connecting terminals. To guarantee a low-cost system, the selected hardware components are based on open-source projects with a relevant cost-effectiveness threshold.
Table 1 summarizes the monitoring node cost.
3.1.3. DC Combiner Box
The DC combiner box serves as a central point for collecting the electrical output from the PV modules. It includes fuses and surge protection devices to safeguard the system from electrical faults and ensure safe operation.
3.1.4. Inverter
The inverter converts the DC electricity generated by the PV modules into alternating current (AC) electricity, which is compatible with the local power grid. The inverter plays a crucial role in ensuring efficient and safe energy transfer to the grid by synchronizing its output with the grid’s voltage and frequency. For this work, we used the Sunny boy 3.0 SMA Inverter (SMA Solar Technology AG, Niestetal, Germany).
3.1.5. The AC Disconnect Switch
It provides a means to isolate the PV system from the power grid, enabling safe maintenance and troubleshooting activities.
3.1.6. Monitoring System
The low-cost wireless monitoring system developed in this study is integrated into the PV system to capture real-time data on its performance. These data include electrical parameters (voltage, current, and power) and environmental conditions (temperature and irradiance), providing valuable insights into the system’s behavior under various operating conditions.
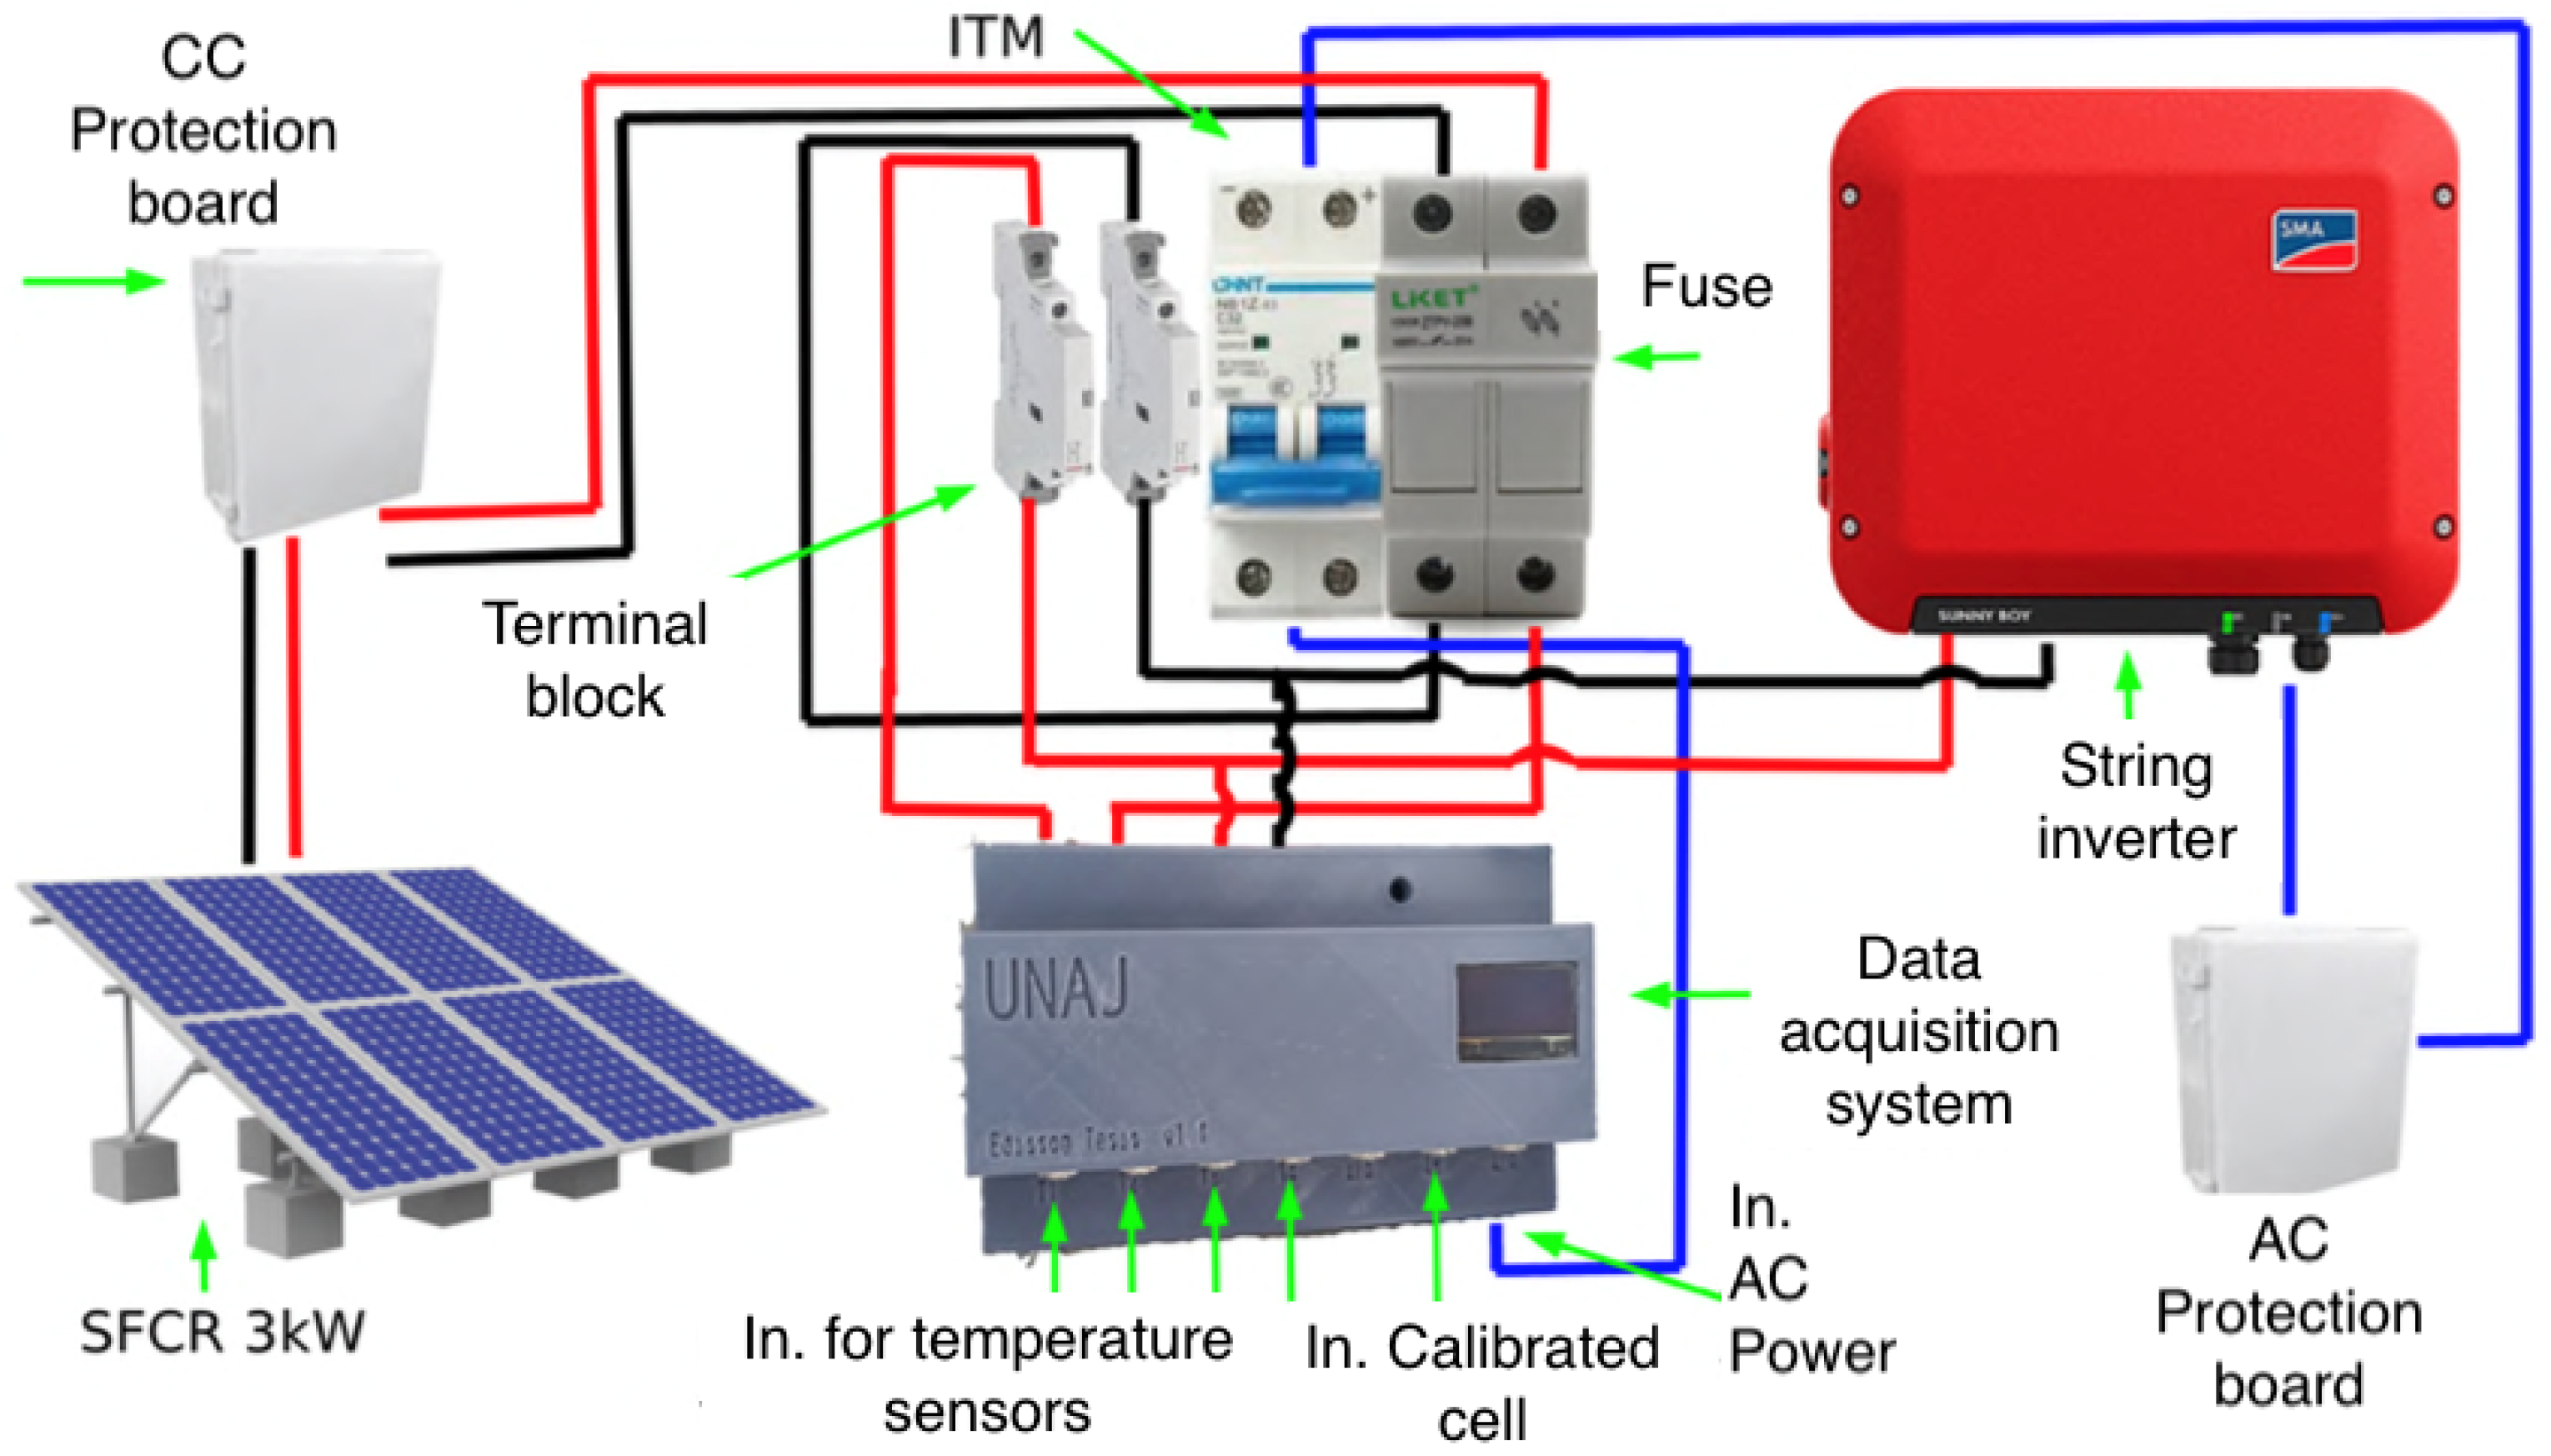
Figure 3 shows the connection diagram of the data acquisition system in the 3 kW grid-connected PV system with a string inverter.
Figure 4 presents the physical installation of the 3 kW grid-connected PV system. The image highlights the arrangement of key components, including the solar panels, the string inverter, protection boards (CC and AC), and the data acquisition system. The solar panels are mounted on a support structure, and the other components are housed in a cabinet. The image provides a visual representation of the complete PV system setup.
The PV system is installed at the campus Ayabacas of the National University of Juliaca on the rooftop of the Renovable Energy Institute building, where three photovoltaic systems are connected to the public network. The altitude of the location is 3820 m above sea level. The Altiplano’s high altitude and clear skies result in high levels of solar irradiance, making it a favorable location for solar energy generation. However, the region also experiences significant variability in irradiance, including extreme events with exceptionally high irradiance levels. These factors pose unique challenges and opportunities for PV system performance, which this study aims to investigate.
By studying the performance of this grid-connected PV system under real-world operating conditions in the Altiplano, this research aims to
Gain insights into the impact of solar irradiance variability on energy generation and system efficiency.
Evaluate the effectiveness of the low-cost monitoring system in capturing and analyzing key performance parameters.
Provide valuable data and analysis for optimizing PV system design and operation in regions with challenging environmental conditions.
The findings from this case study will contribute to a better understanding of PV system behavior in high-altitude environments and support the development of more efficient and resilient solar energy solutions in the Peruvian Altiplano and other similar regions.
3.2. Continuous Monitoring: A Data-Driven Approach
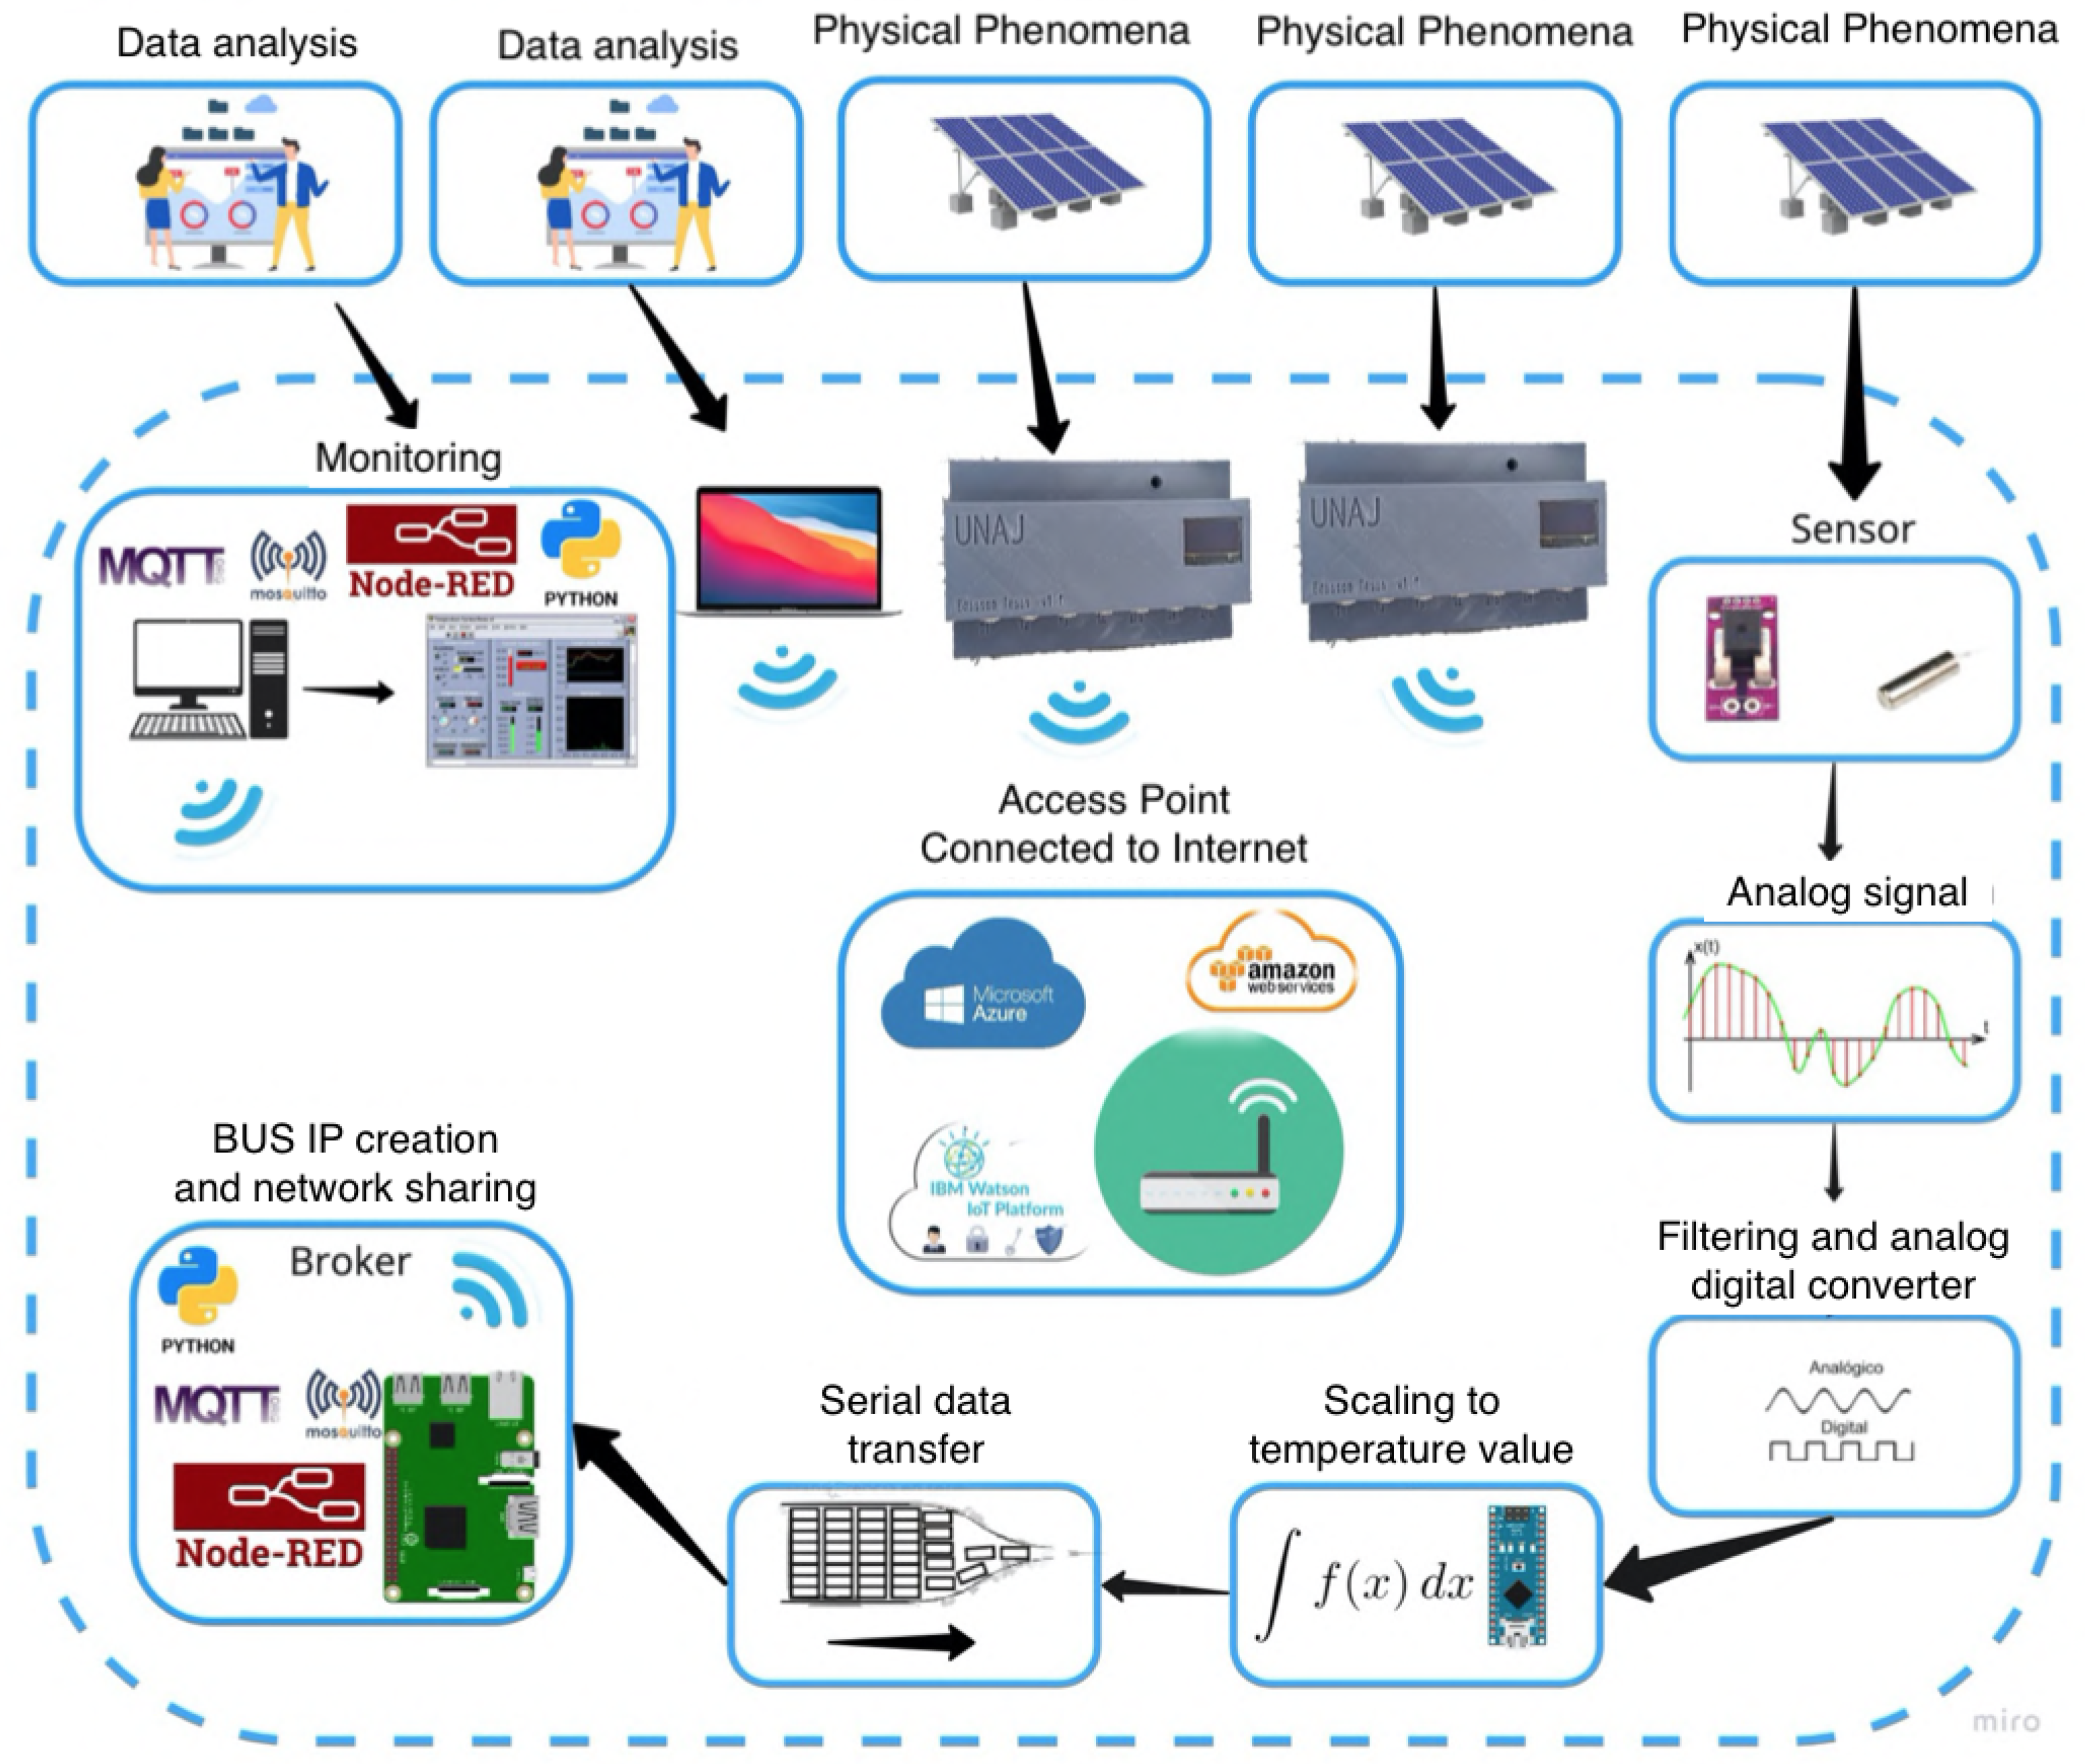
Continuous monitoring of the photovoltaic (PV) system forms the cornerstone of this study, providing a dynamic understanding of its performance under real-world conditions. This process, visualized in
Figure 5, involves the systematic and uninterrupted recording of key electrical and environmental parameters over a defined period.
Figure 5 illustrates the flow of data and the configuration of the monitoring system. It highlights the interconnectedness of the various components and the continuous flow of information from the PV system to the LabVIEW interface.
3.2.1. Sensors in Action
The figure depicts the diverse sensors employed to capture essential data. These include PT100 temperature sensors attached to the PV modules and the ambient environment, a voltage divider circuit measuring the system’s voltage, an ACS758 current sensor monitoring the current flow, and a calibrated solar cell measuring solar irradiance.
3.2.2. Data Acquisition and Transmission
The Arduino Nano, represented in the figure, acts as the data acquisition hub, receiving signals from these sensors and converting them into digital data. These data are then transmitted wirelessly to the Raspberry Pi 3B+ via a Python-based communication bridge, as depicted in the diagram.
3.2.3. Real-Time Visualization and Analysis
The Raspberry Pi relays the data to the LabVIEW interface on a separate computer, enabling real-time visualization and analysis of the PV system’s performance. The LabVIEW interface, as shown in the figure, displays the data in user-friendly formats, such as graphs and charts, allowing for immediate observation of trends and anomalies.
The continuous monitoring process, as visualized in
Figure 5, captures the dynamic behavior of the PV system under various operating conditions. It records data at predefined intervals (e.g., every minute), ensuring a comprehensive record of the system’s response to fluctuations in solar irradiance, temperature, and other environmental factors.
The continuous monitoring process focuses on capturing the following key parameters:
Electrical Parameters: Voltage, current, and power output of the PV system.
Environmental Parameters: PV module temperature, ambient temperature, and solar irradiance.
A key focus of the continuous monitoring process is to capture the variability in solar irradiance, including daily fluctuations and extreme events. These data are crucial for understanding how irradiance variability affects the PV system’s energy generation, efficiency, and overall performance.
3.3. Extreme Events
The Peruvian Altiplano, characterized by its high altitude and clear skies, presents a unique environment for solar energy generation. However, this region also experiences periods of exceptionally high solar irradiance, termed “extreme events”, which can significantly impact the performance and longevity of photovoltaic (PV) systems. This study defines extreme-irradiance events as those exceeding 1000 . This threshold recognizes the potential for such high irradiance to induce thermal stress and affect the long-term performance of PV systems. When the measured irradiance surpasses the 1000 threshold, the system flags it as an extreme event, triggering a more detailed data acquisition process to capture the event’s dynamics.
3.3.1. Characterizing Extreme Events
During an extreme event, the monitoring system increases the frequency of data acquisition to capture the event’s dynamic behavior. This involves recording not only irradiance but also module temperature, voltage, and current at finer time intervals (e.g., every few seconds). This comprehensive data capture allows for a thorough analysis of the event’s impact on the PV system.
The collected data are then analyzed using the LabVIEW interface, which provides tools for visualizing and characterizing the extreme events. The key metrics extracted include
Peak Irradiance: The maximum irradiance level reached during the event.
Duration: The total time for which the irradiance remains above the defined threshold.
Energy Profile: The total energy generated by the PV system during the event, which can be compared to energy generation under normal-irradiance conditions.
Temperature Response: The change in PV module temperature in response to the increased irradiance, providing insights into the thermal stress experienced by the system.
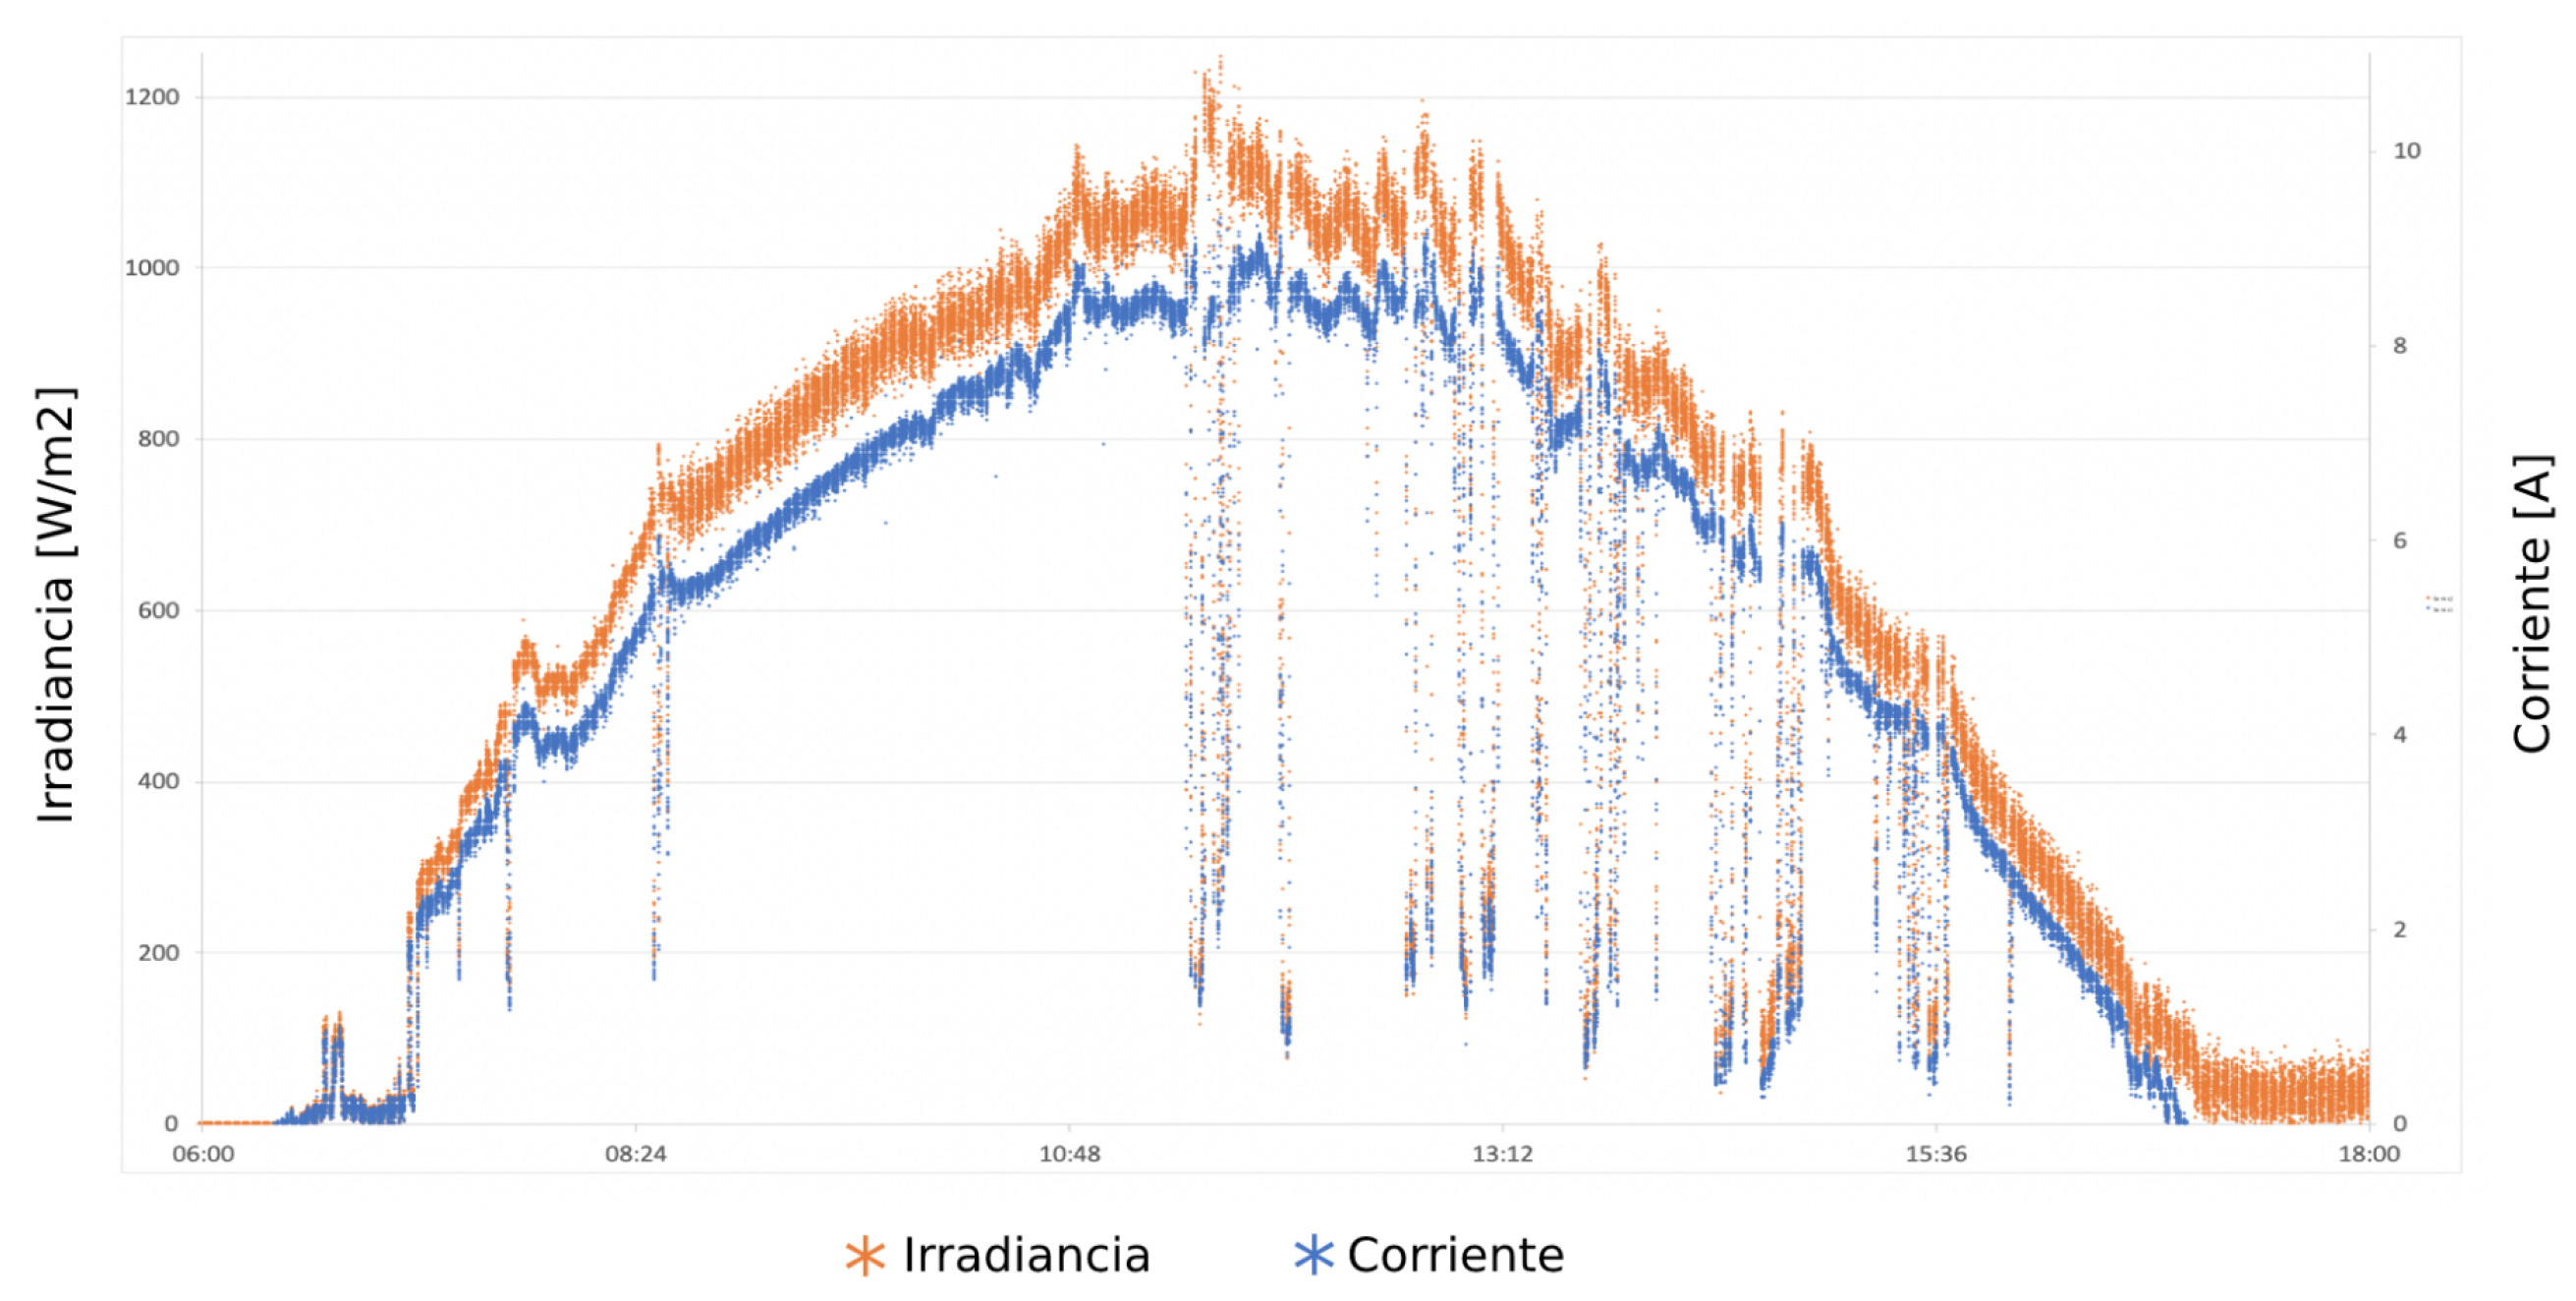
We observed several extreme-irradiance events exceeding 1000
during our study in the Altiplano, with some exceeding 1300
. For example, in
Figure 6, which graphs the data for the day 17 June 2024, it can be observed that the irradiance has an opposite response after the passage of a cloud over the photovoltaic generator. On this day, the irradiance value had a maximum peak of 1245.89 [
], which occurred at 11:39:13, with a duration of 6 s and a current of 9.5 [A]. On this same day, an extreme solar irradiance event occurred, which is considered the most extensive as it has a duration of 176 s, with a value of 1219.75 [
], recorded at 11:34:17.
These events were often associated with clear-sky conditions and occurred more frequently during certain months. We found that extreme events could lead to a significant increase in PV module temperature, potentially affecting the system’s efficiency and long-term reliability.
3.3.2. Implications for PV System Design and Operation
The ongoing monitoring in this study highlights the importance of considering extreme-irradiance events in the design and operation of PV systems in the Altiplano. The key implications include the following:
Component Selection: PV modules and other system components should be selected with appropriate temperature ratings and tolerances to withstand the increased thermal stress during extreme events.
Thermal Management: Implementing effective cooling mechanisms, such as improved heat sinks or ventilation, can help to mitigate the adverse effects of high temperatures on PV module performance and longevity.
System Control: Adaptive control algorithms that adjust the operating point of the PV system in response to extreme-irradiance events can help to optimize energy generation and protect the system from damage.
Monitoring and Maintenance: Continuous monitoring of PV systems is crucial for detecting and responding to extreme events. Regular maintenance, including cleaning of modules and inspection of components, can further enhance system reliability. By understanding the characteristics and potential impacts of extreme-irradiance events, this study aims to contribute to the development of more resilient and efficient PV systems in the Altiplano and other regions prone to high solar irradiance.
4. Potential Application in DC Nanogrids
A DC nanogrid is a small-scale, independent power grid that operates entirely on direct current (DC) electricity. It is like a miniature version of the larger electrical grid, but, instead of using alternating current (AC), it uses DC power. This offers several advantages, particularly for specific applications and locations, like the Altiplano, where many communities still lack access to reliable electricity. DC nanogrids can provide a decentralized and localized solution, extending power to remote and underserved areas where extending the conventional AC grid is challenging or cost-prohibitive.
DC nanogrids can significantly improve energy efficiency by eliminating the need for AC–DC conversion, which is often required in traditional AC grids. This is particularly beneficial in the Altiplano, where energy resources may be limited and maximizing efficiency is crucial. We must bear in mind that the Altiplano boasts abundant solar resources, making it ideal for harnessing solar energy. DC nanogrids are inherently compatible with DC power sources like solar panels, streamlining the integration of renewable energy and empowering local communities by providing them with control over their energy generation and distribution. This can foster local economic development, create jobs, and improve the quality of life for residents.
4.1. System Adaptation
Based on the results presented in our work, the adaptation of the monitoring system to DC nanogrids would involve the following key modifications:
4.1.1. Voltage Measurement
The voltage divider circuit, currently designed for a 500 V DC system, would need to be adjusted to accommodate the lower voltage levels typically found in DC nanogrids (e.g., 48 V or 380 V). This would involve selecting appropriate resistor values in the voltage divider to ensure accurate voltage readings within the new voltage range.
4.1.2. Current Measurement
The ACS758 current sensor, with a measurement range of up to 50 A, might need to be replaced with a sensor that offers higher accuracy at lower current levels depending on the specific requirements of the DC nanogrid. Alternatively, the existing sensor could be recalibrated for optimal performance in the lower current range.
4.1.3. Data Analysis and Visualization
The LabVIEW interface would need to be adapted to display and analyze data relevant to DC nanogrid operation, such as voltage stability, battery charge/discharge cycles, and energy management parameters. New functionalities might be added to the interface to monitor the performance of specific DC loads and optimize the energy distribution within the nanogrid.
4.1.4. Inverter Integration
Since DC nanogrids do not utilize inverters for grid connection, the monitoring system would need to be adapted to interface directly with the DC–DC converters or other power electronic devices used in the nanogrid. This might involve incorporating new communication protocols or modifying the data acquisition and processing routines to accommodate the specific characteristics of the DC nanogrid’s power electronics.
These adaptations would enable the monitoring system to effectively capture and analyze the performance of DC nanogrids, providing valuable insights into their operation and supporting the development of efficient and sustainable energy solutions in the Altiplano region.
4.2. Requirement Analysis
Implementing a successful DC nanogrid in the Altiplano necessitates a thorough requirement analysis that considers the region’s distinct characteristics and challenges. Drawing upon the insights of this work, this analysis outlines key factors for effective nanogrid design and deployment.
4.2.1. Energy Needs Assessment
Detailed Load Profiling: A comprehensive understanding of the energy consumption patterns of the target community or facility is crucial. This involves identifying the types of loads (residential, commercial, or agricultural), their power requirements, and their daily and seasonal variations. This detailed load profile informs the sizing and configuration of the nanogrid components.
Peak Demand Determination: Accurate determination of the peak power demand is essential to ensure that the nanogrid can handle the maximum electricity consumption without compromising stability or reliability. This involves analyzing historical load data and considering potential future increases in demand.
Growth Projections: The design should account for projected growth in energy demand due to factors such as population increase, economic development, or changes in energy use patterns. This ensures the nanogrid’s capacity to meet future needs and avoids premature obsolescence [
16].
4.2.2. Resource Assessment and Optimization
Solar Resource Characterization: A thorough evaluation of the solar resource availability in the Altiplano is essential. This involves analyzing the solar irradiance levels and considering factors such as cloud cover, seasonal variations, and the impact of high altitude. Utilizing data from meteorological stations, solar resource maps, and on-site measurements is crucial for accurate assessment.
Complementary Renewable Sources: Exploring the potential of other renewable energy sources, such as wind or small-scale hydropower, if available, can complement solar generation and enhance the nanogrid’s reliability, particularly during periods of low solar irradiance [
17].
4.2.3. System Design and Component Selection
DC Voltage Level Selection: Choosing an appropriate DC voltage level is crucial for system efficiency and safety. The factors to consider include the types of loads, voltage requirements of DC appliances, safety regulations, and the availability of compatible equipment. The common DC voltage levels for nanogrids include 48 V, 120 V, and 380 V.
PV Array Sizing and Optimization: The PV array should be sized to meet the energy demands identified in the load profile, considering the solar resource availability and the desired level of autonomy from the main grid. Optimization techniques, such as tilt angle optimization and tracking systems, can maximize energy capture [
18].
Energy Storage Integration: Incorporating energy storage, such as batteries, is essential to ensure a continuous power supply during periods of low solar irradiance or high demand. Battery capacity, depth of discharge, lifespan, and environmental considerations should be carefully evaluated.
Power Electronics Selection: Appropriate DC–DC converters and other power electronic devices are crucial for regulating voltage, controlling power flow, and protecting the system from faults. These components should be selected based on their efficiency, reliability, and compatibility with the chosen DC voltage level.
Monitoring and Control System Integration: Integrating a robust monitoring and control system is essential for ensuring the nanogrid’s stability, optimizing energy management, and detecting and mitigating faults. Adapting the low-cost monitoring system developed in this work, with modifications for DC nanogrid specifics, could provide a valuable solution.
5. Conclusions and Recommendations
The findings of this study highlight the dependability of the developed wireless monitoring and data acquisition system in effectively measuring and analyzing the energy generation of the SFRC under various environmental conditions. This dependability is attributed to the meticulous adherence to the proposed methodology, which involved rigorous calibration and validation of sensor readings and the performance of other system components.
The successful design and programming of a data acquisition board based on an Arduino Nano enabled the accurate measurement of critical electrical parameters such as voltage, current, power, temperature, and irradiance. The analog signals from the sensors installed in the SFCR were carefully filtered, digitized, and processed to ensure the reliability of the acquired data.
Furthermore, the seamless integration of the LabVIEW interface with the data acquisition board, facilitated by a Python-programmed bridge running on a Raspberry Pi 3B+, enabled wireless real-time monitoring and data storage with a sampling rate of one second. This capability proved crucial in capturing detailed insights into the system’s performance.
The system’s ability to collect 302,400 data points per day provided a comprehensive view of the electrical energy generation process, revealing real-time effects under various environmental conditions. Notably, the study confirmed the presence of extreme-irradiance effects in cloudy conditions, as previously observed by Ramos Cutipa et al. (2020) [
19] in their high-altitude study.
The research also validated the influence of temperature on photovoltaic modules, particularly its impact on voltage. Temperature variations within the module led to voltage decoupling between cells, resulting in an estimated efficiency loss of 5%. This highlights the importance of thermal management in optimizing PV system performance, as described by Sánchez (2008) [
20]. The analysis of the collected data further revealed voltage decoupling between cells due to temperature variations within the photovoltaic module, highlighting a potential source of efficiency loss.
To ensure the continued reliability and effectiveness of the wireless monitoring and data acquisition system, the following recommendations are put forward:
Prioritize the selection of high-accuracy and precision sensors, carefully reviewing their technical specifications to minimize errors and ensure compliance with permissible limits.
Explore the integration of the system with advanced IOT platforms, such as Node-Red, Amazon AWS, Microsoft Azure, Google Cloud, and IBM Watson, to enhance data management and analysis capabilities.
Conduct a thorough statistical analysis of the collected data to gain deeper insights into system behavior and trends, facilitating better decision-making for improved efficiency and maintenance.
Author Contributions
Conceptualization, N.J.B.C. and E.C.T.; methodology, N.J.B.C. and E.C.T.; software, E.C.T.; validation, F.C.A. and J.R.C.; formal analysis, H.S.L. and O.C.V.; investigation, N.J.B.C. and E.C.T.; writing—original draft preparation, N.J.B.C.; funding acquisition, N.J.B.C. All authors have read and agreed to the published version of the manuscript.
Funding
This research was funded by Fondo Especial de Desarrollo Universitario (FEDU) from the Universidad Nacional del Altiplano-Puno.
Data Availability Statement
The original contributions presented in this study are included in the article. Further inquiries can be directed to the corresponding author.
Acknowledgments
The authors would like to thank the financial support of CONCYTEC-PROCIENCIA under contract number PE501083087-2023 and the Vice-Rectorate of Research of the National University of Altiplano-Puno. Also, it is a product of the incentives and training of RENACYT and FEDU researchers at the aforementioned university.
Conflicts of Interest
The authors declare no conflicts of interest.
References
- Maka, A.O.; Alabid, J.M. Solar energy technology and its roles in sustainable development. Clean Energy 2022, 6, 476–483. [Google Scholar] [CrossRef]
- Jayachandran, M.; Gatla, R.K.; Rao, K.P.; Rao, G.S.; Mohammed, S.; Milyani, A.H.; Azhari, A.A.; Kalaiarasy, C.; Geetha, S. Challenges in achieving sustainable development goal 7: Affordable and clean energy in light of nascent technologies. Sustain. Energy Technol. Assessments 2022, 53, 102692. [Google Scholar]
- Molina, P.S. Global installed PV capacity tops 2 TW. PV Magazine, 13 November 2024. [Google Scholar]
- Gil, G.M.V.; Cunha, R.B.A.; Di Santo, S.G.; Monaro, R.M.; Costa, F.F.; Sguarezi Filho, A.J. Photovoltaic energy in South America: Current state and grid regulation for large-scale and distributed photovoltaic systems. Renew. Energy 2020, 162, 1307–1320. [Google Scholar]
- Izuka, U.; Ojo, G.G.; Ayodeji, S.A.; Ndiwe, T.C.; Ehiaguina, V.E. Powering rural healthcare with sustainable energy: A global review of solar solutions. Eng. Sci. Technol. J. 2023, 4, 190–208. [Google Scholar]
- Ahmad, T.; Madonski, R.; Zhang, D.; Huang, C.; Mujeeb, A. Data-driven probabilistic machine learning in sustainable smart energy/smart energy systems: Key developments, challenges, and future research opportunities in the context of smart grid paradigm. Renew. Sustain. Energy Rev. 2022, 160, 112128. [Google Scholar]
- Livera, A.; Theristis, M.; Micheli, L.; Fernandez, E.F.; Stein, J.S.; Georghiou, G.E. Operation and maintenance decision support system for photovoltaic systems. IEEE Access 2022, 10, 42481–42496. [Google Scholar]
- Strielkowski, W.; Vlasov, A.; Selivanov, K.; Muraviev, K.; Shakhnov, V. Prospects and challenges of the machine learning and data-driven methods for the predictive analysis of power systems: A review. Energies 2023, 16, 4025. [Google Scholar] [CrossRef]
- Kahana, L. Scientists unveil low-cost, wireless monitoring system for PV systems. PV Magazine, 7 December 2023. [Google Scholar]
- Paredes-Parra, J.M.; Mateo-Aroca, A.; Silvente-Ninirola, G.; Bueso, M.C.; Molina-Garcia, A. PV Module Monitoring System Based on Low-Cost Solutions: Wireless Raspberry Application and Assessment. Energies 2018, 11, 3051. [Google Scholar] [CrossRef]
- de la Cruz Severiche Maury, Z.; Fernandez Vilas, A.; Diaz Redondo, R.P. Low-Cost HEM with Arduino and Zigbee Technologies in the Energy Sector in Colombia. Energies 2022, 15, 3819. [Google Scholar] [CrossRef]
- Shanmugam, L.; Balasubramaniam, P.; Shnain, A.H.; Abdulkader, R.; Alharbi, M.; Pustokhin, D.A.; Pustokhina, I.V.; Mohammed, S.; Sengan, S. Solar-Powered LVDC Nano-Grid with Smart FPGA-based Residential Power Switching Algorithm. IEEE Access 2023. [Google Scholar] [CrossRef]
- Rahman, M.M.; Pearce, J.M. Modular open source solar photovoltaic-powered DC nanogrids with efficient energy management system. J. Sol. Energy Sustain. Dev. 2024, 13, 22–42. [Google Scholar] [CrossRef]
- Tiwari, S.; Pandey, R.; Goswami, A. Performance Comparison of 3kW Residential Grid-Connected Photovoltaic System between Microinverter and String Inverter Topology using System Advisor Model. Int. Res. J. Eng. Technol. 2021, 8, 1129–1131. [Google Scholar]
- Pabón-Caicedo, J.D.; Arias, P.A.; Carril, A.F.; Espinoza, J.C.; Borrel, L.F.; Goubanova, K.; Lavado-Casimiro, W.; Masiokas, M.; Solman, S.; Villalba, R. Observed and projected hydroclimate changes in the Andes. Front. Earth Sci. 2020, 8, 61. [Google Scholar] [CrossRef]
- Romero-Fiances, I.; Munoz-Ceron, E.; Espinoza-Paredes, R.; Nofuentes, G.; De la Casa, J. Analysis of the Performance of Various PV Module Technologies in Peru. Energies 2019, 12, 186. [Google Scholar] [CrossRef]
- Shaukhi, A.S.A.; Bakar, M.I.A. Development of Wireless Photovoltaic (PV) Monitoring System. J. Eng. Technol. 2021, 9, 29–35. [Google Scholar]
- STEP. The Effect of Irradiance and Temperature on the Performance of Photovoltaic Modules. Sustain. Technol. Aug. 2017. Available online: https://sustainabletechnologies.ca/app/uploads/2017/10/Irrad-Eff-Tech-Brief_v11.pdf (accessed on 30 December 2024).
- Cutipa, J.M.R.; Castañón, N.J.B.; Larico, E.R.A.; Mamani, V.S.; Yucra, R.C.; Viveros, H.P.; Roque, P.Y.P.; Macedo, W.N. Occurrences of extreme solar irradiance at 3812 meters above sea level, at Lake Titicaca (Puno-Peru). In Proceedings of the LACCEI International Multi-Conference for Engineering, Education and Technology, Virtual, 27–31 July 2020. [Google Scholar]
- Sánchez, M.M. Influencia de la Temperatura en el Generador Fotovoltaico; Undergraduate final project; Universidad de Sevilla: Sevilla, Spain, 2004. [Google Scholar]
| Disclaimer/Publisher’s Note: The statements, opinions and data contained in all publications are solely those of the individual author(s) and contributor(s) and not of MDPI and/or the editor(s). MDPI and/or the editor(s) disclaim responsibility for any injury to people or property resulting from any ideas, methods, instructions or products referred to in the content. |
© 2025 by the authors. Licensee MDPI, Basel, Switzerland. This article is an open access article distributed under the terms and conditions of the Creative Commons Attribution (CC BY) license (https://creativecommons.org/licenses/by/4.0/).


 ,
, 


