1. Introduction
The share of compression ignition engines in the automotive industry continues to grow, despite the implementation of increasingly stringent exhaust emission regulations [
1]. This trend can be attributed to the continuously improved performance of compression ignition engines and their relatively flat torque curve compared to spark ignition engines [
2]. Periodically, new emission standards are introduced, reducing the permissible concentration of toxic substances in engine exhaust gases. The constant pursuit of improved efficiency, increased engine power, and compliance with strict emission standards has led to significant complexity in engine design [
3].
Among all engine components, the fuel injection system has the most significant impact on both the emissions of toxic exhaust components and engine performance. Over the years, this system has undergone substantial advancements, particularly with the development of Common Rail (CR) fuel injection systems [
4,
5].
Automotive manufacturers aiming to launch new vehicles—and consequently new engine designs—must first develop prototypes. To create prototypes that meet designers’ expectations as closely as possible, computer modeling of individual components and entire vehicles is increasingly utilized. This approach allows for preliminary testing of a design during its development stage. After necessary adjustments, a physical prototype is created and subjected to further testing [
6]. The use of computer modeling minimizes the need to produce numerous prototype variants, thereby reducing costs and development time. Engineers can simulate the designed system on a computer, where algorithms calculate the system’s response to specified inputs under simplified conditions [
7]. However, any developed model must be experimentally validated, a process that is often challenging. Insufficient model validation can result in serious consequences, such as failing to meet homologation requirements.
For example, mathematical modeling during the design process can be used to estimate the volume of fuel injected by an electronically controlled injector (electromagnetic or piezoelectric) at a given input pressure and actuator pulse duration. If the injector injects either too little or too much fuel, engineers can modify the model and re-test it. Once the results are satisfactory and align with expectations, a physical injector is manufactured based on the model [
8]. The actual injector is then subjected to further experimental testing, as mathematical descriptions of physical phenomena often involve simplifications [
9].
The degree of accuracy in replicating an injector’s operation using a mathematical model significantly affects production costs. A more accurate mathematical model ensures that simulation results closely align with experimental results for the physical injector. This reduces the number of prototypes needed to develop a design that meets engineering requirements [
10].
Numerical CFD (Computational Fluid Dynamics) methods are primarily used for the analysis of hydrodynamic phenomena. This flow modeling technique offers numerous possibilities, although it also has certain limitations [
11]. One of its most significant advantages is the ability to model fuel flows inside the injector, which helps identify areas of potential pressure losses and allows for the optimization of fuel channel design. Moreover, this technique enables the detection of regions where cavitation may occur during flows.
Another benefit of CFD methods is the ability to model fuel atomization, which is crucial for efficient combustion. Such simulations also allow for conducting numerous analyses without the need to build costly prototypes, resulting in a shorter time to implement new solutions [
12,
13].
However, CFD modeling also has its drawbacks and limitations. Like other techniques, CFD simulations require engineers to adopt certain simplifications and assumptions, for instance, turbulence in flows must be approximated using RANS (Reynolds-Averaged Navier-Stokes) or LES (Large Eddy Simulation) models. Among the limitations, given the current state of technology, is the inability to accurately replicate certain phenomena, such as cavitation or multiphase flows [
14]. Another challenge is that high-accuracy simulations, such as DNS (Direct Numerical Simulation), require extremely high computational power [
15].
The modeling of CR fuel injection system components can be performed at varying levels of complexity. J. A. Soriano et al. [
16] proposed a dimensionless model of injection rate. This model was developed based on experimental data from tests on fuel injection in a CR system equipped with two electromagnetic injectors. The model enables the determination of injection rate using only parameters such as injection pressure, injector control signal, total mass of fuel injected per stroke, geometry and number of injector orifices, and certain fuel properties. The proposed model is beneficial for determining the injection rate in injectors with unknown internal dimensions. Comparative results between experimental and modeled injections demonstrated a high correlation, validating the model’s effectiveness.
Mathematical modeling is utilized in nearly every field of engineering. For example, Wang H. et al. [
17] developed a mathematical model encompassing all components of the high-pressure circuit of a CR system, including the high-pressure pump, fuel rail, and injectors. This model was simulated using Matlab/Simulink and subsequently validated with the Amesim software. The authors also designed an iPI controller based on an Extended State Observer (ESO), characterized by a simple structure, high performance, and ease of parameter tuning. This controller was later compared to a conventional PID (Proportional-Integral-Derivative) controller and an ADRC (Active Disturbance Rejection Control) controller. The results demonstrated that the iPI controller outperformed the others in terms of overshoot and tracking accuracy. However, its application range was somewhat limited and not explicitly defined.
A significant number of studies in this field focus only on simulating specific injector components. For instance, B. Huber and H. Ulbrich [
18] concentrated exclusively on the operation of the electromagnetic valve in a CR injector. They developed a simulation model of the valve, incorporating its magnetic and mechanical parts. The model was validated through dynamic displacement measurements of the solenoid armature. A comparison of simulation and experimental results showed excellent agreement under specific operating conditions. Further research on the simulation model led the authors to conclude that transient states occurring shortly after the energization or de-energization of the solenoid coil could impact fuel metering stability.
In another study, C. Jiangwei et al. [
19] designed a CR injector model using Amesim, which was part of a more complex model of a four-cylinder compression ignition engine. The injector model allowed the researchers to analyze the impact of various injector design parameters, such as fuel injection rate. Subsequently, an engine model was built to simulate engine performance, and the two models were integrated using Simulink. This integrated model provided a theoretical foundation for injector design. However, the model was based on several simplifying assumptions that may not fully capture the complexity of real-world injector processes. Furthermore, no experimental validation of the model was conducted, making it difficult to assess its accuracy and reliability.
Following the development of the engine model, the researchers conducted a subsequent study [
20] to analyze the impact of different structural parameters of the injector on engine performance. Parameters such as the lift height of the control valve, the preload of the needle valve spring, the needle valve stroke, and the clearance between the electromagnetic valve armature and the solenoid coil were investigated. The authors demonstrated that variations in these parameters lead to inconsistencies in fuel metering, highlighting the need for stricter quality control standards during the production phase. However, the experimental validation of the model was limited, restricting the scope of its application.
One-dimensional modeling enables conducting complex studies on the impact of various fuel properties on the injection process in a CR system. R. Payri et al. [
21] undertook such research by modeling a second-generation injector in the Amesim software. The researchers conducted simulations of the injection process for two fuels: diesel fuel and biodiesel (100% rapeseed methyl ester, RME). The study was carried out under various multi-phase injection strategies to examine the impact of biodiesel on injector performance and stability. Experimental mass flow rate characterization tests were subsequently conducted and used for model validation. The results confirmed the model’s reliability, as the differences between the model’s predictions and the experimental results were minimal. Further simulations revealed significant differences in the dynamic response of injectors powered by biodiesel versus diesel fuel. Based on these findings, the researchers proposed hardware modifications to the injectors to compensate for the identified differences.
In certain cases, numerical studies are indispensable, as demonstrated by K. Jaeheun et al. [
22]. They investigated the influence of fuel viscosity and density on injection rate. This influence could only be studied through simulation, as it is practically impossible to vary viscosity or density independently—changing one property inevitably affects the other. The developed model was validated using experimental data on injection rate. The results conclusively showed that fuel viscosity has a greater impact on injection rate than density, which is particularly significant in cold-start conditions.
M. Carreres et al. [
23] employed one-dimensional modeling to analyze the impact of fuel temperature on the performance of an electromagnetic injector. The model was validated using experimental data on injector performance under various load conditions, including variations in pressure, coil actuation time, and fuel temperature. Simulation results provided insights into injector dynamics under low-temperature conditions and allowed for an assessment of how viscous friction forces affect the motion of the needle valve. The study found, for example, that low fuel temperatures lead to slower injector opening due to increased viscosity.
S. Vass and M. Zoldy presented a model of a first-generation CR injector in their publication [
24]. The model was validated based on fuel delivery measurements and needle lift height measurements. Laboratory fuel delivery tests were conducted under three injector load conditions. The model was developed using GT-Suite software. The validation demonstrated the accuracy of the model, providing a foundation for further research on injector optimization.
When considering simulation models of CR injectors, it is essential to account for the inherent variability of modern injectors, despite the use of advanced manufacturing technologies. Simulation models developed by researchers can never be entirely accurate, as it is impossible to produce perfect injectors—there will always be slight differences between individual units. Due to the large number of injector components influencing its performance, such as the nozzle, hydraulic valve, and electromagnetic coil, achieving perfect consistency during production is unfeasible. Variations in geometric, mass, or electrical parameters of these components can impact the amount of fuel injected, ultimately leading to reduced engine efficiency, increased noise emissions, and heightened smoke generation [
25].
A review of the literature highlights the diverse applications of computer modeling within fuel injection systems. The examples presented demonstrate the versatility of simulation models, which enable researchers to independently modify specific parameters of a system, something that is often impractical in reality (e.g., altering the density of a fluid without affecting its viscosity). The literature analysis reveals that many studies either focus on modeling specific parts of the injector or on larger systems, such as the entire high-pressure circuit of a CR system or a complete compression ignition engine, including its fuel injection system. Researchers also investigate the influence of operating conditions, such as fuel temperature or fuel properties, on the injection process. However, relatively few studies focus on the injector itself and its performance under varying load conditions, as well as on comprehensive, multi-scope validation of developed models.
The examined model was based on the injector model from the Amesim software; however, it was thoroughly modified to accurately reflect the injector used in the test stand experiments. After conducting the studies, the consistency of the obtained results was evaluated using Pearson’s correlation coefficient. The research presented in this paper is part of a broader study on the influence of fuel properties on the fuel dosing process. The study aimed to assess how accurately the simulation model corresponds to the real object under various operating conditions and whether the developed model could be utilized for further research in the future.
In order to replicate the real operating conditions of a CR fuel injection system as accurately as possible, a used CR injector was employed for the study. During operation, the parameters of the CR injector undergo changes due to the wear-in process of its components. This phenomenon is most pronounced during the engine break-in period, which occurs within the first several dozen hours of operation and is described by the Lorentz wear curve. For this reason, it was decided to simulate a used injector.
After being removed from the engine, the injectors were verified for proper functionality using dedicated injector testing equipment. The obtained results were consistent with the values required by the manufacturer. Subsequently, the injector underwent laboratory tests in accordance with the research program described in
Section 3—Experimental Research and was then completely disassembled. Detailed measurements of its individual components were carried out.
All measured parameters of the tested injector were then introduced into a simulation model, enabling the replication of an injector identical to the real one, with the same characteristics and measured data. Following the study, the consistency of the obtained results was assessed.
The presented research constitutes one stage of a broader study on the influence of fuel properties on the fuel dosing process. The aim was to evaluate how accurately the models adapt to real-world conditions depending on operational parameters and whether they can be utilized for further investigations. It is worth noting that an injector can be referred to as “new” only before its first installation in an engine. Once it has been used for the first time, it is already considered a used injector.
Additionally, it should be noted that research on second-generation Common Rail injectors remains justified due to their widespread presence in the Common Rail fuel system market and the potential for upgrading the design of this type of injector. Enhanced knowledge acquired through studying these injectors will contribute to improvements in the parameters of future injection systems.
Further advancements in electromagnetic injectors remain valid. Despite the development of piezoelectric injectors, electromagnetic injectors are still widely used in the automotive industry. For instance, Hydraulically Amplified Diesel Injector (HADI) systems, based on electromagnetic injectors, have been implemented in heavy-duty vehicle engines since 2011. Considering the extensive use of heavy-duty vehicles in transportation and the larger engine displacements compared to passenger cars, continued research into electromagnetic injectors is fully justified. These injectors continue to play a critical role in the automotive sector.
The tests were carried out based on essentially new Robert Bosch GmbH (Gerlingen, Germany) electromagnetic injector. The BOSCH injector was selected for testing due to its largest share in the production of fuel injectors used to power compression-ignition engines. The tested injector comes from a Renault Espace III car equipped with a 2.2 DCI engine rated at 130 HP (engine code: G9T720). The electromagnetic valve of the tested injector featured a coil with a winding resistance of 0.5 Ω and an inductance of 200 µH. The current required to attract the solenoid armature was 26 A, whereas the holding current was 13 A. During the initial opening phase of the injector’s electromagnetic valve, the coil was supplied with a voltage of 80 V, which then dropped to 14 V during the holding phase. This injector was operated for 25 h on an engine test bench.
The engine had the following characteristics: power output of 130 HP, torque of 290 Nm, and a compression ratio of 18.3. The common rail system of this engine was powered by a high-pressure pump designated CP1H3, characterized by the following parameters: maximum operating pressure of 135 MPa, number of pistons—3, maximum delivery capacity—85 mm3 per cycle, power consumption of approximately 3.5 kW, and pressure regulation is conducted on the suction side by means of a high-pressure regulator installed on the injection pump.
This study, motivated by the identified research gap, focuses on evaluating the performance of a simulation model of a CR injector under varying pressure and injector opening times, along with its laboratory validation.
3. Experimental Research
Due to the adopted procedure, after conducting verification tests and ensuring that the tested injectors were operating correctly, test bench experiments were performed. To accurately determine the injector’s performance characteristics under the specified conditions, the number of injection events was adjusted so that the measurement cylinders were filled with fuel to at least ¾ of their capacity.
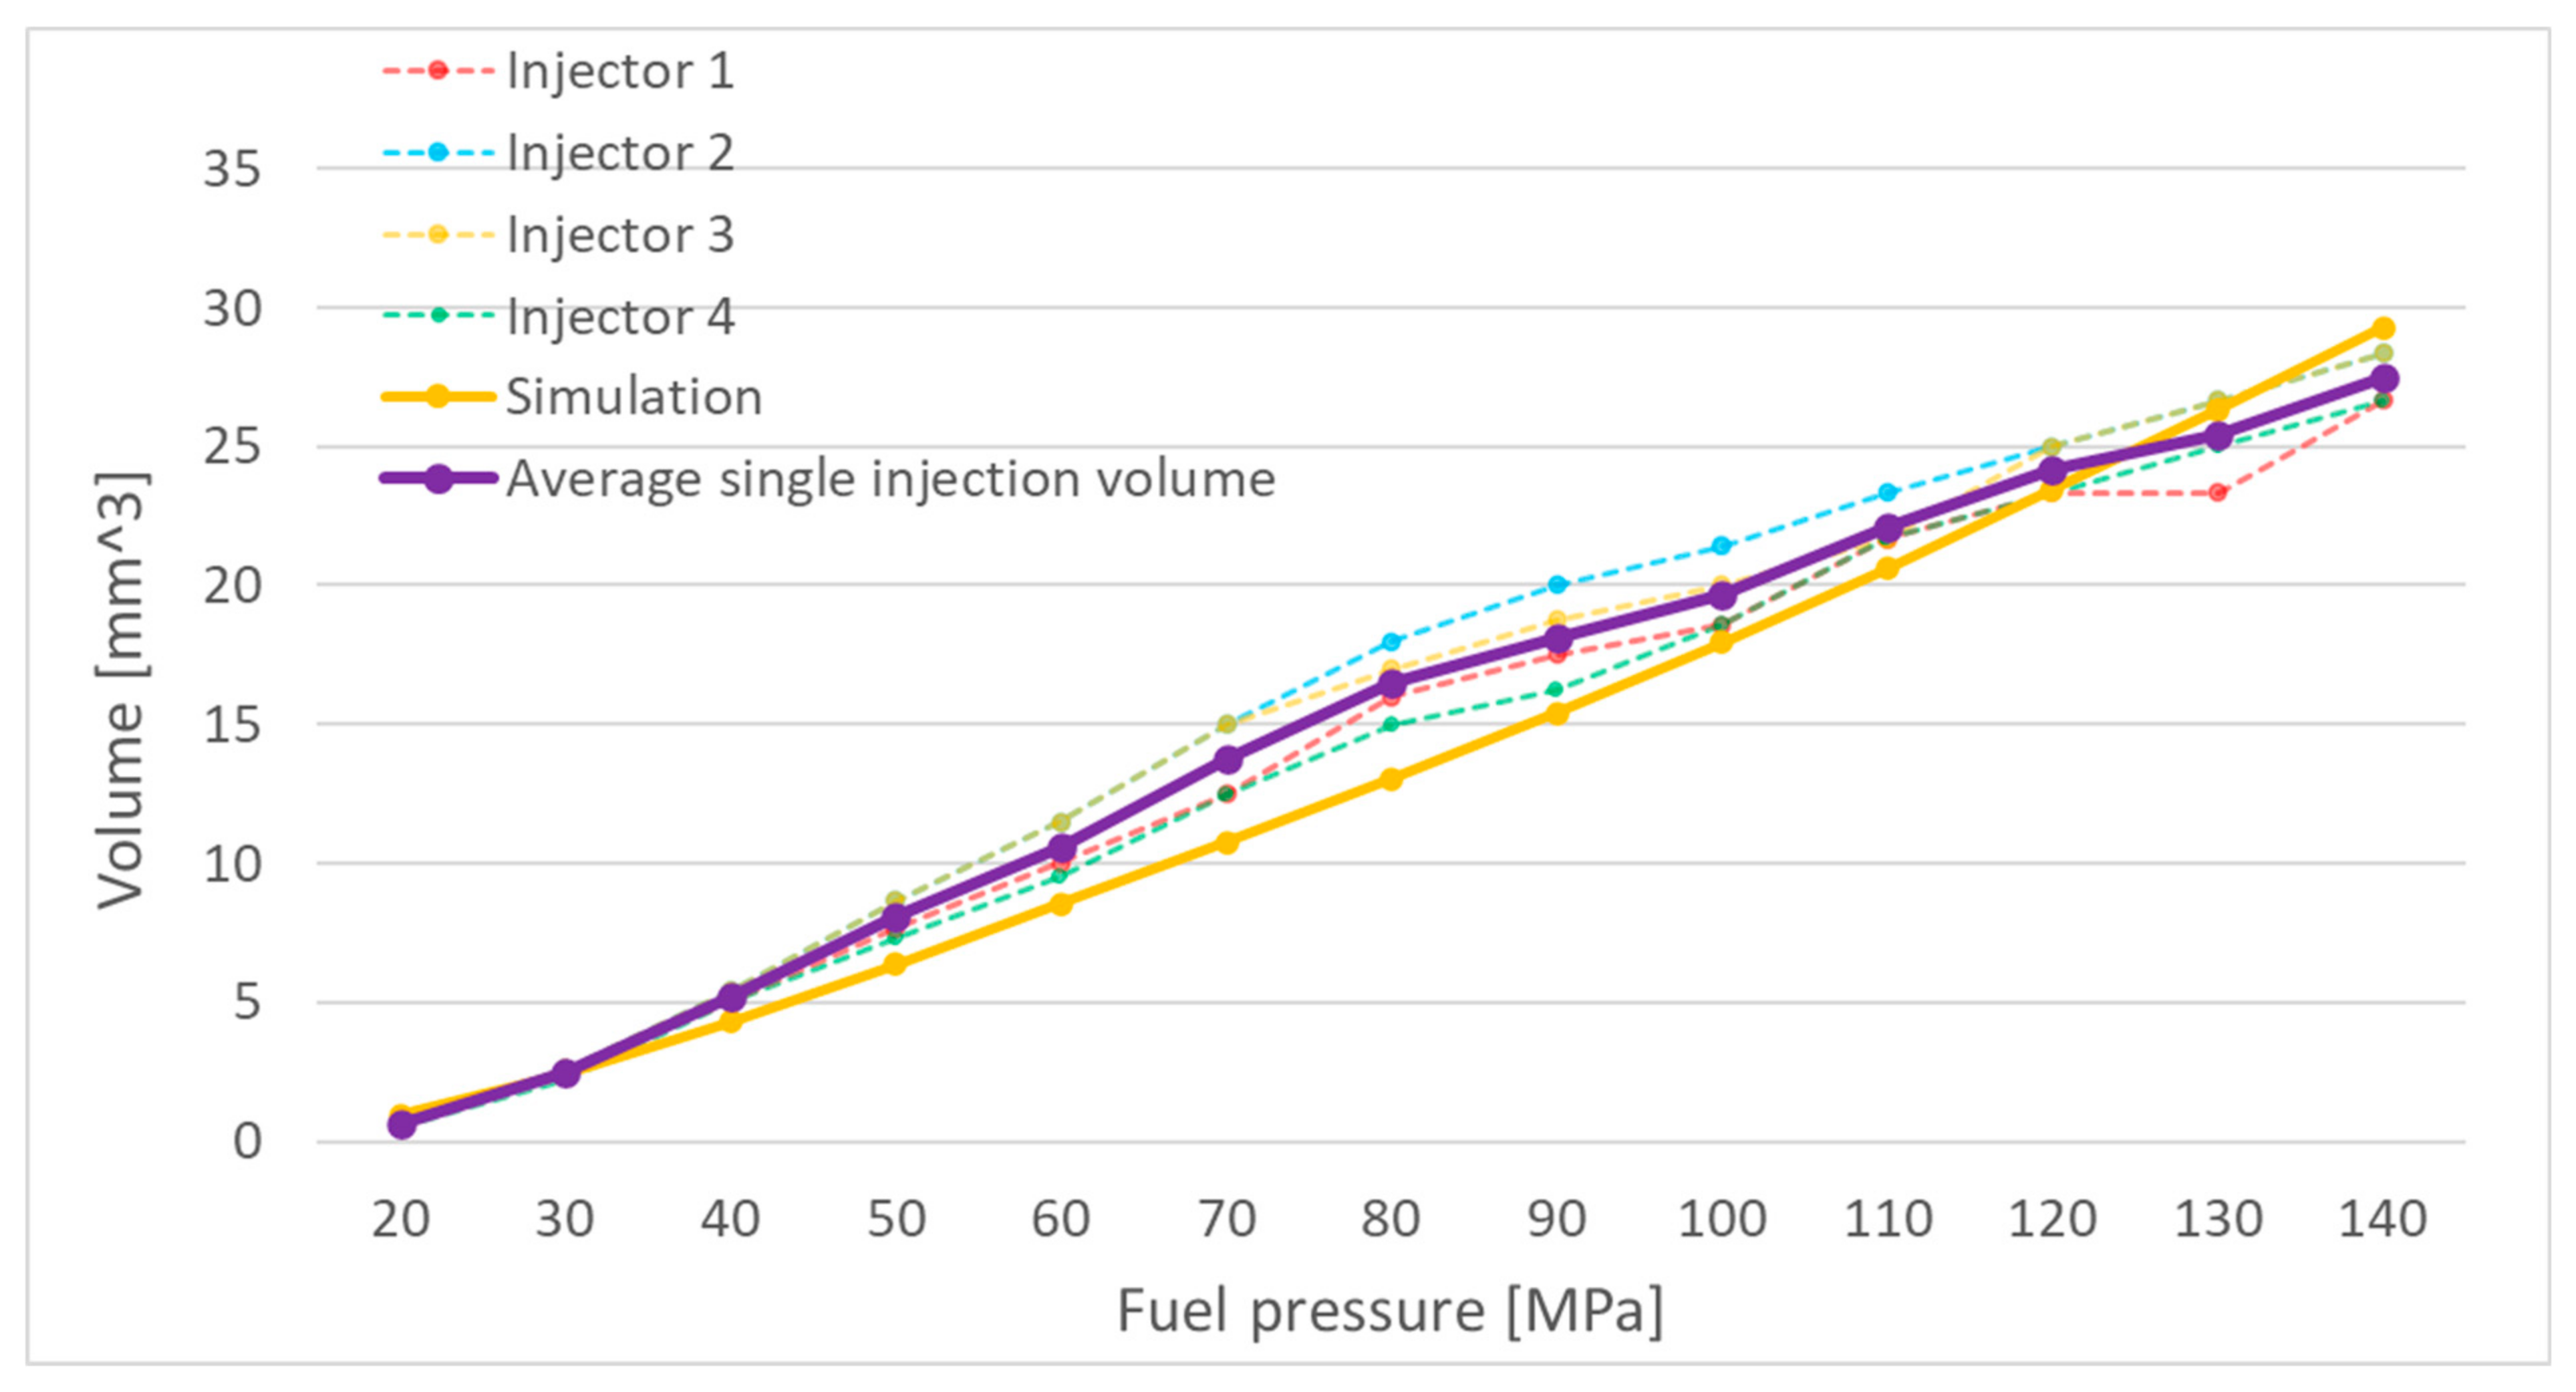
Additionally, to facilitate a comparison between the experimental and simulation results, the obtained measurements were averaged, and a graph of the mean injected fuel volume under the given operating conditions was plotted. An example of such a graph for an injector actuation time of 500 µs is presented in
Figure 1.
At low injection pressures, all injectors delivered nearly identical fuel volumes during operation. However, at pressures exceeding 50 MPa, the injected fuel volume began to vary between injectors. These discrepancies at higher pressures may result from different degrees of wear in the injector components.
The efficiency of the injection process is influenced, among other factors, by the phenomenon of cavitation. As previously mentioned, variations in fuel dosing can stem from varying levels of injector wear. One injector component susceptible to wear is the nozzle. Over time, the nozzle orifices may experience slight enlargement due to cavitation-induced wear. Conversely, improper combustion processes may lead to the accumulation of deposits from combustion by-products on the orifices.
In both scenarios, the nozzle orifice diameter changes, altering the cross-sectional area of the orifice. Since this phenomenon occurs at different rates for each injector, the cross-sectional areas of the nozzle orifices change unevenly. This leads to flow restrictions during injection at higher pressures. This phenomenon can be described by Equation (1):
where
is the fuel mass flow rate,
is the fuel density,
Q is the volumetric fuel flow,
is the flow coefficient (dependent on nozzle geometry and phenomena such as cavitation),
is the cross-sectional area of the nozzle, and
is the pressure difference between the inlet and outlet of the nozzle.
At low values, i.e., during fuel injection at low pressure, the mass flow rate increases linearly with increasing injection pressure. This explains the linear injection characteristic observed for each injector at low pressures. The fuel flow coefficient remains constant during low-pressure injection since the fuel flow through the nozzle orifices is still laminar.
Once a certain pressure is exceeded, the flow transitions from laminar to turbulent; however, cavitation does not yet occur at this stage. When the injection pressure increases further, causing
to reach a critical value, the pressure within the nozzle drops below the fuel vapor pressure. This leads to the formation of cavitation bubbles within the nozzle’s throat, followed by their implosion. The implosion reduces the effective flow area, resulting in a slower increase in the mass flow rate with rising pressure, and in some cases, flow saturation [
24,
26].
Additionally, production variability among injectors can contribute to this phenomenon. In practice, this issue is minimized through IMA (Injector Mengen Abgleich) codes. However, each injector in this study was assigned a unique IMA code. The controller used in the test bench could not account for these codes, as they were not stored in its memory. Consequently, all injectors were powered with identical input signals, leading to varied responses from each injector to the supplied signal.
To minimize the issue of injector variability and the associated differences, such as in the operation of the solenoid valve, four injectors were used for the test stand experiments, and the obtained results were averaged. In order to build the simulation model, one of the tested injectors was completely disassembled to perform geometric and mass measurements. Based on these measurements, the injector was modeled for subsequent simulation studies.
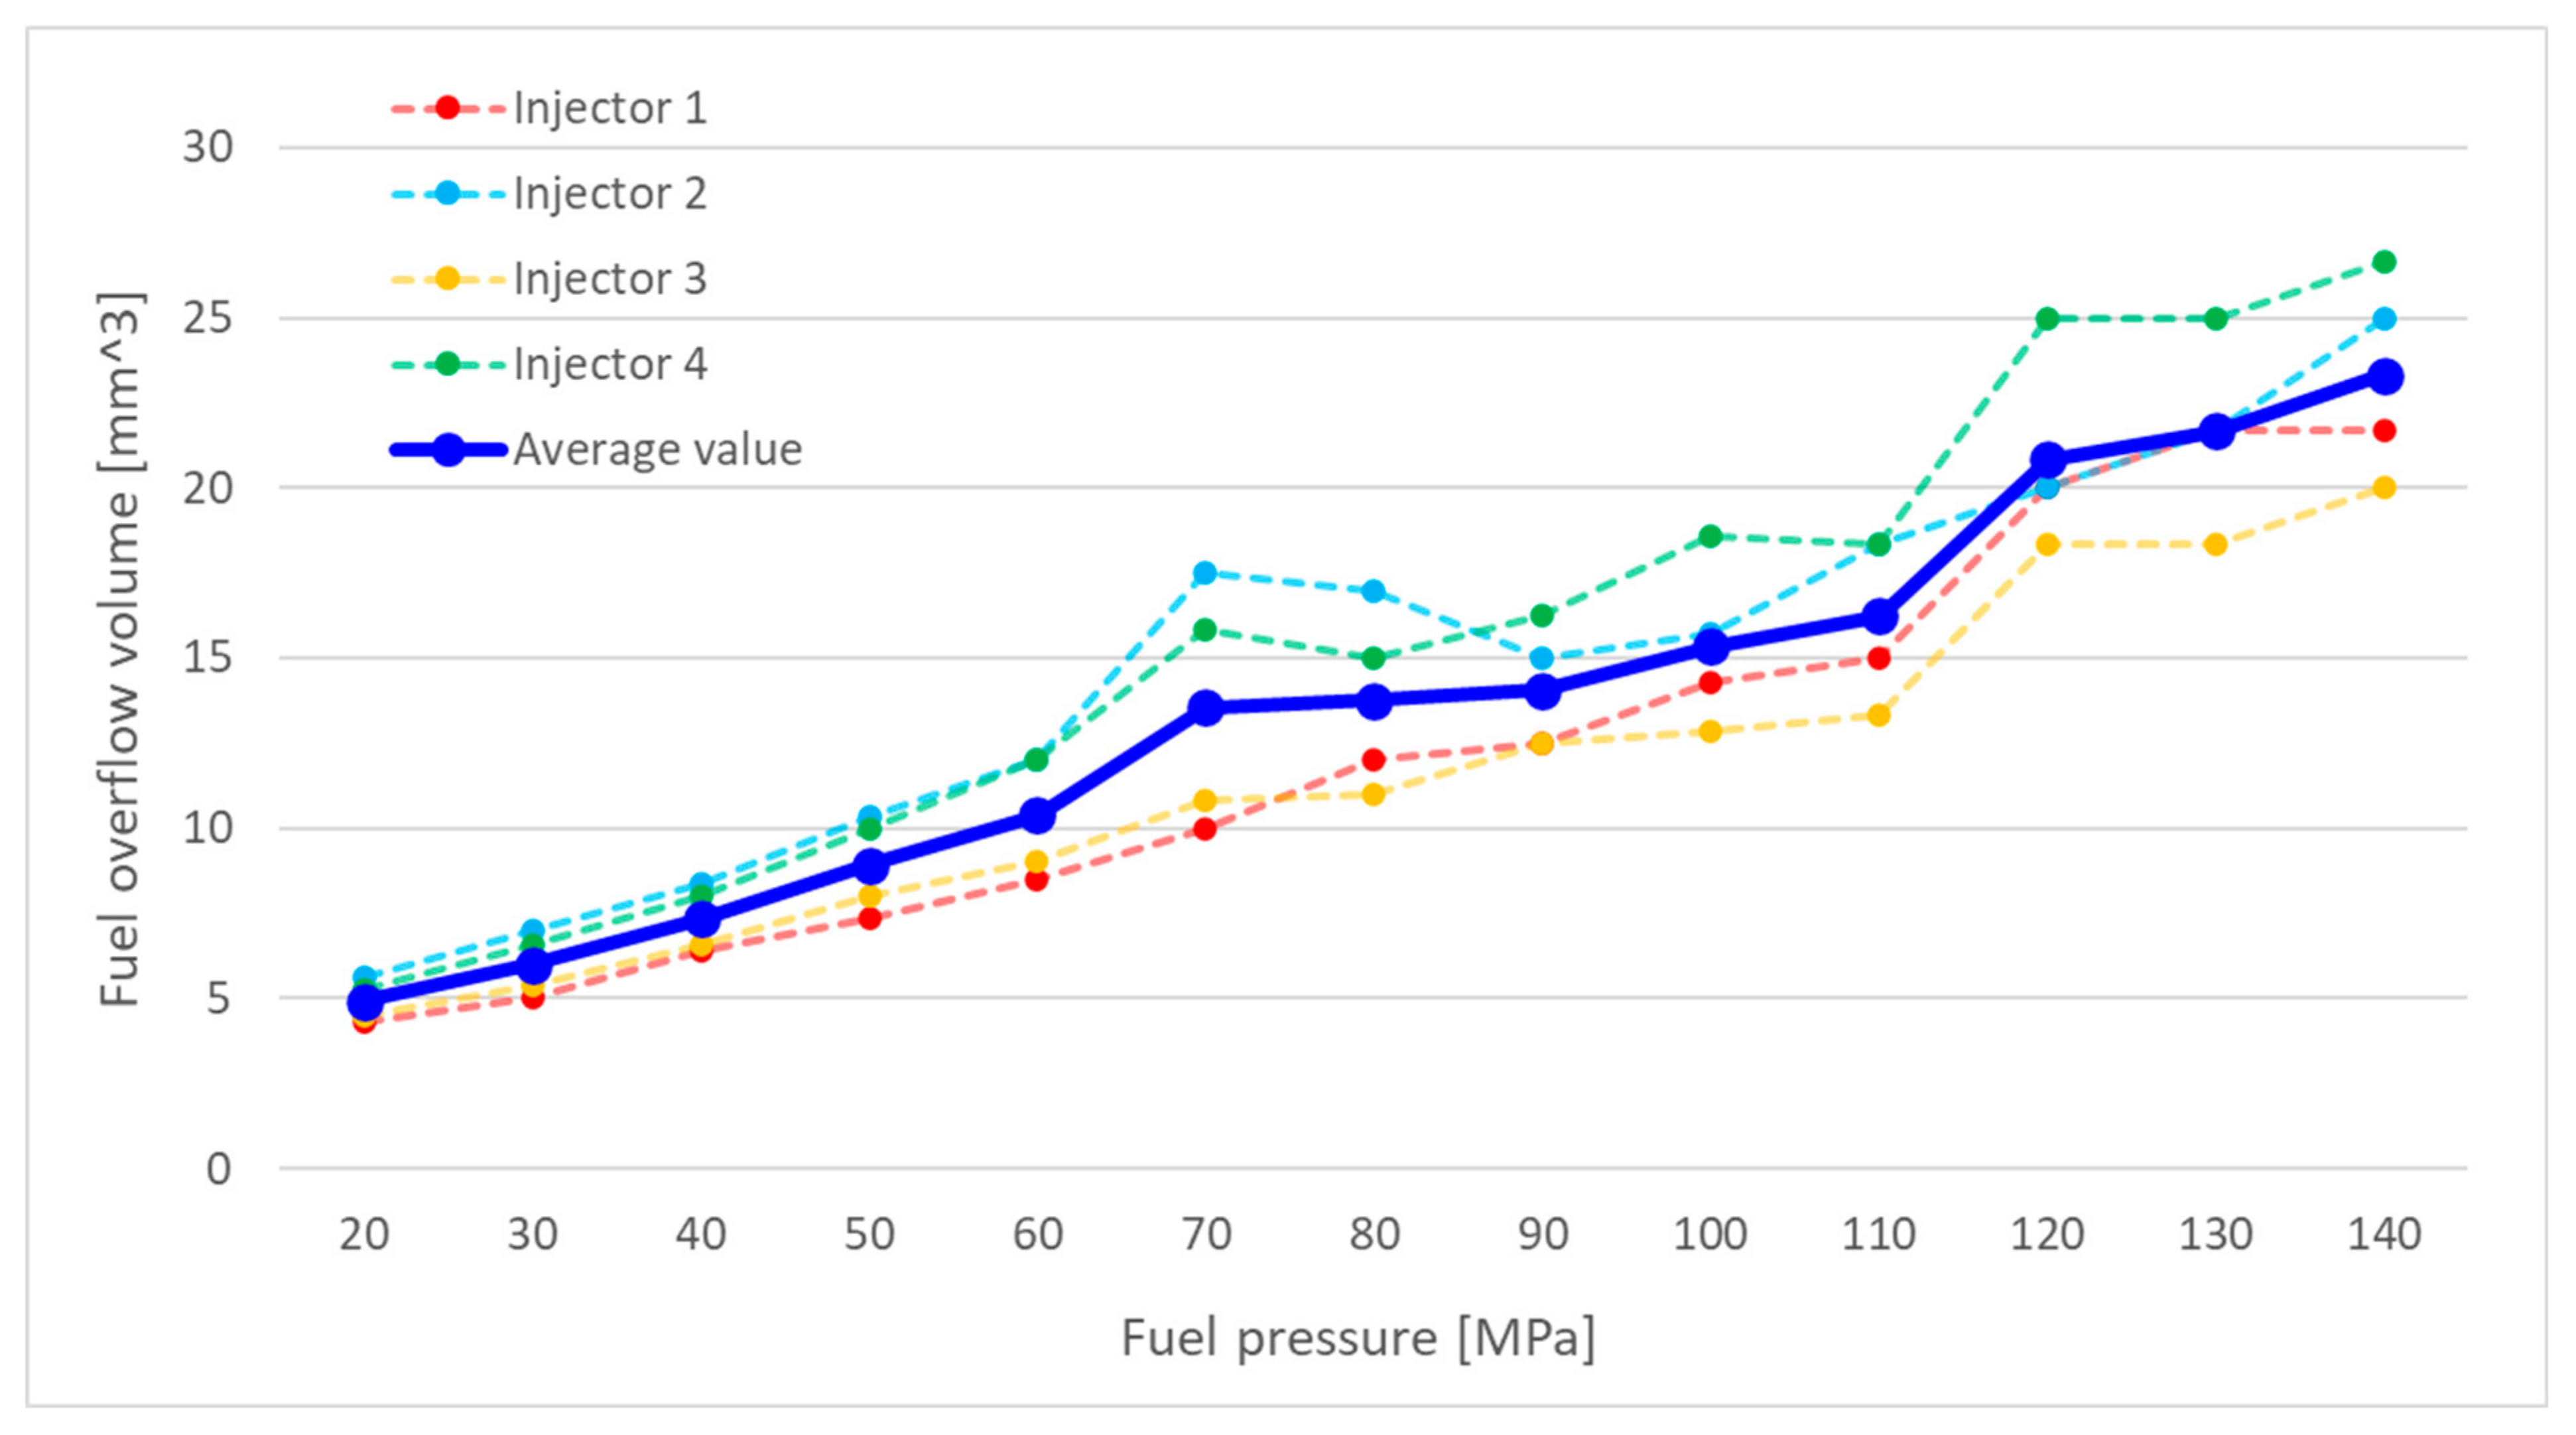
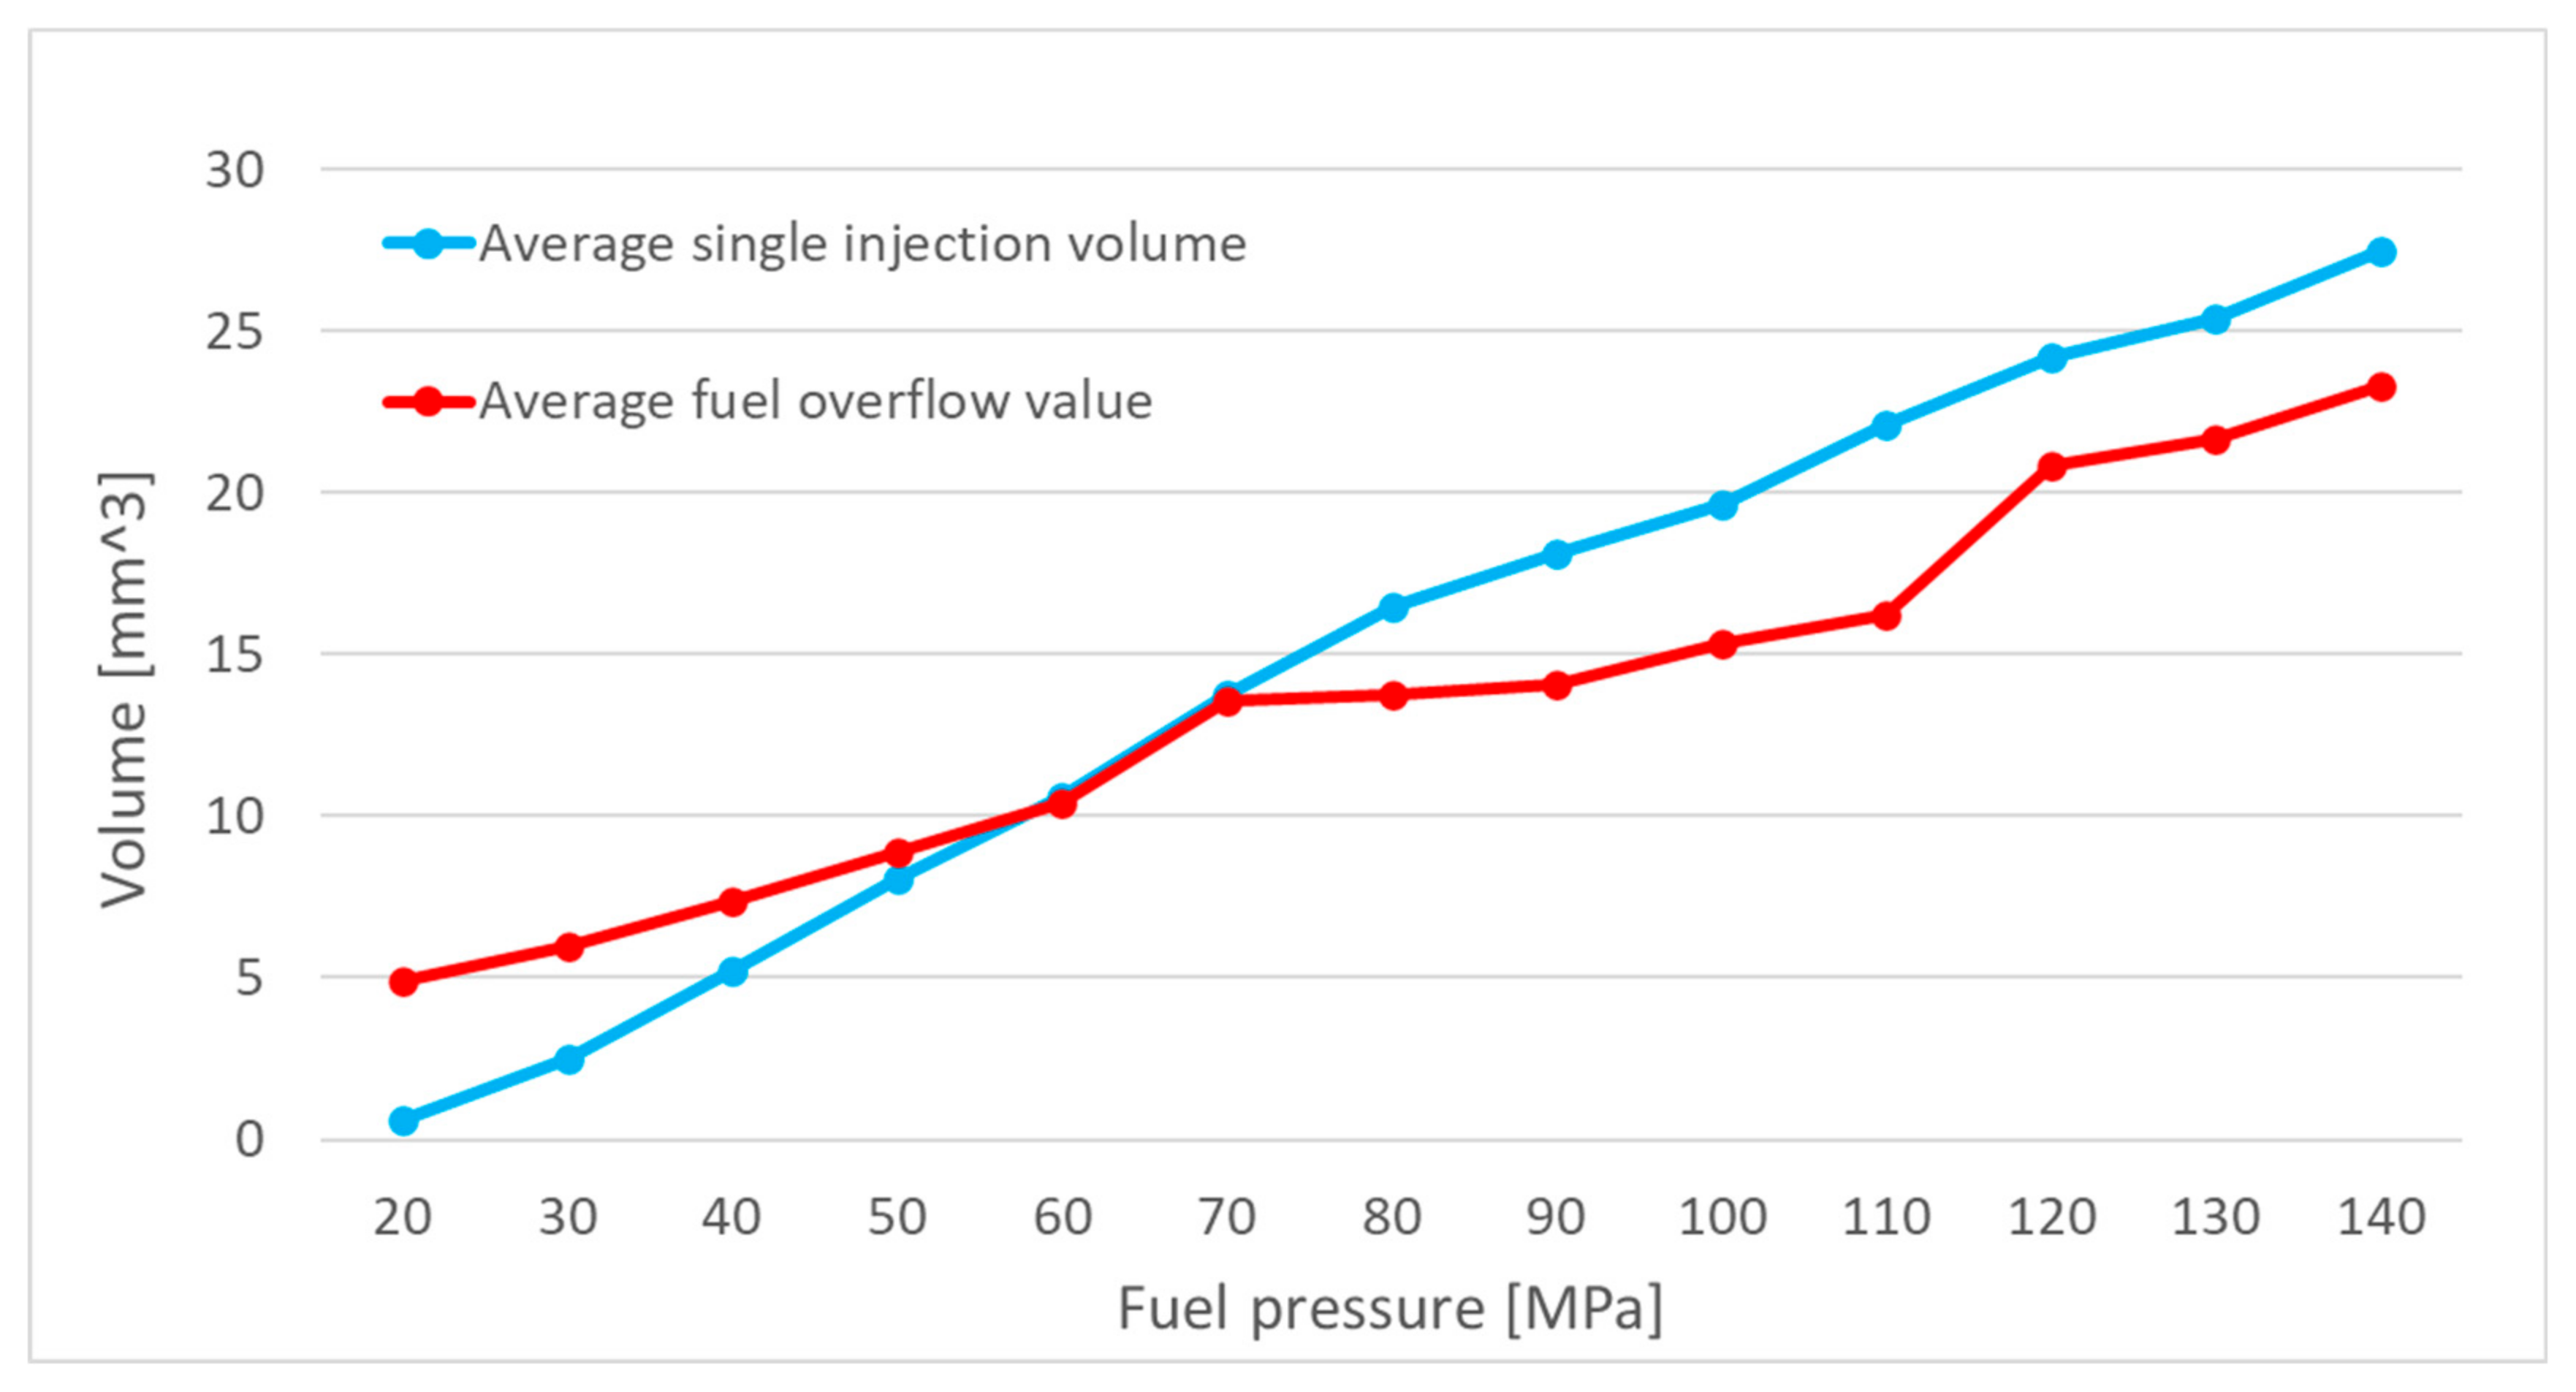
After completing the specified number of injection events, the volume of fuel overflow was measured in the calibration cylinders. The overflow volumes for each series of measurements were collected and used to create graphs showing overflow volume as a function of pressure for four injector opening times. One such graph, corresponding to an injector opening time of 500 µs, is presented in
Figure 2.
The overflow volumes for each injector showed significant variation. The greatest discrepancies were observed at pressures exceeding 60 MPa. This variability can be attributed to production inconsistencies and differing levels of wear among the injectors. Abrasive wear of the moving components within the injector may lead to increased leakage of fuel through the control valve and between the needle and the nozzle body during operation.
To compare the results of experimental tests with those of simulation studies, the measurement data collected so far were averaged. A graph was then generated to represent the mean injected fuel volume under the specified operating conditions of the injector. This graph, corresponding to an injector opening time of 500 µs, is presented in
Figure 3.
4. Simulation Model of the Injector
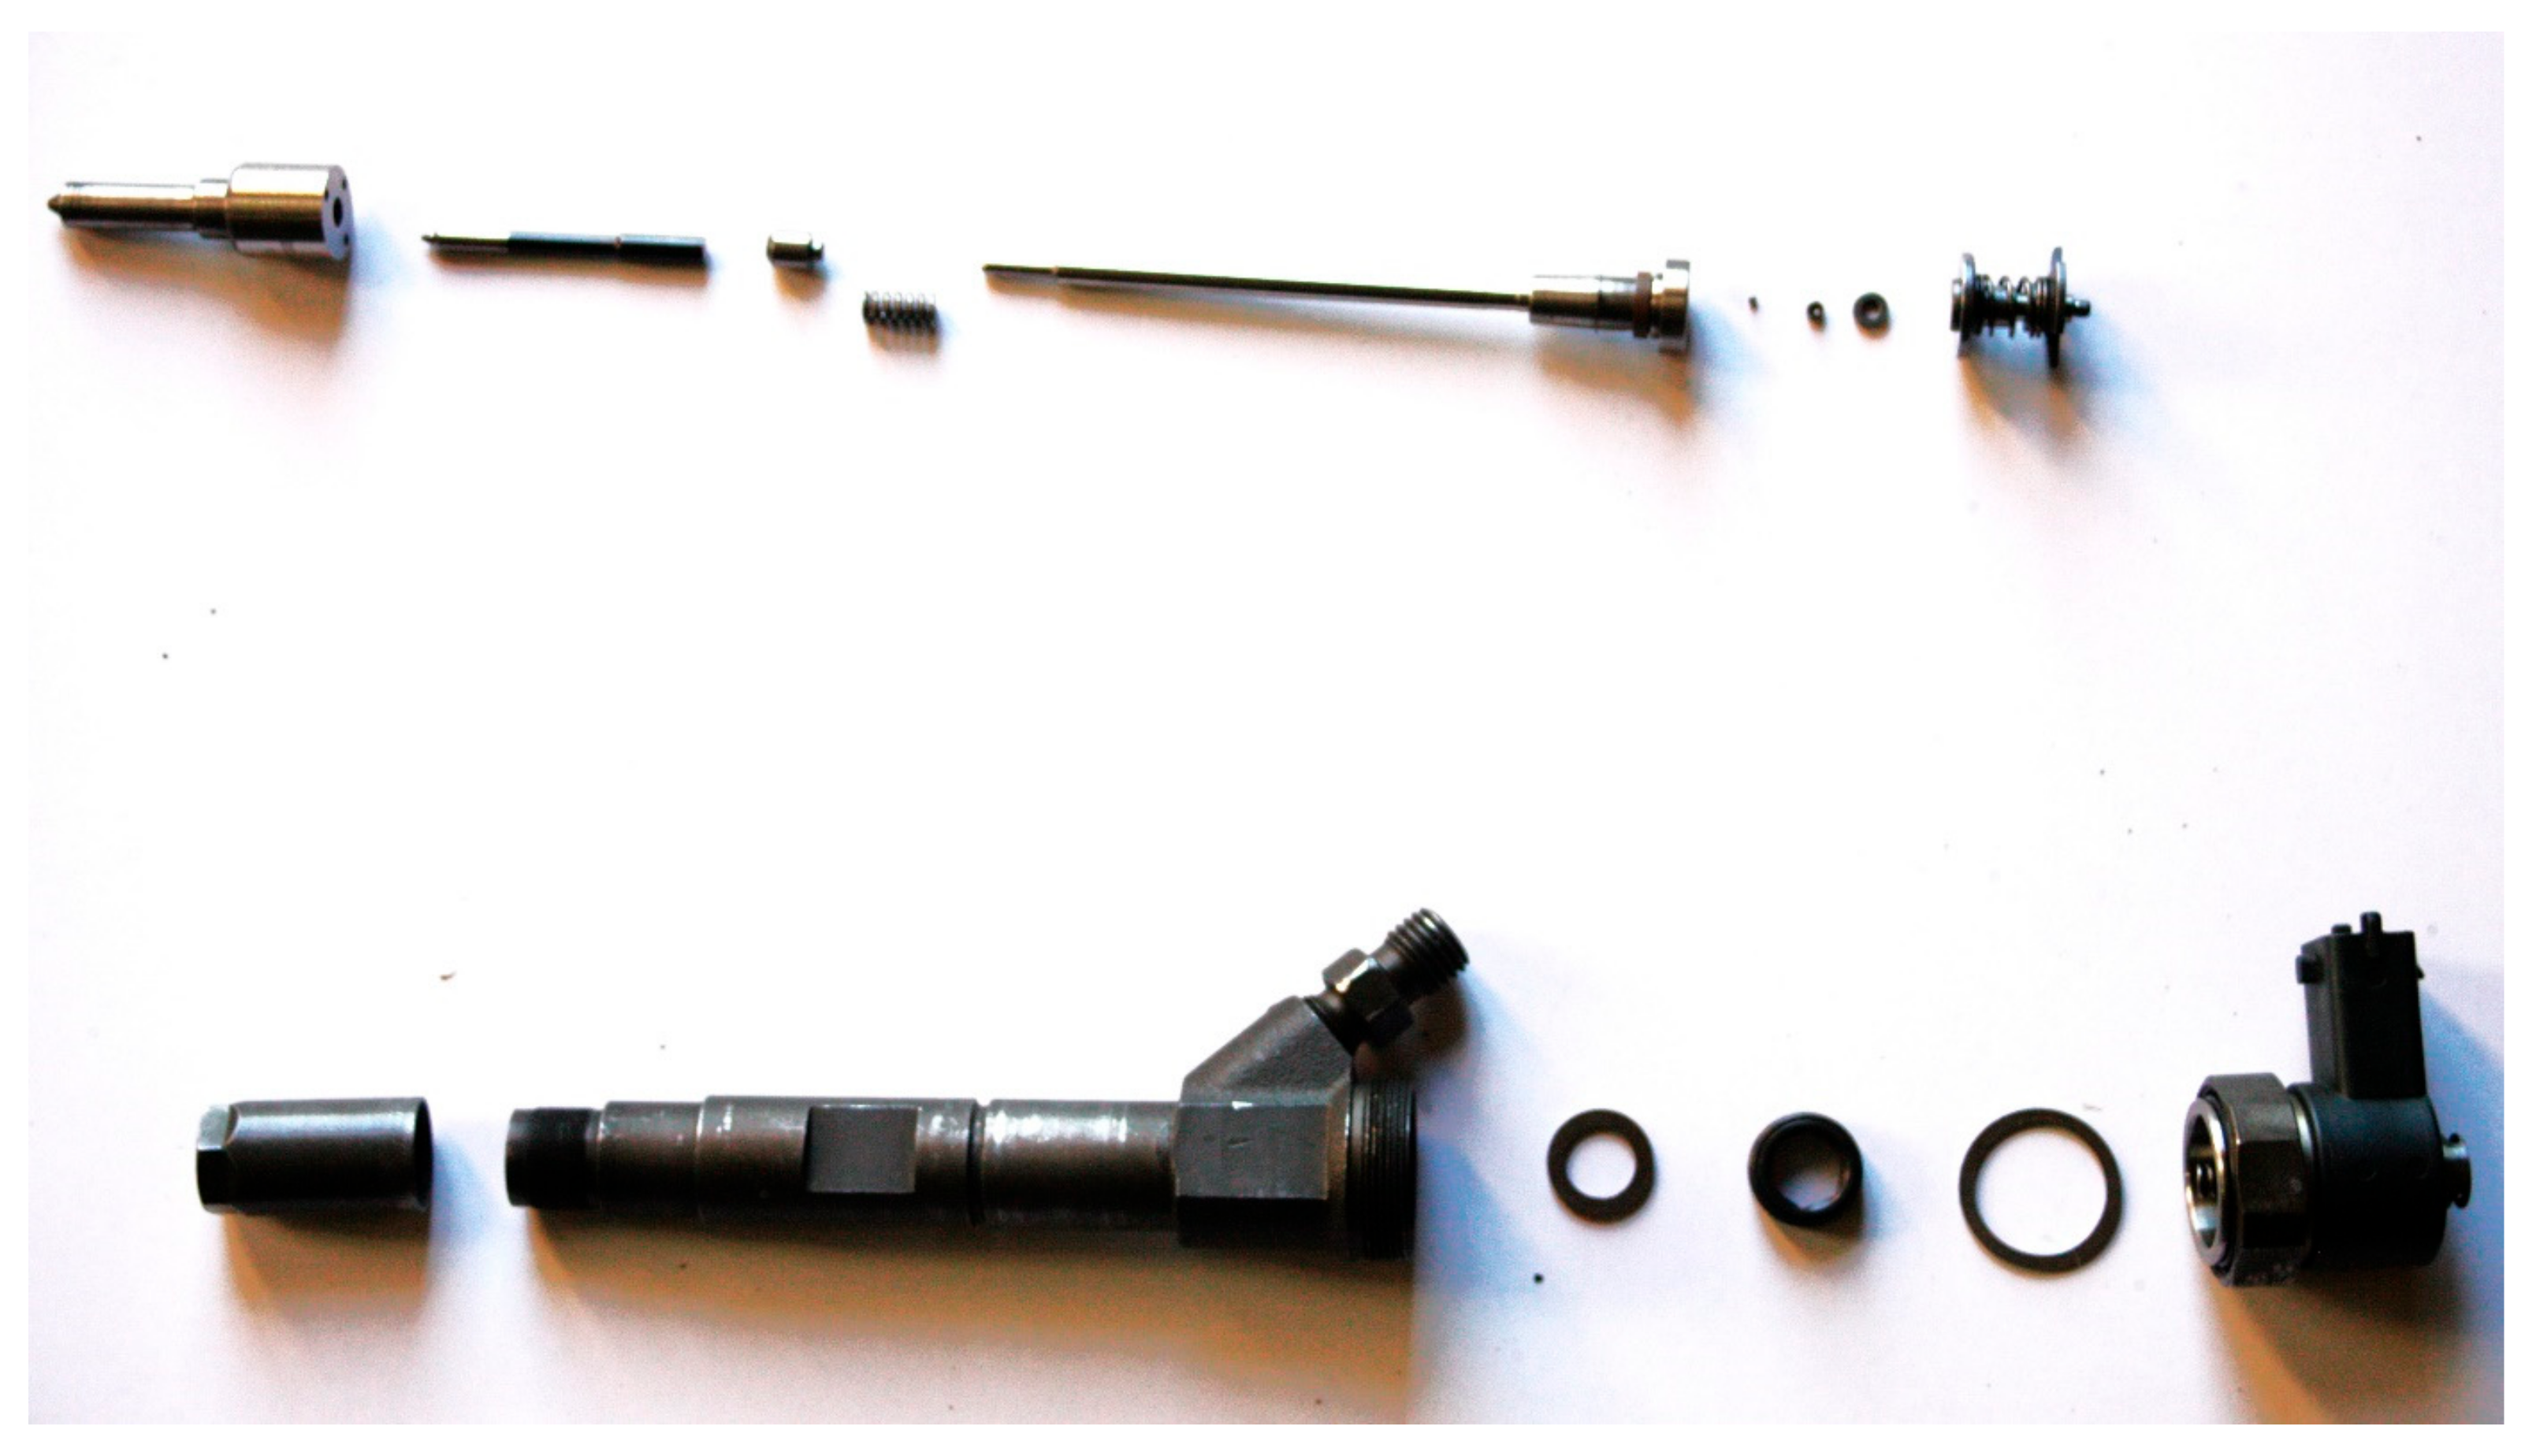
The simulation studies required the creation of a model of the electromagnetic injector in the Amesim software, using the same parameters as the injector tested on the bench. To achieve this, one of the tested injectors was disassembled into its individual components. For further studies, the key components of the injector that influence its operation were identified to accurately replicate the real injector in the Amesim model.
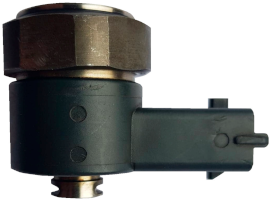
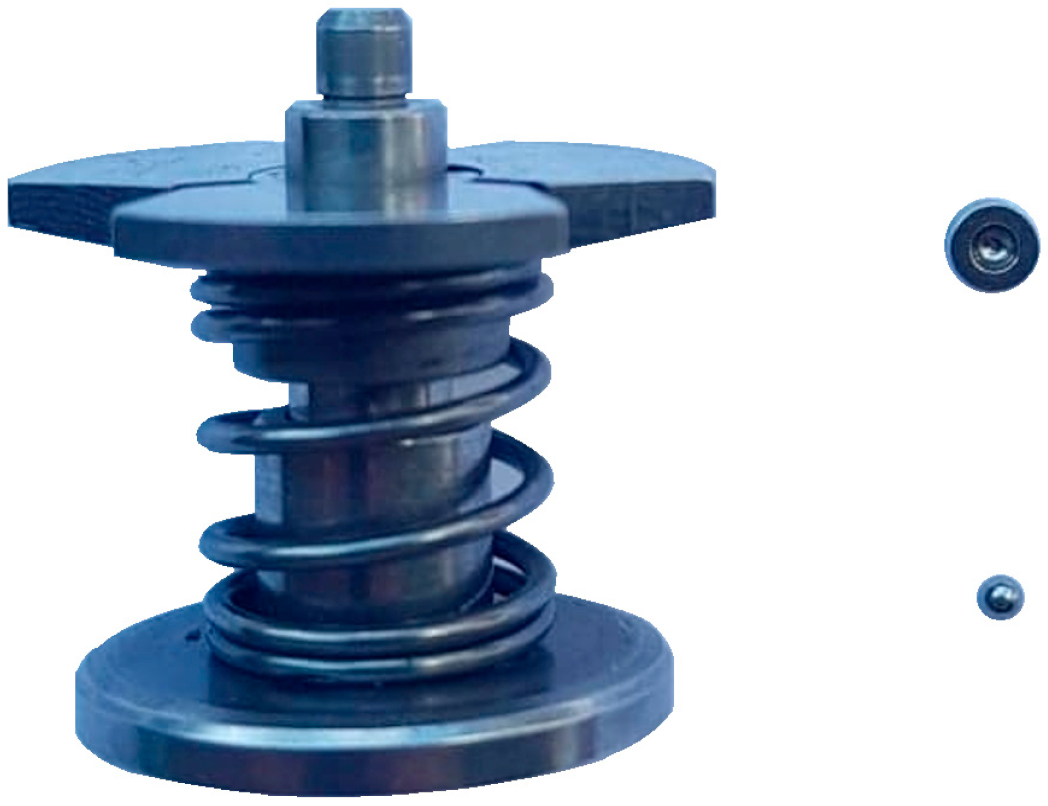
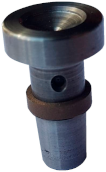
The disassembled injector components are illustrated in
Figure 4.
After disassembling the injector, all its components were washed in an ultrasonic cleaner. The individual components of the disassembled injector were subjected to mass and geometric dimension measurements. These steps were essential for the development of the injector model being studied.
After completing the mass measurements of selected components, the next step involved measuring the geometric dimensions of key parts.
Figure 5 shows the measurement of the cone angle of the nozzle needle. Given that the nozzle contained six orifices, the diameter of each orifice was measured individually. The average diameter was then calculated and input into the simulation software. The measurements were performed using a KEYENCE VHX-6000 microscope (Singapore).
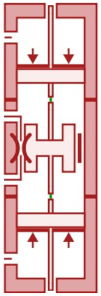
Table 2 summarizes the characteristics of the individual components of the injector along with their counterparts from the Amesim software element library. For the purpose of the study, only those parameters that directly influence the injector’s performance were measured. Mass measurements were conducted for the moving components due to the effect of inertia forces, which impact the speed of movement of the injector’s parts. Additionally, geometric dimensions were measured for components through which fuel flows, enabling the software to calculate parameters such as flow rates through individual channels. Geometric measurements were also performed on components where fuel pressure acts on their surfaces. This was necessary to allow the software to calculate forces resulting from the pressure exerted on these surfaces.
Table 2.
Specification of the injector components with their counterparts in the Amesim software component library.
Table 2.
Specification of the injector components with their counterparts in the Amesim software component library.
| Counterpart from the Component Library | Injector Part |
|---|
| Solenoid valve coil |
![Energies 18 02271 i001]() | ![Energies 18 02271 i002]() |
| Assumed parameters: | Power supply signal frequency: 20 Hz Solenoid valve coil actuation time: 500 µs, 1000 µs, 1500 µs, 2000 µs
|
| Solenoid valve anchor, ball, and centering ring |
![Energies 18 02271 i003]() | ![Energies 18 02271 i004]() |
| The friction of the interacting elements was taken into account. In addition, the viscosity and density of the fuel flowing around the moving masses were considered, as well as the fuel pressure, which also affects the characteristics of the movement. | Mass of the electromagnet anchor: 3.169 g Mass of the electromagnet anchor core: 2.309 g Mass of the electromagnet anchor semicircular protection: 0.109 g Mass of the electromagnet anchor spring: 0.682 g Mass of the ball: 0.018 g Centering ring weight: 0.062 g
Total weight: 6.349 g |
| Solenoid valve socket |
![Energies 18 02271 i005]() | ![Energies 18 02271 i006]() |
| Assumed parameters: | |
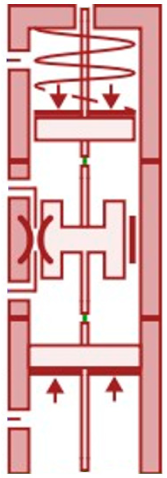
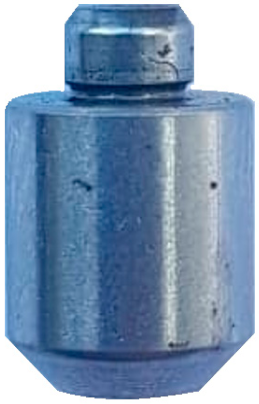
| Control piston |
![Energies 18 02271 i007]() | ![Energies 18 02271 i008]() |
| The movement of the piston takes place, taking into account the Couette flow. It is a laminar flow of a viscous fluid between two planes, where one is fixed (in this case, the inner surface of the injector body) and the other moves at a given speed (in this case, the surface of the piston) [28]. | |
| Control piston connector |
![Energies 18 02271 i009]() | ![Energies 18 02271 i010]() |
Assumed parameters:
Spring force in the initial position: 15 N Elasticity coefficient: 13 N/mm Clearance between the connector and the housing: 0.003 mm
| Rod diameter: 3.100 mm Shank diameter: 5.740 mm Weight: 1.359 g
|
| Mass of the control piston and control piston link |
![Energies 18 02271 i011]() | ![Energies 18 02271 i012]() |
| The friction of the interacting elements was taken into account. In addition, the viscosity and density of the fuel flowing around the moving masses were considered, as well as the fuel pressure, which also affects the characteristics of the movement. | |
| Fuel cushion between control piston link and needle |
![Energies 18 02271 i013]() |
| Spring-damping properties of the fuel cushion between the control piston link and the needle: default properties selected |
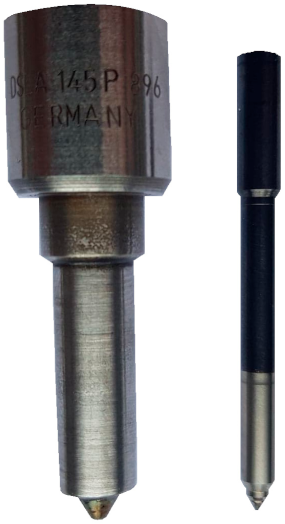
| Atomizer needle weight |
![Energies 18 02271 i014]() | ![Energies 18 02271 i015]() |
| The friction of the interacting elements was taken into account. In addition, the viscosity and density of the fuel flowing around the moving masses were considered, as well as the fuel pressure, which also affects the characteristics of the movement. | |
| Needle atomizer |
![Energies 18 02271 i016]() | ![Energies 18 02271 i017]() |
| Assumed parameters: | Needle diameter: 3095 µm Needle diameter in the guiding part: 3807 µm Average diameter of nozzle holes: 200 µm Number of holes in the nozzle: 6 Cone angle of the nozzle needle: 59.7°
|
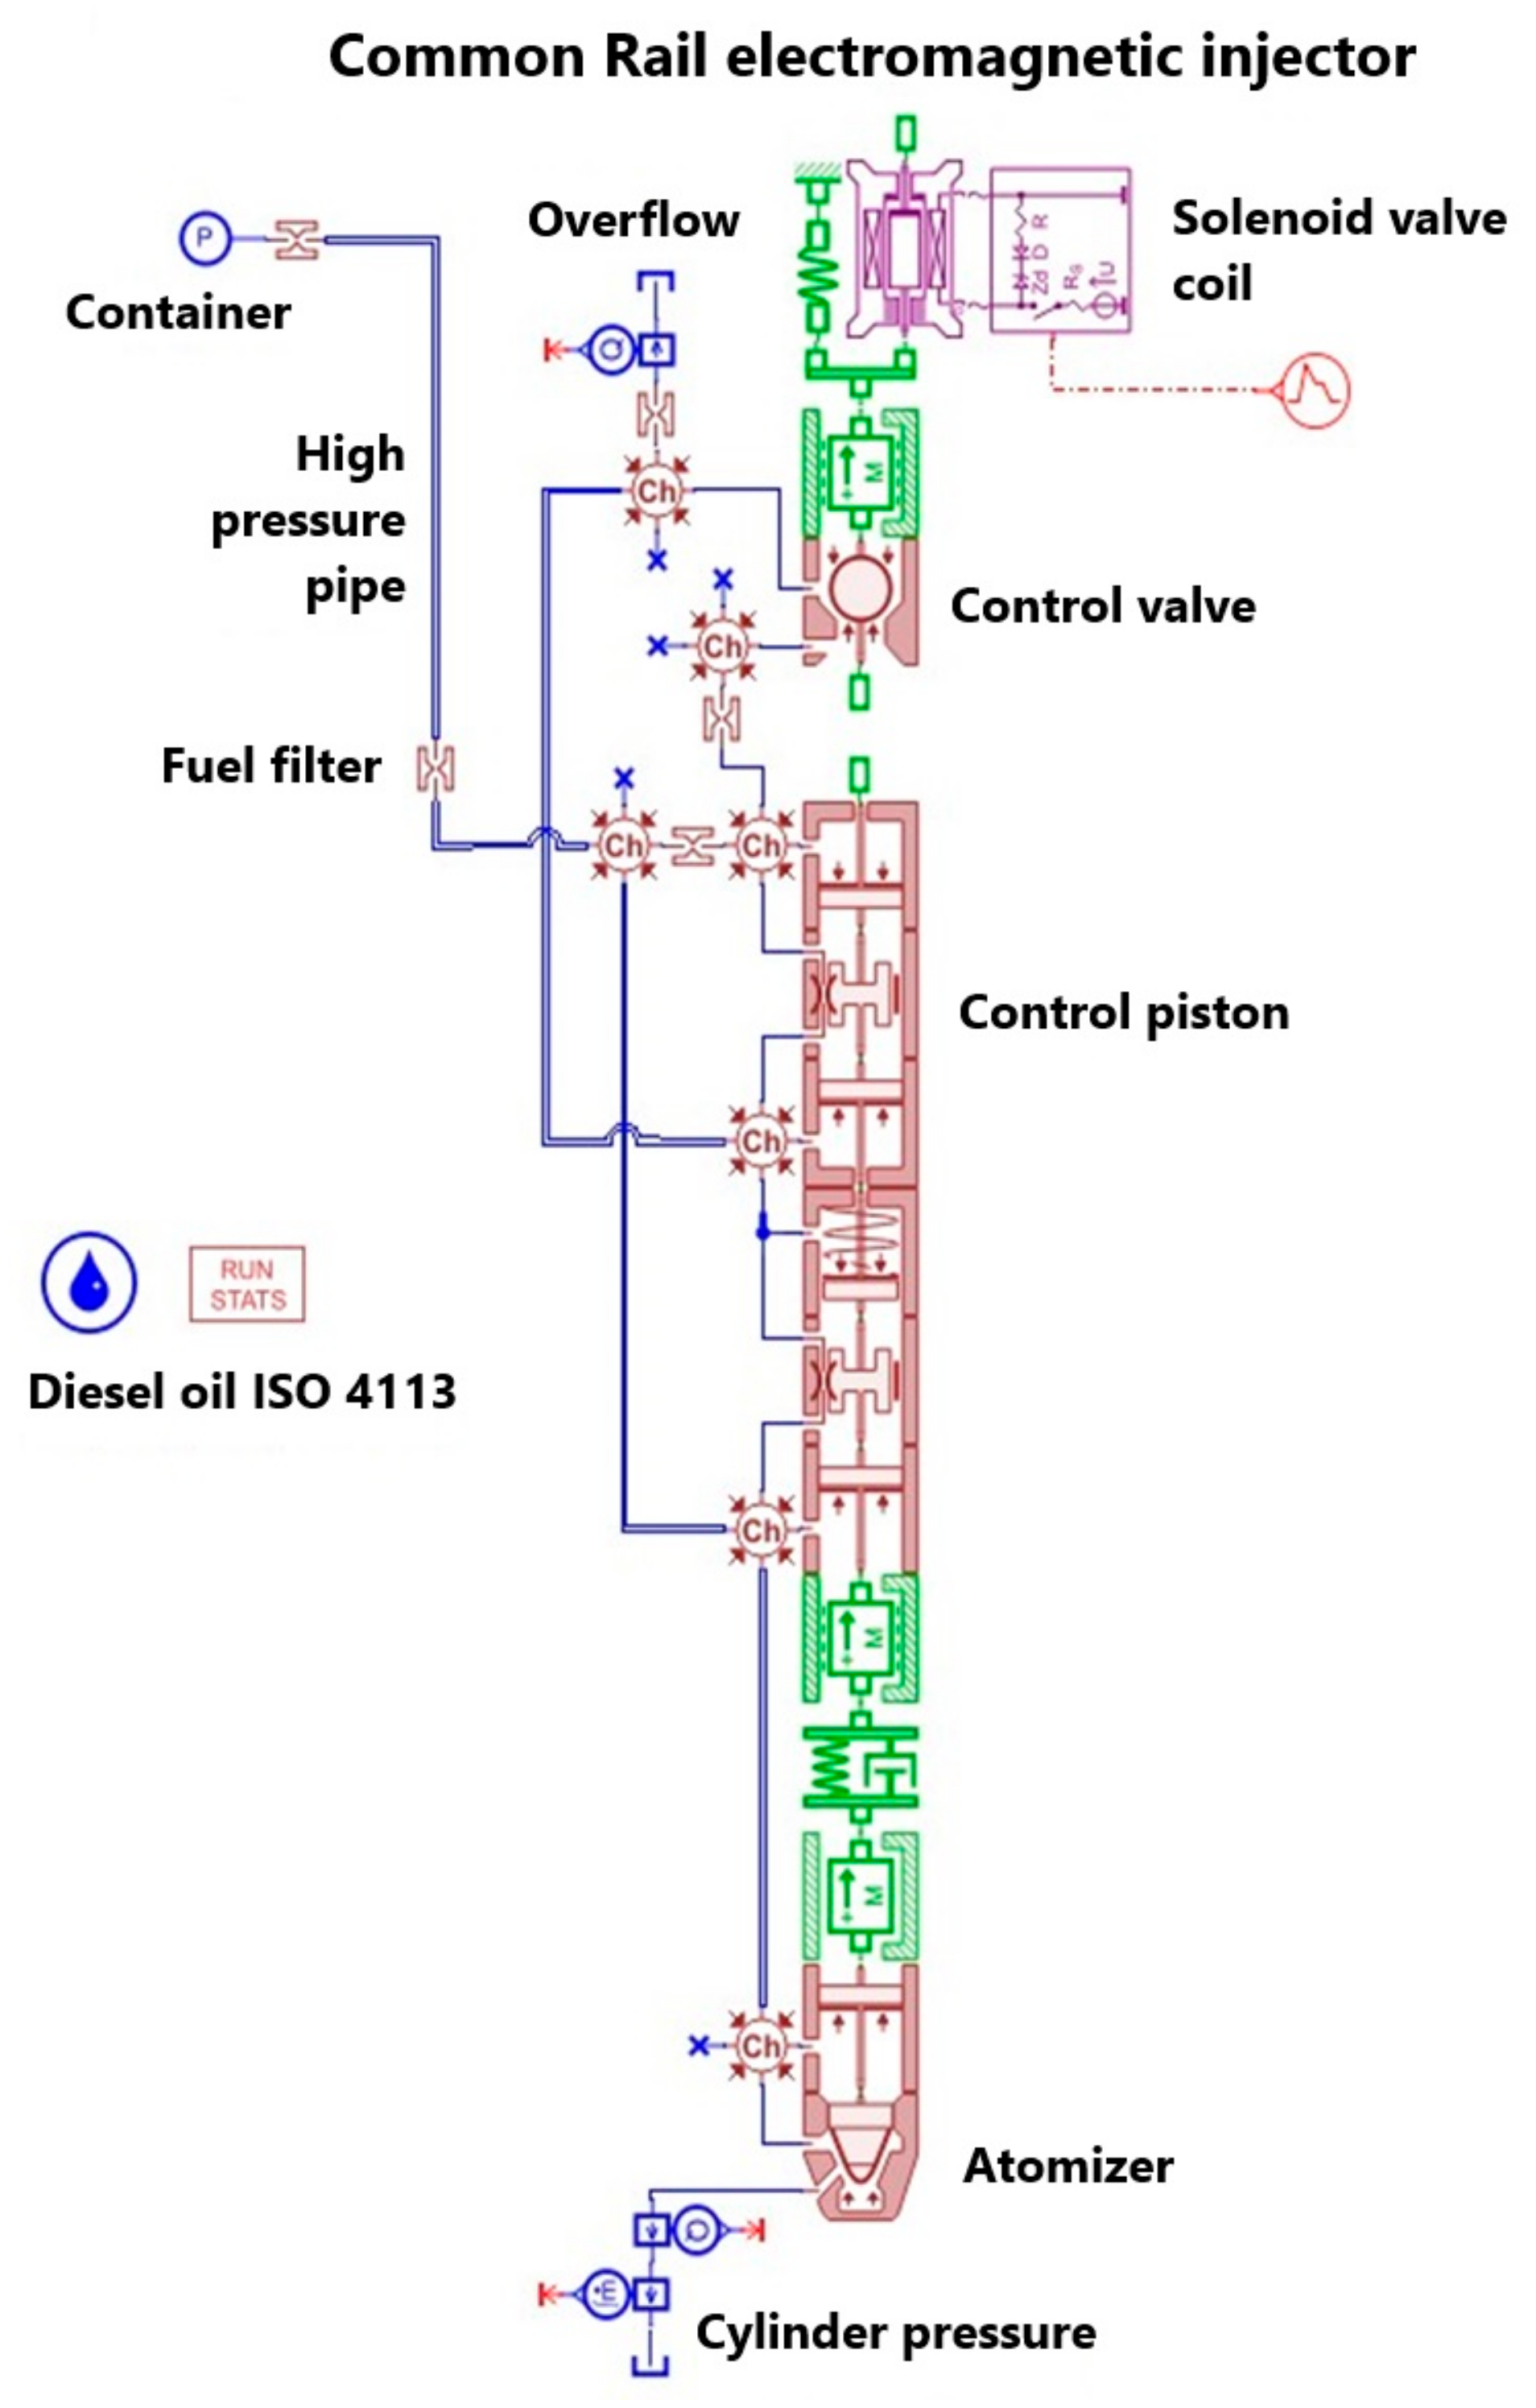
The model of the injector in question is shown in
Figure 6.
Subsequently, the determined characteristic parameters were entered into the software to construct the injector model. The next step involved inputting the operating parameters for each measurement series, in accordance with the established research plan. This included specifying the actuation times for the electromagnetic valve coil: 500 µs, 1000 µs, 1500 µs, and 2000 µs. The measurement series primarily differed in the injector opening times.
In each series, 13 fuel injection events were simulated at varying pressures, enabling the representation of different injector operating states. With four measurement series, this approach allowed for the simulation of 52 operating states (four injector opening times, each tested under 13 different injection pressures). The first injection in each series was performed at a fuel pressure of 20 MPa. For each subsequent injection, the pressure was increased by 10 MPa, with the final injection carried out at 140 MPa. This setup provided a comprehensive dataset for evaluating injector performance under a wide range of operating conditions.
In the experimental bench tests of the injector, a non-flammable water-based fluid, Kalibrol, was used. Kalibrol is a specialized calibration fluid designed for fuel injection system testing, commonly used in test benches. Its stable viscosity ensures repeatable test results on the test bench. Being water-based, Kalibrol is non-flammable, unlike diesel fuel [
29]. In the simulation studies, a calibration fluid based on mineral oil, compliant with ISO 4113:2010 standard [
30], was used as the working fluid. These two fluids have similar properties [
31]. However, differences in the results between the simulation and bench tests may arise due to the slight differences in their physical characteristics. The choice of using Kalibrol in the experimental studies was primarily driven by safety considerations. For this reason, the researchers opted not to conduct tests with mineral oil-based fluids. In future studies, the test bench setup will be adapted to meet ISO standards to ensure a consistent basis for comparison between simulation and experimental results.
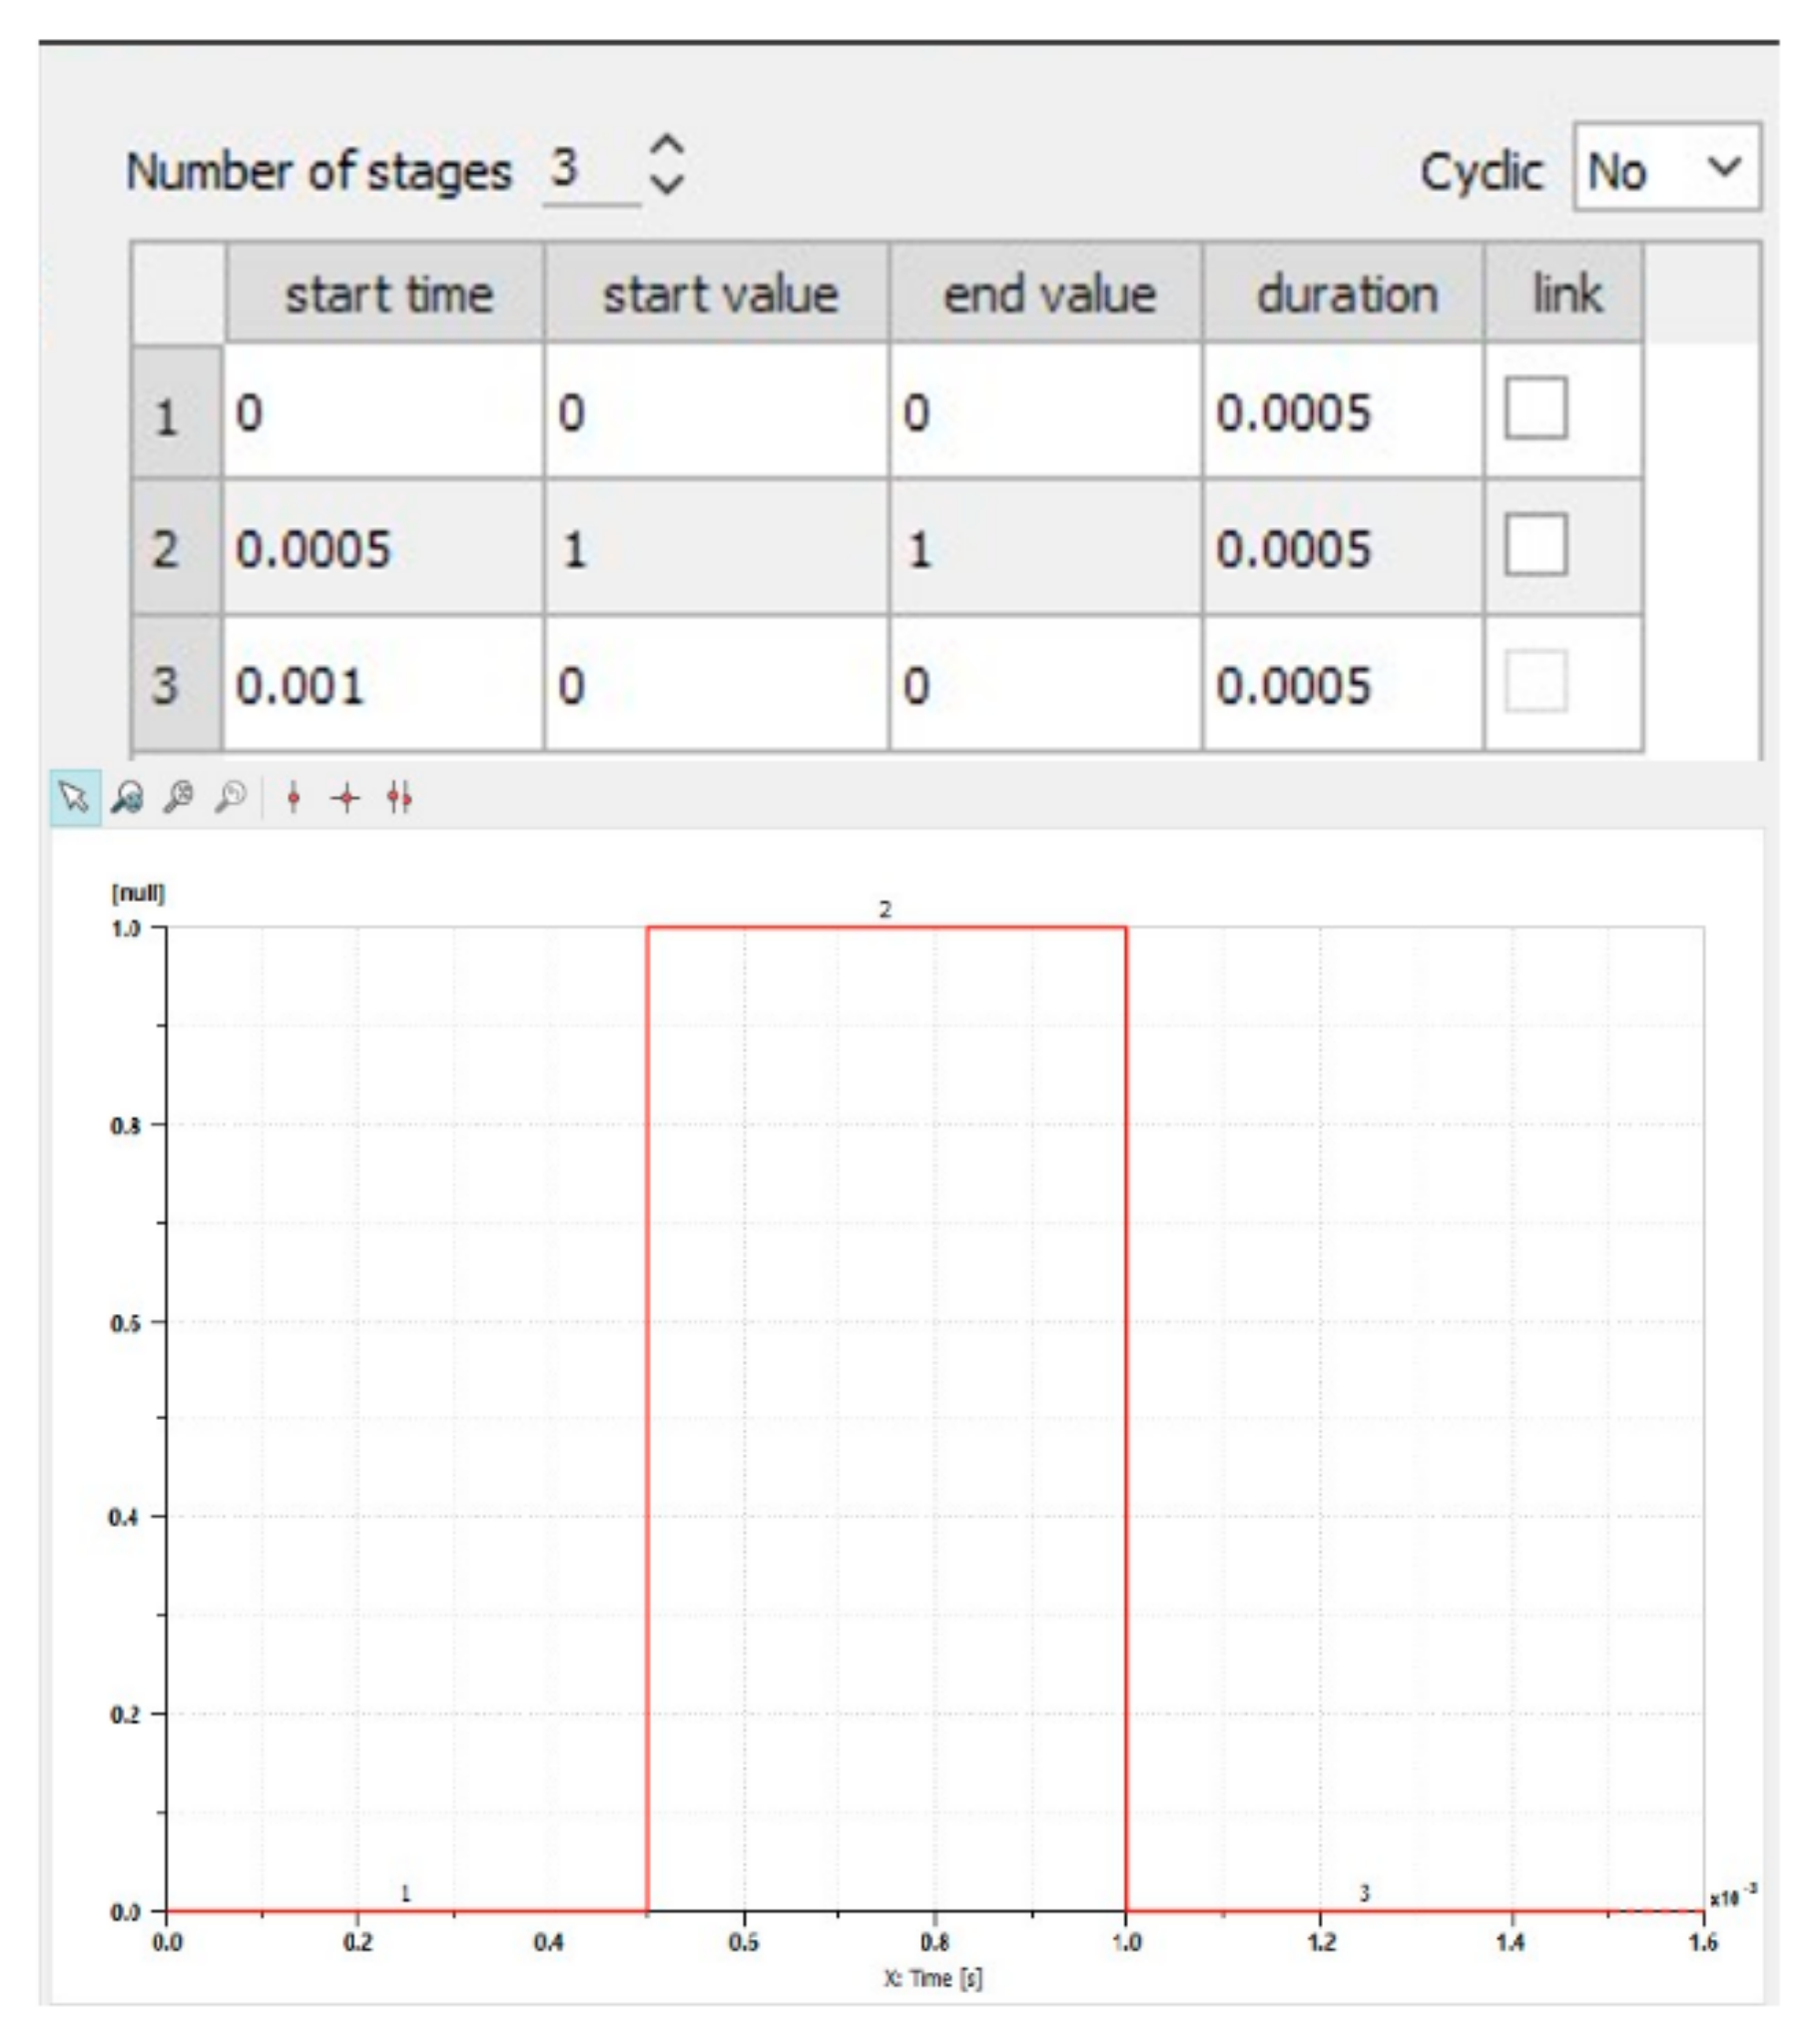
The Amesim software allows for flexible shaping of the input signal to the electromagnetic valve coil. For the simulations, a rectangular waveform was chosen as the shape of the input signal. The interface window in Amesim used for modeling the input signal to the electromagnetic valve coil is shown in
Figure 7.
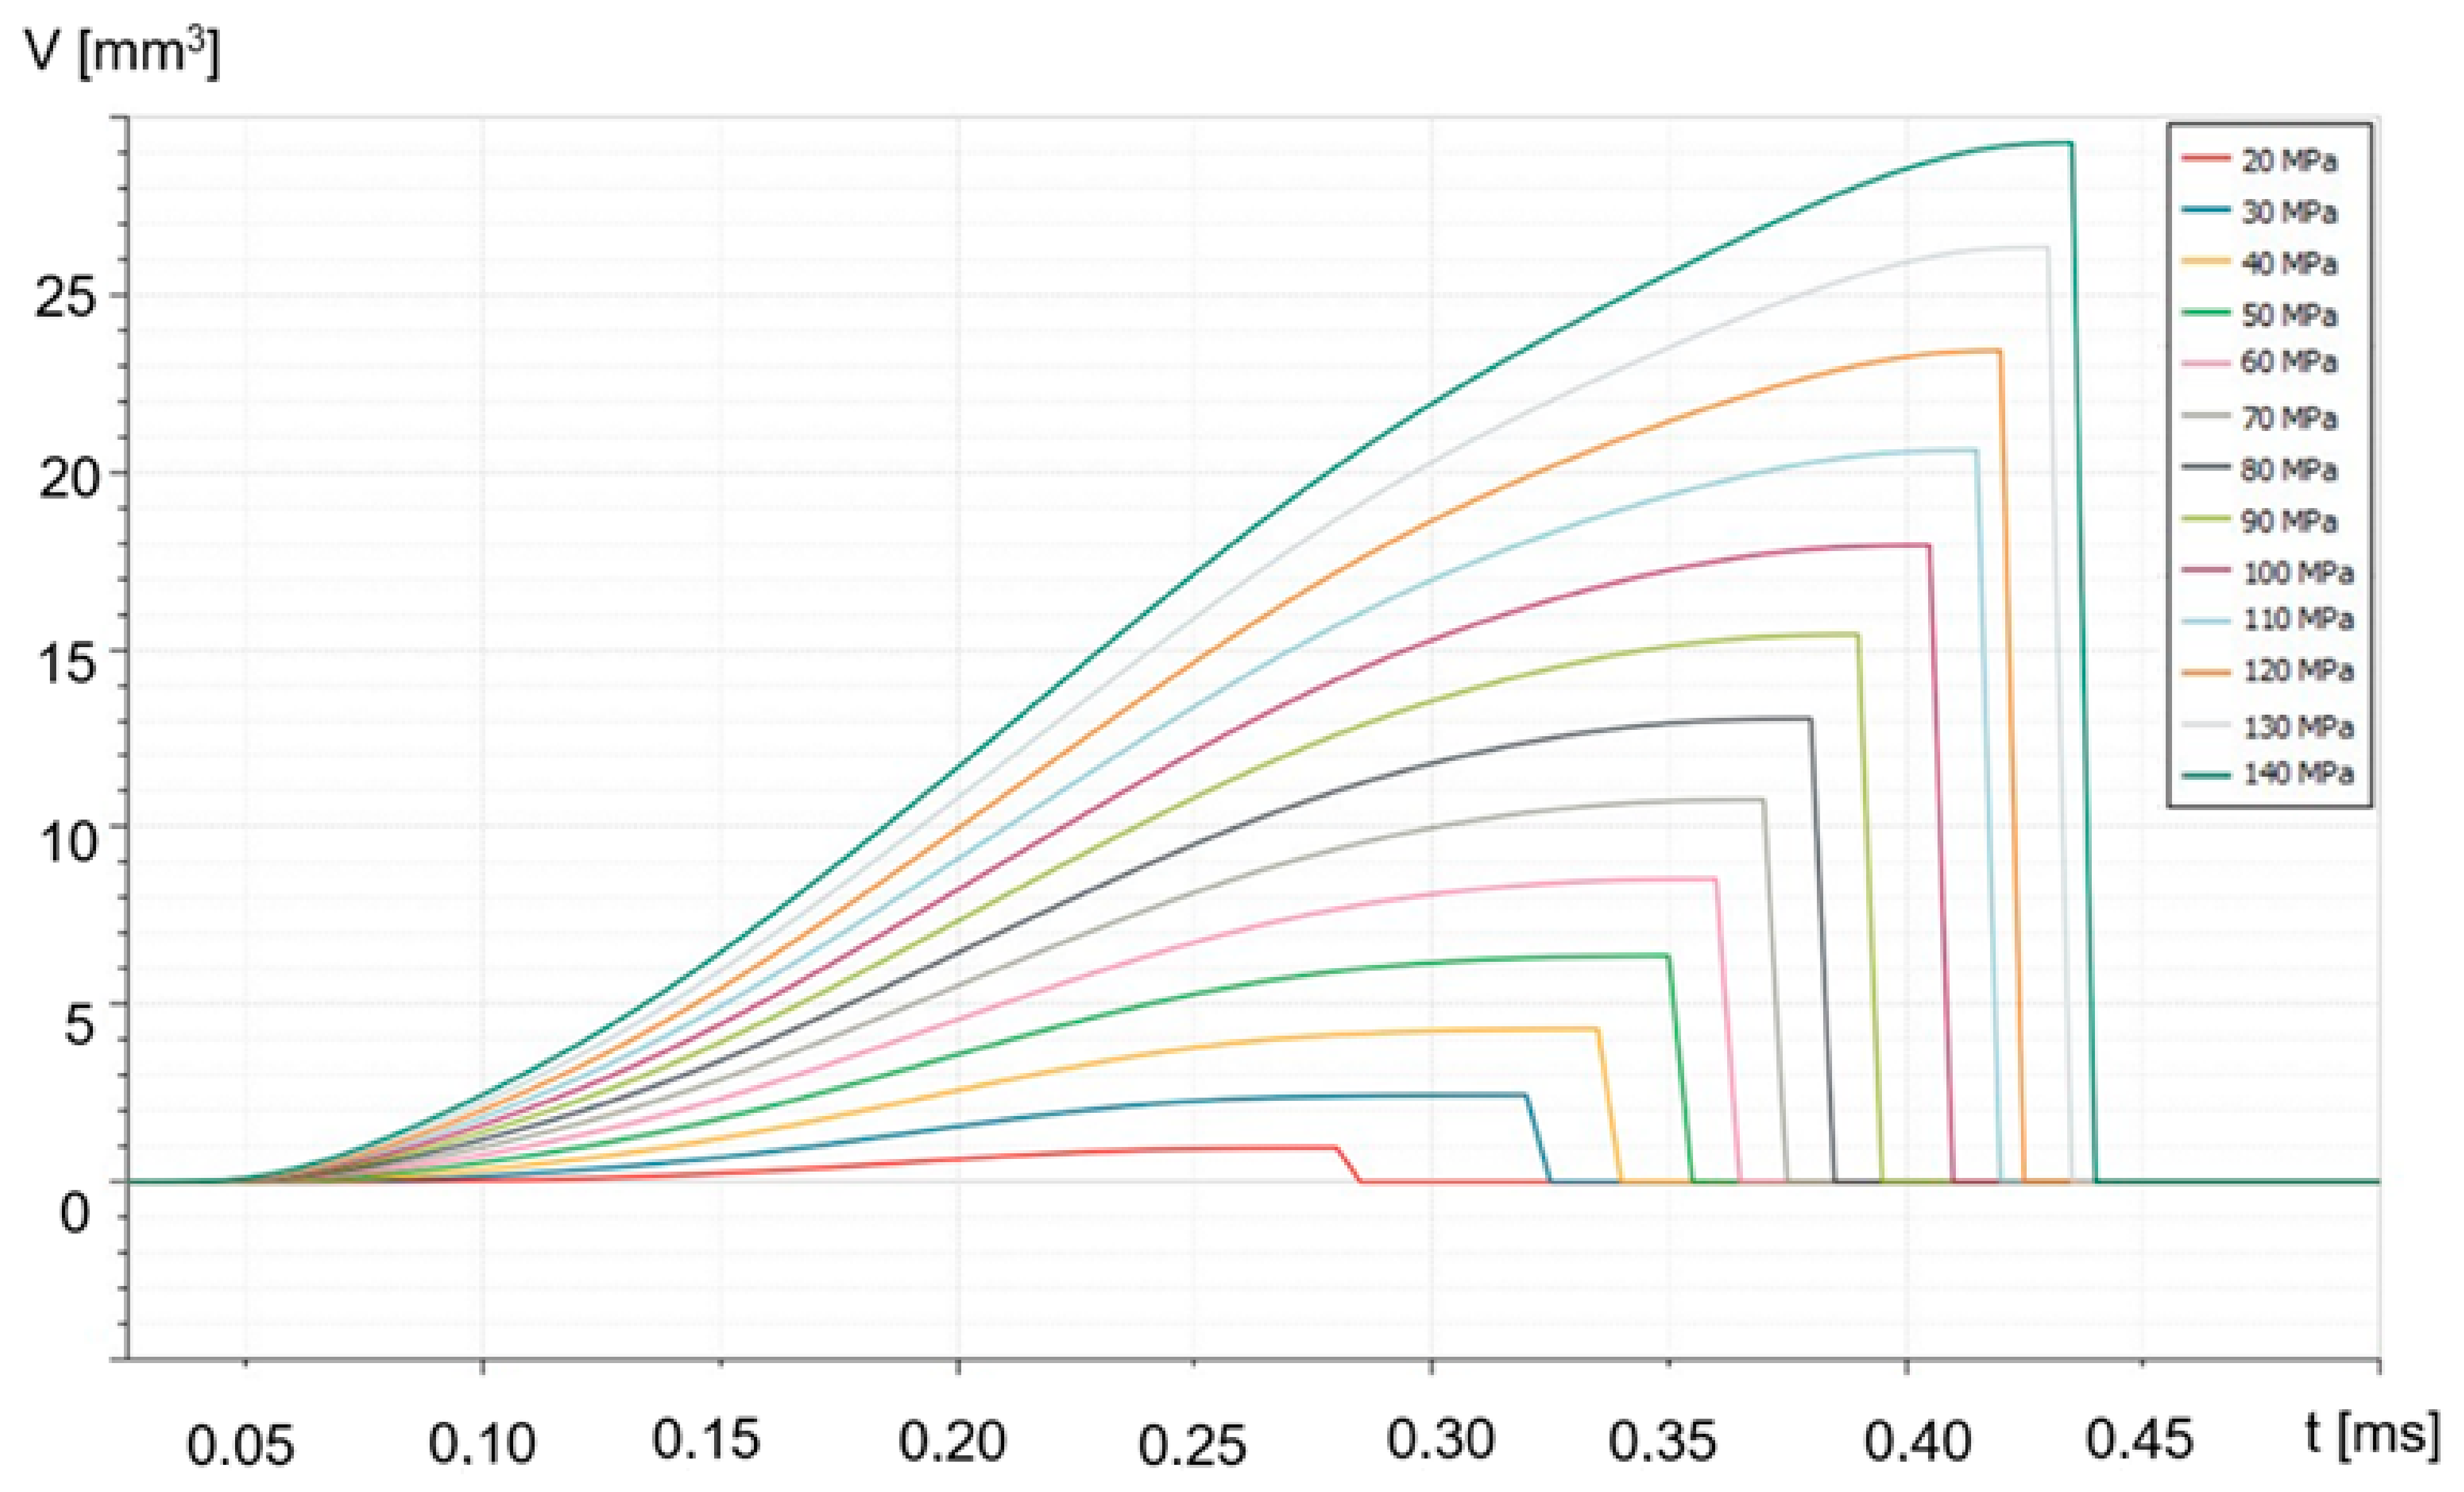
The study was conducted in series, where for a given injector actuation time, the program simulated thirteen different injector operating states. The pressure was varied from 20 MPa to 140 MPa, in increments of 10 MPa. After simulating the specified number of injections, the fuel volume “injected” during each injection at different pressures was determined from the fuel injection graphs. One such graph is presented in
Figure 8.
This process was repeated for the subsequent injector actuation times. Based on this, a graph of the injected fuel volume as a function of pressure was created for all actuation times. Additionally, a graph of overflow volume for each measurement series was generated based on the simulation results.
The creation of fuel injection characteristics as a function of pressure for both experimental and simulation results allowed for a comparison of these characteristics at this stage. This comparison is presented in
Figure 9. A similar comparison of characteristics was made for the overflow volume values.
Figure 6.
Model of the electromagnetic injector in the Amesim program [
30].
Figure 6.
Model of the electromagnetic injector in the Amesim program [
30].
Figure 7.
View of the Amesim program window for modeling the signal supplied to the solenoid valve coil.
Figure 7.
View of the Amesim program window for modeling the signal supplied to the solenoid valve coil.
Figure 8.
Fuel injection curves for an injector opening time of 500 µs: integral characteristic.
Figure 8.
Fuel injection curves for an injector opening time of 500 µs: integral characteristic.
Figure 9.
Summary of the single injection volume characteristics as a function of fuel injection pressure, prepared on the basis of simulations and bench tests for an injector opening time of 500 µs.
Figure 9.
Summary of the single injection volume characteristics as a function of fuel injection pressure, prepared on the basis of simulations and bench tests for an injector opening time of 500 µs.
6. Validation Results of Simulation and Experimental Studies
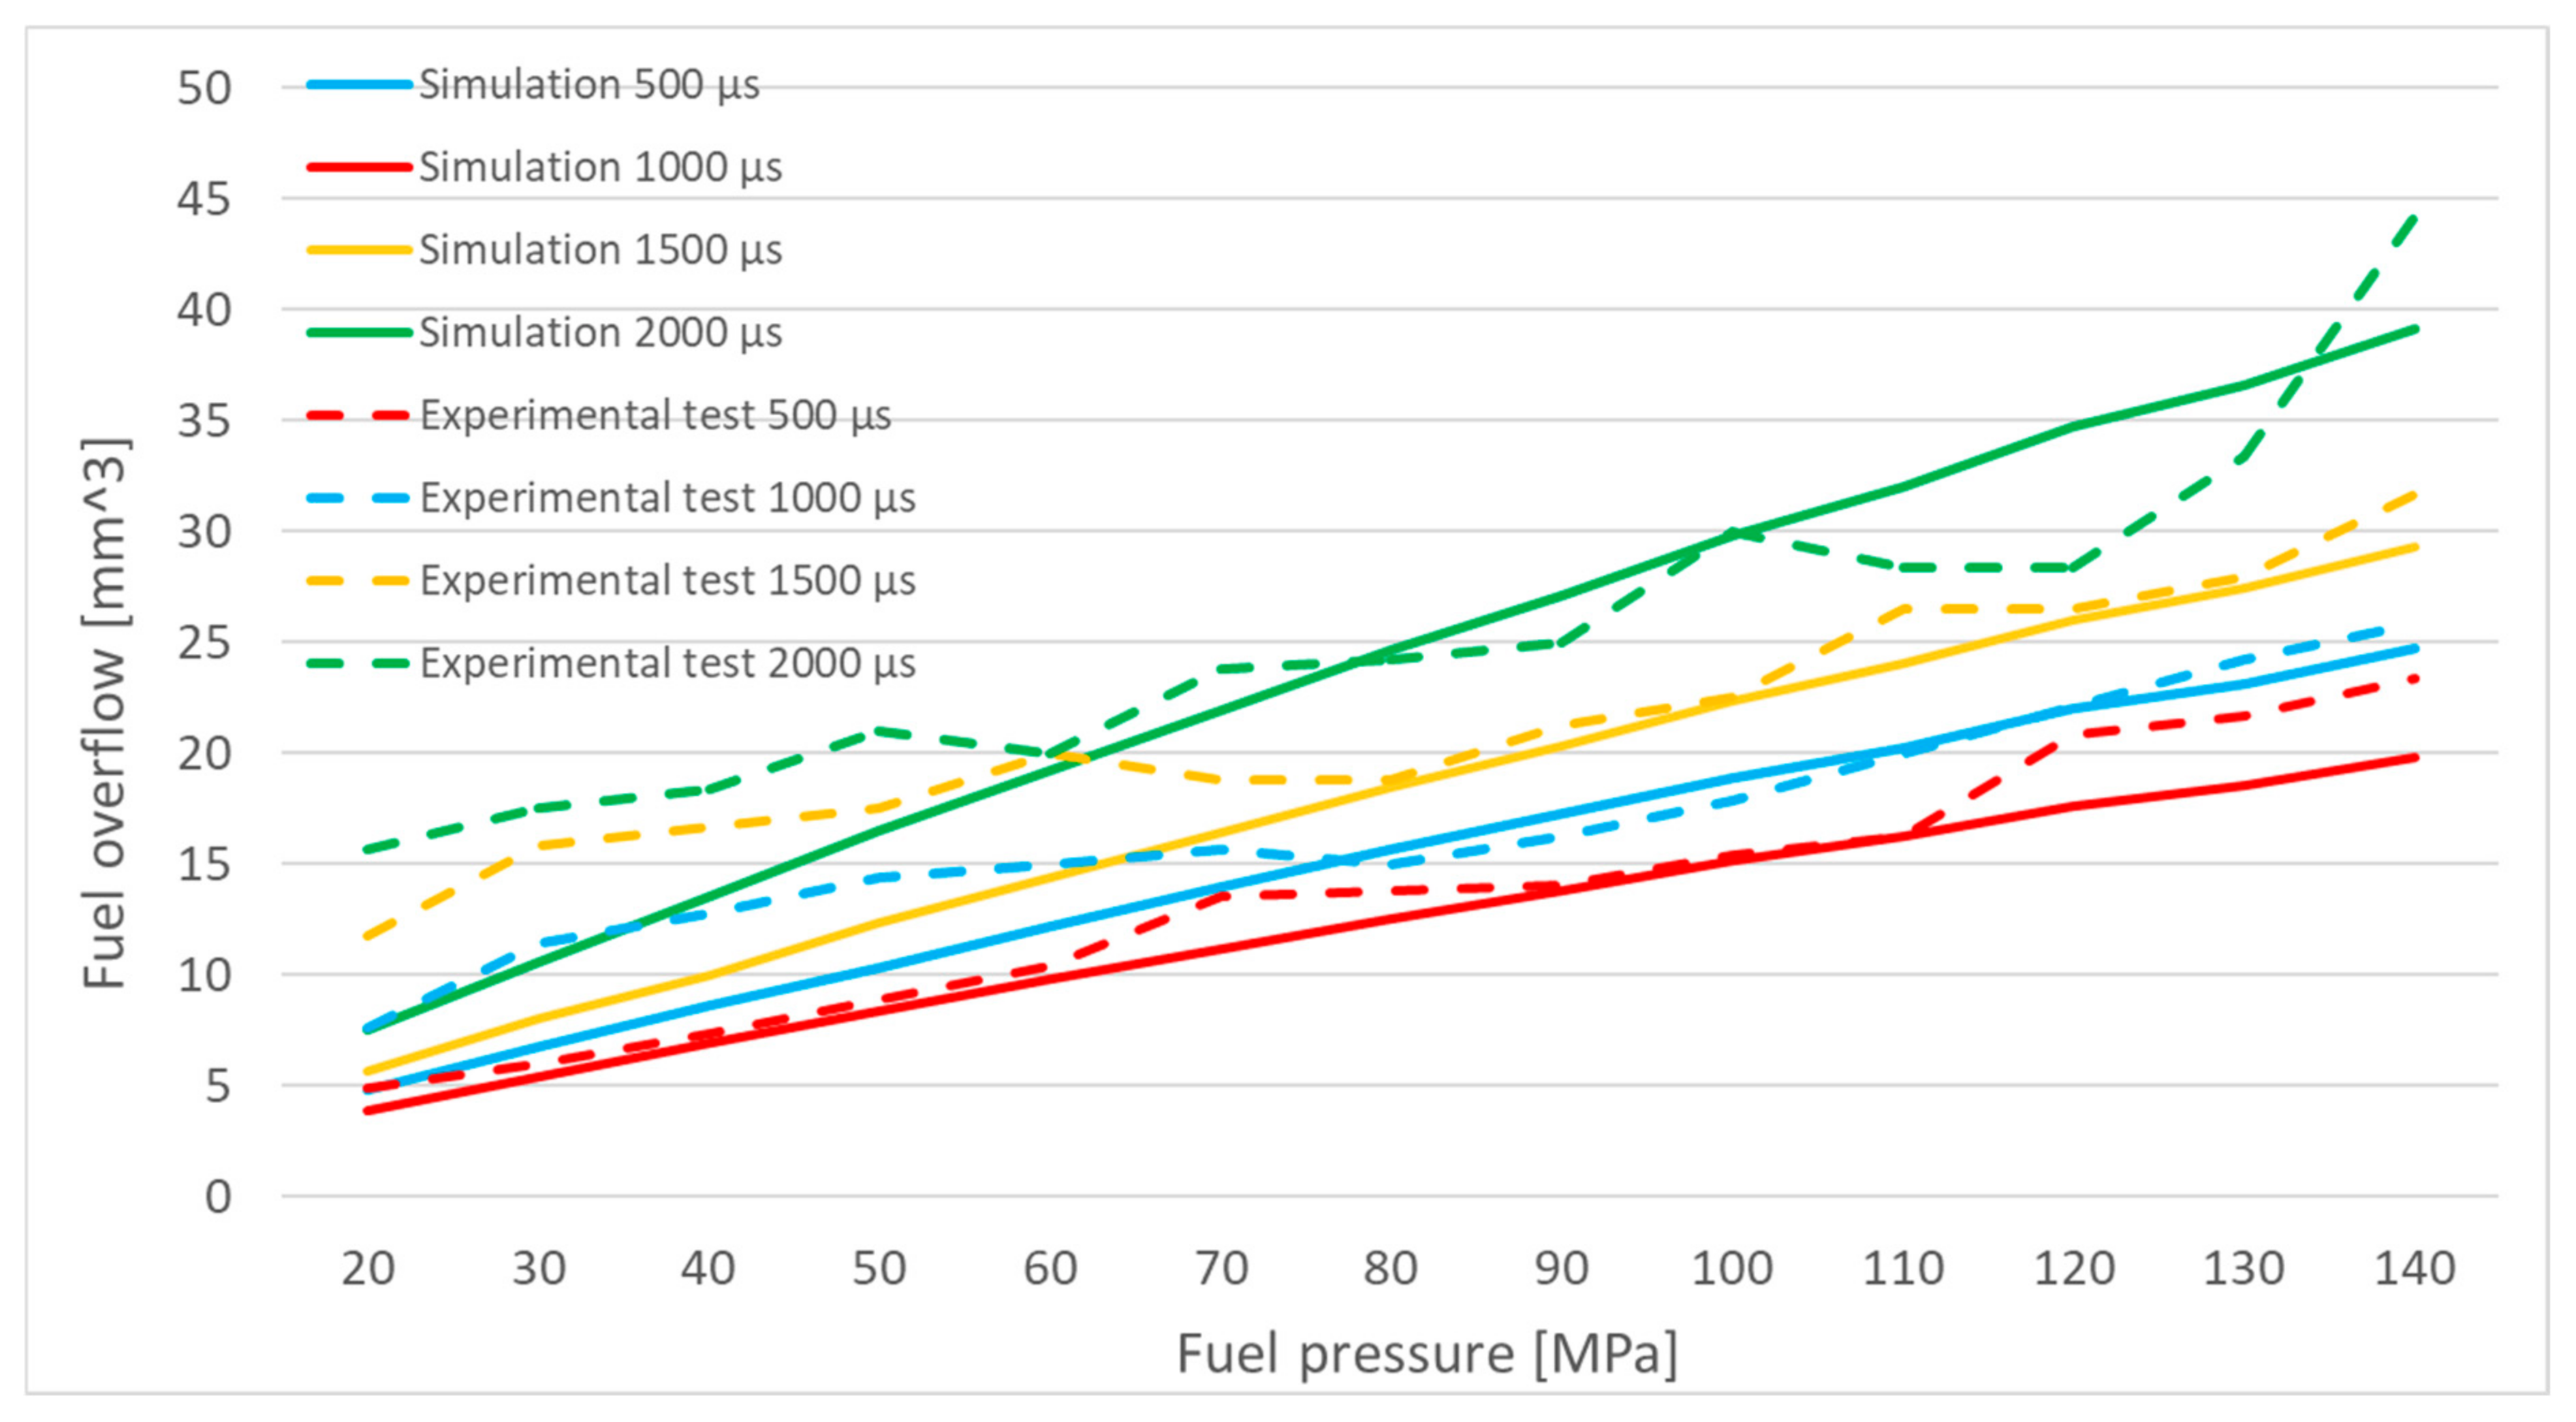
Figure 12 presents the results obtained from the injector simulation model. These results were compared with the averaged results obtained from tests conducted on four injectors. The experimental results were averaged prior to comparison to enhance reliability by considering a larger sample size. In the case of real injectors, manufacturing tolerances are not significant, as the results were averaged from the operation of four injectors on the test bench. According to the authors, manufacturing tolerances do not affect the model, since one of the tested injectors was fully disassembled, and its components were precisely measured with the accuracy specified in the article. The measured data, with a defined level of precision, were then introduced into the simulation model. Therefore, corrective factors were intentionally not included, as the objective was to assess the discrepancies between the real injector and its simulation model.
Figure 12 compares the results of simulation and experimental tests. The highest correlation between the simulation and experimental injection characteristics is observed for an injector opening time of 500 µs. As the injector opening time increases, the correlation decreases. This could be attributed to potential inaccuracies in the simulation model, which does not account for thermal effects influencing the results or wave phenomena occurring in fuel lines, as might have been present during laboratory tests.
The increasing discrepancies between the injection characteristics as the injector opening time lengthens may also be due to the impact of fuel temperature, which could have risen during the experimental tests. Longer injector opening times result in fuel flowing through the injector’s channels for an extended period. The friction between the flowing fuel under high pressure and the injector components could contribute to a temperature rise. Furthermore, there is also internal friction of the flowing fluid, which also leads to an increase in temperature. Consequently, the effect of friction on fuel temperature may be greater for longer injector opening times.
A difference in fuel temperature between tests conducted at different injector opening times could have been sufficient to affect the fuel’s viscosity and density. Any change in these parameters, especially in a precise device like an injector, could have noticeably influenced the injection characteristics. This may explain the reduced correlation between the simulation and experimental results for longer injector opening times.
The most significant differences in single injection volumes can be observed within the range of low injection pressures. This discrepancy may result from simplifying assumptions used in the simulation model, such as assuming a constant needle velocity or an ideal and instantaneous injector closing process. Under real operating conditions, at low fuel pressure, the hydraulic force responsible for closing the injector needle is relatively small, leading to a considerably slower descent of the injector needle. This prolonged needle closure results in an extended fuel outflow duration through the nozzle orifices, thus increasing the actual injected fuel volume.
Moreover, another reason for discrepancies in the injected fuel volume at low injection pressures may be related to the simulation software omitting the “residual” fuel flow phenomenon. This phenomenon refers to fuel that continues to be injected even after the coil of the electromagnetic valve is de-energized. This continued injection is caused by a delay in closing the nozzle, stemming from fuel refilling the control chamber and inertial forces acting upon the injector’s moving components. Such delayed injector closure directly contributes to an increased volume of injected fuel.
During injector operation at high fuel pressures, hydrodynamic effects become dominant. Under these conditions, high fuel pressure primarily determines the single injection volume. Mechanical factors, such as friction, viscosity, and inertial forces—complex to accurately replicate—have relatively minor significance compared to injector operation at low pressure.
There are noticeable differences in the shape of the curves themselves, as the simulation-based injection characteristics resemble a linear function, while the real-world injection characteristics are closer in shape to a logarithmic function. This means that in the experimental results, there are larger changes in single injection volume in the initial part of the graph, whereas for each subsequent value of the function’s argument (in this case, pressure), the increments in single injection volume become progressively smaller. This shape can be attributed to increased flow resistance, as higher injection pressures lead to a greater pressure difference between the nozzle channels and the combustion chamber. This pressure difference results in increased flow velocity, which generates higher hydrodynamic resistance within the injector’s channels, thereby limiting the flow rate. Additionally, high-pressure, high-velocity liquid flows can lead to cavitation. Cavitation may reduce the effective flow area of the injector nozzle orifices, which in turn restricts the flow rate.
Figure 13 presents a graphical comparison of the mean overflow volume as a function of injection pressure. A higher correlation between simulation and experimental results is noticeable here. While the correlation coefficient for an injector opening time of 500 µs is comparable for single injection volume and overflow volume, for injector opening times of 1000 µs and 1500 µs, the correlation coefficient for overflow volume is higher. Specifically, the coefficient is 0.96 for overflow volume, compared to 0.93 and 0.95 for single injection volume, respectively. This increased correlation for overflow volume may result from fewer influencing factors. Overflow volume is largely determined by the fit between interacting components and the wear of tribological interfaces, which are less variable compared to the more complex dynamics affecting single injection volume.
Comparative Analysis of Overflow Volume Characteristics Based on Simulation and Experimental Studies
For the experimental tests, the curve corresponding to an injector opening time of 500 µs is the closest to the trend predicted by the simulation. This applies to both the single injection volume graphs and the overflow volume graphs.
For the remaining curves, differences in the shapes of the characteristics resulting from simulations and experimental tests are noticeable.
Table 3 presents the correlation coefficients for the various measurement series, highlighting the degree of similarity between the results of the simulations and experimental tests.
7. Discussion
In this study, a simulation model of a real injector was created. Prior to this, the injector underwent laboratory tests to develop its injection characteristics. It was then disassembled to perform precise measurements of the physical parameters of the injector components that have the greatest impact on fuel metering. After analyzing the results of both bench and laboratory tests, the consistency of the phenomena occurring during injection was evaluated. The Pearson correlation coefficient was used for this purpose. The comparison of test results was made possible by validating the developed model.
The Pearson correlation coefficient was used to assess the conformity of the characteristic curves. This coefficient indicates the level of dependency between variables, allowing the evaluation of the nature of the phenomenon. It enables a straightforward and concise assessment of the convergence of characteristics. The authors are aware of the imperfections in the developed model. However, with a substantial number of simulation and experimental results, a model correction coefficient can be developed. Correcting the mathematical model is the first step when results deviate from actual observations or experiments; it serves as a tool to verify whether the model accurately reflects reality. Before applying model correction, predictions from the model must be carefully compared with actual data; for this purpose, the correlation coefficient was used, yielding values exceeding 0.90 for practically all observations/tests. The process of model calibration will be detailed in a subsequent publication.
Some researchers, during their simulation studies, omitted the model validation stage, making it difficult to verify the accuracy of the obtained results, even though the simulation outcomes appeared satisfactory. Other researchers, when creating simulation models, conducted validation only to a limited extent, which restricted the potential application of the developed model. Some focused on various aspects of injector operation, such as the functioning of the injector’s electromagnetic valve. Others, on the other hand, focused their studies on designing a controller for operating a simulation model of a CR fuel supply system, which could be implemented in a real system. In most studies, researchers were able to achieve a satisfactory quality of the obtained simulation results.
The difference between the simulation and bench test results may be due, among other factors, to the potential omission of the dynamic nature of the injector’s opening and closing. In practice, the injector needle or control piston does not reach full opening or closing instantaneously. The speed of the nozzle’s opening and closing depends on various parameters, such as fuel pressure, spring force, electromagnet characteristics, and fuel flow conditions. Additionally, the software may have simplified the internal pressure profile of the injector during the rise and fall of the control pulse.
The program may have also assumed a single, average needle lift speed for all injector operating conditions, whereas this parameter may influence the simulated injected fuel volume to a greater or lesser extent. Furthermore, the simulation software may not have accounted for certain phenomena occurring during injector operation, such as needle vibrations and pressure pulsations within the injector. Failure to consider these effects may lead to an underestimation of the single injection volume in the simulation.
During the simulation, inaccuracies in calculating the injected fuel volume could also have resulted from the software assuming a constant fuel density and viscosity, which, in reality, depend on factors such as fuel temperature.

