Article

Thermal Management in 500 kV Oil-Immersed Converter Transformers: Synergistic Investigation of Critical Parameters Through Simulation and Experiment

1
Wuhan NARI Limited Liability Company of State Grid Electric Power Research Institute, Wuhan 430074, China
2
NARI Group Corporation State Grid Electric Power Research Institute, Nanjing 211000, China
3
State Grid Shandong Electric Power Research Institute, Jinan 250002, China
4
School of Electrical Engineering, Dalian University of Technology, Dalian 116024, China
*
Author to whom correspondence should be addressed.
Energies 2025, 18(9), 2270; https://doi.org/10.3390/en18092270
Submission received: 14 March 2025 / Revised: 31 March 2025 / Accepted: 11 April 2025 / Published: 29 April 2025
(This article belongs to the Section F: Electrical Engineering)

Abstract

:
Aimed at solving the problem of insulation failure caused by the local overheating of the oil-immersed converter transformer, this paper investigates the heat transfer characteristics of the 500 kV converter transformer based on the electromagnetic-flow-heat coupling model. Firstly, this paper used the finite element method to calculate the core and winding loss. Then, a two-dimensional fluid-heat coupling model was used to investigate the effects of the inlet flow rate and the radius of the oil pipe on the heat transfer characteristics. The results show that the larger the inlet flow rate, the smaller the specific gravity of high-temperature transformer oil at the upper end of the tank. Increasing the pipe radius can reduce the temperature of the heat dissipation of the transformer in relative equilibrium. Still, the pipe radius is too large to lead to the reflux of the transformer oil in the oil outlet. Increasing the central and sub-winding turn distance, the oil flow diffusion area and flow velocity increase. Thus, the temperature near the winding is reduced by about 9%, and the upper and lower wall temperature is also reduced by about 4%. Based on the analysis of the sensitivity weight indicators of the above indicators, it is found that the oil flow rate has the largest share of influence on the hot spot temperature of the transformer. Finally, the surface temperature of the oil tank when the converter transformer is at full load is measured. In the paper, the heat transfer characteristics of the converter transformer are investigated through simulation and measurement, which can provide a certain reference value for the study of the insulation performance of the converter transformer.

1. Introduction

In the context of global decarbonization imperatives, China’s aggressive deployment of ultra-high-voltage direct current (UHVDC) transmission networks presents critical challenges in power equipment reliability. With the continuous promotion of China’s energy low-carbon transformation, UHV DC transmission technology has been developing at a high speed by virtue of the advantages of long-distance transmission of renewable energy [1,2,3]. The oil-immersed converter transformer, as the core equipment of the UHV DC transmission system, assumes the key role of AC and DC power conversion [4,5]. However, due to the increasing voltage level of the system, the problem of loss and temperature rise in oil-immersed transformers has become more and more serious [6,7]. This creates a self-reinforcing deterioration cycle. The high local temperature of oil-immersed transformers will accelerate the aging of insulation materials and even cause insulation breakdown, which seriously threatens the safe and stable operation of the system [8]. Consequently, resolving the epistemic gap in thermal-flow coupling mechanisms becomes paramount for the study of the heat transfer characteristics between the internal structure of oil-immersed transformers and transformer oil has strategic importance for the insulation design of transformers.
Current research paradigms exhibit some critical limitations. At present, domestic and foreign researchers and scholars for the oil-immersed transformer temperature characteristics of the study mainly use the numerical calculation method of multi-physics coupling [9,10,11]. S. Taheri et al. in the finite element method to calculate the internal electromagnetic field distribution of the converter transformer, combined with the dynamic thermal model of the converter transformer hot spot and the top oil temperature calculation, but can not calculate the hot spot location and the temperature field distribution law [12]. The literature [13] established a three-dimensional electromagnetic-fluid-temperature field coupling model of the oil-immersed transformer by using the finite element method and finite volume method, and calculated the temperature and oil flow distribution of the transformer through several iterations. Feng X et al. of Beijing Jiaotong University analyzed the core and winding losses of the pie-shaped structure through the magnetic-thermal-fluid coupling simulation of an oil-immersed transformer [14]. Zhang, X. et al. conducted a study on high-temperature insulation aging of transformers and verified the role of FR3-T910 in safeguarding the overload performance of transformers [15]. The literature [16] obtained the optimization scheme of 400 kV RIP casing by the three-dimensional electromagnetic fluid thermal simulation method for the heat generation problem of transformer resin insulating paper. Abdali, A. studied the hot spot temperature of the distribution transformer and extracted and predicted the hot spot problem at the top layer and bottom layer locations through the data collected by the fiber optic sensors. This side-by-side comparison reflects the importance of the temperature rise at that location for the study of heat generation in transformers [17]. There is also research on transformer oil chromatography and diagnostic methods through artificial intelligence and big data algorithms remain constrained by data paucity in UHVDC applications [18,19,20]. Siddharthan et al. demonstrate that carbon quantum dots-functionalized silica nanofluids in FR3 biodegradable oil enhance insulation performance with 30% higher partial discharge inception voltage and eightfold lower discharge magnitude compared to conventional oil [21]. Despite these advancements, existing studies often overlook the intricate relationship between oil flow characteristics and temperature distribution, particularly in high-voltage oil-immersed transformers. This study highlights the need for a more detailed study of the internal heat and flow dynamics of these transformers, which is the main focus of this study.
These accumulated limitations reveal a fundamental knowledge gap [22]. Although the multi-physical field numerical calculation method can accurately calculate the temperature characteristics of the internal structure of the converter transformer and the transformer oil, due to the complexity of the internal structure of the oil-immersed transformer, there are fewer domestic and international research on the transformer temperature field and flow field characteristics under the consideration of the oil flow characteristics. Aiming at the above problems, the paper carries out simulations and field experiments on the heat transfer characteristics of a 500 kV oil-immersed converter transformer. Firstly, the core and winding losses of the converter transformer under the rated operating condition are calculated by the finite element method, and the loss calculation results are used as the heat source inputs of the converter transformer flow-heat coupling model; then, the temperature distribution of the converter transformer and the flow characteristics of the transformer oil are investigated for different oil inlet flow rates, different oil pipe radii, and different distances between the miscellaneous parts of the main and secondary windings. Finally, the temperatures of key internal parts of the transformer were obtained through on-site measurements.

2. Theoretical Analysis of Oil-Immersed Transformer Loss and Heat Transfer Process

2.1. Loss Analysis

During the normal operation of oil-immersed transformers, core and winding losses are the main factors that cause the temperature of internal structural components and transformer oil to increase [23,24,25]. To study the heat transfer characteristics of oil-immersed transformers, their losses should be analyzed first. The nomenclature and abbreviation used in the simulation are shown in Table 1, and the oil-immersed transformer losses are analyzed, as shown in Table 2.
Losses include core losses, which are generated by hysteresis and eddy currents in the core; winding losses, which are generated when current passes through the windings; and magnetic losses, where the magnetic field generates an additional electromotive force in the windings and core, which is converted to heat. A power analysis of this process’s yields can be obtained:
P L o s s = P F + P R + P x
In the formula, PLoss is the internal loss; PF is the core loss; PR is the winding loss; Px is the leakage loss, but the winding current flux is not entirely through the core; the leakage stray loss under load operation is slight and can be ignored. Then, Equation (1) can be reduced to the following:
P L o s s = 3 I 1 N 2 r 75 ° C + 3 I 2 N 2 r 75 ° C + K 0 G F e p A F / 50 β B m 2
where I1N and I2N are primary and secondary currents, r75°C is the primary and secondary resistance at 75 °C. K0 is the iron loss process coefficient, GFe is the core weight, pa is the iron loss coefficient, β is the frequency coefficient, and Bm is the maximum magnetic flux density. In our study, we focus on convection as the main mechanism due to its key role in heat dissipation.

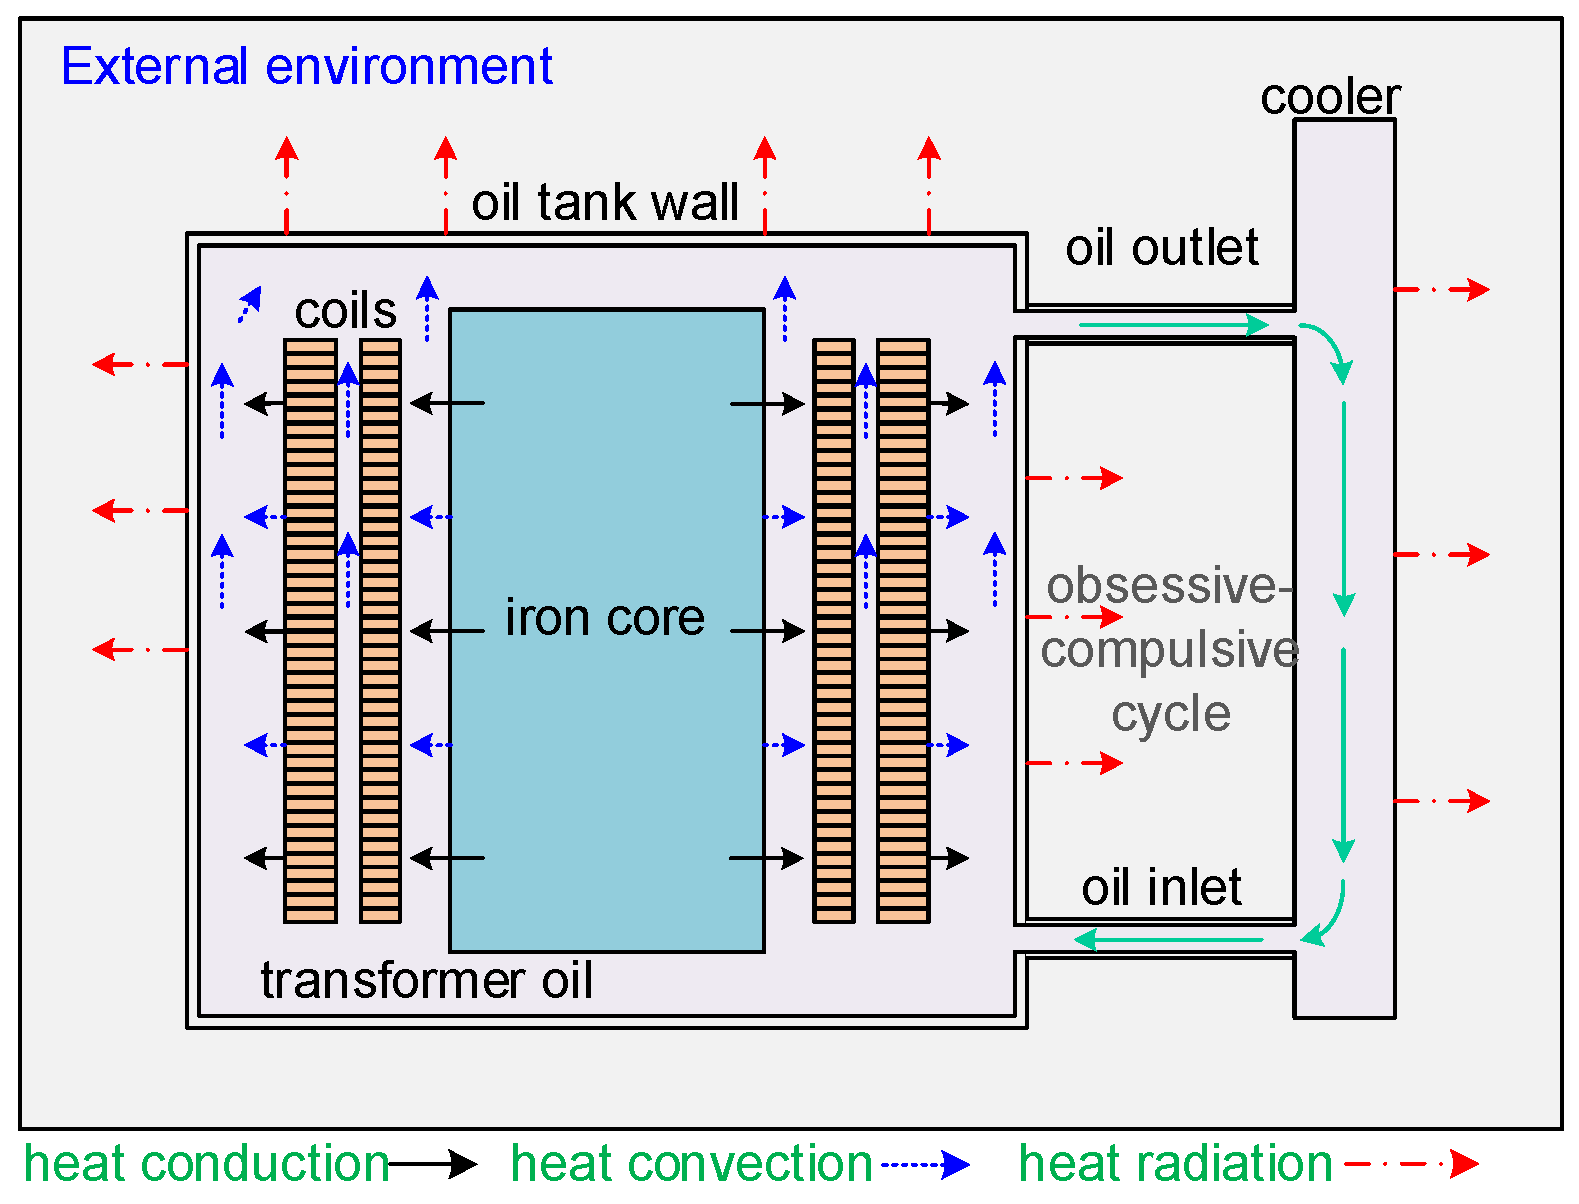
2.2. Heat Transfer Process Analysis

Losses in the core, windings, and other structures of oil-immersed transformers are manifested as heat transfer between the internal components of the transformer and between the transformer and the external environment [26]. Transformer oil assumes the critical role of heat dissipation in the heat transfer process and realizes the relative balance of the overall temperature of the converter transformer through heat conduction, heat convection, and heat radiation in three ways. The heat transfer process of the oil-immersed transformer is shown in Figure 1.
Heat transfer occurs with the oil wall, then there is the following:
Δ T = P R × β k S
where ΔT is the temperature difference, k is the thermal conductivity, and S is the passing area. According to the principle of radiative action, the thermal radiation process has the following:
P f = η S A R T S 4 T a 4
where η = 5.67 × 10⁻⁸ W/m2K4, S′ is the surface emissivity, AR is the radiant area, and Ts and Ta are the temperatures of the radiant surface and air.
Thermal convection (qd) is the transfer of heat between a solid wall and a fluid and can be expressed as follows:
q d = h S ( T T f )
h is the convective heat transfer coefficient, T is the solid wall temperature, and Tf is the fluid temperature. The transformer operation always follows the set of Maxwell’s Equations:
× ( μ B ) λ ω 2 A + ω σ ( σ E + J ) = 0
Building upon the A-φ formulation of Maxwell′s equations, we derive the governing electrodynamic relations considering moving media. The basic characteristic structural relationship from the electromagnetic field equations can be transformed into the following:
× v ( × A ) + σ A t + σ v + × H = J + σ v × × A
where B is the magnetic induction; H is the magnetic field strength; D is the flux density; E is the electric field strength; A is the magnetic vector potential vector; μ0, μr are the vacuum permeability number, relative permeability; ε0, εr are the vacuum permittivity, relative permittivity; ω is the angular frequency of the current; J is the current density; v is the speed of the charged particles in the magnetic field; and σ is the electrical conductivity.
Under electromagnetic fields, transformer oil may undergo cracking and other undesirable phenomena. The oil medium properties and changes described mainly follow the three major conservation laws in computational fluid dynamics, i.e., conservation of mass, energy, and momentum.
The assumptions of the equation are as follows:
  • Quasi-static electromagnetic field: Displacement currents neglected (∂D/∂t ≈ 0);
  • Incompressible flow: Density variations governed by Boussinesq approximation;
  • Isotropic materials: Uniform thermal/electrical properties in all directions;
  • Local thermal equilibrium: No temperature lag between solid and fluid phases.
ρ t + ( ρ v ) = 0 ( ρ e ) t + ( ρ e v ) = ( k T ) p v + Φ ( ρ v ) t + ( ρ v × v ) = p + τ + ρ g
where ρ is the fluid density, v is the fluid velocity, n is the unit normal vector, Sa and V are the unit area and volume, respectively. δQ and δW are the amount of work performed by the microelement and the amount of heat transferred, respectively, e is the amount of heat contained in the unit volume, and ΣF is the combined force applied to the microelement.
From the above analysis, it can be concluded that the transformer oil will move under the electromagnetic field, and the internal heat source will work. The above multi-physical field control equation is the finite element simulation physical field set used in selecting the theoretical basis. The following will be around this oil flow dynamic change process for multi-physical field coupling simulation.

3. Modeling and Analysis of Oil-Immersed Transformer Flow-Heat Coupling

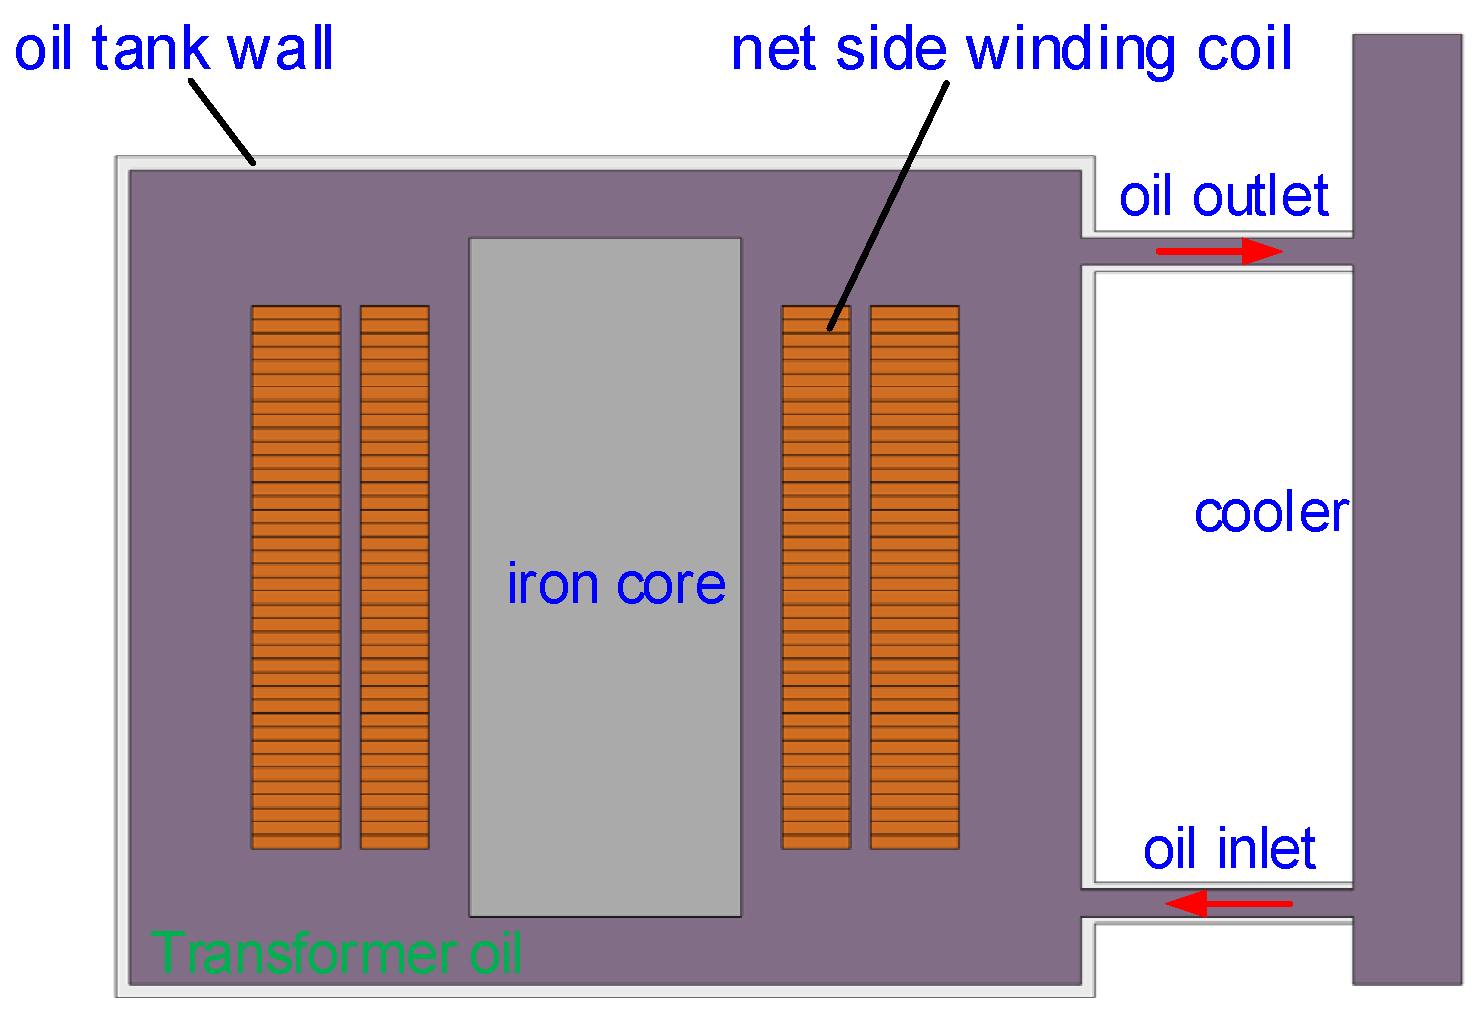
3.1. Simulation Modeling and Initial Condition Setting

The two-dimensional flow field-temperature field simulation model of the 500 kV oil-immersed transformer built in the article is shown in Figure 2. To speed up the simulation solution and reduce the difficulty of the solution, the transformer model is simplified. The radius of the transformer oil inlet and outlet is 100 mm, and the flow rate of transformer oil at the inlet of the oil pump is set to 0.2 m/s. The heat transfer interface is set up with the core, the net-side winding, and the valve-side winding as the heat source, respectively, and the heat source data are input. Among them, the core material is silicon steel sheet, the net side winding and valve side winding materials are copper, and the tank wall material selection of non-magnetic stainless steel. The material properties are shown in Table 3.
Basic Assumptions of the Simulation:
(a)
The ambient temperature of the oil tank is maintained constant at 25 °C.
(b)
The surfaces are assumed to be smooth, with friction between the transformer oil and solid surfaces neglected. Thermal resistance at the contact interfaces is also ignored.
(c)
The heat load from losses is uniformly distributed near the windings.
Meanwhile, based on the simplified model, heat sinks are set up at the tank wall and above the mesh-side windings to characterize the temperature change at the top of the converter transformer.
Boundary conditions of the fluid field and heat transfer field:
(a)
Inlet and Outlet Boundary Conditions: “Inlet” and “Outlet” boundary conditions are applied at the entrance and exit of the cooling fluid, respectively.
(b)
Wall Boundary Condition: The “No-Slip” boundary condition is used at the interface between the fluid and solid surfaces, indicating zero fluid velocity at the walls, which is consistent with the basic assumptions.
(c)
A “Heat Flux” boundary condition is applied on the transformer surface or windings to represent heat input or output per unit area.
(d)
The “Convective Heat Flux” boundary condition is applied at the interface between the transformer surface and the fluid, specifying the convective heat transfer coefficient and fluid temperature.
The wind speed at the topmost fence is set to 1 m/s, the flow velocity at all other boundaries is 0 m/s, and the core heat density is derived from the internal COMSOL 6.1. This study is based on and extends an existing transformer heat transfer model with a comprehensive coupled electromagnetic-flow-heat approach. This model is more focused on the simultaneous consideration of the combined effects of several parameters, such as inlet flow rate, pipe radius, and winding spacing, on the thermal performance of the transformer.

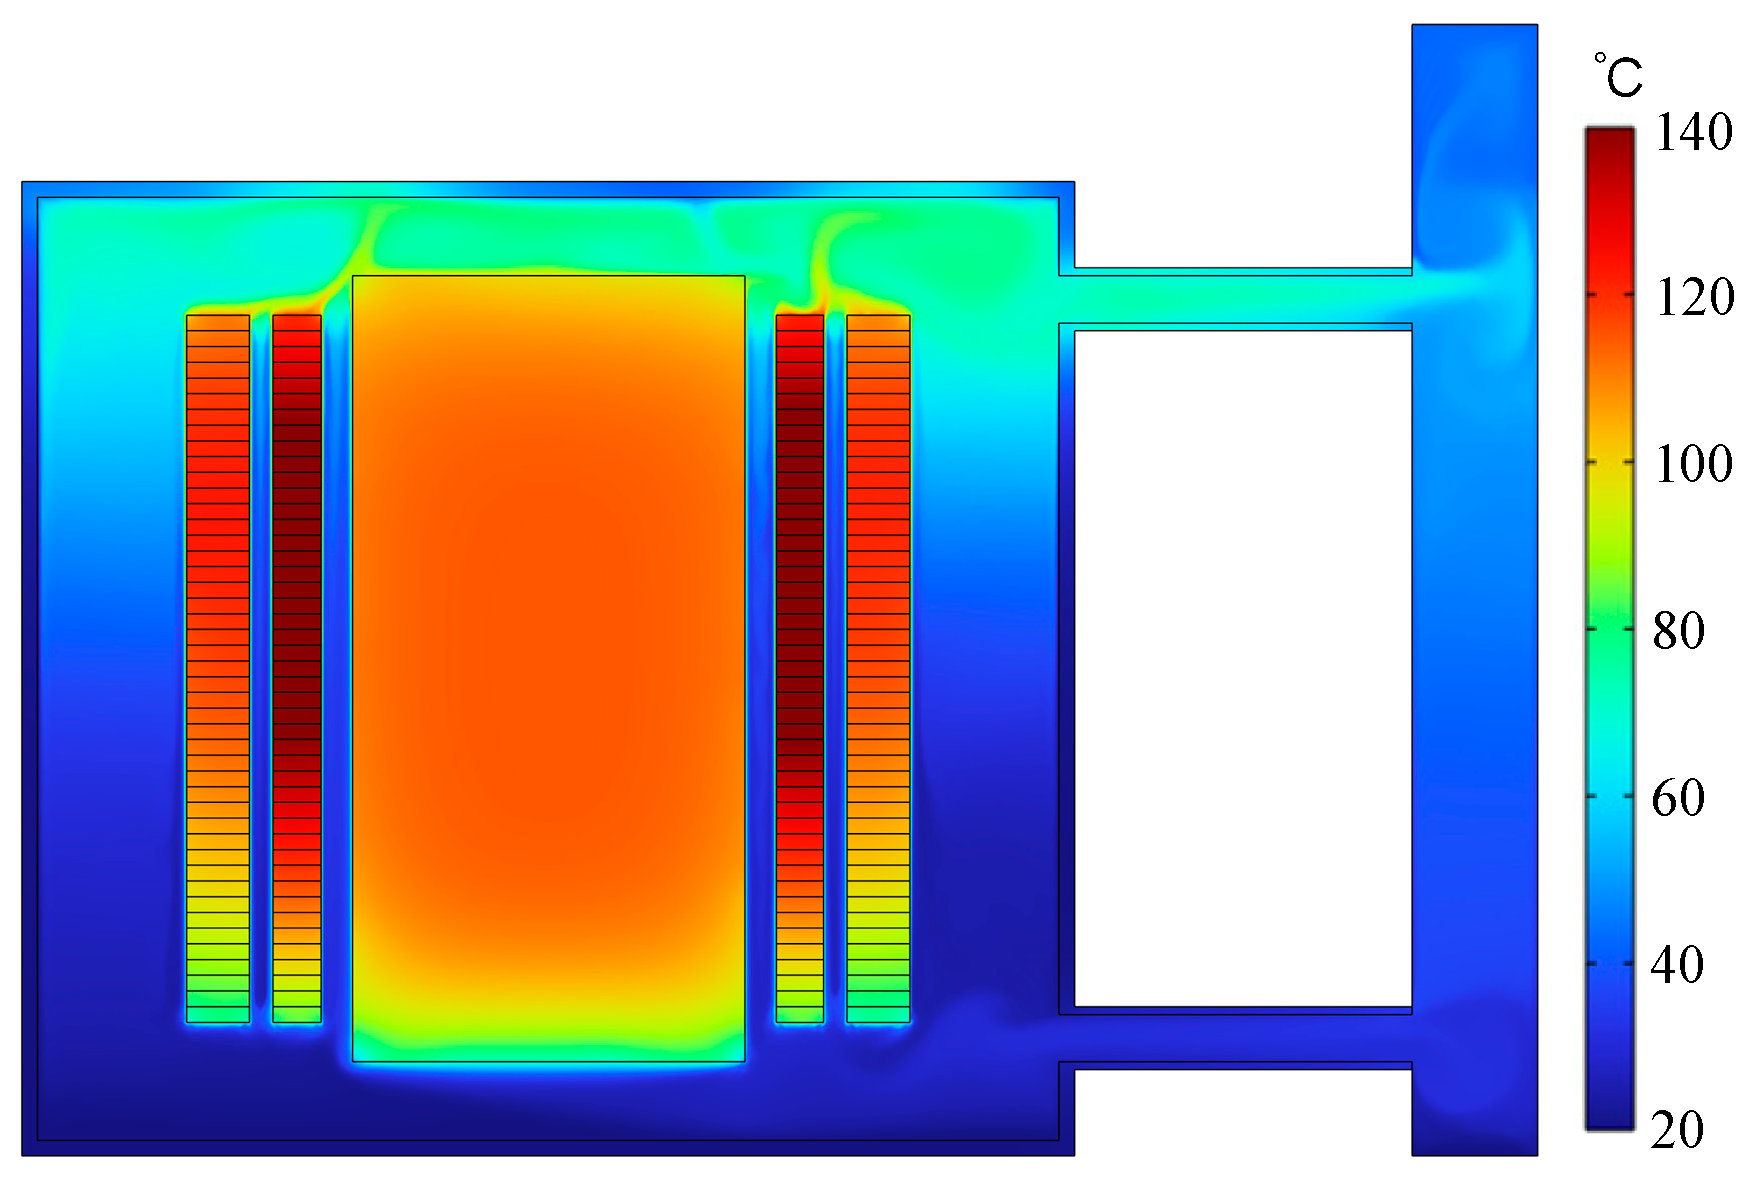
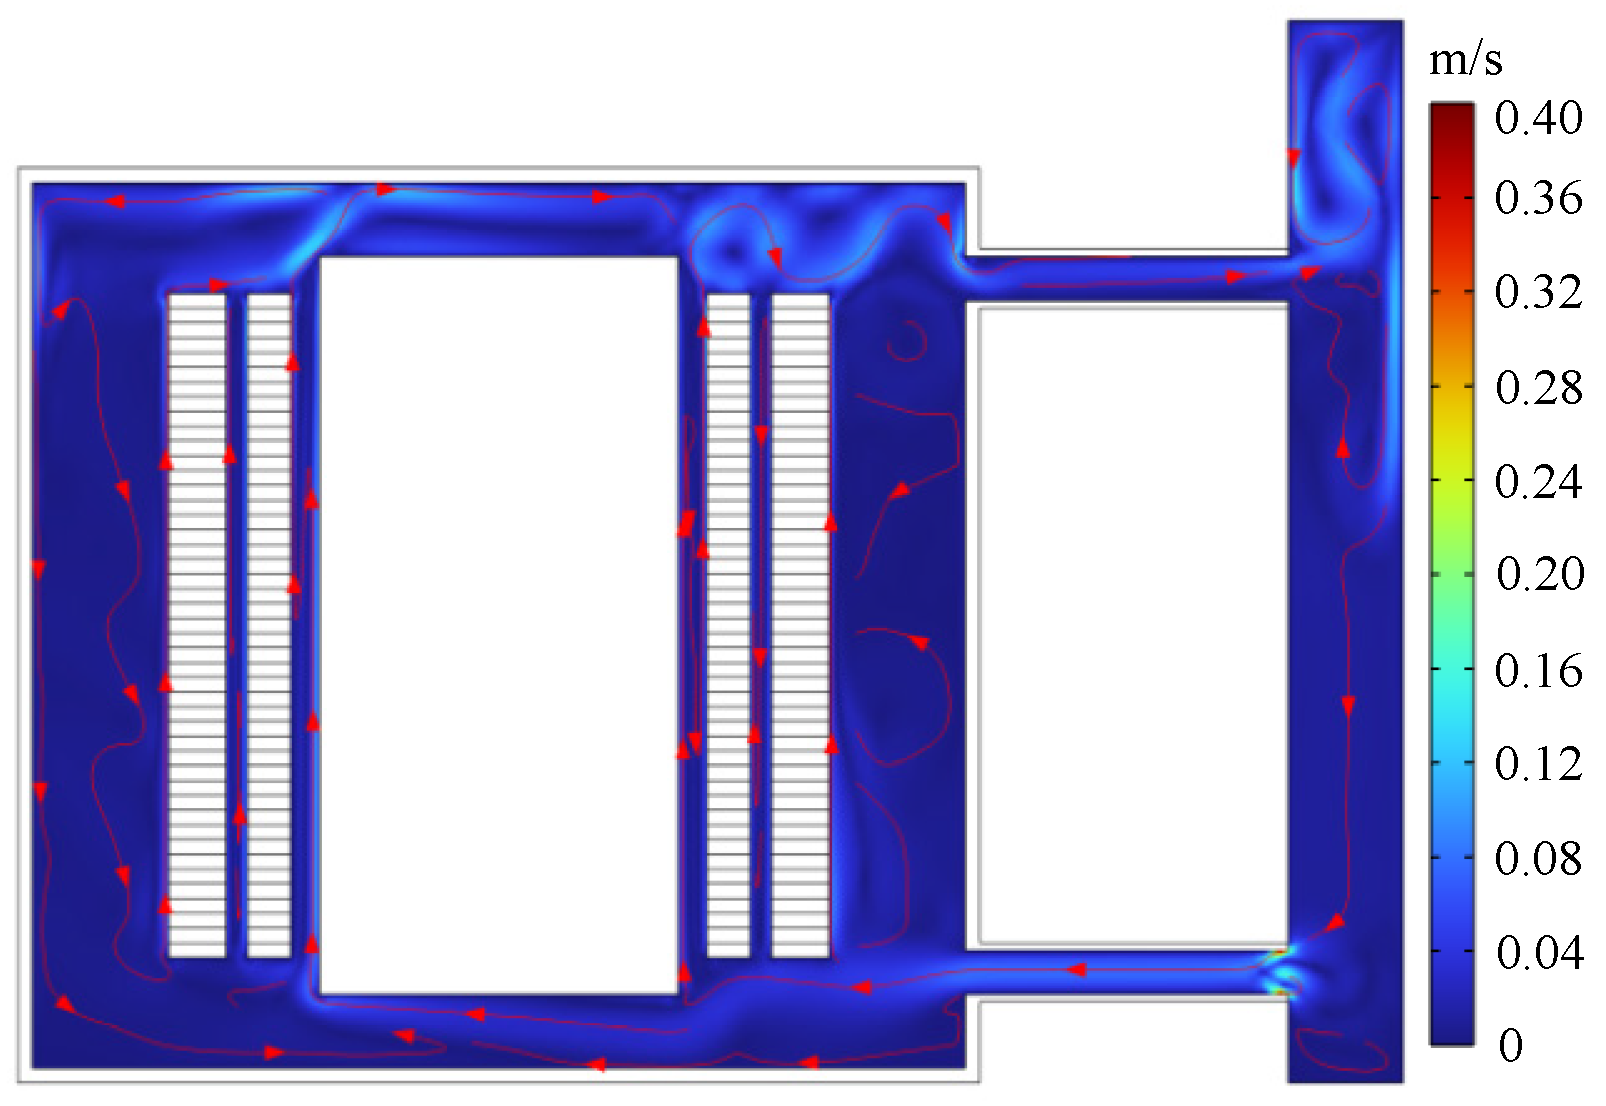
3.2. Analysis of Preliminary Simulation Results

According to the oil-immersed transformer temperature field simulation (Figure 3), the transformer oil temperature at the upper end of the tank is higher, and the closer the temperature is to the core, the higher the winding. Higher-temperature transformer oil flows into the cooler through the oil outlet under the effect of heat convection, and the lower-temperature transformer oil flows into the oil tank under the impact of the oil pump at the oil inlet to realize the circulating flow of transformer oil inside the oil tank and achieve a relatively stable temperature balance.
According to Figure 4, from the transformer oil flow direction, the transformer oil on the surface of the core and windings flows upward to the tank’s upper end and then toward the cooler.
At the same time, the lower-temperature transformer oil in the tank flows downward. From the transformer oil flow rate point of view, the top of the tank transformer oil flow rate is more oversized, the maximum flow rate occurs in the core and net side of the winding above. Higher-temperature transformer oil flows into the tank and then partly flows upward. Combined with Figure 3, the higher the temperature of the transformer oil, the larger the flow rate is, and the lower the density, the lower the temperature of the transformer oil form is, and the more apparent the thermal convection phenomenon is.

4. Analysis of the Effect of Different Parameters on the Distribution of Flow and Temperature Fields of Oil-Immersed Transformers

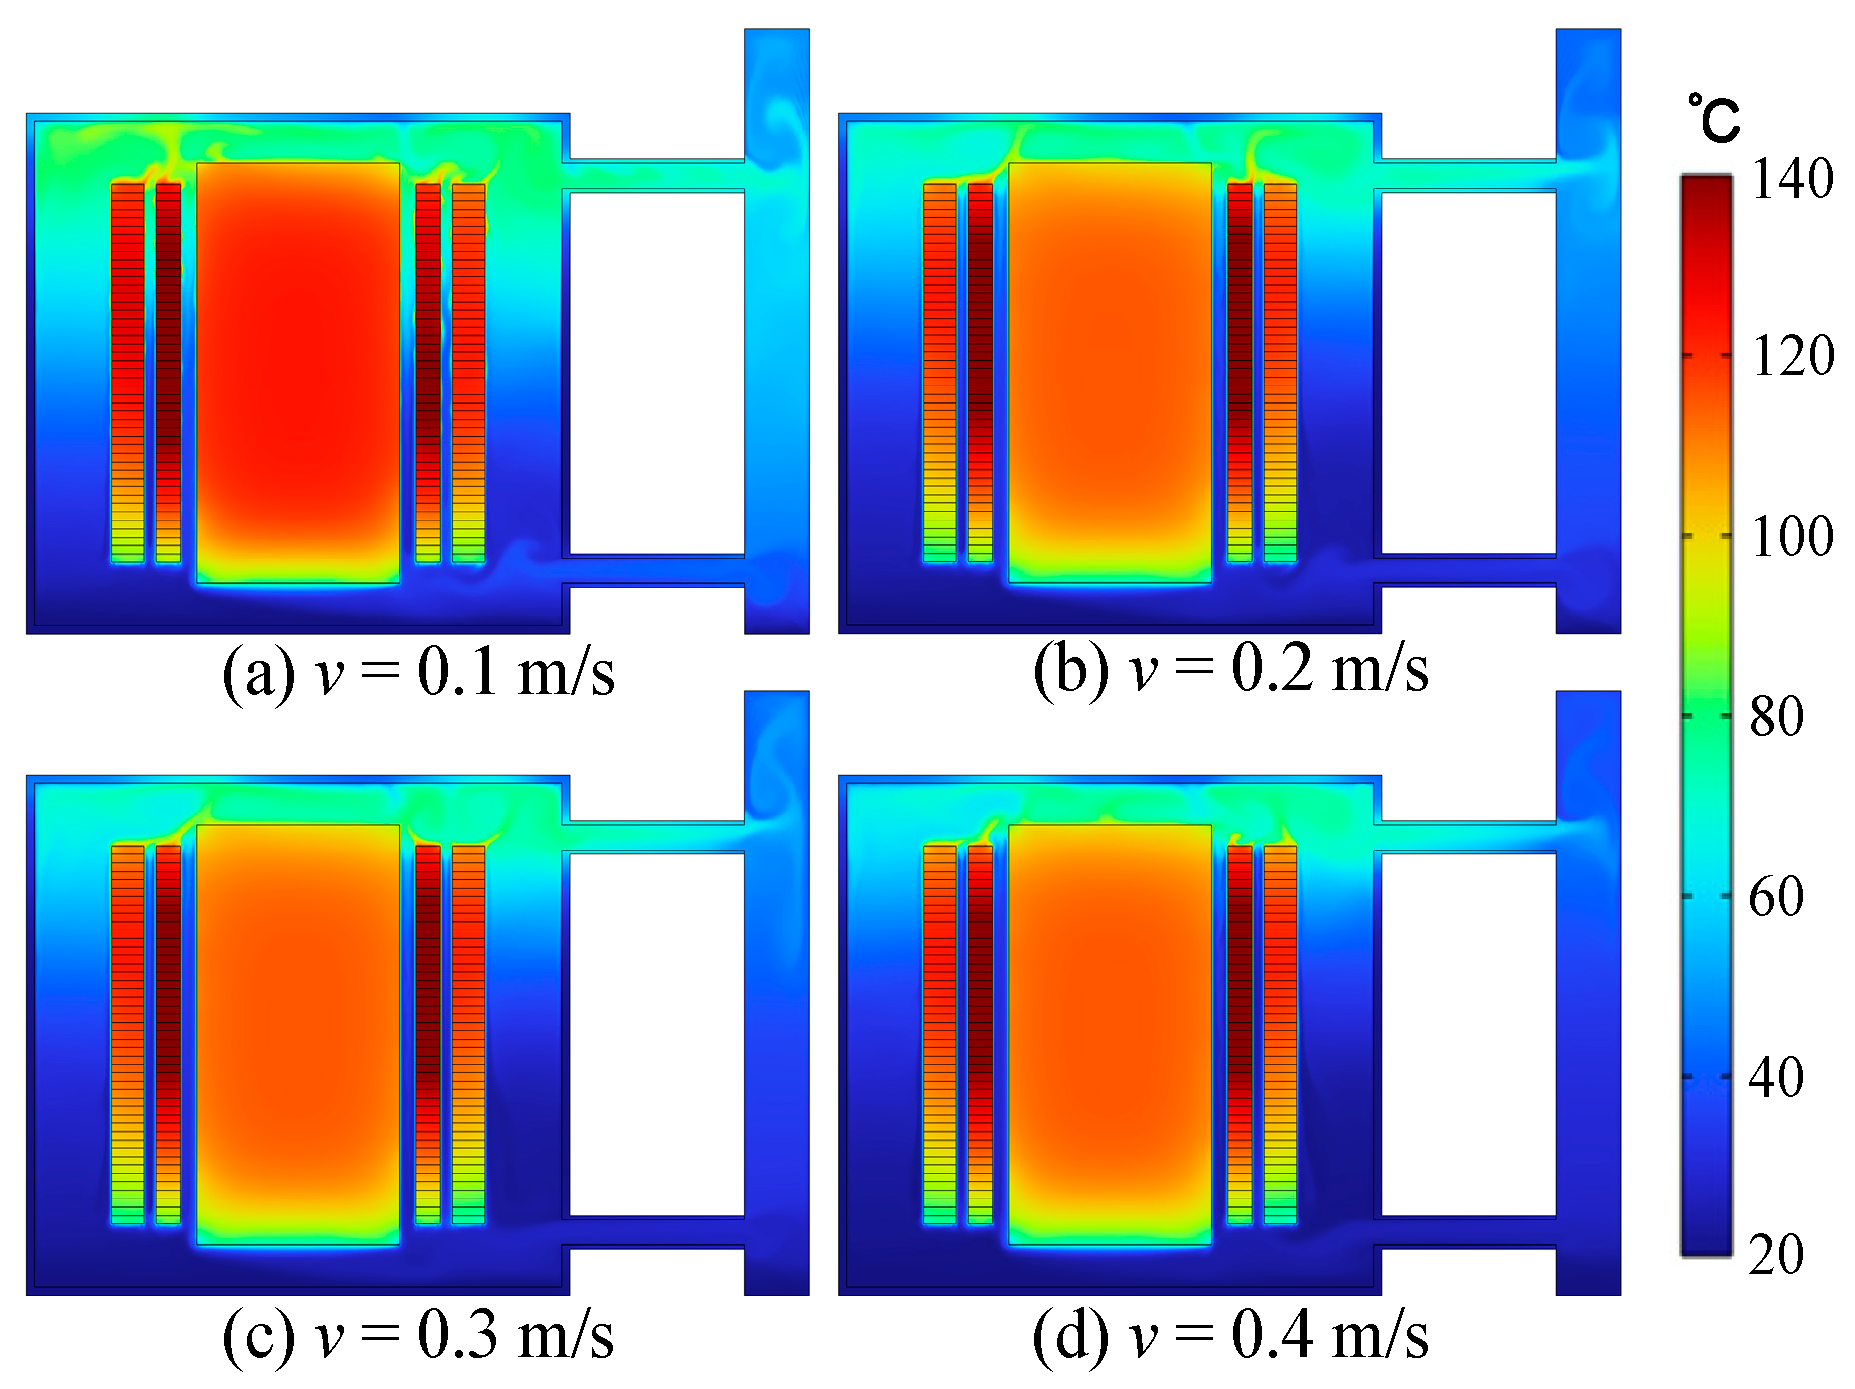
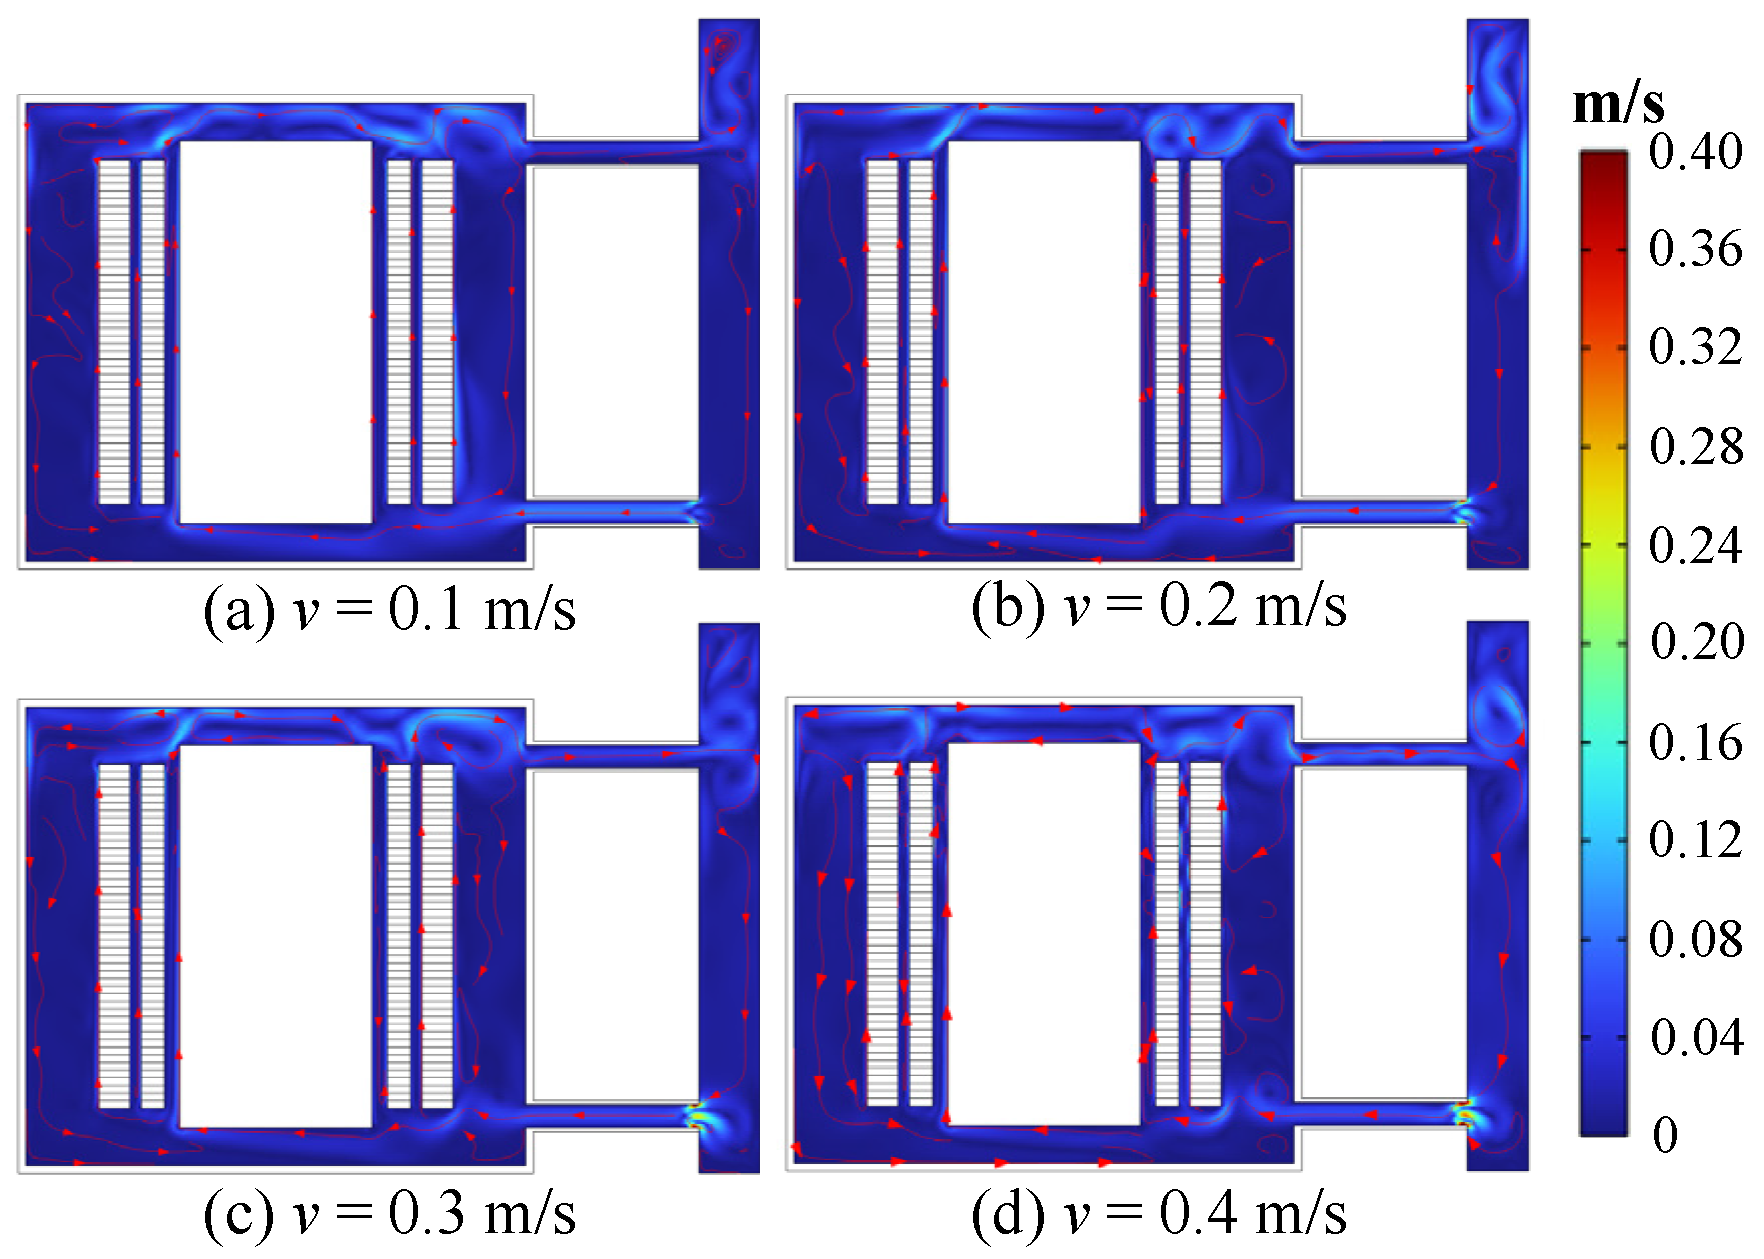
4.1. Effect of Inlet Flow Rate on Heat Transfer Characteristics

The simulation results of transformer temperature under different flow rates at the oil inlet are shown in Figure 5. When the transformer oil flow rate is 0.1 m/s, the temperature of the core and winding is the highest; when the flow rate is more significant than 0.1 m/s, the temperature of the core and winding gradually decreases, but the change is small. The temperature change in the transformer oil in the tank shows an inverse trend with the flow rate, and the larger the flow rate of transformer oil, the smaller the percentage of transformer oil with the higher temperature at the top of the tank.
At the same time, with the increase in the flow rate of the inlet, the transformer oil from the top of the tank to the outlet flow rate is also more significant; the higher temperature transformer oil is more distributed on the right side of the tank. The temperature of transformer oil in the cooler decreases with increasing flow rate. This indicates that higher flow rates enhance the overall circulation of the oil, resulting in a lower equilibrium temperature for the transformer. This improvement contributes to the thermal insulation stability of the transformer. For most converter transformers, the optimal oil flow rate ranges between 0.1 and 0.3 m/s in the cooling channels.
Figure 6 shows the transformer flow field simulation results under different flow rates at the oil inlet. It can be observed that, with the increase in the flow rate of the inlet, the convection phenomenon of the transformer oil above the tank is more prominent, showing a more “vortex” shape distribution. However, the overall flow direction of transformer oil still presents the upward flow trend of high-temperature transformer oil. The inlet flow rate is more significant, and the outlet flow rate is also larger, resulting in the more excellent transformer oil by the cooler wall obstruction being more noticeable and then appearing more “vortex” distribution.
The FEM simulations captured the formation of vortices in the flow field, which is critical for understanding the heat transfer characteristics of the transformer oil. The results indicate that higher flow rates enhance convective heat transfer, leading to more efficient cooling of the transformer. The FEM approach provided a robust framework for analyzing these complex flow patterns, which would be difficult to study using experimental methods alone.

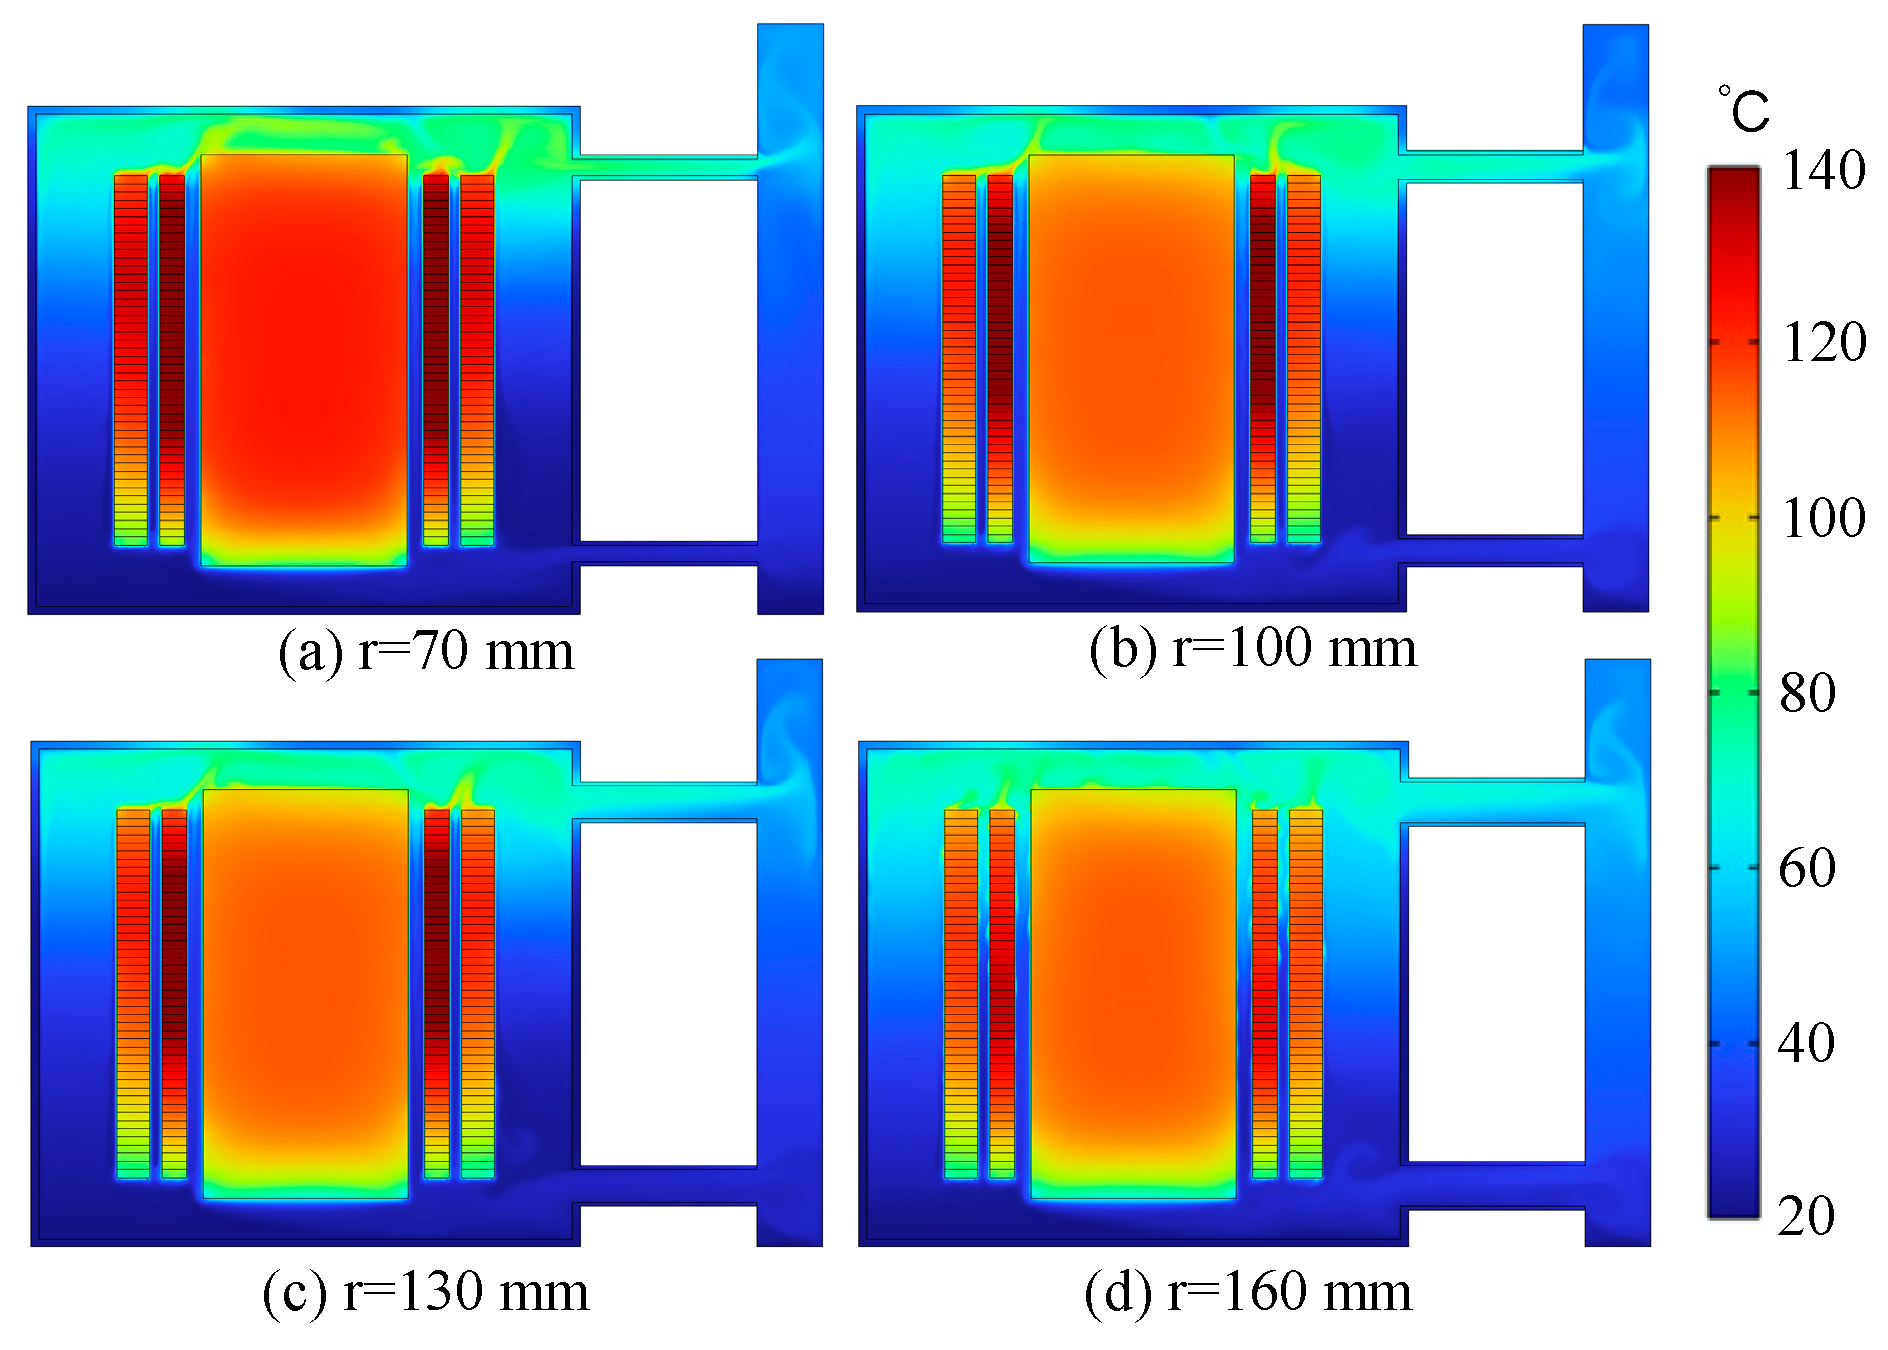
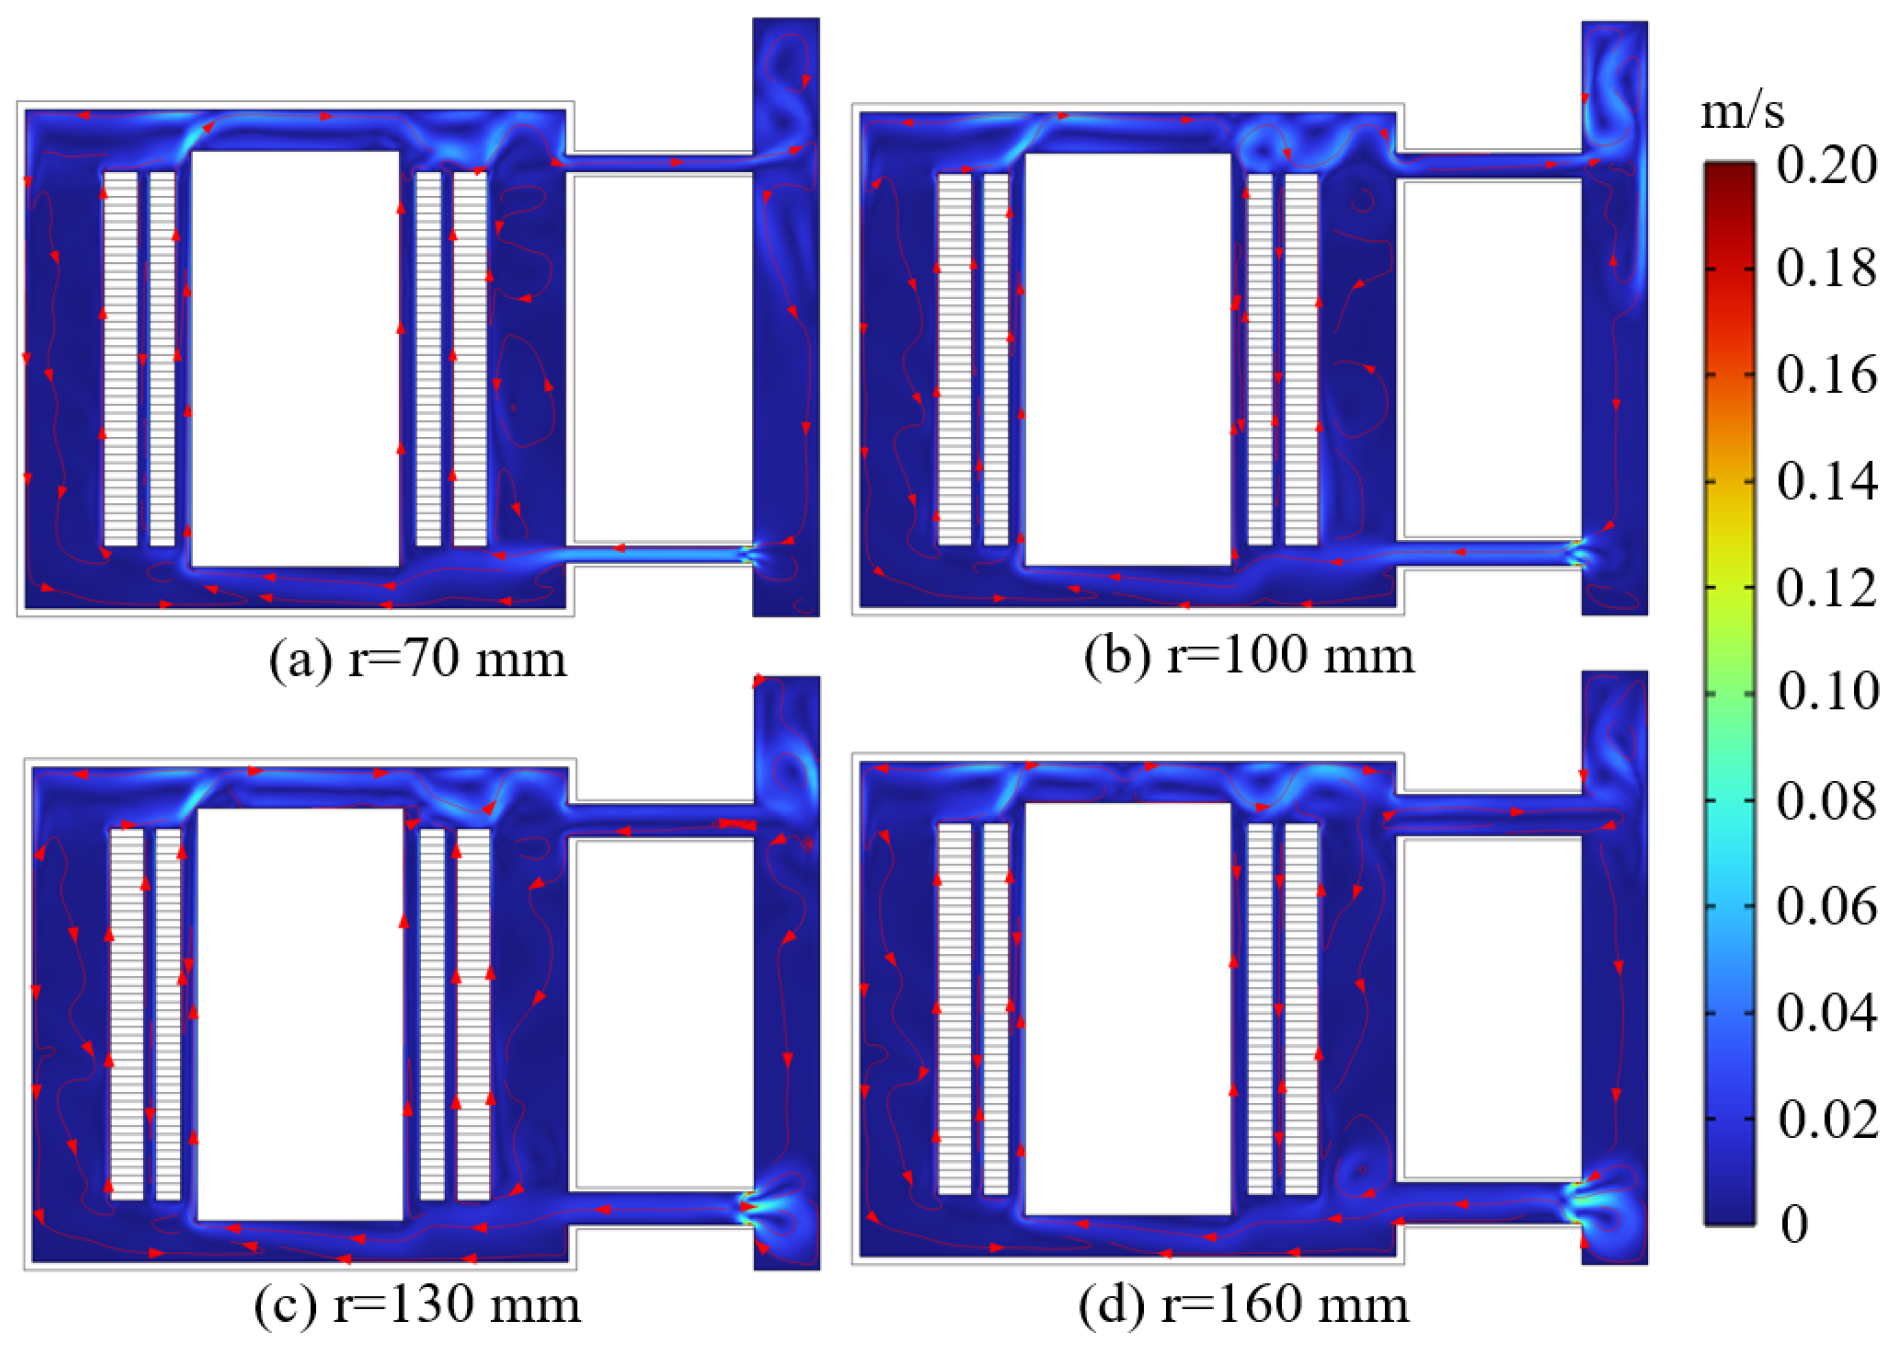
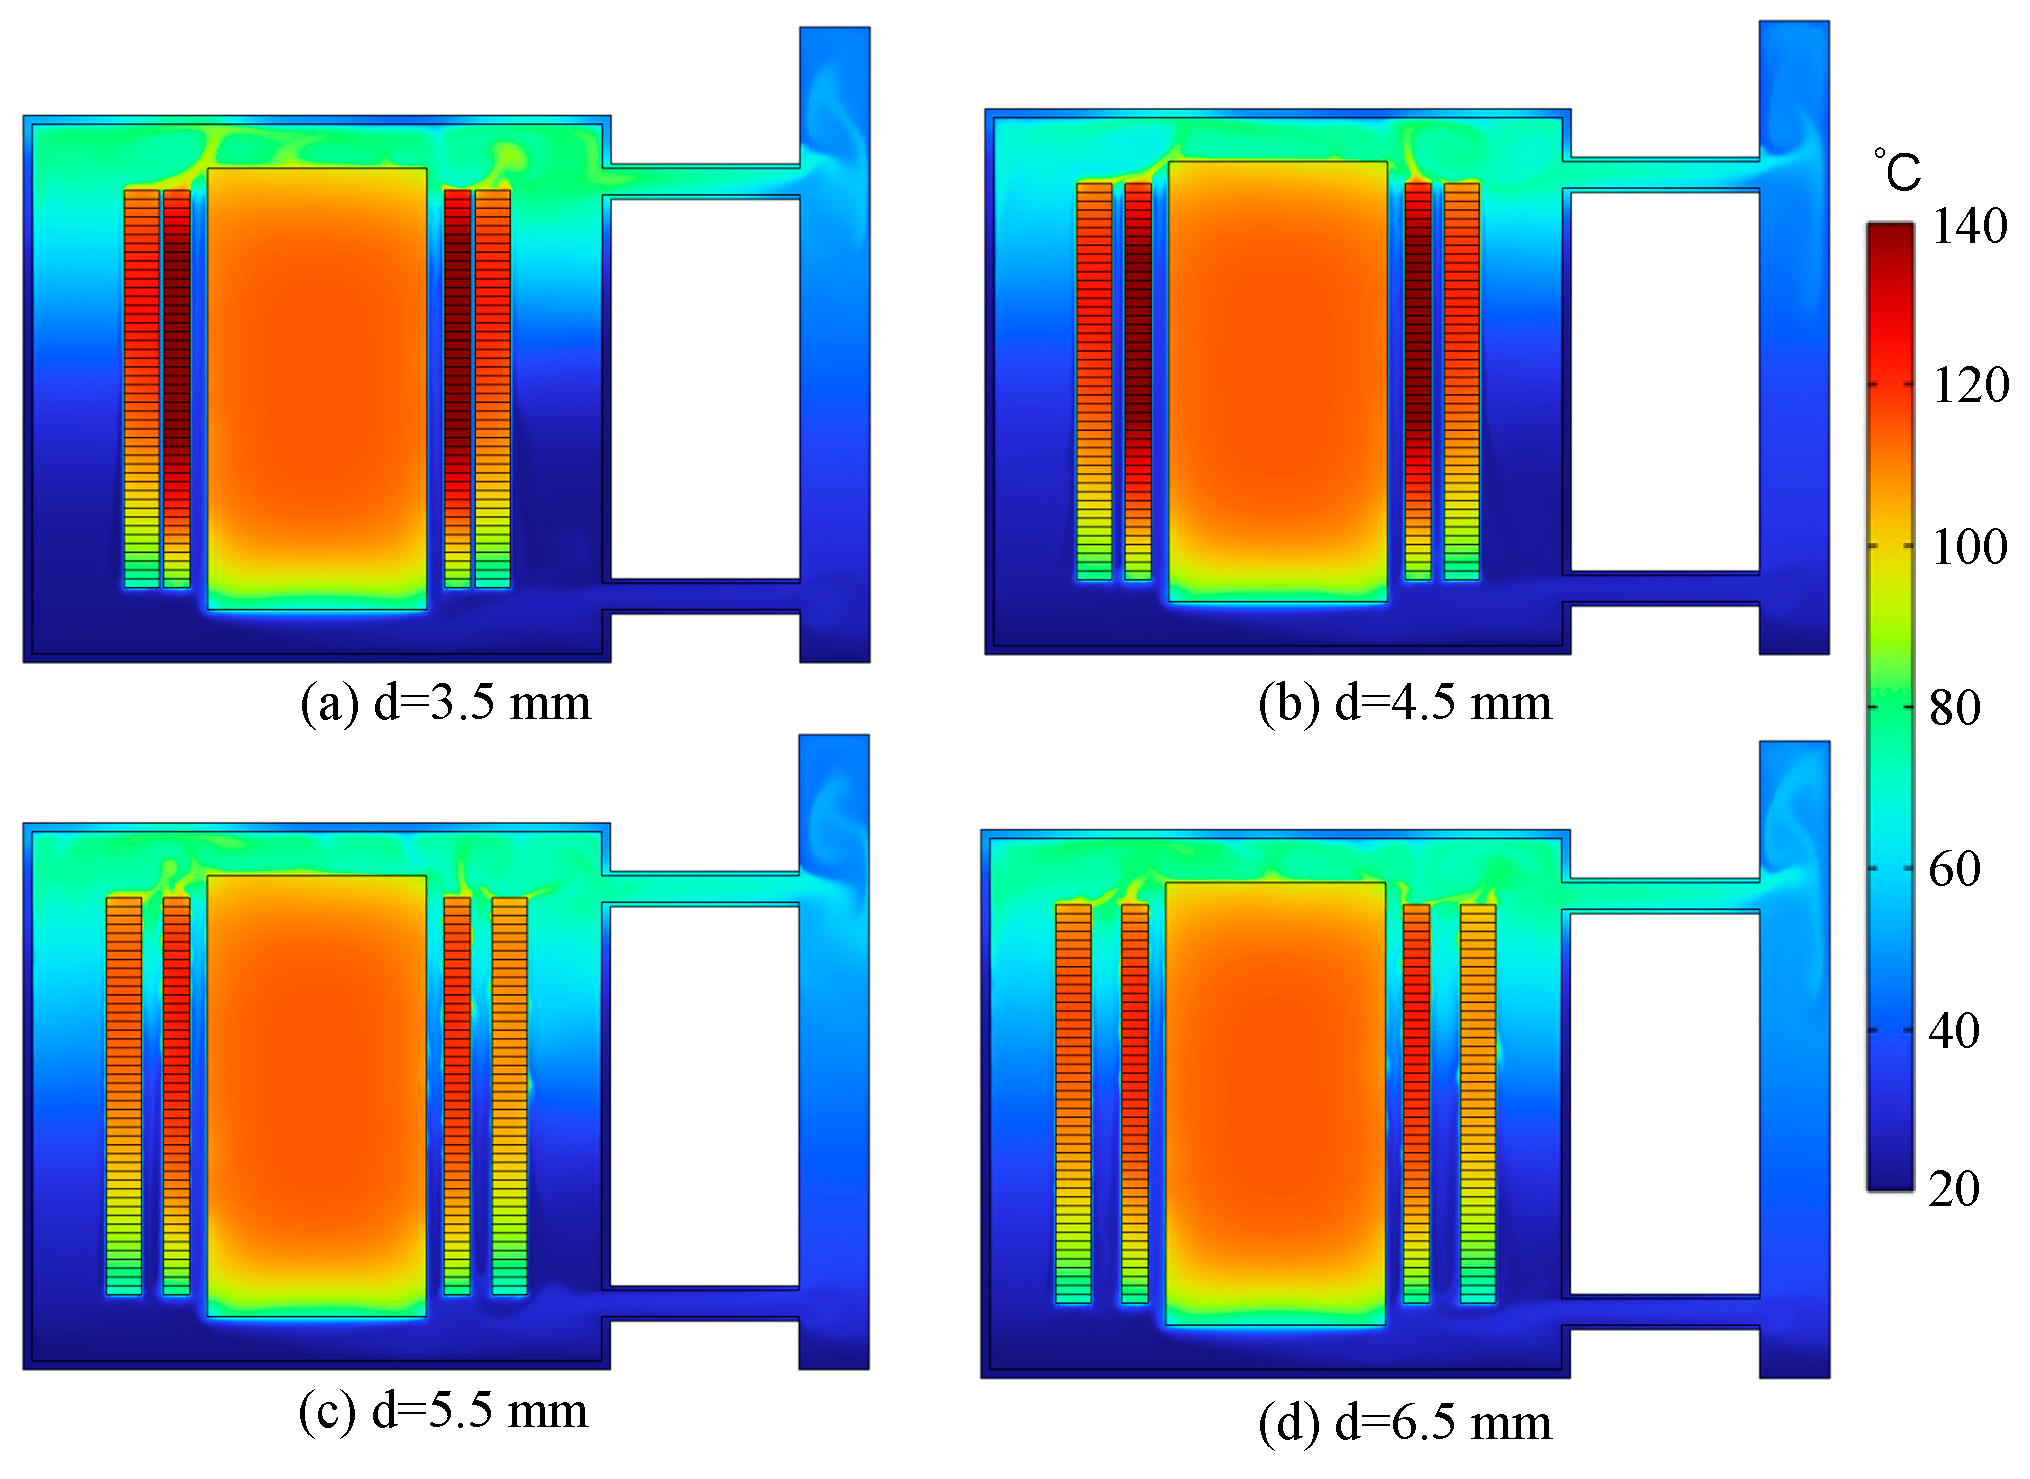
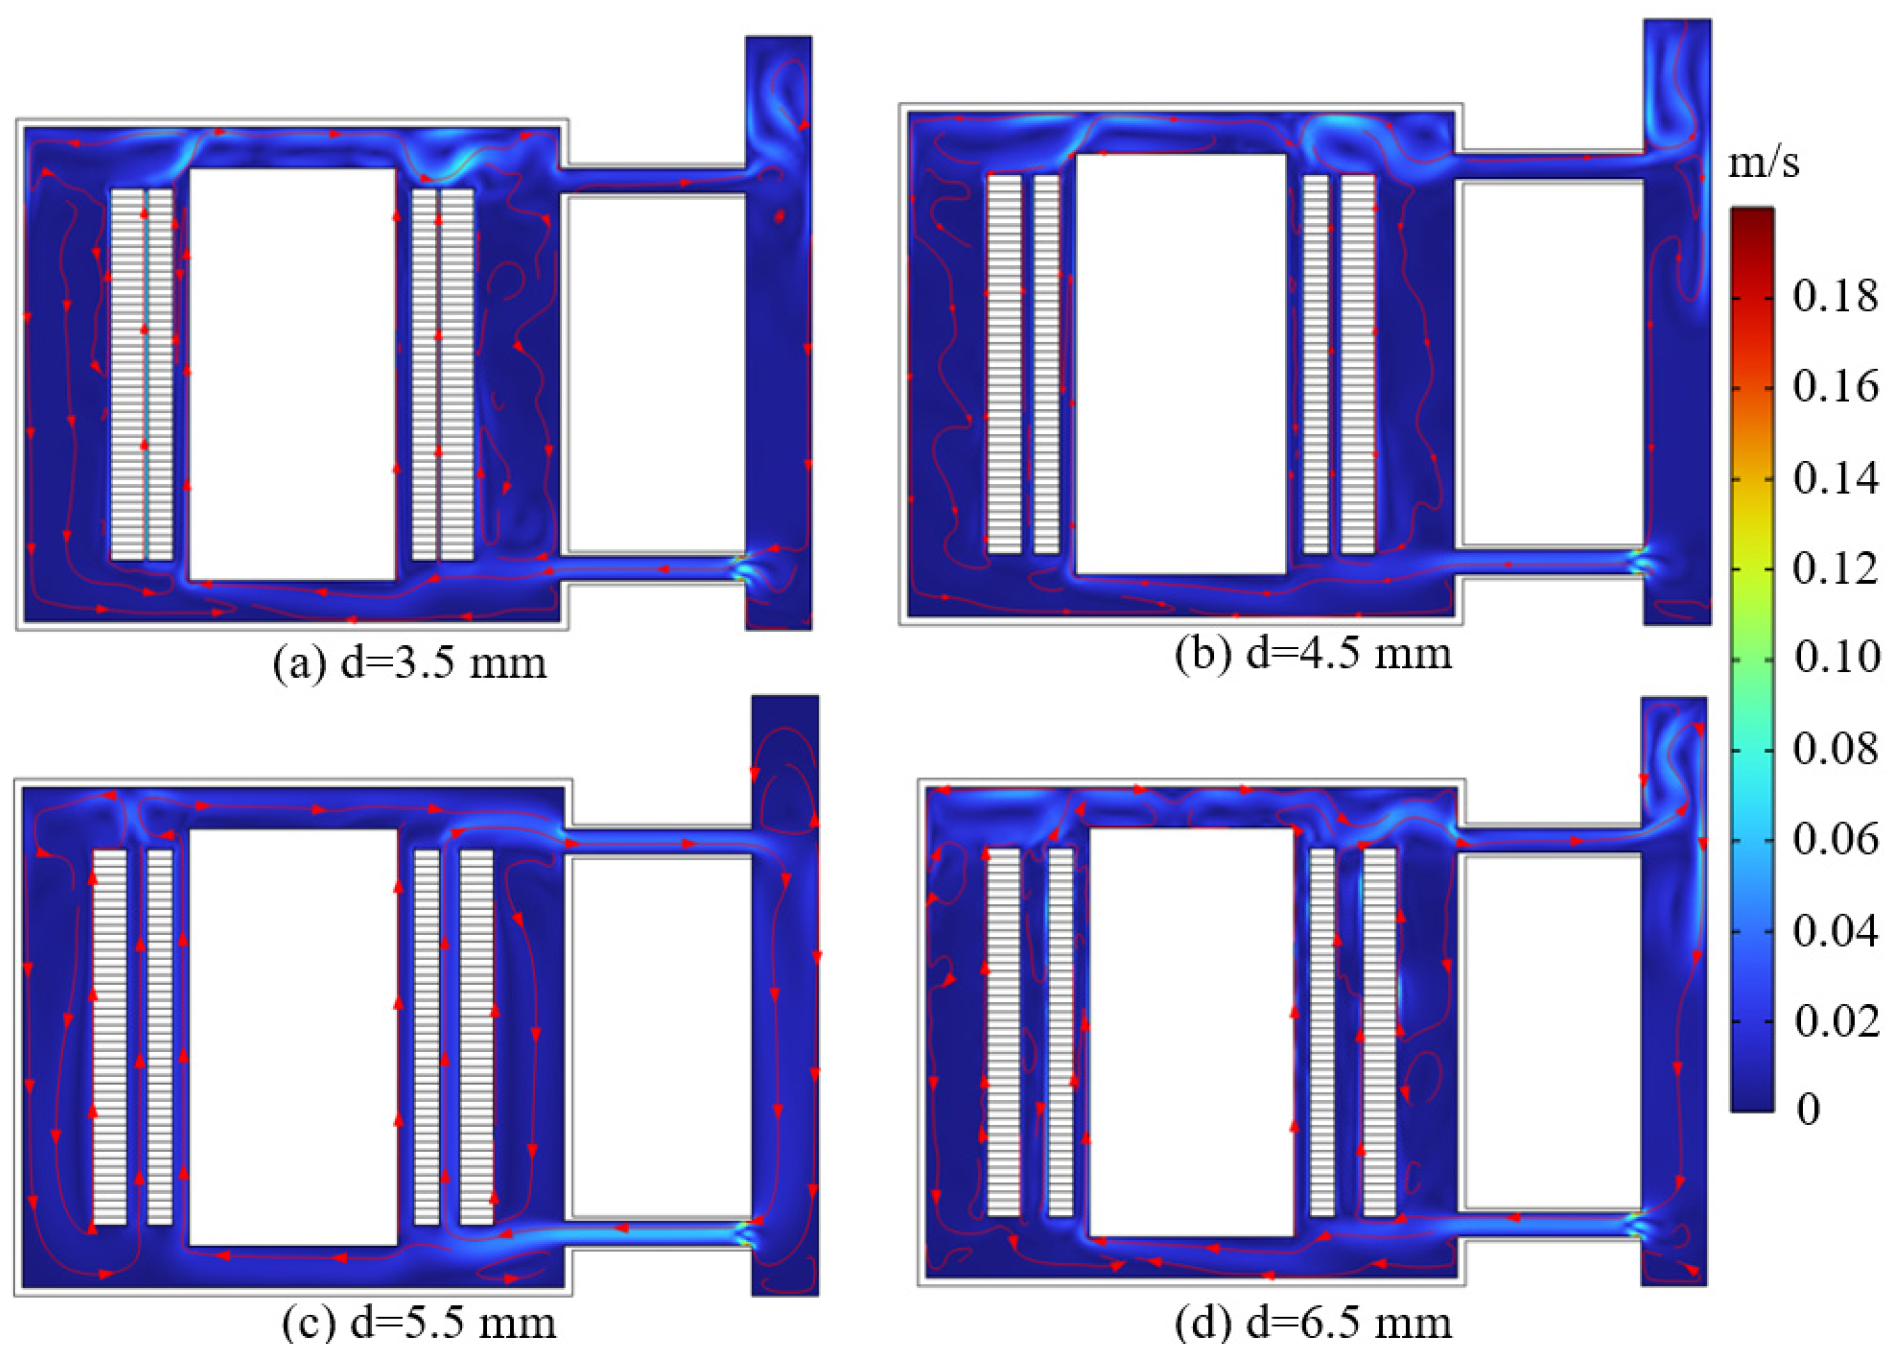
4.2. Influence of Oil Pipe Radius on Heat Transfer Characteristics

When the flow rate of the oil inlet is 0.2 m/s, the simulation results of the transformer temperature field under different oil pipe radii are shown in Figure 7. It can be observed that, with the increase in oil pipe radius, the temperature of the core and winding gradually decreases. When the oil pipe radius is 160 mm, the average temperature of the core and the net side winding is about 110 °C and 120 °C, respectively, which is about 10 °C lower than when the radius is 70 mm. The percentage of high-temperature transformer oil at the tank’s upper end increases with the increase in oil pipe radius. Still, the temperature of transformer oil decreases, indicating that the larger the radius of the oil pipe, the more uniform the distribution of higher-temperature transformer oil at the upper end of the tank.
Figure 8 shows the simulation results of the flow field under different oil pipe radii. It can be seen that the flow rate of transformer oil at the top of the tank is close to that of varying oil pipe radii. But for the radii of 70 mm and 100 mm, the right side of the tank appeared as a “vortex”, and, due to the smaller radius of the oil pipe, part of the high-temperature transformer oil to the outlet flows through the tank side of the walls of the obstruction and enters the return flow. The radii of 130 mm and 160 mm flow to the cooler area of the high-temperature transformer oil distribution in the oil pipe above, and the low-temperature transformer oil in the oil pipe below moves from the cooler to the more relaxed flow, and, finally, to the tank. This means that when the radius of the oil pipe exceeds a specific range, the transformer oil in the oil pipe will form thermal convection, which in turn affects the flow rate of the transformer oil to the cooler.

4.3. Effect of Turn Spacing of Main and Secondary Windings on Heat Transfer Characteristics

As can be seen in Figure 9, the difference in distance between the primary and secondary windings will mainly bring about a difference in the temperature of the oil flow in the vicinity of the winding area. The temperature above the corresponding turn spacing at a spacing of 3.5 mm is about 106 °C, about 8 °C higher than the above at 6.5 mm. However, it is closer compared to 4.5 mm. From Figure 10, when the distance between the primary and secondary windings is increased, the oil flow rate at the inlet of the transformer oil is more significant, and the corresponding flow rate is about 0.16 m/s when the distance is 6.5 mm, which is higher than that of 4.5 mm by 0.12 m/s. Increasing the winding distance can also significantly increase the flow rate of the oil at the inlet and outlet, which leads to a faster flow of the oil and heat dissipation.
The finite element method (FEM) was employed to simulate the temperature and flow fields in the transformer system, providing detailed insights into the heat transfer and fluid flow characteristics. The simulations captured complex phenomena such as vortex formation and convective heat transfer, which are critical for understanding the thermal behavior of the transformer. The FEM results were validated against experimental data, showing good agreement and underscoring the reliability of the approach. The use of FEM allowed for a comprehensive analysis of the effects of inlet flow rate, oil pipe radius, and turn spacing on the thermal performance of the transformer, providing valuable insights for optimizing its design and operation.

4.4. Weighting Analysis of Multifactor Indicators

A mathematical model for impact weighting analysis is established for the three key parameters of inlet flow rate, oil pipe radius, and winding spacing in the thermal management of the converter transformer. With temperature field uniformity and heat balance efficiency as the core optimization objectives, the comprehensive thermal performance index is defined.
J = α Δ T max + β | T avg T safe | + γ Δ P Δ P ref
ΔTmax is the maximum temperature difference in the oil field, Tavg is the average winding temperature, ΔP is the pressure drop in the oil circuit, and α, β, γ are the weighting factors.
Sobol’s variance decomposition was used to quantify the effect of each parameter on the objective function J of the influence weights of each parameter:
S i = Var x i ( E x i ( J | x i ) ) Var ( J ) , S T i = S i + j i S i j +
Then, determine a reasonable range for each parameter: inlet flow rate, 0.5 m/s to 2.0 m/s; tube radius, 10 mm to 30 mm; and winding distance, 20 mm to 50 mm.
The final interaction effects were obtained to be 38% for inlet flow rate, 26% for tubing radius, and 36% for winding spacing. Therefore, the oil flow rate has a more drastic effect on the hot spot temperature of the transformer.

5. Simulation and Experimental Study of Temperature Rise in Oil-Immersed Converter Transformer

5.1. Modeling and Simulation of Oil-Immersed Converter Transformers

To further verify the above simulation of the fundamental laws and obtain the oil-immersed transformer heat transfer under the consideration of the oil flow movement, a domestic converter station 382,000/500 oil-immersed converter transformer was used as the object of study, and a simplified model of flow-heat coupling with finite element simulation was established.
Figure 11 shows a higher temperature zone above the primary and secondary windings, which is about 75 °C and corresponds to a flow rate of about 0.28 m/s. Another slightly higher temperature zone, located in the middle position above the leading and sub-winding areas, is about 74 °C, corresponding to an oil flow rate of about 0.32 m/s.

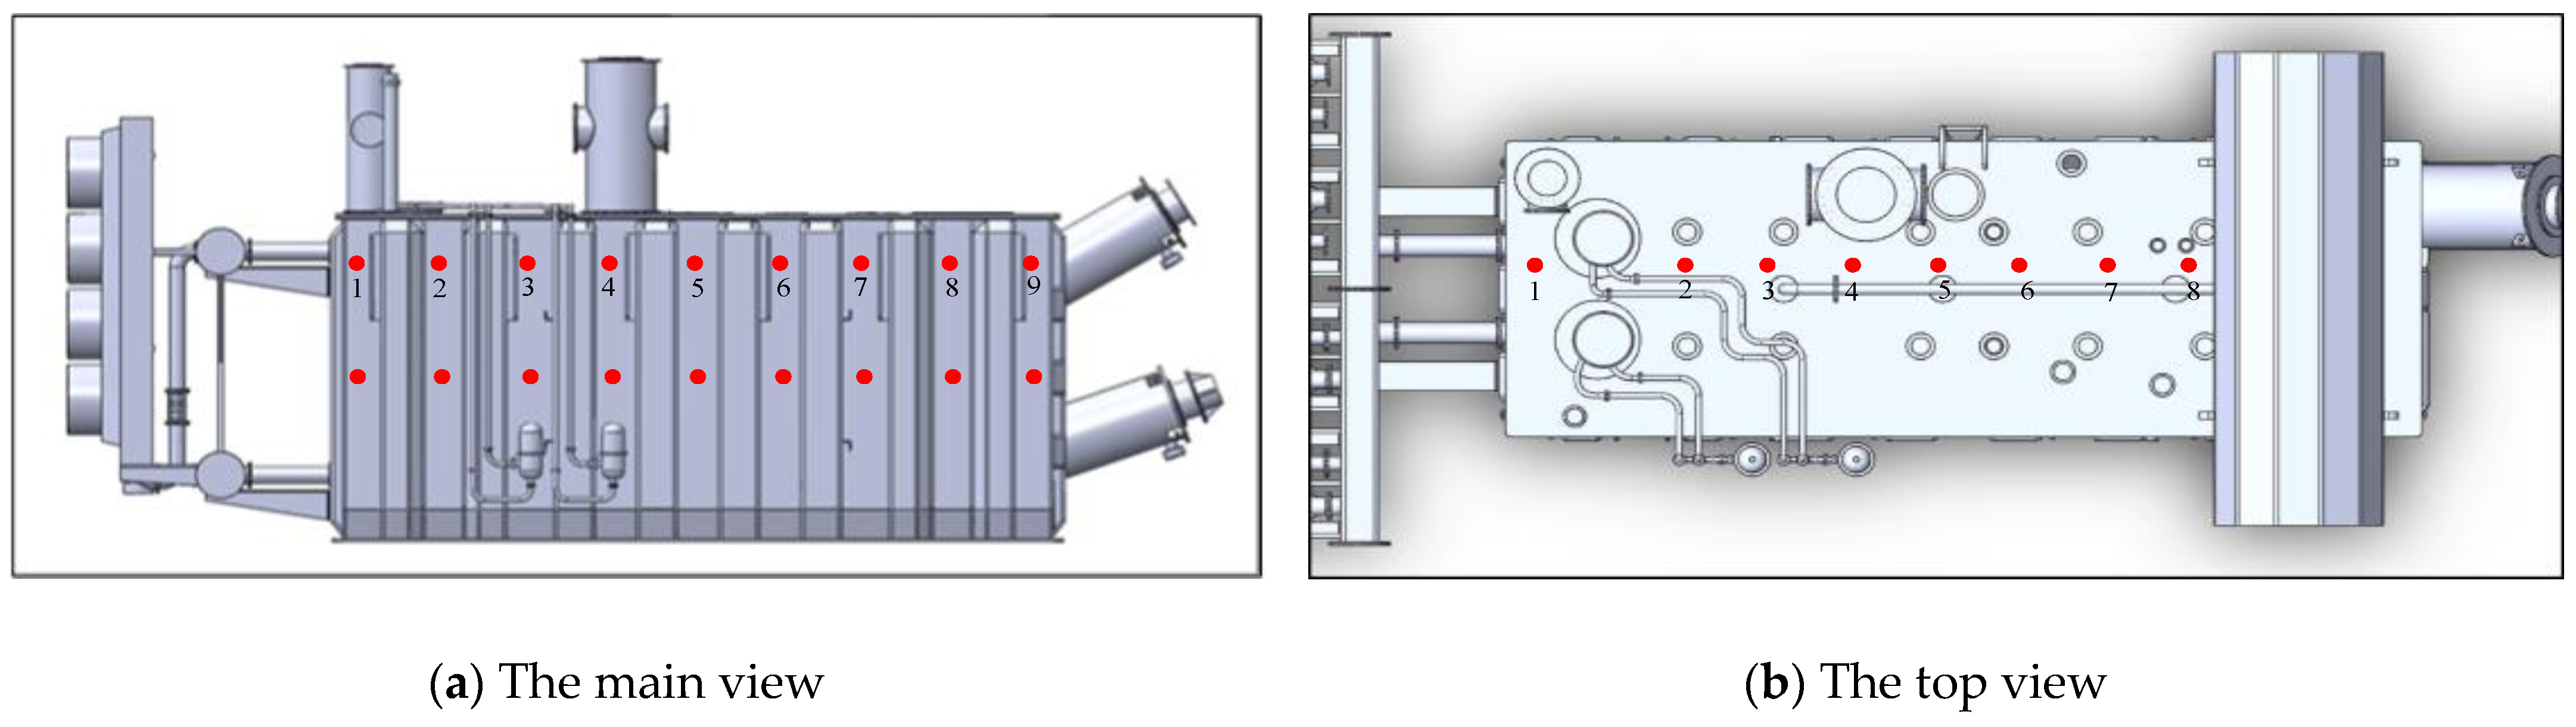
5.2. Temperature Measurement Pickup Point Situation

To further verify the above simulation results and obtain the heat transfer of oil-immersed transformers considering oil flow movement, this study measured the temperature at the critical positions of 382,000/500 for the oil-immersed converter transformers in a domestic converter station in the fall under loaded conditions. Figure 12 shows the schematic diagram of the temperature measurement points of the converter transformer oil tank, and the measurement time was 6 a.m., 12 a.m., and 18 p.m., respectively. One temperature measurement point was selected at every 1.0 m interval between the top end of the oil tank and the middle of the oil tank, and a total of 18 measurement points were selected, as shown in Figure 12a. Eight temperature measurement points were selected for the top cover of the fuel tank, as shown in Figure 12b.
The experimental setup consisted of a 500 kV converter transformer equipped with temperature sensors placed at strategic locations to monitor the temperature distribution. The sensors were calibrated prior to the experiments to ensure accurate measurements. The transformer was operated under full load conditions, and the temperature data were recorded at regular intervals using a data acquisition system.

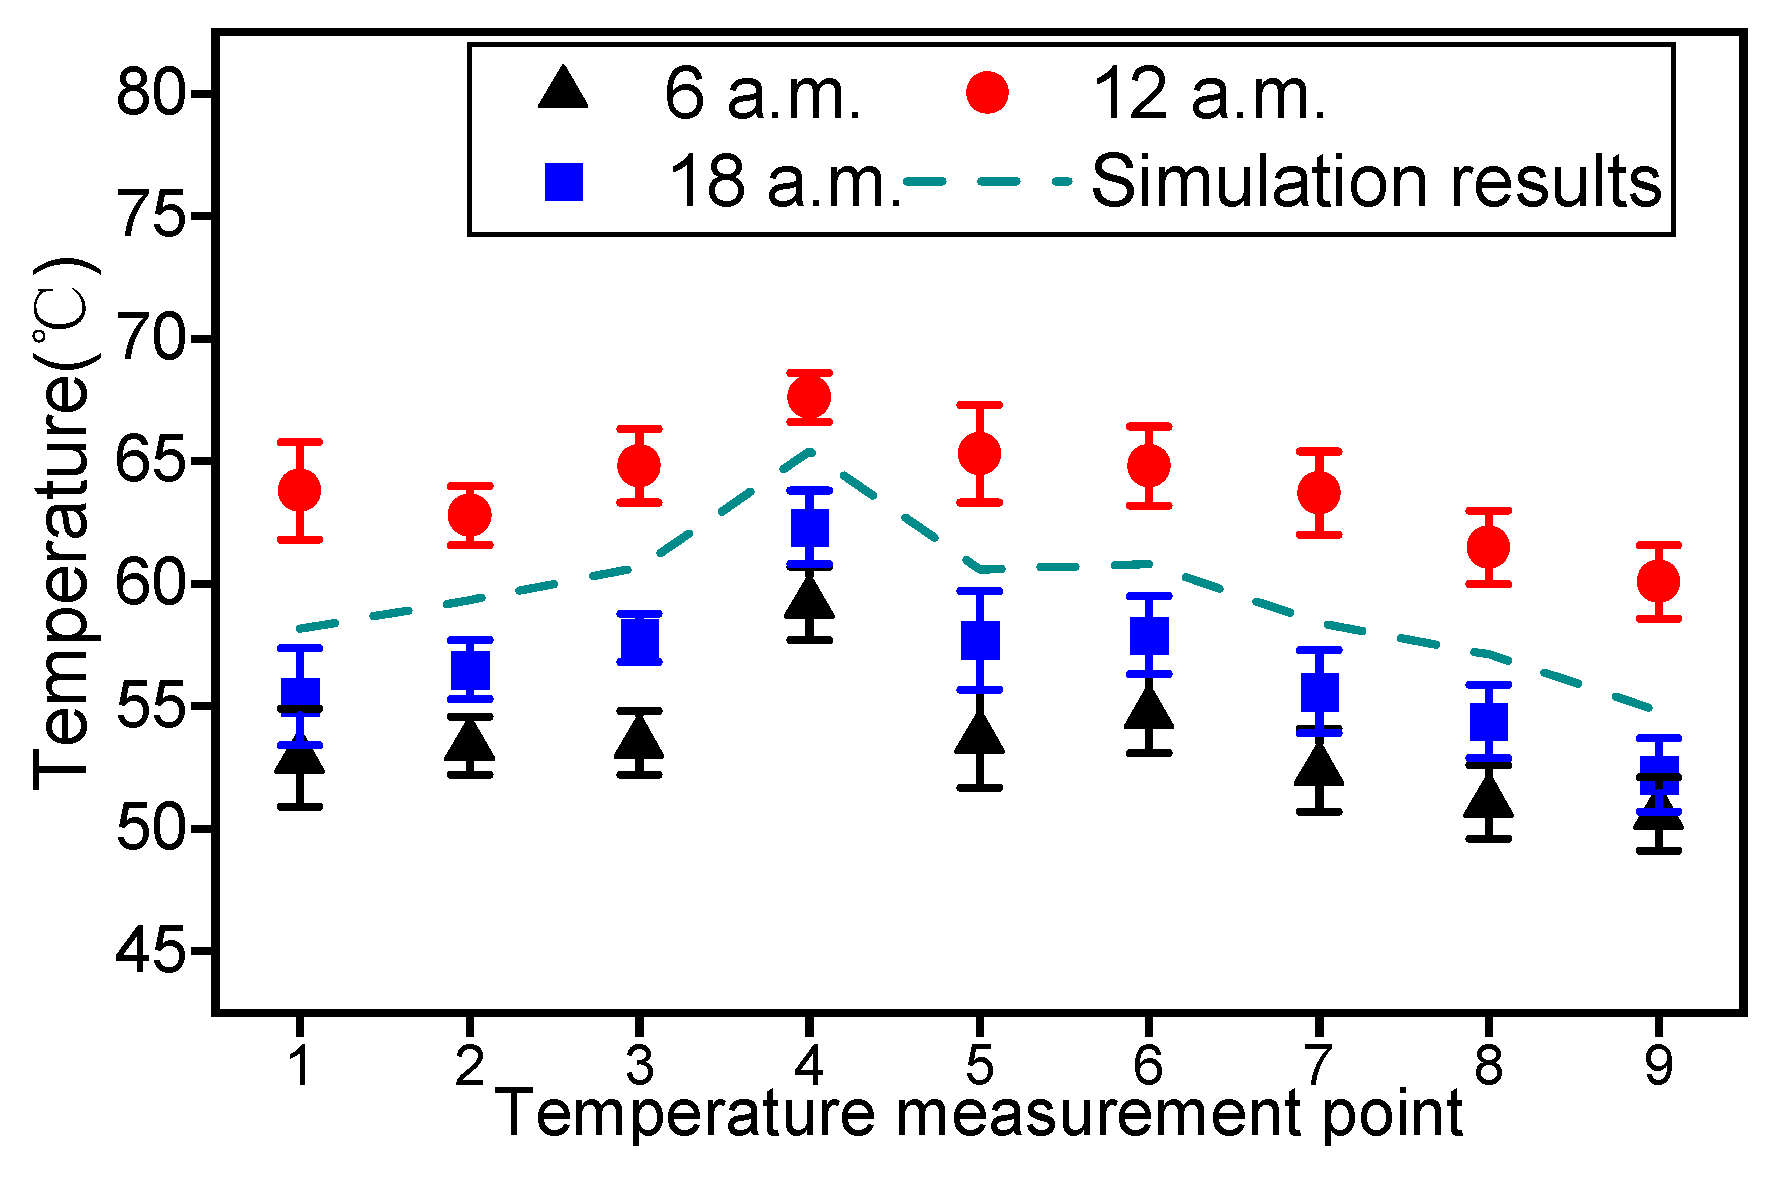
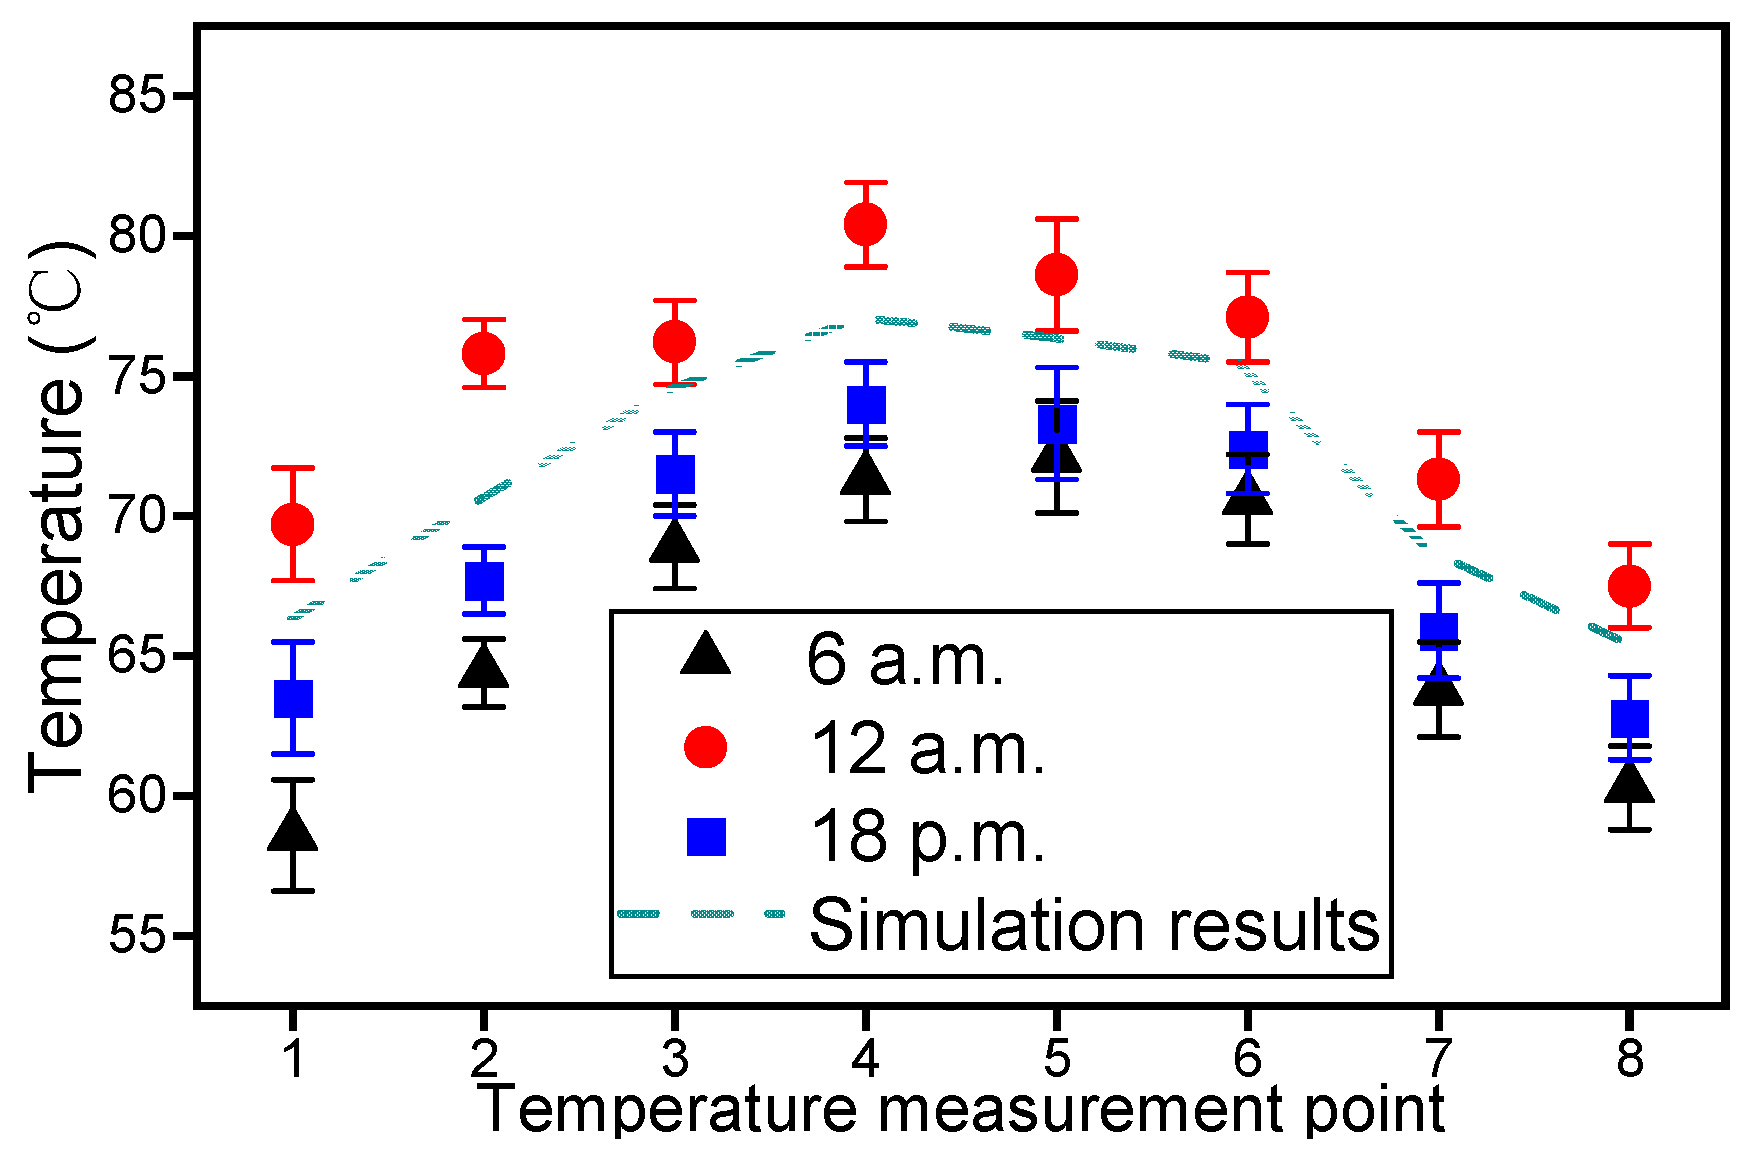
5.3. Typical Position Temperature Measurement Results

First of all, the temperature measurement of the oil-immersed converter transformer’s upper top surface (at position 3) and the lower bottom surface area (directly below position 3) position, i.e., below the elevated seat and the middle area position, was carried out, as shown in Figure 13 below.
From Figure 13, the temperature rise measurement result of the upper top surface position is about 139 °C, and the temperature at this position is about 135 °C in the simulation results, as shown in Figure 4 and Figure 8, which is consistent with the results of the two, with an error within 3%. The temperature measurement results of the typical location of the lower bottom surface and the simulation results are about 88.7 °C. Therefore, the fluid-temperature multi-physics field coupling simulation in the previous section is closer to the experimental results.

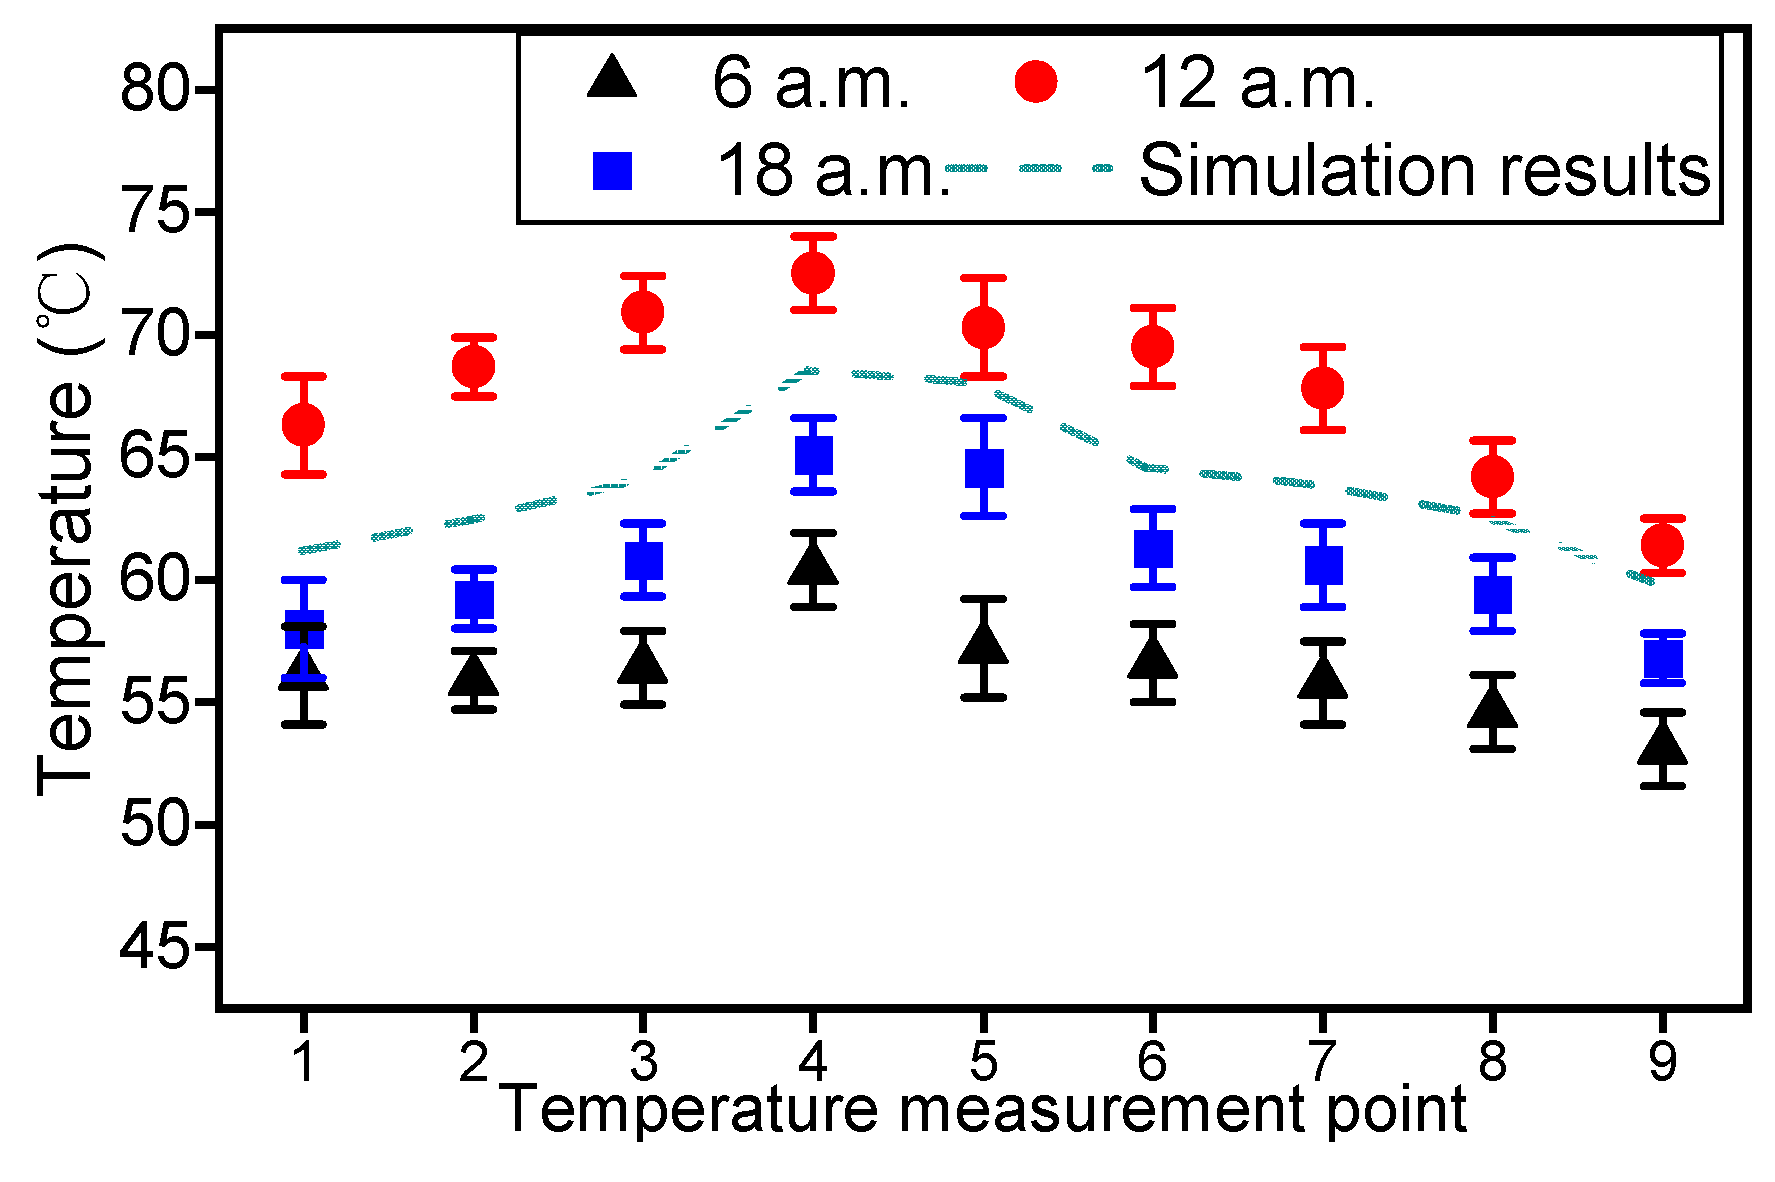
5.4. Temperature Measurement Pickup Point Results

Figure 14 shows the temperature measurement results at the upper end of the converter transformer tank. From measurement point 1 to measurement point 9, the surface temperature of the oil tank shows a rising and then falling trend, and the temperature at the location of measurement point 4 is the highest. The temperatures at measurement point 4 at different times are 60.4 °C, 72.5 °C, and 65.1 °C, respectively. Considering that this location is close to the high-voltage side of the net-side elevated seat, the temperature of the transformer oil in the tank is higher, and the heat transferred to this location through thermal radiation is also higher. The temperature at measurement point 1 is higher than at measurement point 9 at different times. Measurement point 1 is close to the oil outlet, which results in a higher temperature at this point due to the flow of transformer oil with a higher temperature to the outlet. Combined with the simulation results, it can be found that in positions 3 and 4, there are areas of higher temperatures close to the measurement results.
The temperature measurement results in the middle of the oil tank of the converter transformer are shown in Figure 15. The overall temperature distribution trend still shows that it rises first and then falls. The highest temperatures at different times are 59.2 °C, 67.6 °C, and 62.3 °C, respectively. The measurements of point 9 were located at the lowest temperature, 50.6 °C, 60.1 °C, and 52.2 °C, respectively, and the 18-time measurement of point 4 is 10.1 °C higher than the measurement of point 9.
Figure 16 shows the temperature measurement results of the top cover of the oil tank of the converter transformer. It can be observed that the temperature of the top cover of the oil tank at different times is higher at measurement points 4, 5, and 6, and the temperature of the top cover of the oil tank at 6:00 and 18:00 is the highest at measurement point 6, which is 73 °C and 74.9 °C, respectively. In contrast, the highest temperature of the top cover of the oil tank at 12:00 occurs at measurement point 4, with a temperature of 80.3 °C. Combined with Figure 11, the temperature of the top cover of the tank is higher than the temperature of the side surface of the tank, which further indicates that the higher the temperature, the lower the density of the transformer oil, and most of the high-temperature transformer oil is concentrated in the upper end of the tank. Therefore, the temperature of the top cover of the oil tank can be monitored to determine whether the temperature of the transformer oil in the tank is too high and whether the converter transformer is in a safe and stable operating condition.
The material parameters used in simulations (e.g., permeability of the core, resistivity of the windings, etc.) are usually idealized or based on standard values, whereas the actual material may have manufacturing tolerances, temperature dependence, or aging effects. Actual loads may contain harmonics, non-linear characteristics, or dynamic variations.
The experimental measurements presented include error bars to represent the uncertainty in the temperature data. The uncertainty ranges from ±1.2 °C to ±2.0 °C, depending on the measurement location and environmental conditions. These uncertainties are primarily attributed to the precision of the temperature sensors, variations in the thermal environment, and fluctuations in the transformer’s operating conditions. Despite these uncertainties, the measurements are consistent with the simulation results and provide reliable insights into the thermal behavior of the converter transformer.

6. Conclusions

In the paper, the heat transfer characteristics of a 500 kV oil-immersed transformer are simulated and measured for on-site temperature, which can provide specific reference values for the internal temperature distribution and fluid movement characteristics of an oil-immersed converter transformer.
The electric-magnetic-fluid-thermal multi-physical field coupling simulation results show that the larger the flow rate of the inlet, the faster the transformer oil circulation, and the smaller the proportion of high-temperature transformer oil at the upper end of the tank, the lower the temperature of the converter transformer needs to be to reach a relative equilibrium. Increasing the radius of the oil pipe will reduce the proportion of high-temperature transformer oil at the upper end of the tank, when the temperature distribution of the transformer oil in the tank is more uniform, but the oil pipe radius is too large to cause a return flow of transformer oil in the oil outlet pipe. The return flow of transformer oil is in the oil pipe. When the primary and secondary winding turn spacing increases, the oil flow diffusion area increases, and the flow rate increases, so the temperature near the winding is reduced by about 9%, and the corresponding position of the upper and lower wall temperature is reduced by about 4%. Then, a four-core double-winding oil-immersed converter transformer simulation model was established and found that in the first group of main and secondary winding areas and the main and secondary windings, close to the temperature hot spots, the oil flow rate was more significant. From a thermal management perspective, oil flow rate exhibits the highest prioritization in mitigating hot-spot risks, surpassing duct geometry and winding spacing effects. These findings align with previous studies that emphasize the critical role of oil flow rate in transformer thermal management, while also providing new insights into the effects of oil pipe geometry and winding spacing on temperature distribution.
For a converter station work site, the measurement of the full-load work converter transformer tank surface temperature shows that high-temperature transformer oil, due to density reduction and concentration in the upper end of the tank, can be monitored by monitoring the temperature of the top cover of the tank to determine the operating status of the converter transformer.
The study highlights the critical role of oil flow rate in transformer thermal management, showing that higher flow rates reduce hot-spot temperatures and improve temperature uniformity. The study also provides insights into optimizing oil pipe geometry and emphasizes the importance of larger winding spacing, which reduces temperatures by up to 9% near windings and 4% at the wall. These findings underscore the need for integrated design considerations in thermal management. Future research should focus on optimizing the oil flow rate and pipe geometry to further reduce hot-spot risks, as well as exploring advanced cooling techniques such as nanofluids or hybrid cooling systems to enhance the thermal performance of oil-immersed transformers. Additionally, experimental validation of the simulation results under varying operational conditions would provide a more comprehensive understanding of the thermal behavior in practical applications.
In research on heat transfer and cooling, the use of alternative fluids such as ester-based oils or nanofluids can provide advantages in terms of thermal conductivity, fire safety, and environmental sustainability. For example, ester-based oils offer higher flash points and better biodegradability than conventional mineral oils, while nanofluids can enhance dielectric and thermal properties. These alternatives can complement or even exceed the performance of conventional transformer oils, especially in demanding applications.

Author Contributions

Conceptualization, Z.Z., P.Y. and C.L.; methodology, Z.Z., J.Z. and X.Y.; software, Z.Z.; validation, X.Y., M.L. and F.Z.; formal analysis, J.Z.; investigation, F.Z. and P.Y.; resources, Z.Z. and C.L.; data curation, C.L. and Z.Z.; writing—original draft preparation, Z.Z. and J.Z.; writing—review and editing, Z.Z., C.L., J.Z., X.Y. and F.Z.; visualization, Z.Z. and X.Y.; supervision, F.Z.; project administration, F.Z. All authors have read and agreed to the published version of the manuscript.

Funding

This work was supported by the State Grid Science and Technology Program, Grant/Award Number: 5108-202218280A-2-350-XG. This work was supported by the National Natural Science Foundation of China, Grant Number: No.52177131.

Data Availability Statement

Data are contained within the paper.

Conflicts of Interest

Author Zhengqin Zhou, Chuanxian Luo, Jing Zhang, Xu Yang were employed by the company Wuhan NARI Limited Liability Company of State Grid Electric Power Research Institute. Author Fengda Zhang was employed by the company State Grid Shandong Electric Power Research Institute. The remaining authors declare that the research was conducted in the absence of any commercial or financial relationships that could be construed as a potential conflict of interest.

References

  1. Jovcic, D.; Ooi, B.T. Developing DC Transmission Networks Using DC Transformers. IEEE Trans. Power Deliv. 2010, 25, 2535–2543. [Google Scholar] [CrossRef]
  2. Liu, G.; Hu, W.; Hao, S.; Gao, C.; Liu, Y.; Wu, W.; Li, L. A fast computational method for internal temperature field in oil-immersed power transformers. Appl. Therm. Eng. 2024, 236, 121558. [Google Scholar] [CrossRef]
  3. Sayed, S.; Massoud, A. Optimal power flow in multi-terminal HVDC networks with embedded high-power DC–DC converters for voltage matching and flexible DC transmission. IET Gener. Transm. Distrib. 2020, 14, 3866–3876. [Google Scholar] [CrossRef]
  4. Tao, J.; Zhan, H.; Luo, C.; Hu, S.; Duan, X.; Liao, M. Diffusion Properties of Gas Molecules in Oil–Paper Insulation System Based on Molecular Dynamics Simulation. Energies 2024, 17, 3811. [Google Scholar] [CrossRef]
  5. Seddik, M.S.; Shazly, J.; Eteiba, M.B. Thermal Analysis of Power Transformer Using 2D and 3D Finite Element Method. Energies 2024, 17, 3203. [Google Scholar] [CrossRef]
  6. Seddik, M.S.; Eteiba, M.B.; Shazly, J. Evaluating the Harmonic Effects on the Thermal Performance of a Power Transformer. Energies 2024, 17, 4871. [Google Scholar] [CrossRef]
  7. Hao, Y.; Zhang, Z.; Xiao, J.; Zhao, H.; Yang, Y.; Dong, Z. Study on Thermal Characteristics of Winding under Inter-Turn Fault of Oil-Immersed Transformer. Electronics 2024, 13, 2869. [Google Scholar] [CrossRef]
  8. Gao, C.; Gao, J.; Shi, H.; Zhao, X.; Wang, K.; Zhang, S.; Qi, B.; Li, C. Evolution laws of charge mobility of transformer oil and pressboard material with temperature and electric field strength. J. Phys. D Appl. Phys. 2025, 58, 055501. [Google Scholar] [CrossRef]
  9. Eteiba, M.B.; Aziz, M.M.A.; Shazly, J.H. Heat conduction problems in gas cooled-insulated power transformers solved by the finite-element method. IEEE Trans. Power Deliv. 2008, 23, 1457–1463. [Google Scholar] [CrossRef]
  10. Allahbakhshi, M.; Akbari, M. Heat analysis of the power transformer bushings using the finite element method. Appl. Therm. Eng. 2016, 100, 714–720. [Google Scholar] [CrossRef]
  11. Duan, X.; Zhao, T.; Liu, J.; Zhang, L.; Zou, L. Analysis of Winding Vibration Characteristics of Power Transformers Based on the Finite-Element Method. Energies 2018, 11, 2404. [Google Scholar] [CrossRef]
  12. Taheri, S.; Gholami, A.; Fofana, I.; Taheri, H. Modeling and simulation of transformer loading capability and hot spot temperature under harmonic conditions. Electr. Power Syst. Res. 2012, 86, 68–75. [Google Scholar] [CrossRef]
  13. Olowu, T.O.; Jafari, H.; Moghaddami, M.; Sarwat, A.I. Multiphysics and Multiobjective Design Optimization of High-Frequency Transformers for Solid-State Transformer Applications. IEEE Trans. Ind. Appl. 2021, 57, 1014–1023. [Google Scholar] [CrossRef]
  14. Feng, X.; Zhang, D.; Zhao, T.; Liu, H.; Sun, Y.; Guo, H.; He, D. Magnetic-Thermal-Flow Field Coupling Simulation of Oil-Immersed Transformer. IEEE Access 2024, 12, 65462–65470. [Google Scholar] [CrossRef]
  15. Zhang, X.; Ren, L.; Yu, H.; Xu, Y.; Lei, Q.; Li, X.; Han, B. Dual-Temperature Evaluation of a High-Temperature Insulation System for Liquid-Immersed Transformer. Energies 2018, 11, 1957. [Google Scholar] [CrossRef]
  16. Wang, Q.; Yang, X.; Tian, H.; Liu, P.; Peng, Z. A novel dissipating heat structure of converter transformer RIP bushings based on 3-D electromagnetic-fluid-thermal analysis. IEEE Trns. Dielectr. Electr. Insul. 2017, 24, 1938–1946. [Google Scholar] [CrossRef]
  17. Abdali, A.; Abedi, A.; Mazlumi, K.; Rabiee, A.; Guerrero, J.M. Novel Hotspot Temperature Prediction of Oil-Immersed Distribution Transformers: An Experimental Case Study. IEEE Trans. Ind. Electron. 2023, 70, 7310–7322. [Google Scholar] [CrossRef]
  18. Jin, Y.; Wu, H.; Zheng, J.; Zhang, J.; Liu, Z. Power Transformer Fault Diagnosis Based on Improved BP Neural Network. Electronics 2023, 12, 3526. [Google Scholar] [CrossRef]
  19. Bezerra, F.E.; Di Santo, S.G.; Junior, G.M.; Tiferes, R.R.; da Rocha Albertini, A.; Santos, G.R. A forecasting methodology based on second-generation wavelets and neural networks: Application to power transformer oil temperature. Electr. Eng. 2024, 106, 3017–3029. [Google Scholar] [CrossRef]
  20. Li, C.; Chen, J.; Yang, C.; Yang, J.; Liu, Z.; Davari, P. Convolutional Neural Network-Based Transformer Fault Diagnosis Using Vibration Signals. Sensors 2023, 23, 4781. [Google Scholar] [CrossRef]
  21. Siddharthan, S.; Subramaniam, C. Study on the Influence of Nanofiller Additives in Enhancing Electrical Insulation Performance and Thermal Properties of Biodegradable Oils for Electrical Insulation Applications. J. Electr. Eng. Technol. 2025, 20, 2007–2017. [Google Scholar] [CrossRef]
  22. Sorte, S.; Monteiro, A.F.; Ventura, D.; Salgado, A.; Oliveira, M.S.; Martins, N. Power Transformers Cooling Design: A Comprehensive Review. Energies 2025, 18, 1051. [Google Scholar] [CrossRef]
  23. Suarez, P.; Alvarez, A.; Perez, B.; Caceres, D.; Cordero, E.; Ceballos, J.M. Influence of the shape in the losses of solenoidal air-core transformers. IEEE Trans. Appl. Supercond. 2005, 15, 1855–1858. [Google Scholar] [CrossRef]
  24. Thango, B.A.; Bokoro, P.N. Stray Load Loss Valuation in Electrical Transformers: A Review. Energies 2022, 15, 2333. [Google Scholar] [CrossRef]
  25. Nadolny, Z. Determination of Dielectric Losses in a Power Transformer. Energies 2022, 15, 993. [Google Scholar] [CrossRef]
  26. Xie, Y.; Ruan, J.; Shi, Y.; Jin, S.; Tian, Y.; Zhu, L. Inversion Detection Method for Resistivity of Oil-Immersed Paper in Transformer. IEEE Trans. Power Deliv. 2019, 34, 1757–1765. [Google Scholar] [CrossRef]
Figure 1. Oil-immersed transformer heat transfer process.
Energies 18 02270 g001
Figure 2. Two-dimensional flow-temperature field simulation model.
Energies 18 02270 g002
Figure 3. Simulation results of the oil-immersed transformer temperature field.
Energies 18 02270 g003
Figure 4. Simulation results of the oil-immersed transformer fluid field.
Energies 18 02270 g004
Figure 5. Simulation results of the temperature field with different flow rates.
Energies 18 02270 g005
Figure 6. Simulation results of the flow field with different flow rates.
Energies 18 02270 g006
Figure 7. Simulation results of the temperature field with different radii.
Energies 18 02270 g007
Figure 8. Simulation results of the flow field with different radii.
Energies 18 02270 g008
Figure 9. Simulation results of the temperature field with different turn spacing of the main and secondary windings.
Energies 18 02270 g009
Figure 10. Simulation results of the flow field with different turn distances of the main and secondary windings.
Energies 18 02270 g010
Figure 11. Oil-immersed converter transformer flow-thermal simulation results.
Energies 18 02270 g011
Figure 12. Schematic diagram of the temperature measurement points of the oil tank.
Energies 18 02270 g012
Figure 13. Typical position temperature measurement results.
Energies 18 02270 g013
Figure 14. Temperature measurement results of the upper tank.
Energies 18 02270 g014
Figure 15. Temperature measurement results for the middle of the tank.
Energies 18 02270 g015
Figure 16. Fuel tank top cover temperature measurement results.
Energies 18 02270 g016
Table 1. Nomenclature and abbreviation.
NomenclatureAbbreviation
1Ultra-high-voltage direct currentUHVDC
2TemperatureT
3Heat Flow velocityv
4Pipe radiusr
5Densityρ
Table 2. Analysis of the oil-immersed transformer losses.
Oil-Immersed Transformer Losses
Core LossHysteresis lossChange in the direction of the magnetic moment of the core
Eddy current lossSelf-excited loop included current
Winding LossesResistance lossJoule heat of winding resistance
Eddy current lossLeakage field
Table 3. Material properties of the simulation.
MaterialThermal Conductivity
(W·m−1·K−1)
Constant Pressure Heat Capacity
(J·kg−1·K−1)
Density
(kg·m−3)
Silicon steel sheet724467550
Copper4003858940
Non-magnetic stainless steel175227880
Disclaimer/Publisher’s Note: The statements, opinions and data contained in all publications are solely those of the individual author(s) and contributor(s) and not of MDPI and/or the editor(s). MDPI and/or the editor(s) disclaim responsibility for any injury to people or property resulting from any ideas, methods, instructions or products referred to in the content.

