Article

Dynamic Optical Wireless Power Transmission Infrastructure Configuration for EVs

Laboratory for Future Interdisciplinary Research of Science and Technology (FIRST), Institute of Integrated Research (IIR), Institute of Science Tokyo, R2-39, 4259 Nagatsuta, Midori-Ku, Yokohama 226-8503, Japan
*
Author to whom correspondence should be addressed.
Energies 2025, 18(9), 2264; https://doi.org/10.3390/en18092264
Submission received: 31 March 2025 / Revised: 21 April 2025 / Accepted: 28 April 2025 / Published: 29 April 2025
(This article belongs to the Special Issue Future Smart Energy for Electric Vehicle Charging)

Abstract

:
Electric vehicles (EVs) are becoming more widespread as we move toward a carbon-free society. However, challenges remain, such as the need for large batteries, the inconvenience of charging, and limited driving range. Dynamic optical wireless power transmission (D-OWPT) is considered a promising solution to these problems. This paper investigates the infrastructure configuration and feasibility of D-OWPT. To this end, a model of EV power consumption was created, and a simulator for D-OWPT was developed. Using this simulator, it was shown that placing light sources in low-speed sections is an effective method, and that continuous driving can be achieved by providing a light source with an output of about 20 kW, assuming a 50% of light irradiation section ratio. Since many of the conditions used in the analysis are achievable with existing technologies, these results demonstrate the high feasibility of D-OWPT. While the analysis presented in this study is based on simulation, the modeling parameters, including EV power consumption and OWPT system characteristics, are derived from actual vehicle specifications and experimental data reported in OWPT research. Although this study does not include physical implementation, the results present numerically validated conditions that are directly applicable to practical system design. This work is intended to serve as a theoretical foundation for the future development and prototyping of D-OWPT infrastructure.

1. Introduction

In recent years, the shift to electric vehicles (EVs) has gained momentum in an effort to create a carbon-free society. Vehicles are the primary method of transporting people and goods, and this transportation of goods in human life is not something that can be easily reduced. In addition, the energy required to transport goods is extremely large compared to the power consumed by information terminals, for example, and is not easy to reduce due to its physical characteristics. For these reasons, the power consumed in vehicles is extremely large, and therefore reducing the CO2 emissions associated with vehicles will have a huge impact. As mentioned earlier, the essential power consumption of even an EV while driving is not easy to reduce, but it can be an effective measure if the power generation stage is also taken into account. EVs run on electricity, so they do not emit CO2 while driving. In addition, they have lower CO2 emissions than gasoline-powered vehicles, when taking into account the manufacture and disposal of the vehicle, centralized power generation, and highly efficient operation of functions such as motors [1]. On the other hand, EVs require a large battery capacity to extend the driving range. Lithium-ion batteries, which have achieved high energy density, are mainly used for batteries, but there are several challenges. As discussed in detail in Section 2, EV batteries are heavy, large, large requirement of resources, and costly, and there are also challenges with the charging process and a limited driving range. These are difficult challenges that need to be adequately addressed in new societal frameworks, such as building a sustainable society and implementing autonomous driving.
Therefore, dynamic power transmission which transfers power while driving is expected to provide a solution to these problems facing EVs. In the case of the dynamic power transmission, power is ideally supplied as it is consumed while driving, eliminating the inconvenience of charging and the amount of power supplied per unit time is small. In addition, since the EV’s range is then no longer limited by the battery, ideally a battery would not be necessary, and issues based on the amount of battery power on board would be eliminated. In other words, this method has the potential to address the major challenges currently facing EVs. However, to realize this method, it will be necessary to install power supply equipment as an infrastructure at a sufficiently high density in the driving areas, which is a significant departure from conventional methods. In fact, the dynamic power transmission methods that have been considered so far have many problems, such as the cost of establishing the power transmission infrastructure and the electromagnetic interference with equipment due to the use of high-intensity electromagnetic waves as the power transmission, as described in detail in Section 2, and it can be said that solving these problems has not been easy so far.
Optical wireless power transmission (OWPT) is a method that uses a beam light source and a solar cell as a light-receiving element, and wireless power transmission (WPT) is possible with a relatively simple and compact configuration [2,3]. In addition, because it uses light, which is a high-frequency electromagnetic wave more than five orders of magnitude higher than so-called radio waves, the beam spread due to the diffraction mechanism is small, so the power transmission distance can be longer with a sufficiently high beam utilization efficiency than that of microwave wireless power transmission, etc. [4,5]. In addition, in this OWPT, both the light source and the receiver use DC systems, so there is no electromagnetic interference to other devices. For this reason, the research and development of this method has become active in recent years. From the feature of the OWPT method, when the OWPT is applied to dynamic power transmission, long-distance wireless power supply from a light source is possible, so power can be supplied with a small number of light source infrastructure facilities.
In this way, it can be said that dynamic wireless power transmission (WPT) for EVs using OWPT has great advantages, such as reducing problems related to EV batteries and reducing CO2 emissions. However, in order to achieve practical dynamic OWPT (D-OWPT) for EVs, there are many challenges, such as the realization of high power OWPT mechanisms, modifications of EV systems to support dynamic OWPT, and safe conditions and methods for using light beams. In addition, it is also necessary to install a light source for the power transmission system, which will be the infrastructure. However, there are no reported examples of light source infrastructure design and problem investigation that assume dynamic power transmission by OWPT. In order to establish both the EV vehicle body side and the light source equipment that will be the infrastructure for D-OWPT in the future, it is essential to clarify the guidelines for the basic infrastructure configuration.
Based on the above background, this study investigated the basic requirements for the infrastructure configuration of D-OWPT as the initial stage of these methods and systems. The purpose of this study is to numerically investigate the feasibility of D-OWPT under realistic conditions and to provide a foundation for future practical implementation. Some of the results presented in this study were presented at the 5th Optical Wireless Power Transmission Conference (OWPT2023) [6]. This paper reports on the details of the study, with the addition of new results.
This paper is organized as follows: Section 2 discusses the issues surrounding EV batteries in detail, and compares several possible methods of dynamic power transmission and clarifies the fundamental advantages of dynamic power transmission using OWPT. Section 3 describes the construction of a light source infrastructure simulator, the modeling of an actual EV used in the simulator, and the calculation method within the simulation. Section 4 reports the results of the analysis. The validity of the D-OWPT through the analysis based on the constructed simulator is also discussed, and better infrastructure design for the D-OWPT is suggested. Finally, Section 5 summarizes the results and presents a conclusion.

2. Challenges of Electric Vehicles

2.1. Issuues of Battery of EV

This section reviews the main battery-related issues that currently limit the performance of EVs. The use of batteries is an effective method, and in fact, current EVs are made possible by the use of batteries. However, there are three main problems to consider.
The first challenge of batteries is based on their physical properties and technological issues such as the weight, size, amount of resources required, and cost of the battery itself. The weight depends on the battery’s specific energy, which remains relatively low at 80 to 150 Wh/kg [7], even with current technologies. As a result, the weight of the battery is a large proportion of the weight of the EV, about 10–20%. A simple estimation is to compare it with an internal combustion engine (ICE). If the battery parameters are 100 Wh/kg and 200 kg, the total power is 20,000 Wh at 100% of motor efficiency. The thermal energy efficiency of an ICE is low at about 30%, but because gasoline has a high weight energy density of about 1200 W/kg, for the same amount of energy, the weight of gasoline is 56 kg, which is a quarter of the weight. The size of the battery depends on its volumetric energy density, and it makes up a large portion of the volume of an EV due to the large volume of the battery. The resources required for battery production include many underground resources such as aluminum, copper, and rare earths. It is estimated that 48 tons of mining activity is required to extract the resources needed for a battery in an EV, and it has been pointed out that mining such large quantities could lead to environmental problems [8]. The cost per kWh of the battery is about JPY 20,000 at the time of writing this paper, which is said to be several tens of percent of the selling price of an EV [9].
It is noted that recycling technologies are attracting attention to solve these problems and make effective use of limited resources [10]. The recovery of precious metals such as lithium and cobalt leads to the effective use of resources and has economic benefits. However, due to their diverse chemical compositions, it is difficult to accurately classify them, and further study of recycling technology is required [11]. In addition, the improvement of energy density using solid-state batteries is also being considered, and while the state-of-the-art energy density of lithium-ion batteries is reach to 250 to 300 Wh/kg, the energy density of solid-state batteries is expected to exceed 500 Wh/kg [12]. High-energy-density batteries can increase range and reduce the weight of installed batteries, but research, development, and manufacturing challenges remain for large-scale production with low cost [13]. This may take a long time to solve.
The second problem is battery charging. Charging requires manual labor because it uses wires and connectors. Charging methods can be divided into normal charging and fast charging, but normal charging takes several hours to complete [14]. This significantly reduces the operating time of the vehicle. On the other hand, fast charging can drastically reduce charging times from tens of minutes to just a few minutes. However, it also raises other issues, such as a significant increase in power consumption per unit of time. This causes a large increase in the cost of devices and circuits on both the sending and receiving sides, the need for thicker and more difficult to handle charging cables, and the need for advanced heat dissipation technologies, including water cooling methods, due to the large increase in the amount of heat generated per unit time. In addition, high-speed charging methods in excess of several hundred watts are being developed, but these place a burden not only on the power supply facilities, but also on the power transmission cabling and systems, and create issues such as limitations on the power available in the area.
Automated charging by using a robot to connect the charging connector and automatic charging by WPT while the vehicle is parked are also being considered, but these would be costly and still require long charging times. Fast charging would reduce the charging time, but would incur high costs, including the impact on the power grid, so the conditions for its use are likely to be limited.
The third problem is range limitation. Increasing the amount of battery installed in an EV can increase the range, but it also increases the weight and cost of the battery, as well as the time it takes to fully charge the battery. In addition, the energy from the additional battery is used to move the weight of the battery, reducing the benefit of installing the additional battery. Currently, the range is several hundred kilometers, with a maximum of 759 km for the Mercedes-Benz EQS. These are said to be distances comparable to those of gasoline-powered vehicles, but considering various electricity usage situations, range can be said to be an issue for EVs. Assuming that a person will be driving, it is considered sufficient to be able to drive continuously for 500 to 1000 km, taking into account driving time, but as autonomous driving becomes more widespread in the future, it can be said that the current approach to driving range will be insufficient for building a new society.
This range can also be extended by improving the battery, but as mentioned above, it will take a long time to make significant improvements in battery performance. Moreover, even if the weight energy density improves as it has with solid-state batteries, the improvement will only be about twice as great as it is today. Battery weight and driving range limitations cannot be ignored.

2.2. Issuues of Dynamic Power Transmission

As detailed in Section 2.1, battery-related constraints remain a key barrier to the future of sustainable and autonomous mobility. Dynamic power transmission technologies are attracting attention as a way to overcome these limitations.
A number of methods for dynamic power transmission have already been considered. These include overhead wire methods similar to those used by trains, methods using near-field electromagnetic waves such as magnetic and electric fields, and methods using radio wave radiation [15,16,17,18,19]. Demonstration experiments are already underway for pantograph systems and systems using near-field electromagnetic waves because it is relatively easier to ensure safety [20,21,22], but each method has its own problems.
Unlike trains, pantograph systems for EVs require contact power supply for different types of vehicles on different routes, and pantographs need to be installed as infrastructure for each road lane according to the size of the vehicle, making it difficult to support all roads and vehicles. In addition, because the system requires physical contact with the wiring, the wiring is prone to wear and tear, and performing such maintenance over a wide area is a major burden. Although its high efficiency and proven use in trains are appealing, significant challenges remain in adapting the infrastructure to diverse road and vehicle conditions.
On the other hand, magnetic field and electric field systems provide contactless power transmission. The lack of wear from contact due to contact and the slightly wider tolerance of power transmission conditions are attractive features. However, the power supply distance is still short less than tens of centimeters, and the power transmission mechanism serving as the infrastructure is buried in the road surface, which increases the cost and maintenance efforts, such as the number of power transmission mechanisms to be installed, the weight load of heavy vehicles, and how to handle road resurfacing [23]. Furthermore, although these near field methods can achieve extremely high power supply efficiency under optimal conditions, such optimal conditions are only transient during driving. In other words, the time during which power can be efficiently supplied is extremely limited. In order to avoid the introduction of high-density power transmission equipment over a wide area, methods are being considered in which power transmission equipment is installed only on certain sections of the road. To solve these problems, large amounts of power are supplied at the time of power supply. In other words, the same problems arise as with fast charging.
With radio wave methods, the radiation of radio wave beams allows wireless power to be supplied over longer distances than with magnetic field or electric field methods, making it possible to install transmitting antennas along roads where EVs are driven. However, given the reduction in power supply efficiency due to beam propagation of more than 10 m caused by the installation of microwave and millimeter waves, the power transmission would have to be provided from directly above, for example using roadside poles, at a distance of a few meters, which would require a high-density installation of infrastructure equipment and would be a cost issue. In addition, these methods will cause unnecessary electromagnetic interference to surrounding equipment due to power leakage.

2.3. Dynamic Power Transmission by OWPT

When long-distance wireless power transmission becomes possible, a dynamic power transmission mechanism can cover long distances or large areas, facilitating infrastructure development by reducing the number of equipment and enabling installation above the road. In addition, if concerns about electromagnetic interference are eliminated, applications in a variety of environments are expected to become possible. OWPT is expected to be a wireless power transmission method with these characteristics. There are already examples of OWPT that have demonstrated a power transmission distance of 1 km, and transmitted several hundred watts of power with a light source power of several kW [2]. As for the light source, since several tens of kW have been put into practical use as laser light sources for metal processing. From these current situations, this method can be said to be a feasible method for power transmission distances of several hundred meters to kilometers and power transmission of several kW without inherent physical problems. In addition, it does not cause electromagnetic interference with other equipment.
Since the beam spread of the light beam is small due to the low diffraction nature of the high frequency electromagnetic wave, the power transmission distance can be long. For example, the beam spread can be as small as a few tens of centimeters for a few kilometers of transmission when a high-quality Gaussian beam is used. The air propagation loss is 1% over 100 m on a sunny day [24], and kilometers of propagation are quite feasible. Even when using a low-quality multimode beam, the spread can be suppressed to 50 mm even after 10 to 20 m of propagation [25]. In addition, lasers and high-efficiency LEDs can be used as light sources for OWPT. There are various investigations of OWPT applications, such as powering multiple IoT devices, underwater, and air and land vehicles are being considered [26,27,28,29,30].
The efficiency of the power supply in wireless power transmission is extremely important due to its function, but the efficiency of the whole OWPT system is basically expressed as the product of the efficiency of the light source and the efficiency of the solar cell. Solar cells can be highly efficient because they are based on monochromatic light irradiation compared to solar irradiation. The highest reported solar cell efficiency under monochromatic light is 68.9% at 25 °C [31] and 74.7% at 150K [32]. In addition, a monochromatic light source with a wavelength of 800–900 nm, corresponding to these reported examples, has been achieved with a light source efficiency of 72.6% [33]. From these products, an efficiency of 50% can be expected for OWPT. It has been shown that this configuration is effective for D-OWPT for EVs [34]. However, even with an expected power transmission efficiency of about 50%, there are still large losses, which seems to be a major challenge, especially from the perspective of the essential goal of reducing CO2 emissions. However, it has been reported that the amount of batteries installed in EVs can be significantly reduced by dynamic OWPT based EVs, making it possible to reduce CO2 emissions throughout the entire lifecycle of EVs, from production to disposal [35].
Table 1 shows a summary of the challenges and prospects of power supply methods to EVs.
Therefore, OWPT presents a promising approach for powering EVs. To realize D-OWPT for EVs, in addition to establishing the basic configurations and basic functional elements in the system, it is necessary to consider the implementation of an OWPT method on the EV itself, as well as methods for developing the light source infrastructure that will serve as the power transmission mechanism, including the actual roads. However, it is not easy to consider all of these things at once on a practical level. With regard to OWPT technology, small terminal power supplies are just beginning to be introduced to the market, and there are no cases where the technology has been implemented in EVs. In order to proceed with these considerations and social implementation, it is necessary to clarify the requirements and issues for investigating each component of the overall system, assuming a certain system configuration, step by step.

3. Simulator for Infrastructure of D-OWPT-EV

3.1. Preparation of Real EV Model for Simulator

Due to practical constraints in evaluating EVs and D-OWPT infrastructure, numerical simulations provide a valuable tool for studying basic requirements. Therefore, an infrastructure simulator for D-OWPT has been constructed.
In a D-OWPT infrastructure design simulator, a numerical model of the EV itself is required to power an EV whose power consumption varies in a complex manner from moment to moment. Various studies have been conducted on numerical models of real EVs [36], but many parameters are required for analysis, making them unsuitable for initial studies. In this research, a simple numerical model that can only express the main power consumption characteristics of an actual EV was created, and the suitability of the model was confirmed by comparing it with the power consumption of an actual EV. Note that for this comparison of power consumption, the WLTC mode was used, a driving pattern that is an international test method also used to measure the power consumption of actual EVs [37].
First, the power consumption characteristics of the EV modeled in this study are described. When an EV drives, it is mainly subjected to air resistance and friction resistance. As a first approximation, the air resistance depends on the speed of the EV, and the friction resistance depends mainly on the weight of the EV. Note that friction resistance includes the friction between the tires and the road, as well as the friction of the drive system such as the motor. During driving, kinetic energy is constantly consumed by these resistances.
The theoretical equations used for the driving model in this research that represent the power consumption characteristics are discussed. First, regarding the power consumption during constant speed and accelerating driving, the air resistance f a i r t , the friction resistance f f r i c t i o n t , and the power consumption P a c c t during accelerating driving are shown in Equations (1)–(3). v t and a t are the speed and acceleration values at time t , respectively.
f a i r t = k v t 2
f f r i c t i o n t = μ m g
P a c c t = f a i r t + f f r i c t i o n t + m a t v t
Here, k ( k g / m ) and μ are the proportional constants for air and friction resistance, respectively, m ( k g ) is the vehicle weight, and g ( m / s 2 ) is the acceleration due to gravity. Note that when driving at a constant speed, a = 0 . When decelerating, the equation changes because many EVs use energy regeneration to convert the kinetic energy lost during braking into electrical energy. However, when decelerating, the deceleration is not only due to intentional braking, but also due to the resistances mentioned above, so it is necessary to distinguish between deceleration due to braking and regeneration. Therefore, the estimated speed v e s t t after deceleration due to the resistance force alone is shown in Equation (4), and the equation for the power consumption P d e c t during deceleration using this is shown in Equation (5). (t − 1) in Equation (4) represents time one step before discrete time in analysis.
v e s t t = v t 1 1 m f a i r t 1 + f f r i c t i o n t 1
P d e c t = f a i r t + f f r i c t i o n t v t β 1 2 m v e s t t 2 v t 2 ,    ( v e s t > v ) f a i r t + f f r i c t i o n t v t 1 2 m v t 2 v e s t t 2 ,    ( v e s t v )
When v e s t > v , the estimated speed v e s t is greater than the actual driving speed v , so intentional braking causes the speed to decrease to v . Under this condition, energy is regenerated, so the regeneration efficiency β is calculated as the change in kinetic energy. On the other hand, when v e s t v , energy is input, but it is not enough to compensate for the energy required to maintain a constant speed, so deceleration occurs. Under this condition, the brakes are not used, so there is no regeneration.
The results of the power consumption calculations in the WLTC mode using these theoretical model formulas were compared with the power consumption characteristics of actual EV specifications to extract the parameters k , μ , and β by fitting. Table 2 shows the specifications of the vehicle models used in the calculations. Although it is possible to use many vehicle models, a limited number of common vehicle models were used to extract the basic characteristics.
The electricity consumption of a real EV was calculated by multiplying the driving distance per charge and the amount of installed battery by the driving distance in WLTC mode. The vehicle weight was set to 100 kg plus 15% of the payload, as in the evaluation of the WLTC mode of a real EV [38]. Table 3 shows the representative values extracted by fitting the three parameters together for each vehicle type (size). Although the values differ for each size, overall there is no significant difference. The following infrastructure analysis can be performed for each vehicle type, but in order to clarify the general trends of different EVs, it is decided to use the average values of the analysis results are decided for the three vehicle types, k = 0.51 , μ = 0.008 , and β = 0.74 . The data source for the specifications of the EVs is listed in Supplementary Materials Table S1.
Although the EV model used in this simulator is simplified, it captures the essential physical elements. While more complex models could be incorporated, such refinements would not significantly alter the conclusions at this stage due to the dominant uncertainties in the OWPT system characteristics. In future studies, the simulator can be extended to include more advanced physical and control models.

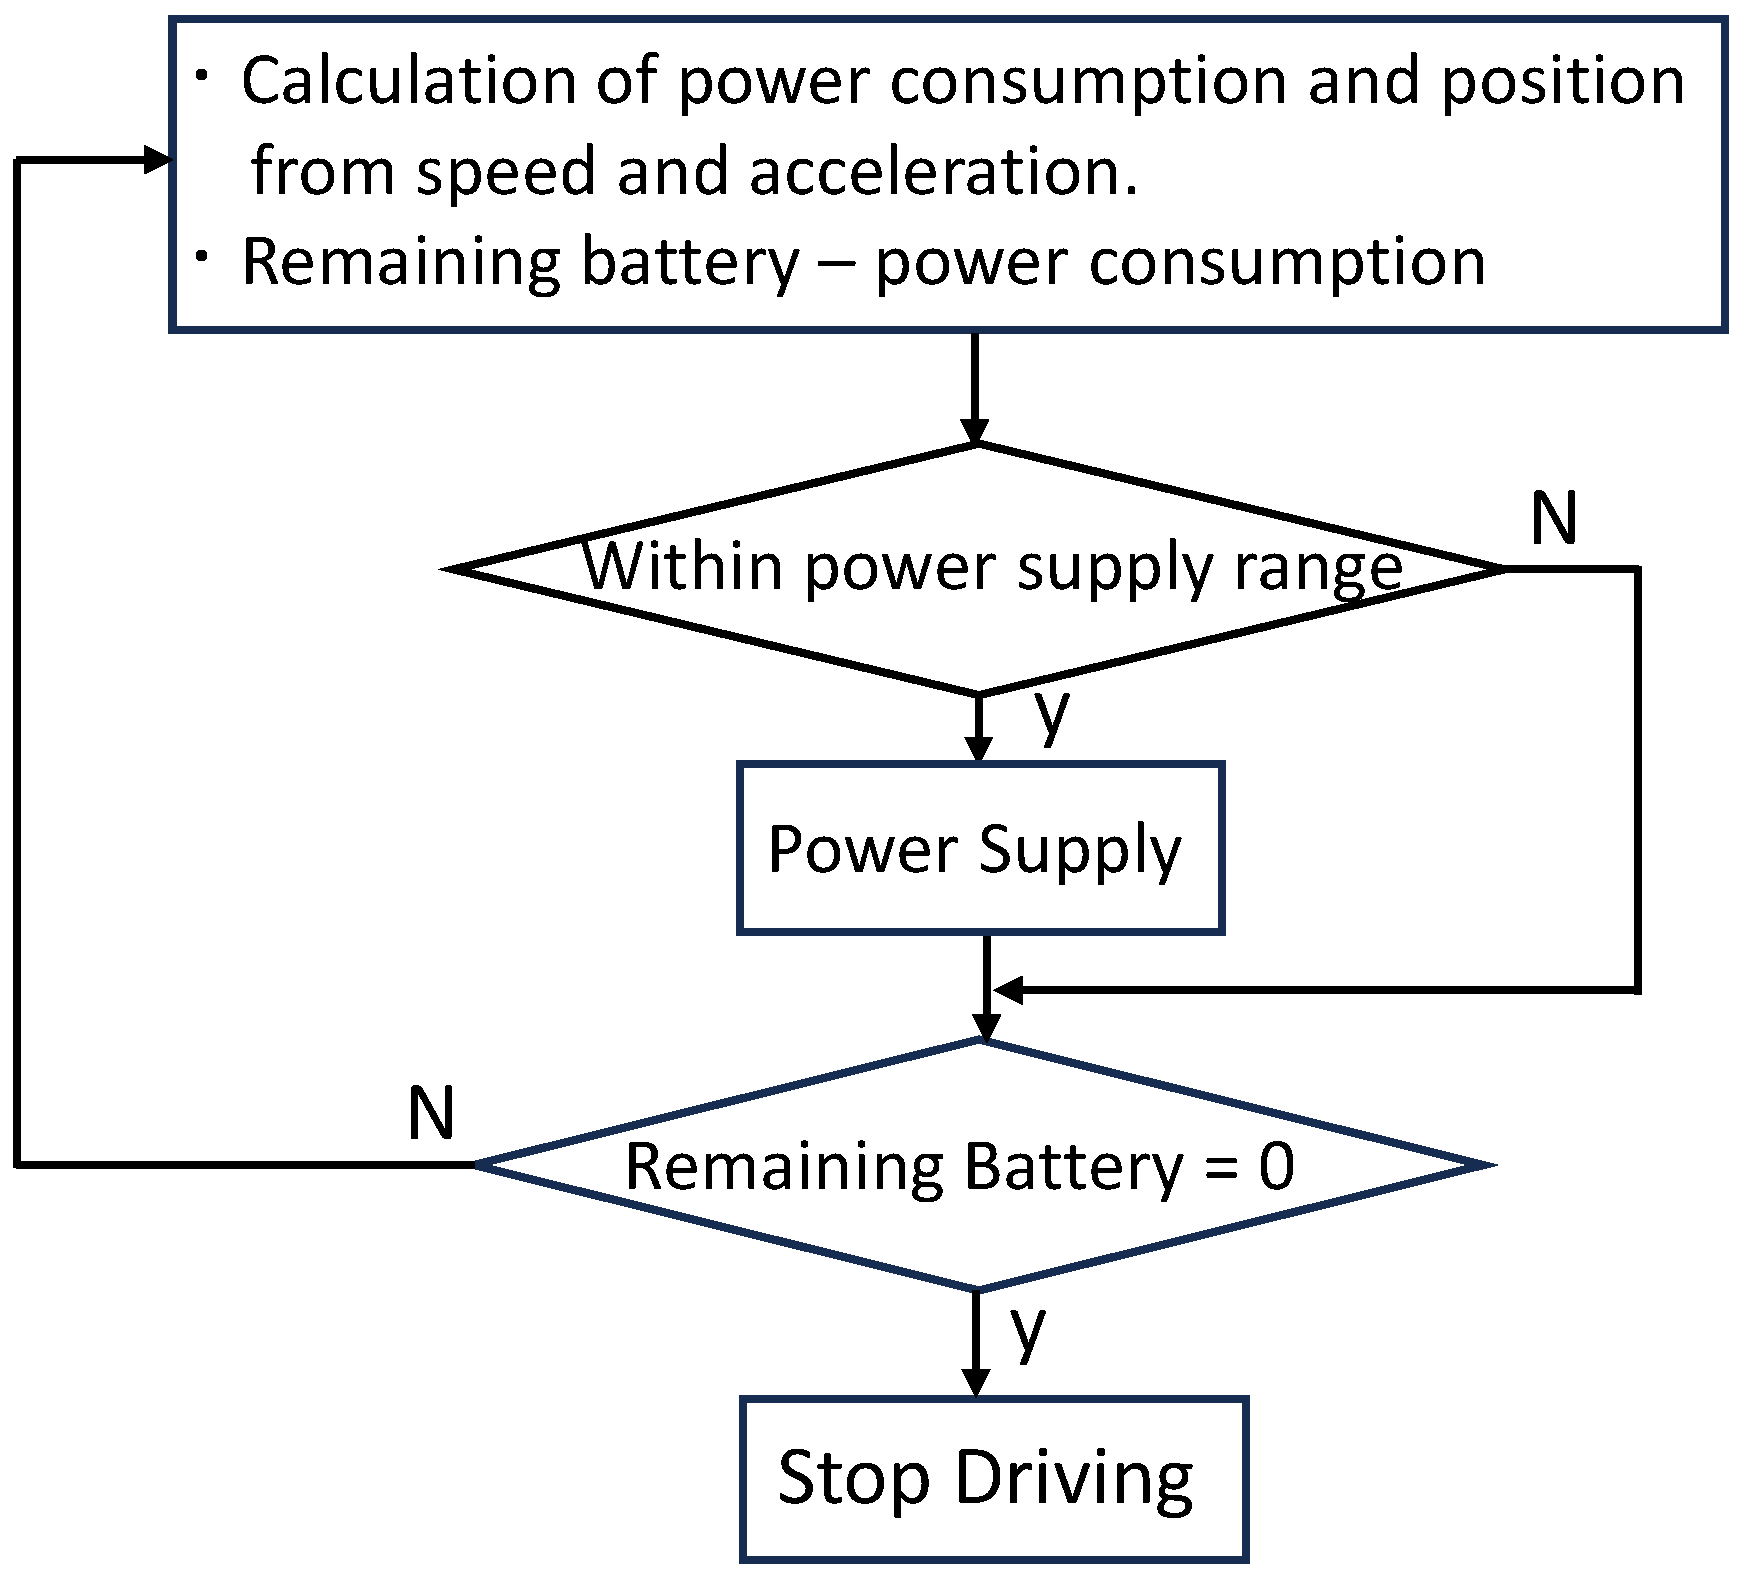
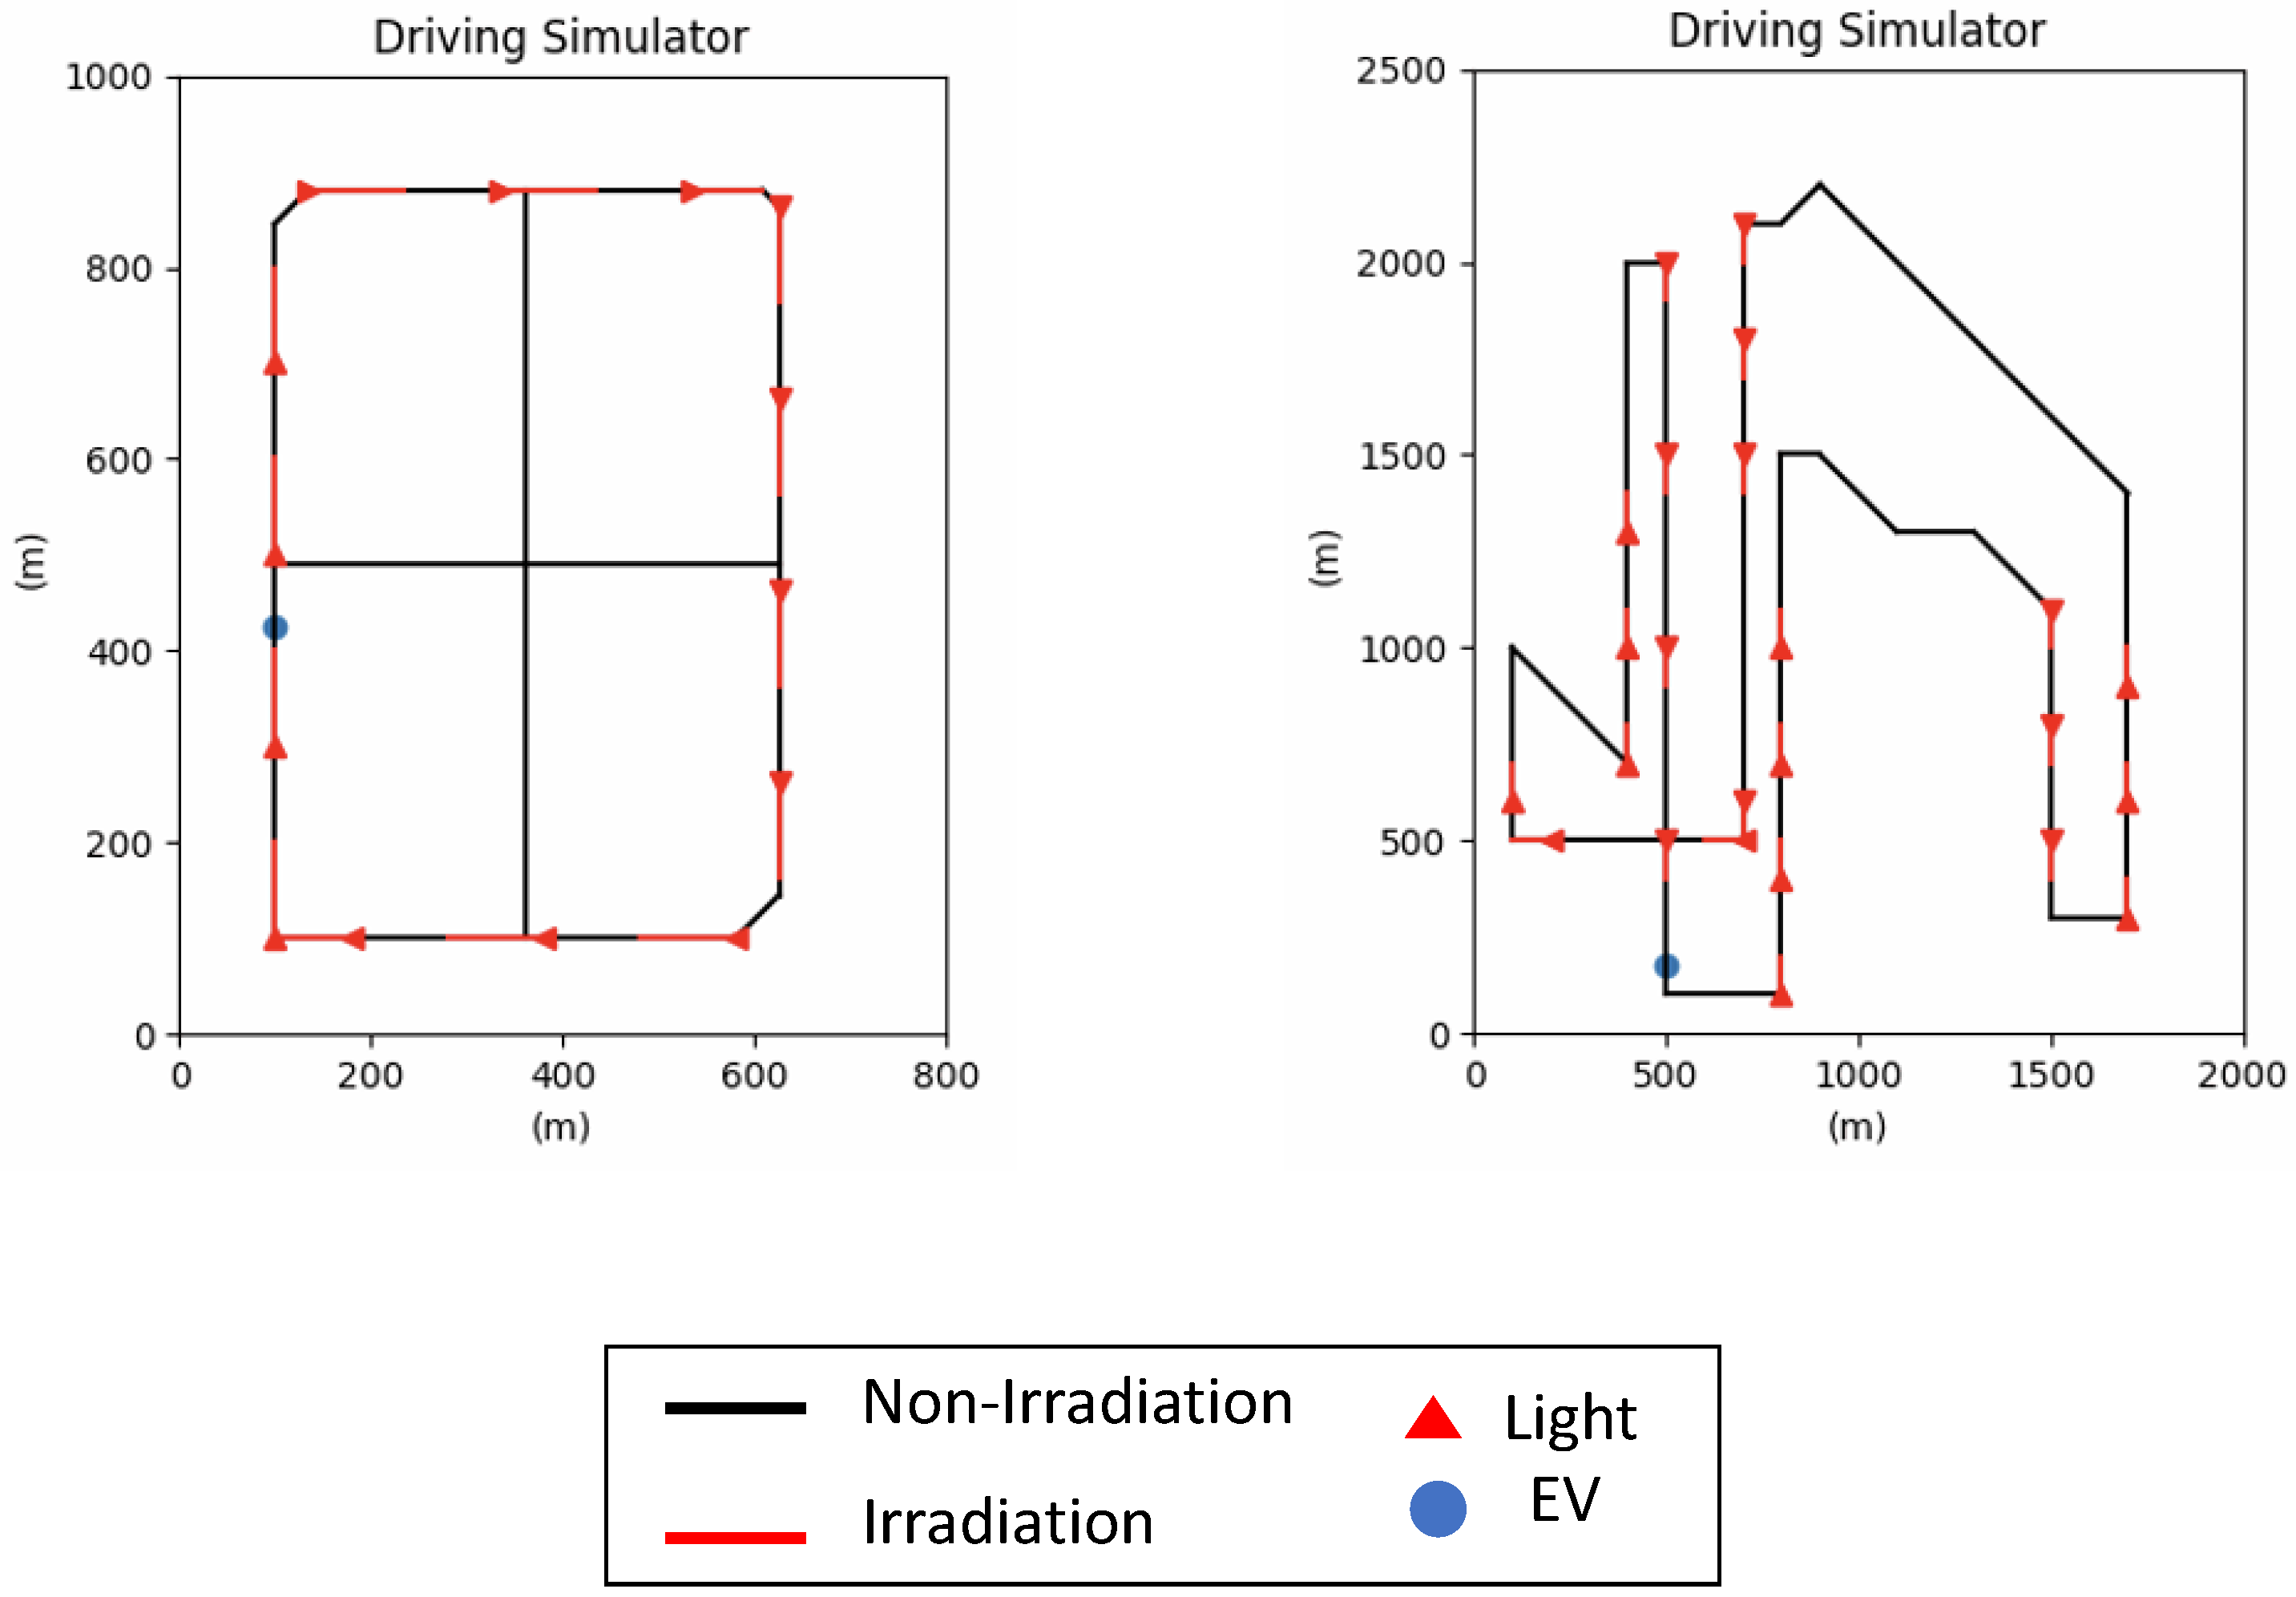
3.2. Construction of Infrastructure Simulator

When designing the infrastructure configuration for D-OWPT, it is necessary to build a numerical simulator to capture the installation location and number of light sources, as well as power transmission issues. Therefore, in this study, a simulator was built that can analyze the remaining battery charge and battery capacity of the EV and the driving distance of the EV for any road shape, any driving speed pattern, and any light source arrangement.
Figure 1 shows the calculation flow of the simulation. In the simulator, the installation position and the achievable power transmission distance of the beam can be specified as light source equipment information, the speed and acceleration for each position of the EV as driving information, and the length of road elements and corners as road information can be arbitrarily specified, and these can be managed by the simulator as main data lists. At present, since a computer aided design (CAD) tool has not been developed to input the necessary data into the simulator, road shapes, driving patterns, light source installation positions, and so on are manually prepared in list format. Based on this information, the power consumption and remaining battery charge, the position and driving distance of the EV are analyzed based on the theoretical formula and the parameters related to the power consumption characteristics prepared in the previous section. Speed and acceleration are evaluated at discrete time intervals, set to 1 s in this study. If the calculated position is within the OWPT range, the power is applied, and the EV is assumed to drive until the remaining battery charge reaches 0.
In the case of WLTC mode analysis, speed and acceleration are given as the specification of the WLTC mode, so the actual road shape is meaningless. This means that since the driving pattern according to road shape is unknown, the detailed mechanism of power consumption in WLTC mode is unclear. However, we believe that the impact on the analysis accuracy in this initial simulation is sufficiently small. On the other hand, in order to analyze more generalized driving trajectories, a simulator has been created that allows the road shape to be handled and displayed as well. Examples of the prepared trajectories are shown in Figure 2. The path on the left is close to a rectangle, but the corners are specified as curved elements. A straight path is also prepared on the inside, but the light sources indicated by the red markers are an example where they are installed only on the surrounding path. The course on the right is a complex course that imitates a race course. In this way, a variety of course shapes can be prepared. However, when analyzing the actual power consumption, etc., the speed and acceleration information set at each position is used.

4. Simulation Result

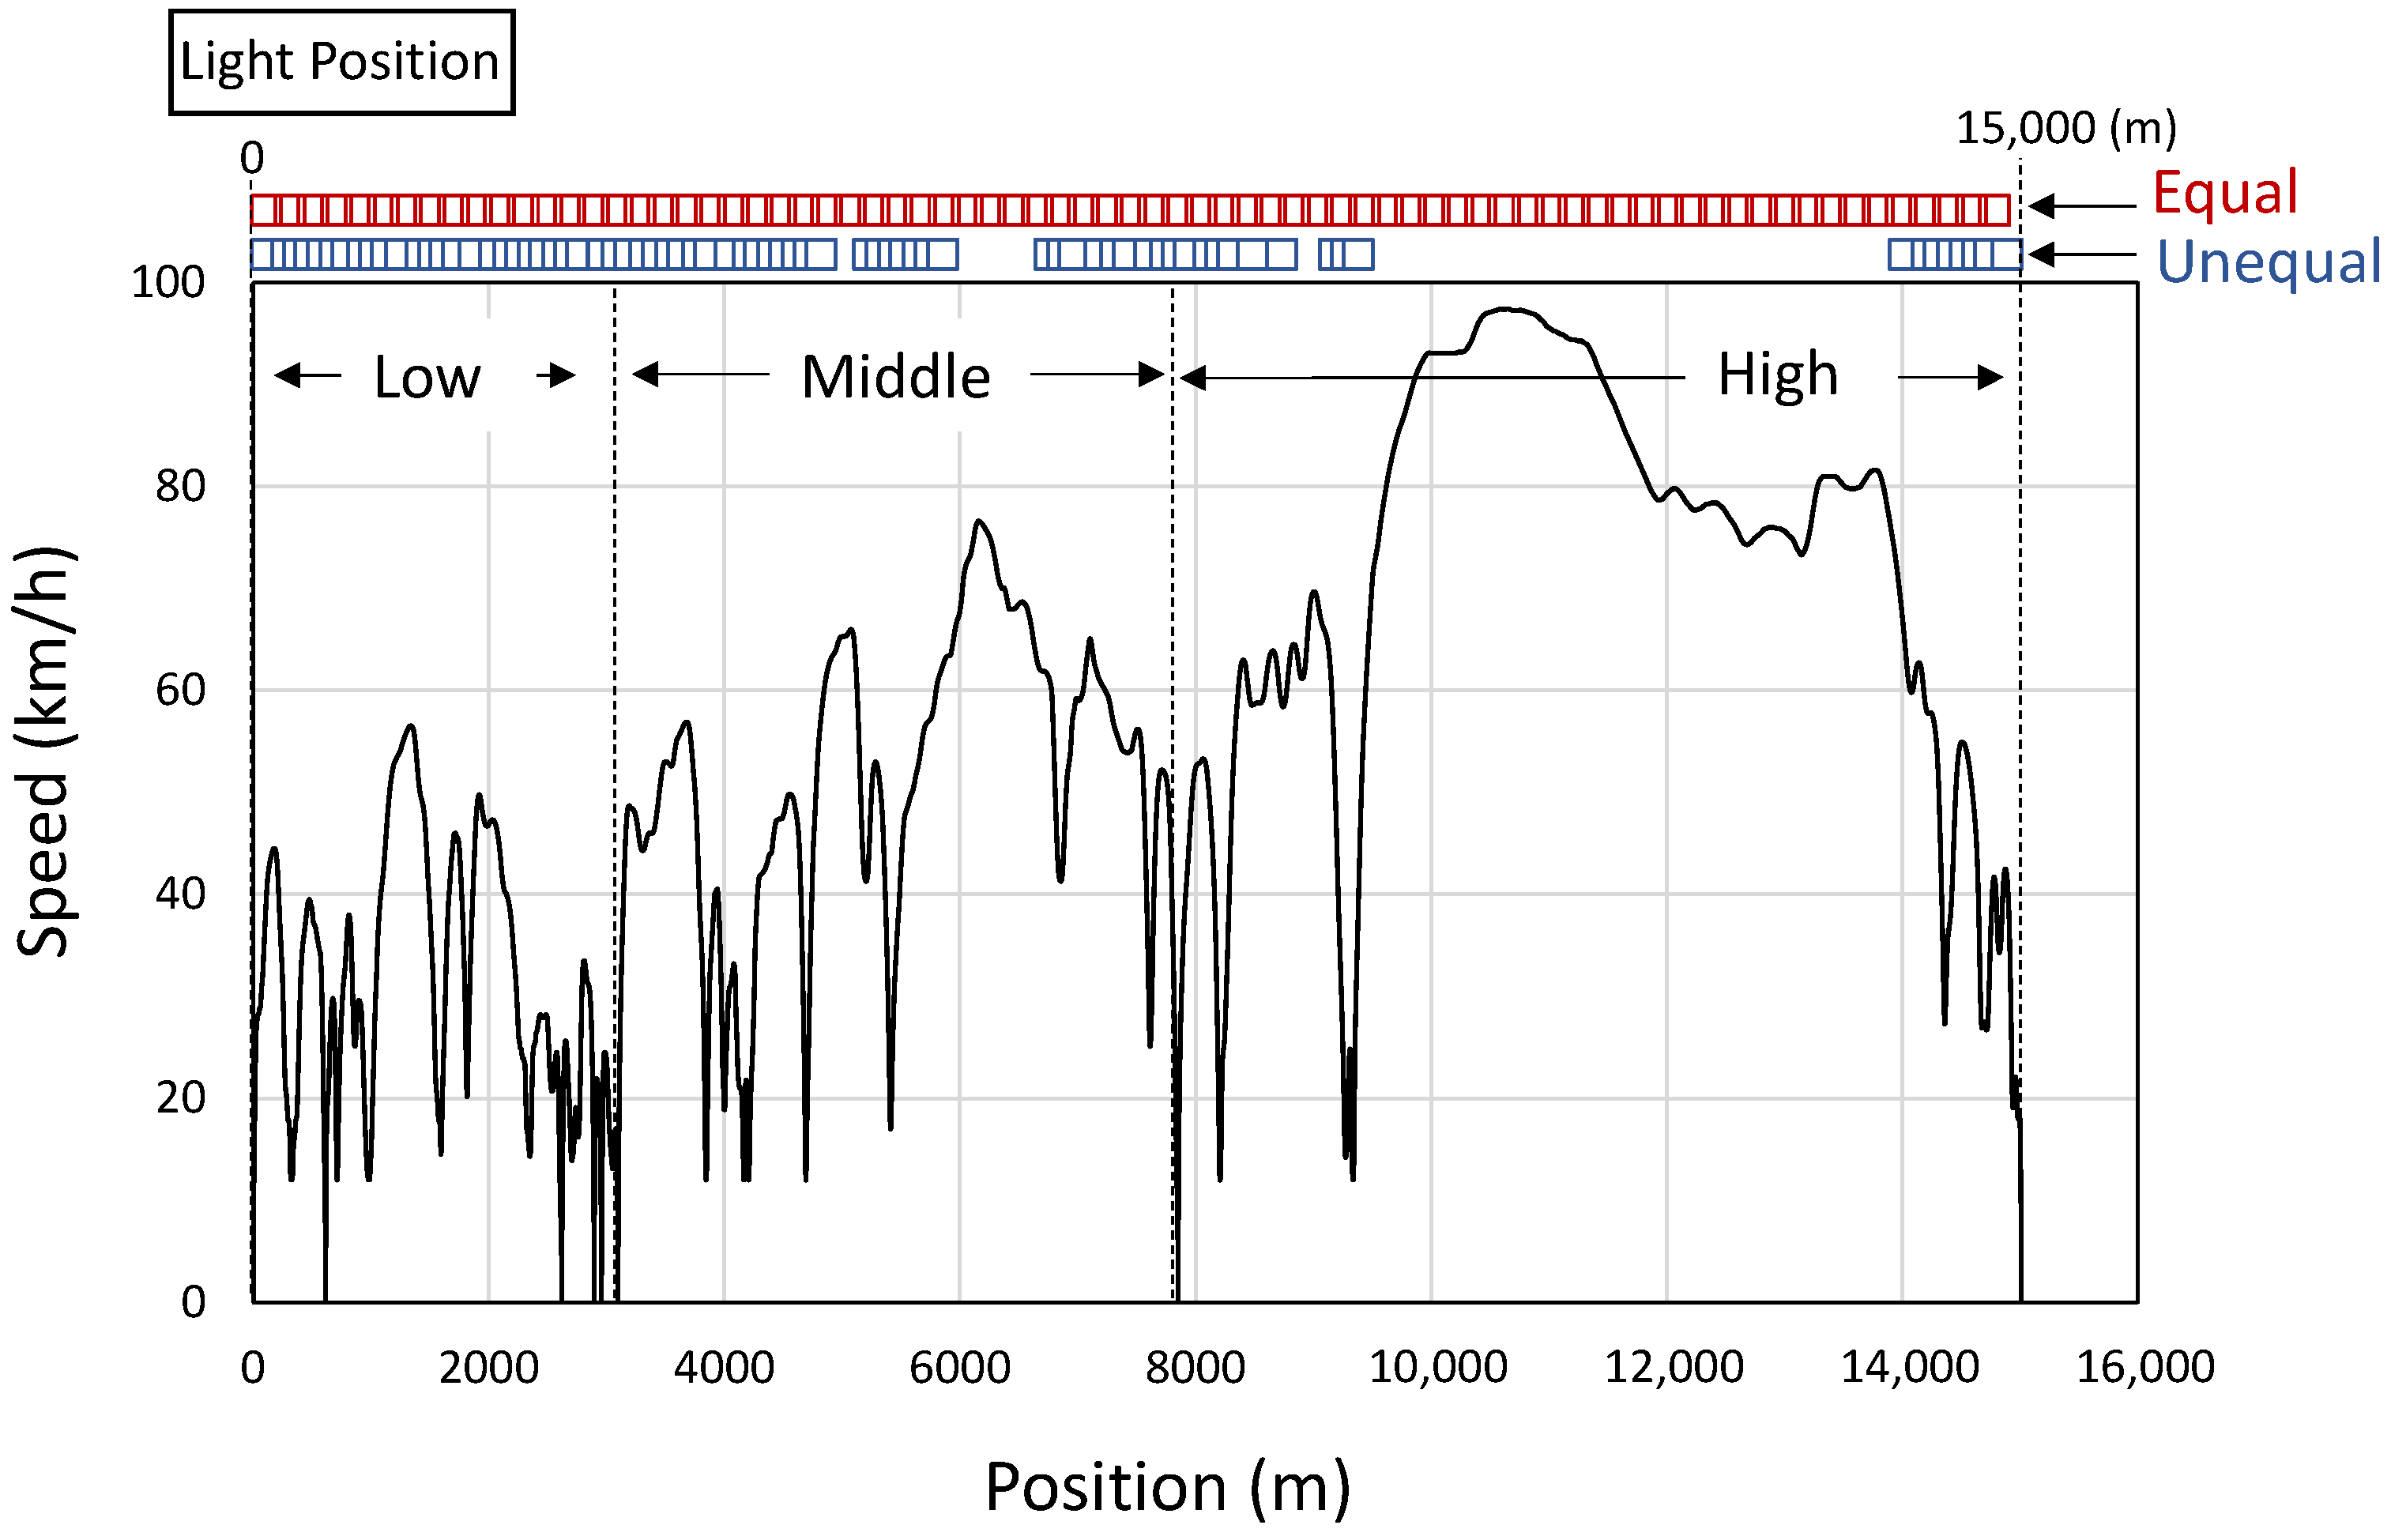
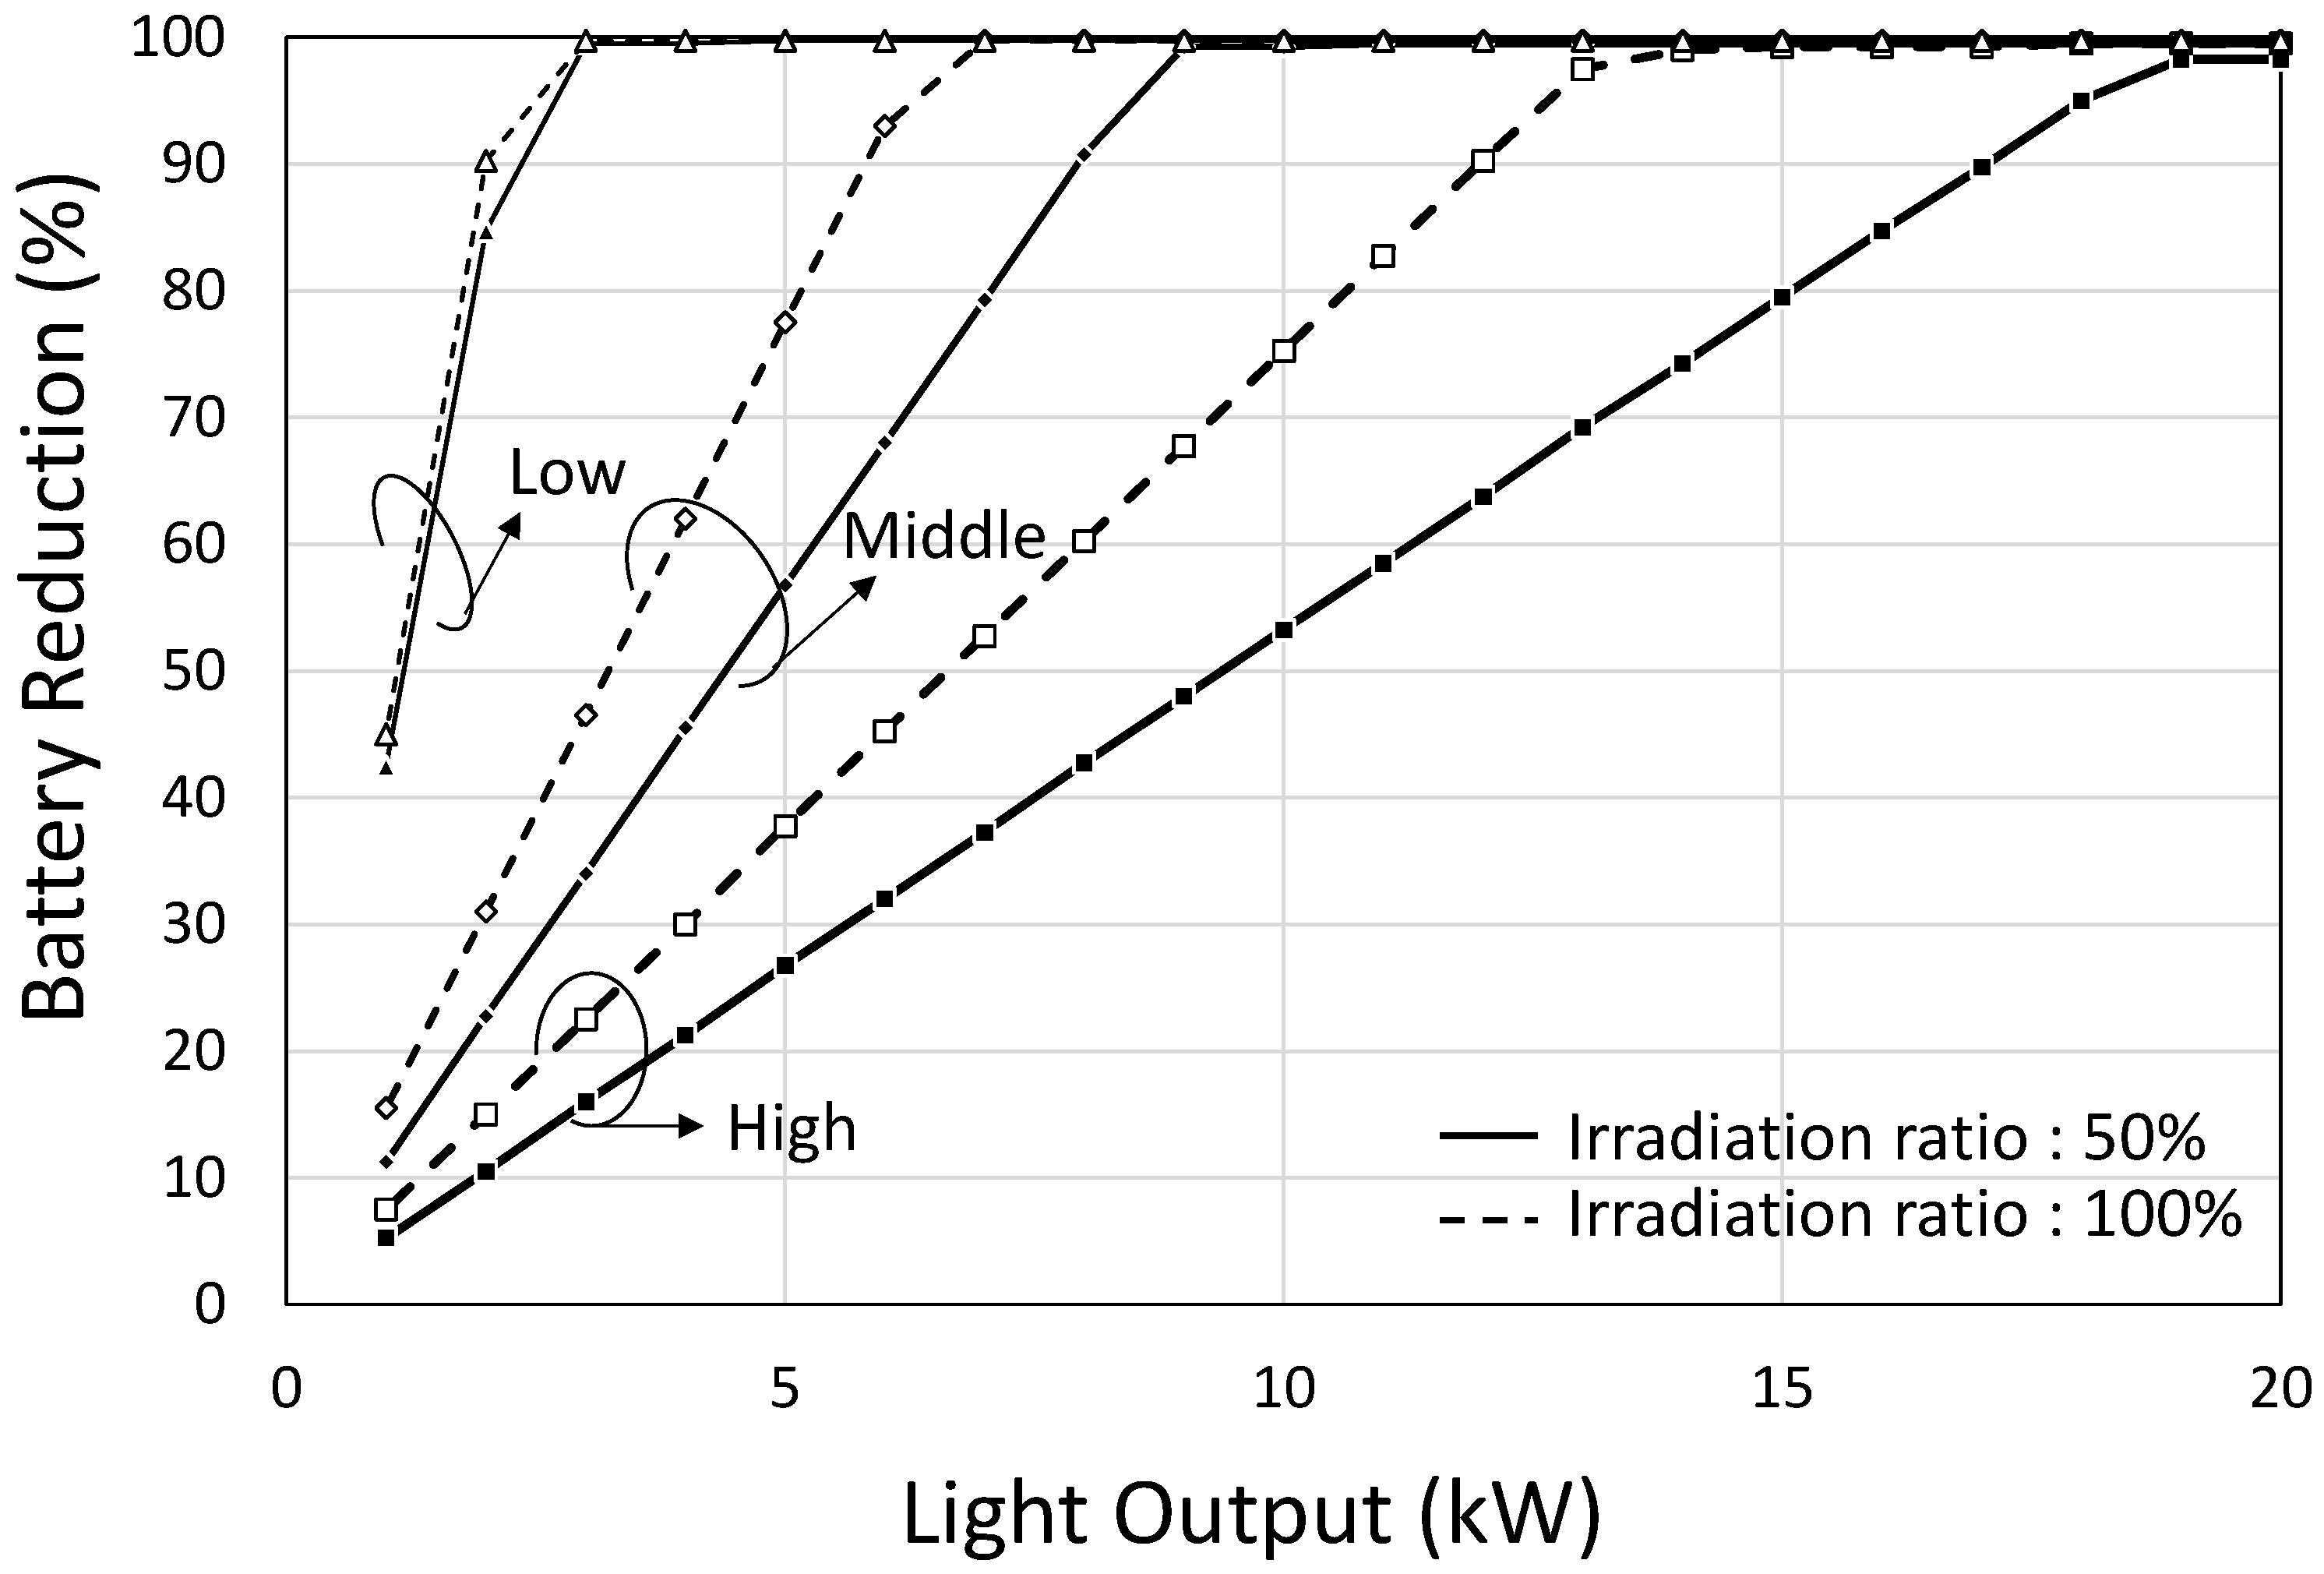
4.1. Effective Light Source Position

By using this simulator, the necessary conditions for D-OWPT can be understood, such as the distance between light sources, the ratio of light irradiation to the length of the road, and the light output. Of course, the necessary conditions will vary depending on the road conditions and the actual driving conditions of the EVs. In this study, typical operations were analyzed assuming average driving characteristics. On the other hand, based on the analysis of the typical operation characteristics, it is possible to consider a more appropriate design policy for the D-OWPT infrastructure.
To consider an effective light source placement method, two placement methods were compared. Figure 3 shows the driving pattern of the WLTC mode, where the horizontal axis represents the distance traveled from the start position of the drive and the vertical axis represents the speed. The upper part of the graph shows the placement positions of the light sources with square markers. Two placement methods are shown, with the upper square markers showing the positions where the light sources are placed at equal intervals of 200 m, and the lower square marker showing the condition where the light sources are placed in the low-speed driving area to extend the power supply time. It is not made clear whether the low-speed area set in the WLTC mode is based on corners and curves or is a low-speed area due to accidental conditions, but in this analysis, it is assumed to be a place where all vehicles drive at low speeds, such as corners and curves.
The simulation conditions for EVs and OWPT were set to a solar cell conversion efficiency of 70%, which is close to the maximum in reported cases, and a light source power of 14 kW, which allows the assumption of continuous driving in WLTC mode. The distance over which the light source can supply power was set to 100 m, with an average of one light source installed every 200 m. The WLTC mode was used for the driving pattern, which is close to the actual driving pattern of an EV. The WLTC mode is composed of driving conditions divided into three categories in the direction of driving distance on the graph: urban (low driving speed), suburban (medium), and highway (high), and the amount of power consumption is different for each category.
Although it is expected that all of these parameters and conditions may vary widely in actual application, they have been set as parameters that can be realistically applied based on information about EVs and OWPT for initial discussion. However, the number of installed light sources, which is extremely important when considering the configuration of the light source infrastructure, has been set based on the following considerations.
To provide sufficient power for D-OWPT travel, it is necessary to either increase the light source output or increase the number of light sources. Increasing the light source output will reduce the number of light sources, but similar to high-speed battery charging, it will increase the load on the power receiving circuit and increase the amount of heat generated per unit time, making heat dissipation more difficult. In addition, it becomes necessary to increase the battery capacity in order to travel in areas where there is no power supply. On the other hand, by increasing the number of light sources, it is possible to suppress the light source output, and thus the battery capacity, but increasing the number of light sources makes it difficult to prepare them and also makes it difficult to travel in sections where light sources are not installed. For these reasons, a policy is needed to suppress excessive increases in light source output and the number of light sources.
The light irradiation section ratio is defined as the ratio of the light irradiated length to the non-irradiated length on the roadway, and it is appropriate for this value to average several tens of percent. Although it is possible to perform analysis with changes in this light irradiation section ratio, the study was conducted with an average light irradiation section ratio of 50% was proceeded as a representative value.
The analyzed light source position is almost optimal for assumed OWPT conditions and WLTC mode. However, individual EVs will drive in a different driving pattern similar to the WLTC mode. Therefore, the WLTC mode in this study was analyzed assuming a driving pattern that occurs on average on a given road. The analyzed infrastructure of the light sources is set based on this typical driving pattern. In the future, it will be important to adjust the infrastructure design to account for deviations from typical driving patterns.
Figure 4 shows the difference in remaining battery capacity versus driving distance in one cycle of WLTC mode for the above two arrangement methods. In addition to equal and unequal intervals, the case without light sources is also shown. Without light sources, power is not supplied during driving, so the initial charge amount stops at about 15,000 m in the analysis conditions of Figure 3.
On the other hand, in the two cases with light sources, the battery does not run out within the range of this graph, and continuous driving is possible. However, the change in the remaining battery capacity is different depending on the light source arrangement method, even with the same light source output. Compared to the same interval conditions, the arrangement method that maximizes the power supply time, which allows power to be supplied during low-speed driving, has a greater increase in the remaining battery capacity after one cycle. Therefore, it is advantageous to install the light sources in the slower speed sections, because it allows power to be received for a longer period of time with the same light source output. This shows that an appropriate arrangement method can enable effective power supply and suppress the required light source power or enable the use of solar cells with less than the highest efficiency level, or can be applied to EVs with higher power consumption.
From the above analysis, it was confirmed that installing light sources for D-OWPT in sections where vehicles travel at low speeds would facilitate infrastructure development.
The WLTC mode takes into account the average driving modes of urban areas, suburban areas, and highways. In fact, Figure 3 shows the driving areas of the WLTC mode: urban areas = low speed, suburban areas = medium speed, and highways = high speed. Figure 4 shows the power supplied by OWPT across the full WLTC mode, which incorporates urban, suburban, and highway driving conditions.

4.2. Continuous Driving Condition

The ideal scenario for D-OWPT is one that allows continuous driving without running out of charge. The battery capacity for continuous driving only needs to be enough to drive through the non-irradiated sections, so ideally the ratio of light irradiated sections would be 100% and the power consumption during driving would be 0 if it is possible to compensate for the power consumption during power supply. However, a ratio of light irradiated sections of 100% would be very burdensome because of the cost of infrastructure development due to the number of light sources, and it would be impossible to use if the infrastructure development is carried out sequentially over time.
Therefore, the light source output was changed, and an analysis was performed to determine under which conditions continuous driving would be possible. Figure 5 shows the analysis results for each driving pattern in WLTC mode, with the light irradiated section ratio at 50 and 100%. The analysis was performed to divide the WLTC mode into three driving areas. In actual vehicles, on average, many vehicles drive in all areas of the WLTC mode, but there are also individual vehicles that are used in ways that differ significantly from the average WLTC mode.
The light sources were installed at intervals of an average distance of 200 m for each driving pattern and were unevenly spaced to maximize the amount of power supplied. The horizontal axis represents the light source power, and the vertical axis represents the battery reduction rate, which is the percentage of battery capacity that can be reduced from the current battery capacity installed in the EV to allow the same driving distance as a current EV through OWPT while driving. Note that in this analysis, the battery energy density was set to 200 kW/h and the weight change due to the effect of battery reduction was taken into account.
As can be seen from the graph, the battery reduction rate increases as the light source power increases, and continuous driving is reached when the battery reduction rate saturates at 100%. The light source output required for continuous driving differs for the three driving conditions in WLTC mode, but it can be seen that, under the condition of a 50% illumination section ratio, continuous driving is achieved with 4 kW in Low mode, which has the lowest power consumption, and 20 kW in High mode, which has the highest power consumption. In addition, under the condition of a 100% illumination section ratio, the light source output required for continuous driving is reduced to 15 kW even in high-speed mode, although this configuration may increase the number of light sources and deteriorates the maintainability.
It is noted that Figure 4 presents the result for the average WLTC driving pattern integrating all zones, while Figure 5 provides a detailed analysis separated by urban, suburban, and highway sections. The required conditions for continuous driving shown in Figure 4 are consistent with the averaged outputs derived from Figure 5. If the battery reduction rate in the average WLTC mode is required, it can be calculated using Figure 4. Alternatively, the weighted average of each range can be considered for the graph in Figure 5.
Considering the development of an actual light source infrastructure, even if a light source capable of continuous driving is prepared, it is believed that a battery capacity of several percent to 10% of that of existing EVs will be necessary, taking into account cases where it is difficult to install a suitable light source and driving in non-irradiated sections. With a battery capacity of 10%, it will be possible to drive a distance of about 50 km without OWPT.
On the other hand, this graph shows that even if the light source output is low due to light source development issues, it is possible to achieve the same driving distance as existing EVs while reducing the amount of battery power required. For example, in urban areas (low), if a light source output of 1 kW can be prepared, the same driving distance as existing EVs can be achieved even if the EV’s battery power is reduced to 50% of the current level. With the gradual development of the light source infrastructure, even if the light source output, which is directly related to the cost of the light source, is reduced, it will be possible to use it in a similar way to conventional EVs while significantly reducing the amount of battery amount required. Although there is no advantage in unlimited continuous driving, it is important as a prerequisite for a gradual transition to D-OWPT.
This research characterizes and clarifies the optimization guidelines of the D-OWPT have been performed. In addition, the D-OWPT infrastructure design problem can be conceptually viewed as a continuous-space extension of the EV Charging Location Problem (CLP). The simulator used in this study inherently reflects variables analogous to those in CLP research, such as the ratio of irradiated to non-irradiated area and the trade-off between beam intensity and source placement density. This link opens the possibility of applying established optimization techniques from the CLP literature to the dynamic planning of optical charging infrastructures in future work [39].

5. Conclusions

This paper presented a foundational study on D-OWPT infrastructure and clarified key requirements for its implementation. First, a simulator was constructed to investigate the infrastructure configuration, which numerically modeled the power consumption characteristics of current EVs, and also enabled the analysis of the amount of power supply and remaining battery capacity for any driving pattern and any light source arrangement. Using this simulator, the position of the light source arrangement was investigated, and it was shown that in order to maximize the amount of power supplied, an uneven light source arrangement, in which light sources are located in low-speed areas, limits the number of light sources and makes dynamic power transmission effective. In addition, a light source power of several kW is required for continuous driving only in urban areas, and about 20 kW is required for highway driving under the condition of 50% irradiation section ratio. Although this study does not encompass all EV types and driving scenarios, it identifies representative conditions that validate the feasibility of D-OWPT. More specifically, it is necessary to concretely determine the conditions of actual driving routes and the configuration of actual EVs compatible with OWPT based on this result. In addition, multiple vehicles, multiple lanes, oncoming lanes, etc. cannot be considered at present. However, it is believed that these conditions can be handled by installing a number of light sources within a few times the basic configuration. On the other hand, the safety of OWPT, which uses optical beams of several kW or more, is also an issue for social implementation, and it is believed that safety must be improved by appropriate control of the optical beam. Although large-scale demonstrations with commercial EVs have not yet been realized, the analysis in this study indicates that continuous driving is numerically feasible with laser outputs in the 10–20 kW range, values already achieved in industrial laser applications. D-OWPT may first see practical use in controlled environments such as campuses or dedicated lanes, serving as a foundation for broader deployment in the future.

Supplementary Materials

The following supporting information can be downloaded at: https://www.mdpi.com/article/10.3390/en18092264/s1, Table S1: source of commercial EVs.

Author Contributions

Conceptualization, T.M.; methodology, T.M. and M.K.; software, M.K.; validation, T.M. and M.K.; formal analysis, M.K.; investigation, T.M.; resources, T.M.; data curation, T.M. and M.K.; writing—original draft preparation, M.K.; writing—review and editing, T.M.; visualization, M.K.; supervision, T.M.; project administration, T.M.; funding acquisition, T.M. All authors have read and agreed to the published version of the manuscript.

Funding

This work was partially supported by the Tsurugi-Photonics Foundation (No. 20220502).

Data Availability Statement

The original contributions presented in the study are included in the article, further inquiries can be directed to the corresponding author.

Acknowledgments

We thank members of the T. Miyamoto Laboratory of Institute of Science Tokyo for discussion.

Conflicts of Interest

The authors declare no conflicts of interest.

Abbreviations

The following abbreviations are used in this manuscript:
EV(s)Electric vehicle(s)
OWPTOptical wireless power transmission
WPTWireless power transmission
D-OWPTDynamic optical wireless power transmission
DCDirect current, continuous current
ICEInternal combustion engine
LEDLight emitting diode
WLTCWorldwide harmonized light duty driving test cycle

Symbols

The following symbols are used in the equations in this manuscript:
t Time of driving
f a i r t Air resistance of EV during driving at time t
f f r i c t i o n t Frictional resistance of EV during driving at time t
P a c c t Power consumption of EV during driving at time t
v t Speed of EV at time t
a t Acceleration of EV at time t
m Weight of EV
g Gravitational acceleration
k Proportional constants for the air resistance and assumed as a constant
μ Proportional constants for the frictional resistance and assumed to be constant
β Regeneration efficiency during deceleration
v e s t t Estimated speed after deceleration at time t
P d e c t Power consumption during deceleration

References

  1. Costa, V.B.F.; Bitencourt, L.; Dias, B.H.; Soares, T.; Andrade, J.V.B.; Bonatto, B.D. Life cycle assessment comparison of electric and internal combustion vehicles: A review on the main challenges and opportunities. Renew. Sustain. Energy Rev. 2025, 208, 114988. [Google Scholar] [CrossRef]
  2. Zheng, Y.; Zhang, G.; Huan, Z.; Zhang, Y.; Yuan, G.; Li, Q.; Ding, G.; Lv, Z.; Ni, W.; Shao, Y.; et al. Wireless laser power transmission: Recent progress and future challenges. Space Sol. Power Wirel. Transm. 2024, 1, 17–26. [Google Scholar] [CrossRef]
  3. Miyamoto, T. Optical wireless power transmission using VCSELs. In Proceedings of the Semiconductor Lasers and Laser Dynamics VIII, Strasbourg, France, 22–26 April 2018; p. 1068204. [Google Scholar]
  4. He, T.; Yang, S.-H.; Zhang, H.-Y.; Zhao, C.-M.; Zhang, Y.-C.; Xu, P.; Ángel, M.M. High-power high-efficiency laser power transmission at 100 m using optimized multi-cell GaAs converter. Chin. Phys. Lett. 2014, 31, 104203. [Google Scholar] [CrossRef]
  5. Jin, K.; Zhou, W. Wireless laser power transmission: A review of recent progress. IEEE Trans. Power Electron. 2018, 34, 3842–3859. [Google Scholar] [CrossRef]
  6. Kawakami, M.; Suda, Y.; Miyamoto, T. Effective placement methods of light source infrastructure for dynamic EV charging using optical wireless power transmission. In Proceedings of the 6th Optical Wireless and Fiber Power Transmission Conference (OWPT2024), Yokohama, Japan, 22–26 April 2024. OWPT8-04. [Google Scholar]
  7. Ahmad, M.S.B.; Pesyridis, A.; Sphicas, P.; Andwari, A.M.; Gharehghani, A.; Vaglieco, B.M. Electric vehicle modelling for future technology and market penetration analysis. Front. Mech. Eng. 2022, 8, 896547. [Google Scholar]
  8. Kosai, S.; Takata, U.; Yamasue, E. Natural resource use of a traction lithium-ion battery production based on land disturbances through mining activities. J. Clean. Prod. 2021, 280, 124871. [Google Scholar] [CrossRef]
  9. Orangi, S.; Manjong, N.; Clos, D.P.; Usai, L.; Burheim, O.S.; Strømman, A.H. Historical and prospective lithium-ion battery cost trajectories from a bottom-up production modeling perspective. J. Energy Storage 2024, 76, 109800. [Google Scholar] [CrossRef]
  10. Ornes, S. How to recycle an EV battery. Proc. Natl. Acad. Sci. USA 2024, 121, e2400520121. [Google Scholar] [CrossRef]
  11. Zanoletti, A.; Carena, E.; Ferrara, C.; Bontempi, E. A review of lithium-ion battery recycling: Technologies, sustainability, and open issues. Batteries 2024, 10, 38. [Google Scholar] [CrossRef]
  12. Lin, Y.; Somervill, L.G.; Rashid, R.; Ledesma, R.I.; Kang, J.H.; Kavanagh, A.R.; Packard, J.S.; Scrudder, C.H.; Durgin, A.L.; Yamakov, V.I.; et al. Toward 500 Wh Kg−1 in Specific Energy with Ultrahigh Areal Capacity All-Solid-State Lithium–Sulfur Batteries. Small 2025, 2409536. [Google Scholar] [CrossRef]
  13. Zhang, J.; Fu, J.; Lu, P.; Hu, G.; Xia, S.; Zhang, S.; Wang, Z.; Zhou, Z.; Yan, W.; Xia, W.; et al. Challenges and Strategies of Low-Pressure All-Solid-State Batteries. Adv. Mater. 2025, 37, 2413499. [Google Scholar] [CrossRef]
  14. Savari, G.F.; Sathik, M.J.; Raman, L.A.; El-Shahat, A.; Hasanien, H.M.; Almakhles, D.; Aleem, S.H.E.A.; Omar, A.I. Assessment of charging technologies, infrastructure and charging station recommendation schemes of electric vehicles: A review. Ain Shams Eng. J. 2023, 14, 101938. [Google Scholar] [CrossRef]
  15. Tajima, T.; Tanaka, H. Study of 450-kw Ultra Power Dynamic Charging System; SAE Technical Paper; SAE International: Warrendale, PA, USA, 2018. [Google Scholar]
  16. Mahesh, A.; Chokkalingam, B.; Mihet-Popa, L. Inductive wireless power transfer charging for electric vehicles—A review. IEEE Access 2021, 9, 137667–137713. [Google Scholar] [CrossRef]
  17. Li, S.; Liu, Z.; Zhao, H.; Zhu, L.; Shuai, C.; Chen, Z. Wireless power transfer by electric field resonance and its application in dynamic charging. IEEE Trans. Ind. Electron. 2016, 63, 6602–6612. [Google Scholar] [CrossRef]
  18. Shinohara, N.; Kubo, Y.; Tonomura, H. Wireless charging for electric vehicle with microwaves. In Proceedings of the 2013 3rd International Electric Drives Production Conference (EDPC), Nuremberg, Germany, 29–30 October 2013; pp. 1–4. [Google Scholar]
  19. Trivino, A.; González-González, J.M.; Aguado, J.A. Wireless power transfer technologies applied to electric vehicles: A review. Energies 2021, 14, 1547. [Google Scholar] [CrossRef]
  20. Electreon. Findings from the World’s First Public Wireless Electric Road for Heavy-Duty Commercial Vehicles. Available online: https://electreon.com/articles/worlds-first-public-wireless-electric-road (accessed on 27 March 2025).
  21. eHighway.SH. Feldversuch eHighway Schleswig-Holstein. Available online: https://ehighway-sh.de/en/ (accessed on 27 March 2025).
  22. Taisei Corporation. T-iPower Road. Available online: https://www.taisei.co.jp/about_us/wn/2022/220921_8962.html (accessed on 18 January 2025).
  23. Honma, Y.; Hasegawa, D.; Hata, K.; Oguchi, T. Locational Analysis of In-motion Wireless Power Transfer System for Long-distance Trips by Electric Vehicles: Optimal Locations and Economic Rationality in Japanese Expressway Network. Netw. Spat. Econ. 2024, 24, 261–290. [Google Scholar] [CrossRef]
  24. Putra, A.W.S.; Tanizawa, M.; Maruyama, T. Optical wireless power transmission using Si photovoltaic through air, water, and skin. IEEE Photonics Technol. Lett. 2018, 31, 157–160. [Google Scholar] [CrossRef]
  25. Sahai, A.; Graham, D. Optical wireless power transmission at long wavelengths. In Proceedings of the 2011 International Conference on Space Optical Systems and Applications (ICSOS), Santa Monica, CA, USA, 11–13 May 2011; pp. 164–170. [Google Scholar]
  26. Zhao, M.; Miyamoto, T. 1 W High Performance LED-Array Based Optical Wireless Power Transmission System for IoT Terminals. Photonics 2022, 9, 576. [Google Scholar] [CrossRef]
  27. Tai, Y.; Miyamoto, T. Experimental characterization of high tolerance to beam irradiation conditions of light beam power receiving module for optical wireless power transmission equipped with a fly-eye lens system. Energies 2022, 15, 7388. [Google Scholar] [CrossRef]
  28. Ouyang, J.; Che, Y.; Xu, J.; Wu, K. Throughput maximization for laser-powered UAV wireless communication systems. In Proceedings of the 2018 IEEE International Conference on Communications Workshops (ICC Workshops), Kansas City, MO, USA, 20–24 May 2018; pp. 1–6. [Google Scholar]
  29. Watamura, T.; Nagasaka, T.; Kikuchi, Y.; Miyamoto, T. Flying a Micro-Drone by Dynamic Charging for Vertical Direction Using Optical Wireless Power Transmission. Energies 2025, 18, 351. [Google Scholar] [CrossRef]
  30. Xu, H.; Du, B.; Shi, D.; Huang, X.; Hou, X. Laser wireless power transfer system design for lunar rover. Space Sol. Power Wirel. Transm. 2024, 1, 129–135. [Google Scholar] [CrossRef]
  31. Fafard, S.; Masson, D.P. 74.7% Efficient GaAs-based laser power converters at 808 nm at 150 K. Photonics 2022, 9, 579. [Google Scholar] [CrossRef]
  32. Helmers, H.; Lopez, E.; Höhn, O.; Lackner, D.; Schön, J.; Schauerte, M.; Schachtner, M.; Dimroth, F.; Bett, A.W. 68.9% efficient GaAs-based photonic power conversion enabled by photon recycling and optical resonance. Phys. Status Solidi (RRL)–Rapid Res. Lett. 2021, 15, 2100113. [Google Scholar] [CrossRef]
  33. Liu, Y.; Yang, G.; Zhao, Y.; Tang, S.; Lan, Y.; Zhao, Y.; Demir, A. 48 W continuous-wave output from a high-efficiency single emitter laser diode at 915 nm. IEEE Photonics Technol. Lett. 2022, 34, 1218–1221. [Google Scholar] [CrossRef]
  34. Rathod, Y.; Hughes, L. Simulating the charging of electric vehicles by laser. Procedia Comput. Sci. 2019, 155, 527–534. [Google Scholar] [CrossRef]
  35. Suda, Y.; Miyamoto, T. Estimation of CO2 Emissions of Dynamic Charging Electric Vehicle Using Optical Wireless Power Transmission. Rev. Laser Eng. 2023, 51, 163–170. Available online: https://ndlsearch.ndl.go.jp/books/R000000004-I032776452 (accessed on 27 April 2025).
  36. Chang, N.; Baek, D.; Hong, J. Power consumption characterization, modeling and estimation of electric vehicles. In Proceedings of the 2014 IEEE/ACM International Conference on Computer-Aided Design (ICCAD), San Jose, CA, USA, 2–6 November 2014; pp. 175–182. [Google Scholar]
  37. UNECE. WLTP-DHC-12-07. Available online: https://unece.org/dhc-12th-session (accessed on 18 March 2025).
  38. UNECE. UNECE Adopts More Accurate Fuel Efficiency and CO2 Test for New Cars (WLTP). Available online: https://unece.org/press/unece-adopts-more-accurate-fuel-efficiency-and-co2-test-new-cars-wltp (accessed on 18 March 2025).
  39. Quintana, L.C.; Climent, L.; Arbelaez, A. Iterated local search for the ebuses charging location problem. In Proceedings of the Parallel Problem Solving from Nature-PPSN XVII, Dortmund, Germany, 10–14 September 2022; pp. 338–351. [Google Scholar]
Figure 1. Calculation flow in simulator.
Energies 18 02264 g001
Figure 2. Example of course shape in simulator.
Energies 18 02264 g002
Figure 3. Driving pattern and light position.
Energies 18 02264 g003
Figure 4. Remaining battery capacity versus driving distance in one cycle of WLTC mode.
Energies 18 02264 g004
Figure 5. Light output condition when continuous driving.
Energies 18 02264 g005
Table 1. Summary of challenges and prospects of power supply to electric vehicles.
CategoryIssueDetails/CausesCountermeasures/Future Prospects
Battery EVWeight, Size, Resources, CostLow energy density results in heavy and bulky batteries, that require large amounts of mined resources and contribute to high costs.Recycling technologies (lithium, cobalt); development of high-density solid-state batteries.
ChargingCharging is manual and time-consuming. Fast charging reduces time but increases heat, equipment costs, and cable size.Improve fast and wireless charging technologies.
Driving RangeMore batteries add weight and cost, reducing efficiency. Current ranges may not meet future autonomous driving needs.Use solid-state batteries; dynamic charging while driving.
Dynamic Power Transmission EVPantograph MethodRequires vehicle-specific infrastructure, making full road coverage complex and costly.Trial projects underway; not suitable for all road types.
Magnetic/Electric Field MethodShort transmission distance and embedded infrastructure increase cost and maintenance requirements.Limited use due to structural and cost constraints.
Radio Wave MethodAllows longer range but suffers from beam loss and may interfere with other electronics.Requires efficiency gains and reduced infrastructure burden.
Optical Wireless Power Transmission (OWPT)Allows long range and interference-free transmission. Narrow beam reduces loss over distance.Up to 50% efficiency; suitable for multiple applications and helps reduce EV battery use and CO2 emissions.
Table 2. Specifications of EVs for extracting parameters.
SizeNameWeight (kg)Electricity
Consumption
(km/kWh)
MiniMitsubishi ekXEV10809.00
MiniNissan SAKURA10709.00
CompactHonda e15407.30
CompactNissan LEAF15208.05
StandardToyota bZ4X19207.83
StandardNissan ARIYA B619207.12
Table 3. Extracted parameters of each size.
Size k μ β
Mini0.400.0110.70
Compact0.580.0080.75
Standard0.580.0060.78
Averaged0.510.0080.74
Disclaimer/Publisher’s Note: The statements, opinions and data contained in all publications are solely those of the individual author(s) and contributor(s) and not of MDPI and/or the editor(s). MDPI and/or the editor(s) disclaim responsibility for any injury to people or property resulting from any ideas, methods, instructions or products referred to in the content.

