Research on a Quantitative Evaluation Method for Reservoir Damage Induced by Waterflooding Rate Sensitivity in Tight Oil Reservoirs
Abstract
:1. Introduction
2. Results Analysis of the Litho-Mineral Assemblage of the Target Reservoir
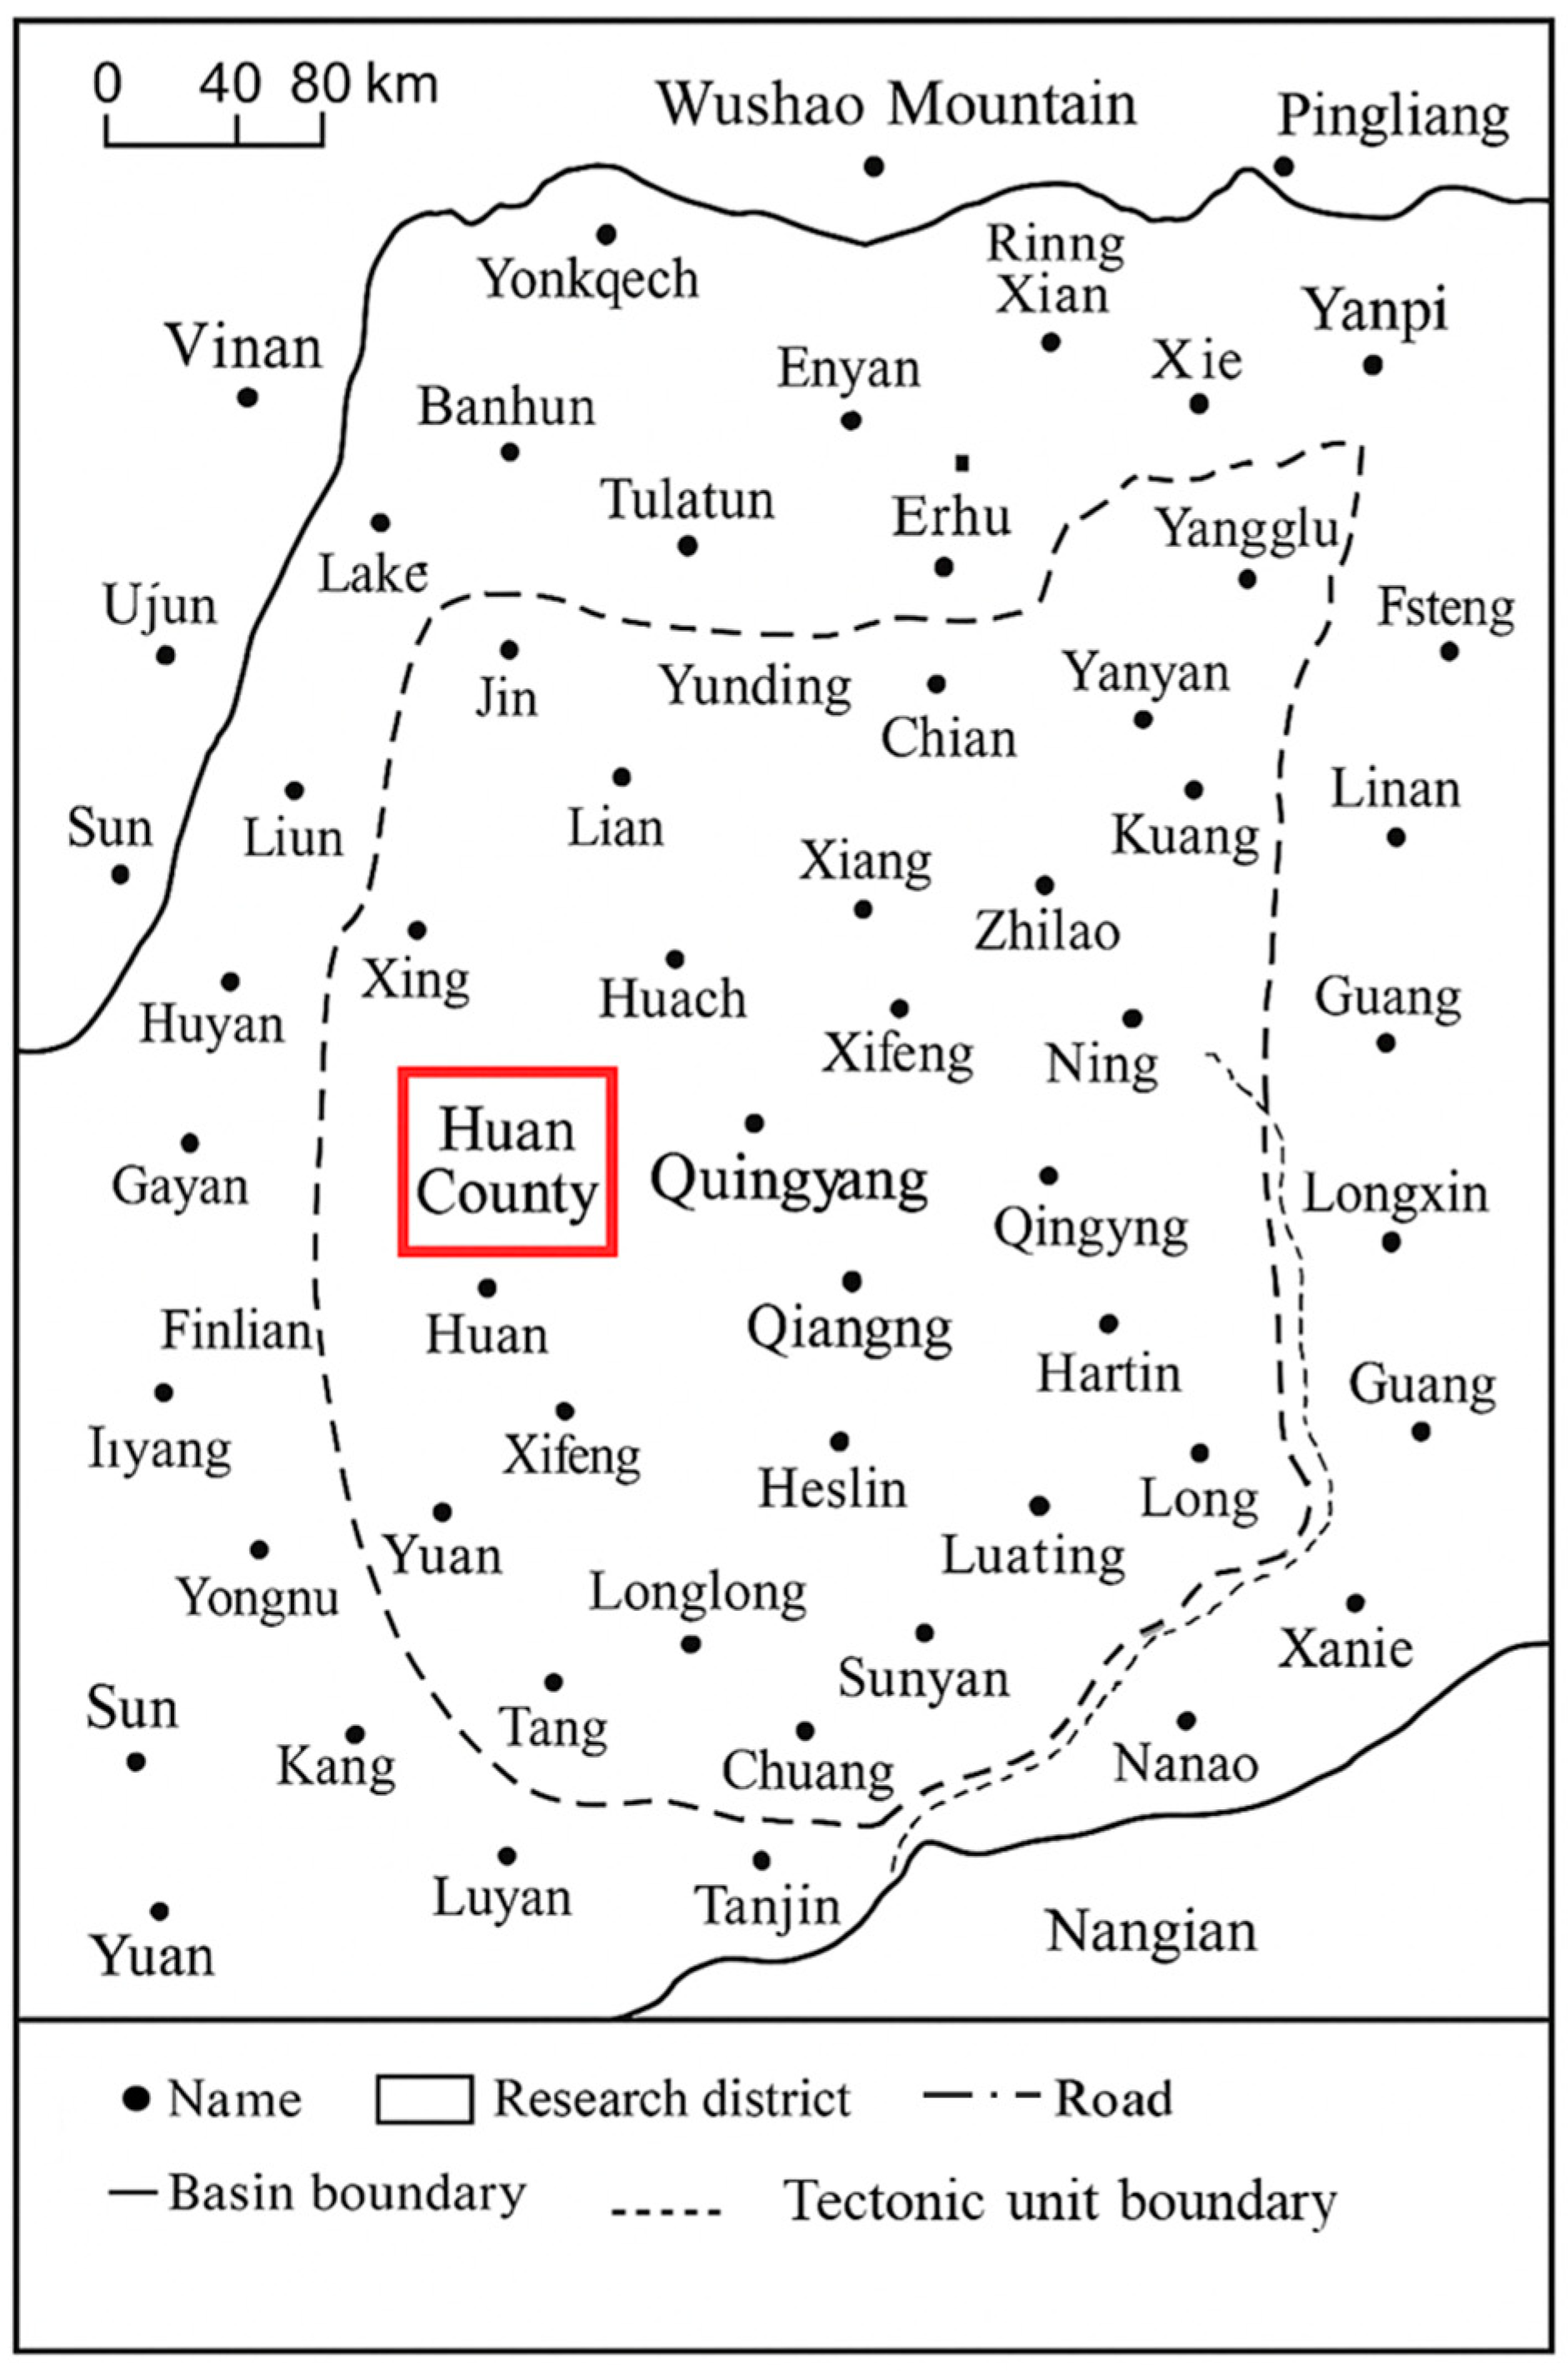
2.1. Geological Setting
2.2. Reservoir Characteristics
2.3. Analysis of Changes in Reservoir Pore–Throat Characteristics
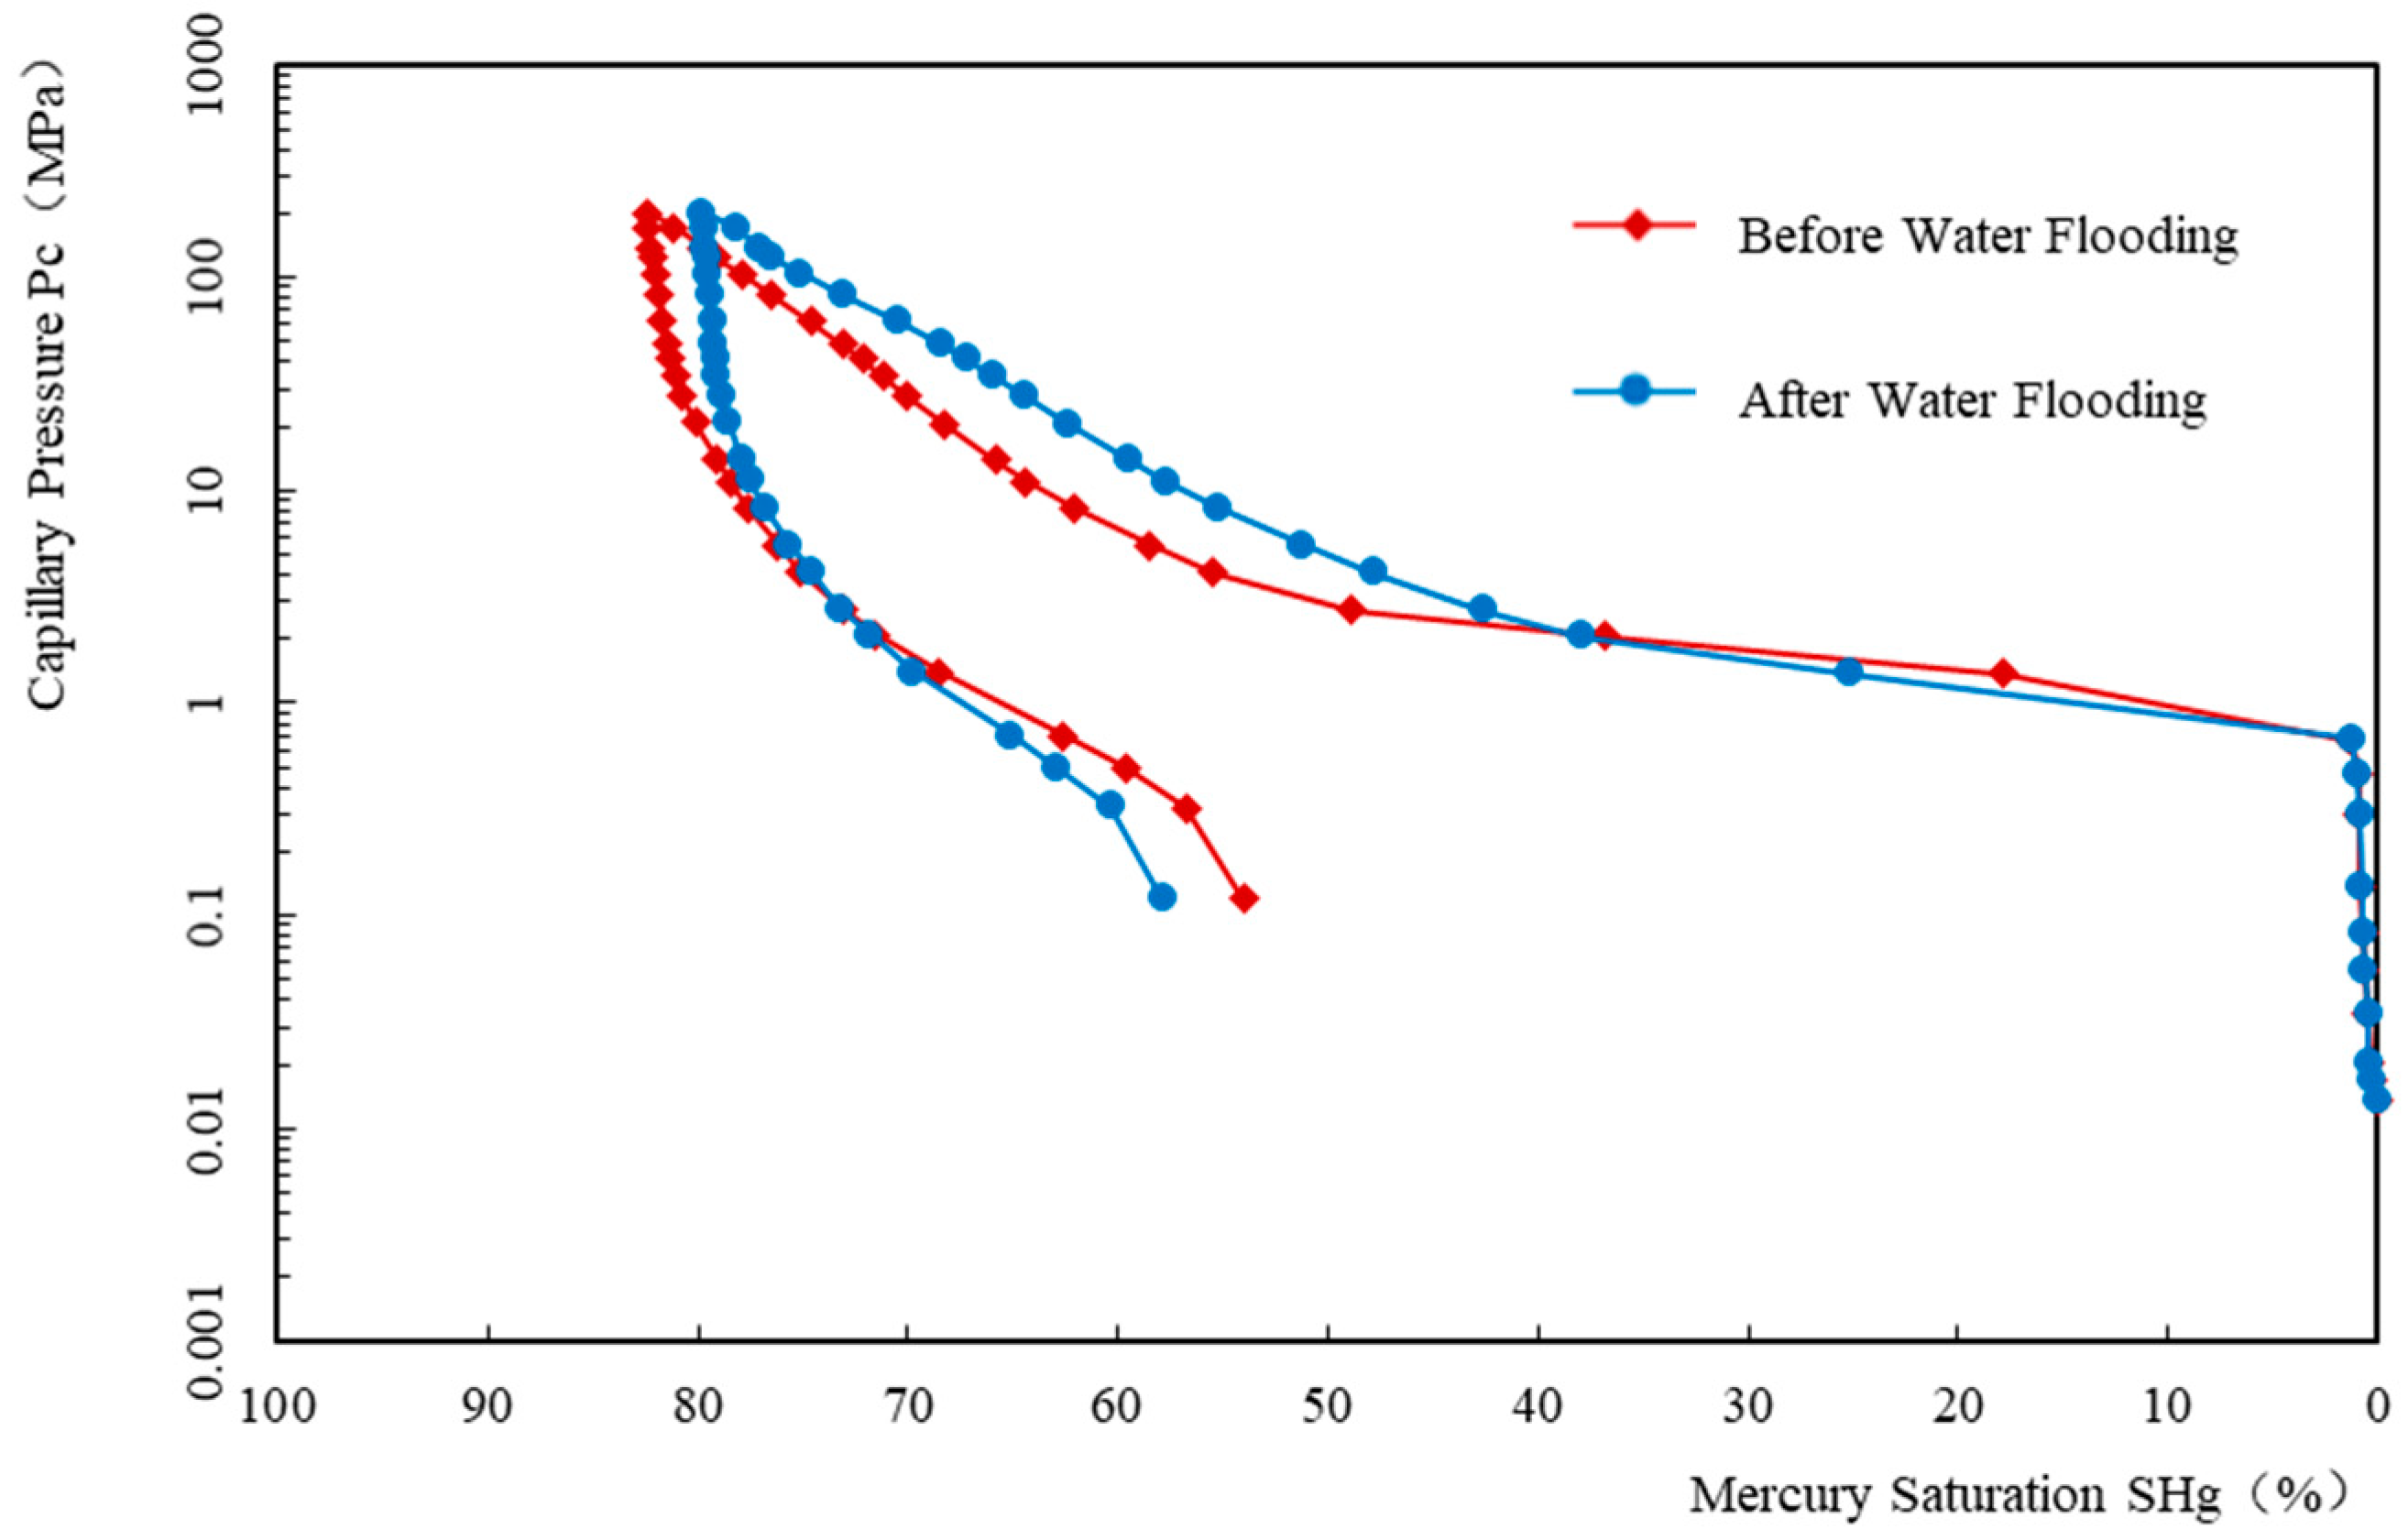
2.3.1. Analysis Based on High-Pressure Mercury Intrusion (HPMI) Results
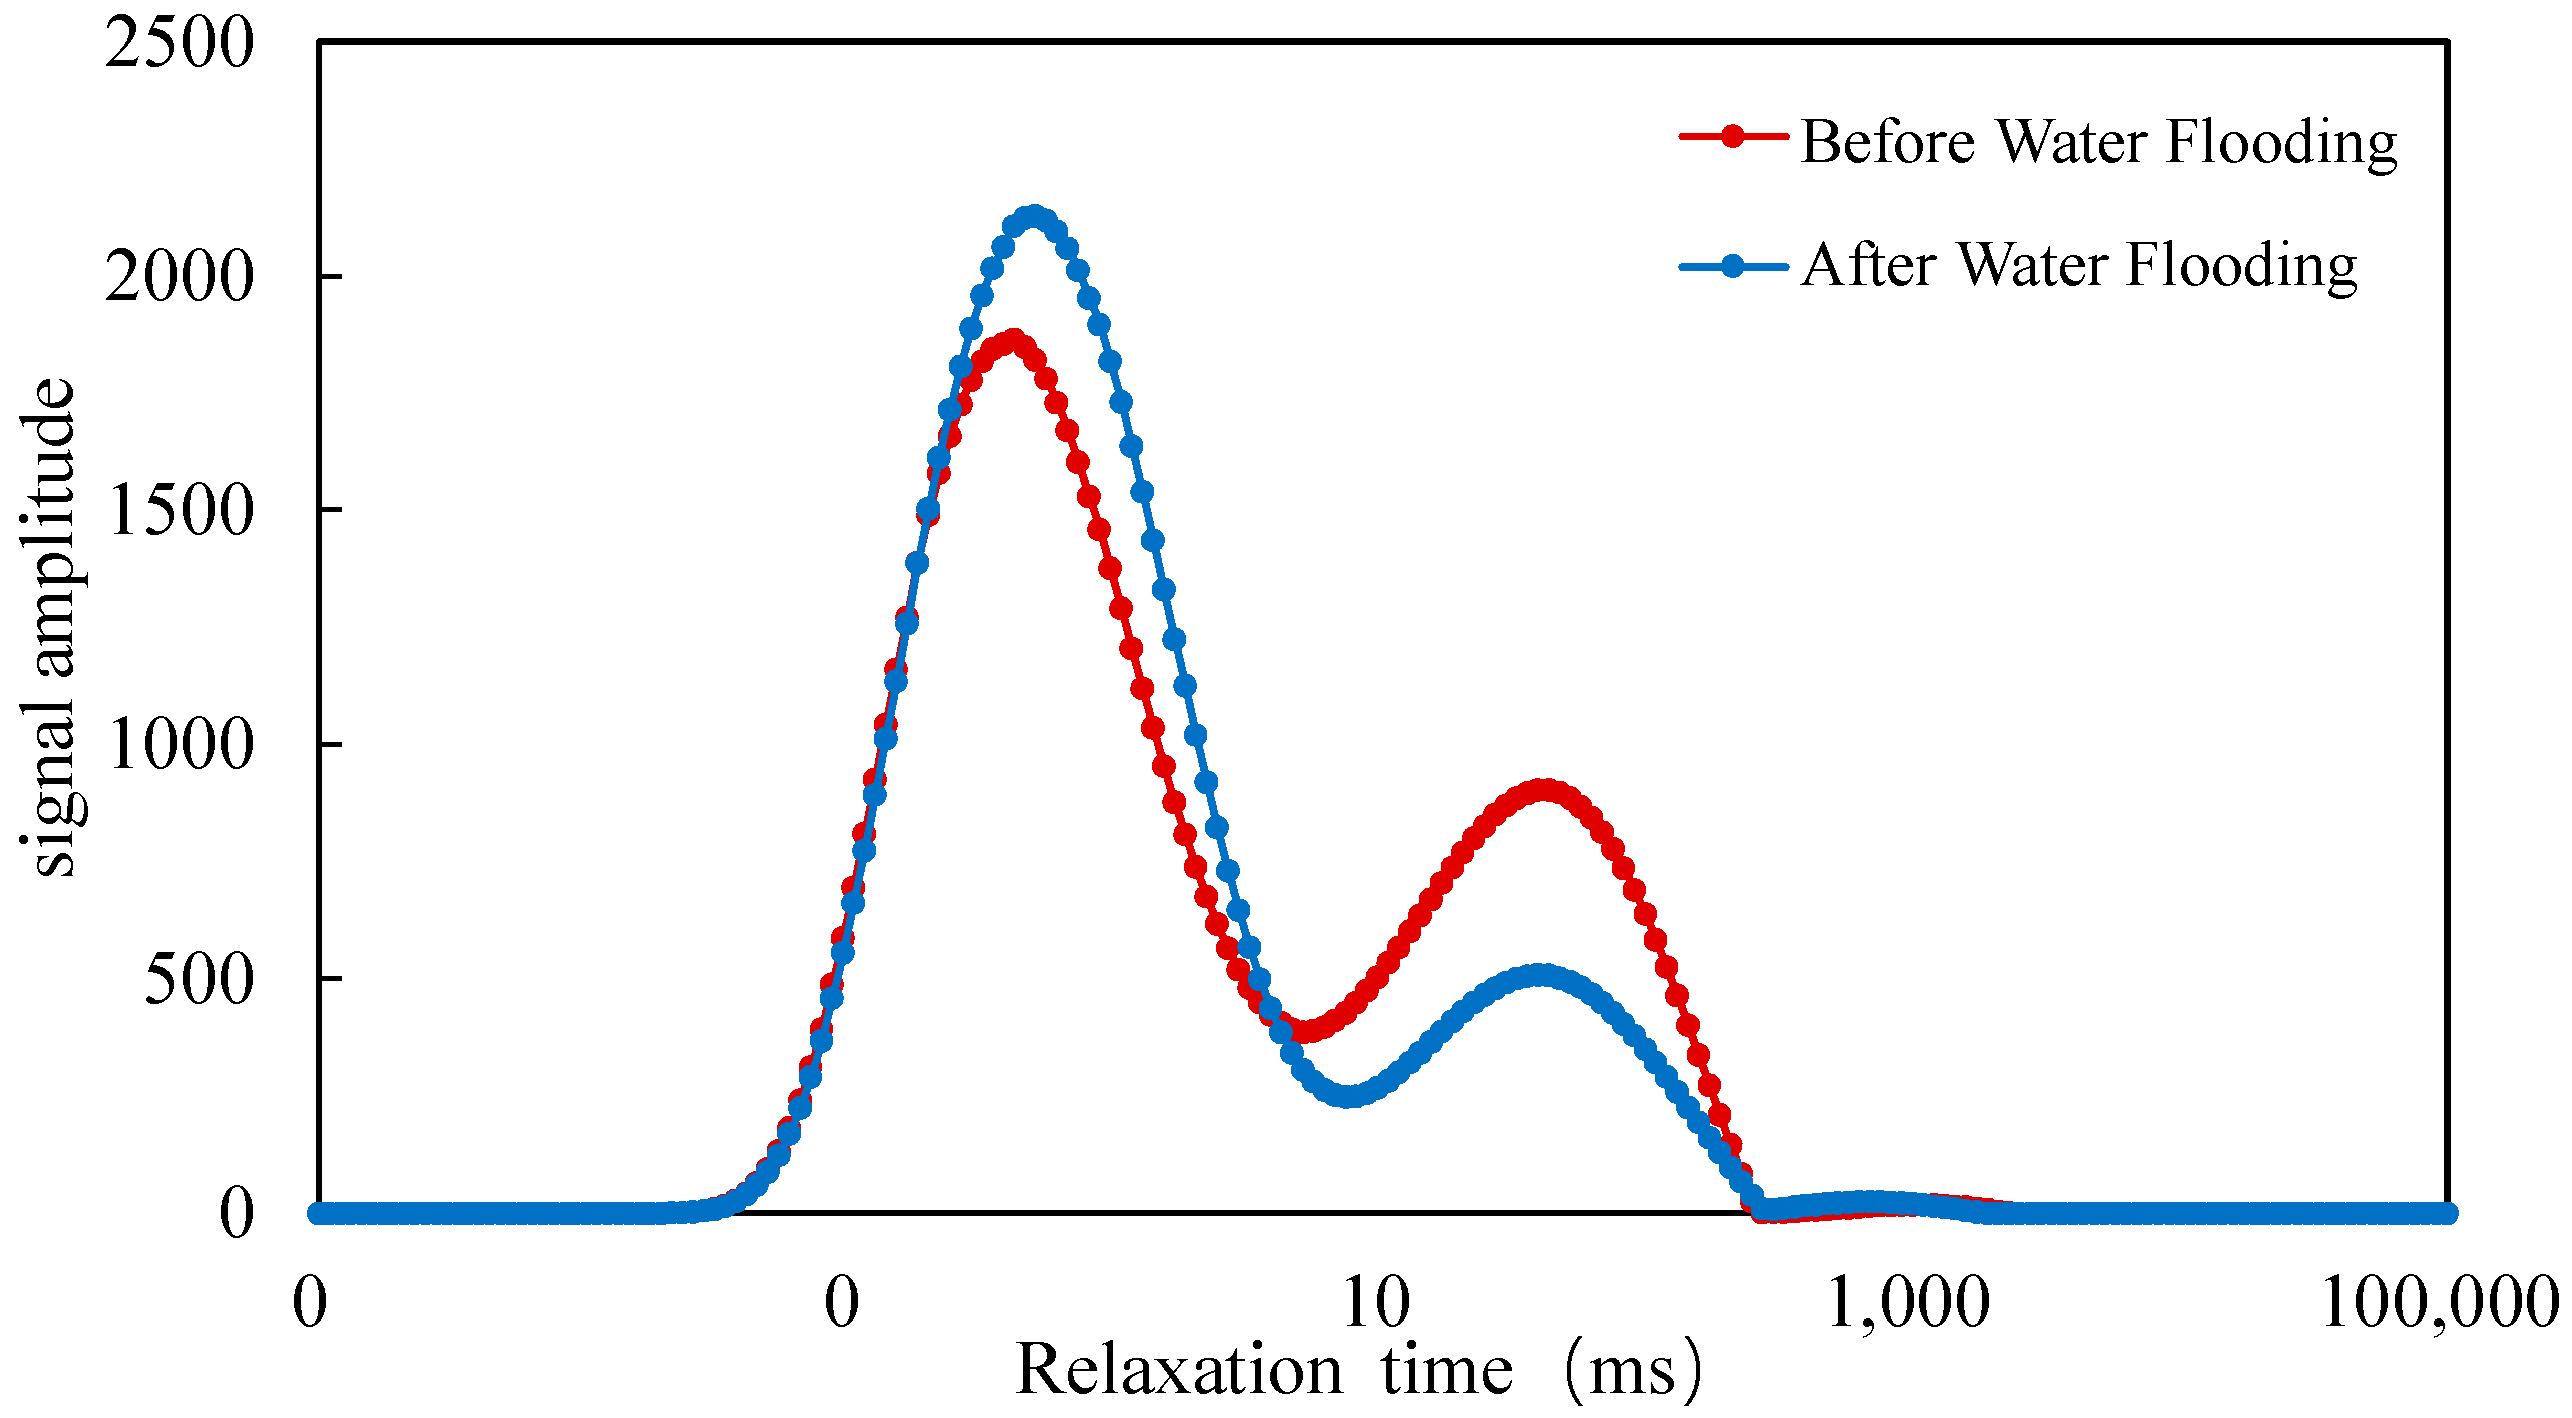
2.3.2. Based on Nuclear Magnetic Resonance T2 Spectra Results
2.4. Analysis of Reservoir Clay Mineral Changes
3. Experimental Analysis of Velocity-Sensitive Damage to the Reservoir
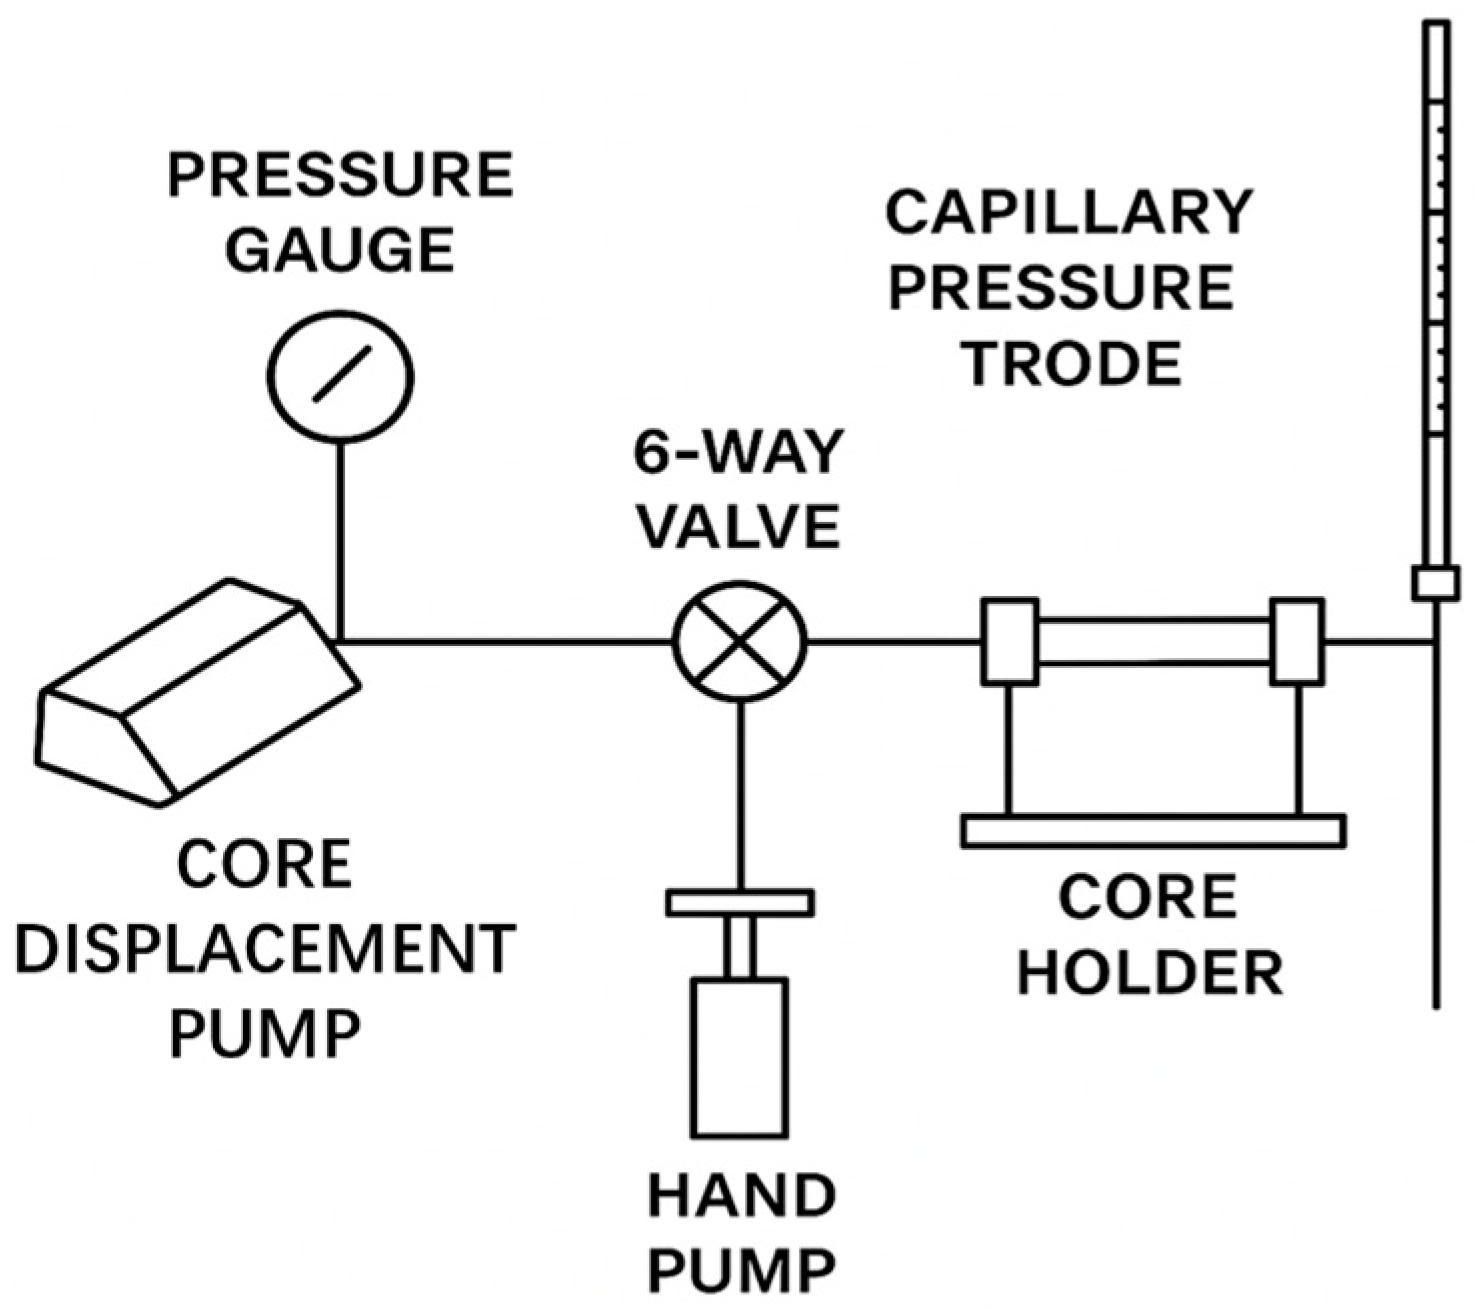
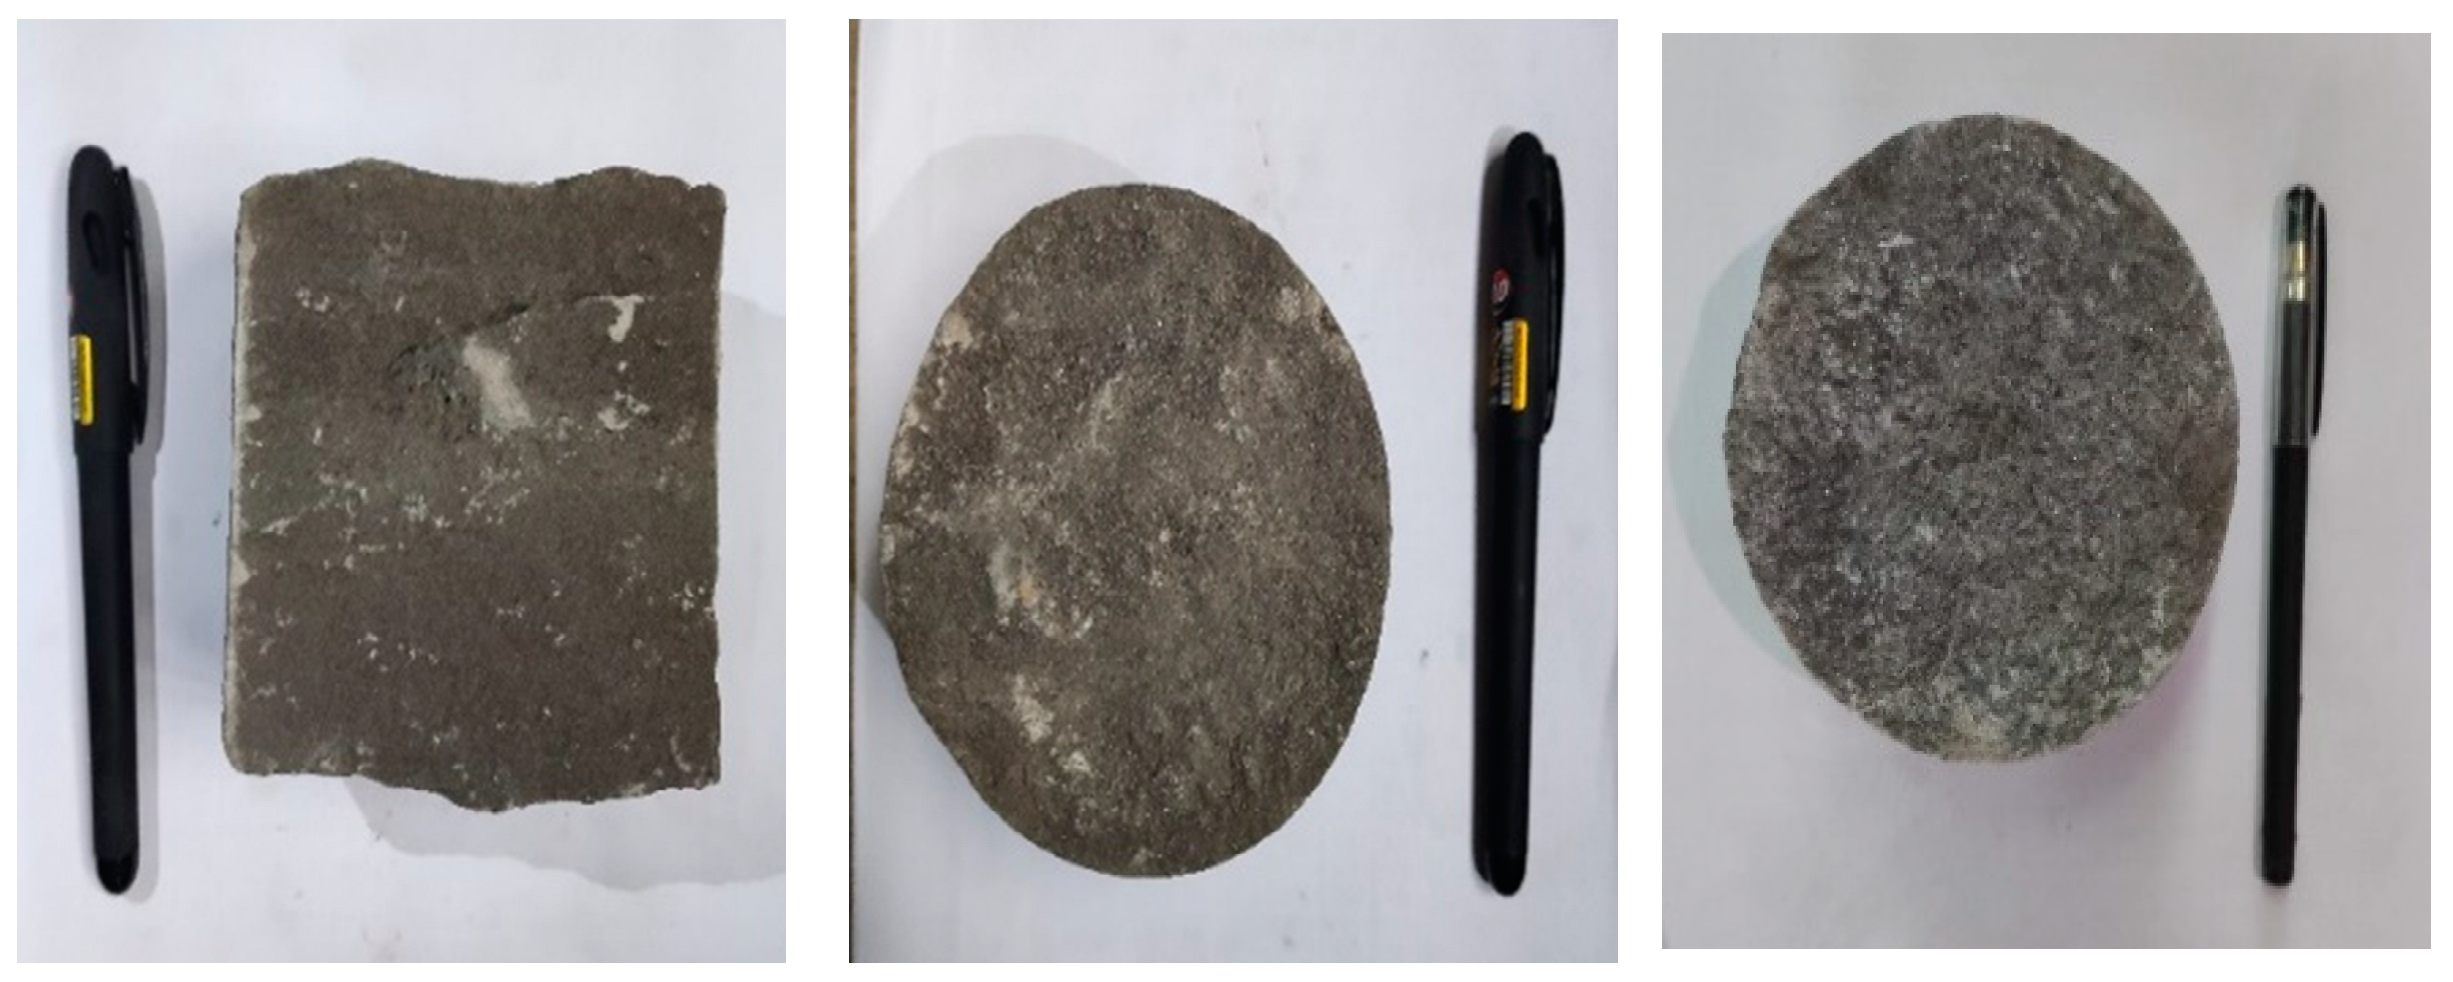
3.1. Experimental Equipment and Materials
3.2. Experimental Objective
3.3. Experimental Design
3.4. Experimental Procedure
- Vacuum core samples were saturated using formation water;
- The core samples were placed into the core holder, ensuring that the liquid flow direction in the core aligns with the gas flow direction used during permeability measurement. The confining pressure was set to 2.0 MPa and maintained throughout the experiment, kept at 1.5–2.0 MPa higher than the core inlet pressure;
- Fluids were injected at flow rates of 0.05, 0.075, 0.10, 0.25, 0.50, 0.75, 1.0, 1.5, and 2.0 cm3/min, with each rate corresponding to an injection volume of approximately 3–4 pore volumes (PV). After each injection stage, the core was treated before proceeding to the next flow rate. Measurements were conducted sequentially for each flow condition;
- If the pressure gradient exceeds 3 MPa/cm before reaching a flow rate of 2.0 cm3/min, and permeability does not show a significant decline with increasing flow rate, the core is considered unaffected by velocity-sensitive damage, and the experiment is concluded. If permeability damage exceeds 20%, the experiment is terminated.
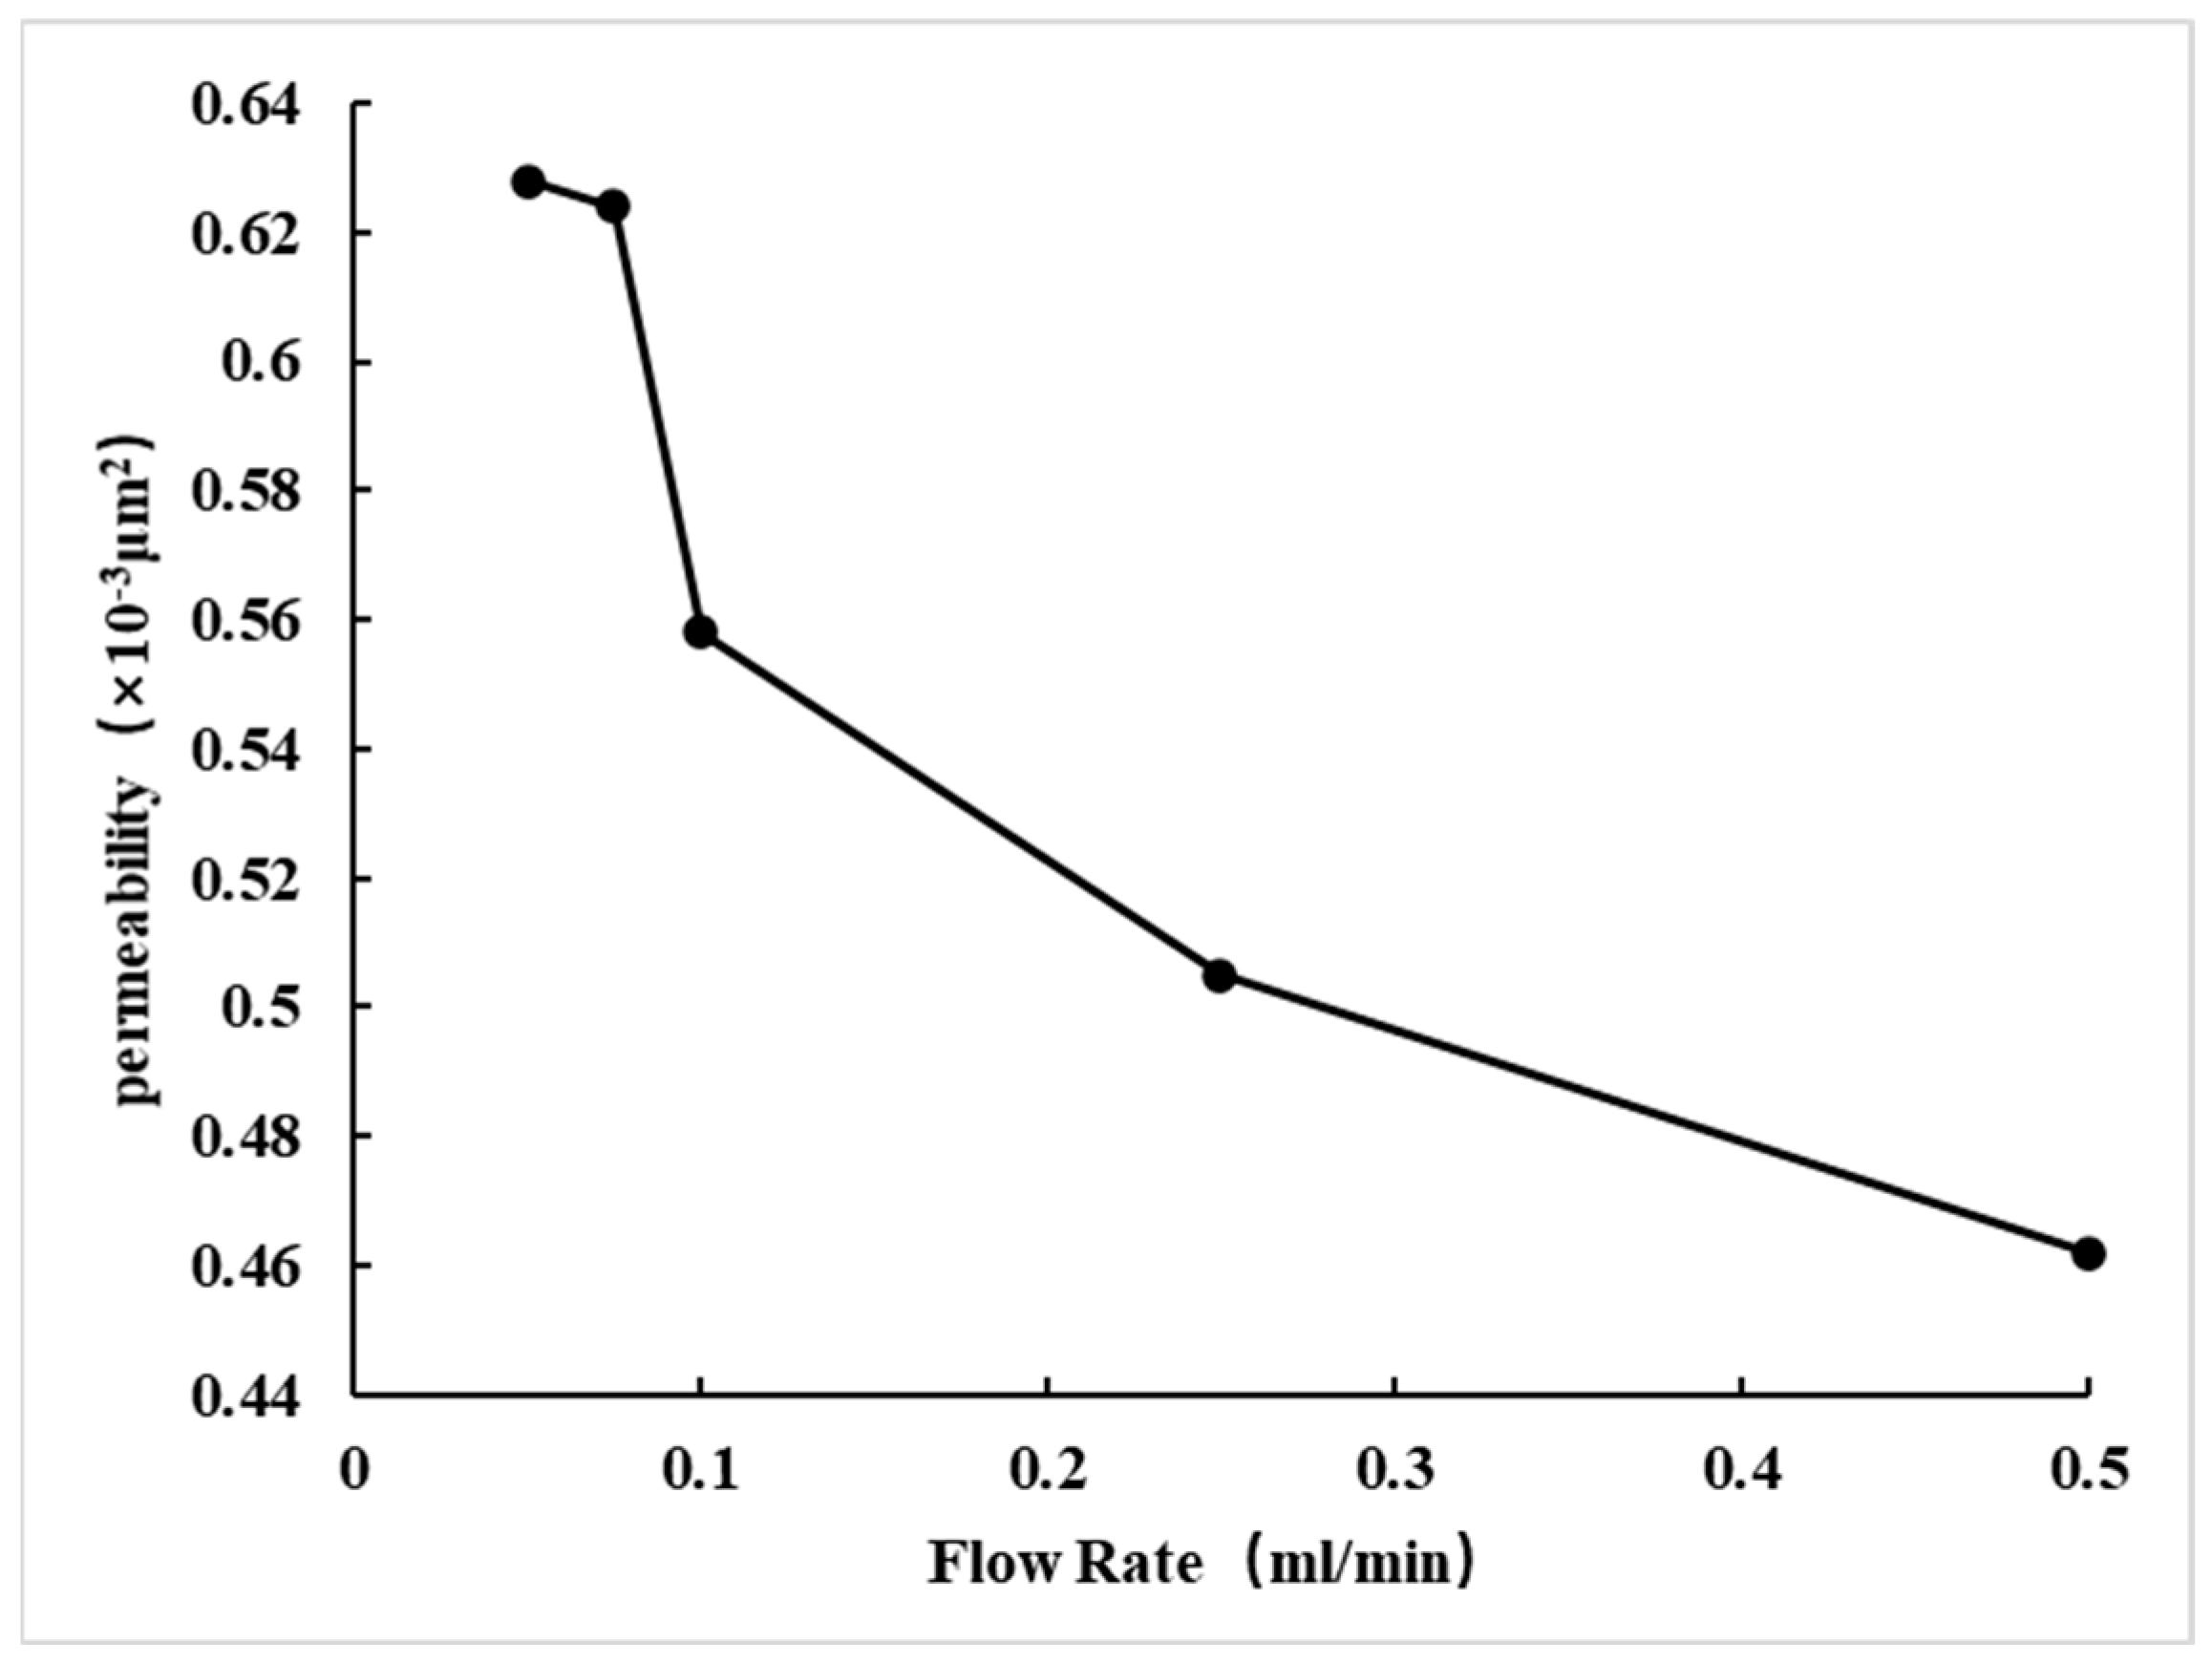
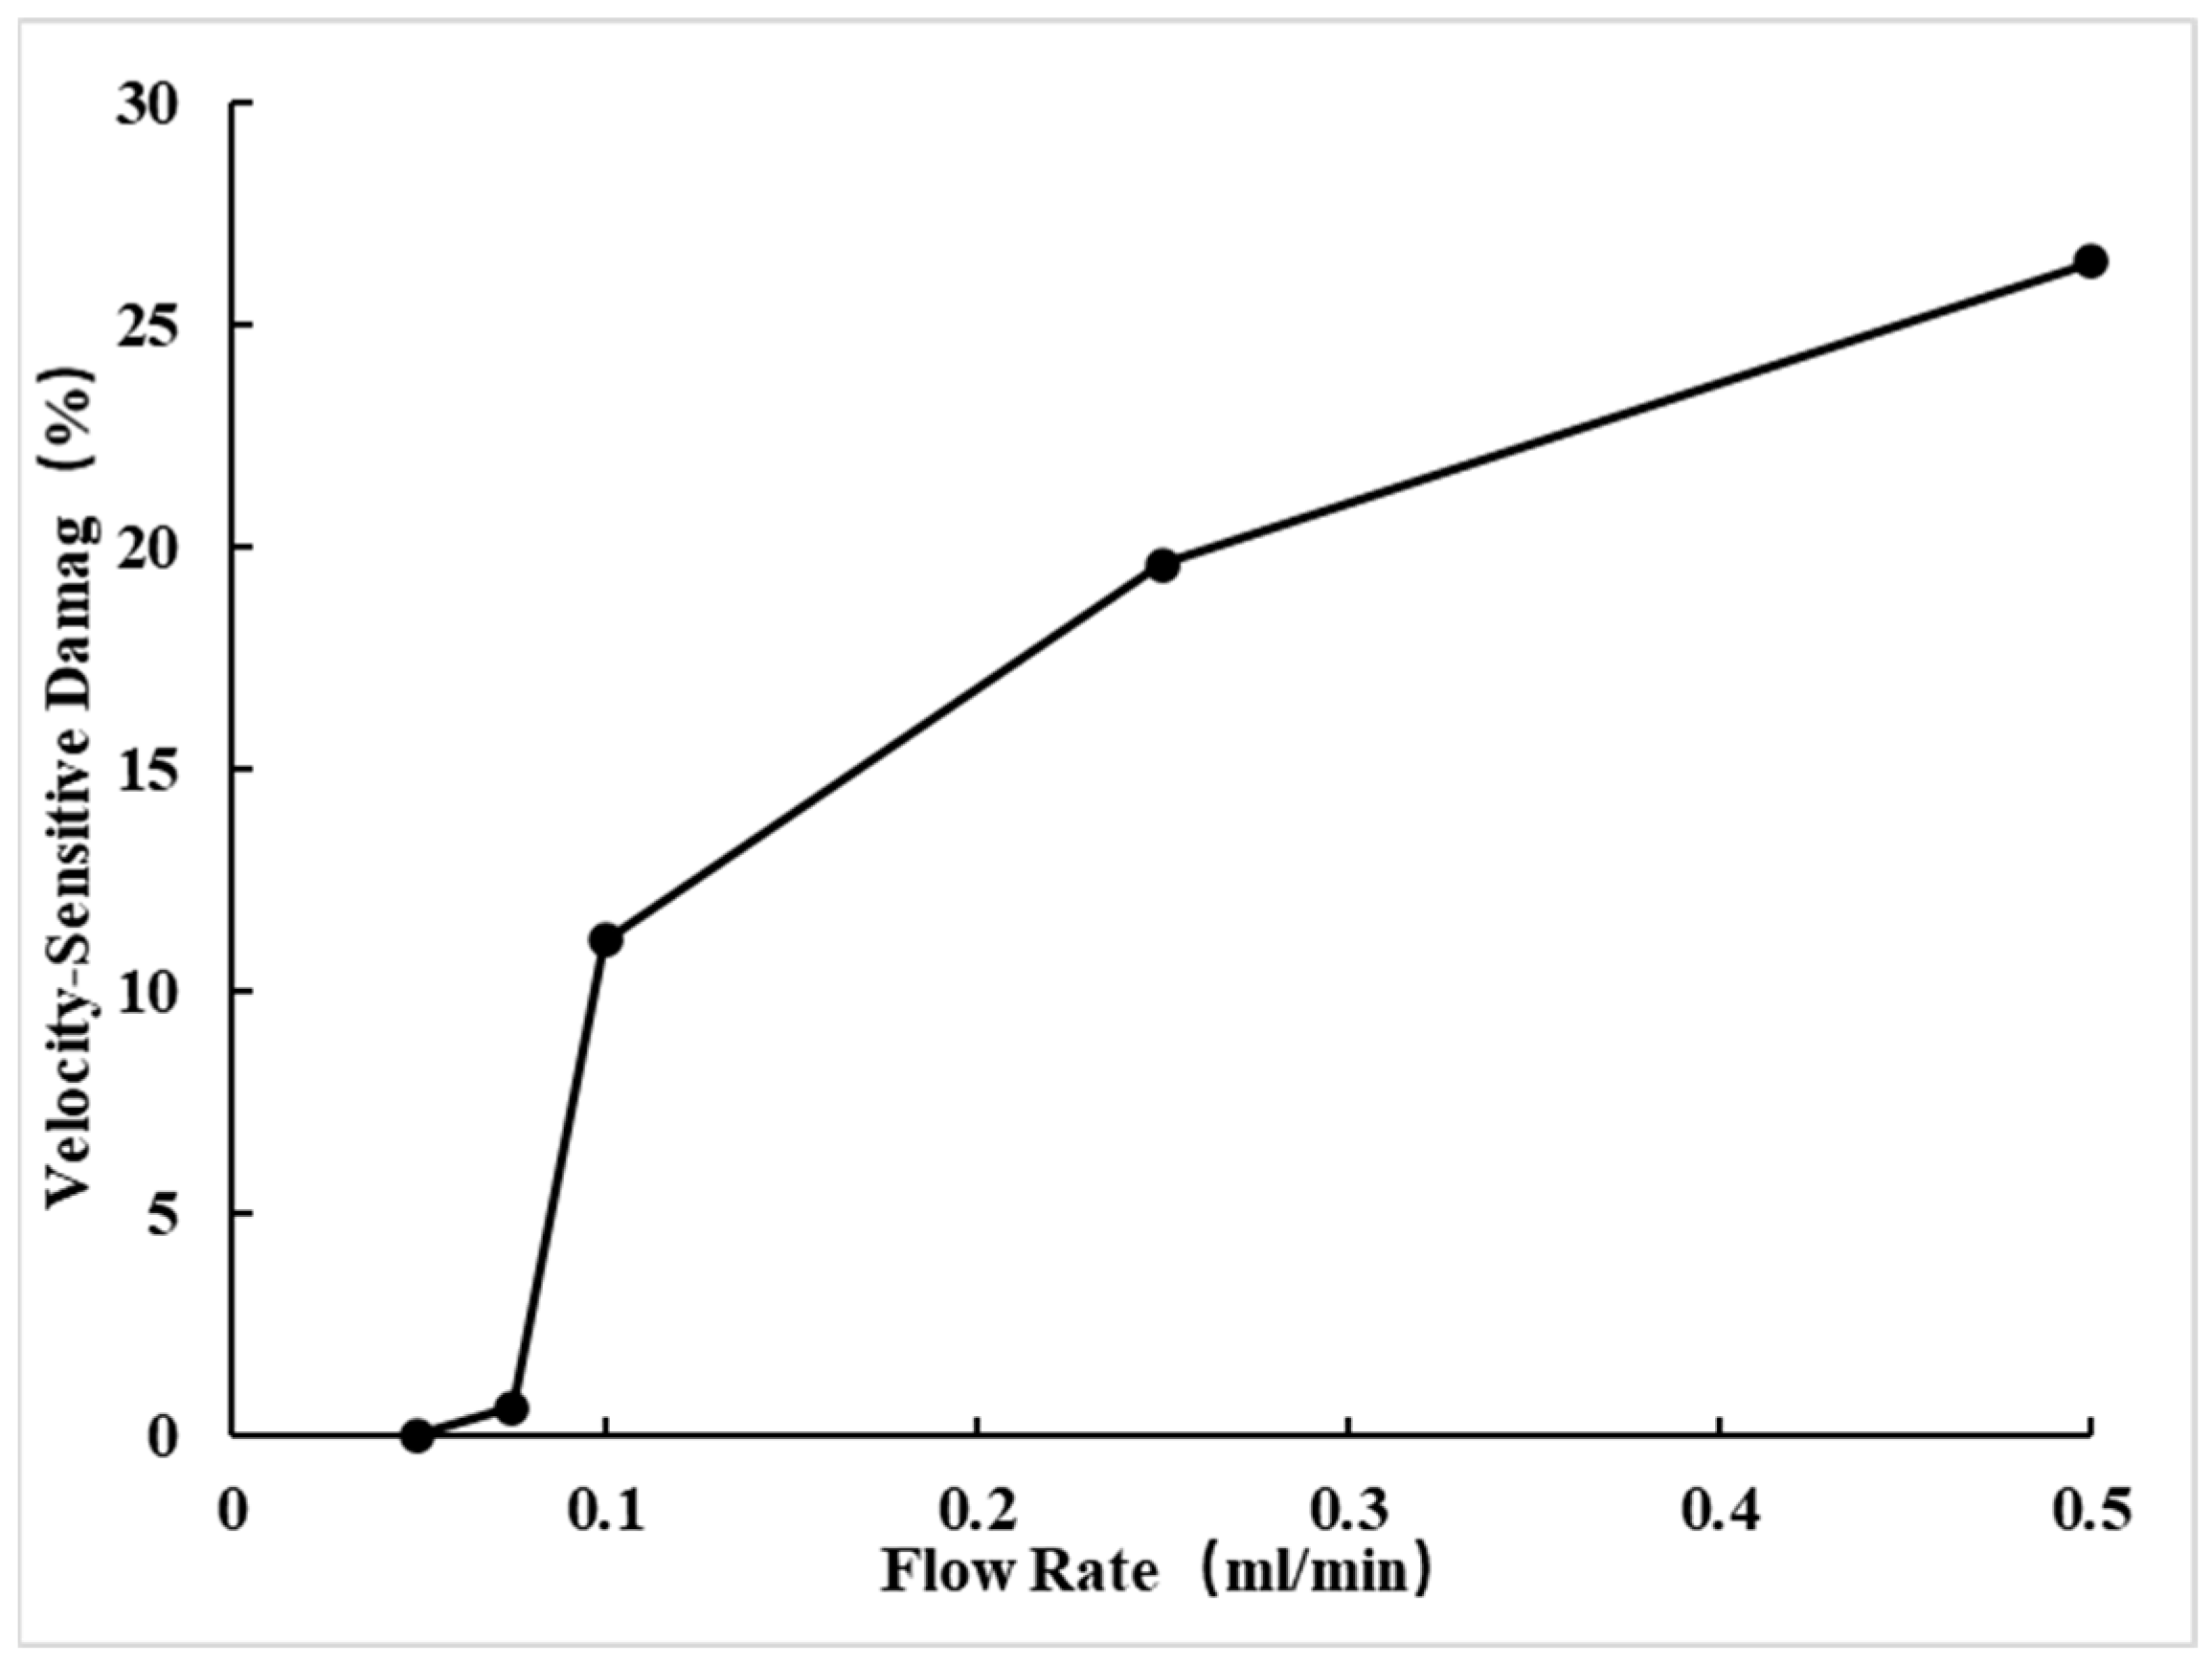
3.5. Experimental Results Analysis
- Permeability Greater Than 1 × 10⁻³ μm2
- 2.
- Permeability Range: 0.3~1 × 10⁻³ μm2
- 3.
- Permeability Range: Less Than 0.3 × 10⁻³ μm2
4. Characterization Model of Speed-Sensitive Damage to Reservoirs
4.1. Speed-Sensitive Effect
4.1.1. Definition of Speed-Sensitive Effect
4.1.2. Influence of Speed-Sensitive Effect on Formation Flow Velocity
- Exponential Decay Model
- 2.
- Power-Law Decay Model
- 3.
- Linear Decay Model
- Stress-Sensitive Linear Decay Model:
- Time-Sensitive Linear Decay Model
4.2. Effect of Injection Volume on Speed-Sensitive Effect
Effect of Injection Volume on Flow Rate
- Exponential Decay Model:
- 2.
- Empirical Power-Law Model:
- 3.
- Linear Model (Weak Speed-Sensitive Assumption):
- When Q is small, , the approximation is . In this case, Rc is approximately linear with Q;
- As increases, increases with , and the correction factor significantly decreases, causing the dependence of on to become nonlinear. In extreme cases, may increase more slowly as grows;
- The above model also emphasizes the importance of reasonably controlling the injection volume to avoid speed-sensitive effects. When the injection volume is too large, the reduction in effective permeability caused by speed-sensitive effects can result in the actual diffusion radius being much smaller than the expected value under non-speed-sensitive conditions, thereby affecting the oil recovery efficiency.
5. Application of the Characterization Model to the Target Reservoir
5.1. Model Parameter Determination and Validation
5.2. Practical Application in the Field
6. Conclusions
- Through high-pressure mercury injection, nuclear magnetic resonance, and scanning electron microscope experiments, the microscopic mechanism of the L tight oil reservoir after waterflooding was revealed. The pore throat radius decreased (the maximum pore throat radius dropped from 1.093 μm to 1.085 μm), and the sorting became worse (the variation coefficient increased to 0.208). It was confirmed that the migration and blockage of kaolinite particles in the pores were the main causes of permeability decline (with a decrease of 5.63%);
- The established exponential decay model and the critical diffusion radius formula were validated with field data, showing an error of less than 3%. This model can accurately predict the nonlinear relationship between injection volume and speed-sensitive range, providing a theoretical basis for optimizing water injection strategies;
- By using this model, the optimal injection volume for the L reservoir was determined to be 16.8 m3/day. After implementing a zoned water injection strategy, speed-sensitive particle damage was reduced by 21%; the rate of permeability decline was slowed by 13.2%, and the recovery rate increased by 1.4%.
Author Contributions
Funding
Data Availability Statement
Acknowledgments
Conflicts of Interest
References
- Wang, X.C.; Wang, X.R.; Zhang, H.B. Research on Regional Flow Field Adjustment in the Late Stage of Waterflooding Oilfield Development. Petrol. Chem. Appl. 2024, 43, 9–13. (In Chinese) [Google Scholar]
- Li, H. Research on Water Injection Development Technology for Low Permeability Oilfields. Chem. Eng. Manag. 2018, 19, 210–211. [Google Scholar]
- Zhang, J.; Liu, Y.J.; Liu, D. Research and Application of Flow Field Reconstruction Model in High Water Cut Stage of Waterflooding Oilfields. J. Chongqing Univ. Sci. Technol. Nat. Sci. Ed. 2021, 23, 1. [Google Scholar]
- Yan, X.L.; Zhou, Q. Reservoir Sensitivity Evaluation of the Third Member of Shahejie Formation in Zhangdong Area. J. Yangtze Univ. Nat. Sci. Ed. 2010, 7, 171–173, 389. [Google Scholar] [CrossRef]
- Chang, X.J.; Yin, Z.J. Experimental Study on Reservoir Sensitivity and Its Formation Mechanism of the Third Member of Shahejie Formation in Gaoshangpu Oilfield. Petrol. Geol. Exp. 2004, 1, 84–88. [Google Scholar]
- Li, Q.; Li, Q.; Wu, J. Wellhead Stability During Development Process of Hydrate Reservoir in the Northern South China Sea: Evolution and Mechanism. Processes 2024, 13, 40. [Google Scholar] [CrossRef]
- Li, Q.; Li, Q.; Cao, H.; Wu, J.; Wang, F.; Wang, Y. The Crack Propagation Behaviour of CO2 Fracturing Fluid in Unconventional Low Permeability Reservoirs: Factor Analysis and Mechanism Revelation. Processes 2025, 13, 159. [Google Scholar] [CrossRef]
- Kukharova, T.; Maltsev, P.; Novozhilov, I. Development of a Control System for Pressure Distribution During Gas Production in a Structurally Complex Field. Appl. Syst. Innov. 2025, 8, 51. [Google Scholar] [CrossRef]
- Feng, H.; Qu, L.L.; Zhang, X.G. Characteristics Variation of Waterflooding Development in Medium-High Permeability Reservoirs: A Case Study of H Oilfield in Nanpu Sag. Petrol. Geol. Eng. 2023, 37, 59–64. [Google Scholar]
- Li, H.J.; Zheng, Q.F.; Chen, Y.Z. Sedimentary Characteristics of Kiziloy Formation in Akemomu Anticline, Northern Margin of Kashi Sag, Tarim Basin. Sci. Tech. Assoc. Forum Second Half 2011, 8, 123–124. [Google Scholar]
- Jia, T.Q. The Influence of Corresponding Relationship Between Clay Minerals and Reservoir Evolution on Reservoir Sensitivity: A Case Study of Fan 131 Block in the Fourth Member of Shahejie Formation, Zhenglizhuang Oilfield. Petrol. Geol. Recovery Eff. 2007, 5. (In Chinese) [Google Scholar]
- Wen, X.; Dai, Z.; Wang, H. Variation Law of Reservoir Physical Properties after Long-Term Waterflooding in Marine Sandstone Reservoirs. Spec. Oil Gas. Reserv. 2017, 24, 157–161. [Google Scholar]
- Li, A.F.; Ren, X.X.; Wang, G.J. Method and Application of Nuclear Magnetic Resonance in Studying Pore Structure of Tight Sandstone. J. China Univ. Pet. Nat. Sci. Ed. 2015, 39, 92–98. [Google Scholar]
- Cao, B.G.; Han, Y.L.; Yu, Y.J. Dynamic Characteristics Variation of Waterflooding Development in Low Permeability Reservoirs. Sci. Technol. Eng. 2020, 20, 1820–1825. [Google Scholar]
- Zhang, X.F.; Liu, Z.B.; Liu, C. Effect of Clay Minerals on Physical Properties of Waterflooding Development Reservoirs in X Oilfield, Liaodong Bay Depression. Daqing Pet. Geol. Dev. 2017, 36, 62–67. [Google Scholar]
- Chen, X.; Zhong, J.H.; Yuan, J. Development Characteristics and Transformation Mechanism of Kaolinite in Paleogene of Bonan Sag. Petrol. Explor. Dev. 2009, 36, 456–462. [Google Scholar]
- Zhao, Y. Study on the Relationship Between Tightness and Reservoir Formation of Chang 7 Member in the Southwest Ordos Basin. Ph.D. Thesis, China University of Mining and Technology, Beijing, China, 2018. [Google Scholar]
- Liu, H.J. Study on the Production Law of Mud and Sand in Loose Sediments of Hydrate Decomposition Zone. Ph.D. Thesis, China University of Petroleum, Qingdao, China, 2019. [Google Scholar]
- Yu, X.L.; Peng, C.Z.; Tian, H.Z. Abnormal Analysis of Relative Permeability Curve Characteristics and Reasonable Exploitation Suggestions in X Oilfield. J. Chongqing Univ. Sci. Technol. Nat. Sci. Ed. 2010, 12, 86–88. [Google Scholar]


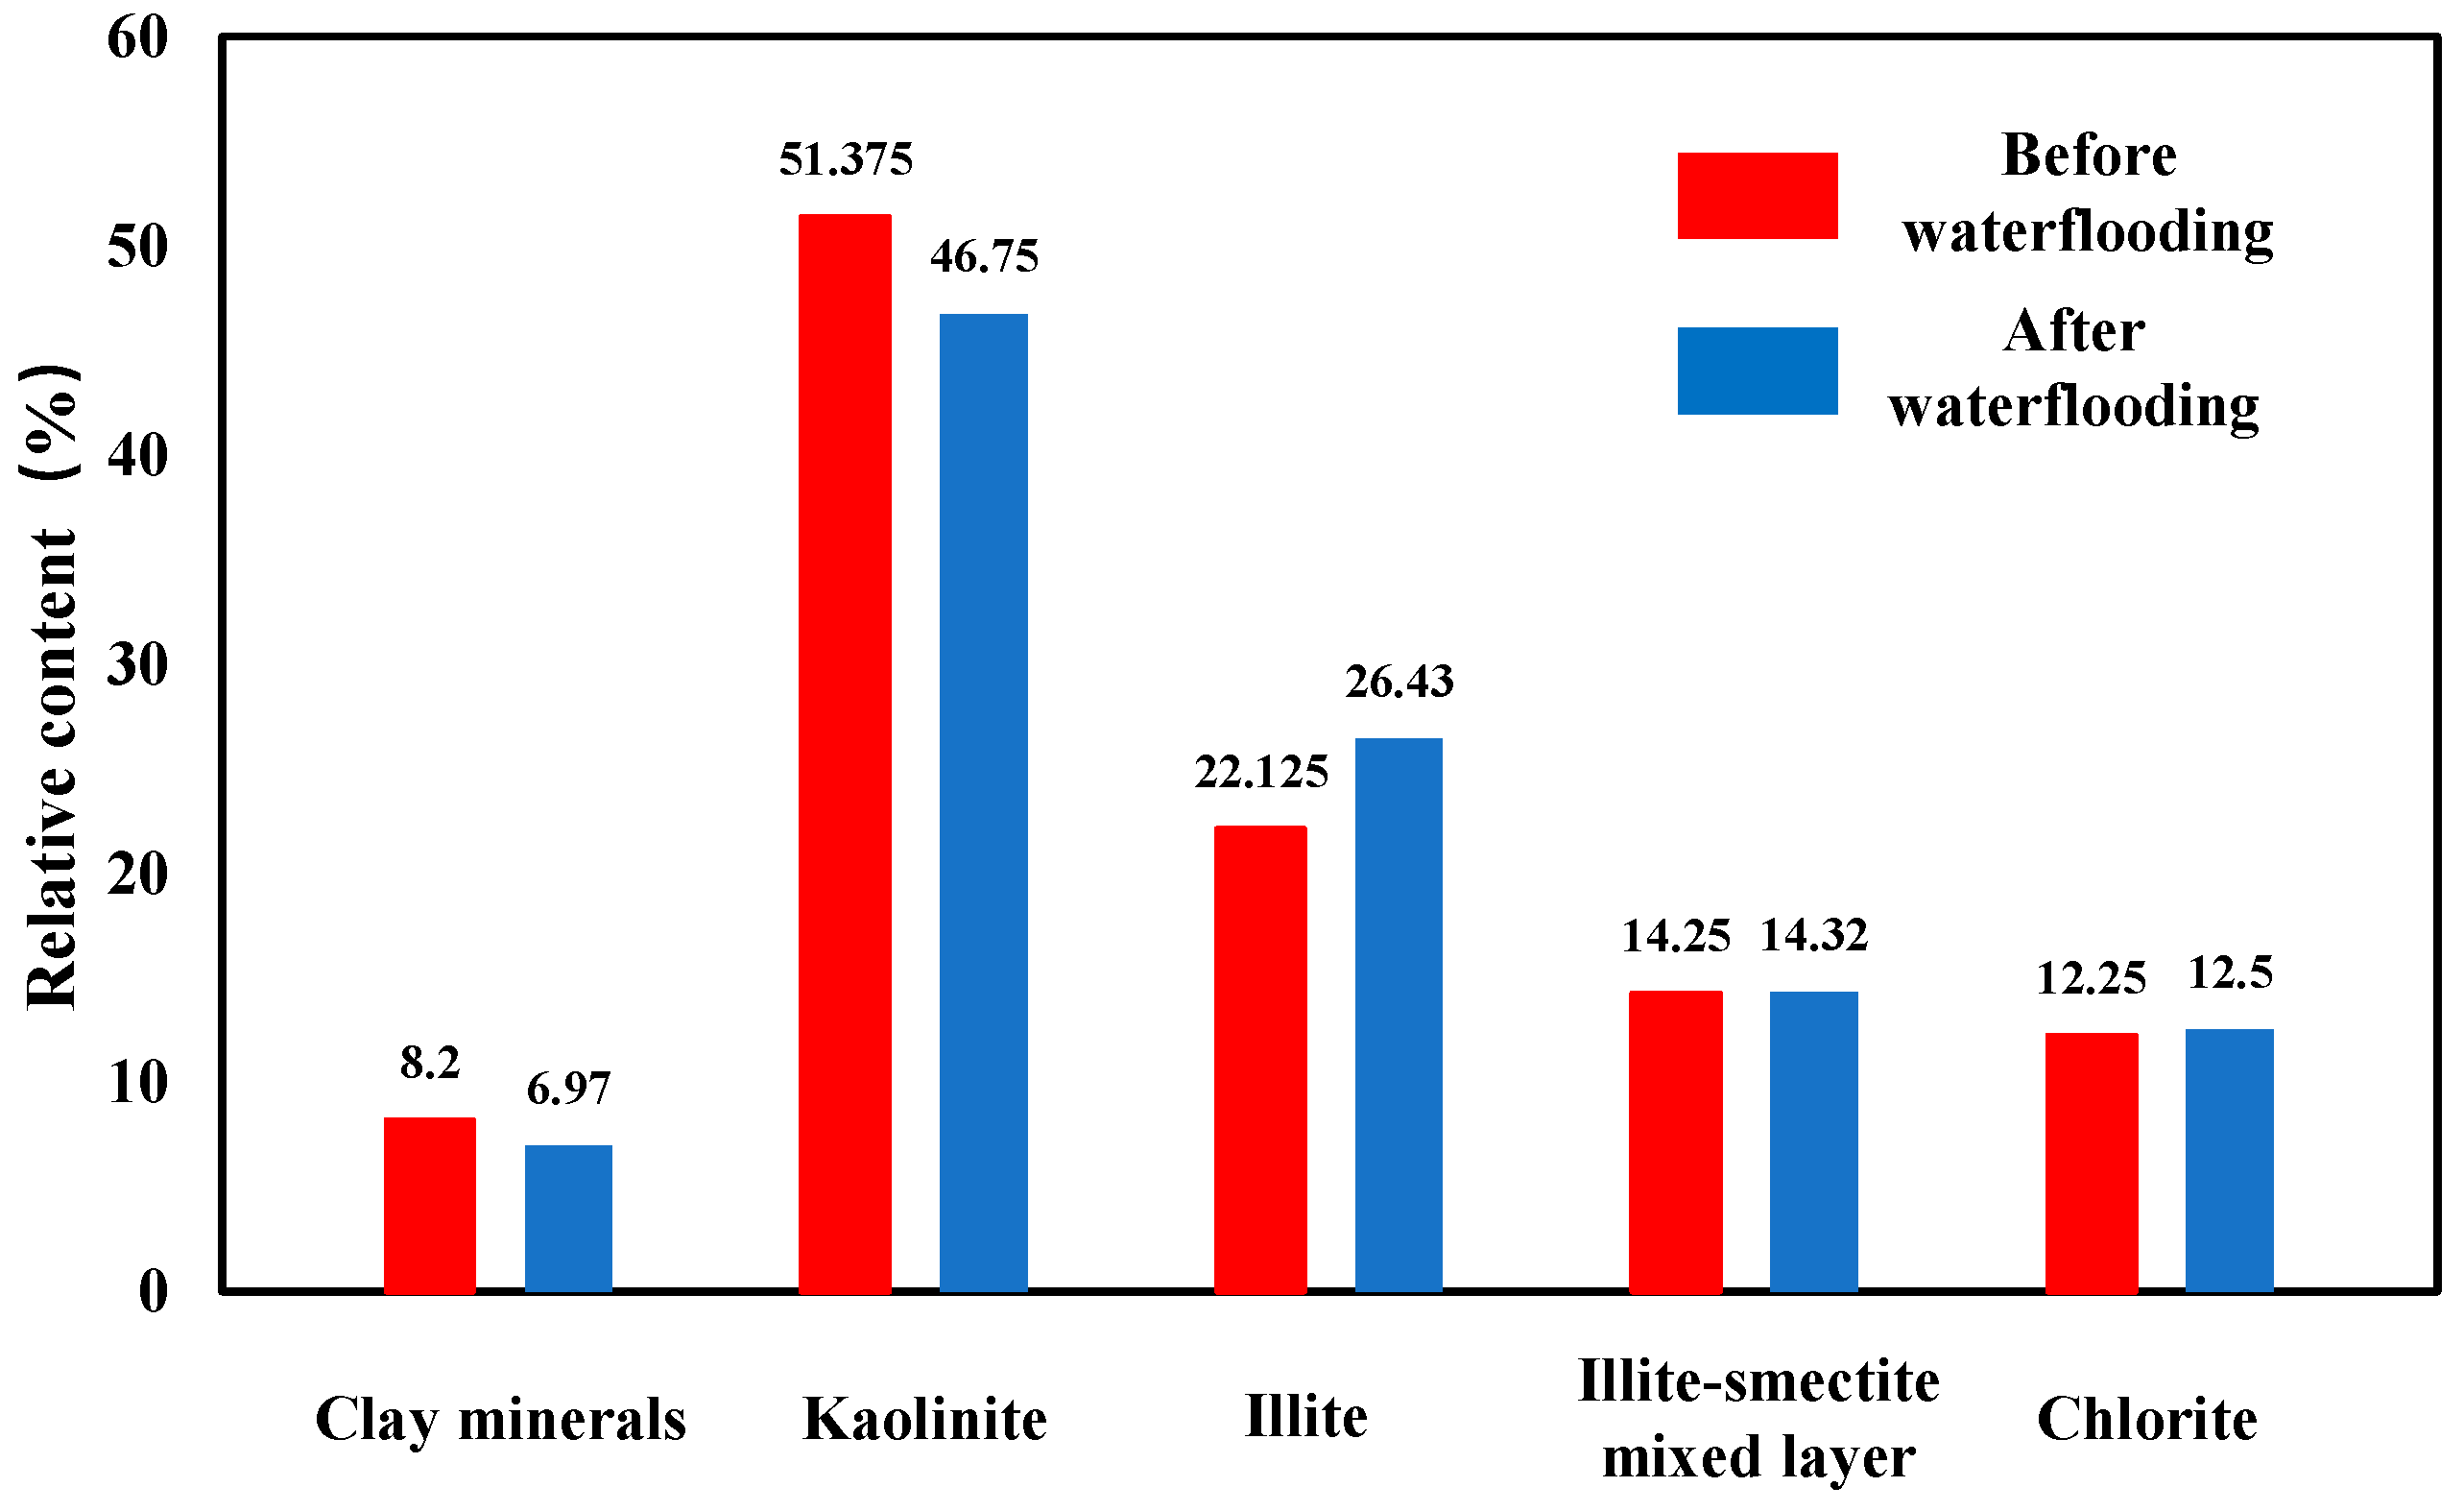


| Sample No. | Formation | Clay Mineral Types and Relative Contents (%) | |||
|---|---|---|---|---|---|
| Illite–Smectite Mixed Layer | Illite | Kaolinite | Chlorite | ||
| 21 | Chang8 | 10 | 21 | 54 | 15 |
| 24 | Chang8 | 17 | 28 | 42 | 13 |
| 29 | Chang8 | 23 | 28 | 33 | 16 |
| 30 | Chang8 | 24 | 24 | 37 | 15 |
| 34-1 | Chang8 | 8 | 18 | 68 | 6 |
| 34-2 | Chang8 | 7 | 18 | 70 | 5 |
| 54 | Chang8 | 16 | 22 | 42 | 20 |
| 70 | Chang8 | 9 | 18 | 65 | 8 |
| Average | 14.25 | 22.125 | 51.375 | 12.25 | |
| Core-Related Parameters | Before Waterflood | After Waterflood | |
|---|---|---|---|
| Displacement Pressure PT (MPa) | 0.67 | 0.68 | |
| Median Capillary Pressure Pc50 (MPa) | 2.98 | 5.00 | |
| Maximum Mercury Saturation SHgmax (%) | 82.41 | 79.79 | |
| Residual Mercury Saturation SR (%) | 53.99 | 57.85 | |
| Mercury Removal Efficiency We (%) | 34.49 | 27.50 | |
| Pore Radius | Average (μm) | 0.236 | 0.203 |
| Median (μm) | 0.247 | 0.147 | |
| Maximum (μm) | 1.093 | 1.085 | |
| Variability Coefficient Dr | 0.189 | 0.208 | |
| Homogeneity Coefficient α | 0.216 | 0.187 | |
| Skewness Skp | 0.551 | 0.522 | |
| Kurtosis Kp | 1.153 | 0.825 | |
| Experiment | Sample No. | Well No. | Well Depth (m) | Diameter (cm) | Length (cm) | Pore Volume (mL) | Porosity (%) | Gas Permeability (×10−3 μm2) | Liquid Permeability (×10−3 μm2) |
|---|---|---|---|---|---|---|---|---|---|
| Velocity Impact | 52 | A | 2535.00 | 2.52 | 4.91 | 3.49 | 14.23 | 1.44 | 0.56 |
| 73 | B | 2540.40 | 2.52 | 4.92 | 2.89 | 11.79 | 0.28 | 0.13 | |
| 5 | C | 2778.98 | 2.40 | 4.80 | 2.04 | 9.38 | 0.14 | 0.02 |
| Experiment | Core Sample | Dry Weight (g) | Saturated Weight (g) | Absorption Mass (g) |
|---|---|---|---|---|
| Velocity Impact | 52 | 58.814 | 61.161 | 2.347 |
| 73 | 58.832 | 61.287 | 2.455 | |
| 5 | 57.459 | 60.402 | 2.943 |
| Flow Rate (mL/min) | Permeability (×10−3 μm2) | Velocity-Sensitive Damage (%) |
|---|---|---|
| 0.05 | 0.628 | \ |
| 0.075 | 0.624 | 0.604 |
| 0.1 | 0.558 | 11.146 |
| 0.25 | 0.505 | 19.586 |
| 0.5 | 0.462 | 26.433 |
| Flow Rate (mL/min) | Permeability (×10−3 μm2) | Velocity-Sensitive Damage (%) |
|---|---|---|
| 0.05 | 0.139 | \ |
| 0.075 | 0.138 | 0.719 |
| 0.1 | 0.133 | 4.317 |
| 0.25 | 0.124 | 10.791 |
| 0.5 | 0.111 | 20.144 |
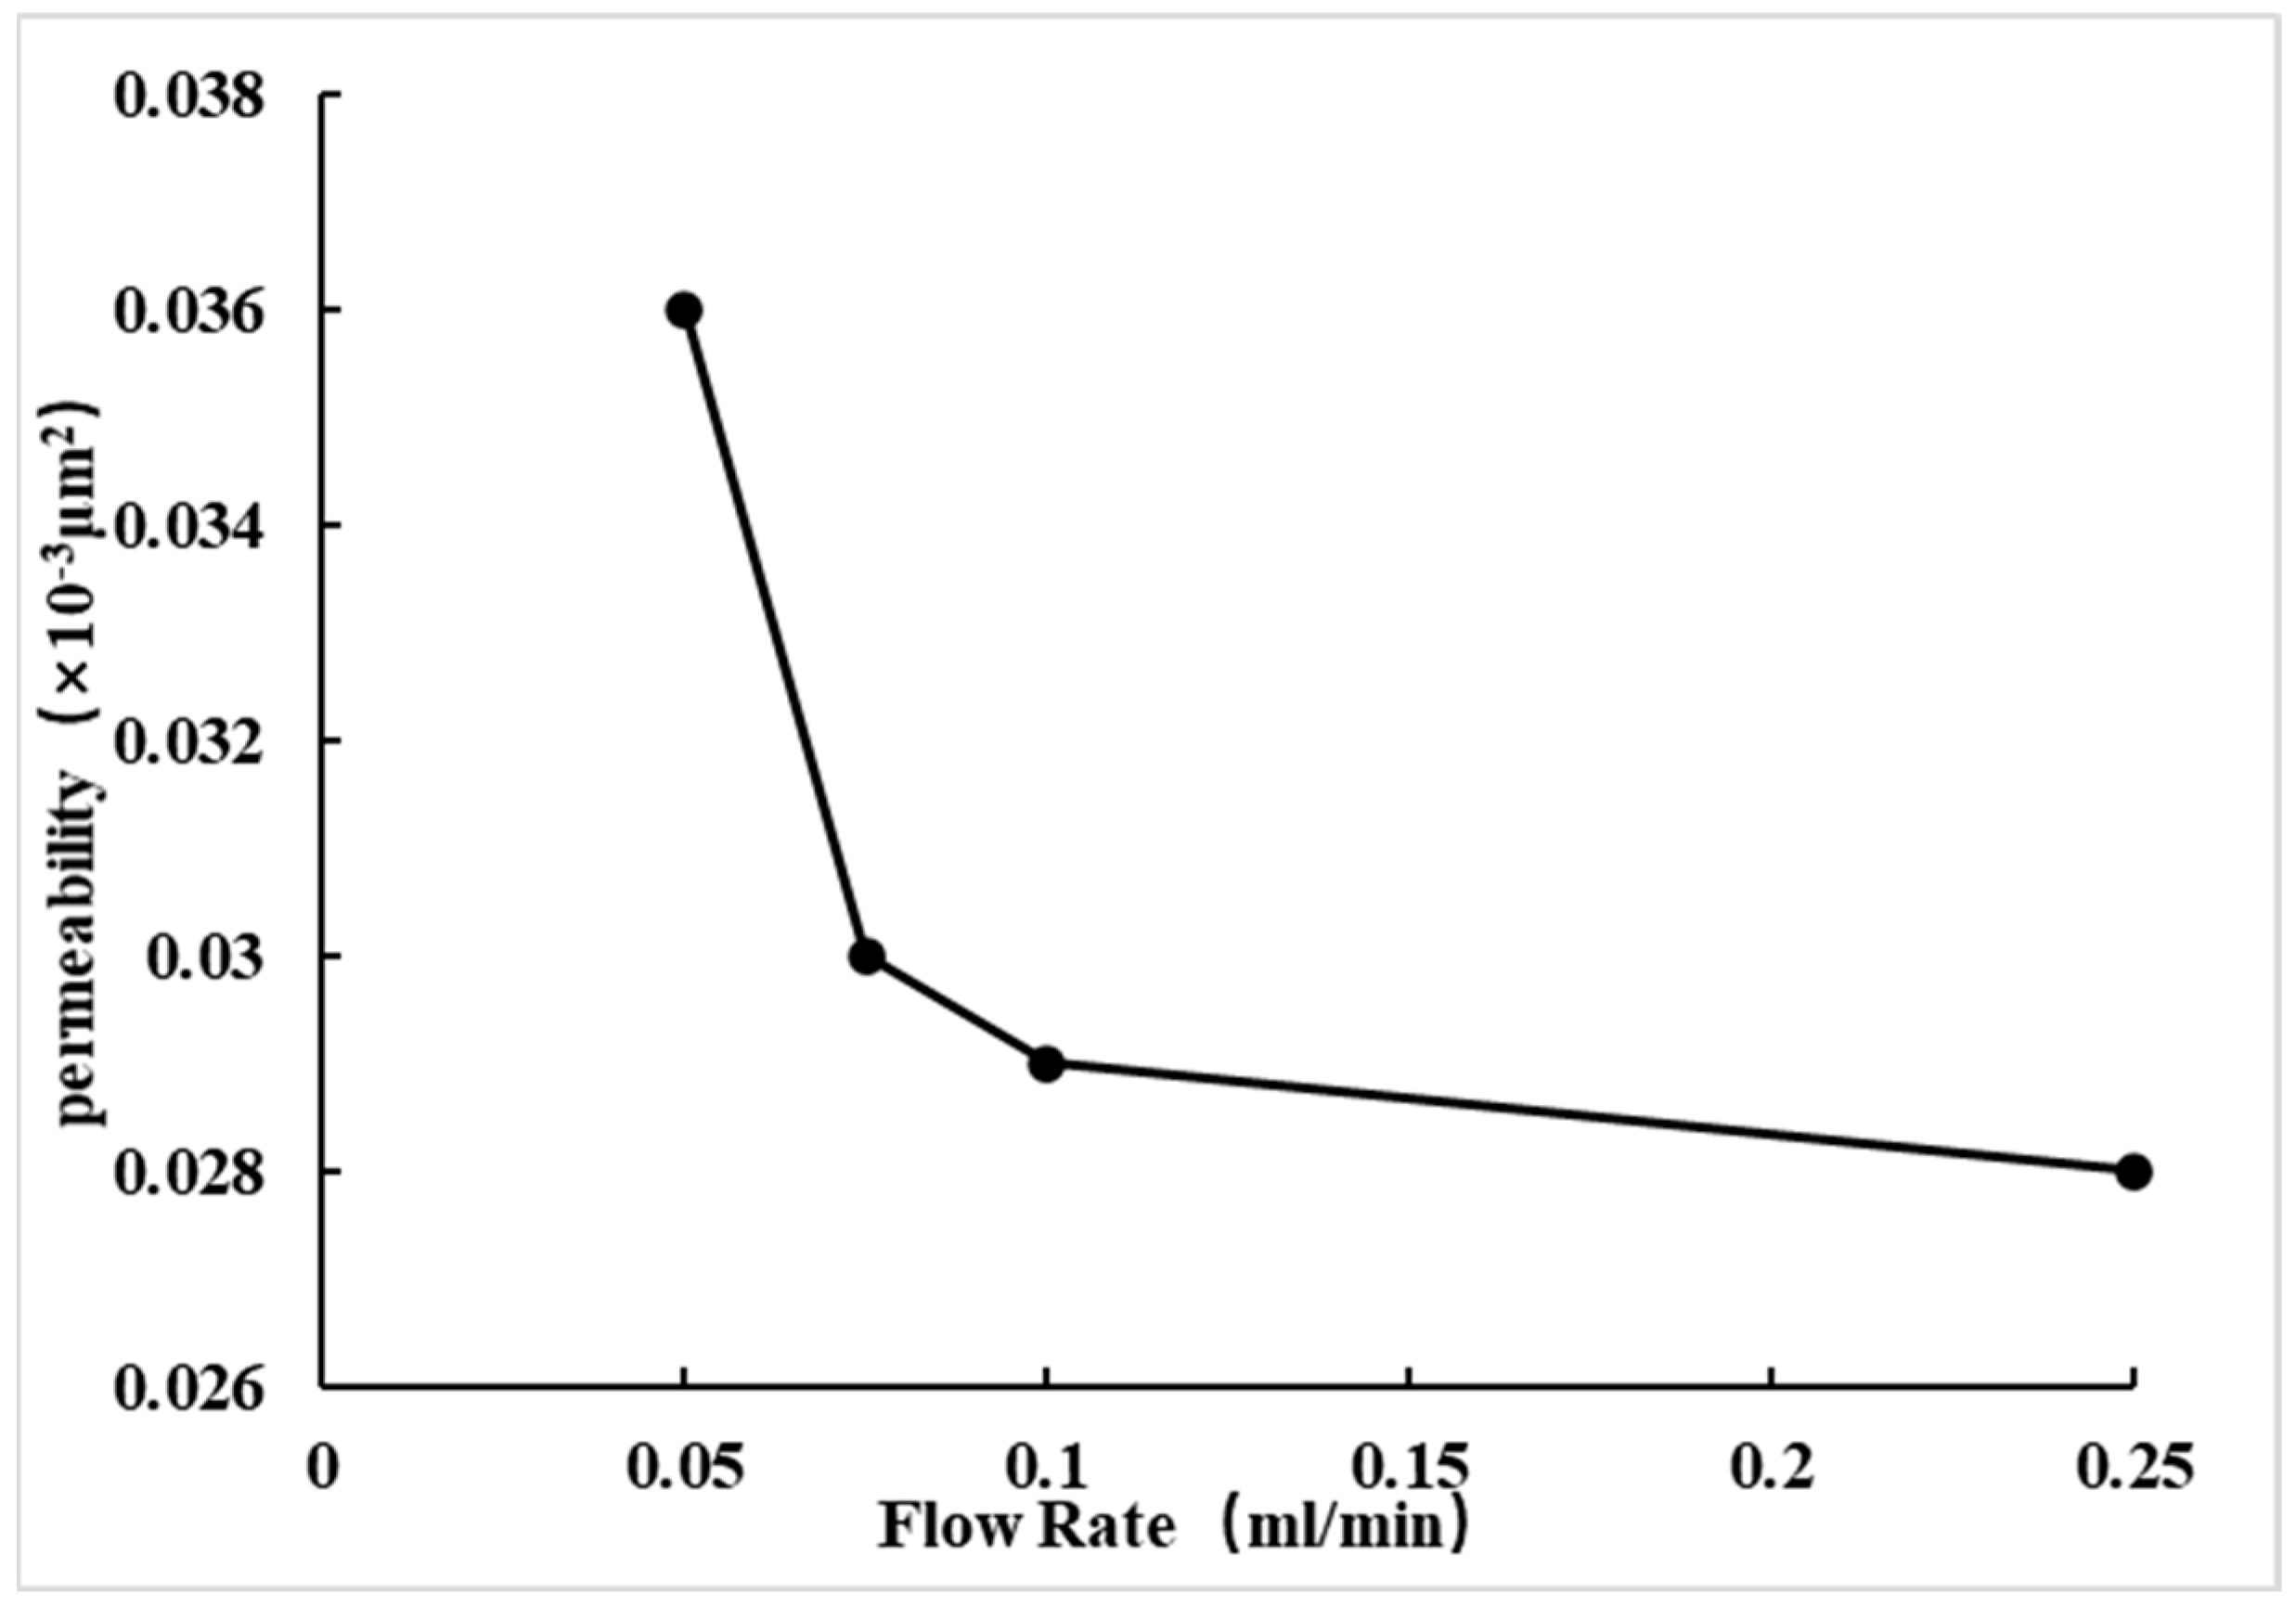
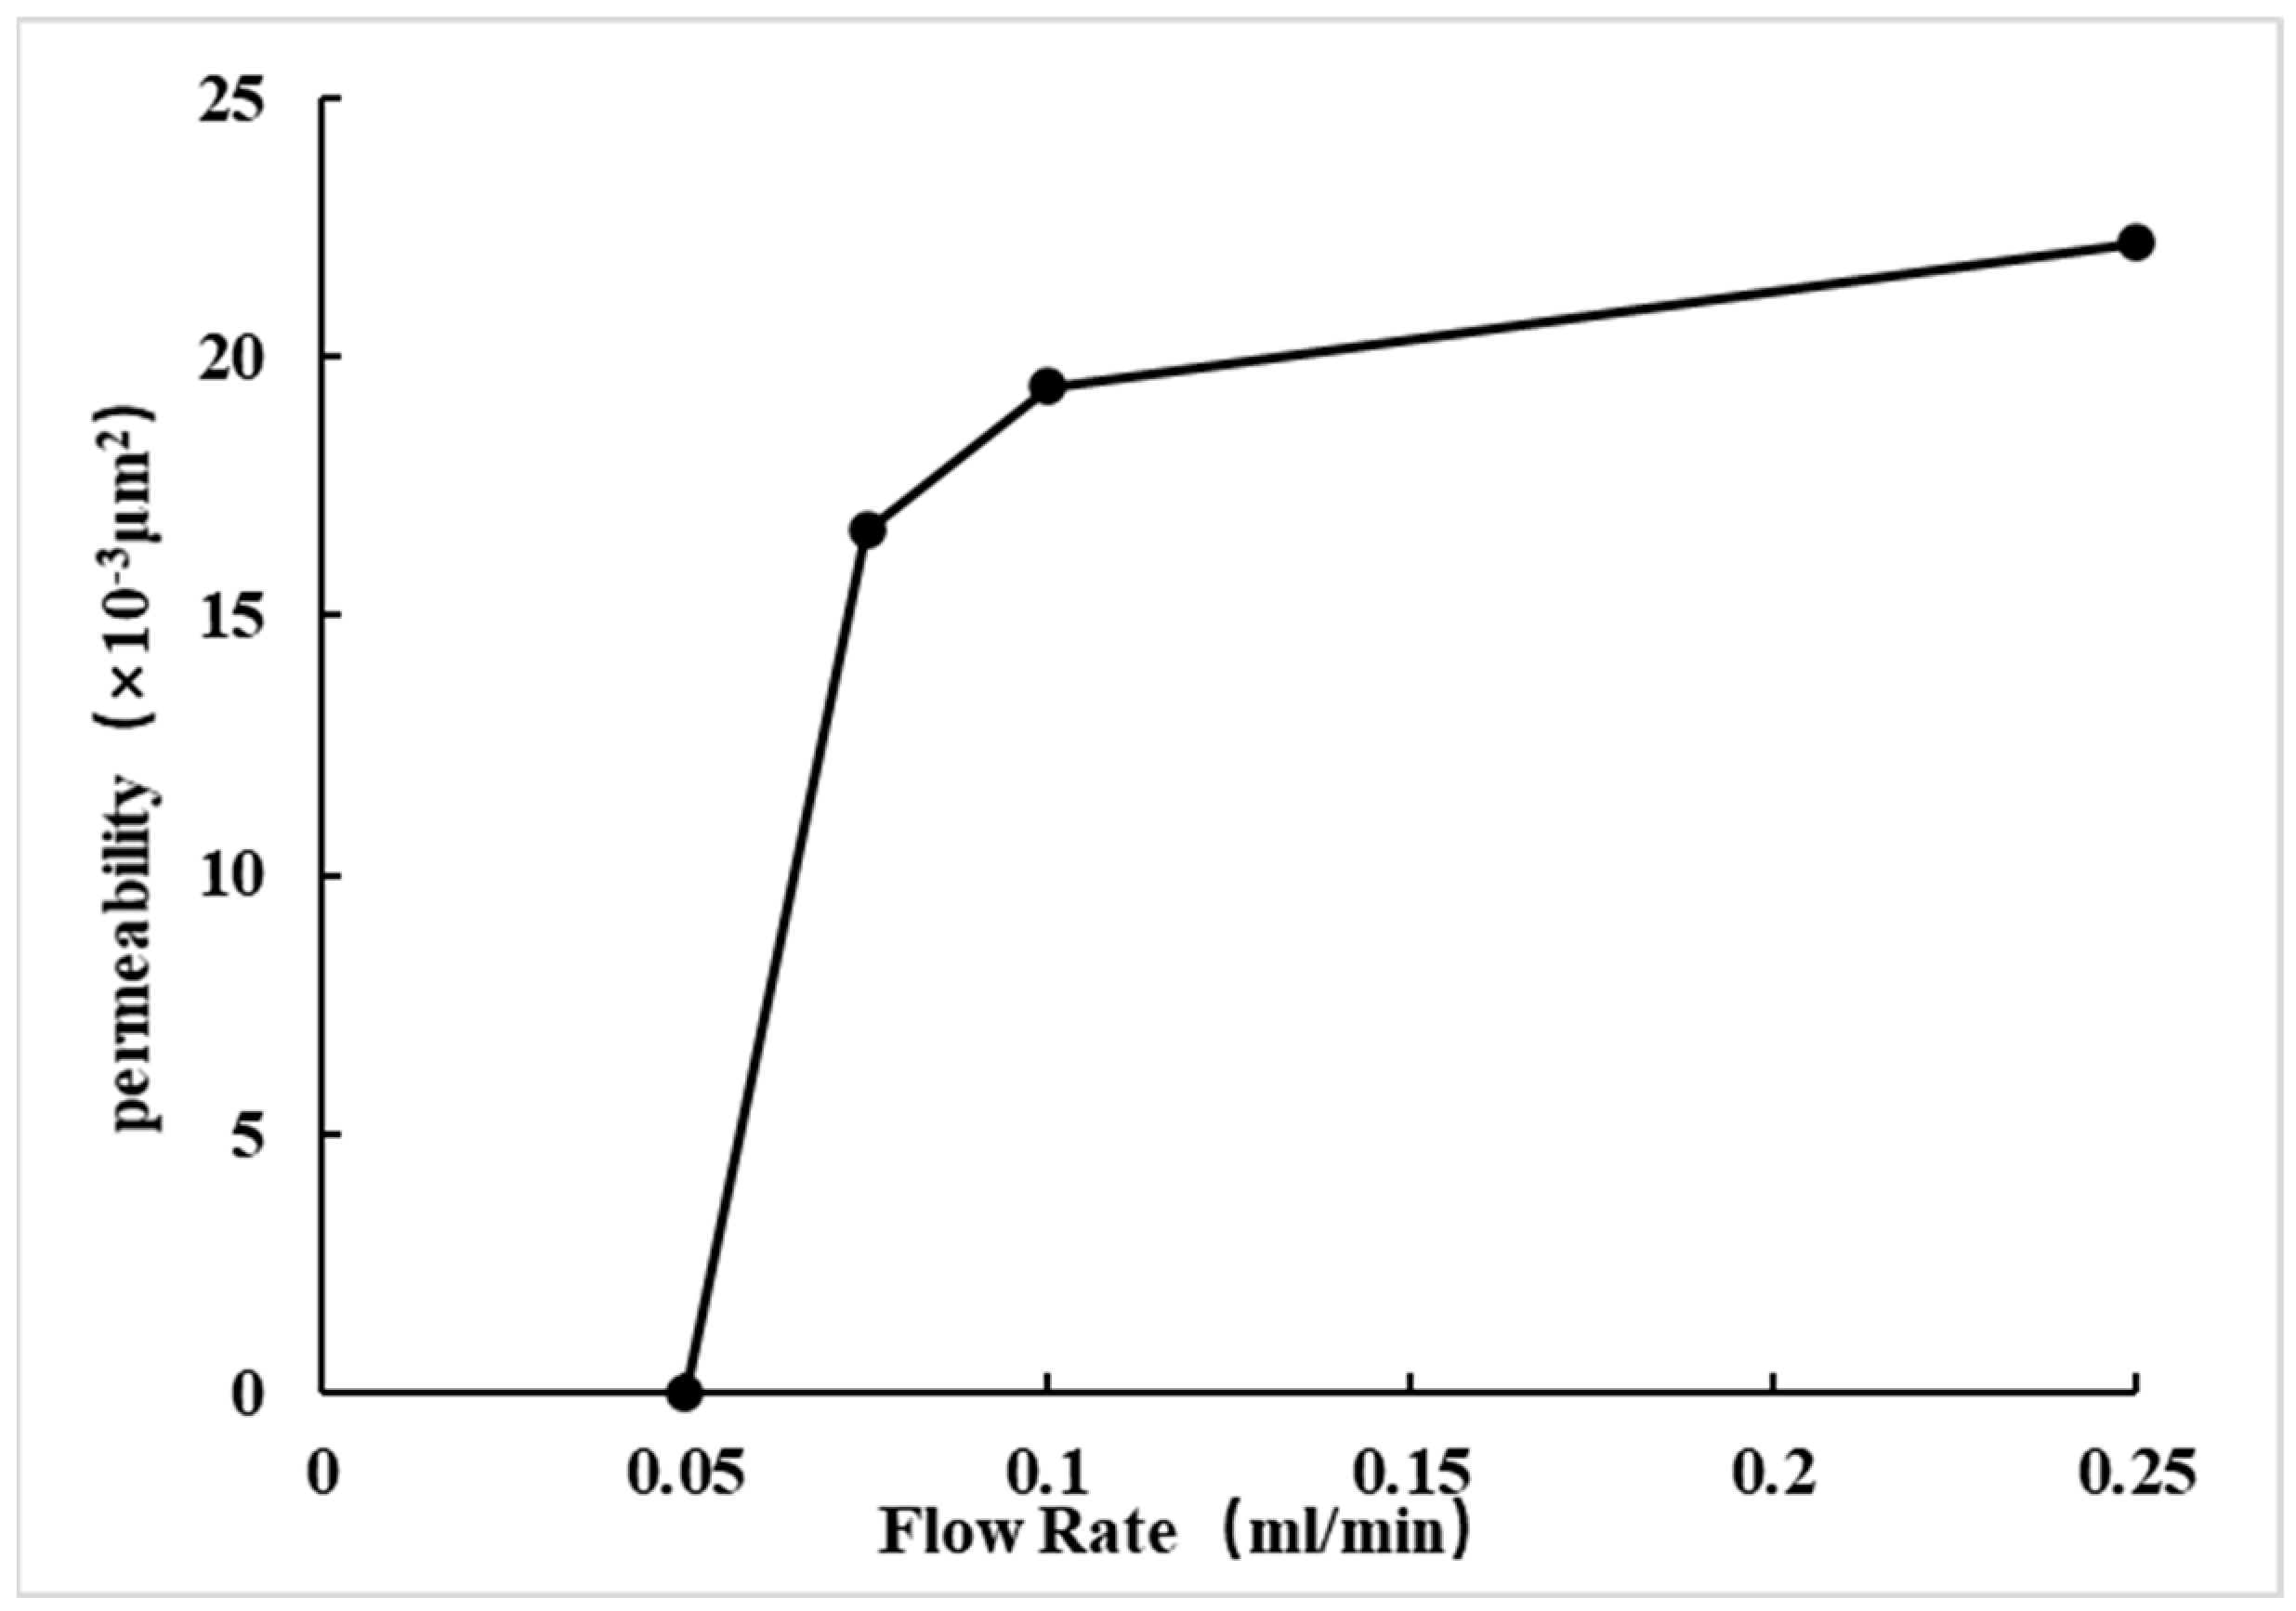
| Flow Rate (mL/min) | Permeability (×10−3 μm2) | Velocity-Sensitive Damage (%) |
|---|---|---|
| 0.05 | 0.036 | \ |
| 0.075 | 0.030 | 16.667 |
| 0.1 | 0.029 | 19.444 |
| 0.25 | 0.028 | 22.222 |
| Parameter Setting | Symbol | Unit |
|---|---|---|
| Formation Pressure (assumed constant pressure) | P | MPa |
| Daily Fixed Water Injection Volume | Q | m3/day |
| Formation Thickness | h | h |
| Formation Porosity | Φ | / |
| Radial Distance of Water Flow | R | m |
| Flow Velocity | v | m/s |
| Time | t | day |
| Formation Permeability | k | ×10−3 μm2 |
| Injection Volume Q (m3/day) | Calculated Rc (m) | Measured Rc (m) | Deviation% |
|---|---|---|---|
| 10 | 9.03 | 9.3 | 2.9 |
| 15 | 9.96 | 10.2 | 2.3 |
| 20 | 12.09 | 11.8 | 2.5 |
| 25 | 13.54 | 14.2 | 2.4 |
| 30 | 16.09 | 16.4 | 1.9 |
Disclaimer/Publisher’s Note: The statements, opinions and data contained in all publications are solely those of the individual author(s) and contributor(s) and not of MDPI and/or the editor(s). MDPI and/or the editor(s) disclaim responsibility for any injury to people or property resulting from any ideas, methods, instructions or products referred to in the content. |
© 2025 by the authors. Licensee MDPI, Basel, Switzerland. This article is an open access article distributed under the terms and conditions of the Creative Commons Attribution (CC BY) license (https://creativecommons.org/licenses/by/4.0/).
Share and Cite
Duan, Z.; Xue, Y.; Zhang, Z.; Yang, L.; Cai, Y. Research on a Quantitative Evaluation Method for Reservoir Damage Induced by Waterflooding Rate Sensitivity in Tight Oil Reservoirs. Energies 2025, 18, 2259. https://doi.org/10.3390/en18092259
Duan Z, Xue Y, Zhang Z, Yang L, Cai Y. Research on a Quantitative Evaluation Method for Reservoir Damage Induced by Waterflooding Rate Sensitivity in Tight Oil Reservoirs. Energies. 2025; 18(9):2259. https://doi.org/10.3390/en18092259
Chicago/Turabian StyleDuan, Zhaoyu, Yongchao Xue, Ziyao Zhang, Lan Yang, and Yongji Cai. 2025. "Research on a Quantitative Evaluation Method for Reservoir Damage Induced by Waterflooding Rate Sensitivity in Tight Oil Reservoirs" Energies 18, no. 9: 2259. https://doi.org/10.3390/en18092259
APA StyleDuan, Z., Xue, Y., Zhang, Z., Yang, L., & Cai, Y. (2025). Research on a Quantitative Evaluation Method for Reservoir Damage Induced by Waterflooding Rate Sensitivity in Tight Oil Reservoirs. Energies, 18(9), 2259. https://doi.org/10.3390/en18092259


