Abstract
This study was conducted to quantitatively evaluate the reservoir damage caused by waterflood-induced velocity sensitivity in the tight oil reservoirs of Block L in the Ordos Basin. This research investigated changes in reservoir pore–throat structure before and after waterflooding through laboratory experiments. A velocity sensitivity characterization model was established as , and the injection volume as Q, and its reliability was validated using both experimental and field data. The results indicate that excessive water injection can lead to permeability damage in the reservoir. Based on this model, the optimal injection rate for Block L was determined to be 16.8 m3/day. Field application of this optimized rate reduced velocity sensitivity-induced particle damage by 21% and improved oil recovery by 1.4%.
1. Introduction
Waterflooding plays an extremely important role in oilfield development. Firstly, waterflooding has a high oil displacement efficiency; by injecting water into the oilfield, more crude oil can be extracted [1]. Additionally, waterflooding can effectively supplement reservoir pressure, thereby maintaining a robust production capacity. Considering both the development costs and revenues, waterflooding offers high economic benefits due to its cost advantages, and thus, it is widely applied in both onshore and offshore oilfields [2,3].
Appropriate water injection can enhance the efficiency of crude oil displacement and increase the ultimate recovery factor of the oilfield. However, excessively rapid or large-volume water injection may cause damage to the injection zone, leading to rate sensitivity effects. The rate sensitivity effect refers to the phenomenon where reservoir permeability changes with variations in fluid velocity, usually due to the migration of clay minerals or fine particles in the reservoir at high flow rates, which then block pore throats [4]. The amount of water injected has a significant impact on the rate sensitivity effect in a reservoir. When the injection rate is too high, it increases the velocity of fluid flowing through the reservoir. This elevated fluid velocity can dislodge fine particles from the rock matrix. Once mobilized, these particles may migrate and accumulate in the pore throats. As a result, the pores become blocked, leading to a reduction in reservoir permeability. This blockage negatively affects fluid flow and can hinder further oil or gas production [5].
The Ordos Basin, located in North-central China, is the second-largest sedimentary basin in the country. It exhibits stable intracratonic structural characteristics, hosts multi-layered hydrocarbon reservoirs, and possesses abundant energy resources. As the core region for major energy bases such as the Chang Qing Oilfield, it holds significant strategic importance in ensuring national energy security. Meanwhile, growing energy shortages have shifted attention toward the development of unconventional oil and gas resources [6]. However, their exploitation is often accompanied by a range of prominent challenges, including reservoir damage and wellbore instability [7].
Currently, with the long-term development of water injection, some wells in the L tight oil reservoirs are experiencing continuously rising injection pressures, difficulties in establishing an effective displacement system between oil and water wells, and issues of “unable to inject water, unable to produce oil”. These challenges have led to reduced oilfield production and operational difficulties [8]. To identify the causes and address these issues during the waterflooding development process and to further guide field operations, this study investigates the damage caused by water injection in the L oilfield.
Considering that the target reservoir is sensitive, the incompatibility of the injected water may be the root cause of the problem. This study systematically examines the pore–throat characteristics and clay mineral changes in the reservoir before and after waterflooding, utilizing existing reservoir physical property data and core experimental data, and evaluates the reservoir sensitivity in the study area [9]. This study clarifies the changes in reservoir characteristics during waterflood development, establishes a characterization model for the rate sensitivity range relative to water injection volume, and reveals the damage mechanism in the target ultra-low permeability oil reservoirs. This work lays a solid foundation for stabilizing production and adjusting development technology policies in the L oilfield.
2. Results Analysis of the Litho-Mineral Assemblage of the Target Reservoir
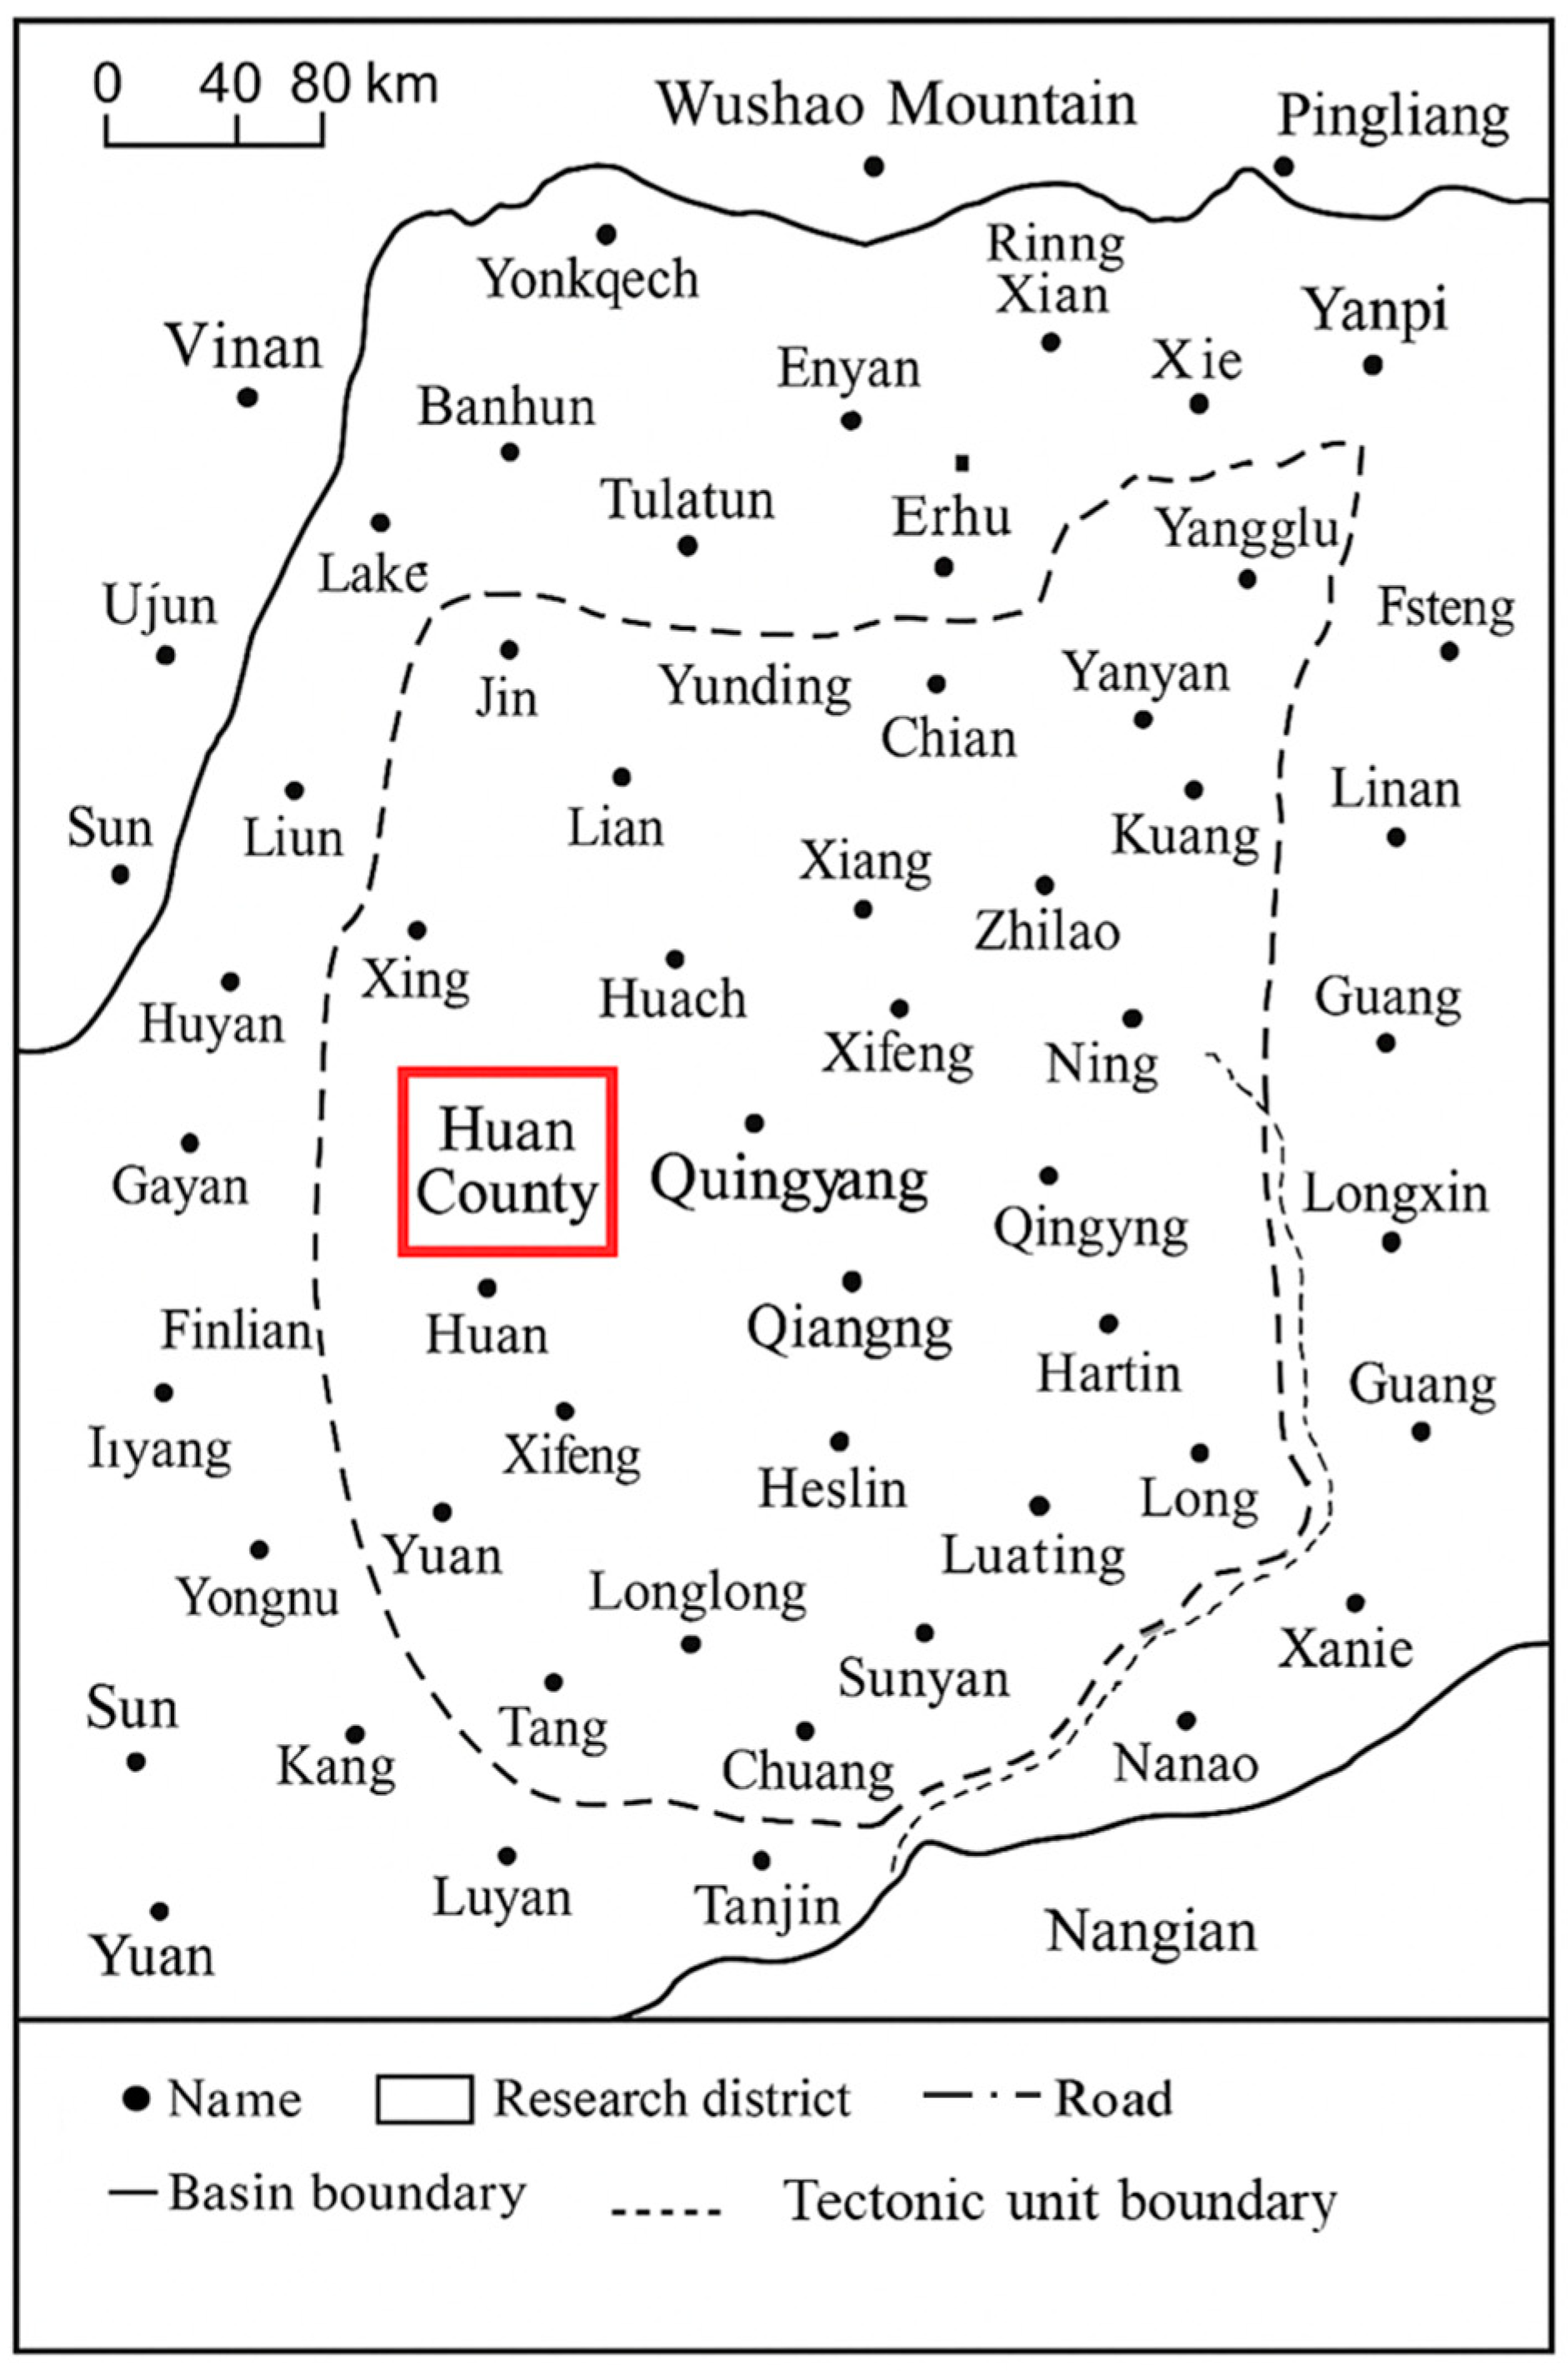
2.1. Geological Setting
The Ordos Basin is a major hydrocarbon-bearing basin in Western China, developed independently as a large Mesozoic intracontinental sedimentary basin following the disintegration of the North China Platform. The present-day structural configuration of the basin is a nearly north–south oriented rectangular shape, featuring a listric morphology characterized by a broad and gentle eastern flank and a steep and narrow western flank. The basin covers an area of approximately 250,000 km2 and represents a typical large-scale, multi-cycle superimposed basin. Tectonically, the Ordos Basin is situated in the transitional zone between the relatively stable eastern tectonic domain and the more active western tectonic domain of China. Stratigraphically, it exhibits a typical dual-layer structure composed of a crystalline basement overlain by the sedimentary cover. The basement mainly consists of metamorphic rocks from the Archean and Proterozoic eras, while the overlying strata are primarily composed of sediments deposited from the Middle to Late Proterozoic. Controlled by regional tectonic evolution, the Ordos Basin is divided into six major tectonic units: the Yi Meng Uplift, Wei Bei Uplift, Western Thrust Belt, Tian Huan Depression, Yi Shan Slope, and the Western Shanxi Flexural Belt, spanning five provinces and autonomous regions—Shaanxi, Gansu, Ningxia, Inner Mongolia, and Shanxi. The western margin of the basin is strongly influenced by the combined effects of the Qaidam, North China, and Song Pan-Gan Zi blocks, resulting in well-developed faulting and folding. In contrast, the central part of the basin, particularly the Yi Shan Slope, is structurally simple, lacking well-defined secondary and tertiary tectonic units, and is dominated by gentle nose-like structures.
From a sedimentary evolution perspective, the Ordos Basin is characterized by long-term regional uplift coupled with continuous subsidence, gentle terrain gradients, and relatively conformable depositional sequences.
Block L is located within a secondary tectonic unit of the Yi Shan Slope, situated on the Northern Shaanxi slope of the Ordos Basin. The geological features of this area are primarily governed by the regional sedimentary evolution. The sedimentary strata exhibit a gentle westward-dipping monocline, with an average gradient of 10 m/km and a dip angle of less than 1°. Structural deformation is minimal, with the development of primarily nose-like structural features. The Chang8 reservoir group in Block L is mainly composed of deltaic facies, dominated by subaqueous distributary channels and interdistributary bay deposits.
2.2. Reservoir Characteristics
The L oilfield is located in the eighth section of the extended unit of the Triassic ultra-low permeability sandstone oilfields in the Ordos Basin, representing a shallow-water deltaic depositional system. This system is characterized by the development of subaqueous distributary channels, estuarine sand bars, distal sand bars, sheet sands, interdistributary bays, and subaqueous natural levees [10]. The predominant rock types are lithic–feldspathic sandstones and feldspathic–lithic sandstones, in which clastic components constitute an average of 91.8% of the rock. These clastic components are mainly composed of quartz (40.6%), feldspar (29.3%), and lithic fragments (21.9%), indicating low compositional maturity. The pore-filling materials are primarily kaolinite and illite, with subordinate amounts of illite–smectite mixed layers, chlorite, and other clay minerals, which have a significant impact on reservoir properties. Table 1 presents the X-ray diffraction (XRD) test results of the reservoir in the L oilfield.
Table 1.
X-Ray Diffraction Test Results for the L Oilfield Reservoir.
The reservoir predominantly exhibits medium-grained sandy structures with grain sizes ranging from 0.25 to 0.5 mm. The grains are well-sorted and range from sub-rounded to sub-angular, with cementation primarily occurring through intergranular bonding, characterized by point contacts between clasts, and displaying low structural maturity [11]. Overall, the reservoir is characterized by low porosity and ultra-low permeability, with porosities between 7% and 12% and permeabilities ranging from 0.04 to 1.00 × 10⁻³ μm2. The primary pore types are intergranular dissolution pores and intergranular pores, leading to relatively poor reservoir properties. Figure 1 shows the casting thin section and scanning electron microscopy (SEM) test results of the reservoir in the L oilfield.
Figure 1.
Tectonic Map of the Ordos Basin.
2.3. Analysis of Changes in Reservoir Pore–Throat Characteristics
Previous studies have shown that after waterflooding development in ultra-low permeability reservoirs, reservoir physical parameters decline, indicating reservoir damage. However, the variation patterns of key parameters such as pore–throat characteristics and clay mineral content during water injection development in the L oilfield remain unclear, and the underlying damage mechanisms are not well understood. Therefore, this study selected core samples from typical wells in the target block and conducted a series of laboratory tests before and after waterflooding, including cast thin sections, high-pressure mercury intrusion (HPMI), nuclear magnetic resonance (NMR), scanning electron microscopy (SEM), X-ray diffraction (XRD), energy dispersive spectroscopy (EDS), and cathodoluminescence (CL). The test data were then analyzed and compared.
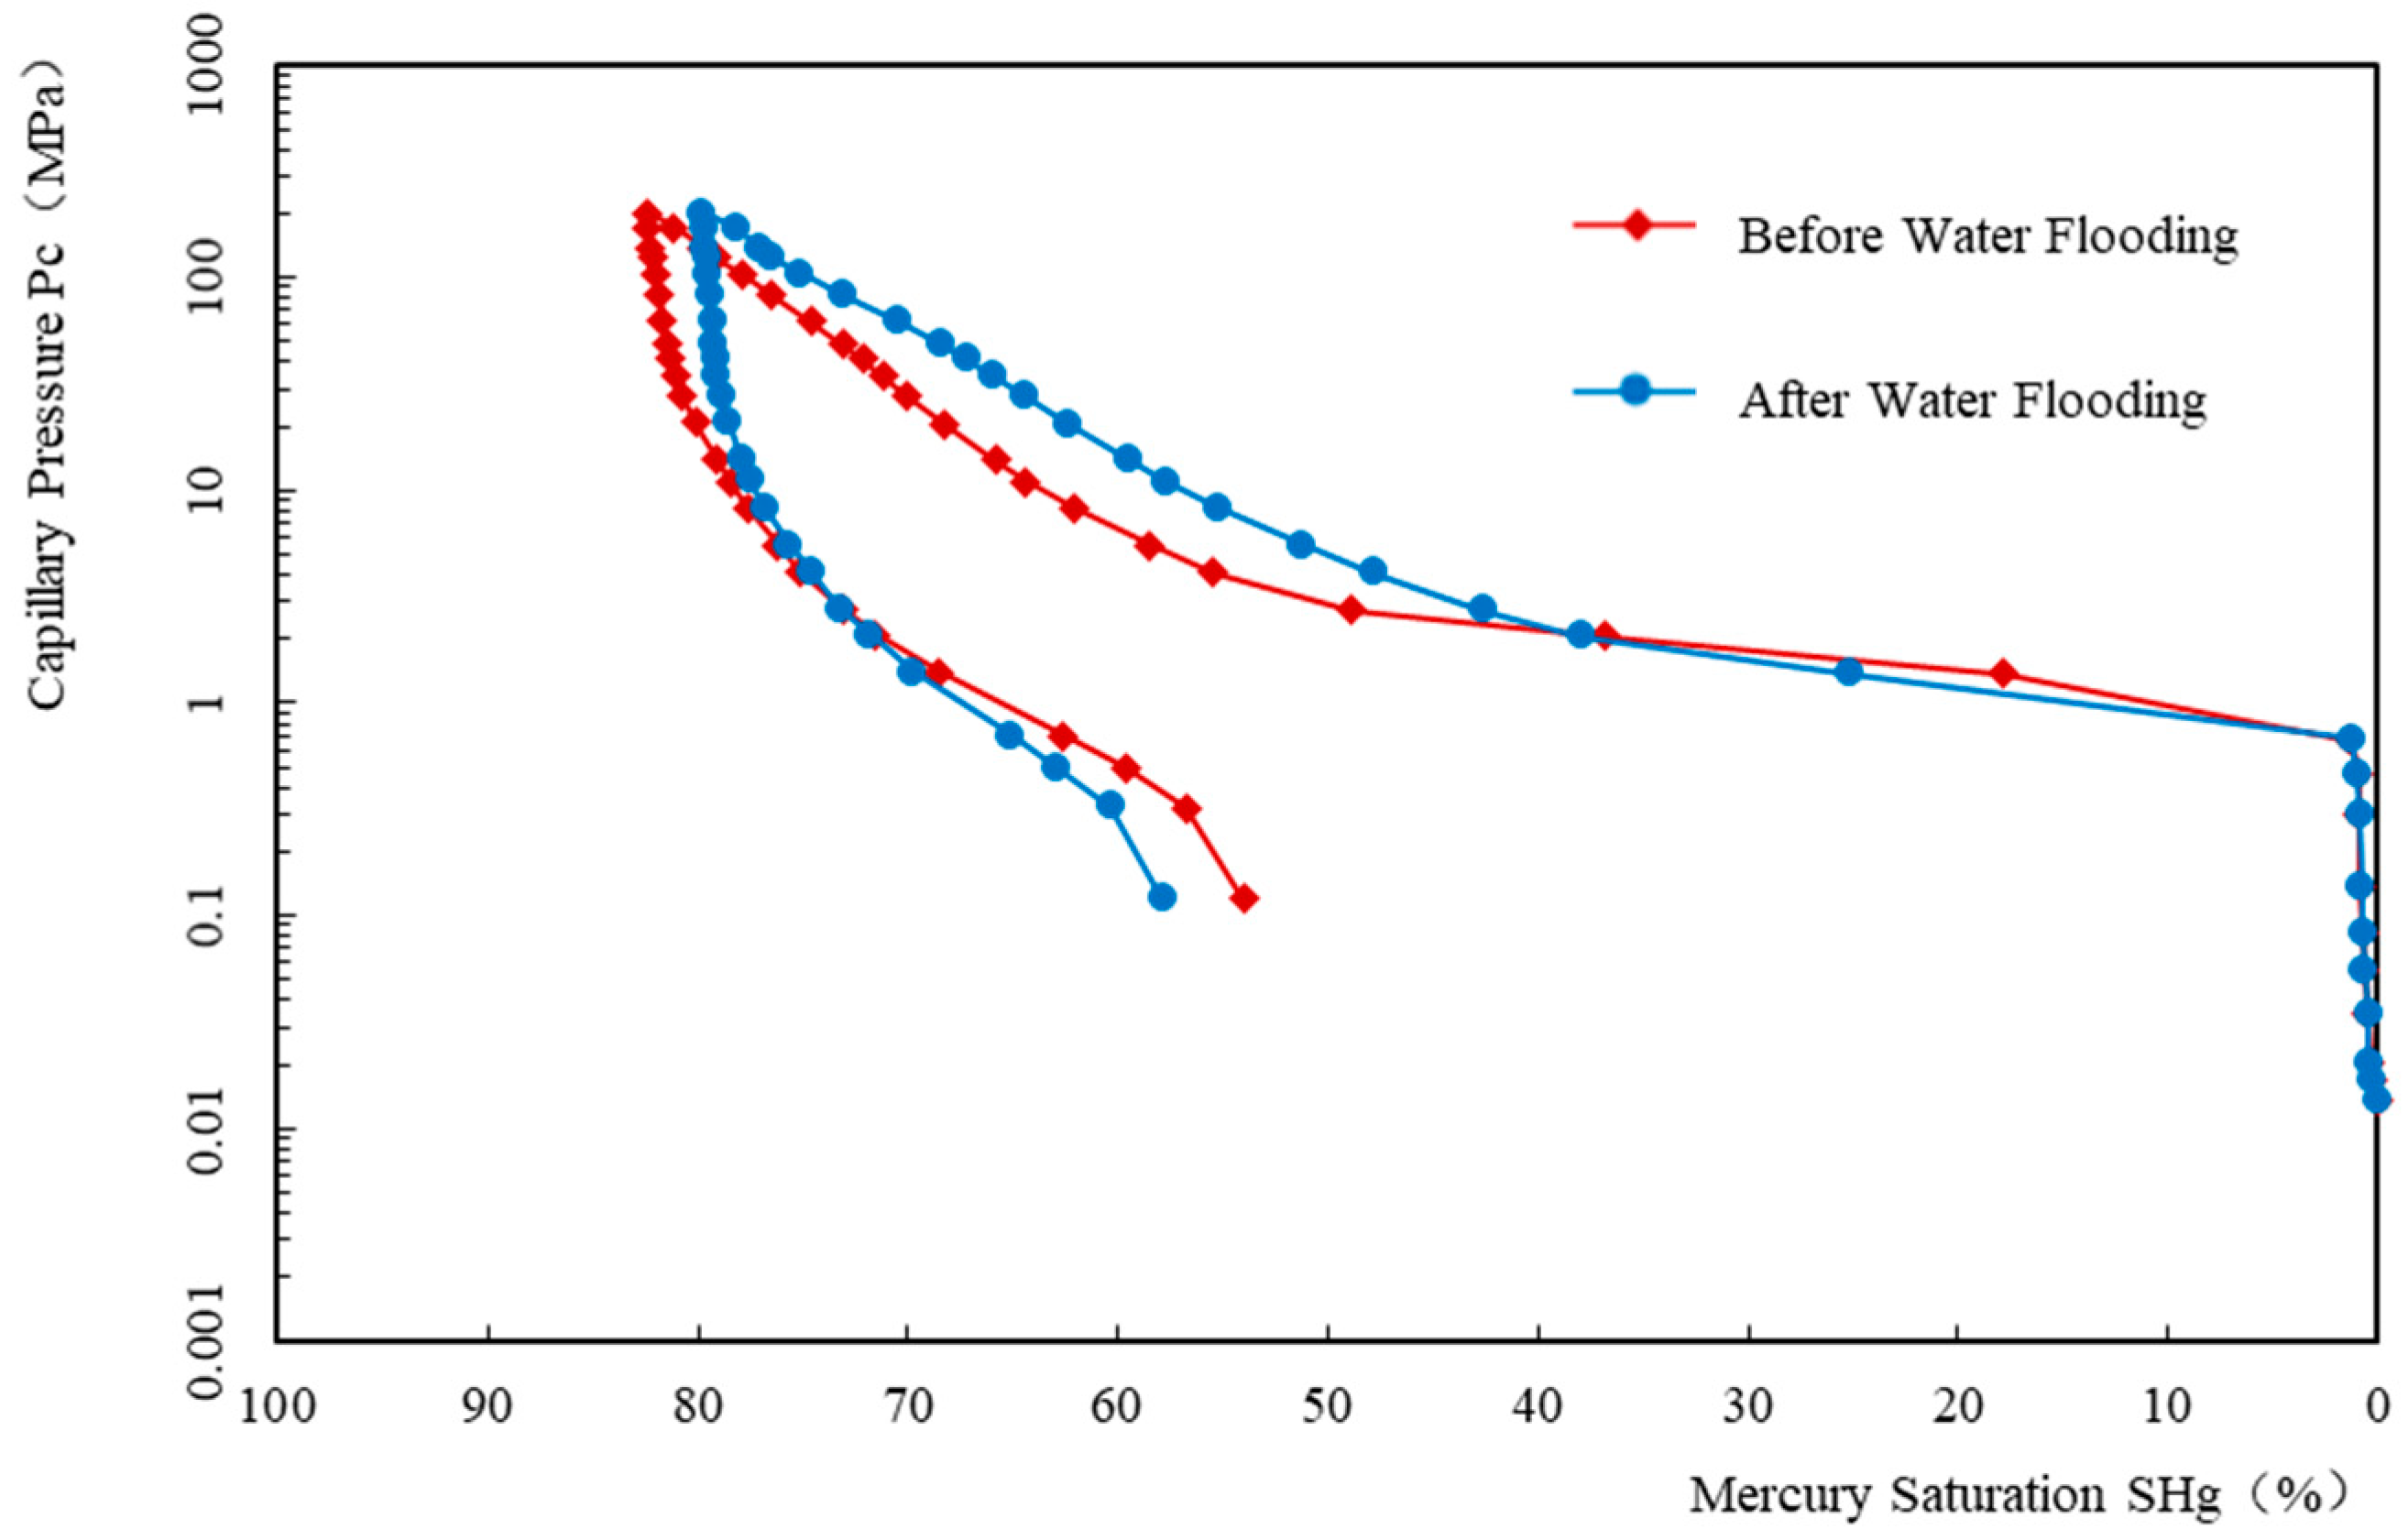
2.3.1. Analysis Based on High-Pressure Mercury Intrusion (HPMI) Results
The morphology and parameters of mercury intrusion curves are effective indicators for evaluating reservoir pore–throat characteristics. The peak shape of the curve reflects the sorting degree and heterogeneity of pore throats, while mercury withdrawal efficiency provides insights into the effectiveness of waterflooding development.
By comparing the mercury intrusion curves before and after waterflooding in Figure 2, along with the relevant parameters in Table 2, it was observed that the mercury intrusion curve inflection point shifted upward after waterflooding, and displacement pressure increased from 0.67 MPa to 0.68 MPa, indicating a reduction in the maximum pore–throat radius from the initial 1.093 μm to 1.085 μm. The median saturation pressure increased from 2.98 MPa before waterflooding to 5.00 MPa, signifying a decrease in the average pore–throat radius from 0.236 μm to 0.203 μm. These results suggest an overall reduction in pore–throat size.
Figure 2.
Cast Thin Section and Scanning Electron Microscope (SEM) Test Results of the L Oilfield Reservoir. (a) Cast thin section, medium-grained sandy structure, showing intergranular pores, feldspathic–lithic sandstone. (b) Cast thin section featuring intergranular dissolution pores and particle dissolution pores, composed of quartz, feldspar, lithic fragments, and mica. (c) Scanning electron microscope (SEM) image, showing the development of intergranular dissolution pores. (d) Scanning electron microscope (SEM) image showing the development of intergranular pores.
Table 2.
Comparison of Mercury Intrusion Curve Parameters Before and After Waterflooding.
Additionally, the slope of the mercury intrusion curve increased after waterflooding, with the peak shape decreasing from 1.153 to 0.825. The coefficient of variation increased from 0.189 to 0.208, while the homogeneity coefficient decreased from 0.216 to 0.187, indicating that the pore–throat size distribution became more dispersed, the sorting deteriorated, and reservoir micro-heterogeneity intensified after waterflooding. The skewness remained positively skewed (coarse-skewed), reflecting the low permeability of the tested core samples and the dominance of small pores. After waterflooding, the skewness decreased from 0.551 to 0.522, indicating a reduction in the proportion of large pores and an increase in the proportion of small pores [12].
Overall, after waterflooding development, the maximum connected pore–throat radius decreased, pore–throat sorting worsened, the proportion of small pores increased, heterogeneity intensified, and the pore structure became more complex. The comparison of mercury intrusion curves before and after water injection is explained in Figure 3. These changes further led to a reduction in waterflooding oil displacement efficiency. The mercury withdrawal efficiency decreased from 34.49% to 27.50%, further supporting these conclusions.
Figure 3.
Comparison of Mercury Intrusion Curves Before and After Waterflooding.
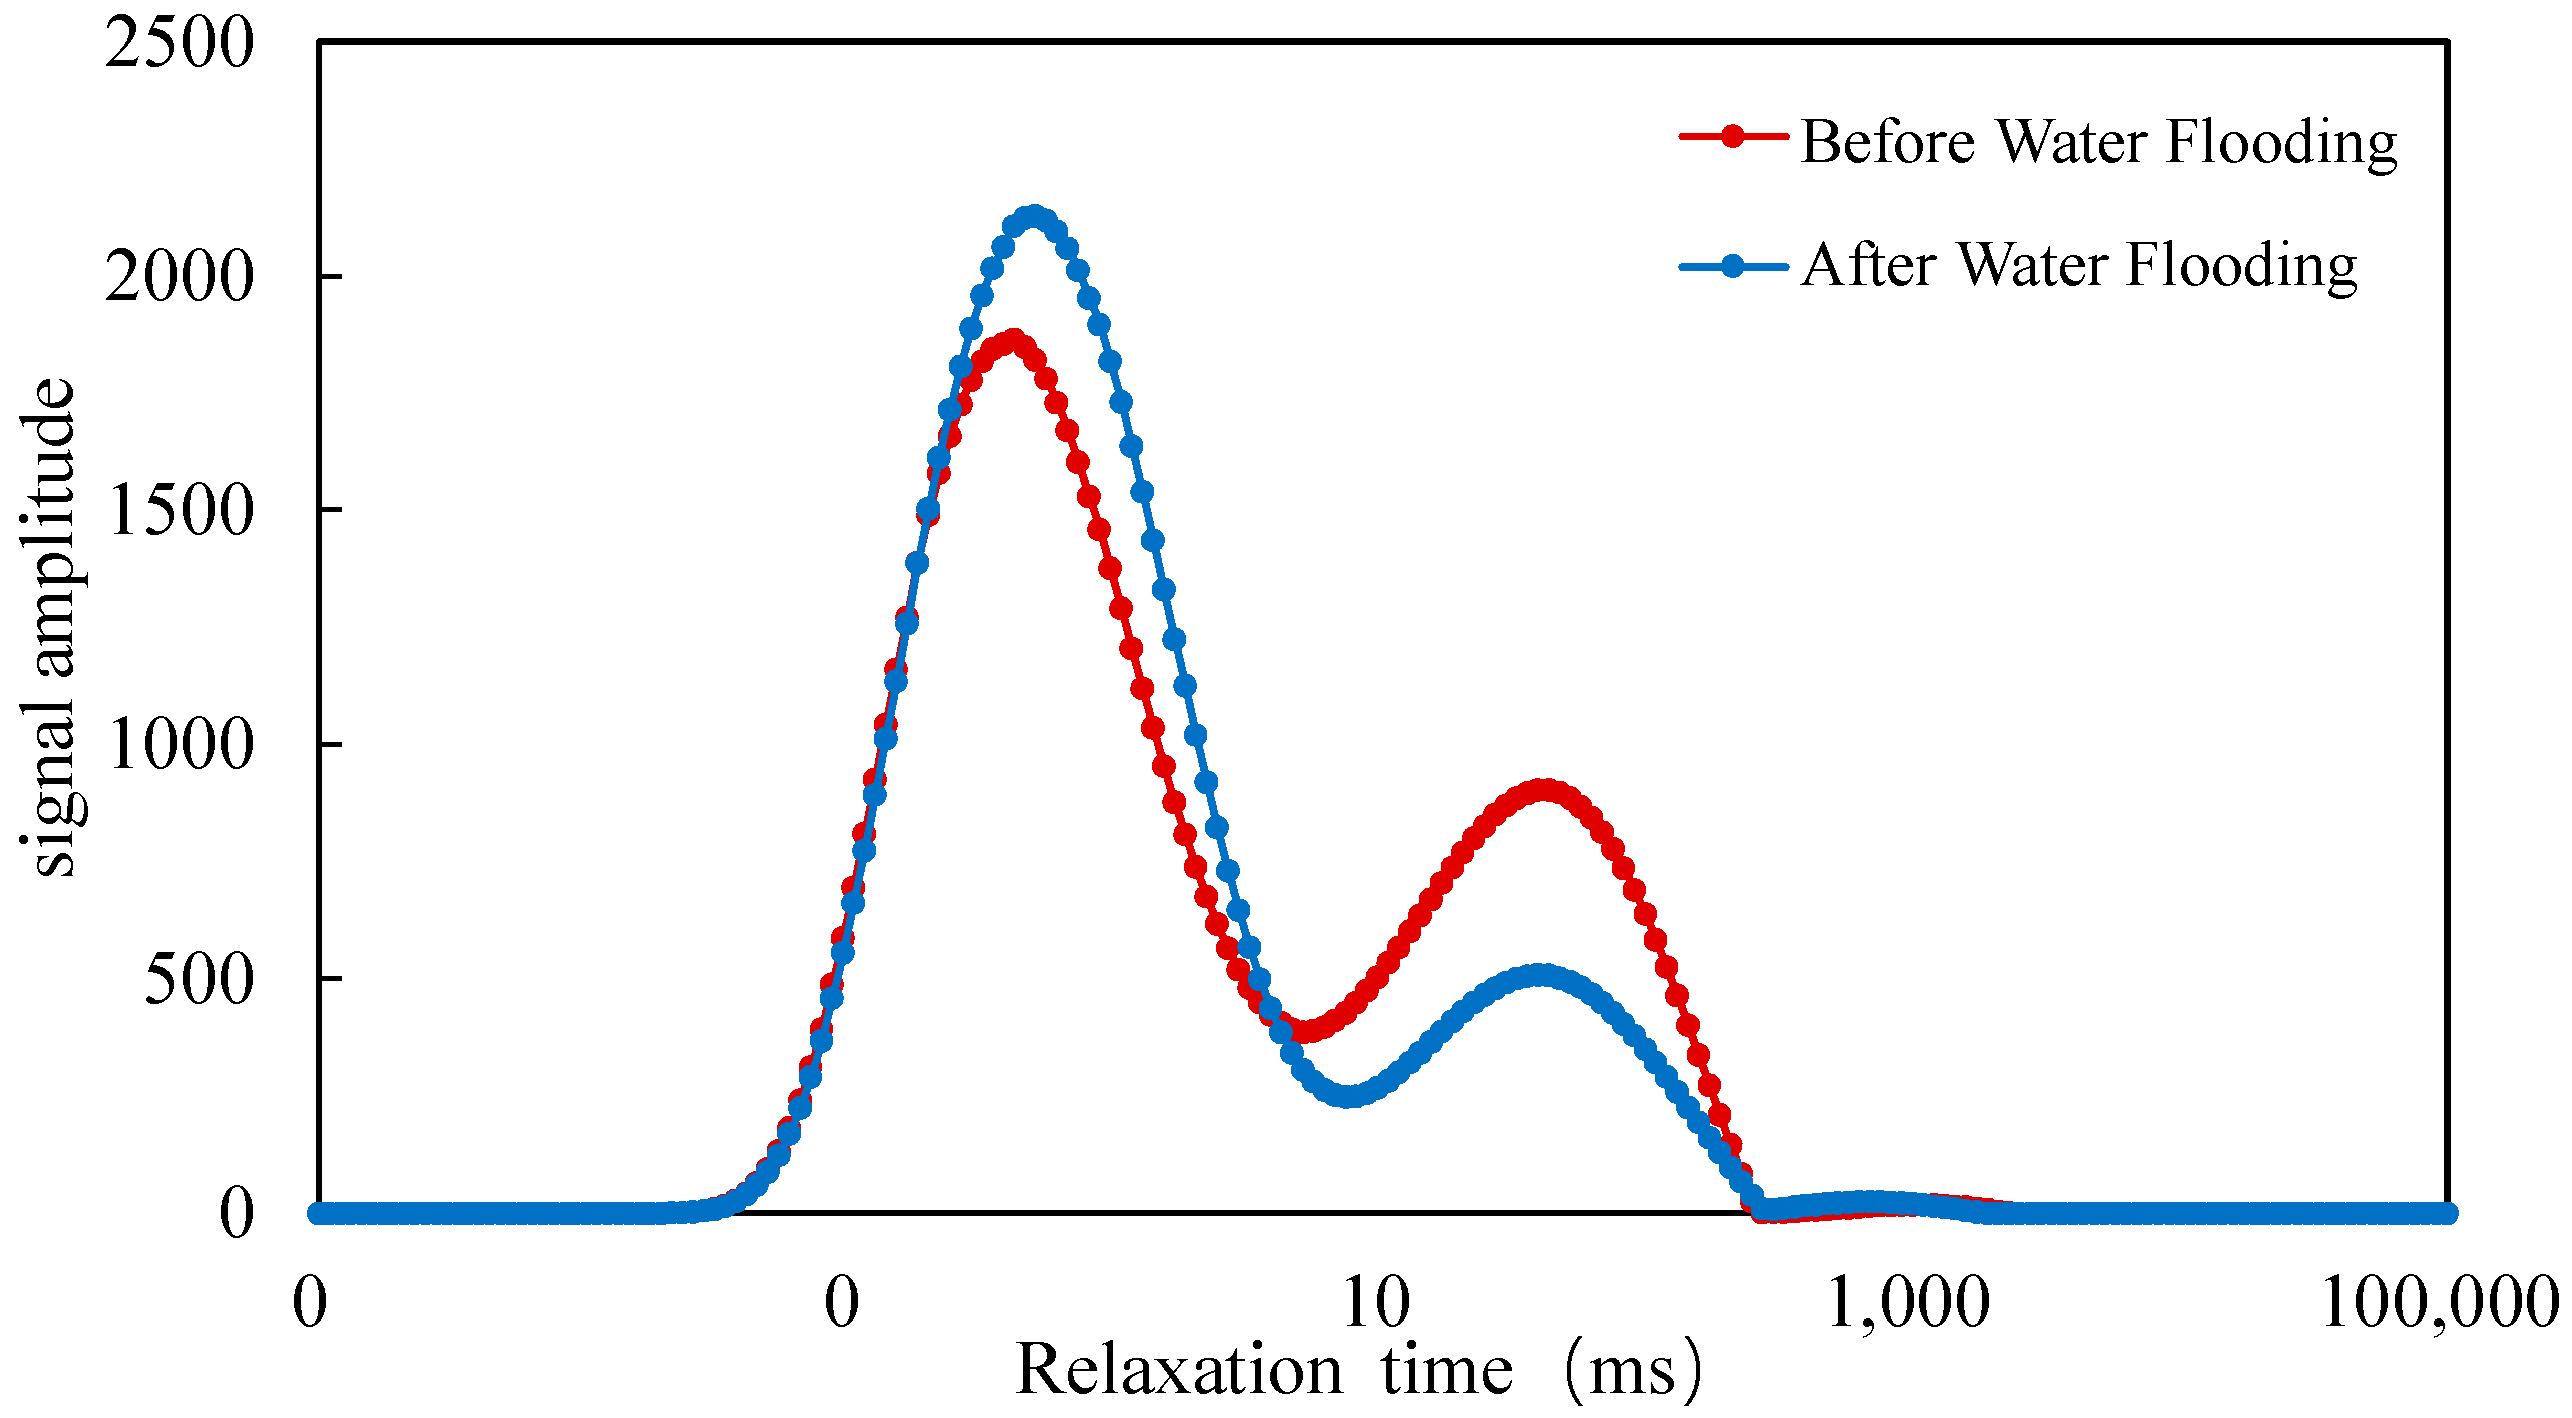
2.3.2. Based on Nuclear Magnetic Resonance T2 Spectra Results
The T2 relaxation time, signal peak, and curve shape in the Nuclear Magnetic Resonance (NMR) T2 spectra can reflect pore size, structure, and pore throat characteristics, such as pore type and distribution in the reservoir [13]. From the nuclear magnetic resonance (NMR) T2 spectra before and after waterflooding in Figure 4, it can be observed that longer T2 relaxation times correspond to pore types such as dissolution pores or primary intergranular pores, while shorter T2 relaxation times correspond to smaller spaces, such as intercrystalline pores. After waterflooding, the proportion of signals corresponding to longer T2 relaxation times significantly decreases. Since longer T2 relaxation times are typically associated with larger pore radii and shorter T2 relaxation times correspond to smaller pore radii, the proportion of larger pore throats in the reservoir decreases significantly after waterflooding, leading to a deterioration in pore size sorting.
Figure 4.
NMR T2 spectra before and after waterflooding.
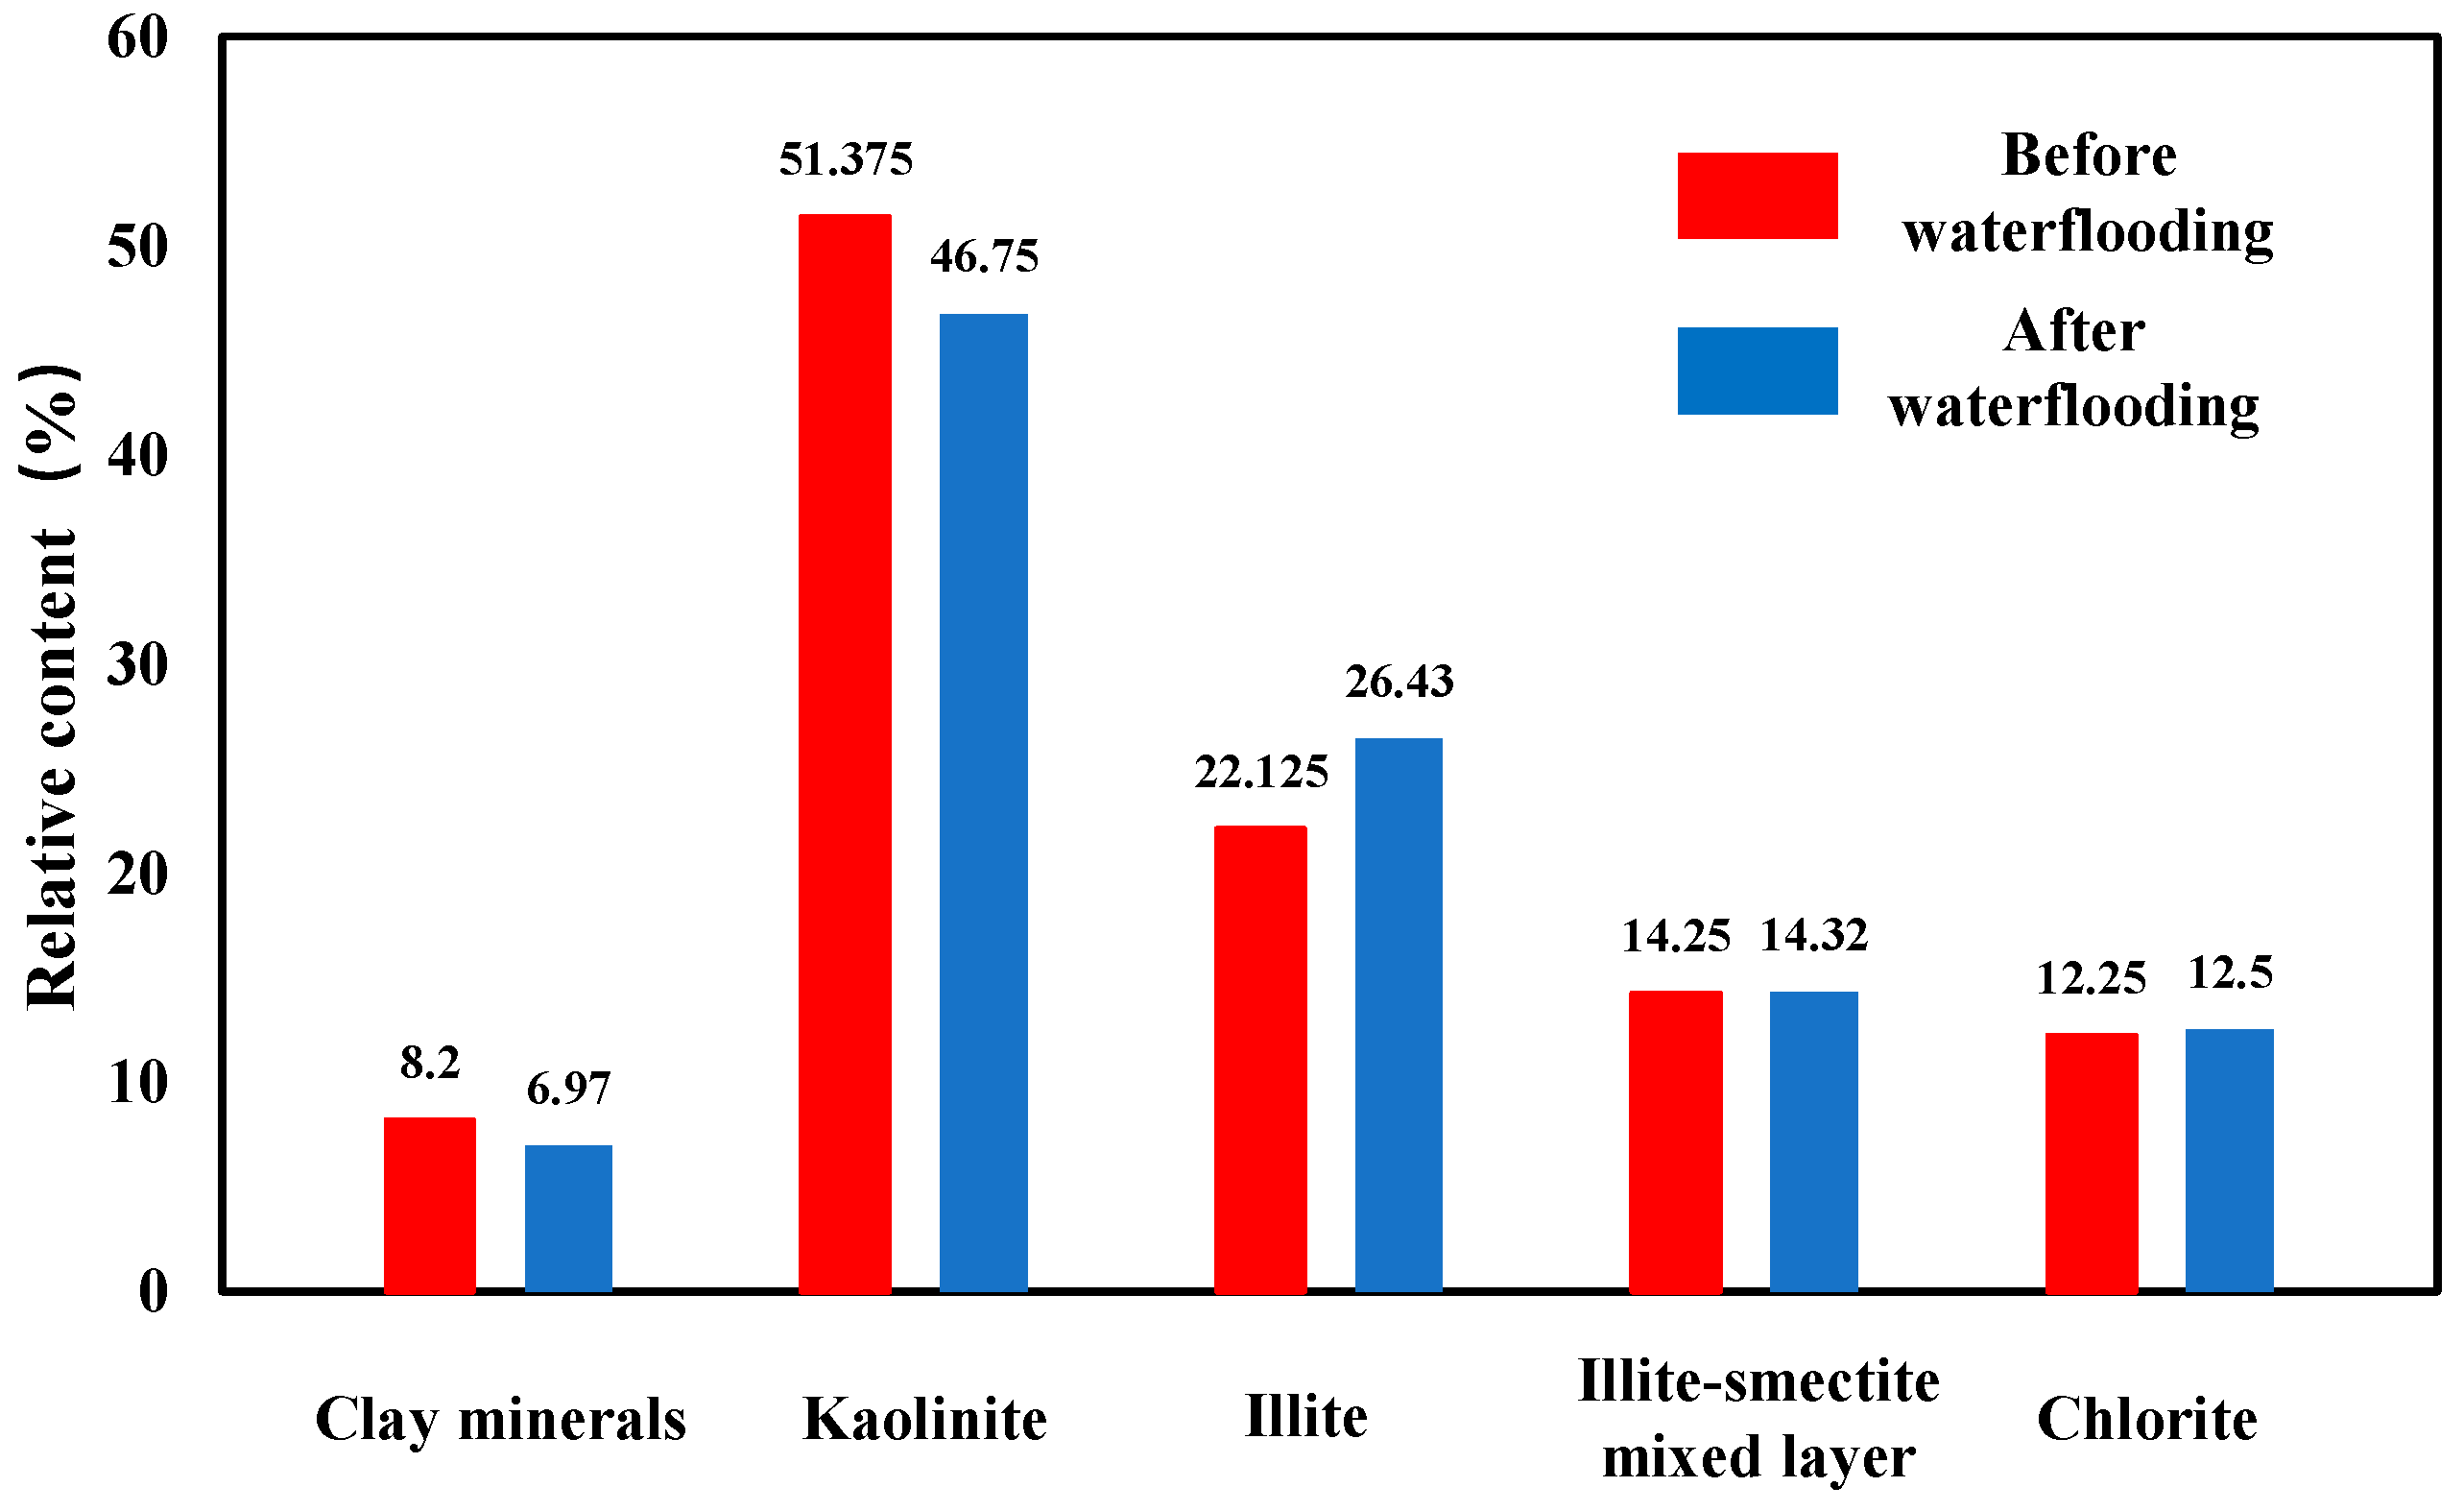
2.4. Analysis of Reservoir Clay Mineral Changes
A comprehensive analysis of scanning electron microscopy (SEM), X-ray diffraction (XRD), cathodoluminescence, and energy spectrum analysis results indicates that the primary clay minerals in this area are kaolinite, illite, montmorillonite, and chlorite, with kaolinite and illite being dominant, having relative contents of 51.38% and 20.75%, respectively.
Kaolinite typically exists in platy or book-like structures. Under high fluid flow velocity conditions, kaolinite particles may detach from their original positions and migrate with the fluid. Due to the relatively large cross-sectional area of kaolinite flakes, they are prone to clogging pore throats, obstructing fluid flow, and reducing reservoir permeability [14,15,16]. Illite, which appears in platy or fibrous forms, tends to form a “bridging” structure in the pores. Multiple illite particles interconnect, leading to blockages in the pore throats, further restricting fluid movement and reducing reservoir permeability [17].
From the scanning electron microscope (SEM) results in Figure 5, it can be observed that before waterflooding, kaolinite occurs as aggregates within the sandstone pores, maintaining a relatively complete crystal structure. After waterflooding, kaolinite undergoes mechanical fragmentation and migrates with the fluid, ultimately accumulating and clogging the pore throats. This change in kaolinite is one of the key factors contributing to the reduction in permeability in waterflooded reservoirs.
Figure 5.
Comparison of scanning electron microscopy before and after waterflooding injury. (a) Before waterflooding, kaolinite appears in a vermicular form with a relatively intact crystal structure. (b) After waterflooding, kaolinite becomes fragmented and migrates to fill the dissolution pores.
By comparing the X-ray diffraction (XRD) test data before and after waterflooding in Figure 6, it can be concluded that the total clay mineral content in the rock decreases after waterflooding, dropping from 8.2% to 6.97%. Additionally, the content of kaolinite, a velocity-sensitive mineral, declines from 51.38% to 46.75%.
Figure 6.
Comparison of Relative Clay Mineral Content Before and After Waterflood-Induced Damage.
After water injection, the total clay mineral content decreased from 8.2% to 6.97%, and the proportion of velocity-sensitive mineral kaolinite decreased from 51.38% to 46.75%. This indicates that clay minerals underwent migration and pore–throat blockage during the waterflooding process. Kaolinite, typically present in platy or book-like morphologies, is prone to detachment from its original position under high-velocity fluid flow and can migrate with the fluid, ultimately leading to blockage of pore throats. This migration behavior directly results in permeability reduction and constitutes a primary mechanism of the velocity sensitivity effect. Experimental analyses, including high-pressure mercury intrusion, nuclear magnetic resonance (NMR), and scanning electron microscopy (SEM), revealed a decrease in pore–throat radius, deterioration in pore sorting, and significant kaolinite migration following waterflooding. These results confirm that the observed permeability impairment is primarily due to velocity-sensitive damage.
3. Experimental Analysis of Velocity-Sensitive Damage to the Reservoir
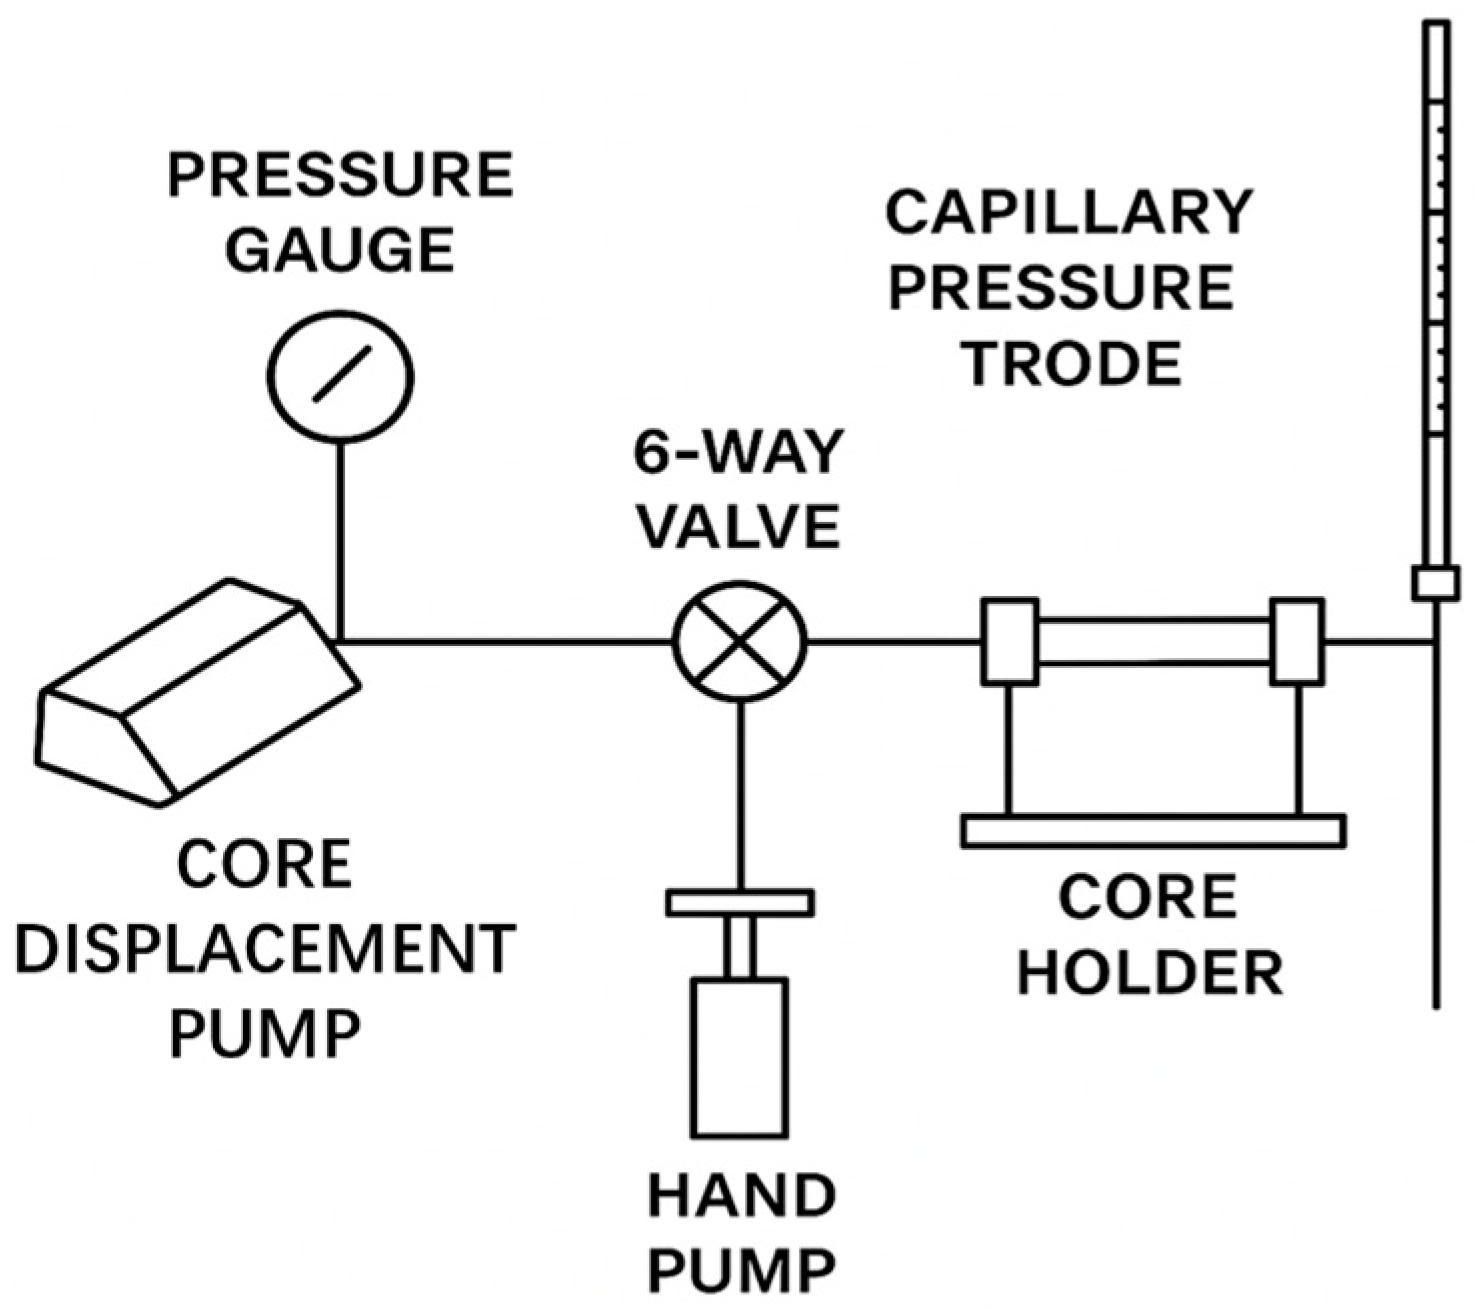
3.1. Experimental Equipment and Materials
The experimental setup consists of a core displacement pump, pressure gauges, a six-way valve, a hand pump, a core holder, and a capillary measuring tube, as shown in Figure 7. This system is designed to simulate formation pressure and monitor permeability changes under varying flow rates. Additionally, a microscope, electronic balance, and chemical reagents are employed to analyze core structure and fluid effects. The experimental procedure follows the industry standard, with controlled flow rate gradients applied to assess the degree of velocity-sensitive damage in the reservoir.
Figure 7.
Schematic Diagram of the Experimental Apparatus.
3.2. Experimental Objective
In response to issues such as the continuous increase in injection pressure and difficulties in water injection in the L reservoir, an analysis of reservoir sensitivity was conducted. The aim is to clarify the changes in reservoir characteristics before and after damage, identify the causes of the increase in injection pressure, and understand the waterflood propagation patterns under different reservoir conditions.di
3.3. Experimental Design
The experimental samples were sourced from the L reservoir, consisting of cylindrical core samples with a lithology of tight sandstone, as shown in Figure 8. To achieve the research objectives, core samples were selected for velocity impact experiments (three groups). Three groups of core samples with different permeability levels were chosen to investigate the effect of injection velocity on permeability, as shown in Table 3. The aim was to study the relationship between reservoir permeability changes and fluid flow velocity within the reservoir and to determine the critical flow velocity. The content of the rock photographs is as follows:
Figure 8.
Rock sample photographs.
Table 3.
Physical Property Information of Rock Samples.
The experimental samples need to be pretreated. All samples were placed in a drying oven at 70 °C for 3 days. Afterward, the samples for the velocity impact experiment were saturated with formation water. The saturation information is as follows Table 4:
Table 4.
Sample Saturation Information.
3.4. Experimental Procedure
- Vacuum core samples were saturated using formation water;
- The core samples were placed into the core holder, ensuring that the liquid flow direction in the core aligns with the gas flow direction used during permeability measurement. The confining pressure was set to 2.0 MPa and maintained throughout the experiment, kept at 1.5–2.0 MPa higher than the core inlet pressure;
- Fluids were injected at flow rates of 0.05, 0.075, 0.10, 0.25, 0.50, 0.75, 1.0, 1.5, and 2.0 cm3/min, with each rate corresponding to an injection volume of approximately 3–4 pore volumes (PV). After each injection stage, the core was treated before proceeding to the next flow rate. Measurements were conducted sequentially for each flow condition;
- If the pressure gradient exceeds 3 MPa/cm before reaching a flow rate of 2.0 cm3/min, and permeability does not show a significant decline with increasing flow rate, the core is considered unaffected by velocity-sensitive damage, and the experiment is concluded. If permeability damage exceeds 20%, the experiment is terminated.
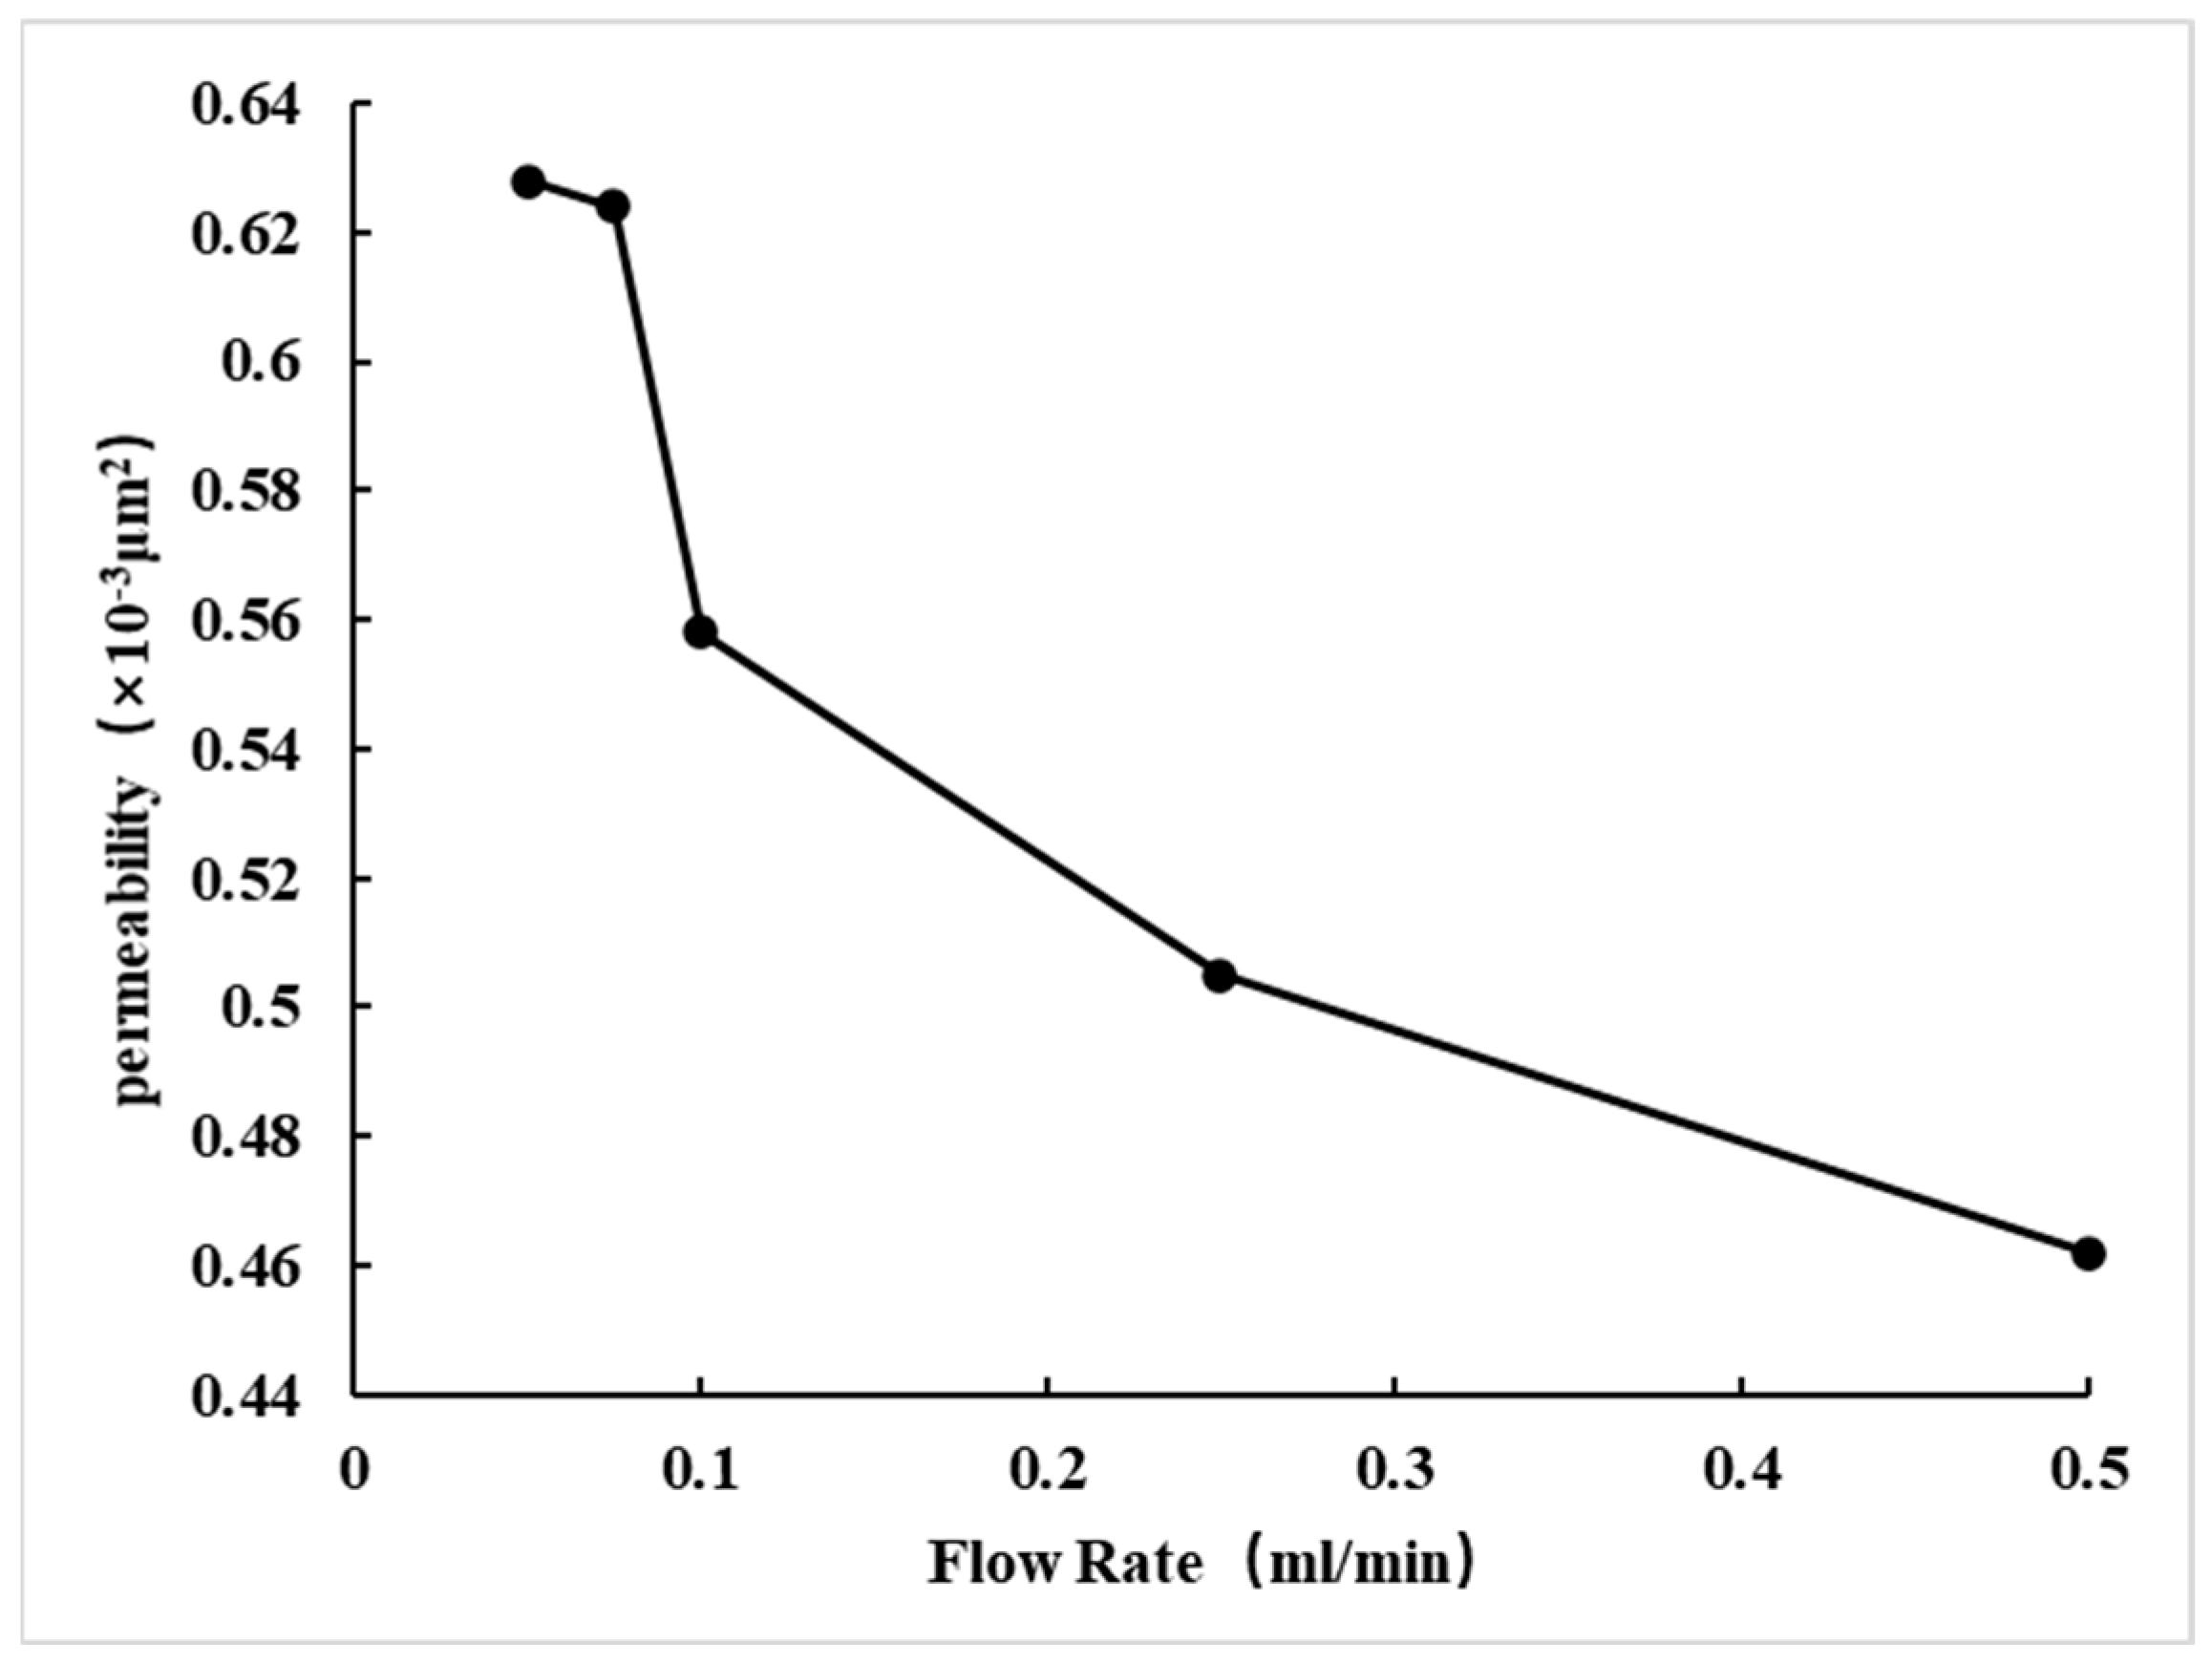
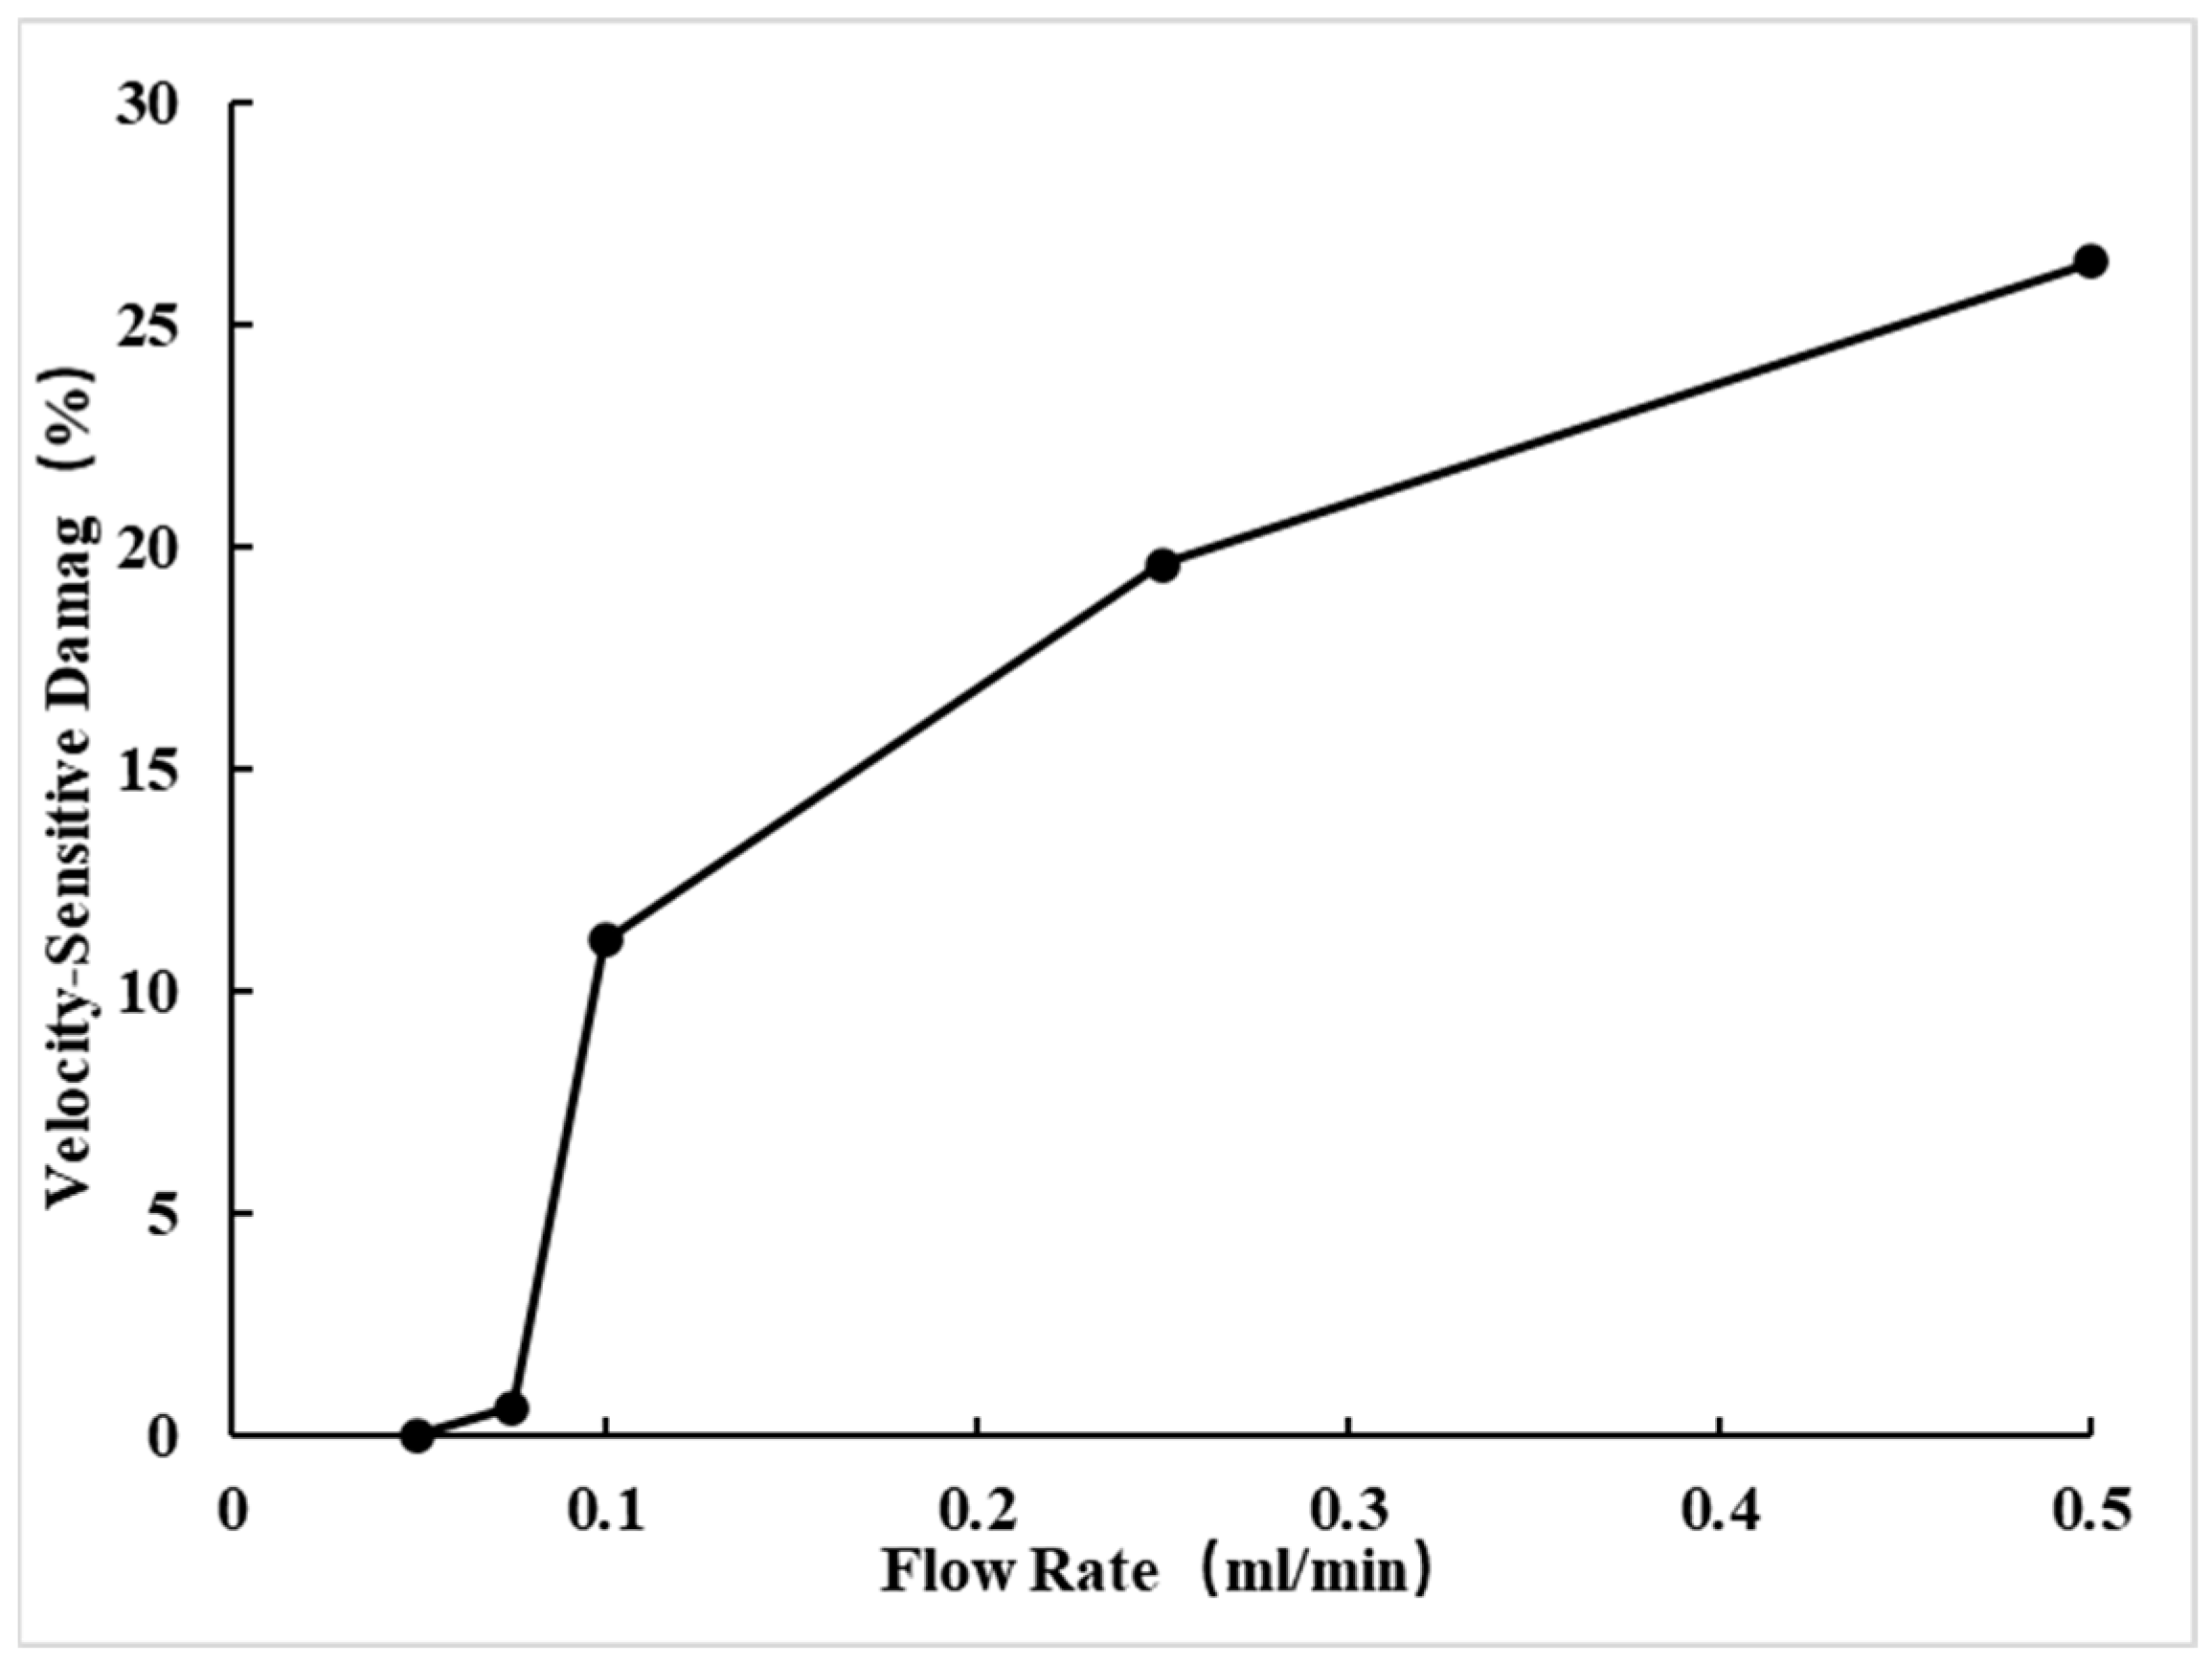
3.5. Experimental Results Analysis
- Permeability Greater Than 1 × 10⁻³ μm2
For core sample No. 52, the gas-measured permeability is 1.442 × 10⁻³ μm2, which is greater than 1 × 10⁻³ μm2. As the flow rate increases, the liquid-measured permeability gradually decreases, and the degree of permeability reduction due to rate sensitivity progressively increases, as shown in Table 5 and Figure 9 and Figure 10. When the flow rate reaches 0.5 mL/min, the degree of permeability reduction due to rate sensitivity reaches 26.433%, exceeding 20%. Thus, the critical flow velocity is determined to be 0.25 mL/min.
Table 5.
Velocity–Sensitivity Experiment Results for Sample No. 52.
Figure 9.
Permeability Variation in Sample No. 52 Liquid.
Figure 10.
Variation in Speed Damage Rate for Sample No. 52.
- 2.
- Permeability Range: 0.3~1 × 10⁻³ μm2
For Core No. 73, the gas-measured permeability falls within the range of 0.3~1 × 10⁻³ μm2. As the flow rate increases, the liquid-measured permeability gradually decreases, while the speed-sensitive damage value progressively increases, as shown in Table 6, Figure 11 and Figure 12. When the flow rate reaches 0.5 mL/min, the speed-sensitive damage value reaches 20.144%, determining the critical flow rate to be 0.25 mL/min.
Table 6.
Velocity Sensitivity Experiment Results for Sample No. 73.
Figure 11.
Permeability Variation in Sample No. 73 Liquid.
Figure 12.
Variation in Speed Damage Rate for Sample No. 73.
- 3.
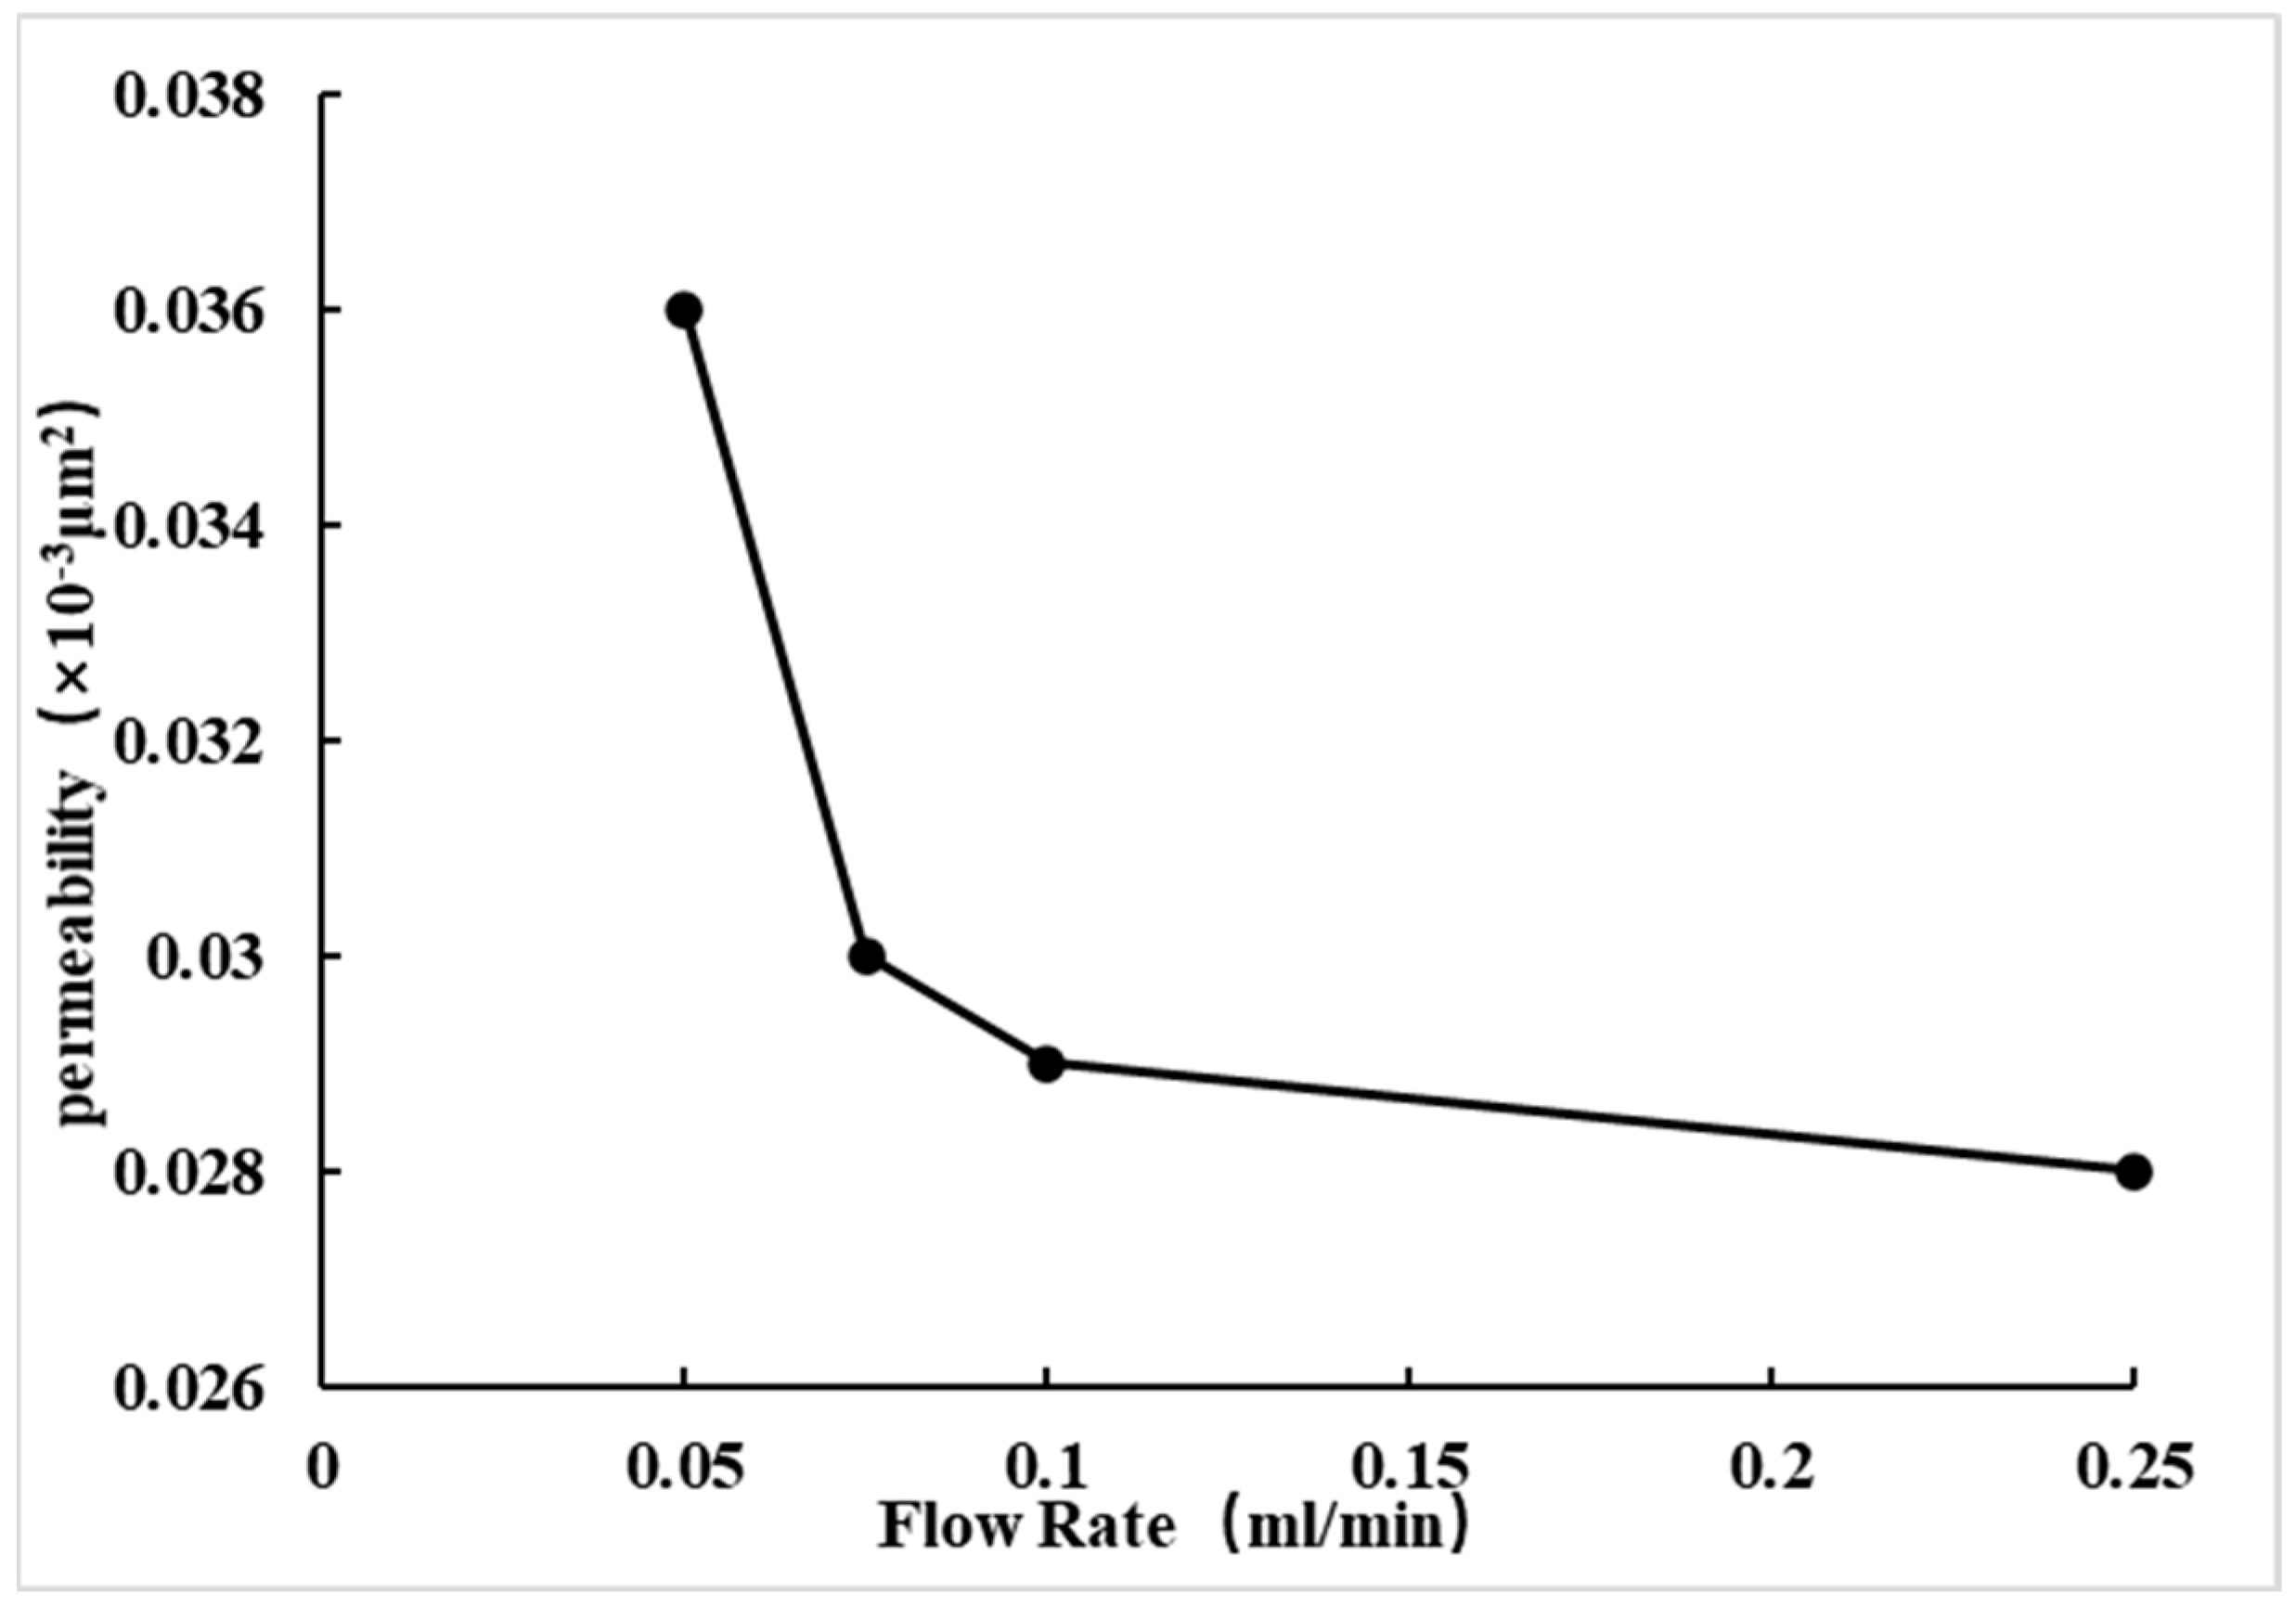
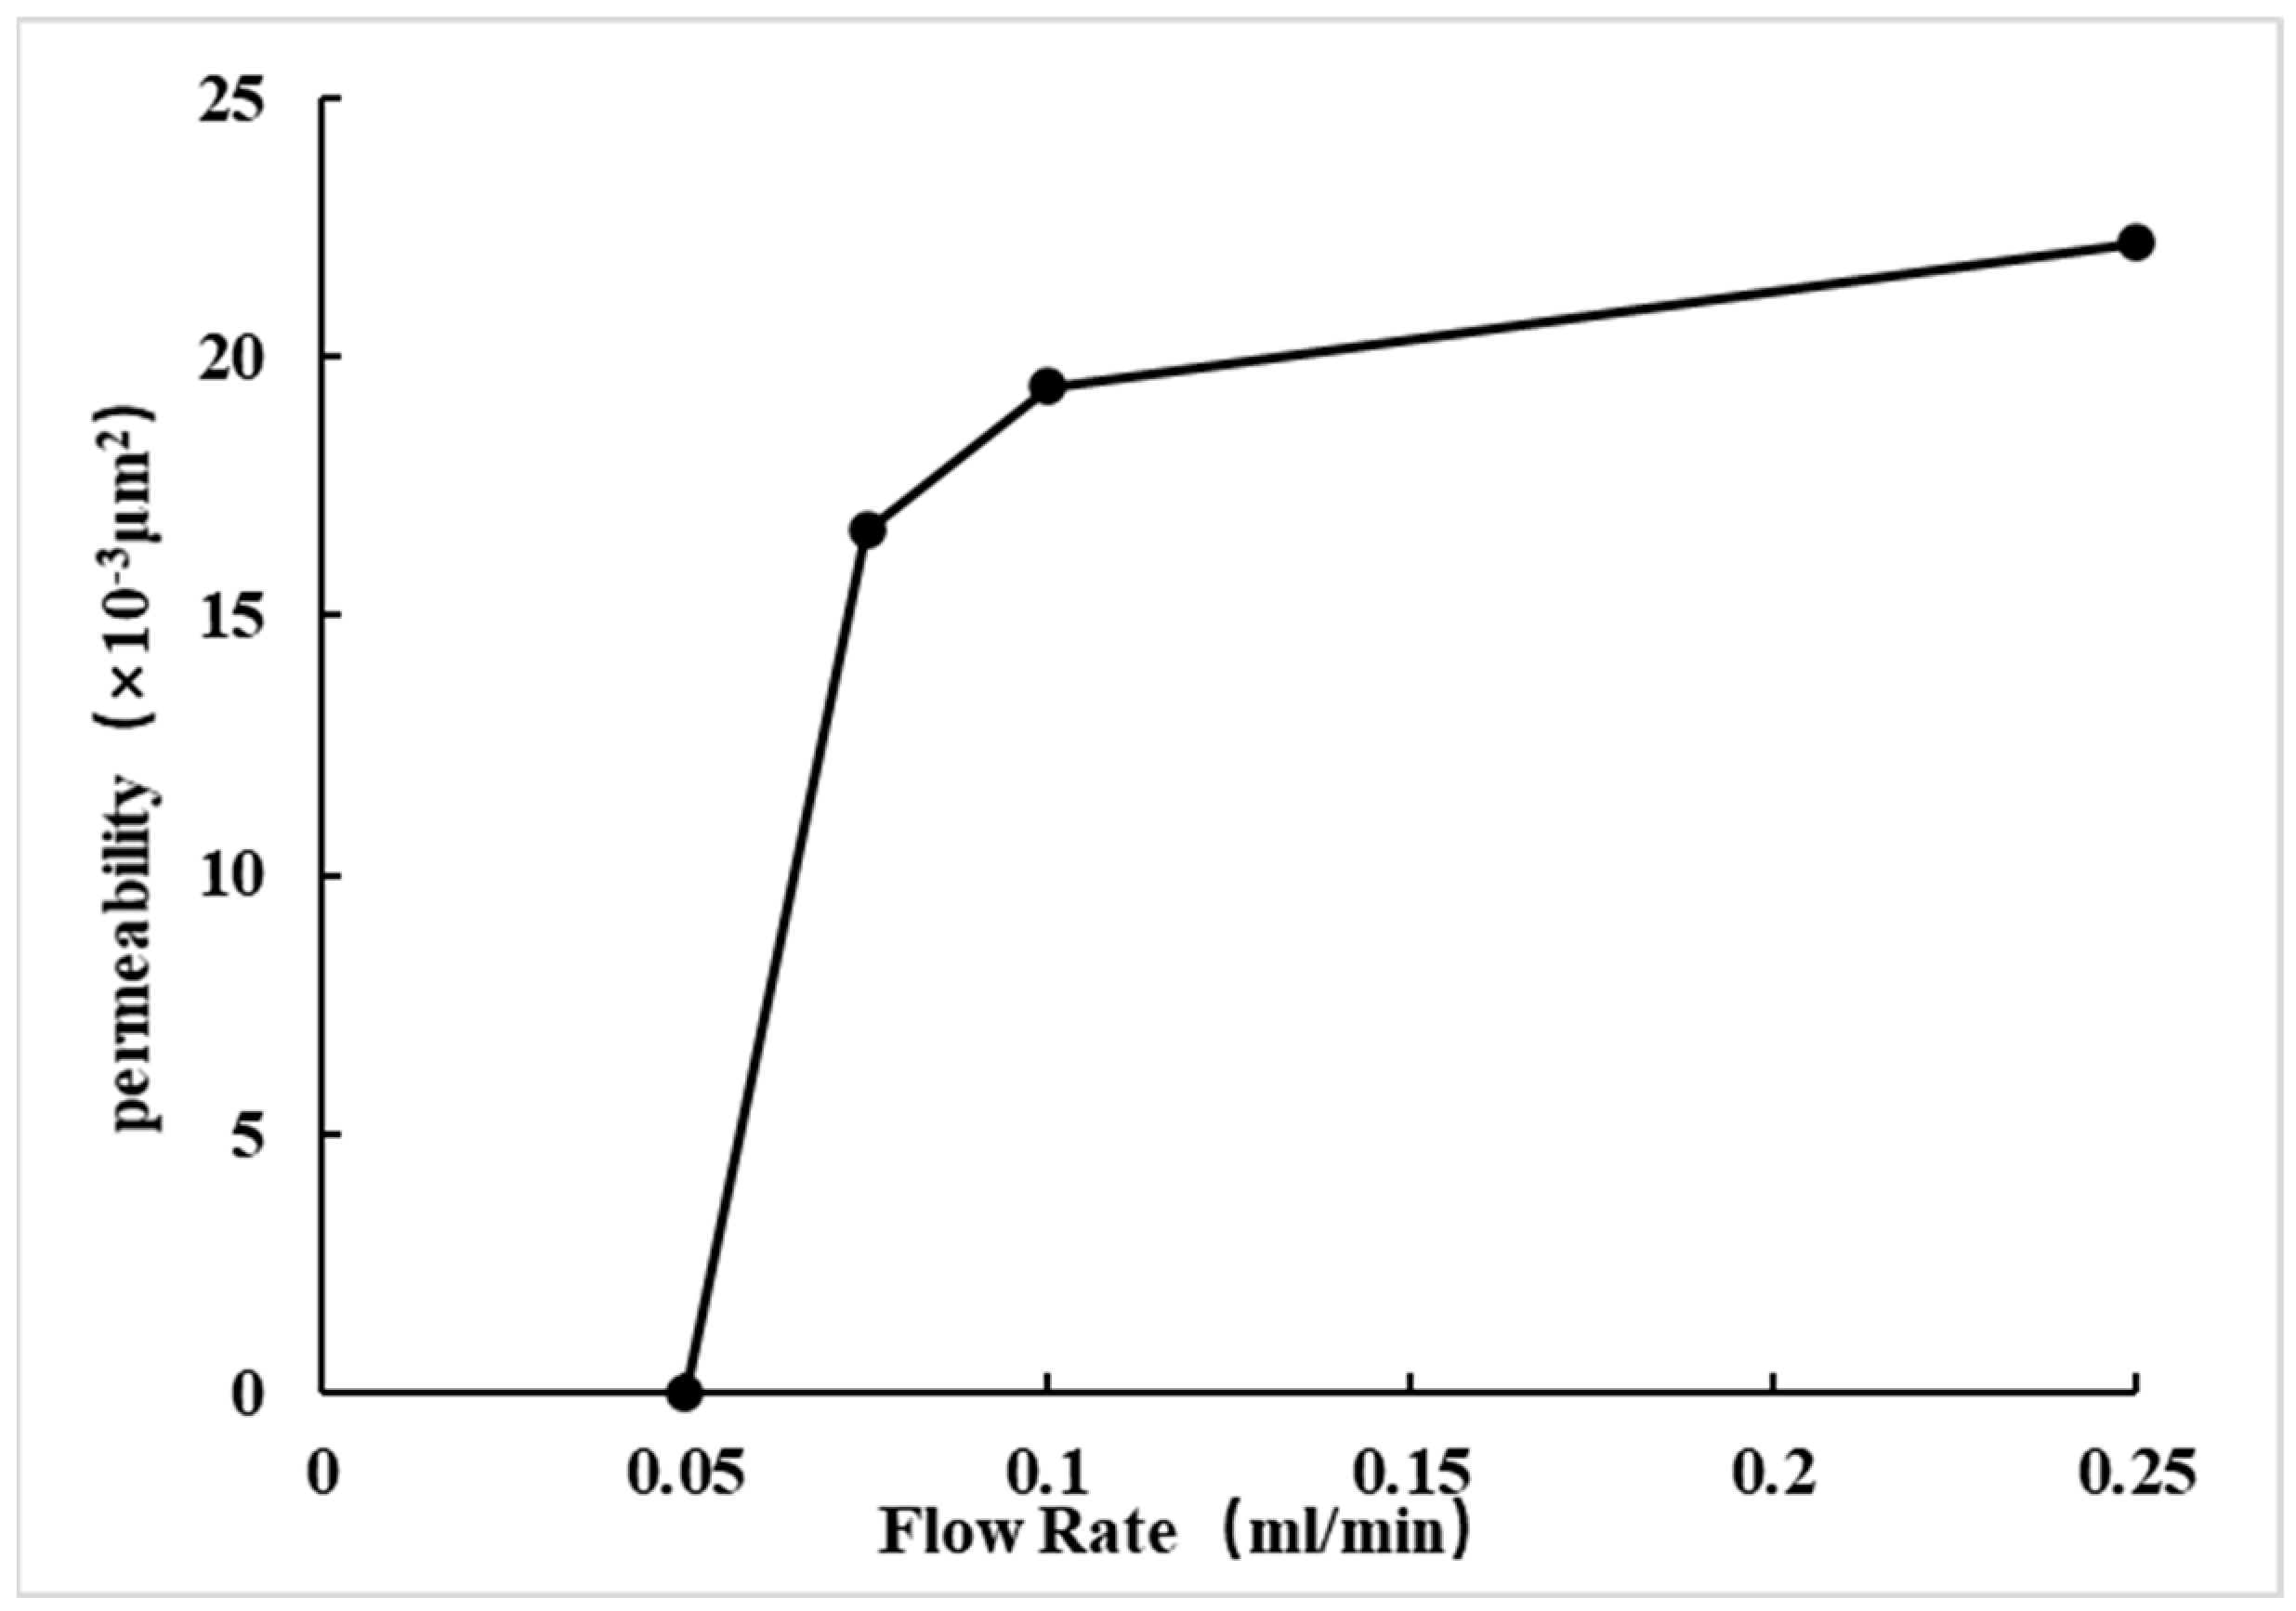
- Permeability Range: Less Than 0.3 × 10⁻³ μm2
For Core No. 5, the gas-measured permeability is less than 0.3 × 10⁻³ μm2. As the flow rate increases, the liquid-measured permeability gradually decreases, while the speed-sensitive damage value progressively increases, as shown in Table 7, Figure 13 and Figure 14. When the flow rate reaches 0.25 mL/min, the speed-sensitive damage value reaches 22.222%, determining the critical flow rate to be 0.1 mL/min.
Table 7.
Velocity Sensitivity Experiment Results for Sample No. 5.
Figure 13.
Permeability Variation in Sample No. 5 Liquid.
Figure 14.
Variation in Speed Damage Rate for Sample No. 5.
4. Characterization Model of Speed-Sensitive Damage to Reservoirs
4.1. Speed-Sensitive Effect
4.1.1. Definition of Speed-Sensitive Effect
Speed sensitivity refers to the phenomenon where changes in fluid flow velocity within a porous medium cause variations in formation permeability. The primary influencing factors include formation grain composition and cementation degree, the presence and dispersibility of clay minerals, fluid properties (such as flow rate, viscosity, and ion concentration), and acting forces (such as shear force and electrostatic interactions). Due to speed sensitivity, permeability may decrease as flow velocity increases. Generally, permeability is higher at low flow velocities and decreases at high flow velocities, ultimately affecting reservoir productivity.
4.1.2. Influence of Speed-Sensitive Effect on Formation Flow Velocity
Assuming a homogeneous, uniform-thickness, and infinite formation under single-phase flow conditions, the mass conservation equation for radial flow is derived based on the continuity equation:
where = porosity; = fluid density (kg/m3); = flow velocity (m/s); = radial distance (m).
The speed-sensitive model is primarily used to describe the flow characteristics of fluids in porous media. Its core idea lies in the permeability’s sensitivity to external environments or internal factors. For example, in oil extraction, factors such as formation pressure, temperature, and fluid properties can influence changes in permeability [18].
The calculation of permeability is usually based on Darcy’s Law:
where = fluid flow rate (m3/day); = permeability (×10−3 μm2); = cross-sectional area (m2); = pressure difference (MPa); = fluid viscosity (kg/m·s); = flow path length (m).
Considering the speed-sensitive effect, the formation permeability becomes a function of flow velocity, . Darcy’s law is then modified as
where = fluid viscosity (kg/m·s); = formation pressure (MPa).
In the speed-sensitive model, the permeability model is mainly represented by the following approaches:
- Exponential Decay Model
This model is used to describe the exponential decay relationship of permeability with respect to time or changes in external conditions, commonly found in situations where chemical or physical environmental changes influence permeability. Its expression is given by
where = initial permeability (×10−3 μm2); = decay coefficient, representing the rate of permeability change (1/day); = time (day).
When the formation or medium responds strongly to pressure changes, the exponential decay model can effectively describe the variation in permeability. Even over a longer time period, this model maintains stable predictive capability and better aligns with the actual trend of permeability changes, especially under high-pressure conditions;
- 2.
- Power-Law Decay Model
The power-law decay model is a mathematical model used to describe the permeability, flow rate, or other physical quantities as they change with time, pressure, or stress following a power-law decay. It is used to study heterogeneous formations, multi-scale permeability variations, and long-term evolutionary processes. Its expression is as follows:
where = current permeability (×10−3 μm2); = initial permeability (×10−3 μm2); = current effective stress (formation pressure) (MPa); = initial effective stress (MPa); n = power exponent (usually n > 0 indicates that permeability decreases as stress increases).
The power-law decay model describes how the rate of change in permeability varies with stress or time rather than changing at a fixed rate. It follows a power-law decay, which is suitable for situations involving multi-scale fracture media, rock fracturing, formation subsidence, and other similar cases. Power-law decay is slower than exponential decay and is more suitable for long-term permeability evolution predictions. While exponential decay decreases rapidly at the beginning, the power-law decay is more gradual and aligns with permeability evolution that changes slowly over time;
- 3.
- Linear Decay Model
The linear decay model is a mathematical model that describes the linear decrease in permeability, flow rate, or other physical parameters with stress or time. It assumes a simple linear relationship between permeability change and stress or time, making it applicable to low-stress-sensitive formations, homogeneous rock layers, and short-term variations. Based on different influencing factors, the linear decay model has two common forms:
- Stress-Sensitive Linear Decay Model:
When permeability k decreases with increasing effective stress σ, its mathematical expression is
where = current permeability (×10−3 μm2); = initial permeability (×10−3 μm2); = current effective stress (formation pressure) (MPa); = stress decay coefficient (constant), representing the degree of stress influence on permeability (×10−3 μm2/MPa);
- Time-Sensitive Linear Decay Model
When permeability k changes with time t, the mathematical expression is
where = time (day); = time decay coefficient (constant), representing the rate of permeability decrease over time (×10−3 μm2/day).
The linear decay model describes a linear decrease in permeability with stress or time, unlike the exponential decay or power-law decay models, which exhibit nonlinear characteristics. In certain homogeneous rock layers or low-pressure environments, permeability changes are more stable, making linear decay a good fit. The calculation process is simple and is suitable for short-term permeability change predictions. However, as stress or time increases beyond a certain point, it could lead to negative permeability values, so this model is typically applied only within a specific range of changes.
4.2. Effect of Injection Volume on Speed-Sensitive Effect
Effect of Injection Volume on Flow Rate
When water injection is used for displacement in oil fields, the injected water induces a speed-sensitive effect in the formation, thereby affecting the flow rate. Considering the formation pressure remains constant, assume the following formation parameters are shown in Table 8:
Table 8.
Model Parameter Settings.
In the absence of additional velocity-dependent effects, the diffusion of injected water along the horizontal plane satisfies the mass conservation:
Thus, we have
where = fixed daily water injection volume (m3/day); = radial distance of water flow that changes over time (m); = formation thickness (m); = formation porosity; = flow velocity that changes over time (m/s).
By applying the law of mass conservation, the relationship between velocity and injection volume can be derived as
The relationship between velocity and the radial flow radius is given by
Integrating the equation, we obtain
Solving the integral, we obtain
Substituting the expression for R(t) into the velocity relationship, we obtain the relationship between velocity v(t), injection volume Q, and time t as follows:
Considering the permeability and speed-sensitive relationship, we have k = k(v).
Based on empirical models, the permeability as a function of flow velocity v can be expressed as
- Exponential Decay Model:
- 2.
- Empirical Power-Law Model:
- 3.
- Linear Model (Weak Speed-Sensitive Assumption):
To divide the speed-sensitive range based on velocity v, the following categorization is typically used:
where = critical speed (m/s).
Assuming that velocity remains below the critical threshold,
Substitute into the expression for the velocity at the front without speed sensitivity:
Solving for time:
The corresponding velocity is
In the case of considering the correction for speed-sensitive effects, Darcy’s law is modified as
where is the fluid viscosity (kg/m3), and is the radial pressure gradient (MPa/m). When r = , substituting into the equation, we obtain
At this point, assuming a high injection volume due to factors such as pore clogging or particle migration, the critical velocity may exhibit injection volume dependence, denoted as
where is the base critical velocity, and and are parameters that describe the impact of the injection volume. In this way, the speed-sensitive correction is not only reflected through , but also the critical velocity changes with .
After considering the above corrections, the expression for the critical radius can be written as
If only the case without speed sensitivity is considered, then has a linear relationship with Q; however, due to the fact that changes with , the final relationship between and becomes nonlinear.
At the same time, the speed-sensitive correction for permeability can also introduce a correction function F(v) to describe the impact of injection volume on effective permeability. Let
Then, the effective permeability is
In Darcy’s law, the flow velocity can be written as
At the critical point r = Rc, let = ; thus, we have
Considering as a constraint condition and taking into account the variation in with Q, the comprehensive relationship between the speed-sensitive range Rc and the injection volume Q is given by
This expression reflects the linear effect of Q on Rc in mass conservation.
The speed-sensitive permeability correction introduced by and the nonlinear effect of critical velocity changed with . This formula primarily reflects the relationship between the velocity sensitivity range Rc and the water injection volume in the reservoir of Block L in the Ordos Basin. Its application focuses on the reservoir properties of tight formations, providing a theoretical basis for understanding the relationship between velocity sensitivity range, water injection volume, permeability, and porosity conditions in similar situations within the Ordos Basin.
Regarding the comprehensive relationship between the speed-sensitive range Rc and the injection volume Q:
- When Q is small, , the approximation is . In this case, Rc is approximately linear with Q;
- As increases, increases with , and the correction factor significantly decreases, causing the dependence of on to become nonlinear. In extreme cases, may increase more slowly as grows;
- The above model also emphasizes the importance of reasonably controlling the injection volume to avoid speed-sensitive effects. When the injection volume is too large, the reduction in effective permeability caused by speed-sensitive effects can result in the actual diffusion radius being much smaller than the expected value under non-speed-sensitive conditions, thereby affecting the oil recovery efficiency.
5. Application of the Characterization Model to the Target Reservoir
5.1. Model Parameter Determination and Validation
Based on the experimental data in Section 3 and the speed-sensitive characterization model established in Section 4, combined with the reservoir characteristics and field data of the L oilfield, the key parameters of the model are determined.
Experimental research and numerical simulation results indicate that there is usually a nonlinear relationship between permeability and flow velocity, and the attenuation of permeability is often related to factors such as inertia effects, changes in pore structure, and fluid medium interactions. The exponential decay model can accurately describe these effects. When the permeability changes smoothly, and the rate change is not significant, we can obtain it through the following attenuation model:
Nonlinear regression was performed on Core 52, and the fitting formula obtained is
The fitting formula has a goodness of fit R2 = 0.98.
The correction for the critical velocity is
For the L block reservoir, with an average porosity of 10% and an effective thickness of 10 m, based on the modified Darcy’s law and the speed-sensitive range formula, the critical diffusion radius for different injection volumes is calculated as
Based on the actual injection volume of the oil field and the measured diffusion radius, a comparison is made with the theoretical injection volume, as shown in Table 9.
Table 9.
Model Reliability Verification.
The deviation is less than 3%, proving that the formula Rc(Q) has good predictive capability for the field data.
5.2. Practical Application in the Field
In the oilfield water injection development process, speed-sensitive effects lead to a decrease in reservoir permeability, which affects injection efficiency and recovery rates [19]. If the injection volume is not properly controlled, it could result in slow advancement of the waterflood front, abnormal pressure increases, or even phenomena such as a decline in the water injection well’s “water absorption capacity” or “inability to inject water”. Therefore, it is necessary to use the speed-sensitive range Rc(Q) formula derived in this paper to provide reasonable guidance for water injection optimization on-site in order to reduce the adverse effects caused by speed-sensitive effects.
Based on the speed-sensitive range formula,
By adjusting the value of Q so that Rc(Q) is maximized, the influence of the speed-sensitive effect can be minimized.
By differentiating Rc(Q) and setting its derivative equal to zero, the optimal injection volume for the reservoir can be obtained.
Let the numerator be
The denominator is
Then,
To calculate N′(Q),
Given
To calculate D′(Q),
Substituting gives
When = 0, the solution is
The solution is , which satisfies the following equation:
In summary, when applied to the L oilfield, the optimal injection volume is determined to be 16.8 m3/day. After three months of on-site application, the speed-sensitive particle damage was reduced by 21%, the rate of reservoir permeability decline was slowed by 13.2%, and the recovery rate increased by 1.4%.
During the field application, it is recommended to regularly collect core samples and on-site data to calibrate and optimize the speed-sensitive model and the Rc(Q) formula, making it more aligned with the actual field conditions. This will help achieve a dynamically optimized development plan.
6. Conclusions
- Through high-pressure mercury injection, nuclear magnetic resonance, and scanning electron microscope experiments, the microscopic mechanism of the L tight oil reservoir after waterflooding was revealed. The pore throat radius decreased (the maximum pore throat radius dropped from 1.093 μm to 1.085 μm), and the sorting became worse (the variation coefficient increased to 0.208). It was confirmed that the migration and blockage of kaolinite particles in the pores were the main causes of permeability decline (with a decrease of 5.63%);
- The established exponential decay model and the critical diffusion radius formula were validated with field data, showing an error of less than 3%. This model can accurately predict the nonlinear relationship between injection volume and speed-sensitive range, providing a theoretical basis for optimizing water injection strategies;
- By using this model, the optimal injection volume for the L reservoir was determined to be 16.8 m3/day. After implementing a zoned water injection strategy, speed-sensitive particle damage was reduced by 21%; the rate of permeability decline was slowed by 13.2%, and the recovery rate increased by 1.4%.
Author Contributions
Conceptualization, Data curation and Formal analysis, Z.D.; Methodology, Project administration and Resource, Y.X.; Software, Supervision and Investigation, Z.Z.; Validation, Visualization and Writing—original draft, L.Y.; Funding acquisition, Writing—review & editing Y.C. All authors have read and agreed to the published version of this manuscript.
Funding
The authors gratefully acknowledge support from the Strategic Cooperation Technology Projects of China National Petroleum Corporation (CNPC) and China University of Petroleum, Beijing (CUPB) (No. ZLZX2020-02-04).
Data Availability Statement
The original contributions presented in this study are included in the article. Further inquiries can be directed to the corresponding author.
Acknowledgments
All authors thank Zhentao Ma, Chunhui Zhang, and Junfeng Liu for their contributions to this article.
Conflicts of Interest
Authors Ziyao Zhang, Lan Yang and Yongji Cai are employed by the Second Oil Production Plant of Chang Qing Oilfield Branch. The remaining authors declare that the research was conducted in the absence of any commercial or financial relationships that could be construed as a potential conflict of interest.
References
- Wang, X.C.; Wang, X.R.; Zhang, H.B. Research on Regional Flow Field Adjustment in the Late Stage of Waterflooding Oilfield Development. Petrol. Chem. Appl. 2024, 43, 9–13. (In Chinese) [Google Scholar]
- Li, H. Research on Water Injection Development Technology for Low Permeability Oilfields. Chem. Eng. Manag. 2018, 19, 210–211. [Google Scholar]
- Zhang, J.; Liu, Y.J.; Liu, D. Research and Application of Flow Field Reconstruction Model in High Water Cut Stage of Waterflooding Oilfields. J. Chongqing Univ. Sci. Technol. Nat. Sci. Ed. 2021, 23, 1. [Google Scholar]
- Yan, X.L.; Zhou, Q. Reservoir Sensitivity Evaluation of the Third Member of Shahejie Formation in Zhangdong Area. J. Yangtze Univ. Nat. Sci. Ed. 2010, 7, 171–173, 389. [Google Scholar] [CrossRef]
- Chang, X.J.; Yin, Z.J. Experimental Study on Reservoir Sensitivity and Its Formation Mechanism of the Third Member of Shahejie Formation in Gaoshangpu Oilfield. Petrol. Geol. Exp. 2004, 1, 84–88. [Google Scholar]
- Li, Q.; Li, Q.; Wu, J. Wellhead Stability During Development Process of Hydrate Reservoir in the Northern South China Sea: Evolution and Mechanism. Processes 2024, 13, 40. [Google Scholar] [CrossRef]
- Li, Q.; Li, Q.; Cao, H.; Wu, J.; Wang, F.; Wang, Y. The Crack Propagation Behaviour of CO2 Fracturing Fluid in Unconventional Low Permeability Reservoirs: Factor Analysis and Mechanism Revelation. Processes 2025, 13, 159. [Google Scholar] [CrossRef]
- Kukharova, T.; Maltsev, P.; Novozhilov, I. Development of a Control System for Pressure Distribution During Gas Production in a Structurally Complex Field. Appl. Syst. Innov. 2025, 8, 51. [Google Scholar] [CrossRef]
- Feng, H.; Qu, L.L.; Zhang, X.G. Characteristics Variation of Waterflooding Development in Medium-High Permeability Reservoirs: A Case Study of H Oilfield in Nanpu Sag. Petrol. Geol. Eng. 2023, 37, 59–64. [Google Scholar]
- Li, H.J.; Zheng, Q.F.; Chen, Y.Z. Sedimentary Characteristics of Kiziloy Formation in Akemomu Anticline, Northern Margin of Kashi Sag, Tarim Basin. Sci. Tech. Assoc. Forum Second Half 2011, 8, 123–124. [Google Scholar]
- Jia, T.Q. The Influence of Corresponding Relationship Between Clay Minerals and Reservoir Evolution on Reservoir Sensitivity: A Case Study of Fan 131 Block in the Fourth Member of Shahejie Formation, Zhenglizhuang Oilfield. Petrol. Geol. Recovery Eff. 2007, 5. (In Chinese) [Google Scholar]
- Wen, X.; Dai, Z.; Wang, H. Variation Law of Reservoir Physical Properties after Long-Term Waterflooding in Marine Sandstone Reservoirs. Spec. Oil Gas. Reserv. 2017, 24, 157–161. [Google Scholar]
- Li, A.F.; Ren, X.X.; Wang, G.J. Method and Application of Nuclear Magnetic Resonance in Studying Pore Structure of Tight Sandstone. J. China Univ. Pet. Nat. Sci. Ed. 2015, 39, 92–98. [Google Scholar]
- Cao, B.G.; Han, Y.L.; Yu, Y.J. Dynamic Characteristics Variation of Waterflooding Development in Low Permeability Reservoirs. Sci. Technol. Eng. 2020, 20, 1820–1825. [Google Scholar]
- Zhang, X.F.; Liu, Z.B.; Liu, C. Effect of Clay Minerals on Physical Properties of Waterflooding Development Reservoirs in X Oilfield, Liaodong Bay Depression. Daqing Pet. Geol. Dev. 2017, 36, 62–67. [Google Scholar]
- Chen, X.; Zhong, J.H.; Yuan, J. Development Characteristics and Transformation Mechanism of Kaolinite in Paleogene of Bonan Sag. Petrol. Explor. Dev. 2009, 36, 456–462. [Google Scholar]
- Zhao, Y. Study on the Relationship Between Tightness and Reservoir Formation of Chang 7 Member in the Southwest Ordos Basin. Ph.D. Thesis, China University of Mining and Technology, Beijing, China, 2018. [Google Scholar]
- Liu, H.J. Study on the Production Law of Mud and Sand in Loose Sediments of Hydrate Decomposition Zone. Ph.D. Thesis, China University of Petroleum, Qingdao, China, 2019. [Google Scholar]
- Yu, X.L.; Peng, C.Z.; Tian, H.Z. Abnormal Analysis of Relative Permeability Curve Characteristics and Reasonable Exploitation Suggestions in X Oilfield. J. Chongqing Univ. Sci. Technol. Nat. Sci. Ed. 2010, 12, 86–88. [Google Scholar]
Disclaimer/Publisher’s Note: The statements, opinions and data contained in all publications are solely those of the individual author(s) and contributor(s) and not of MDPI and/or the editor(s). MDPI and/or the editor(s) disclaim responsibility for any injury to people or property resulting from any ideas, methods, instructions or products referred to in the content. |
© 2025 by the authors. Licensee MDPI, Basel, Switzerland. This article is an open access article distributed under the terms and conditions of the Creative Commons Attribution (CC BY) license (https://creativecommons.org/licenses/by/4.0/).