Article

Experimental Study on the Effect of Environmental Factors on the Real Driving Emission (RDE) Test

1
College of Automotive Engineering, Jilin University, Changchun 130025, China
2
National Key Laboratory of Automotive Chassis Integration and Bionics, Jilin University, Changchun 130025, China
*
Author to whom correspondence should be addressed.
Energies 2025, 18(9), 2253; https://doi.org/10.3390/en18092253
Submission received: 18 March 2025 / Revised: 17 April 2025 / Accepted: 25 April 2025 / Published: 28 April 2025
(This article belongs to the Section I2: Energy and Combustion Science)

Abstract

:
The real driving emissions of gasoline and diesel vehicles are significantly influenced by altitude, temperature, and starting conditions. In this study, the real driving emissions (RDEs) of gasoline and diesel vehicles compliant with China V standards were investigated under various conditions. The adaptability of RDE testing in China was evaluated by analyzing vehicle emissions at different altitudes, ambient temperatures, and starting conditions. The results show that, with increasing altitude, CO, NOx, and PN emissions generally exhibit a downward trend, particularly for gasoline vehicles, whose conformity factors remain well below the China VI limit. However, for China V diesel vehicles relying solely on EGR technology, NOx emissions significantly exceed China VI standards, indicating that EGR alone is insufficient to meet regulatory requirements. Temperature variations have little effect on the emissions of China V PFI gasoline vehicles, while diesel vehicles continue to exhibit excessive NOx emissions under varying temperatures. Although the cold-start phase generates substantial pollutant emissions, the EMROAD evaluation method excludes this phase, resulting in limited differences between cold- and hot-start emission results. Nevertheless, the inclusion of cold-start emissions should be considered in future RDE assessments.

1. Introduction

Environmental issues have become one of the most pressing challenges in modern cities, and vehicle-related pollution constitutes a significant portion of urban pollution [1,2]. Countries worldwide have also issued a series of policies and regulations to limit and control the environmental pollution caused by vehicles [3]. Accurate testing and evaluation methods for vehicle emissions serve as the foundation for enforcing these regulations [4]. The traditional testing method is to conduct tests on a chassis dyno in the laboratory under specific cycle conditions. The typical test cycles include NEDC (New European Driving Cycle), WLTC (Worldwide harmonized Light vehicles Test Cycles), etc. Although the WLTC includes many transient sub-cycles that compensate for the overly smooth nature of the NEDC, there are still significant differences between it and real-world driving, especially in terms of the randomization of test conditions [5]. Therefore, laboratory tests cannot fully replicate the real-world driving conditions of vehicles [6].
In comparison with the China V emission standard, the China VI standard imposes stricter limits on total pollutant emissions and revises the testing procedures by replacing the NEDC with the WLTC, as well as introducing the real driving emission (RDE) test, to compensate for this discrepancy [7]. The test method is conducted on actual roads, incorporating the influence of the driver, road conditions, and environmental parameters into the test results [8]. The RDE test also has corresponding data processing methods. The moving-average window method, developed by JRC (European commission’s Joint Research Centre), is one of two data processing methods in the European RDE standard. The other one is power binning based on engine power. In the formulation of the China VI standard, considering the difficulty in simplifying the implementation of the standard and the need for the normalization of certification supervision, only the moving-average window method was adopted in RDE regulations [9].
The basic principle of moving-average window calculation is as follows: emissions are not calculated based on the overall test results, but rather on subsets of data that divides all test results into several sets of data that emit half the amount of CO2 emitted by the vehicle during the type I emission test cycle [10]. At the same time, although the RDE test captures the randomness of real-world driving, the test conditions still comply with certain standards to ensure the validity of the results. To reflect the statistics within a normal driving range, the windows of the regulations are also required to succeed at a “normalcy” and “integrity” check. The specific requirements for “normalcy”: more than 50% of the urban, suburban, and high-speed windows must be within the scope of the characteristic curve defined by the basic tolerance; if data do not meet the minimum requirements of 50%, we can increase the step length basic tolerance zone by 1%, until meeting the requirements of 50% of the window, but the most basic tolerance zone can be extended to ±50% of the range. The specific requirements for “integrity”: the number of urban, suburban, and highway windows should account for more than 15% of the total number of windows [11].
China is a vast country with different driving environments. More than 58% of China’s land is at an altitude of above 1000 m; areas with altitudes above 2000 m account for more than 33% of China’s territory [12]. Meanwhile, China has a large territory and a large temperature difference between north and south. Conditions of high temperature, low temperature [13,14], and high altitude [15,16,17,18] may occur. These environmental factors can have a significant impact on the fuel consumption and emission of vehicles. Therefore, it is very necessary to study the influence of the environment on the RDE test. In this study, the impacts of altitude, temperature, and starting conditions on the real driving emissions of China V gasoline and diesel vehicles were investigated, as well as the repeatability of RDE tests, to provide guidance for the improvement of testing methods in emission standards.

2. Experimental Setup

2.1. Test Vehicles

In this study, two light vehicles were tested, including a gasoline vehicle and a diesel vehicle, which all met the China V standard. Parameters of sample vehicles are shown in Table 1.
Vehicle 1 is a China V standard port fuel injection (PFI) gasoline vehicle. The PFI system will form a relatively average in-cylinder fuel and air mixture, which can avoid the partly over-rich conditions and reduce carbon smoke PN emissions. Meanwhile, a TWC system equipped on the vehicle can effectively reduce CO and NOx emissions. Vehicle 2 is a China V standard direct injection (DI) diesel vehicle, and the direct injection system ensures the good atomization of the diesel in the cylinders. Vehicle 2’s exhaust after-treatment system is equipped with a diesel particulate filter.

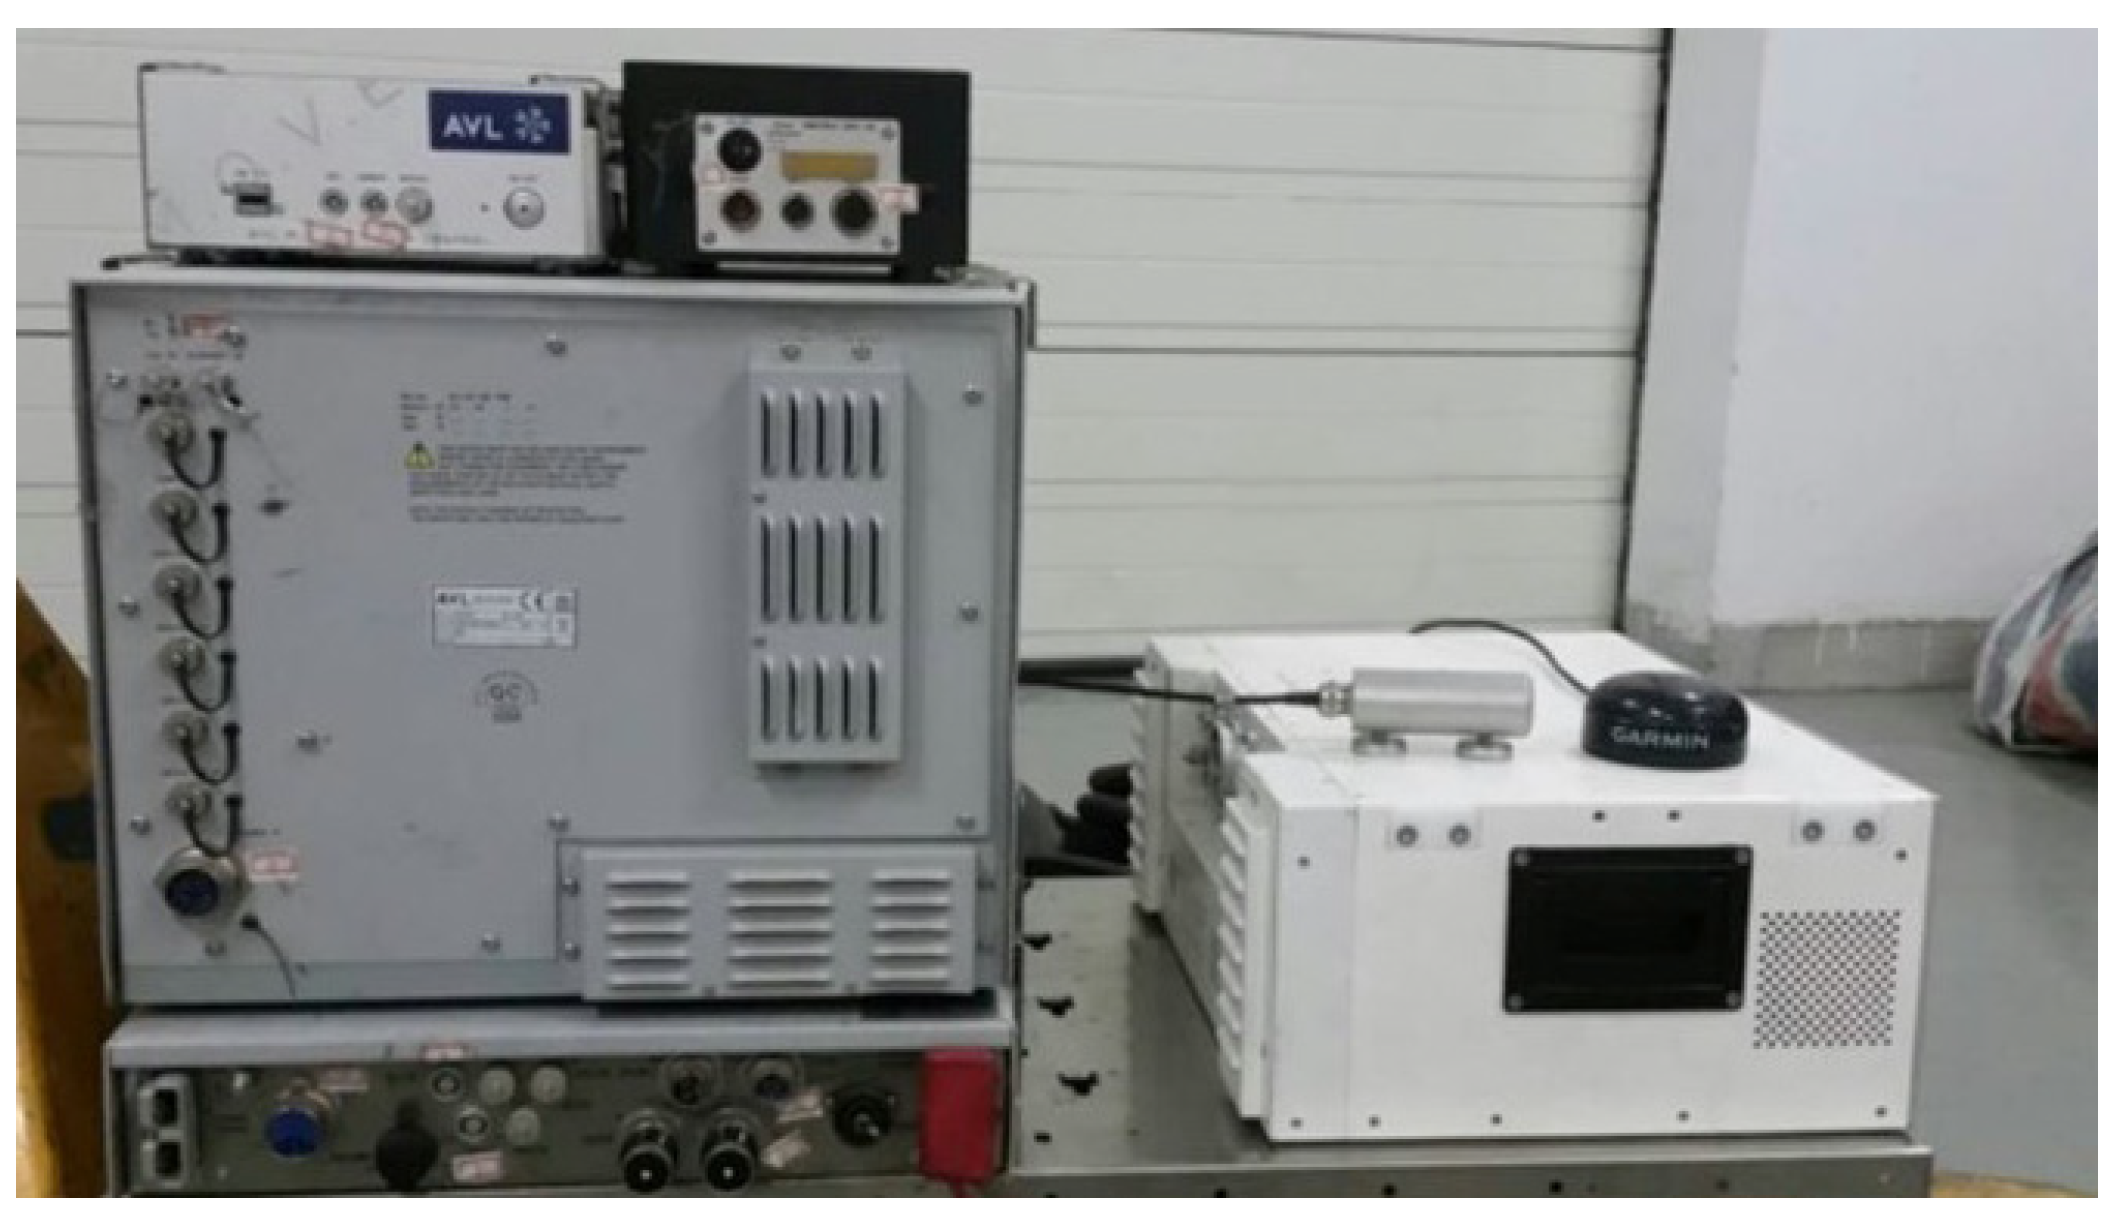
2.2. Experimental Instruments and Procedure

In this study, the RDE test adopted AVL List’s PEMS equipment M.O.V.E, as shown in Figure 1. It can be used in −10 °C to 50 °C environments, can measure CO, CO2, NOx, HC, and other gaseous emissions; it also can measure PM, PN, and fuel consumption. For light vehicles, the RDE in China VI standard only requires the measurement of CO, NOx, and PN emissions.
To test the adaptability of the RDE test method in China, the test proceeded at high altitudes, and a comparison test was supplemented on Vehicle 1 at no altitude. The operating conditions of the test are shown in Table 2.
As shown in Table 2, the test vehicles were subjected to RDE tests at locations with various altitudes. The test procedures need to follow certain standards to ensure the validity of the results [19]. For light-duty vehicles, the RDE test cycle comprises three phases defined by vehicle speed: urban conditions (<60 km/h), suburban conditions (60–90 km/h), and highway conditions (>90 km/h). The driving distance for each phase must not be less than 16 km, and the respective distance shares are specified as 34%, 33%, and 33%, with an allowable deviation of ±10%. The urban phase share must not fall below 29%. At the various test locations in this study, the routes were designed in accordance with this regulation, and the deviation of the actual phase proportions from the specified values was within 7%. In addition, specific requirements are imposed on the average vehicle speed, maximum speed, and idling time during the test. In this study, the test routes and times were carefully designed to minimize the impact of external factors, including public traffic flow and peak commuting periods.

2.3. Data Processing

The data processing in this study followed the China VI RDE regulations, excluding engine preheating, vehicle stopping, and engine stopping conditions. The remaining data were processed using the MAW method. The primary window ratio was calculated as follows:
C P = N P N T
where CP was the primary window ratio, NP was the primary window number of the RDE test, and NT was the total window number of the RDE test [20].

3. Results and Discussion

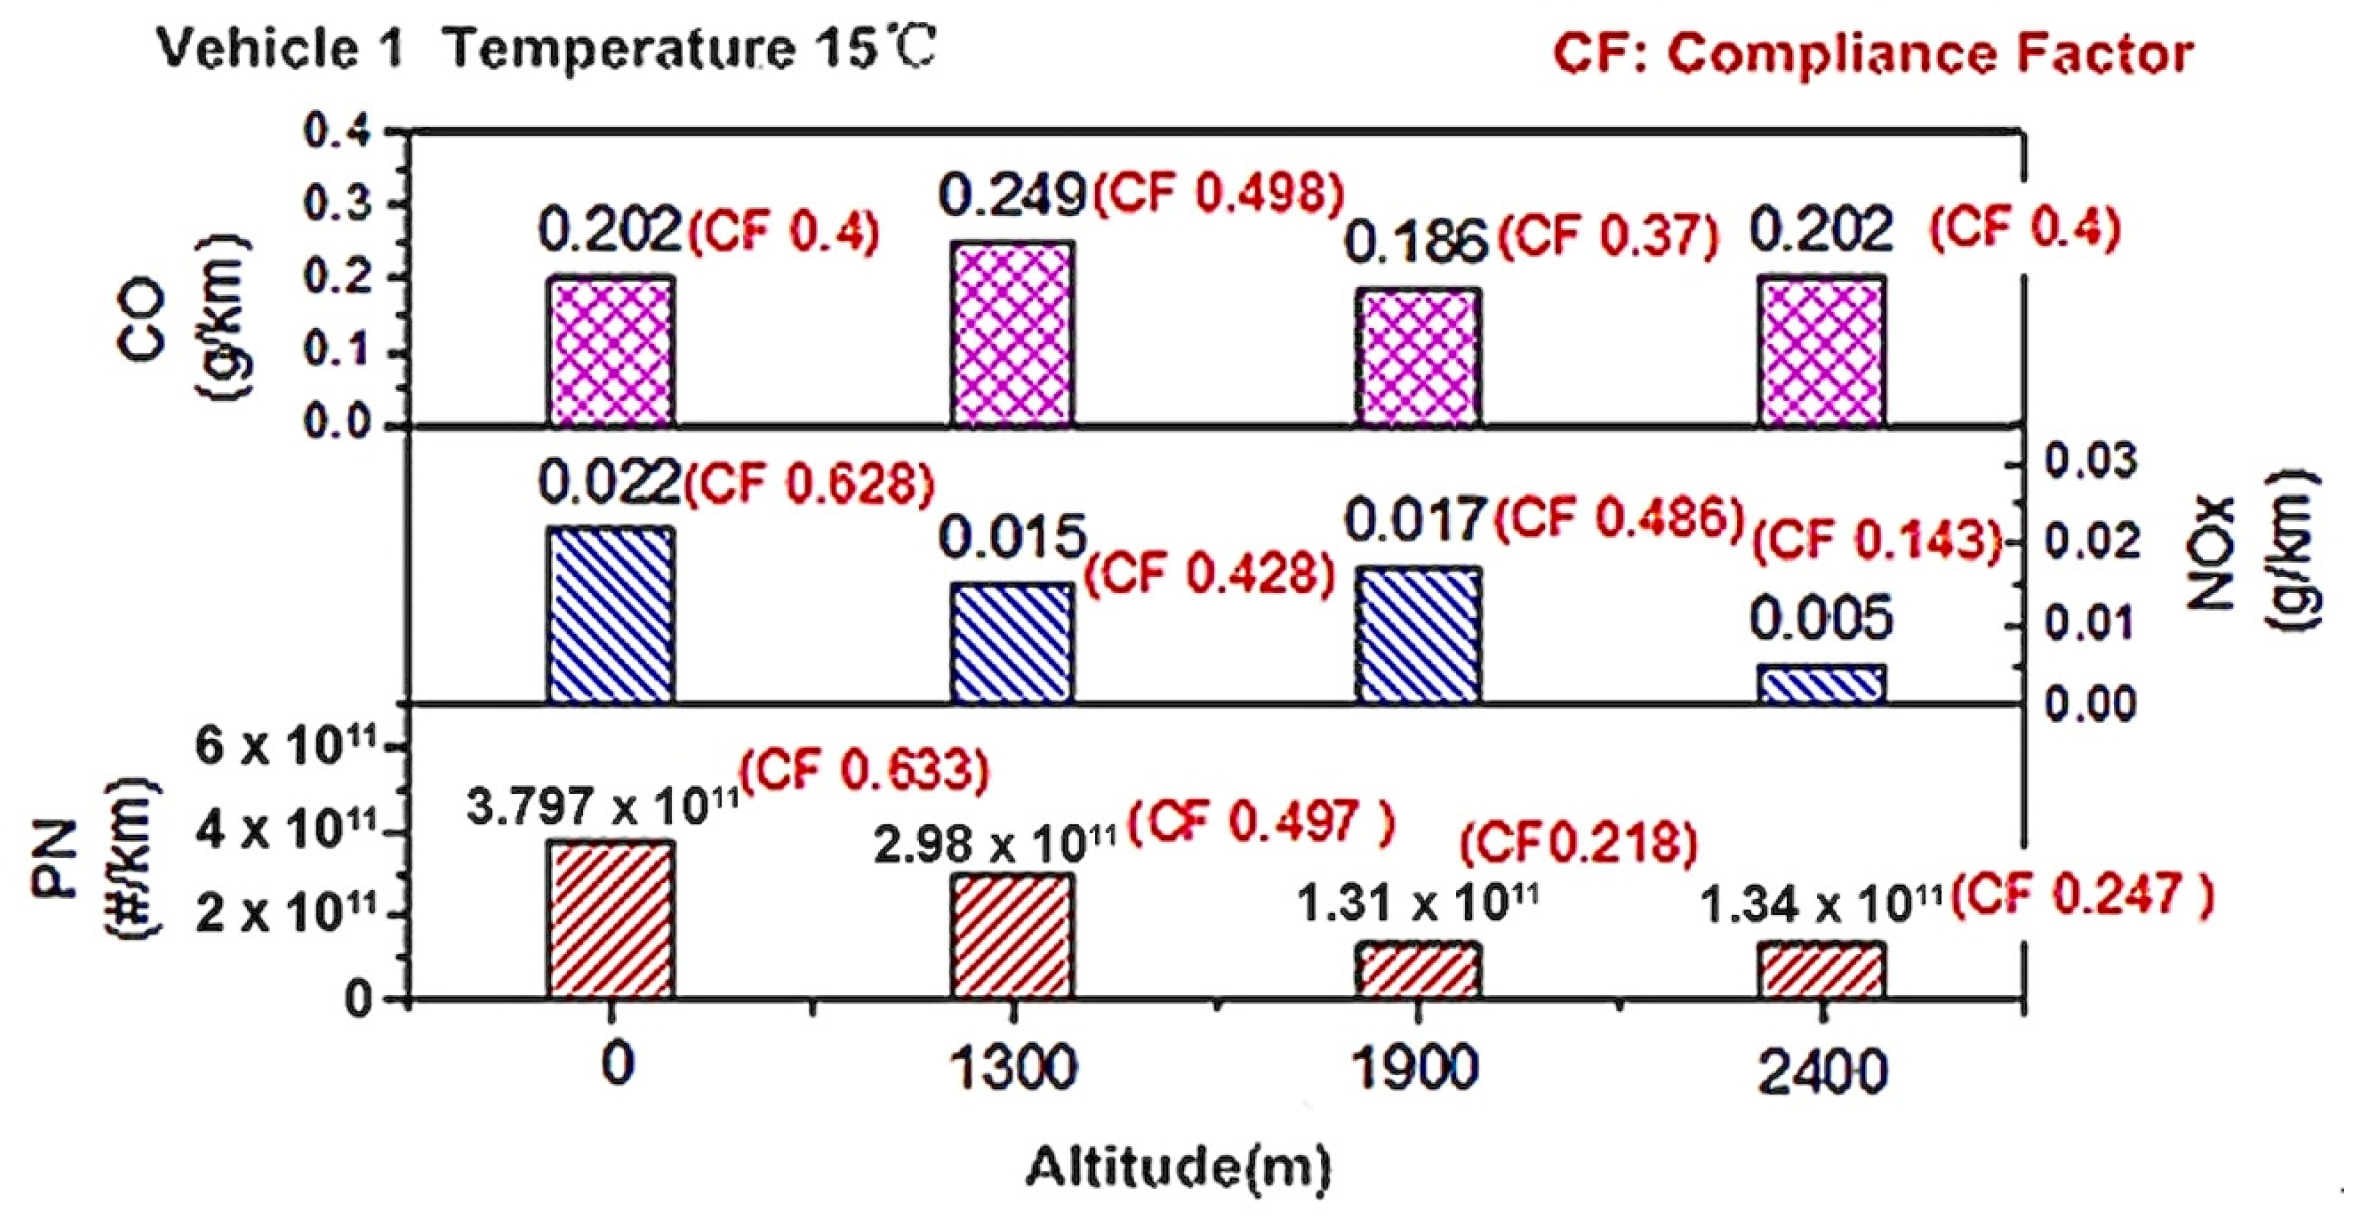
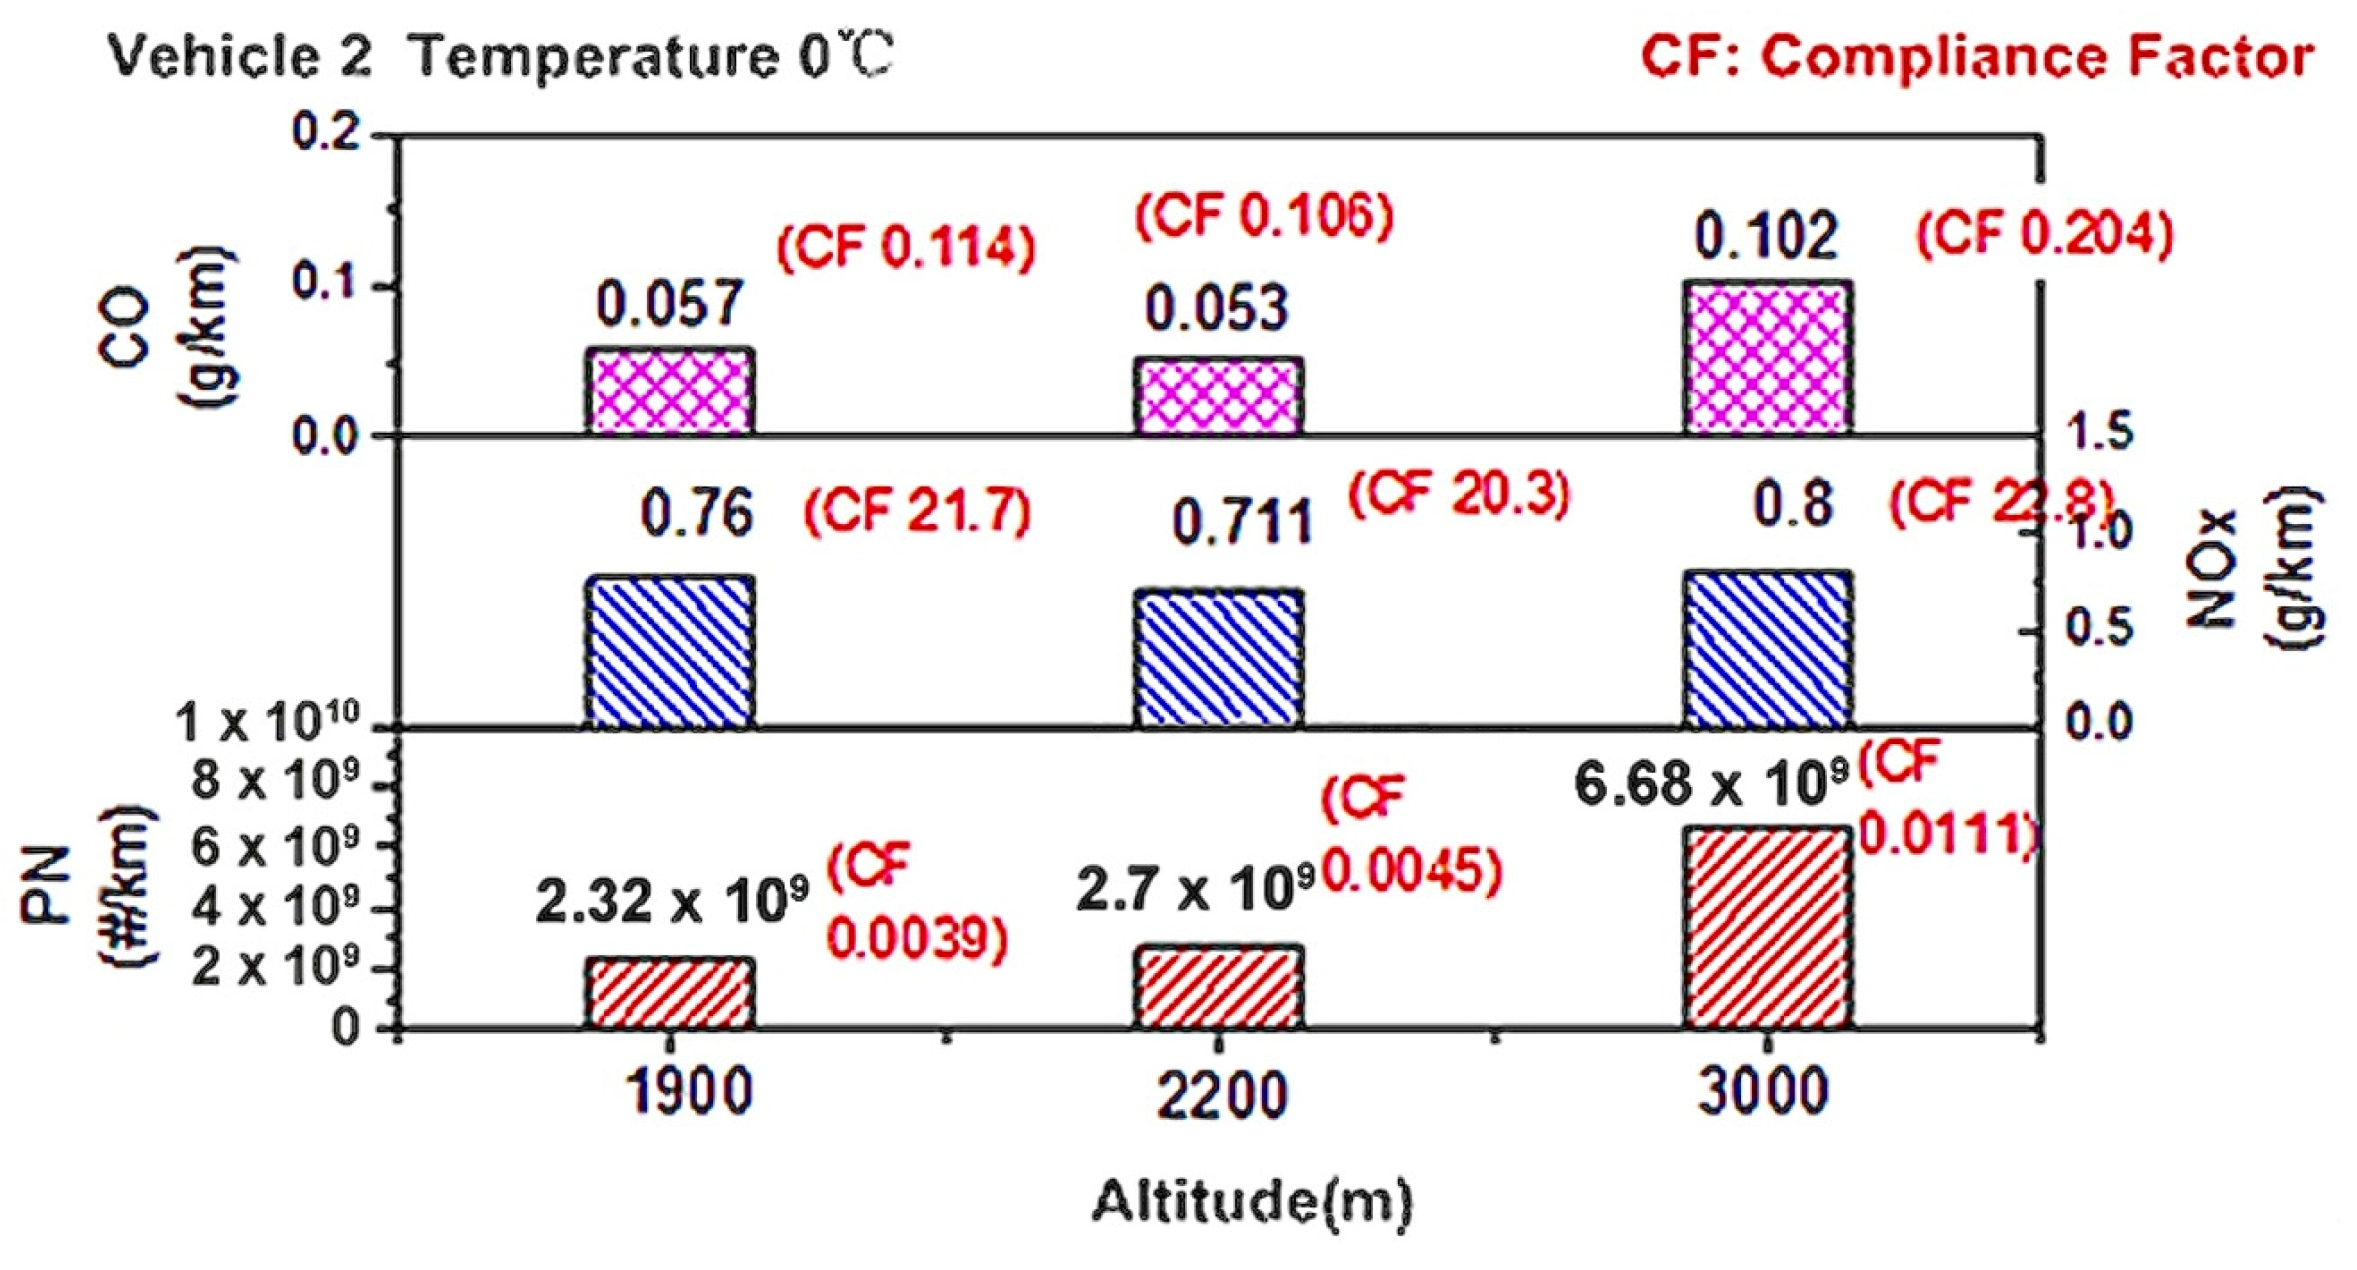
3.1. Effects of Altitude on RDE Emissions

As shown in Figure 2, the CO emissions show no clear trend with altitude changes: all the CO emissions are lower than the emission limit of the China VI standard (China VI b standard, the same below), the highest compliance factor (the ratio of PEMS measured emission to the limit of China VI b standard) is 0.498, and the CO emission has a 50% margin from the limit. Due to the decrease in oxygen concentration in high-altitude areas, the combustion temperature in the cylinder decreases accordingly. Therefore, NOx emissions generally show a downward trend with the rise in altitude. All NOx emissions are lower than the China VI standard emission limit, and the highest compliance factor is 0.628. PN emissions generally also show a downward trend with the elevation rise. PN emissions all meet the requirements of the China VI standard emission limit, and the highest compliance factor is 0.633, 36% below the limit [21,22].
As shown in Figure 3, without SCR for adding DPF, in China V standard diesel vehicles that rely solely on EGR to control NOx (Vehicle 2), when the altitude ranges from 1900 m to 3000 m, CO and NOx emissions (and PN in general) rise. This is because the diesel fuel quantity control is not like gasoline vehicles regarding air–fuel ratio control: at high-altitude, the low oxygen concentration will cause the deterioration of the combustion in the engine cylinder [23]. Meanwhile, at high altitudes, diesel vehicles tend to reduce their EGR rate to improve the quality of fresh air intake. However, due to fuel consumption constraints, it is not feasible to significantly increase this post-injection, which leads to a slight increase in NOx emissions at an altitude of 3000 m [24]. All CO emission data meet the China VI standard emission limit: the highest compliance factor is 0.242, and there is a 75% margin. Due to the addition of DPF, PN emission is two orders of magnitude below the China VI standard. Because there is no SCR installed, NOx emission from Vehicle 2 far exceeds the country’s VI limit value: the highest compliance factor is 22.8, 21.8 times higher than the standard. Therefore, for China V standard diesel vehicles, adding DPF can make PN meet the RDE requirements of the China VI standard, but controlling NOx through EGR technology alone leaves the NOx values far from meeting it.

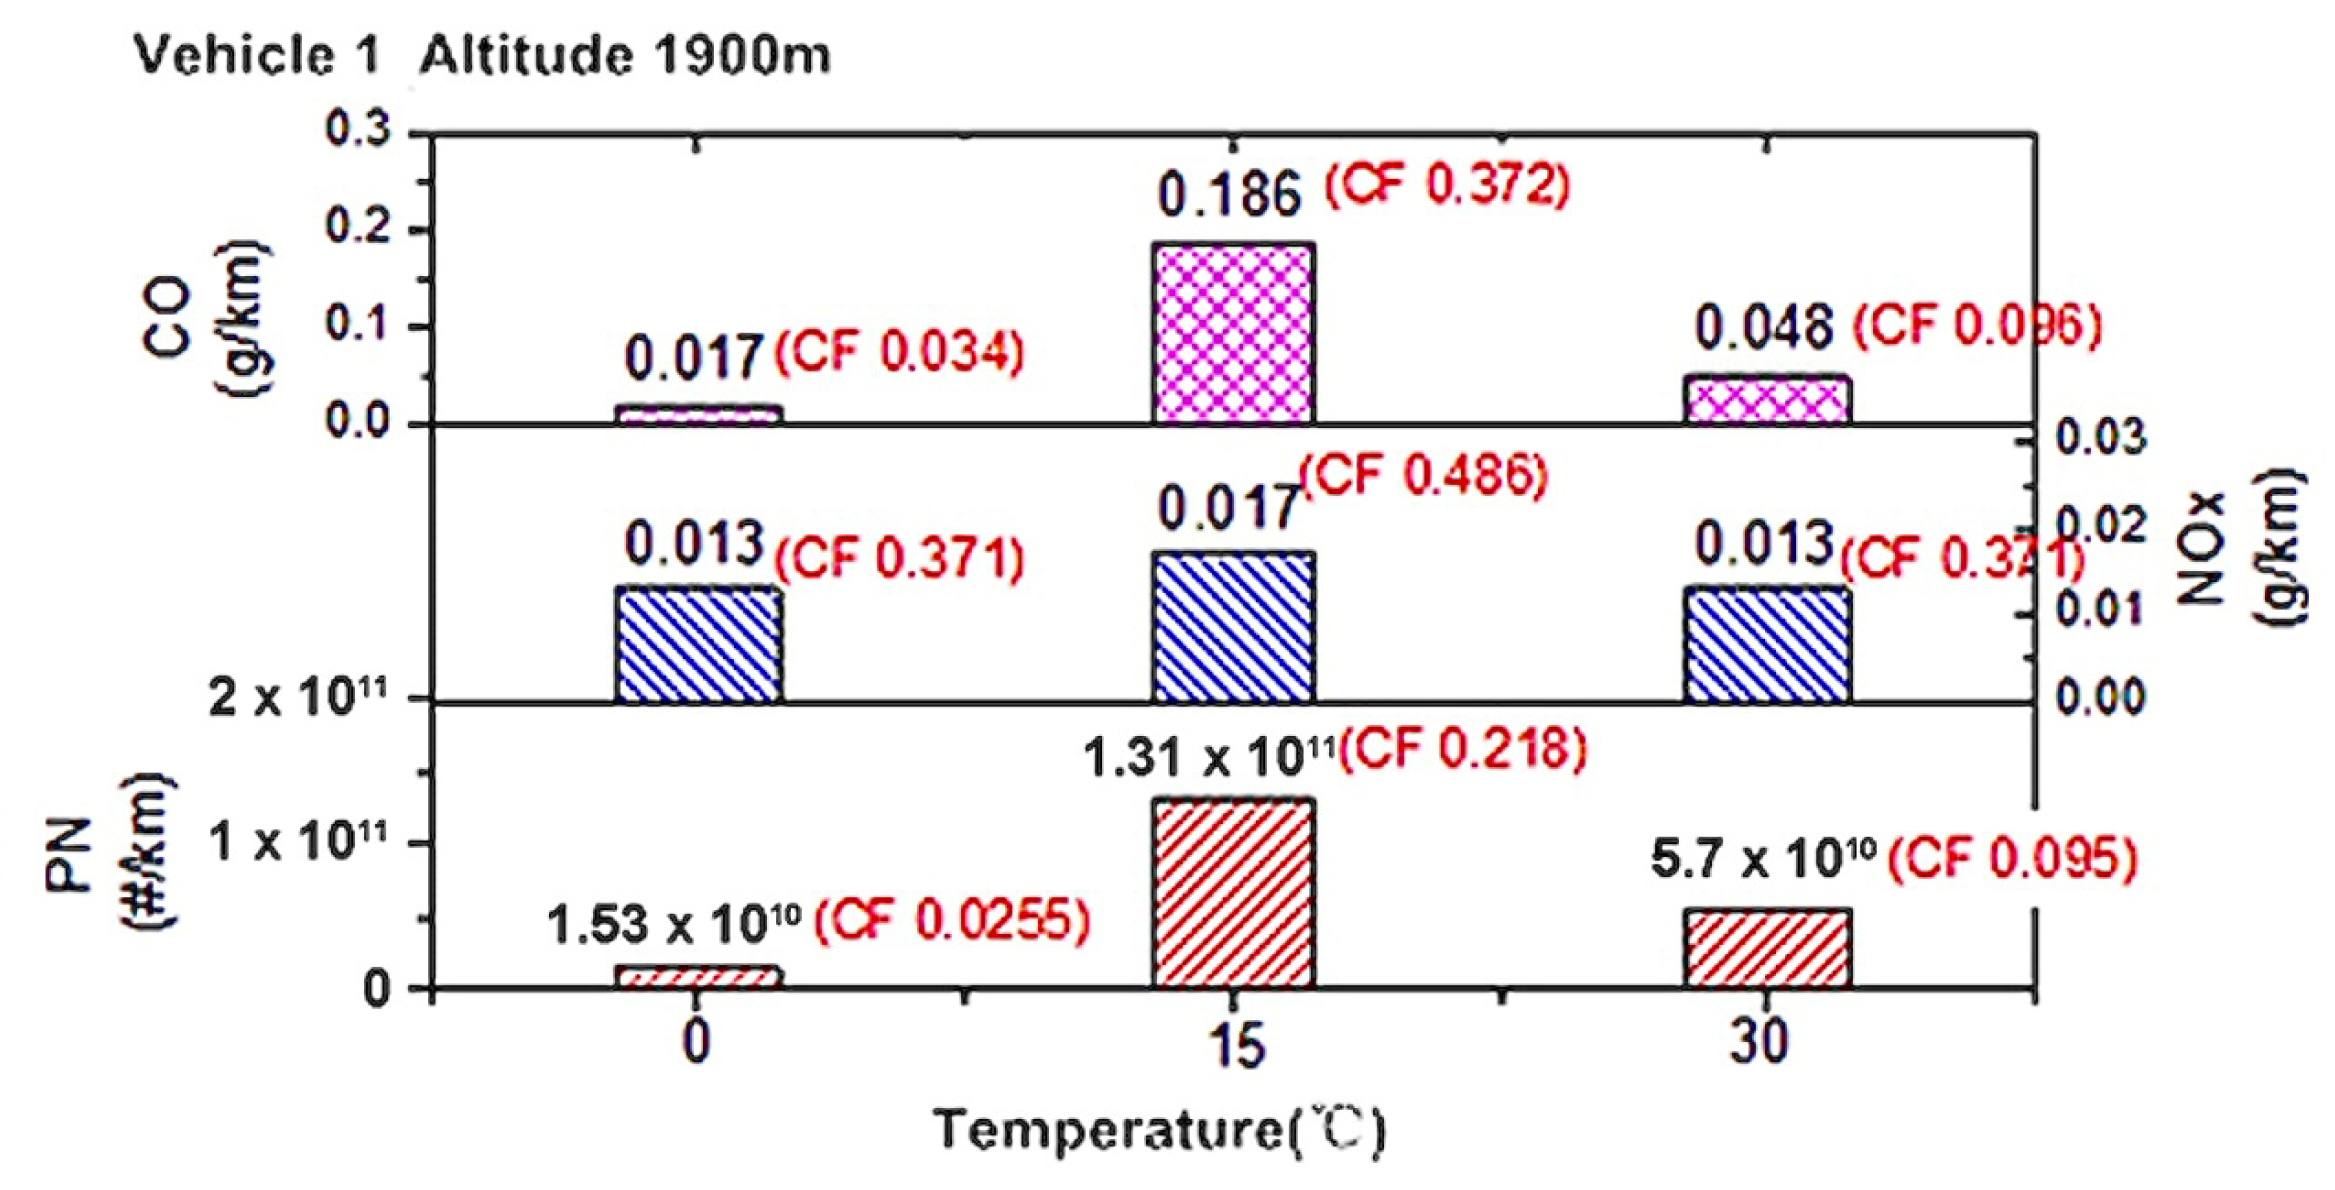
3.2. Effects of Temperature on RDE Emissions

As shown in Figure 4, at 1900 m of altitude, the emission factors of CO, NOx, and PN in the RDE test of the China V standard PFI vehicle did not show obvious regularity when the temperature changed. In the study by Wang et al. on gasoline vehicles under different ambient temperatures, similar results were also observed in the RDE tests [14]. They suggested that non-temperature factors had a greater impact on emissions. However, based on the similar trends observed in the two sets of tests, this phenomenon may be related to the specific calibration strategy of the vehicle’s engine, in which factors such as the fuel film evaporation model could play a role. All emissions data can satisfy the requirements of the China VI standard emission limit value: the highest CO conformance factor is 0.372, which is now 62% allowance; the highest NOx conformance factor is 0.486, which is now 51% allowance; and the highest PN conformance factor is 0.218, which is 78% allowance.
As shown in Figure 5, with no SCR for DPF, for China V standard diesel vehicles that rely solely on EGR to control NOx, in the realm of 15 degrees to 0 degrees in terms of the temperature rise in the process of its RDE test, the CO and PN emissions can all satisfy the China VI standard. Among them, the highest CO compliance factor is 0.146, with a margin of 85%; PN is also far lower than the China VI standard, with a highest compliance factor of only 0.0086. However, NOx emissions significantly exceed the standard, with the highest compliance factor reaching 24.2, which is 23.2 times the limit.

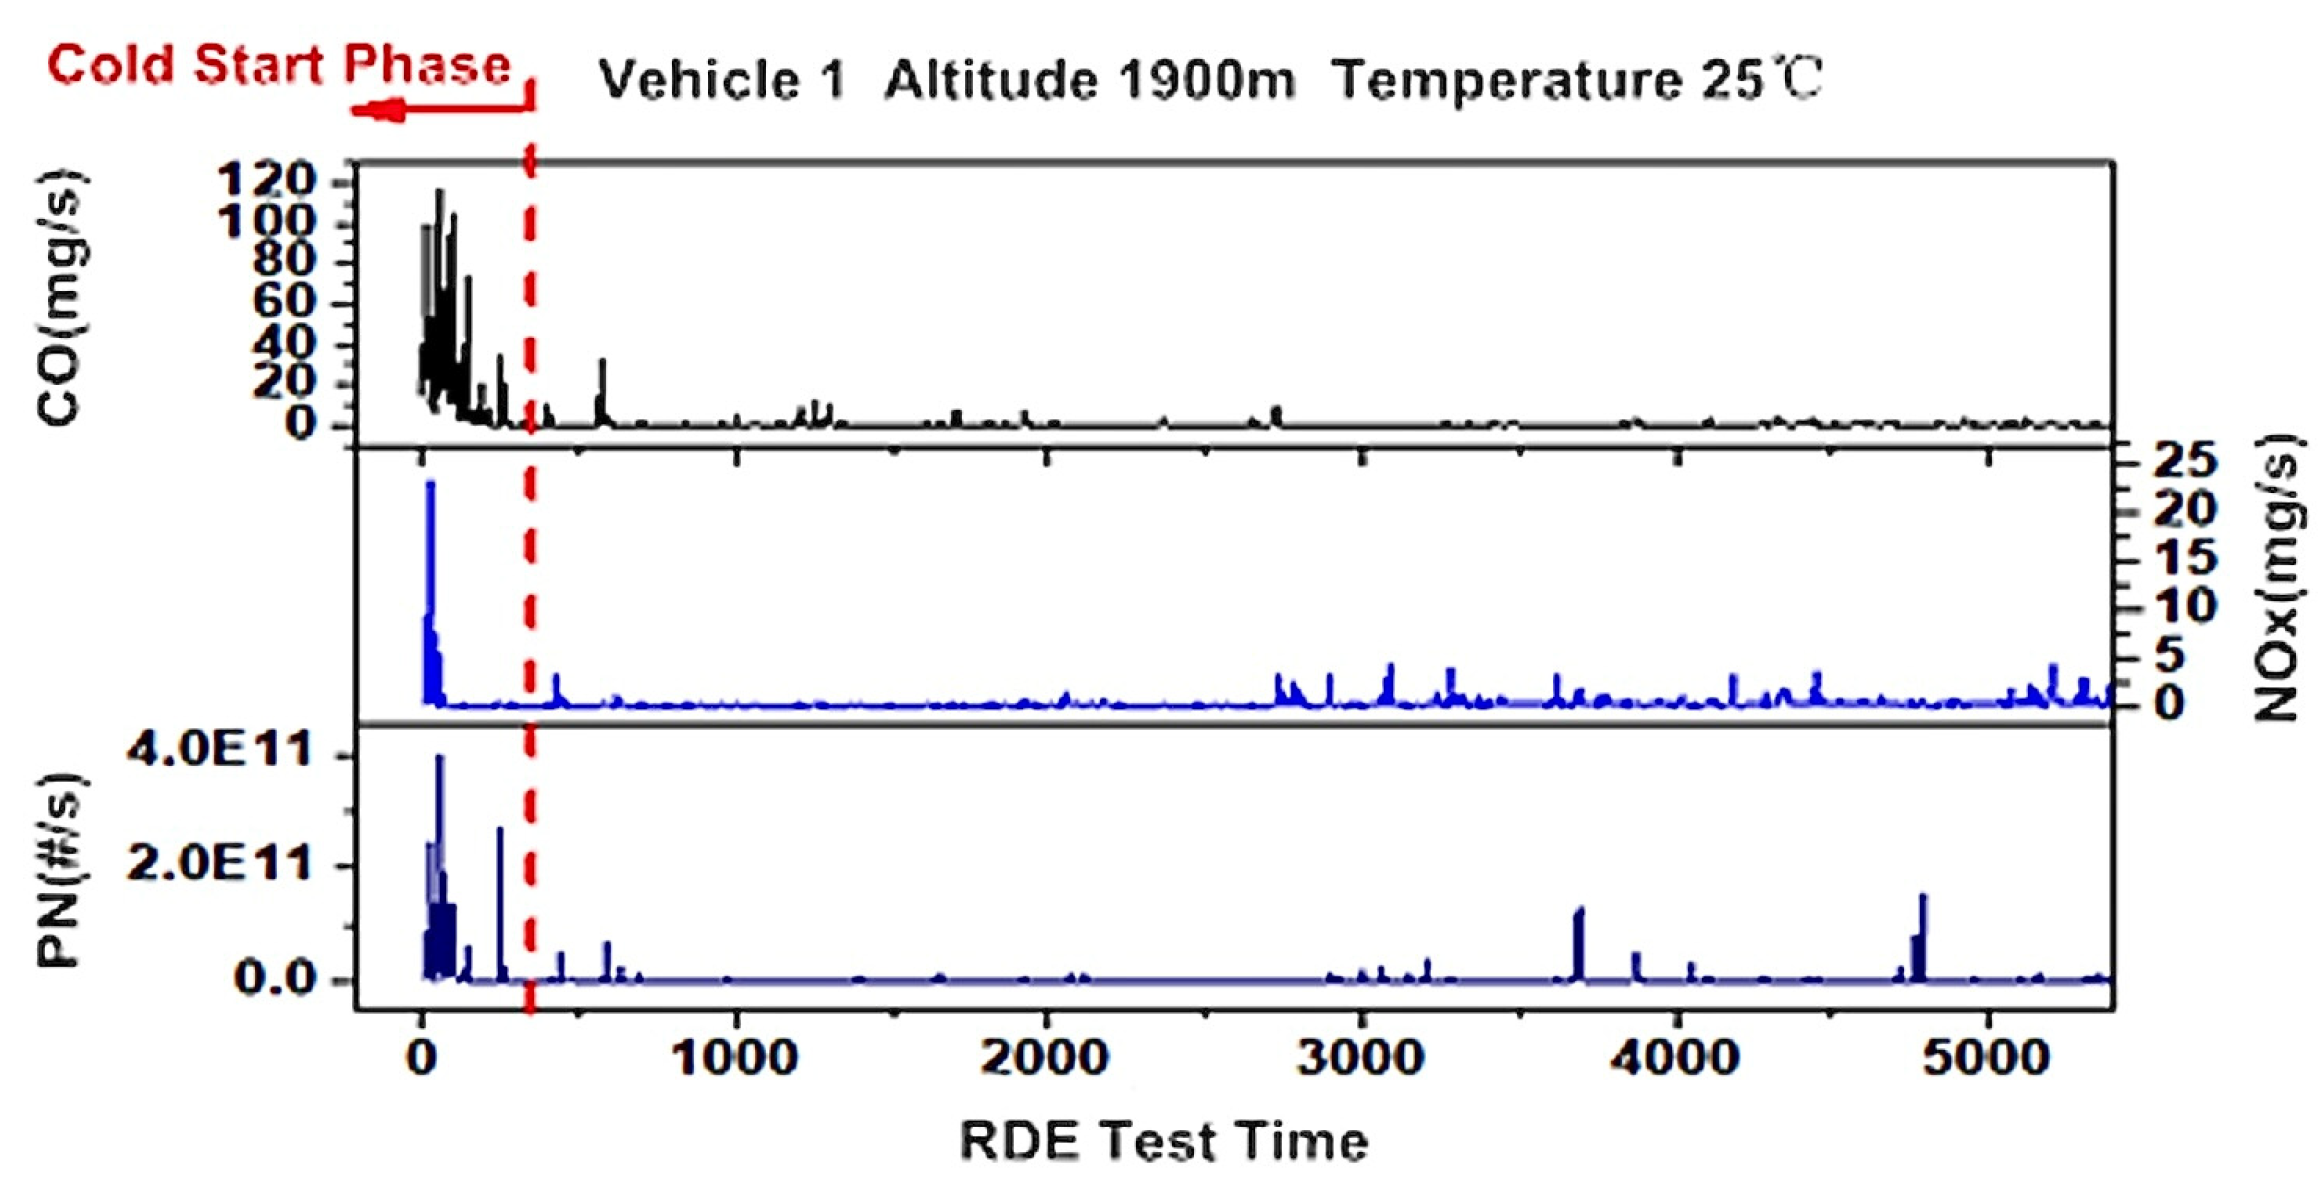
3.3. Effect of Hot and Cold Start on the Emission Results of RDE Test

In the Euro VI and China VI standards, the emission in the cold-start phase should be excluded when the emission results of the RDE test are counted, but this phase is often the most important stage for the formation of pollutants [25]. Therefore, the RDE comparison test for the cold and hot start of Vehicle 1 at 1900 m altitude and 25 °C is conducted.
The EMROAD emission results are shown in Figure 6. Since the EMROAD emission of the regulations eliminate the pollutant data in the cold-start phase, the emission gap between cold- and hot-start EMROAD is not large, and the CO emission from the cold- and hot-start phases is almost the same, while the difference between NOx and PN emissions is about 23%.
As shown in Figure 7, a significant amount of pollutants will be discharged during the cold-start phase of the vehicle. The peak emissions of CO, NOx, and PN in the cold-start phase are several times higher than those in other RDE test stages, and the peak values of CO are even hundreds of times higher. Therefore, the integrated emissions of CO, NOx, and PN during the cold start of the vehicle are significantly higher than those during the hot start of the vehicle, as shown in Figure 8, in which the differences for integrated CO emissions are 68.4%, integrated NOx emissions are 38.4%, and integrated PN emissions are 75%.
The main purposes of RDE are to evaluate the real-time emission levels of vehicles, to promote technological innovation, and to control the emission of pollutants. However, cold start is also a necessary phase in the actual driving process of the vehicle [26]. In this phase, the generation of a large number of pollutants will cause a significant difference in the emissions of cold- and hot-start credits, which is contrary to the original intention of the RDE test. Therefore, RDE should consider adding cold-start emissions at an appropriate time.

3.4. Repeatability of RDE Test

A repeatability verification of the RDE test was conducted to ensure consistent test temperature, altitude, and route selection, as shown in Figure 9. There were significant differences in pollutant emissions in the three repeatable tests, and the difference between the repeatable test results and the average value is shown in Table 3. The largest differences between the CO, NOx, and PN emissions and the average value were 99.5%, 84.5%, and 57.6%, respectively. This indicates that, in the case of the same altitude, temperature, and route, the results of the RDE test will be affected by driving habits (aggressive driving/moderate driving), road conditions (congestion/unblocked), climatic conditions, road choice (uphill/downhill/cave), and many other factors; thus, the repeatability is not strong.

4. Conclusions

This paper studies the calculation methods of pollutant discharge, fuel consumption, and the RDE emissions of sample gasoline and diesel vehicles meeting the China V standard under different altitude and temperature conditions. It also studies the effect of starting conditions and the repeatability of the RDE test through onboard emission equipment. The effects of these environmental factors on RDE test results were investigated, providing guidance for the improvement of testing methods in emission standards. The impact of the driving environment on the actual driving emissions of light vehicles is as follows:
(1) As the altitude increases, the environmental pressure decreases. For gasoline vehicles, the CO emission of test vehicles has no obvious correlation with the change in altitude. Due to the decrease in oxygen concentration at high altitude, the combustion temperature in the cylinder will decrease, so NOx emissions generally show a downward trend with the increase in altitude. The PN emission also decreased with the elevation rise. The highest compliance factor of the three emission indexes is 0.633, which fully meets the current China VI standard. However, for China V standard diesel vehicles that only rely on EGR to control NOx, the emissions of CO, NOx, and PN rise. Among these, NOx emissions far exceed the China VI standard, with the highest compliance factor being 22.8, exceeding the standard by 21.8 times. As such, for China V standard diesel vehicles, controlling NOx through EGR technology alone is far from meeting the RDE requirements of the China VI standard;
(2) The emission factors of CO, NOx, and PN in the RDE test of the China V PFI vehicle do not show obvious regularity with the temperature changes. However, for the China V standard diesel vehicle that relies on EGR to control NOx, the same NOx emission exceeds the standard significantly, and the highest compliance factor is 24.2, which is 23.2 times higher than the standard;
(3) Hot and cold starts cause obvious differences in the final results of the test. However, since the EMROAD emission calculated according to the law will eliminate the pollutant data in the cold-start phase, the difference between cold- and hot-start EMROAD emission is not large. Starting is also a necessary phase in the actual driving process. In this phase, the generation of a significant amount of pollutants will cause a significant difference in the emissions of cold- and hot-start integrals, which is contrary to the original intention of the RDE test. Therefore, legislators should consider adding cold-start emissions at an appropriate time;
(4) When ensuring that the external conditions of the test are consistent, the repeatability of the RDE test was verified. There were significant differences in pollutant emissions in the three repeated tests, among which the maximum differences between CO, NOx, and PN emissions and the average values were 99.5%, 84.5%, and 57.6%, respectively, indicating that RDE was more affected by the actual boundary conditions, making the test less repeatable.
The experimental results show that some phenomena may still be related to the engine configurations of the vehicle under different environmental conditions, such as torque limitations, EGR strategies, and post-injection strategies in certain cases. These influencing factors need to be further analyzed in future studies.

Author Contributions

Data curation, writing—original draft, conceptualization, methodology, validation, investigation, resources: H.Y., Y.S., and L.C.; Supervision, project administration, funding acquisition: Y.S. and L.C.; Writing—review and editing: Y.S., B.S., Y.Z. and B.W. All authors have read and agreed to the published version of the manuscript.

Funding

This research was funded by the Key Research and Development Project of Social Development of Science and Technology Agency of Jilin Province (Authorized Number: 20220203156SF) and the Jilin University 2025 Experimental Technology Project (Authorized Number: XYXM2025a005).

Data Availability Statement

Data are contained within the article.

Conflicts of Interest

The authors declare no conflicts of interest.

References

  1. Li, J.; Gong, C.; Wang, E.; Yu, X.; Wang, Z.; Liu, X. Emissions of Formaldehyde and Unburned Methanol from a Spark-Ignition Methanol Engine during Cold Start. Energy Fuels 2010, 24, 863–870. [Google Scholar] [CrossRef]
  2. Wang, B.; Xie, F.; Li, X.; Jiang, B.; Su, Y.; Wang, Z.; Liu, Y.; Liang, Z. Optical and simulation investigation of effect of jet-wall interaction on combustion performance of methanol pre-chamber turbulent jet ignition system. Appl. Energy 2025, 385, 125533. [Google Scholar] [CrossRef]
  3. Wang, H.; Wang, X.; Ge, Y.; Wang, S.; Yang, J.; Ji, C. Analyzing the impact of hydrogen direct injection parameters on flow field and combustion characteristics in Wankel rotary engines. Energy 2025, 319, 135004. [Google Scholar] [CrossRef]
  4. Weixia, L.; Zhurong, D.; Ling, M.; Guoyuan, W.; Zhijun, D.; Jianfeng, Z.; Wenwei, H. On-road evaluation and regulatory recommendations for NOx and particle number emissions of China VI heavy-duty diesel trucks: A case study in Shenzhen. Sci. Total Environ. 2024, 928, 172427. [Google Scholar] [CrossRef]
  5. Wasserburger, A.; Hametner, C. Automated Generation of Real Driving Emissions Compliant Drive Cycles Using Conditional Probability Modeling. In Proceedings of the 2020 IEEE Vehicle Power and Propulsion Conference (VPPC), Gijon, Spain, 18 November–16 December 2020; pp. 1–6. [Google Scholar]
  6. Wang, Y.C.; Su, S.; Lai, Y.T.; Luo, W.Y.; Hou, P.; Lyu, T.; Ge, Y.S. China 6 EGR gasoline vehicles without a GPF may struggle to meet the potential SPN10 limit. Environ. Int. 2023, 181, 6. [Google Scholar] [CrossRef]
  7. Zhao, H.G.; Shi, L.H.; Xu, X.L.; Qiu, J.S.; Li, L.; Wang, J.F.; Yu, W.H.; Ge, Y.S. Impact of Shortening Real Driving Emission (RDE) Test Trips on CO, NO, and PN Emissions from Different Vehicles. Sustainability 2024, 16, 15. [Google Scholar] [CrossRef]
  8. Wasserburger, A.; Hametner, C.; Didcock, N. Risk-averse real driving emissions optimization considering stochastic influences. Eng. Optim. 2020, 52, 122–138. [Google Scholar] [CrossRef]
  9. Wang, Y.; Yin, H.; Wang, J.; Hao, C.; Xu, X.; Wang, Y.; Yang, Z.; Hao, L.; Tan, J.; Wang, X.; et al. China 6 moving average window method for real driving emission evaluation: Challenges, causes, and impacts. J Env. Manag. 2022, 319, 115737. [Google Scholar] [CrossRef]
  10. Su, S.; Ge, Y.; Hou, P.; Wang, X.; Wang, Y.; Lyu, T.; Luo, W.; Lai, Y.; Ge, Y.; Lyu, L. China VI heavy-duty moving average window (MAW) method: Quantitative analysis of the problem, causes, and impacts based on the real driving data. Energy 2021, 225, 120295. [Google Scholar] [CrossRef]
  11. Sikai, Z.; Yunshan, G.; Weicheng, C.; Xin, W.; Bin, S.; Wenlin, Y. A research on the effects of different data processing methods on the results of RDE test. Automot. Eng. 2018, 40, 646–651+665. [Google Scholar] [CrossRef]
  12. Yu, L.X.; Ge, Y.S.; Tan, J.W.; He, C.; Wang, X.Z.; Liu, H.; Zhao, W.; Guo, J.D.; Fu, G.; Feng, X.Y.; et al. Experimental investigation of the impact of biodiesel on the combustion and emission characteristics of a heavy duty diesel engine at various altitudes. Fuel 2014, 115, 220–226. [Google Scholar] [CrossRef]
  13. Ko, J.; Myung, C.-L.; Park, S. Impacts of ambient temperature, DPF regeneration, and traffic congestion on NOx emissions from a Euro 6-compliant diesel vehicle equipped with an LNT under real-world driving conditions. Atmos. Environ. 2019, 200, 1–14. [Google Scholar] [CrossRef]
  14. Wang, R.; Zhang, L.; Peng, J.; Han, J.; Du, B.; Gong, B.; Xue, H.; Tuo, D.; Zhang, Q. Effect of ambient high-temperature on real driving emission tests of a light-duty gasoline vehicle. Atmos. Pollut. Res. 2024, 15, 101998. [Google Scholar] [CrossRef]
  15. Lyu, M.; Bao, X.F.; Wang, Y.J.; Matthews, R. Analysis of emissions from various driving cycles based on real driving measurements obtained in a high-altitude city. Proc. Inst. Mech. Eng. Part D-J. Automob. Eng. 2020, 234, 1563–1571. [Google Scholar] [CrossRef]
  16. Gao, H.; Wang, R.; Wen, Z.; Xiong, X.; Zheng, Z.; Lin, S.; Ding, H.; Tan, W. The real driving emissions characteristics of light-duty diesel vehicle in four typical cities with varying altitudes in China. Case Stud. Therm. Eng. 2025, 67, 105831. [Google Scholar] [CrossRef]
  17. Wang, H.; Ge, Y.; Hao, L.; Xu, X.; Tan, J.; Li, J.; Wu, L.; Yang, J.; Yang, D.; Peng, J.; et al. The real driving emission characteristics of light-duty diesel vehicle at various altitudes. Atmos. Environ. 2018, 191, 126–131. [Google Scholar] [CrossRef]
  18. Zheng, F.; Zhao, H.; Ji, J.; Yin, H.; Ding, Y.; Li, J. Real Driving Emission Characteristics of China VI Hybrid Electric Vehicle Based on Altitude Conditions in Beijing and Kunming. Res. Environ. Sci. 2022, 35, 1581–1588. [Google Scholar] [CrossRef]
  19. Claßen, J.; Sterlepper, S.; Dorscheidt, F.; Görgen, M.; Scharf, J.; Nijs, M.; Alt, N.; Balazs, A.; Böhmer, M.; Doucet, M.; et al. RDE cycle generation—A statistical approach to cut down testing effort and provide a secure base to approve RDE legislation compliance. In Internationaler Motorenkongress; Springer: Wiesbaden, Germany, 2019; pp. 37–56. [Google Scholar]
  20. Wang, Y.; Ge, Y.; Wang, J.; Wang, X.; Yin, H.; Hao, L.; Tan, J. Impact of altitude on the real driving emission (RDE) results calculated in accordance to moving averaging window (MAW) method. Fuel 2020, 277, 117929. [Google Scholar] [CrossRef]
  21. Wang, A.J.; Ge, Y.S.; Tan, J.W.; Han, X.K. Study on relationships between on-road driving characters and emission characteristics of taxies in Beijing. Beijing Ligong Daxue Xuebao/Trans. Beijing Inst. Technol. 2010, 30, 891–894+905. [Google Scholar]
  22. Li, M.; Feng, Y.; Qin, K.; Feng, Y.; Zhang, J.; Gao, J. Real-world emission characteristics of in-use light-duty vehicles in Beijing. J. Wuhan Univ. Technol. (Transp. Sci. Eng.) 2011, 35, 237–240. [Google Scholar]
  23. Giraldo, M.; Huertas, J.I. Real emissions, driving patterns and fuel consumption of in-use diesel buses operating at high altitude. Transp. Res. Part D Transp. Environ. 2019, 77, 21–36. [Google Scholar] [CrossRef]
  24. Kwon, S.; Park, Y.; Park, J.; Kim, J.; Choi, K.H.; Cha, J.S. Characteristics of on-road NO(x) emissions from Euro 6 light-duty diesel vehicles using a portable emissions measurement system. Sci. Total Environ. 2017, 576, 70–77. [Google Scholar] [CrossRef] [PubMed]
  25. Varella, R.A.; Duarte, G.; Baptista, P.; Mendoza Villafuerte, P.; Sousa, L. Analysis of the Influence of Outdoor Temperature in Vehicle Cold-Start Operation Following EU Real Driving Emission Test Procedure. SAE Int. J. Commer. Veh. 2017, 10, 596–697. [Google Scholar] [CrossRef]
  26. Li, H.; Andrews, G.E.; Savvidis, D. Influence of Cold Start and Ambient Temperatures on Greenhouse Gas (GHG) Emissions, Global Warming Potential (GWP) and Fuel Economy for SI Car Real World Driving. SAE Int. J. Fuels Lubr. 2010, 3, 133–148. [Google Scholar] [CrossRef]
Figure 1. AVL M.O.V.E vehicle onboard emission measurement system.
Energies 18 02253 g001
Figure 2. Effect of altitude on RDE test emission for Vehicle 1.
Energies 18 02253 g002
Figure 3. Effect of altitude on RDE test emission for Vehicle 2.
Energies 18 02253 g003
Figure 4. Effect of temperature on RDE test emission for Vehicle 1.
Energies 18 02253 g004
Figure 5. Effect of temperature on RDE test emission for Vehicle 2.
Energies 18 02253 g005
Figure 6. Effect of hot and cold start on EMROAD emission in RDE test.
Energies 18 02253 g006
Figure 7. Transient discharge of emissions during RDE test.
Energies 18 02253 g007
Figure 8. Effects of hot and cold start on RDE test integrated emissions.
Energies 18 02253 g008
Figure 9. Repeatability of the RDE test.
Energies 18 02253 g009
Table 1. Main parameters of test vehicles.
VehicleStandardFuelInjection TypeIntake FormDisplacementWeightAftertreatment
Vehicle 1China VGasolinePFINaturally aspirated1.5 L1560 kgTernary catalytic
Vehicle 2China VDieselDITurbocharged2.0 L2430 kgDPF
Table 2. RDE test condition environment.
VehicleAltitude/mTemperature/°C
Vehicle 1015
130015
19000/15/30
240015
Vehicle 219000/15/30
22000
30000
Table 3. The difference between the results of repeated tests and the average.
Test No.Difference from the Average %
CONOxPN
1+99.5−9.1−22.6
2−84.5−30.1−35.1
3−15.1+39.9+57.6
Disclaimer/Publisher’s Note: The statements, opinions and data contained in all publications are solely those of the individual author(s) and contributor(s) and not of MDPI and/or the editor(s). MDPI and/or the editor(s) disclaim responsibility for any injury to people or property resulting from any ideas, methods, instructions or products referred to in the content.

