
Characteristics of High-Pressure Hydrogen Jet Dispersion Along a Horizontal Plate


 , and
, and 
Abstract
:1. Introduction
2. Methodology
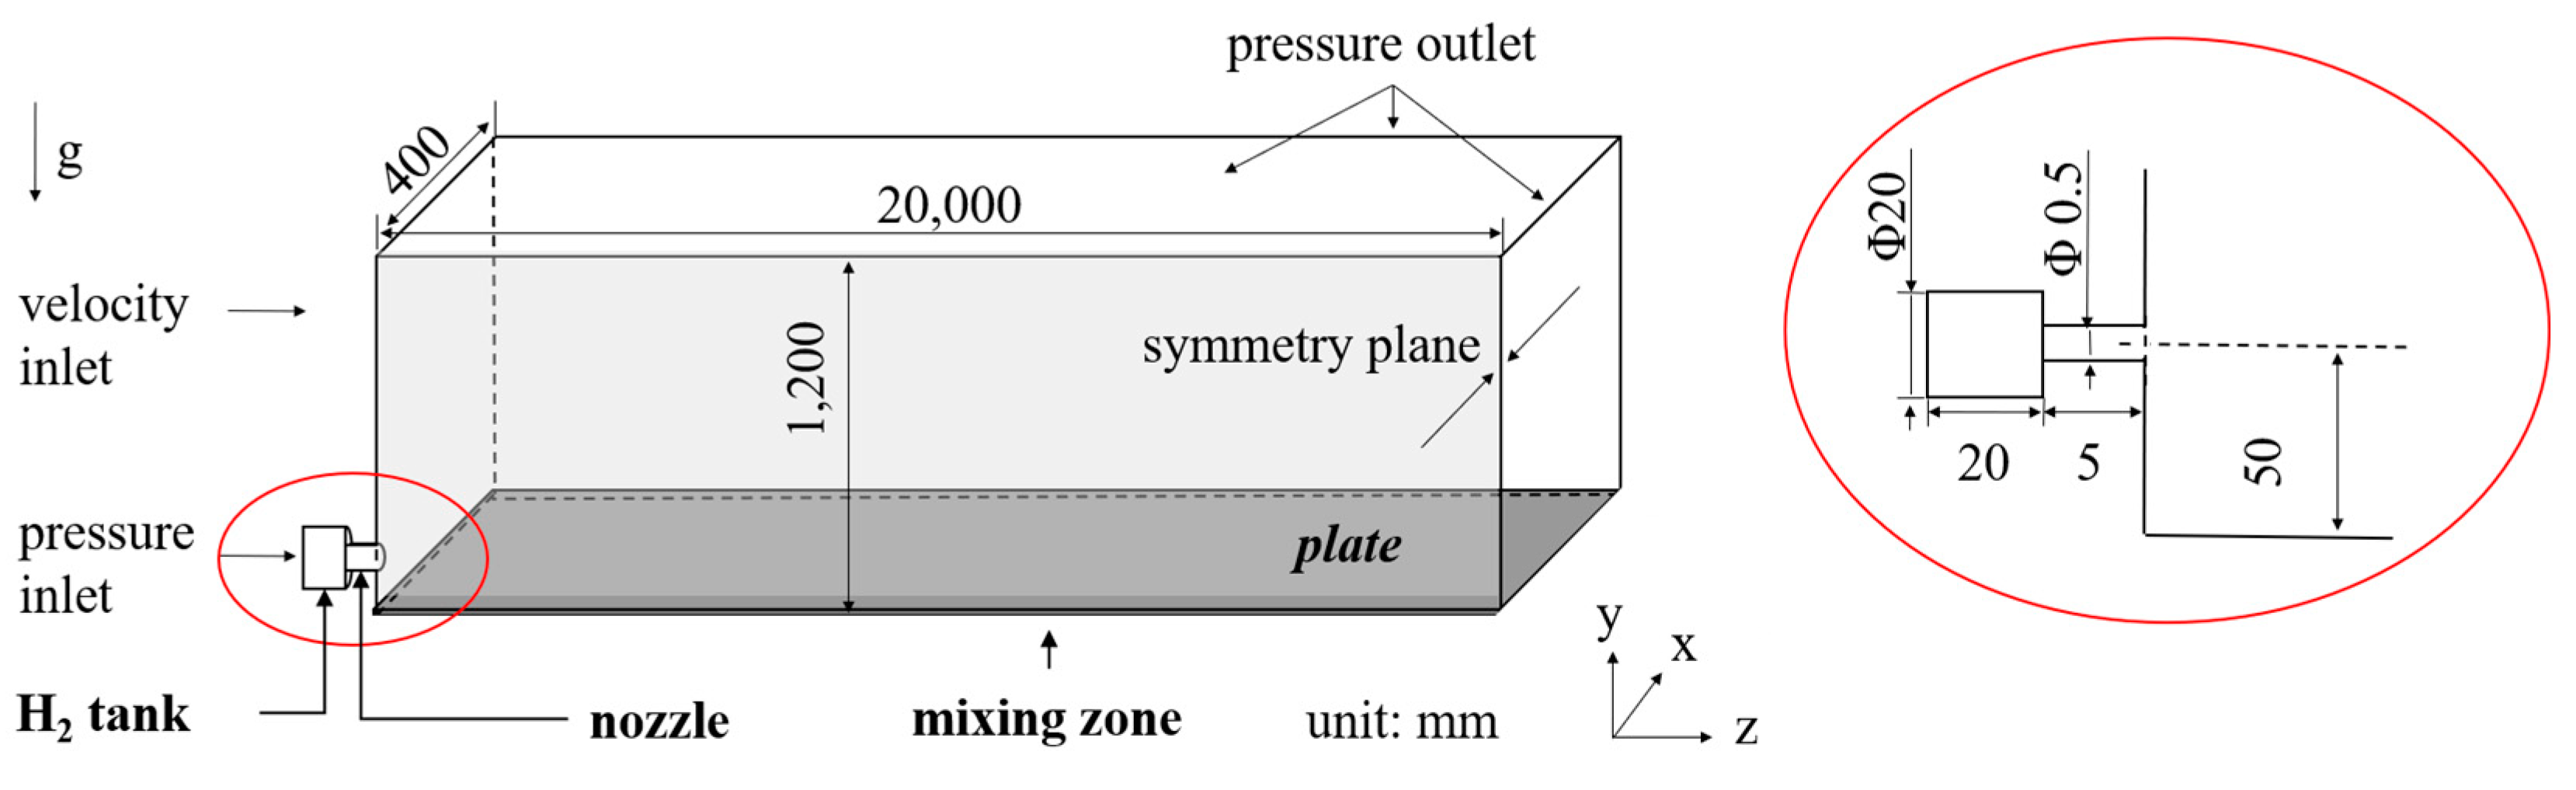
2.1. Geometry
2.2. Numerical Model
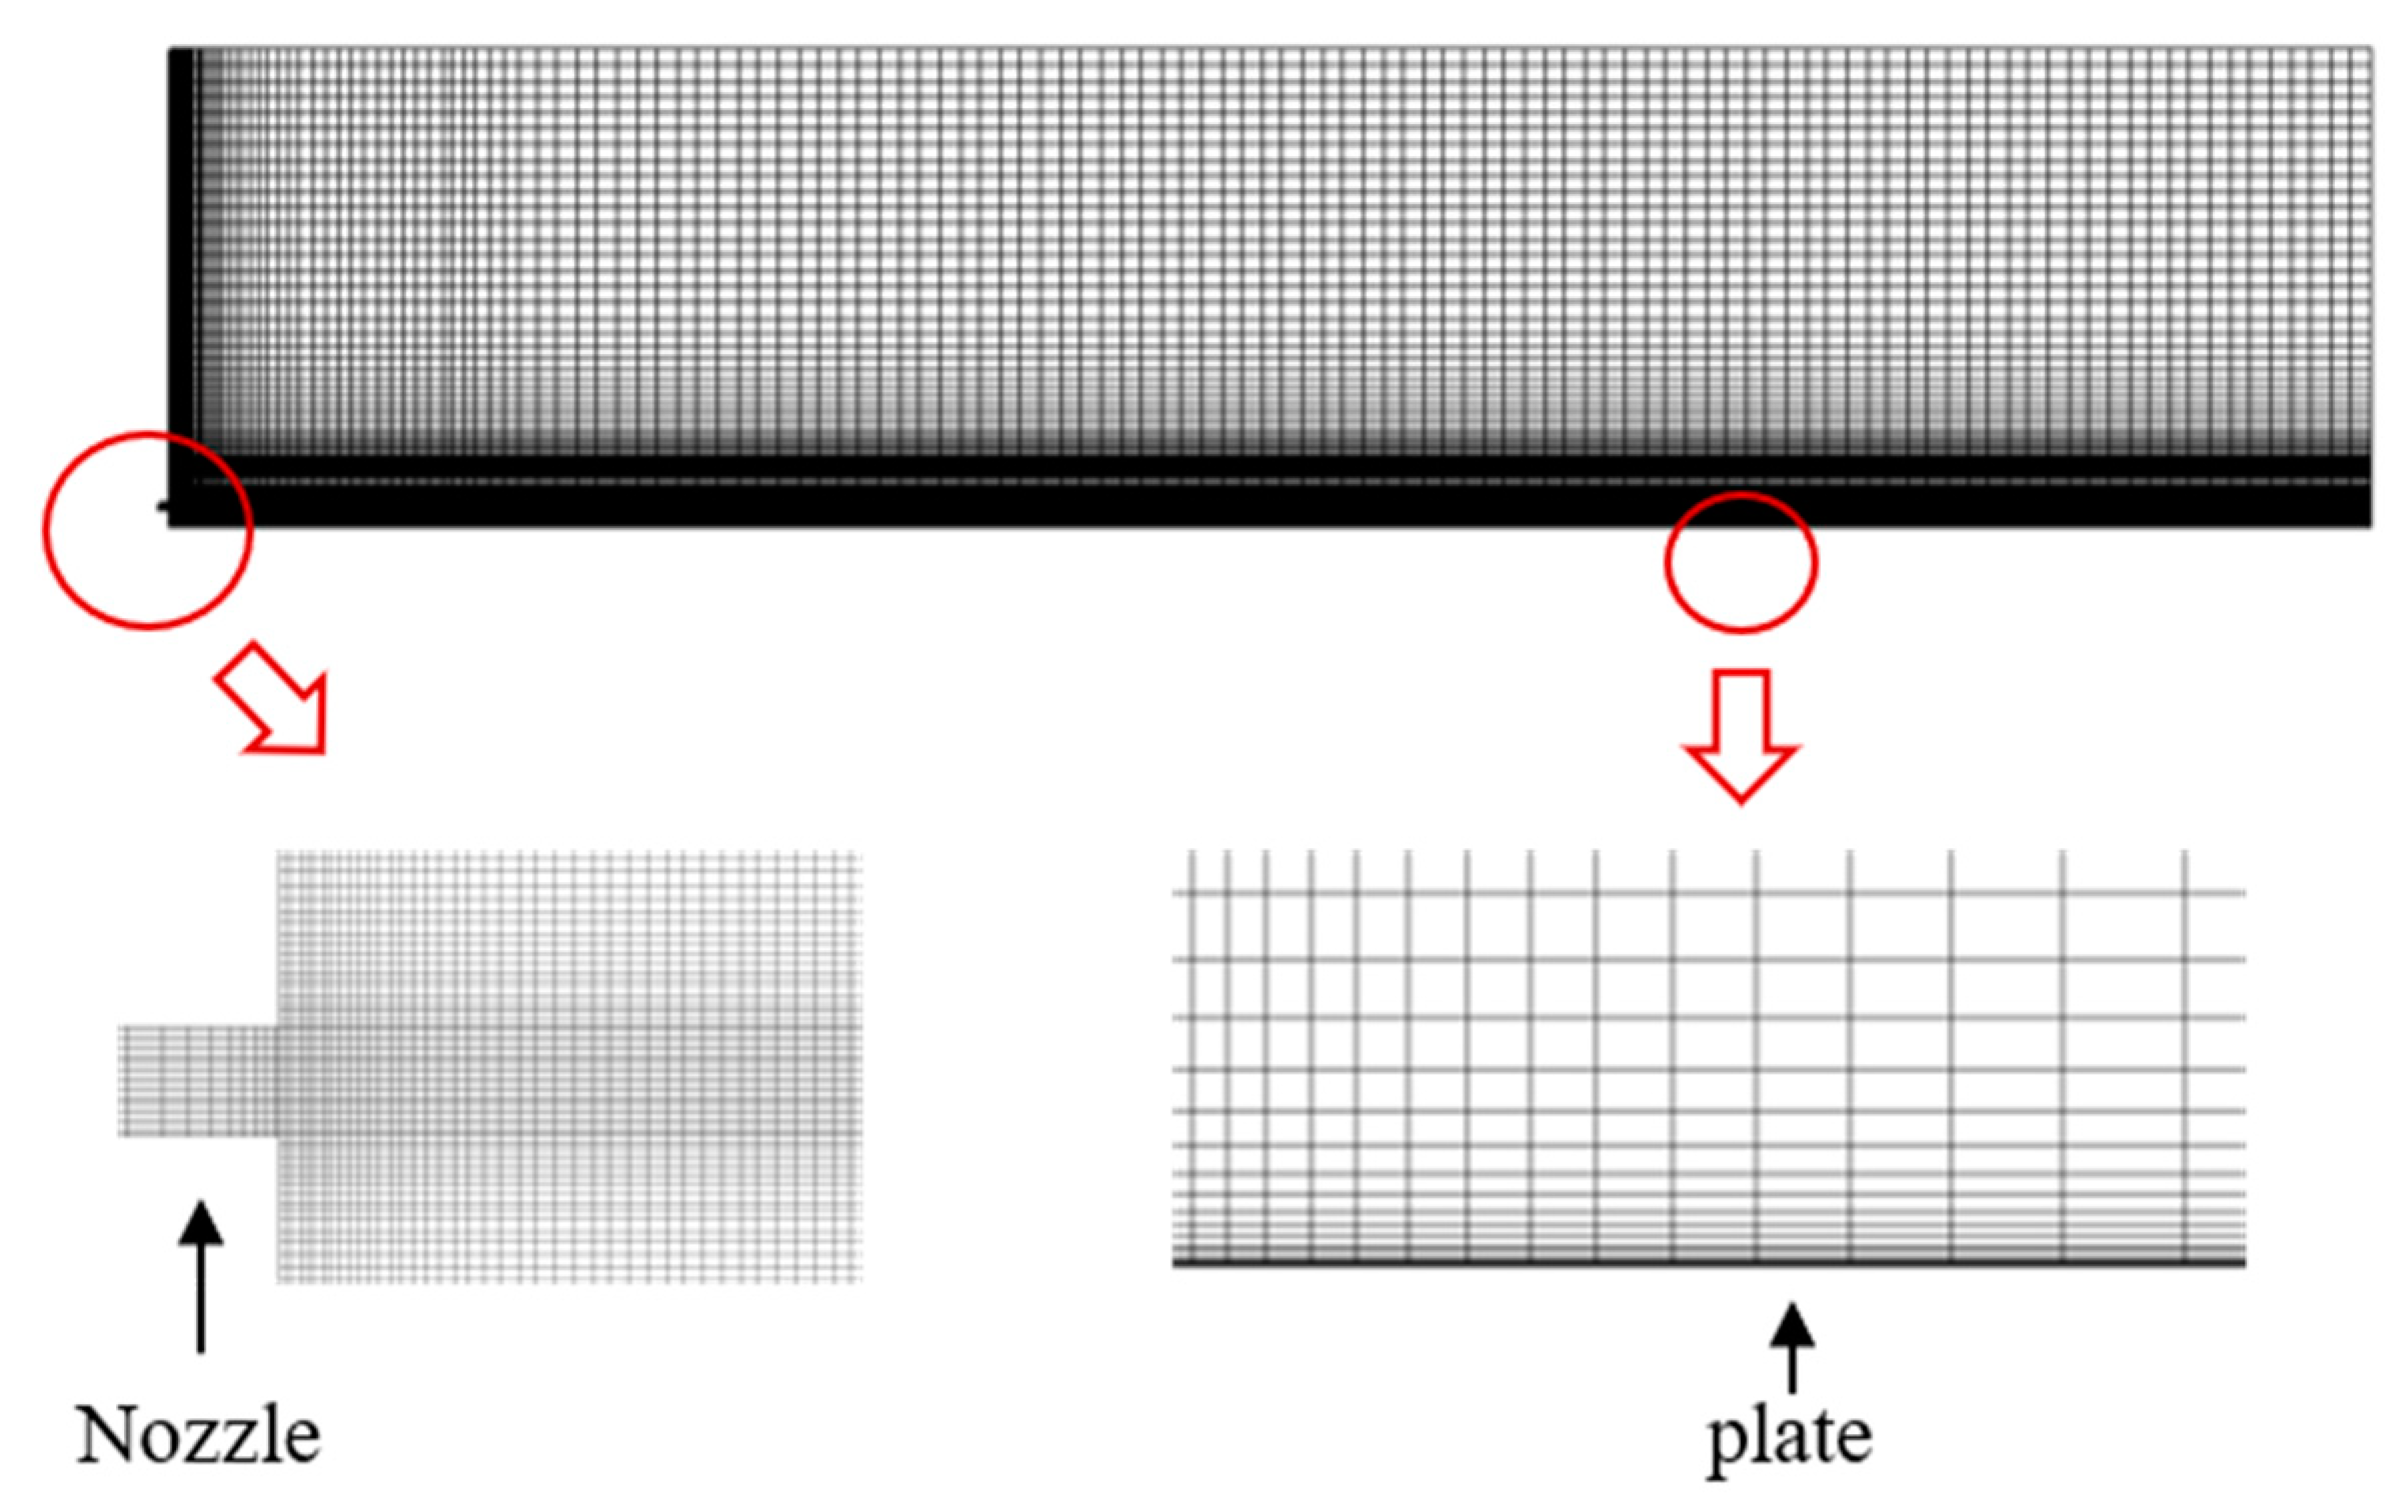
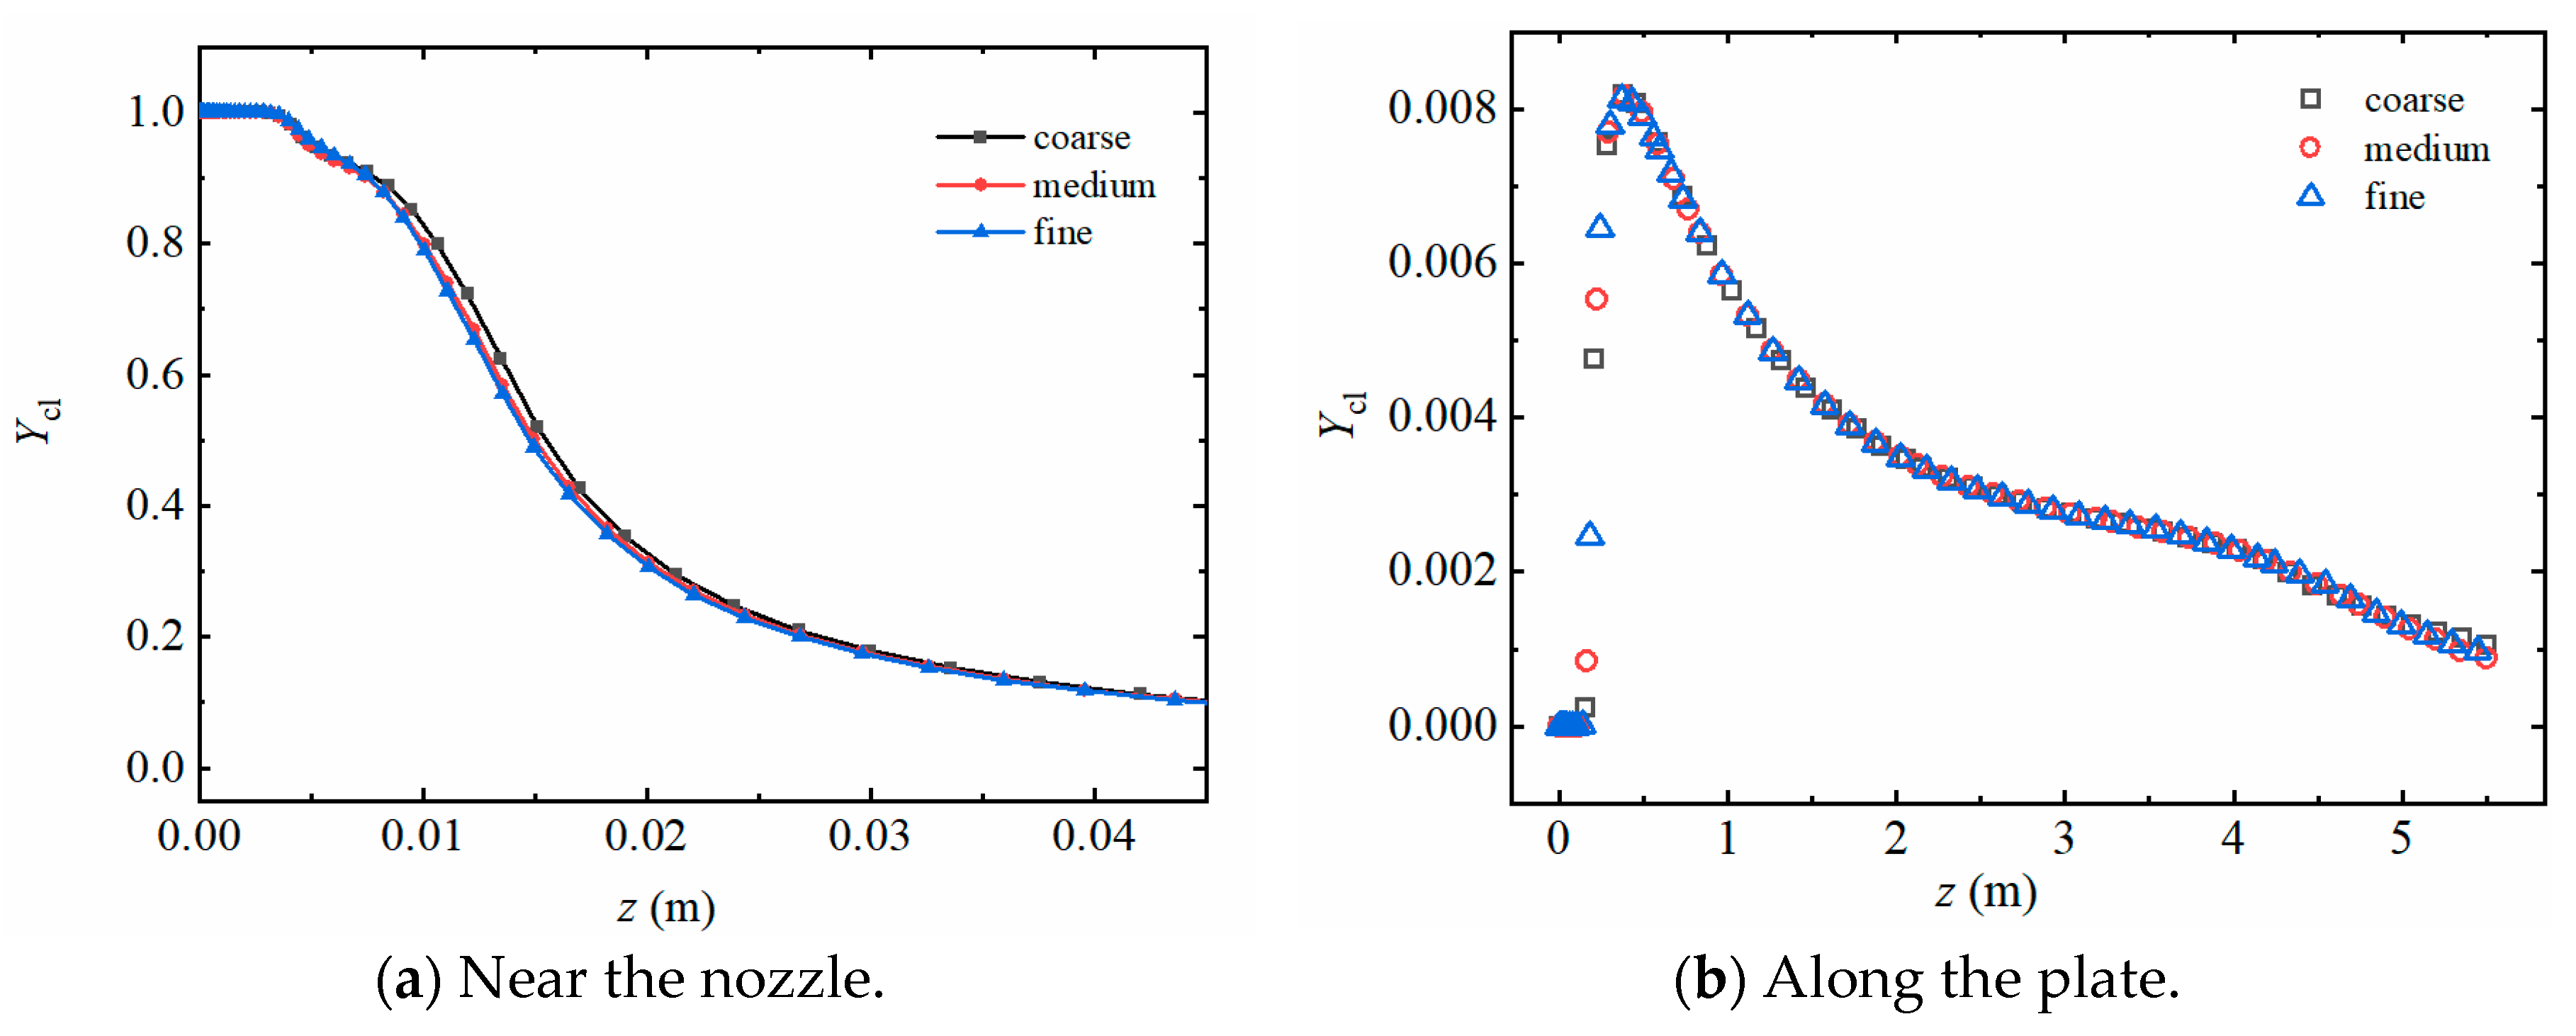
2.3. Grid Sensitivity
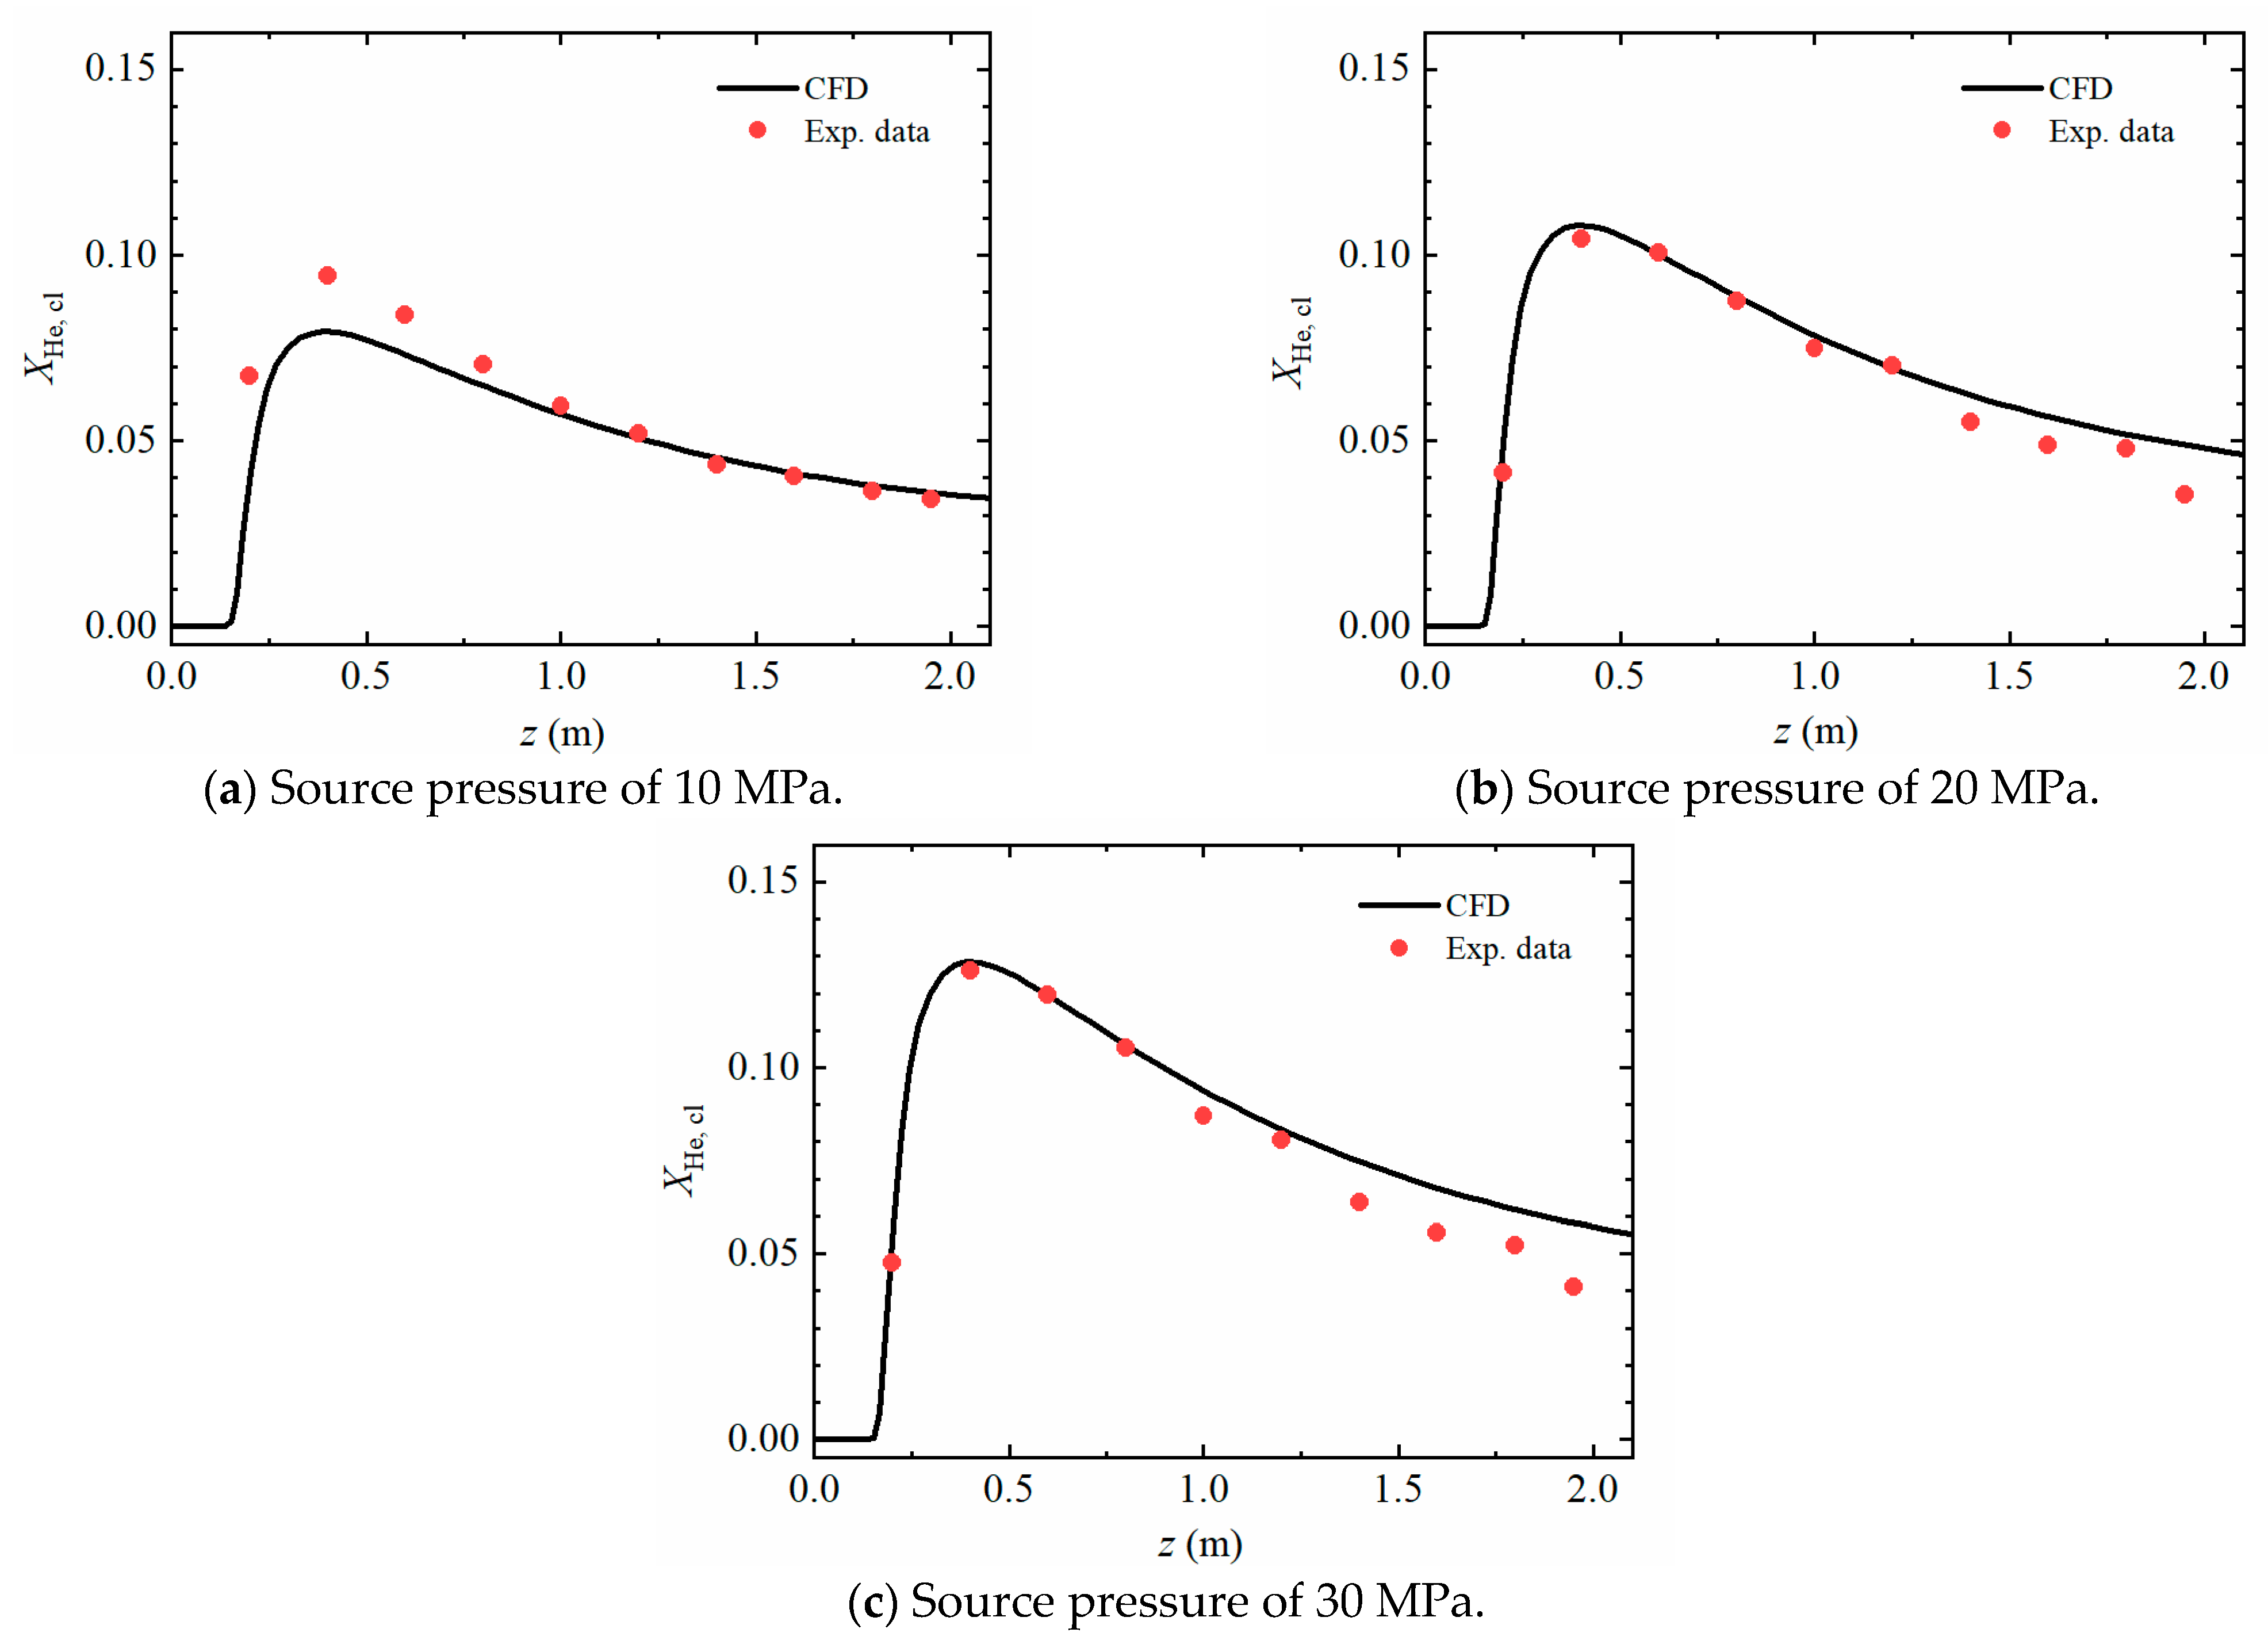
2.4. Validation
3. Results and Discussion
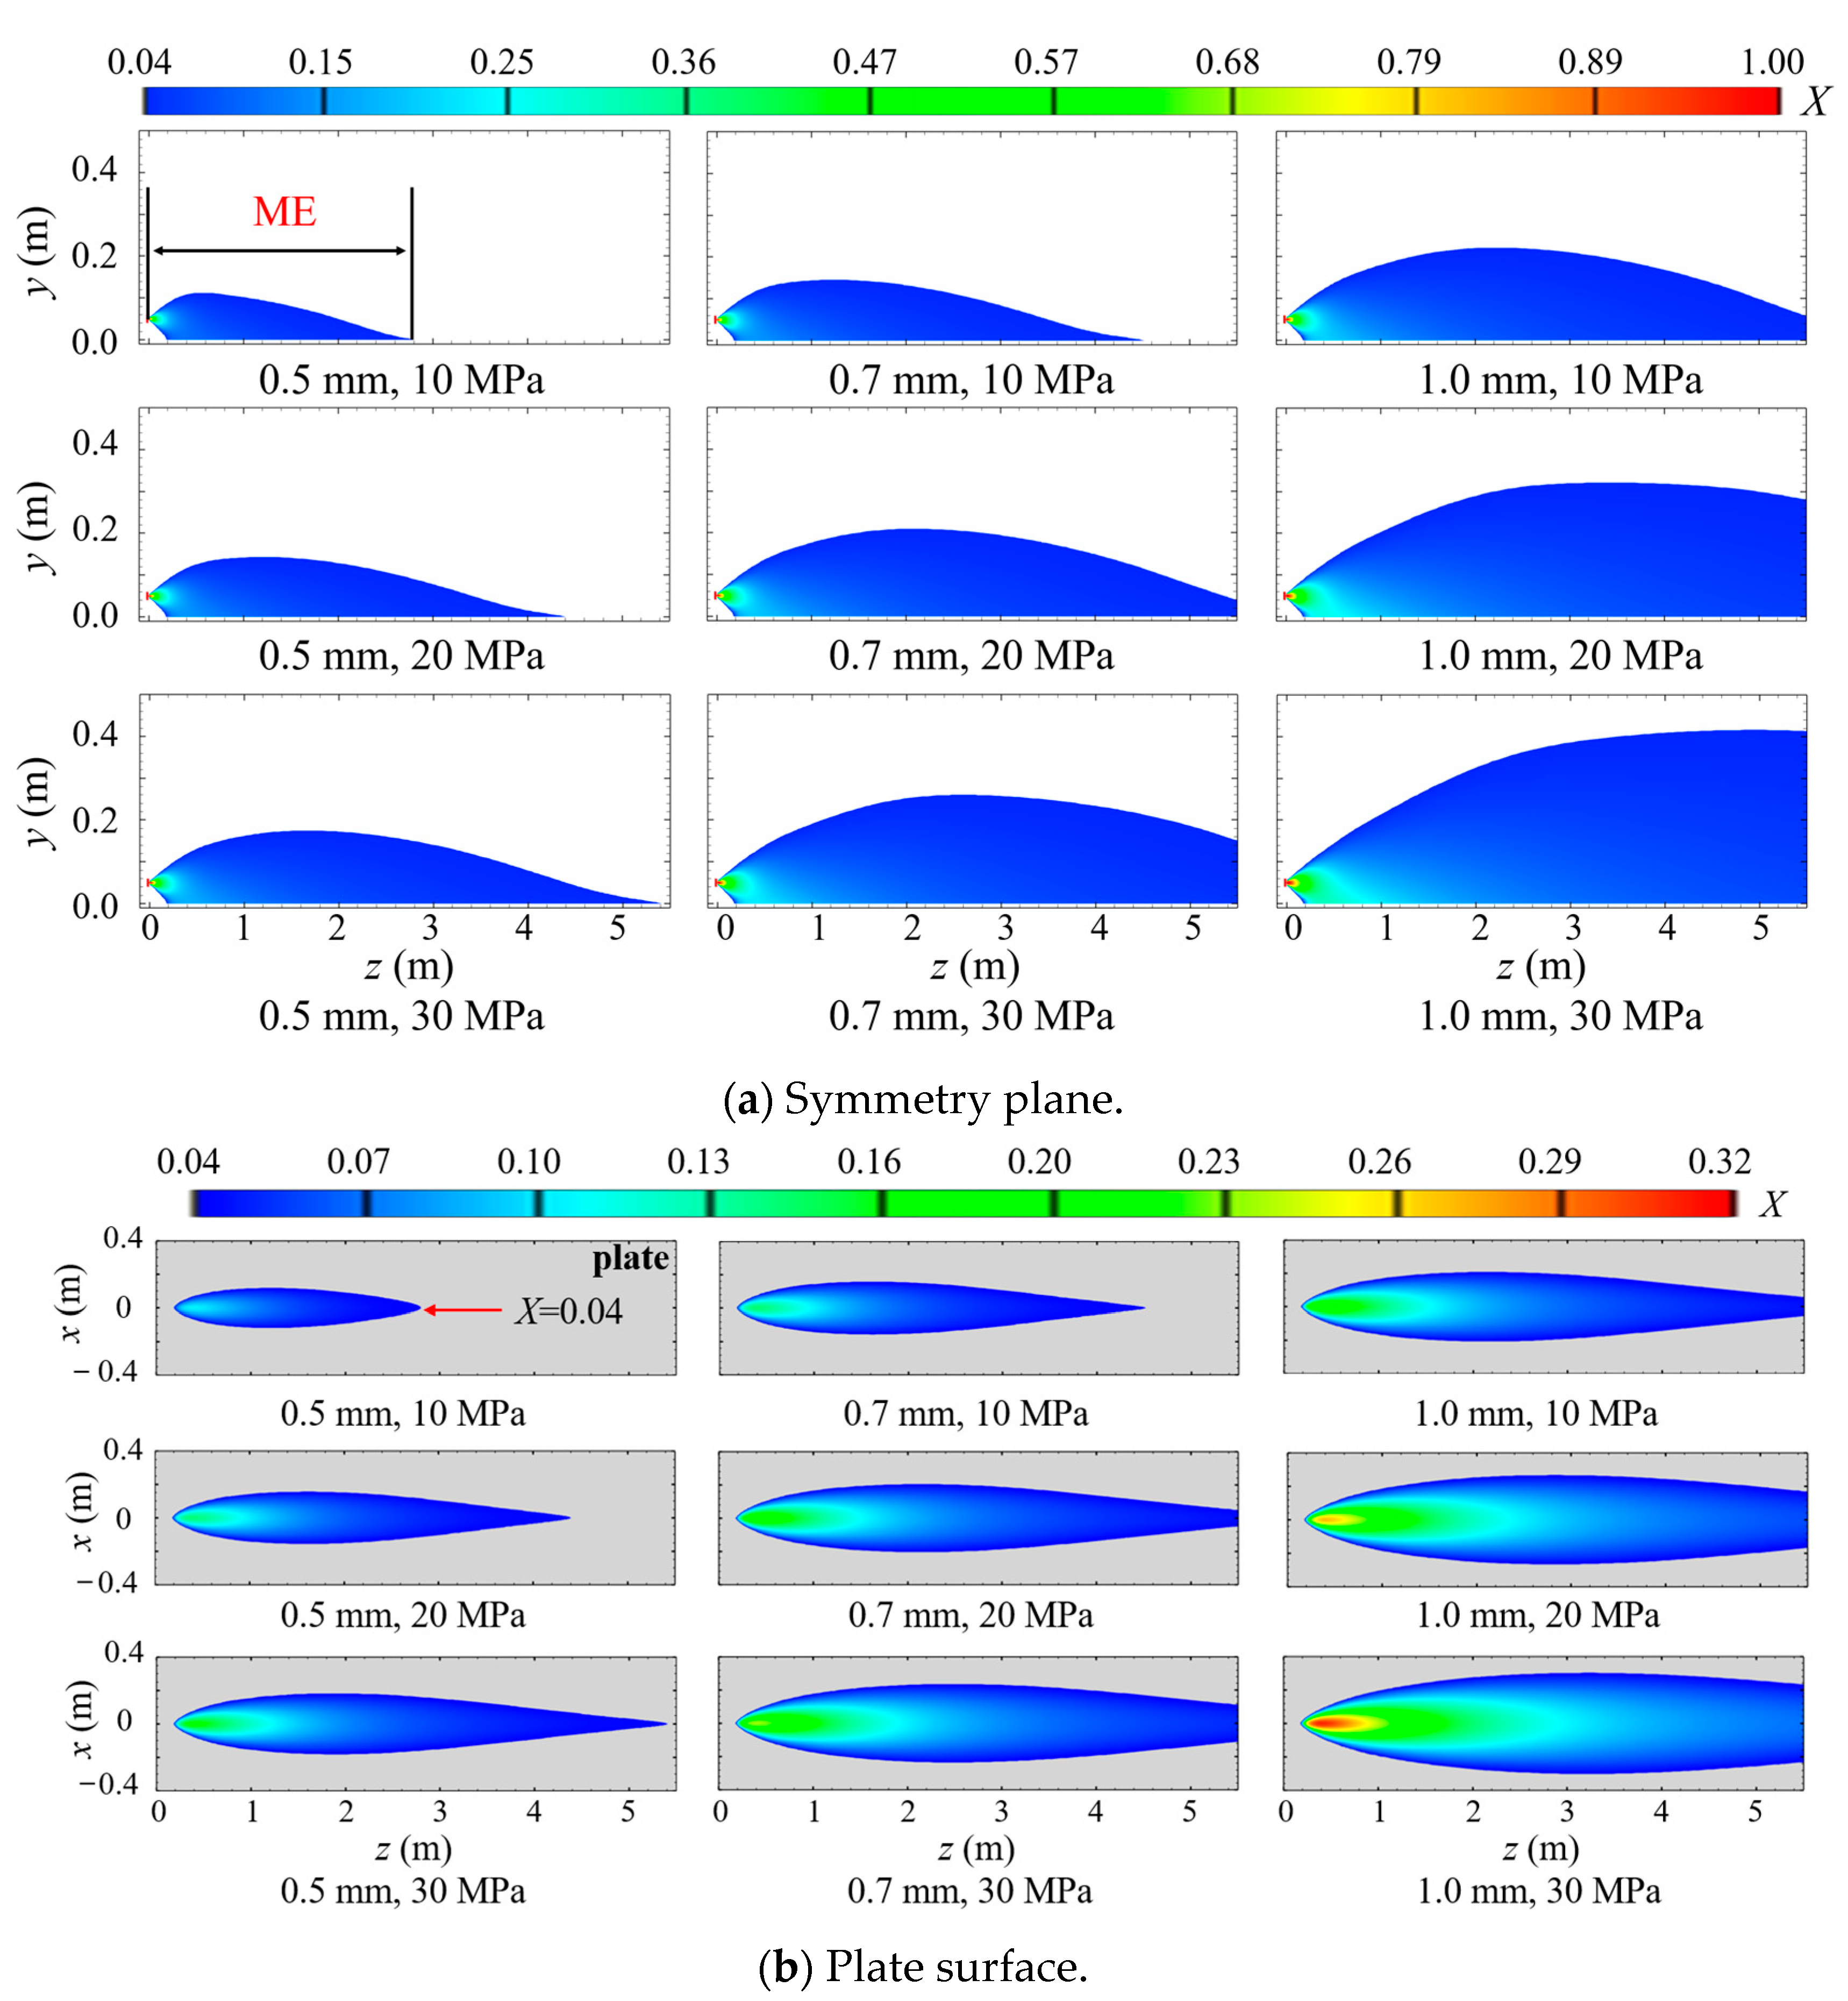
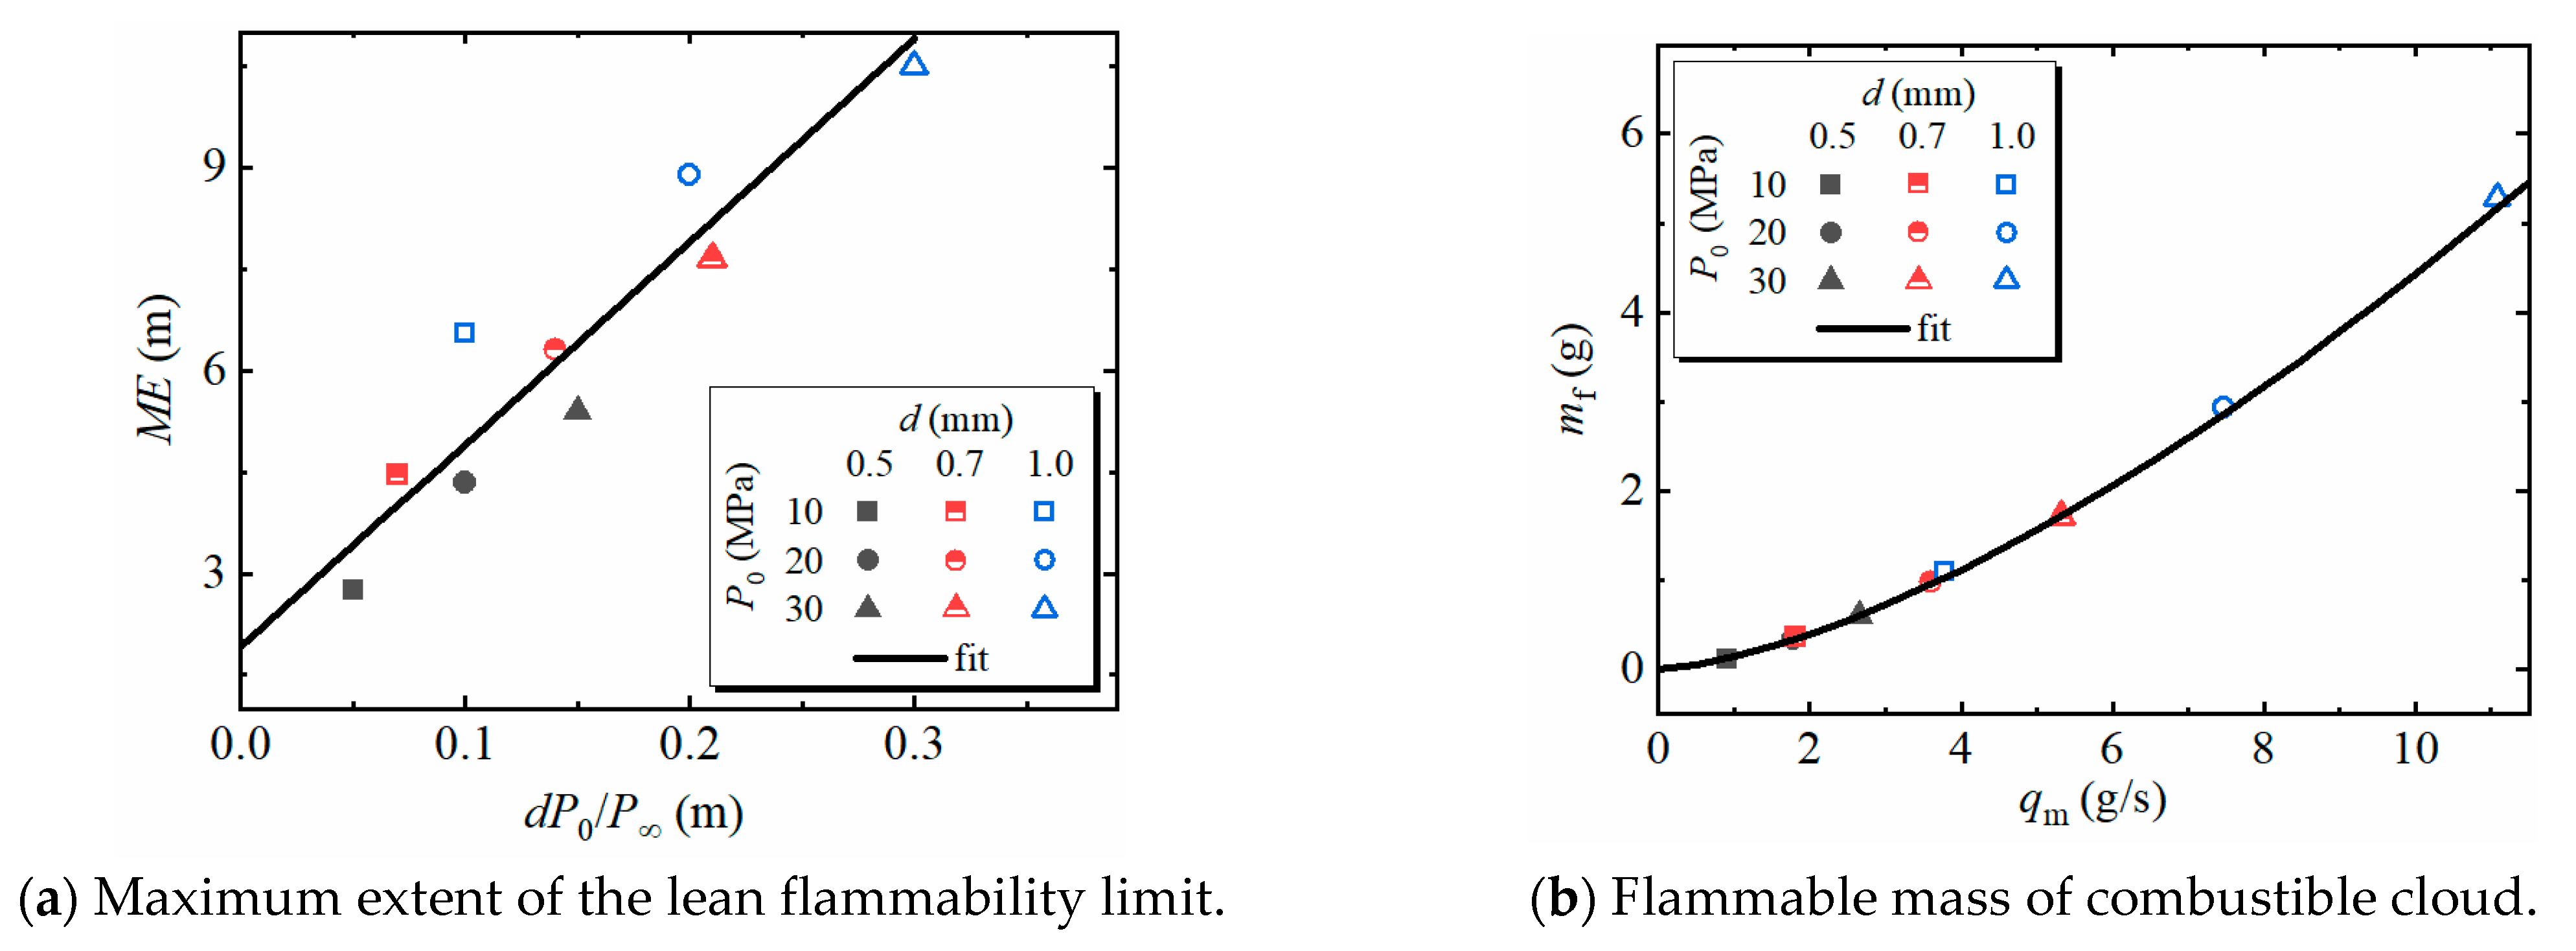
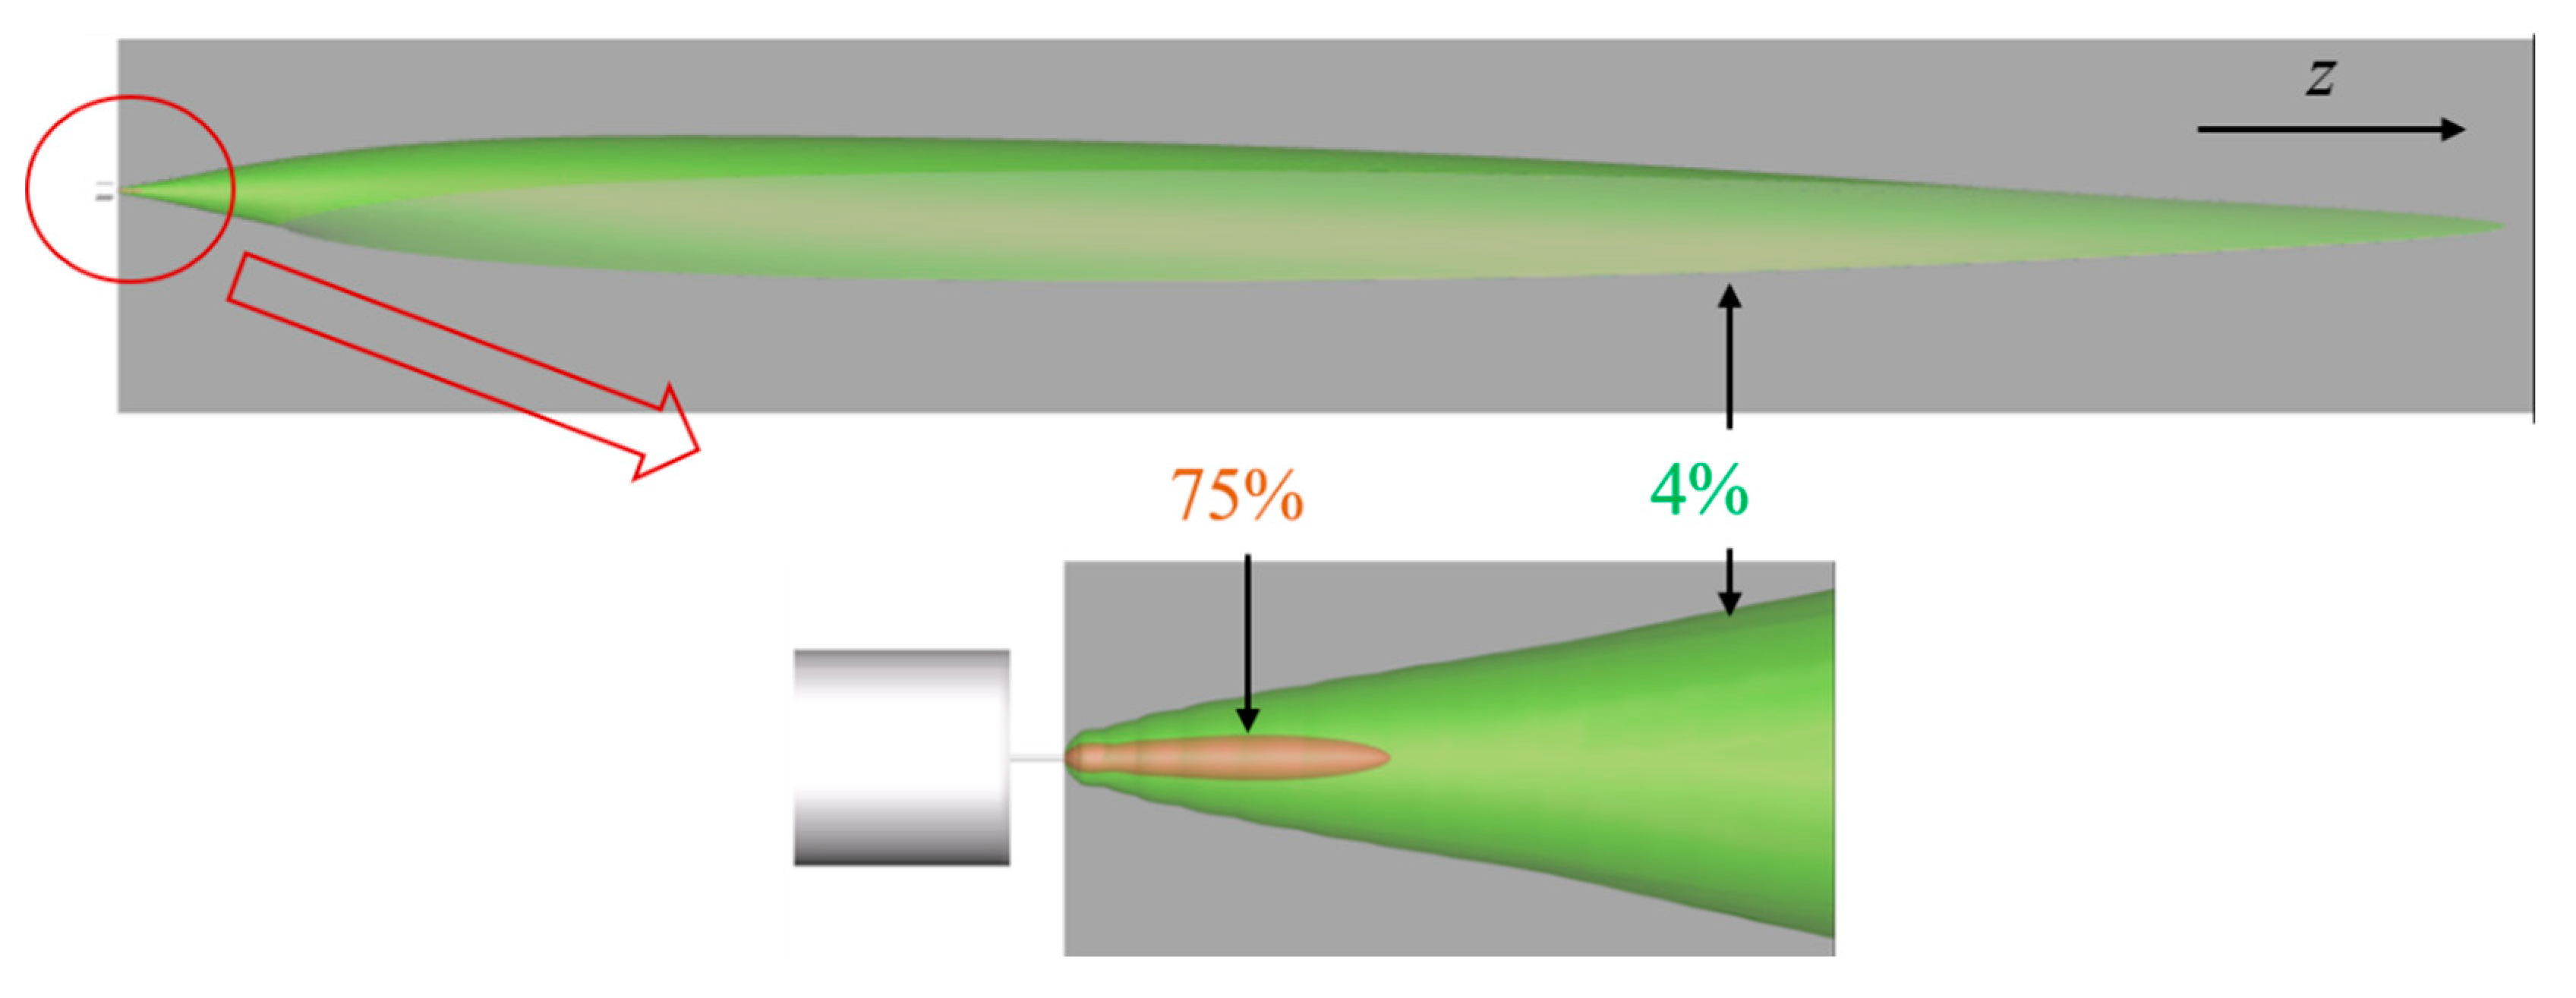
3.1. Combustible Cloud
3.2. Streamwise Concentration Profiles
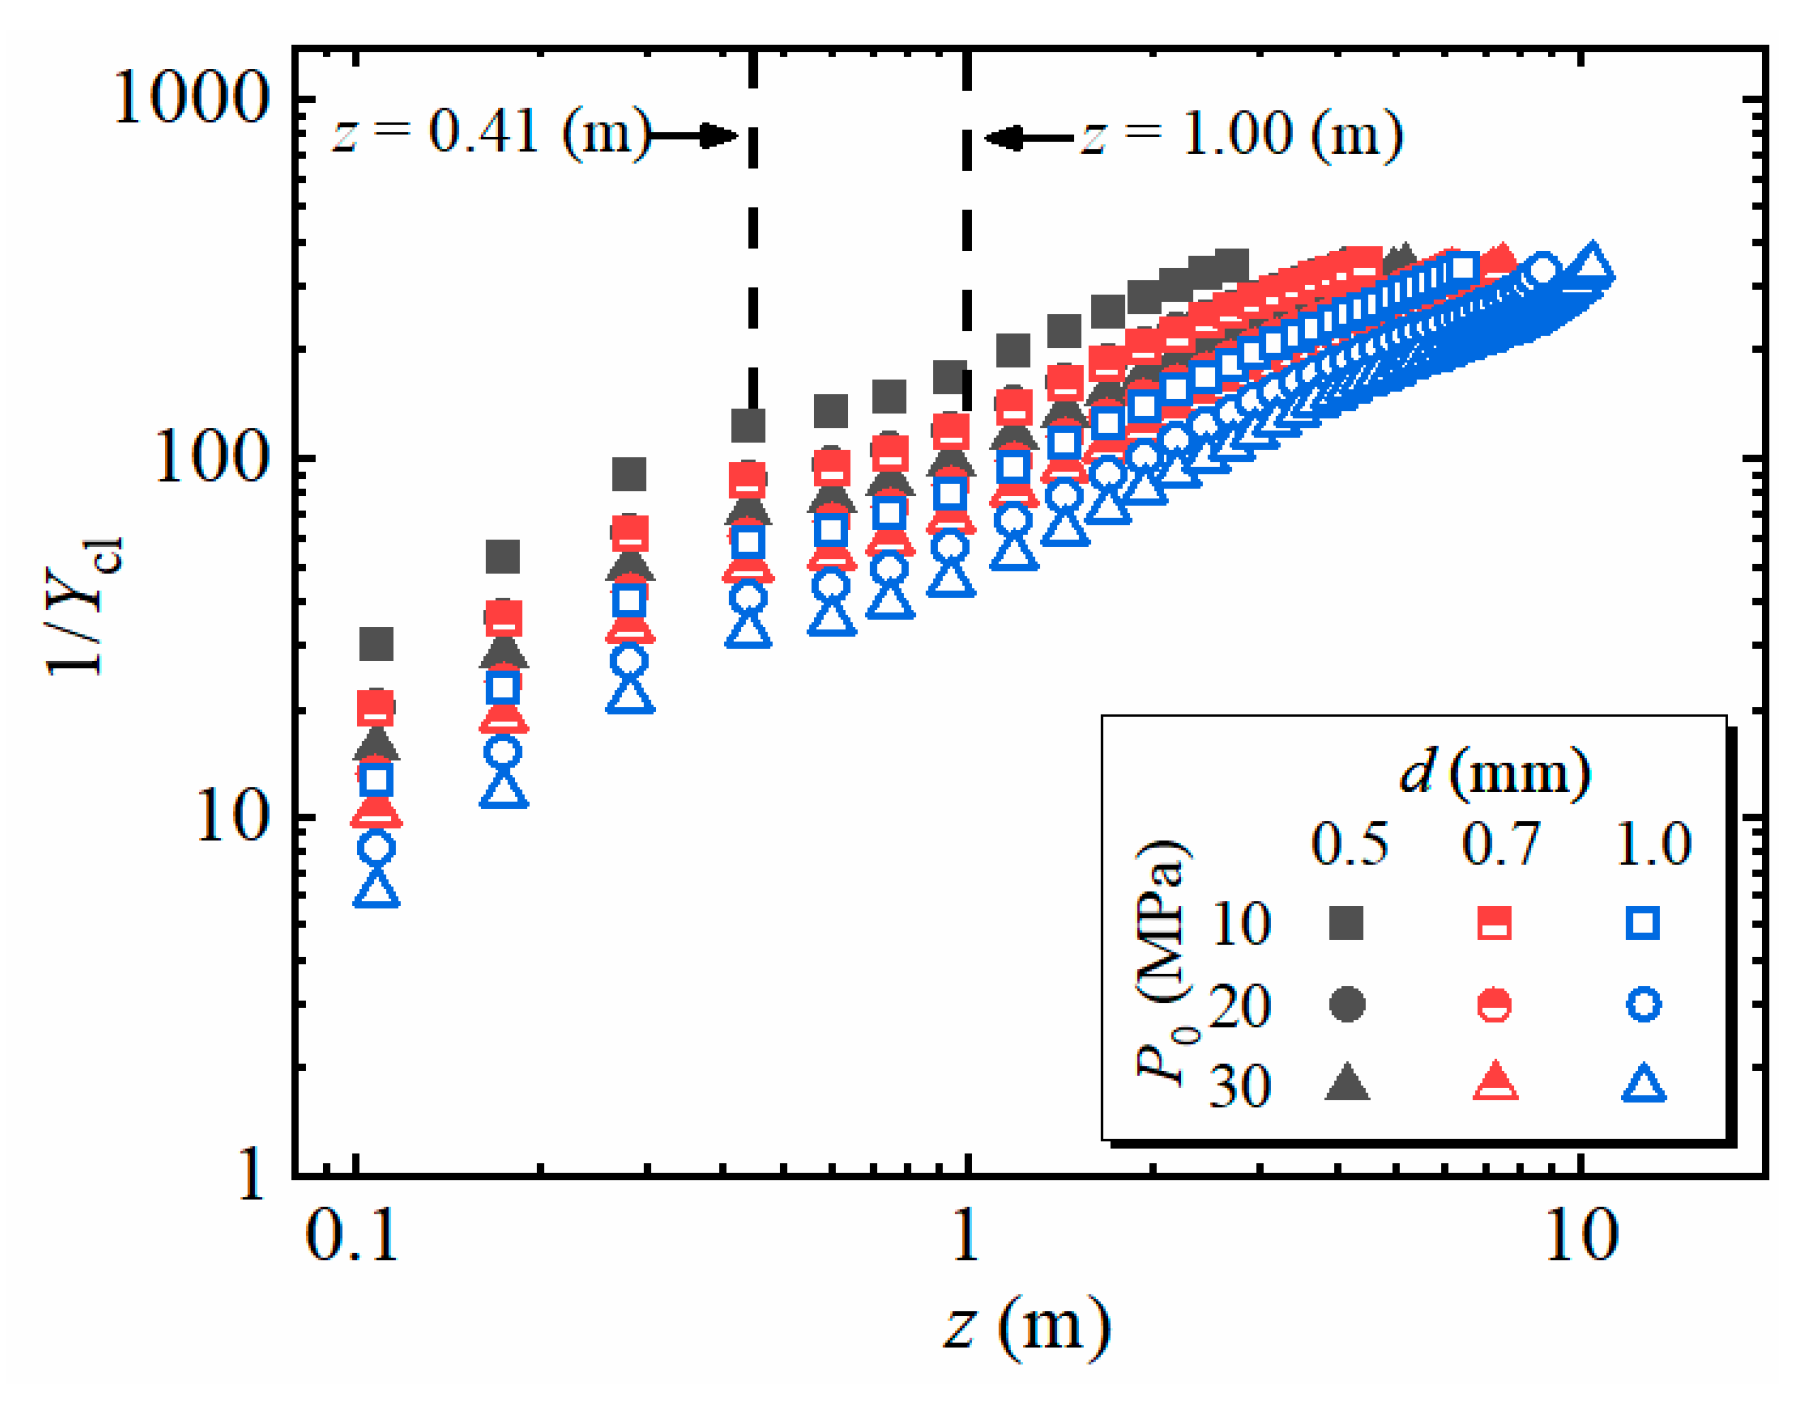
3.2.1. Jet Centerline
3.2.2. Pre-Attachment Zone
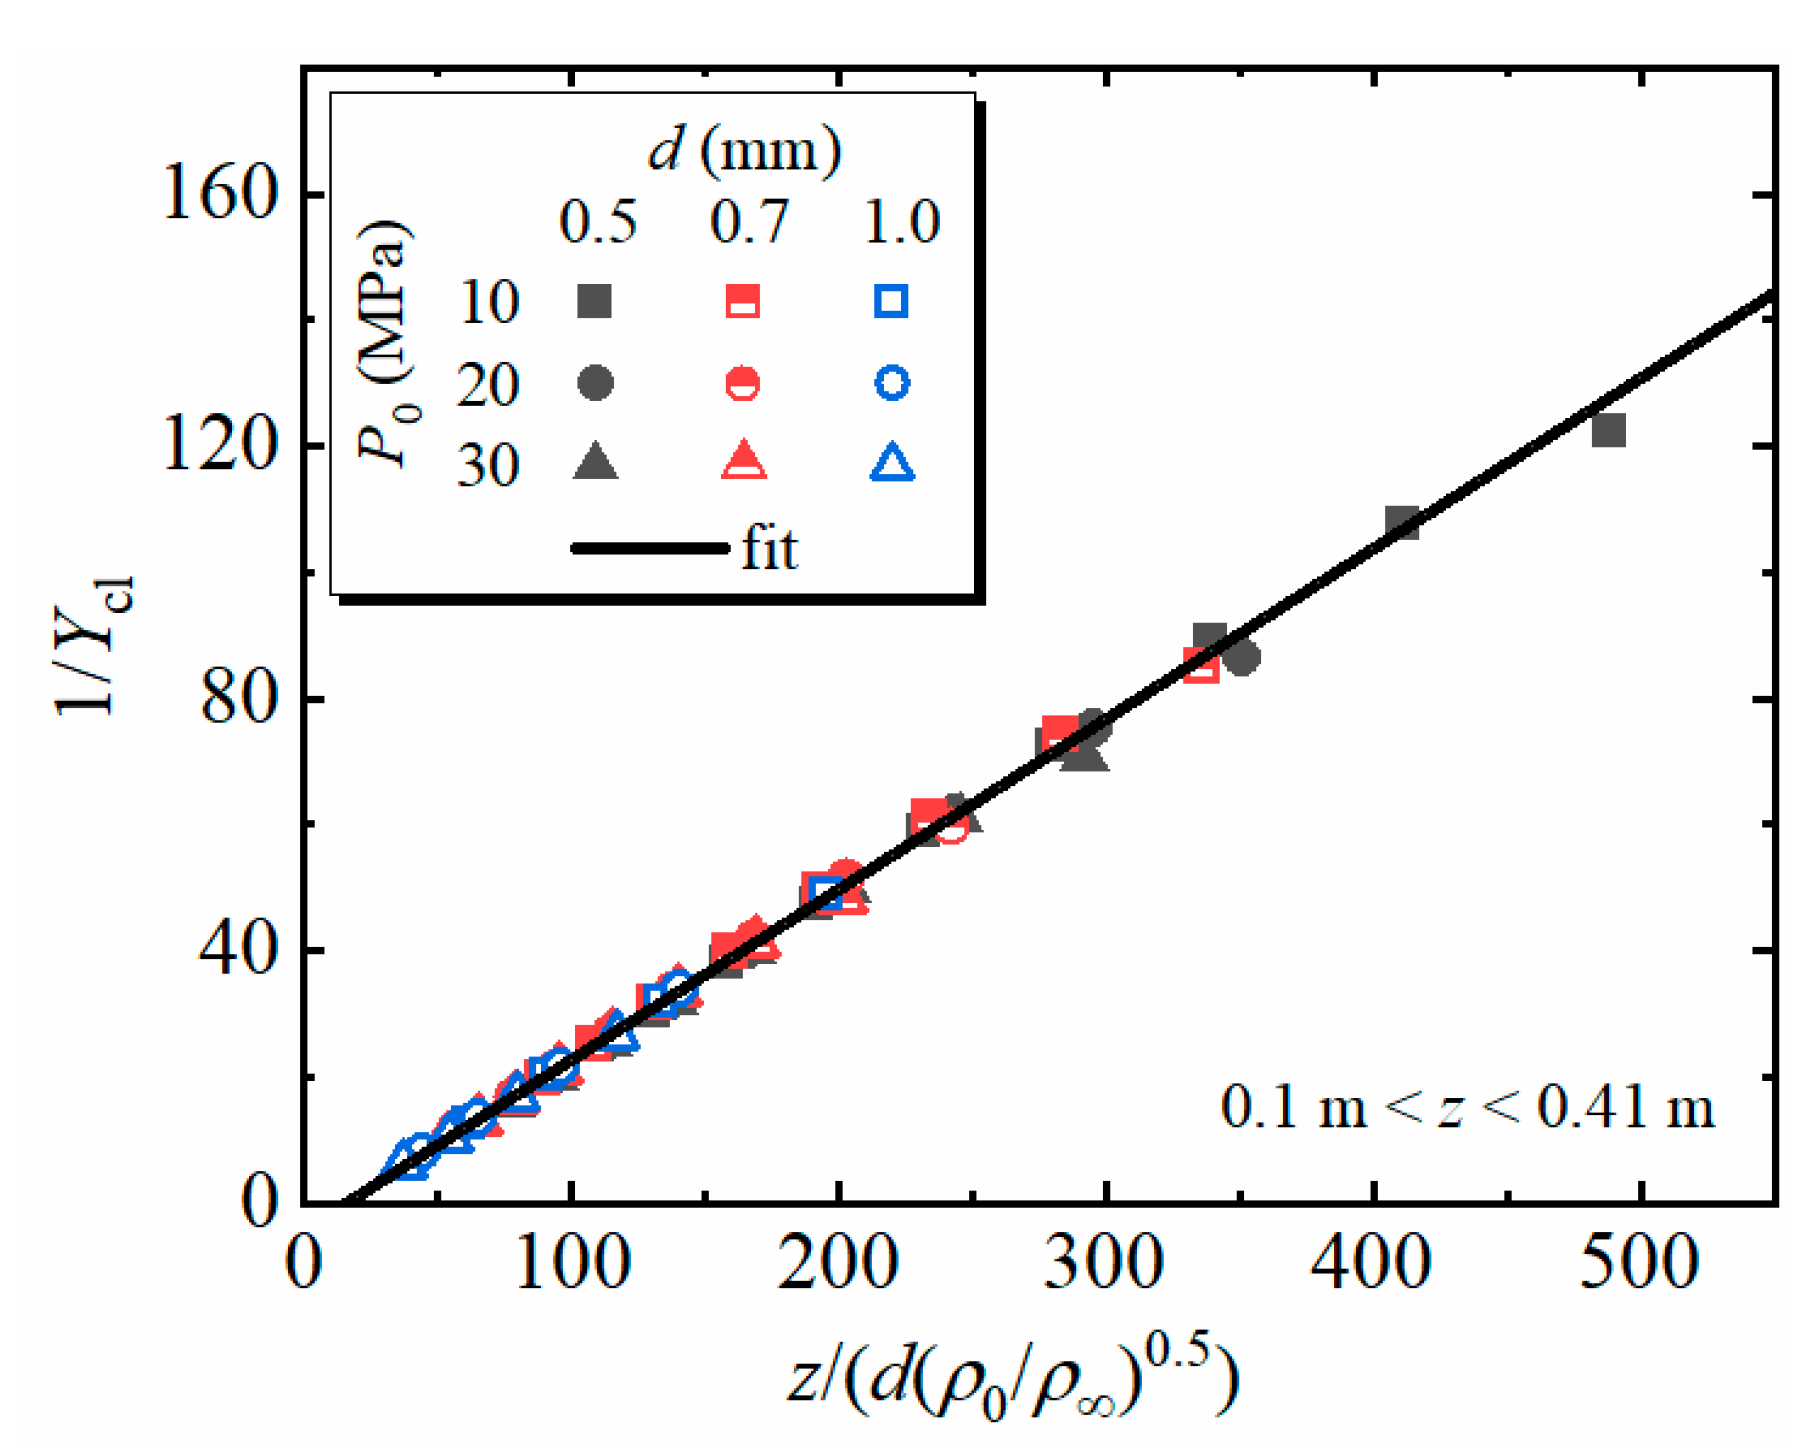
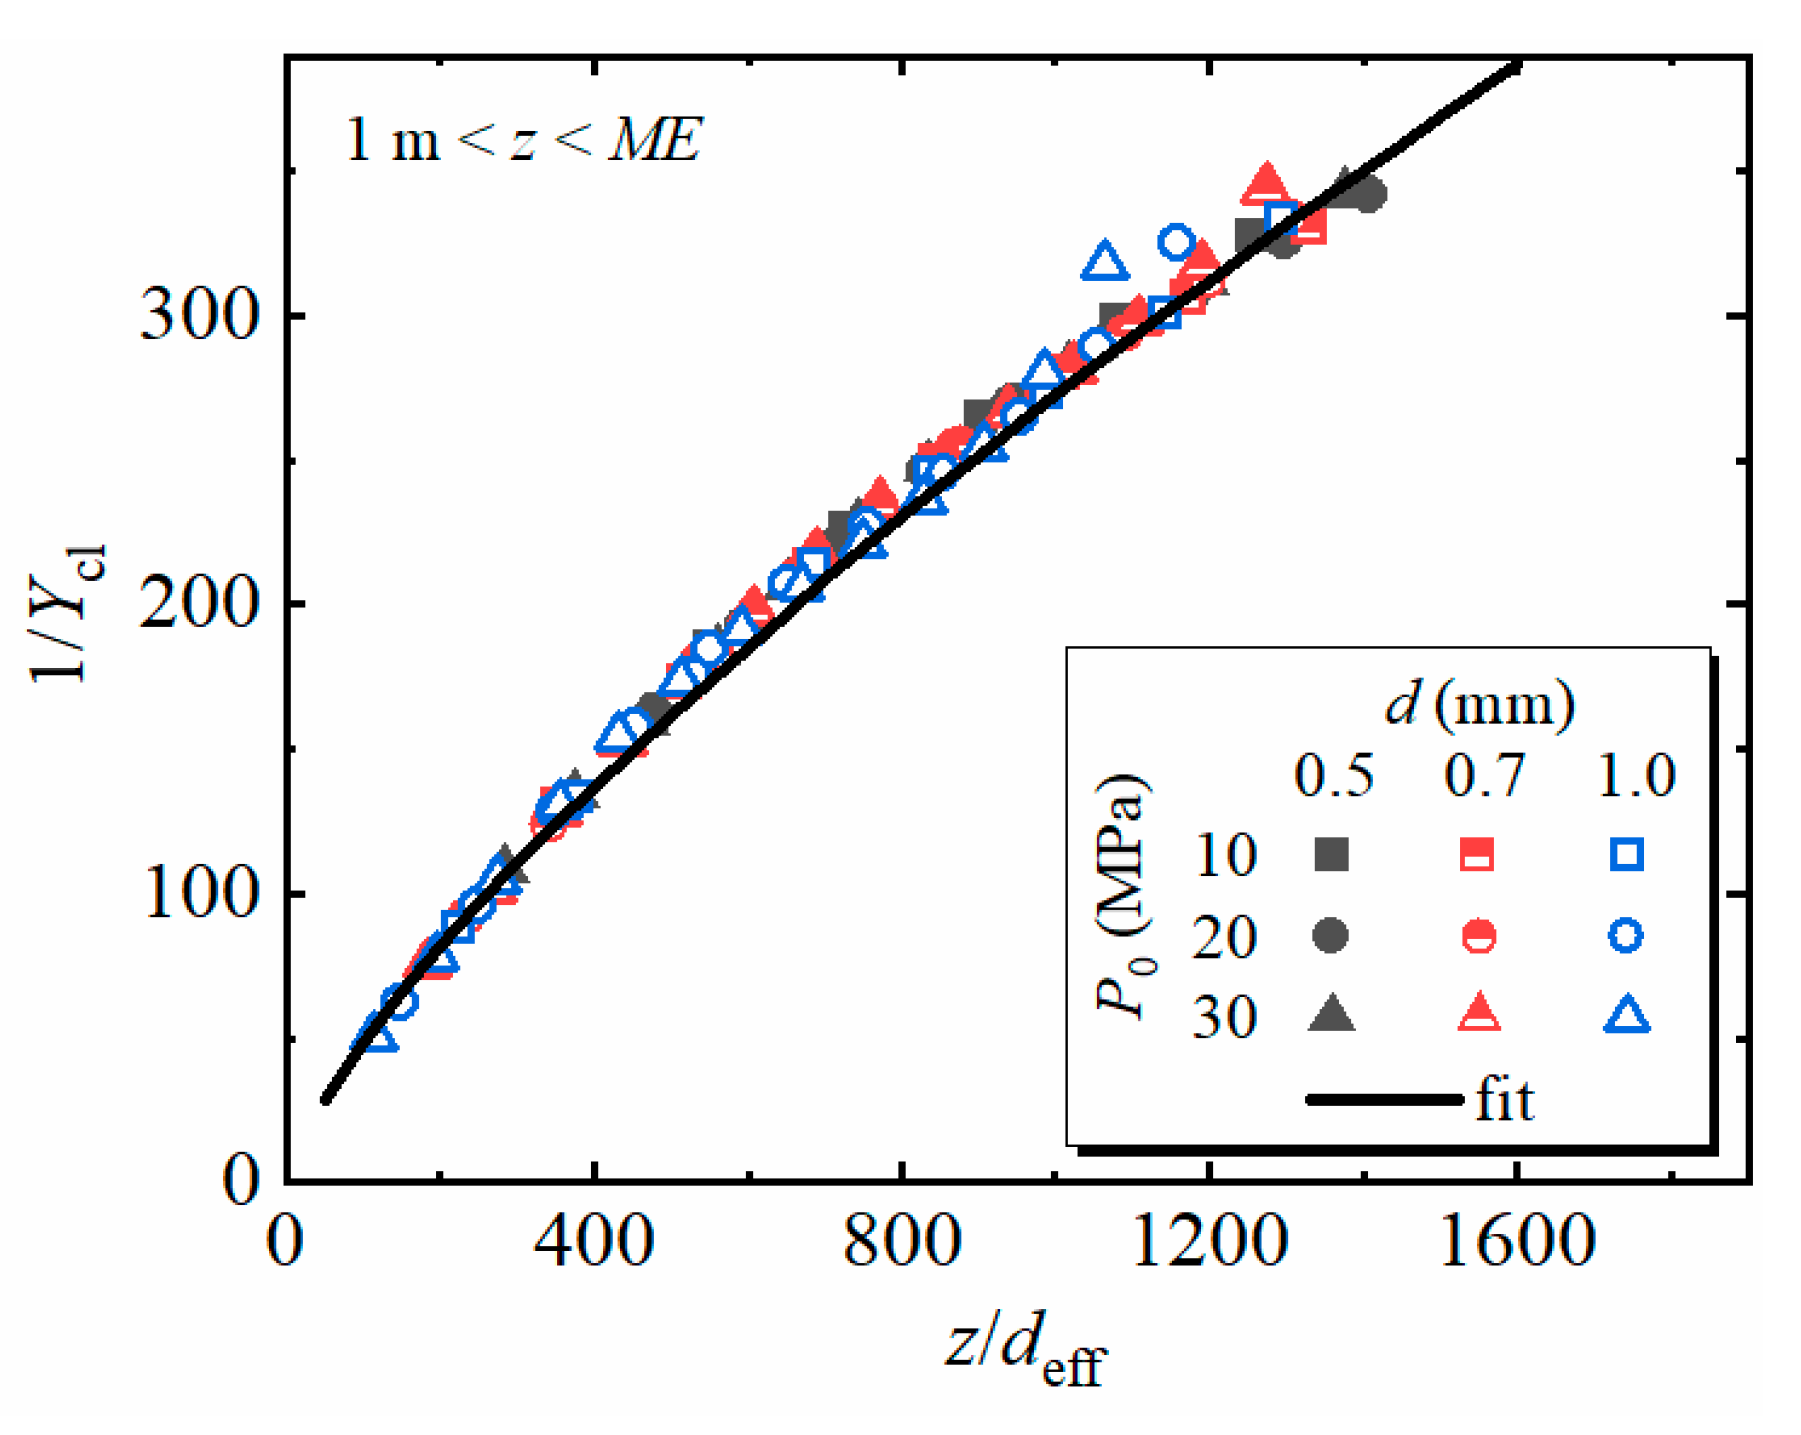
3.2.3. Post-Attachment Zone
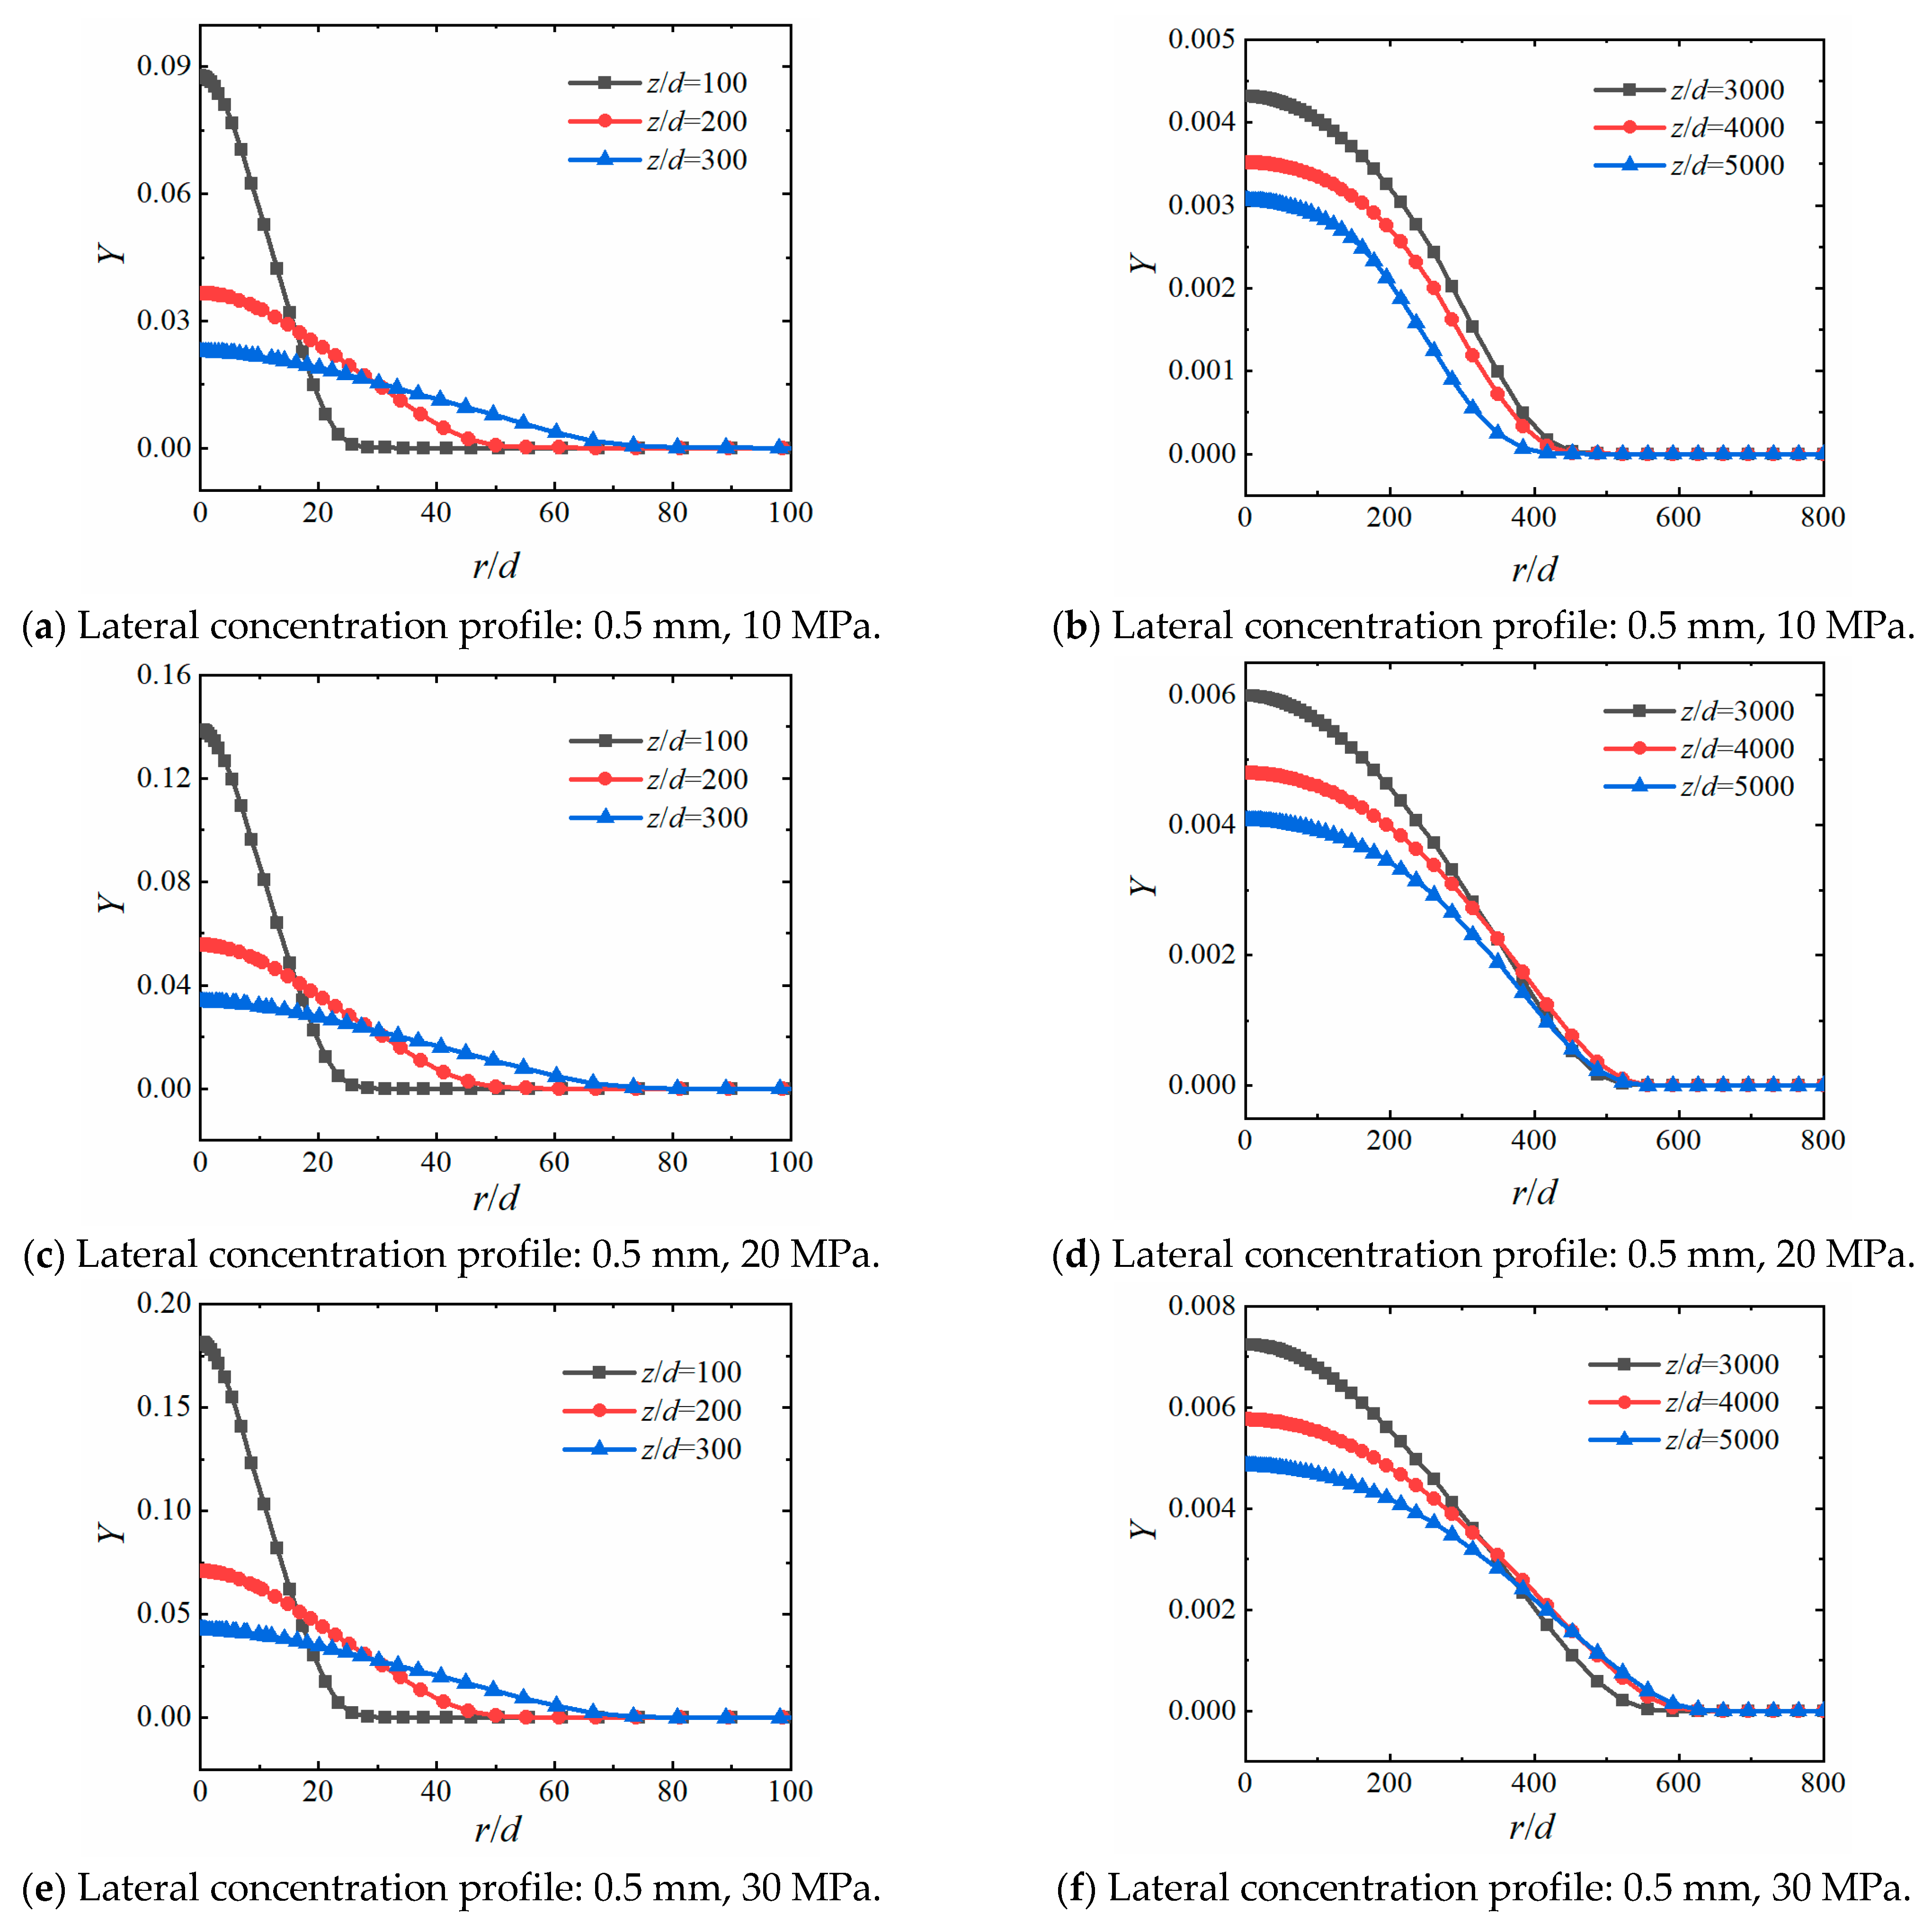
3.3. Lateral Concentration Profiles
4. Conclusions
Author Contributions
Funding
Data Availability Statement
Acknowledgments
Conflicts of Interest
References
- Zhang, J.; Huang, J.; Ba, Q.; Zhou, B.; Christopher, D.M.; Gao, M.; Li, X. Cavity effects on spontaneous ignition of pressurized hydrogen jets. Fuel 2024, 359, 130495. [Google Scholar] [CrossRef]
- Jeddizahed, J.; Webley, P.A.; Hughes, T.J. Energy, exergy and optimization of a binary hydrogen-power production system with net zero emissions. Fuel 2025, 381, 133529. [Google Scholar] [CrossRef]
- Oğur, E.; Koç, A.; Köse, Ö.; Yağlı, H.; Koç, Y. Energy, exergy, exergoeconomic, exergy sustainability and exergoenvironmental analyses (5E) of a turbofan engine: A comparative study of hydrogen and kerosene fuels. Fuel 2025, 381, 133324. [Google Scholar] [CrossRef]
- Field, R.A.; Derwent, R.G. Global warming consequences of replacing natural gas with hydrogen in the domestic energy sectors of future low-carbon economies in the United Kingdom and the United States of America. Int. J. Hydrogen Energy 2021, 46, 30190–30203. [Google Scholar] [CrossRef]
- Shovon, S.M.; Akash, F.A.; Rahman, A.; Rahman, W.; Chakraborty, P.; Monir, M.U.; Sarkar, S.M.; Aziz, A.A.; Chowdhury, S. Advancements in hydrogen generation, storage, and utilizations: A comprehensive review of current trends in Bangladesh. Energy 2024, 292, 130477. [Google Scholar] [CrossRef]
- Zheng, J.; Liu, X.; Xu, P.; Liu, P.; Zhao, Y.; Yang, J. Development of high pressure gaseous hydrogen storage technologies. Int. J. Hydrogen Energy 2012, 37, 1048–1057. [Google Scholar] [CrossRef]
- Jugroot, M.; Groth, C.P.T.; Thomson, B.A.; Baranov, V.; Collings, B.A. Numerical investigation of interface region flows in mass spectrometers: Neutral gas transport. J. Phys. D Appl. Phys. 2004, 37, 1289. [Google Scholar] [CrossRef]
- Ruggles, A.J.; Ekoto, I.W. Ignitability and mixing of underexpanded hydrogen jets. Int. J. Hydrogen Energy 2012, 37, 17549–17560. [Google Scholar] [CrossRef]
- Crist, S.; Glass, D.R.; Sherman, P.M. Study of the highly underexpanded sonic jet. AIAA J. 1966, 4, 68–71. [Google Scholar] [CrossRef]
- Addy, A.L. Effects of axisymmetric sonic nozzle geometry on Mach disk characteristics. AIAA J. 1981, 19, 121–122. [Google Scholar] [CrossRef]
- Houf, W.; Schefer, R. Analytical and experimental investigation of small-scale unintended releases of hydrogen. Int. J. Hydrogen Energy 2008, 33, 1435–1444. [Google Scholar] [CrossRef]
- Takeno, K.; Okabayashi, K.; Kouchi, A.; Misaka, N.; Hashiguchi, K. Concentration fluctuation and ignition characteristics during atmospheric diffusion of hydrogen spouted from high pressure storage. Int. J. Hydrogen Energy 2017, 42, 15426–15434. [Google Scholar] [CrossRef]
- Yao, C.; Ba, Q.; Hecht, E.S.; Christopher, D.M.; Li, X. Concentration fluctuations and flammability of cryo-compressed hydrogen and methane jets. Fuel 2024, 358, 130230. [Google Scholar] [CrossRef]
- Schefer, R.W.; Houf, W.G.; Williams, T.C. Investigation of small-scale unintended releases of hydrogen: Momentum-dominated regime. Int. J. Hydrogen Energy 2008, 33, 6373–6384. [Google Scholar] [CrossRef]
- Asahara, M.; Iwasa, T.; Tsuboi, N.; Hayashi, A.K. Numerical study on unsteady characteristics of high-pressure hydrogen jet ejected from a pinhole. Int. J. Hydrogen Energy 2022, 47, 31709–31728. [Google Scholar] [CrossRef]
- Li, X.; Yao, C.; Egbert, S.C.; He, Q.; Zhao, Z.; Christopher, D.M.; Hecht, E.S. Self-similar characteristics of underexpanded, cryogenic hydrogen and methane jets. Int. J. Hydrogen Energy 2023, 48, 4104–4117. [Google Scholar] [CrossRef]
- Wang, L.; Lyu, X.; Zhang, J.; Liu, F.; Li, X.; Qiu, X.; Song, Q.; Lin, J.; Ma, T. Analysis of hydrogen leakage behavior and risk mitigation measures in a hydrogen refueling station. Int. J. Hydrogen Energy 2024, 83, 545–552. [Google Scholar] [CrossRef]
- Li, Y.; Wang, Z.; Shi, X.; Fan, R. Safety analysis of hydrogen leakage accident with a mobile hydrogen refueling station. Process Saf. Environ. Prot. 2023, 171, 619–629. [Google Scholar] [CrossRef]
- Zhou, C.; Yang, Z.; Chen, G.; Li, X. Optimizing hydrogen refueling station layout based on consequences of leakage and explosion accidents. Int. J. Hydrogen Energy 2024, 54, 817–836. [Google Scholar] [CrossRef]
- Bi, Y.; Wu, Q.; Wang, S.; Shi, J.; Cong, H.; Ye, L.; Gao, W.; Bi, M. Hydrogen leakage location prediction at hydrogen refueling stations based on deep learning. Energy 2023, 284, 129361. [Google Scholar] [CrossRef]
- Li, J.; Liu, J.; Wang, T.; Zou, W.; Yang, Q.; Shen, J. Analysis of the evolution characteristics of hydrogen leakage and diffusion in a temperature stratified environment. Energy 2024, 293, 130598. [Google Scholar] [CrossRef]
- Shen, Y.; Lv, H.; Zheng, T.; Liu, Y.; Zhou, W.; Zhang, C. Temporal and spatial evolution of hydrogen leakage and diffusion from tube fittings on fuel cell vehicles under the effect of ambient wind. Renew. Sustain. Energy Rev. 2023, 185, 113596. [Google Scholar] [CrossRef]
- Liu, S.; He, R. Decision-level fusion detection method of hydrogen leakage in hydrogen supply system of fuel cell truck. Fuel 2024, 367, 131455. [Google Scholar] [CrossRef]
- Mao, X.; Ying, R.; Yuan, Y.; Li, F.; Shen, B. Simulation and analysis of hydrogen leakage and explosion behaviors in various compartments on a hydrogen fuel cell ship. Int. J. Hydrogen Energy 2021, 46, 6857–6872. [Google Scholar] [CrossRef]
- Kim, B.; Hwang, K.I. Experimental analysis of the effects of ship motion on hydrogen dispersion in an enclosed area. Int. J. Hydrogen Energy 2023, 48, 31779–31789. [Google Scholar] [CrossRef]
- Xin, J.; Duan, Q.; Jin, K.; Sun, J. A reduced-scale experimental study of dispersion characteristics of hydrogen leakage in an underground parking garage. Int. J. Hydrogen Energy 2023, 48, 16936–16948. [Google Scholar] [CrossRef]
- Hajji, Y.; Jouini, B.; Bouteraa, M.; Elcafsi, A.; Belghith, A.; Bournot, P. Numerical study of hydrogen release accidents in a residential garage. Int. J. Hydrogen Energy 2015, 40, 9747–9759. [Google Scholar] [CrossRef]
- Huang, T.; Zhao, M.; Ba, Q.; Christopher, D.M.; Li, X. Modeling of hydrogen dispersion from hydrogen fuel cell vehicles in an underground parking garage. Int. J. Hydrogen Energy 2022, 47, 686–696. [Google Scholar] [CrossRef]
- Sposato, C.; Tamanini, F.; Rogers, W.J.; Mannan, M.S. Effects of plate impingement on the flammable volume of fuel jet releases. Process Saf. Prog. 2003, 22, 201–211. [Google Scholar] [CrossRef]
- Tchouvelev, A.V.; Cheng, Z.; Agranat, V.M.; Zhubrin, S.V. Effectiveness of small barriers as means to reduce clearance distances. Int. J. Hydrogen Energy 2007, 32, 1409–1415. [Google Scholar] [CrossRef]
- Hu, J.; Christopher, D.M.; Li, X. Simplified partitioning model to simulate high pressure under-expanded jet flows impinging vertical obstacles. Int. J. Hydrogen Energy 2018, 43, 13649–13658. [Google Scholar] [CrossRef]
- Su, X.; Wang, H.; Chen, B.; Ren, Y.; Zhu, Z.; Zhang, Y.; Lin, R. Migration characteristics of nodules at the critical position of a Coandă effect harvesting model. Ocean Eng. 2024, 295, 116861. [Google Scholar] [CrossRef]
- Hourri, A.; Angers, B.; Bénard, P. Surface effects on flammable extent of hydrogen and methane jets. Int. J. Hydrogen Energy 2009, 34, 1569–1577. [Google Scholar] [CrossRef]
- Hourri, A.; Angers, B.; Bénard, P.; Tchouvelev, A.; Agranat, V. Numerical investigation of the flammable extent of semi-confined hydrogen and methane jets. Int. J. Hydrogen Energy 2011, 36, 2567–2572. [Google Scholar] [CrossRef]
- Hall, J.E.; Hooker, P.; O’sullivan, L.; Angers, B.; Hourri, A.; Bénard, P. Flammability profiles associated with high-pressure hydrogen jets released in close proximity to surfaces. Int. J. Hydrogen Energy 2017, 42, 7413–7421. [Google Scholar] [CrossRef]
- Bénard, P.; Hourri, A.; Angers, B.; Tchouvelev, A. Adjacent surface effect on the flammable cloud of hydrogen and methane jets: Numerical investigation and engineering correlations. Int. J. Hydrogen Energy 2016, 41, 18654–18662. [Google Scholar] [CrossRef]
- Xie, Q.; Lu, Q.; Yuan, Y.; Zhang, J.; Zhou, F. Numerical study on the horizontal stretching effect of ground on high-pressure vapor jets of LNG tank leakage. J. Loss Prev. Process Ind. 2021, 72, 104526. [Google Scholar] [CrossRef]
- Colombini, C.; Martani, A.; Rota, R.; Busini, V. Ground influence on high-pressure methane jets: Practical tools for risk assessment. J. Loss Prev. Process Ind. 2020, 67, 104240. [Google Scholar] [CrossRef]
- Gao, Q.; Qu, X.; Peng, W.; Zhang, P.; Chen, S. Influence of obstacle morphology on safety of nuclear hydrogen production system. Int. J. Hydrogen Energy 2022, 47, 36733–36748. [Google Scholar] [CrossRef]
- Chen, F.; Zhang, Y.; Jin, Z. Co-design and aerodynamic study on a two-step high pressure reducing system for hydrogen decompression: From hydrogen refueling station to hydrogen fuel cell vehicle. Int. J. Hydrogen Energy 2023, 48, 10968–10981. [Google Scholar] [CrossRef]
- Swain, M.R.; Grilliot, E.S.; Swain, M.N. Experimental verification of a hydrogen risk assessment method. J. Chem. Health Saf. 1999, 6, 28–32. [Google Scholar] [CrossRef]
- Nasr, A.; Lai, J.C.S. A turbulent plane offset jet with small offset ratio. Exp. Fluids 1998, 24, 47–57. [Google Scholar] [CrossRef]
- Hecht, E.S.; Panda, P.P. Mixing and warming of cryogenic hydrogen releases. Int. J. Hydrogen Energy 2019, 44, 8960–8970. [Google Scholar] [CrossRef]
- Schefer, R.W.; Houf, W.G.; Williams, T.C. Investigation of small-scale unintended releases of hydrogen: Buoyancy effects. Int. J. Hydrogen Energy 2008, 33, 4702–4712. [Google Scholar] [CrossRef]
- Nadarajah, S. A generalized normal distribution. J. Appl. Stat. 2005, 32, 685–694. [Google Scholar] [CrossRef]
- Achim, A.; Loza, A.; Bull, D.; Canagarajah, N. Statistical modelling for wavelet-domain image fusion. In Image Fusion; Stathaki, T., Ed.; Academic Press: Oxford, UK, 2008; pp. 119–138. [Google Scholar] [CrossRef]


Disclaimer/Publisher’s Note: The statements, opinions and data contained in all publications are solely those of the individual author(s) and contributor(s) and not of MDPI and/or the editor(s). MDPI and/or the editor(s) disclaim responsibility for any injury to people or property resulting from any ideas, methods, instructions or products referred to in the content. |
© 2025 by the authors. Licensee MDPI, Basel, Switzerland. This article is an open access article distributed under the terms and conditions of the Creative Commons Attribution (CC BY) license (https://creativecommons.org/licenses/by/4.0/).
Share and Cite
He, Z.; Ba, Q.; Zhang, J.; Yao, C.; Wang, Y.; Li, X. Characteristics of High-Pressure Hydrogen Jet Dispersion Along a Horizontal Plate. Energies 2025, 18, 2242. https://doi.org/10.3390/en18092242
He Z, Ba Q, Zhang J, Yao C, Wang Y, Li X. Characteristics of High-Pressure Hydrogen Jet Dispersion Along a Horizontal Plate. Energies. 2025; 18(9):2242. https://doi.org/10.3390/en18092242
Chicago/Turabian StyleHe, Zhonglong, Qingxin Ba, Jiaxin Zhang, Chenyi Yao, Yujie Wang, and Xuefang Li. 2025. "Characteristics of High-Pressure Hydrogen Jet Dispersion Along a Horizontal Plate" Energies 18, no. 9: 2242. https://doi.org/10.3390/en18092242
APA StyleHe, Z., Ba, Q., Zhang, J., Yao, C., Wang, Y., & Li, X. (2025). Characteristics of High-Pressure Hydrogen Jet Dispersion Along a Horizontal Plate. Energies, 18(9), 2242. https://doi.org/10.3390/en18092242