1. Introduction
Traditional photovoltaic panel-powered forced air systems exhibit significant deficiencies in building energy efficiency and thermal comfort. Firstly, the temperature sensitivity of photovoltaic components leads to power generation efficiency degradation. Studies show that the temperature coefficients of different photovoltaic materials range from −0.21%/°C to −0.72%/°C, with each 1 °C temperature increase causing 0.4–0.5% output power loss [
1]. Although forced air cooling can reduce photovoltaic panel temperatures, it requires reliance on mechanical ventilation systems whose additional energy consumption may partially offset power generation benefits, forming a “cooling energy consumption paradox” (referring to the conflict where energy consumed by mechanical cooling partially offsets the efficiency gains from photovoltaic power generation) [
1]. Secondly, traditional systems present dual contradictions in building thermal environment regulation: enhancing ventilation to maintain photovoltaic efficiency may exacerbate indoor temperature fluctuations, causing thermal comfort index values to deviate from ideal ranges; while reducing ventilation intensity can improve comfort but intensifies photovoltaic panel temperature rise, thereby further reducing power generation efficiency [
1,
2]. Additionally, the spatial layout of traditional photovoltaic-powered forced air systems faces significant constraints. Building facade shading effects may cause 20–30% irradiance loss for lower-layer photovoltaic panels, and the installation of mechanical ventilation ducts often conflicts with functional building spaces [
1]. These contradictions highlight the fundamental conflict between energy efficiency improvement and comfort maintenance inherent in traditional technical approaches.
RCC systems have emerged as a promising alternative to convection-dominated air conditioning by leveraging radiative heat transfer, offering dual advantages of energy efficiency and thermal uniformity. Compared to traditional systems, RCC reduces mechanical ventilation energy consumption and mitigates temperature fluctuations through direct radiative cooling. Key parameters influencing RCC performance include ceiling surface temperature, pipe embedding depth, spacing, and water supply temperature, with optimal cooling achieved at 16–20 °C [
3]. The evolution of RCC technology has transitioned from theoretical models to practical applications. For instance, Cao et al. (2008) established a dynamic heat transfer model to quantify the relationship between pipe parameters and thermal response time, laying the groundwork for standardized designs [
3]. Recent advancements, such as open curved-surface structures (2023), further enhanced heat transfer coefficients by 15–20% through adjustments in curvature radius and gap distance [
4].
PCMs address the mismatch between building thermal inertia and energy demand through high latent heat storage density (100–180 J/g) and tunable phase transition temperatures (25–30 °C) [
5]. Initially limited by low thermal conductivity (<0.5 W/m·K) and leakage risks, organic PCMs like paraffin have evolved into advanced composites. Post-2010 developments in microencapsulation (e.g., PMMA/capric acid-stearic acid) and porous matrix composites (e.g., expanded perlite-PCM) reduced leakage rates to <3% and improved thermal conductivity to 1.2–2.5 W/m·K via carbon nanotube doping [
3,
6]. Recent innovations, such as fractal cavity structures, further boosted energy storage efficiency by 30% [
7]. While PCM integration with radiant floors has demonstrated energy-saving rates of 25–30% [
8], ceiling-based applications remain experimental, with challenges including phase change hysteresis and compatibility with wet construction methods [
7,
9].
Currently, the synergistic application of RCC and PCM is still in the experimental stage, primarily focusing on radiant floor heating systems. For instance, Ye Hong et al. [
8] validated the thermal stability of PCM energy storage floors at a phase change temperature of 32 °C, achieving an energy-saving rate of 25–30%. However, there is limited research on integrated ceiling cooling, with only a few cases exploring PCM embedded in radiant panels to enhance thermal inertia. In 2023, Mohamed et al. compared the coupling effects of radiant ceilings and displacement ventilation, finding that PCM could reduce peak cooling loads by 12%, but issues such as phase change hysteresis and mismatched surface temperature control remain [
9]. Additionally, the compatibility of PCM with water pipe systems in wet construction methods still requires validation [
3].
At present, the technical bottlenecks in combining RCC and PCM are concentrated in three aspects:
Material Level: PCMs exhibit insufficient long-term cycling stability, with latent heat decay (i.e., gradual reduction in energy storage capacity due to repeated phase transitions) reaching 15–20% after 200 phase change cycles. Additionally, the flammability of organic PCMs increases fire risks [
4,
6].
System Integration: The difference in thermal response times between RCC and PCM leads to temperature control delays. For instance, PCM melting requires 30 to 60 min, while radiant panels typically respond within 10 min, necessitating dynamic control strategies for optimization [
3].
Cost and Standardization: The production cost of microencapsulated PCMs is 40–60% higher than that of traditional materials, and there is a lack of unified performance testing standards [
3].
Future research needs to focus on multi-scale simulations, intelligent encapsulation technologies, and life cycle assessments to advance the practical application of this technology.
This article aims to explore PCM and RCC by (1) analyzing PCM mechanisms and ceiling heat transfer theory; (2) optimizing composite PCMs through additive-enhanced modifications and cost-effective experiments; and (3) simulating ceiling cooling performance via SolidWorks 2024 SP4 and Fluent 2022 R1. The study integrates material design, experimentation, and numerical modeling for efficient thermal management.
2. Materials and Methods
2.1. Theoretical Calculation of Enthalpy and Phase Transition Temperature of PCMs
PCM refers to a physical material that absorbs or releases a significant amount of heat during its phase change (e.g., transitioning from solid to liquid or vice versa), thereby achieving cooling or heating purposes. To balance the performance and cost requirements of phase change materials, this study selects a glycerol–water–alcohol ternary system as the composite phase change material. This system is chosen based on the following advantages:
To verify its thermal properties, differential scanning calorimetry (DSC) was employed to test samples with different ratios. According to the GB/T 19466.2—2024 standard [
12], the samples were scanned at a heating rate of 10 °C/min within the range of −50 to 50 °C to determine the phase transition temperatures (
Tonset,
Tpeak) and the enthalpy of phase transition (Δ
H). Prior to the experiment, the instrument was calibrated using high-purity indium (melting enthalpy of 28.4 J/g), and data reliability was ensured through baseline correction and integration range optimization [
13]. By analyzing the DSC curves, the optimized ratio with high enthalpy of phase transition and phase transition temperatures matching the target operating conditions was selected, providing data support for the subsequent system construction [
14].
2.1.1. The Calculation of the Enthalpy of Phase Transition
The core calculation formula for the enthalpy of phase transition (Δ
H) is:
In the formula,
A represents the corrected peak area (obtained by integrating the heat flow-time curve), m is the sample mass, and
K is the instrument calibration factor. The calibration factor is determined using standard reference materials (such as indium with an enthalpy of fusion of 28.4 J/g). The formula is:
The calibration process must strictly adhere to the experimental conditions specified for the reference material. For example, the heating rate is typically maintained at 10 °C/min, and the sample mass should range between 5 mg and 20 mg to avoid thermal lag effects.
In DSC data analysis, critical data processing steps include firstly, performing baseline correction before and after phase transitions using linear or polynomial fitting to eliminate environmental and instrumental noise interference; secondly, precisely defining the onset and end temperature points (
T1,
T2) of phase transition peaks to ensure the integration range exclusively covers phase transition-related thermal effects; additionally, the heat flow signal
requires temperature-dependent integration conversion based on experimental scanning rate
β, with the correction formula expressed as:
The instrument software automatically performs the aforementioned integration and unit conversion, ultimately calculating the accurate enthalpy change ΔH through the calibration factor K.
2.1.2. Determination of Phase Transition Temperature
Phase transition temperatures are determined through characteristic points on the DSC curve:
Onset temperature (Tonset): Using the tangent method, a tangent line is drawn at the maximum slope point on the ascending edge of the phase transition peak. The intersection of this tangent with the baseline defines the onset temperature, reflecting the initiation of phase transition.
Peak temperature (Tpeak): Directly corresponds to the temperature at the curve’s maximum point, representing the temperature with the highest phase transition rate.
2.2. Establishment of Heat Transfer Equations for Radiant Cooling Ceilings [15]
2.2.1. Convective Heat Transfer Between the Cold Water Inside the Pipe and the Inner Pipe Wall
The forced convective heat transfer of cold water flowing inside the pipe, being a turbulent process, exhibits negligible influence of thermal boundary conditions on the surface heat transfer coefficient due to intense mixing between fluid micro-eddies. According to the Dittus–Boelter equation, the convective heat transfer coefficient for cold water inside the pipe can be calculated as:
In the formula, considering the fluid being heated, n is taken as 0.4; d represents the characteristic length; denotes the fluid velocity; corresponds to the Prandtl number of the fluid; is the kinematic viscosity coefficient; and stands for the thermal conductivity coefficient.
The heat absorbed per second by the heated water is denoted as
, which can be calculated by the following formula:
In the formula, represents the specific heat capacity at constant pressure, denotes the density, corresponds to the outlet water temperature, and indicates the supply water temperature.
2.2.2. Thermal Conduction Between the Inner and Outer Walls of the Pipe
The conductive heat transfer quantity
between the inner and outer walls of the pipe can be calculated using the following formula:
In the formula,
represents the thermal conductivity coefficient of the pipe,
denotes the axial length of the pipe,
and
correspond to the outer diameter and inner diameter of the pipe, respectively, while
and
indicate the temperatures of the outer and inner walls. The temperature of the pipe’s inner wall surface can be calculated using the following formula:
2.2.3. Convective Heat Transfer Between the Outer Pipe Wall Surface and Indoor Air
The formula for calculating the convective heat transfer quantity
is as follows:
In the formula,
represents the convective heat transfer coefficient between the outer pipe wall and indoor air;
indicates the fluid temperature on the outer pipe wall side, which can be approximated as the indoor temperature. The surface convective heat transfer coefficient can be calculated using the following empirical formula:
In the formula, represents the air velocity (m/s).
2.2.4. Radiative Heat Transfer Between the Outer Pipe Wall Surface and Indoor Building Structures
The radiative heat transfer quantity
adopts the following empirical formula:
In the formula, represents the area-weighted average temperature of the indoor building structures.
According to the law of conservation of energy and the above analysis, the total heat transfer in the supply and return water system satisfies: the total heat transfer between supply and return water equals the convective heat transfer between the cold water in the pipe and the inner pipe wall, which equals the conductive heat transfer between the inner and outer pipe walls, which in turn equals the sum of the convective heat transfer between the outer pipe wall and indoor air as well as the radiative heat exchange between the outer pipe wall and indoor enclosure structures. The formula is expressed as follows:
2.3. PCM Experiment
We prepared five different 100 g gel packs by mixing water, alcohol, and glycerol in varying proportions:
Glycerol (5%) + Alcohol (1%) + Water (94%);
Glycerol (5%) + Alcohol (2.5%) + Water (92.5%);
Glycerol (5%) + Alcohol (5%) + Water (90%);
Glycerol (10%) + Alcohol (5%) + Water (85%);
Glycerol (20%) + Alcohol (10%) + Water (70%).
The prepared gel packs are shown in
Figure 1.
Experimental studies have demonstrated that phase change material systems with compositions of 92.5% water + 2.5% alcohol + 5% glycerol and 94% water + 1% alcohol + 5% glycerol exhibit significant advantages in thermodynamic performance compared to other formulations. These advantages are specifically manifested as the following: phase transition temperature meeting requirements, enhanced thermal stability parameters, and a notable increase in phase change enthalpy. Due to these advantageous properties, both formulations have been widely adopted in practical phase change energy storage applications.
To precisely evaluate the performance differences between the two formulation systems, this study employs DSC for comparative analysis of their phase change latent heat and phase transition temperature. As a standard testing method for thermal analysis of PCMs, DSC enables accurate determination of critical thermodynamic parameters such as phase transition temperature range and melting/solidification enthalpy. The testing utilizes a METTLER TOLEDO DSC instrument equipped with 56 thermocouples, capable of precise measurements across a temperature range of −150 °C to 700 °C. Through phase equilibrium analysis and DSC measurements, reliable data on material latent heat and solidification temperature ranges can be obtained.
This study employs a phase change material (PCM) thermal storage tank with a capacity of 200 L to replace traditional energy storage devices. The system operates under two working conditions:
During periods of sufficient photovoltaic power supply, the DC vapor compression unit prioritizes electrical energy to drive the PCM thermal storage device. This allows the phase change material in the tank to simultaneously store energy via phase transition while providing spatial cooling through radiative cooling ceiling panels. The latent heat storage at the material’s phase transition temperature achieves the conversion of electrical energy to thermal energy.
During periods of insufficient photovoltaic power supply (e.g., nighttime or continuous cloudy/rainy weather), the PCM releases stored latent heat through reverse phase transition to sustain the operational efficiency of the radiative cooling terminal.
The selection of PCMs with a phase transition temperature above 0 °C aims to prevent freezing of the cooling water (phase transition temperature 0 °C) in the radiative cooling ceiling. This thermal battery technology based on PCM heat storage effectively addresses the cyclic degradation issues inherent in traditional electrochemical energy storage while enhancing the system’s environmental benefits.
The core component of this thermal management system adopts a dual-loop energy storage water tank structure, comprising two independent circulation loops. The primary loop achieves cooling capacity conversion through a vapor-driven compressor, while the secondary loop is thermally coupled with the radiant terminal devices. The secondary loop is directly connected to the radiant terminal, utilizing the temperature buffering effect of the radiant panels to reduce reliance on the transient response of PCM discharging. The dual-loop design physically isolates heat/cooling transfer paths, thereby optimizing system adaptability to dynamic loads while minimizing direct impacts of phase transition processes on cooling supply stability [
16]. However, due to the time-delay characteristics of latent heat release during PCM phase transition, although this design partially mitigates transient response mismatch issues, experimental quantification remains necessary to validate the influence of hysteresis effects on system control accuracy.
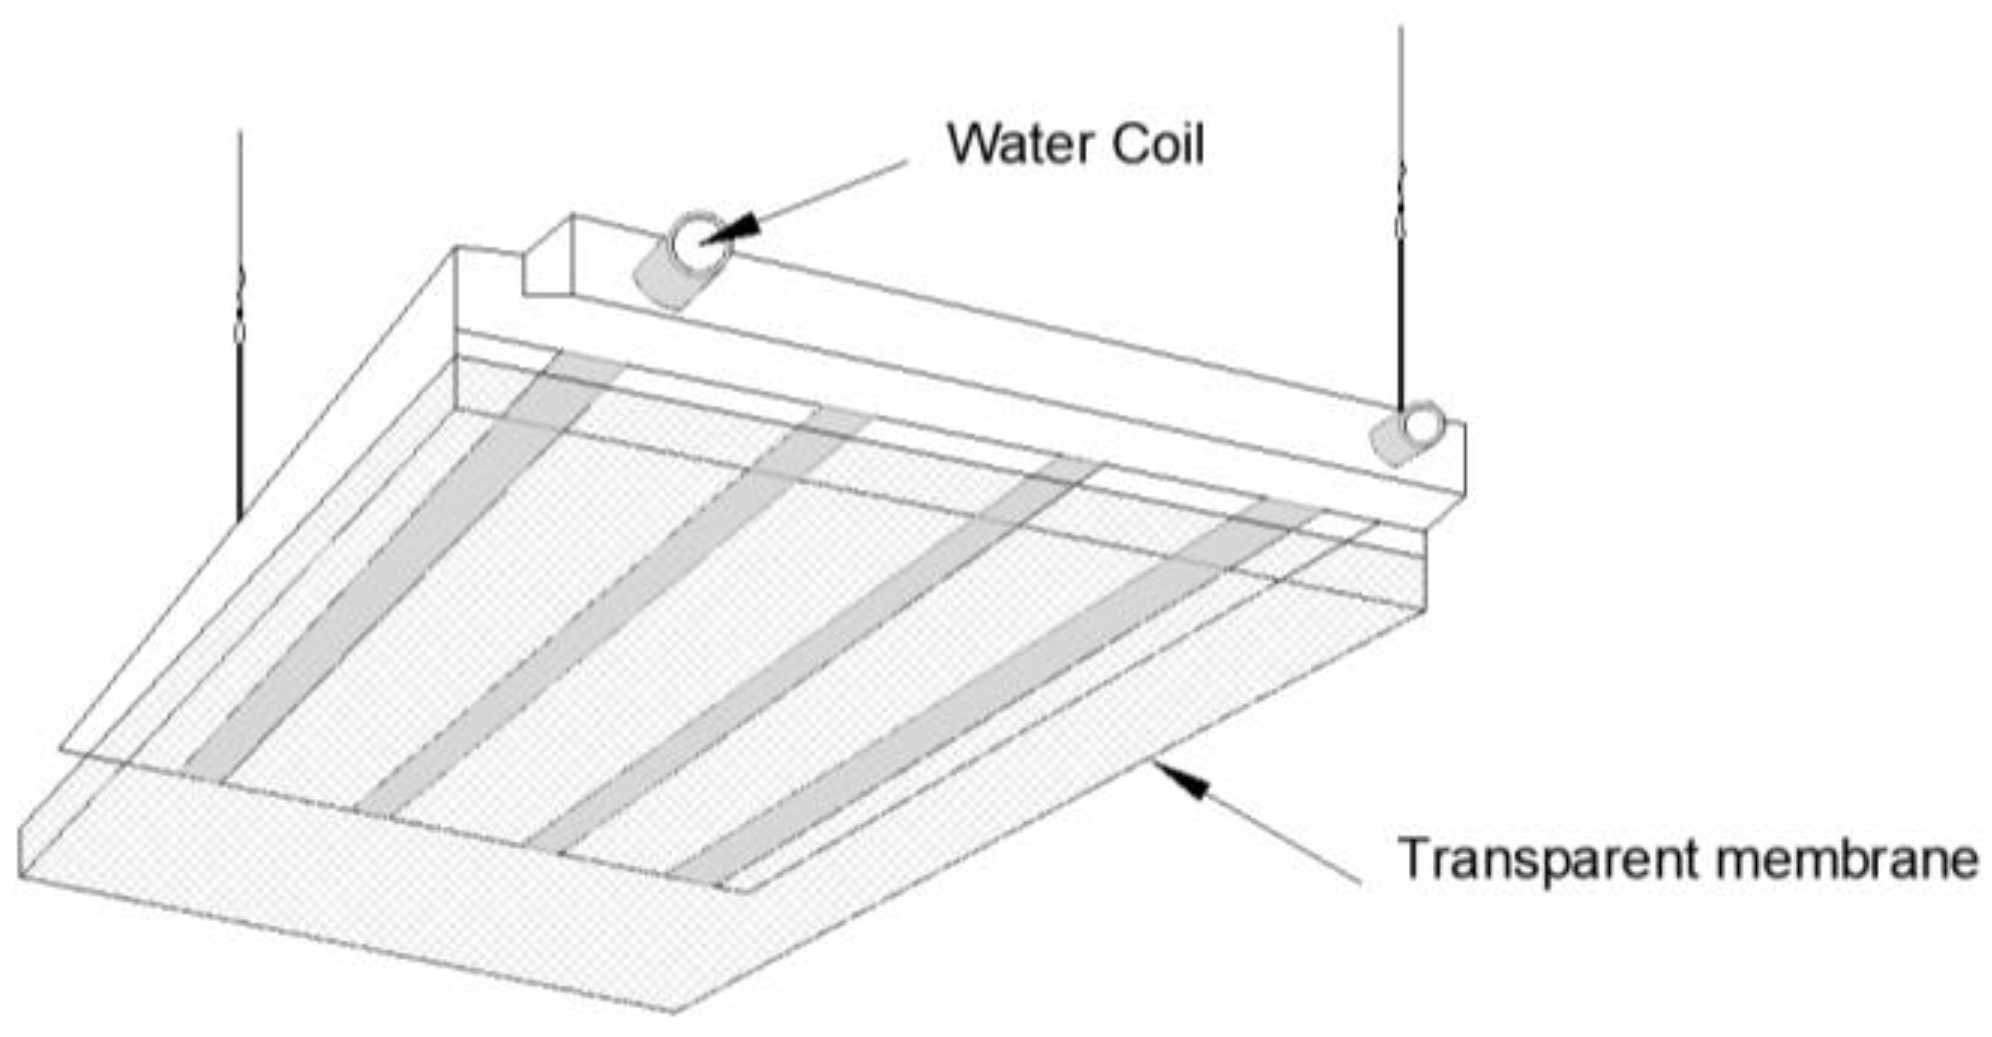
2.4. Physical Model Construction of the Radiant Cooling Ceiling
During the design phase, this study fully incorporated cost control considerations for large-scale civil applications and, therefore, adopted an optimized solution with significant cost advantages and structural simplicity. The specific layout configuration is illustrated in
Figure 2.
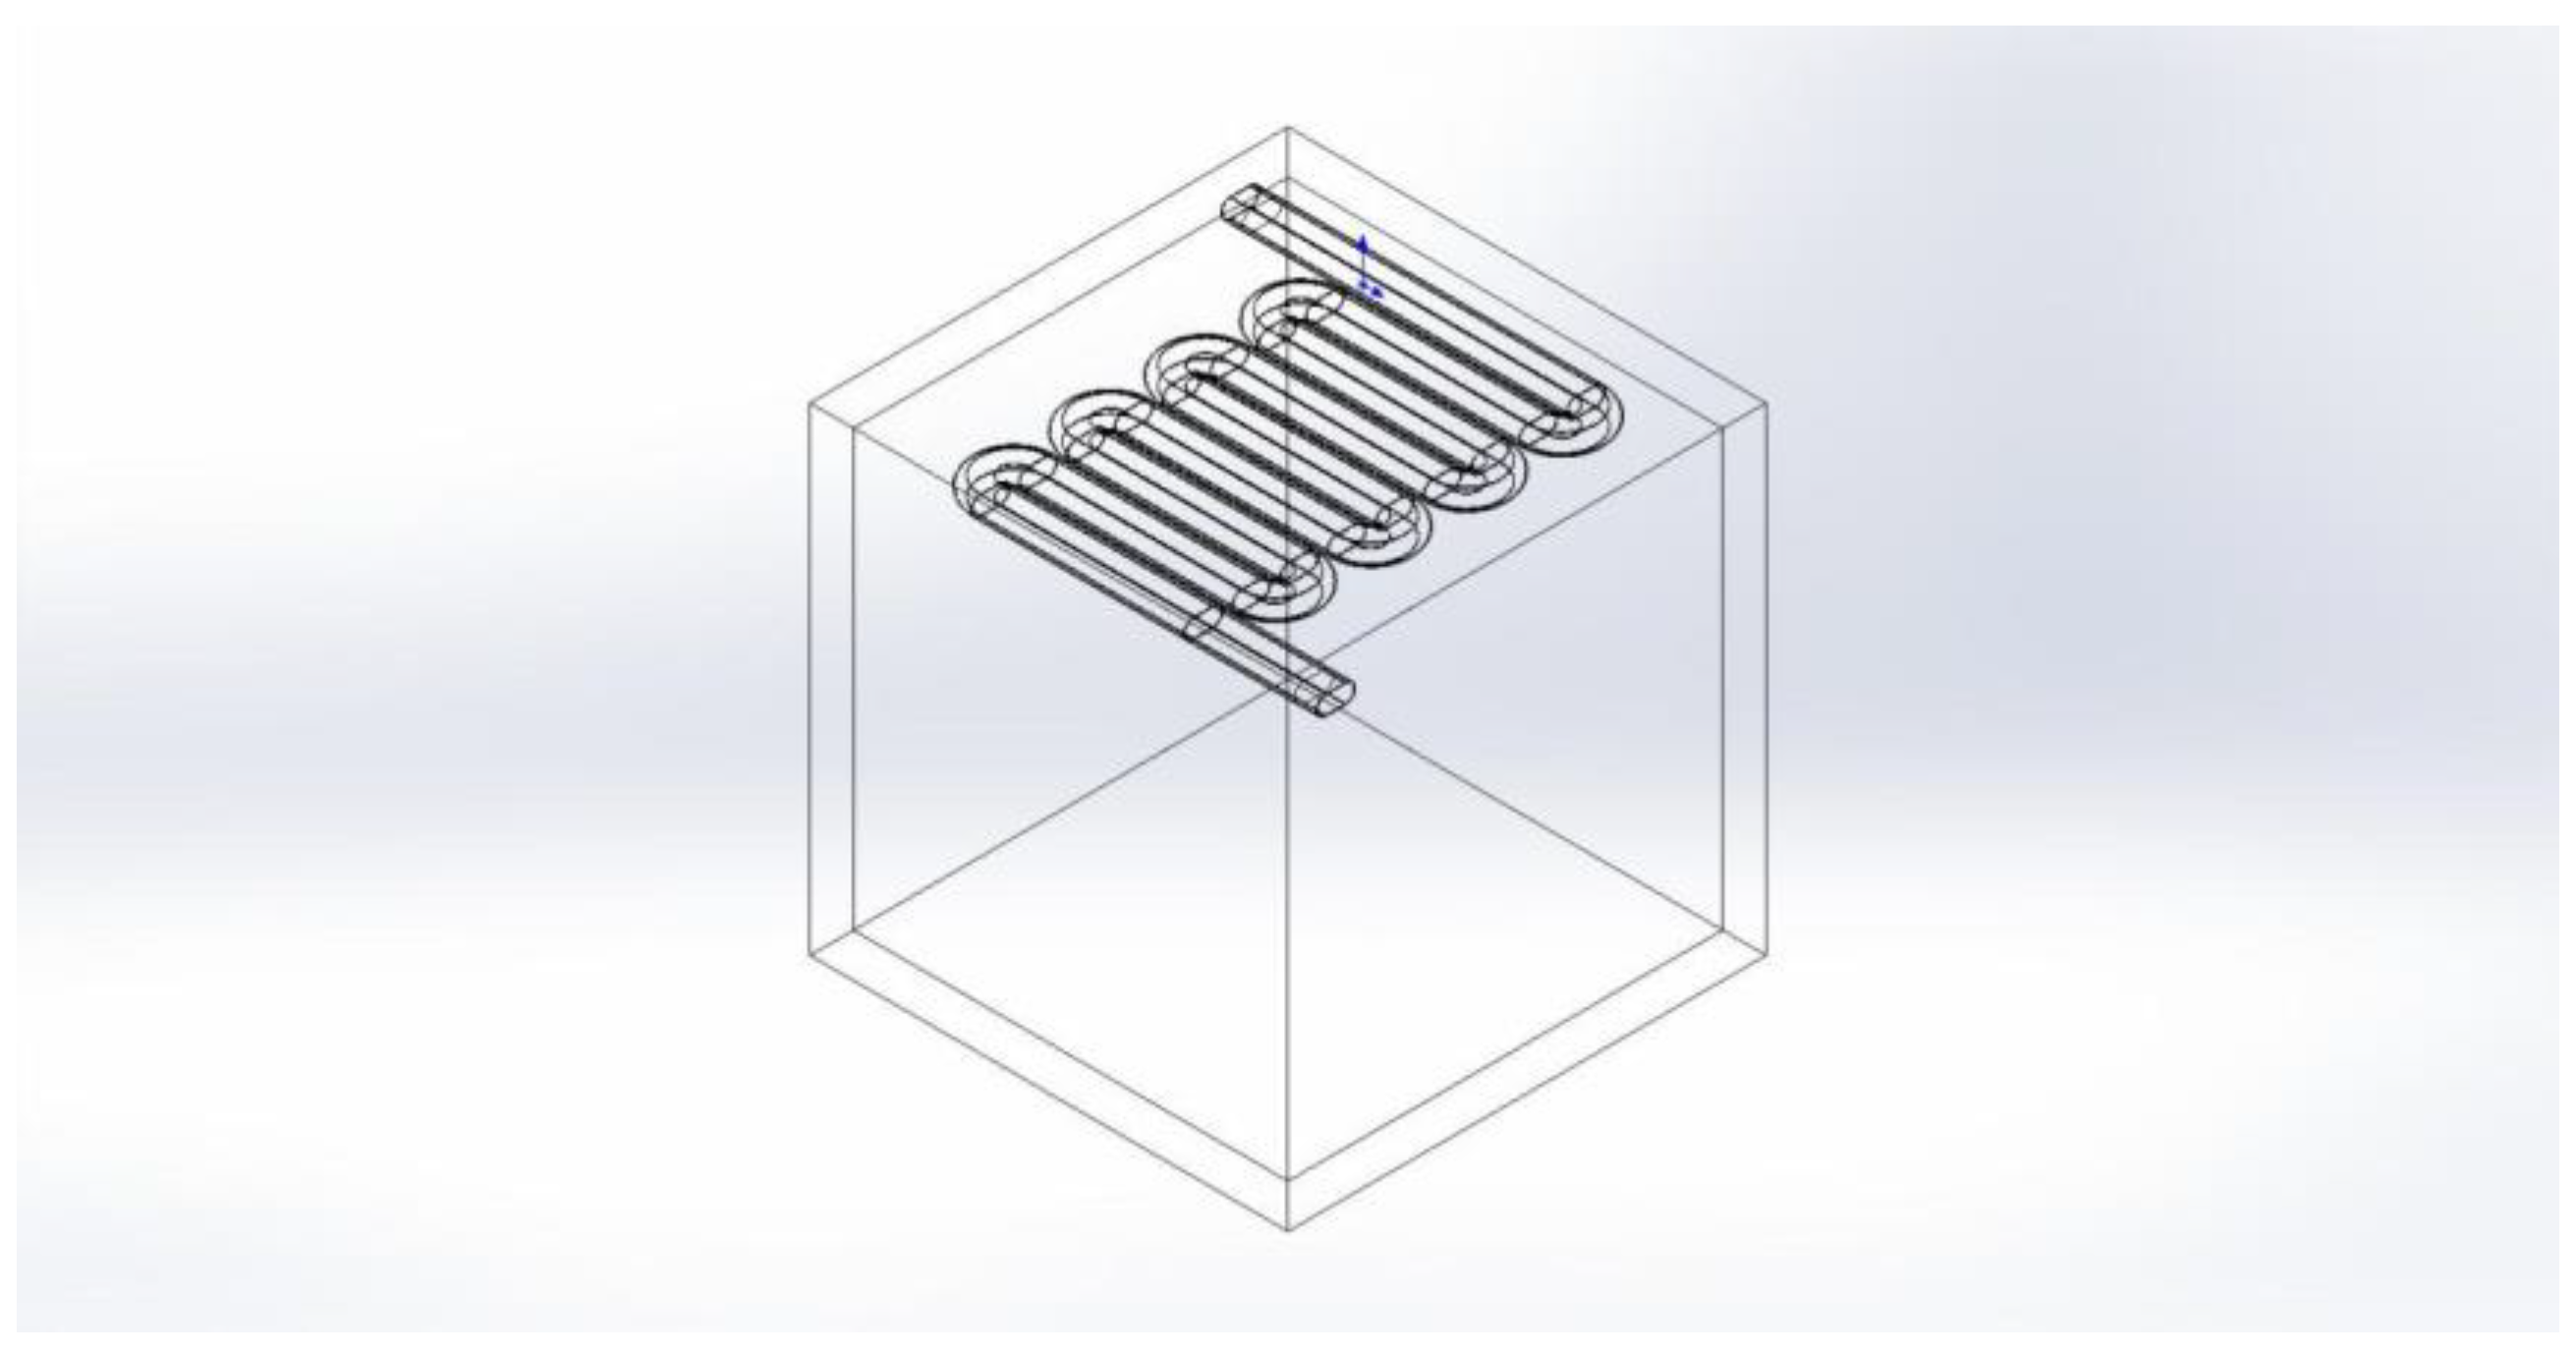
To validate the cooling capacity of the radiative cooling ceiling structure, this study establishes a 1 m
3 enclosed space physical model using SolidWorks software. The main structure consists of 50 mm thick concrete walls (density: 2551 kg/m
3, specific heat capacity: 920 J/(kg·K), thermal conductivity: 1.74 W/(m·K)). To simplify the model, a serpentine radiative cooling pipe system is integrated into the top of the enclosed space. The copper pipes feature a straight-groove cross-section (semi-circular pitch: 45 mm, radius: 22.5 mm, wall thickness: 2.5 mm), arranged in a serpentine layout covering the ceiling. The straight segments measure 490 mm in length, with bend radii of 55 mm, positioned 22.5 mm below the top inner surface. The enclosed space is filled with air, while water serves as the coolant in the pipes, with an inlet flow velocity of 0.65 m/s. Gravitational acceleration is set at −9.81 m/s
2 along the Y-axis. A constant-temperature boundary condition (283 K) is applied to the radiative cooling panel area, while all other walls adopt zero heat flux boundary conditions to simplify heat transfer analysis. The complete physical model is shown in
Figure 3 below.
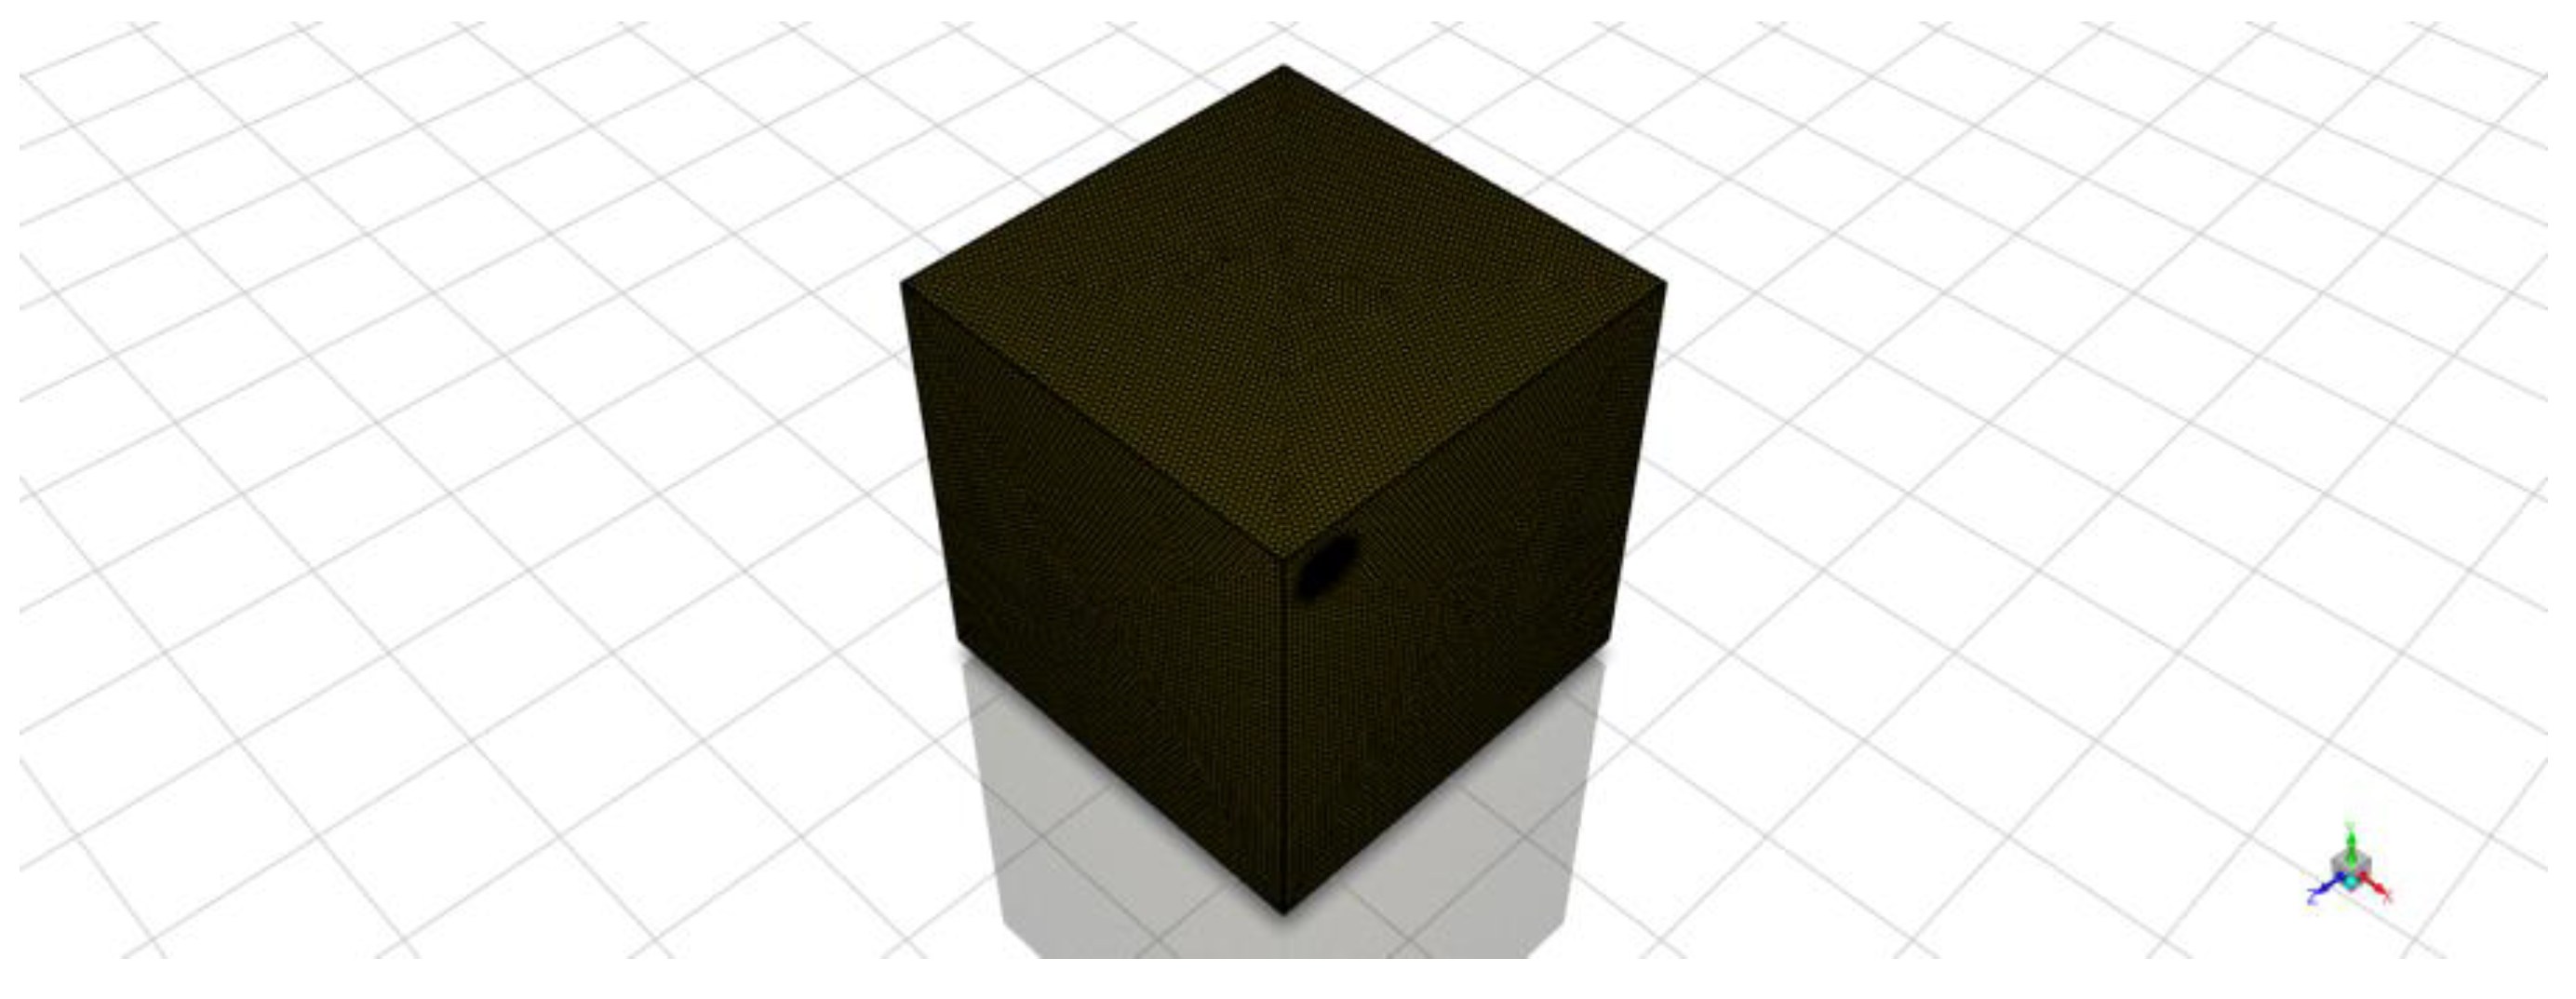
This study employs the Discrete Ordinates (DO) method for radiative heat transfer modeling, selected through a systematic evaluation of optical thickness (αL), computational efficiency, and local heat source adaptability. With air’s low absorption coefficient (α) and a characteristic length of 7.2 m, αL < 1 confirms an optically thin medium, excluding P-1 (αL > 1), Rosseland (αL > 3), and S2S (inapplicable to media). The DO method outperforms DTRM (limited by computational costs from ray tracing) and S2S (burdened by view factor calculations) by balancing accuracy and efficiency via angle discretization. It uniquely addresses medium radiation, scattering, and non-gray radiation while resolving localized heat source distributions. Furthermore, its compatibility with advanced scenarios (e.g., specular reflection, semi-transparent media) ensures robustness for future extensions. The DO model’s versatility, precision in complex radiation fields, and computational scalability solidify its suitability for this study’s physical constraints and methodological rigor. For the fluid viscosity model, turbulent flow was determined through Reynolds number calculation (Re = 40,222.77), leading to the adoption of a turbulence model for simulations. The mesh generation process employs software-optimized unstructured hybrid elements with an automatically determined minimum size of 1.07 mm, constructing a computational grid system containing 8.54 million nodes and 2.1 million elements. The boundary configuration comprises 7 nodal domains and 12 surface partitions specifically designed for multiphysics coupling requirements.
In numerical simulations, grid density exhibits a positive correlation with computational accuracy, yet excessive mesh elements significantly escalate computational costs. This study generated five grid configurations (ranging from 1.02 million to 2.94 million elements) by adjusting maximum/minimum grid dimensions (40/4 mm to 10/1.07422 mm). To validate grid independence, the dynamic thermal regulation performance of a radiant cooling ceiling was evaluated under 0.5 h and 1 h operating conditions. The assessment utilized time-averaged temperature profiles across the YX-normal symmetric plane air domain. Relative errors were quantified using δ = |R − R
0|/R
0 × 100%, where R
0 represents the baseline result from the 2.10-million-element grid. The grid independence verification results are presented in
Table 1.
Results demonstrate: As grid elements increased from 1.02 million to 2.10 million, the 0.5 h operating temperature rose from 295.16 K to 296.59 K, while the 1 h temperature increased from 294.99 K to 296.17 K. Further refinement to 2.94 million elements yielded marginal temperature increments of 0.14 K and 0.25 K, respectively, indicating stabilized computational precision. By balancing error control (0.145% and 0.19% relative errors) with computational efficiency, the 1.87-million-element configuration was identified as optimal (as shown in
Figure 4), effectively reducing computational resource consumption while maintaining solution accuracy.
3. Results
3.1. PCM Experiment Result
Table 2 presents the weight percentage composition of the two distinct PCM materials (Ice Gel and Slushy Ice).
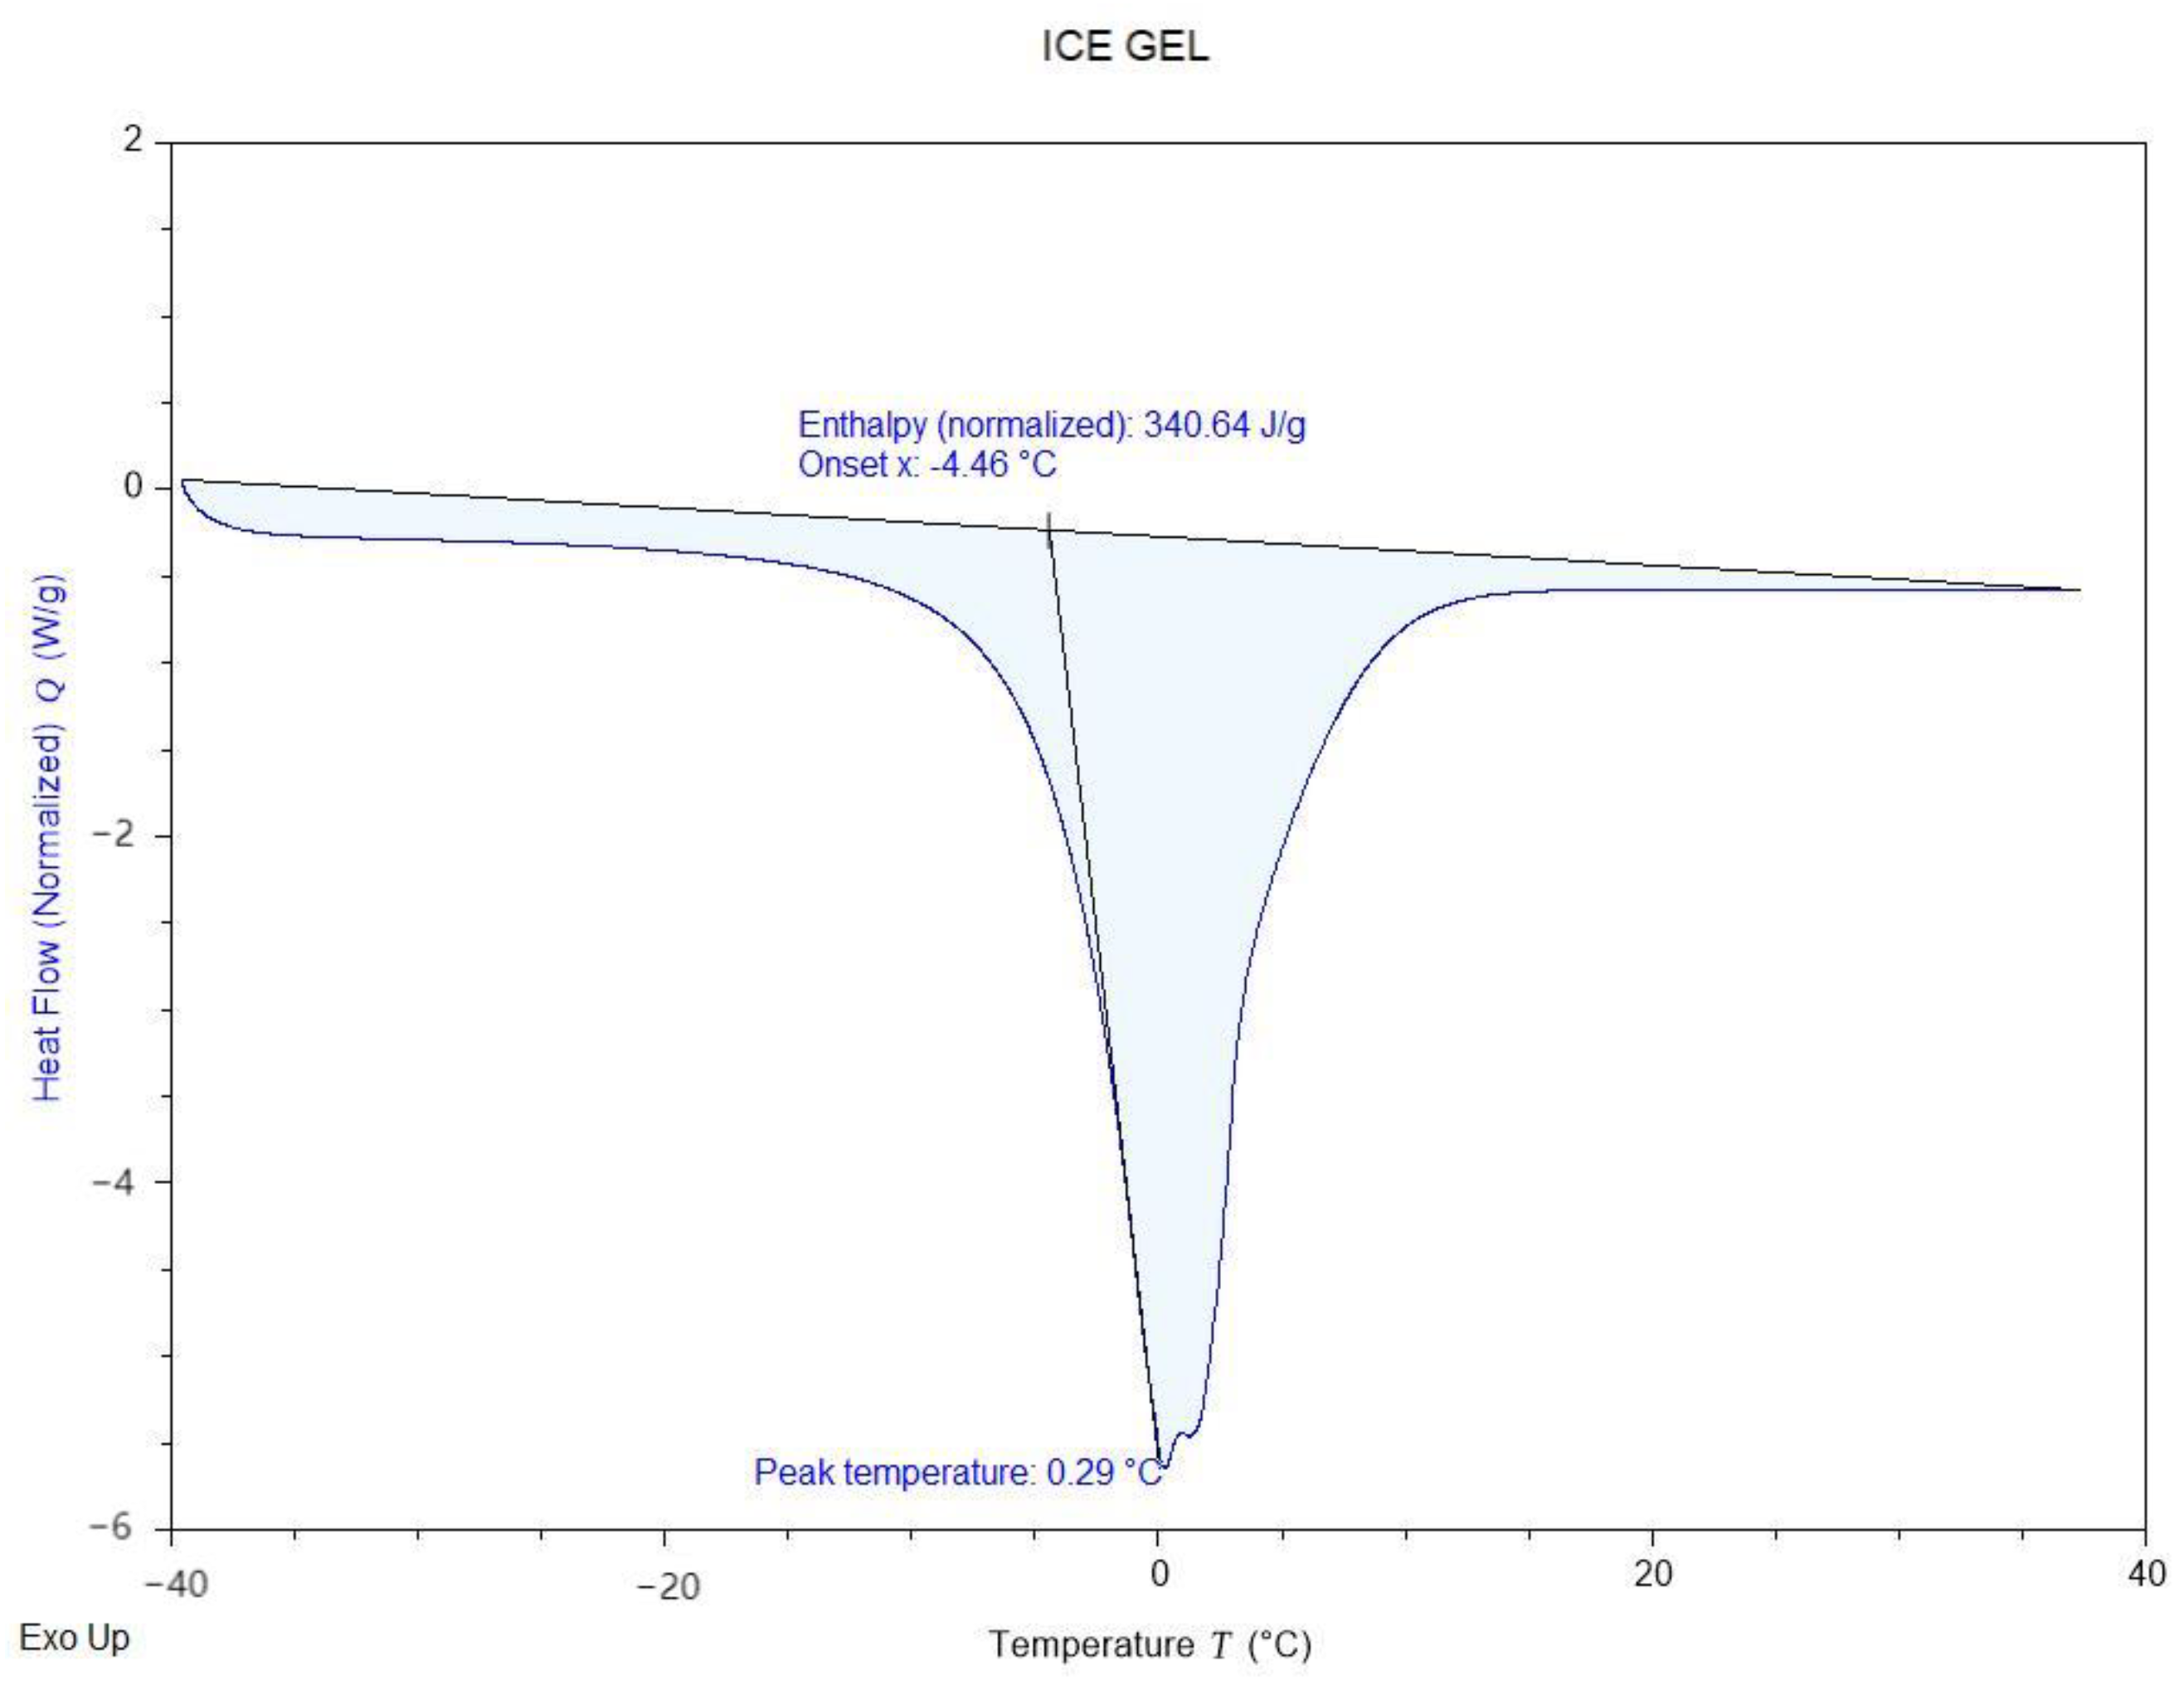
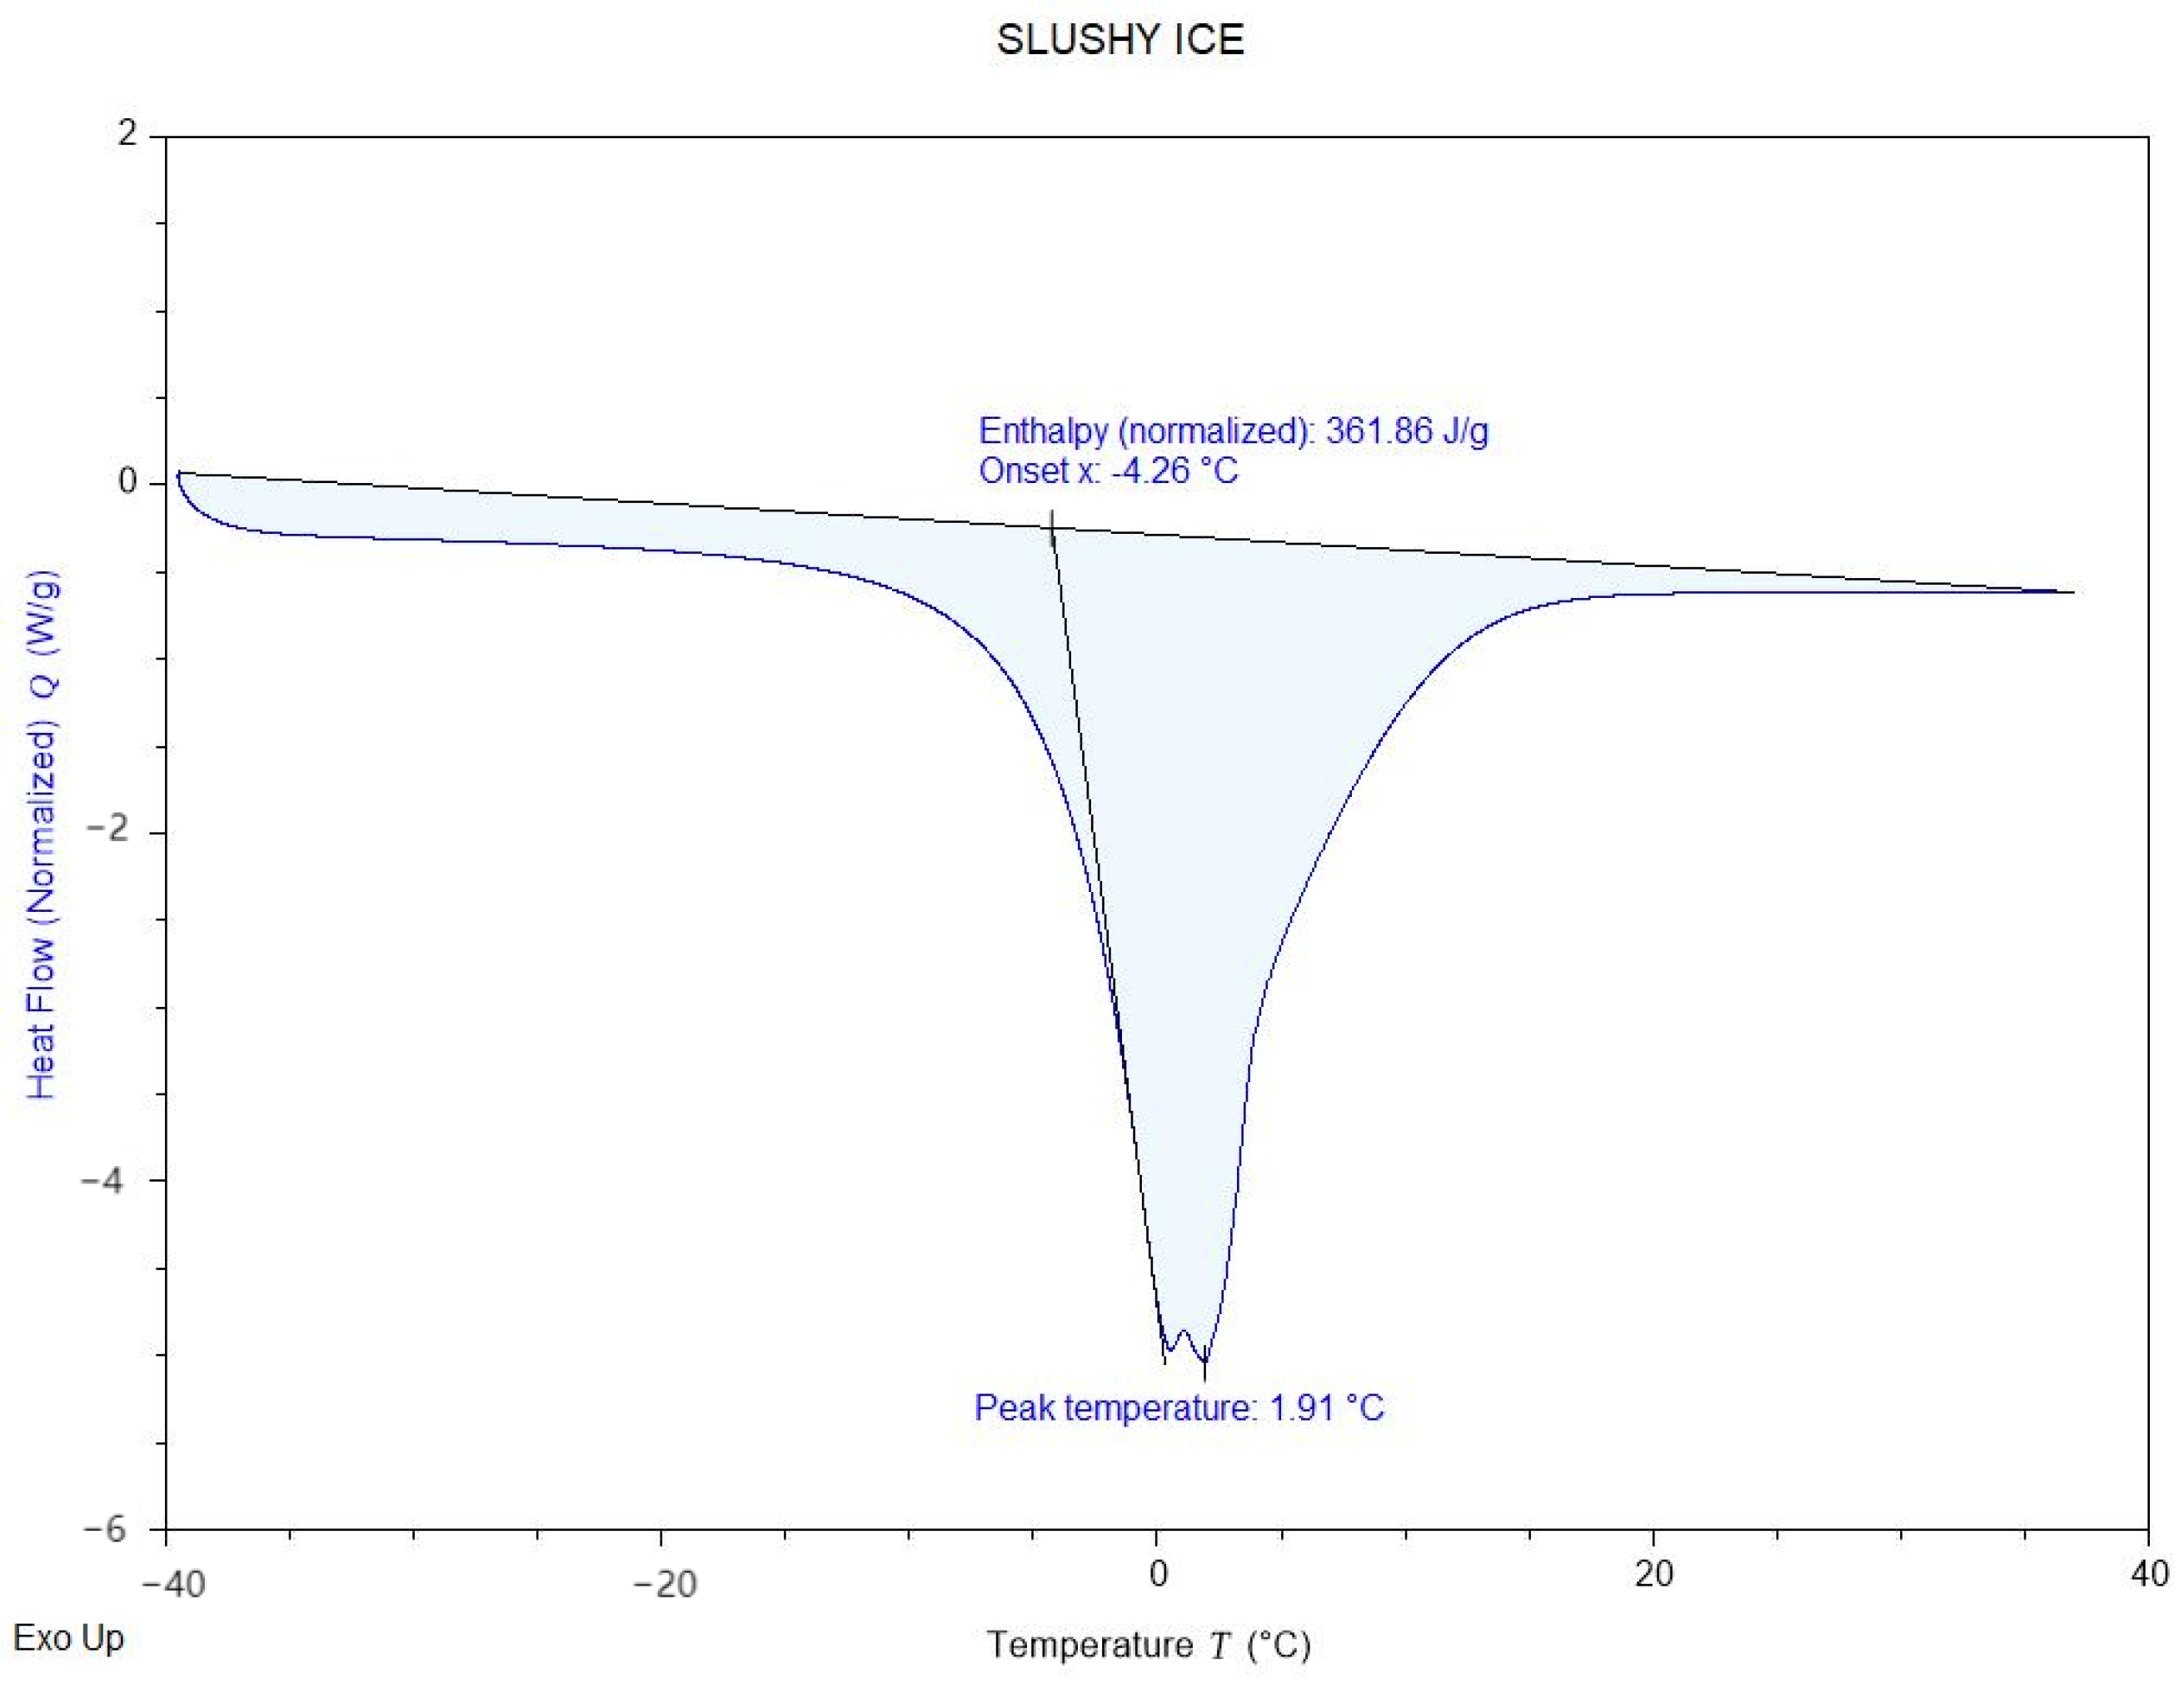
The phase transition temperature (Tpeak) of the PCM can be directly determined from the DSC curves. By applying the modified forms of Formulas (1)–(3), the enthalpy of phase change can be calculated through integration of the peak area in the DSC curve, followed by multiplying the integrated value with the scanning rate (10 °C/min). This combined approach enables a straightforward quantification of the latent heat associated with the phase transition process.
Figure 5 illustrates the freezing characteristics of the Ice Gel material, with a freezing point of 0.29 °C and an enthalpy value of 340.64 J/g. Meanwhile,
Figure 6 displays the freezing properties of the Slushy Ice, which exhibits a freezing point of 1.91 °C and an enthalpy value of 361.66 J/g. Comparing the two materials, the Slushy Ice demonstrates superior thermal performance. Long-term cycling tests (500 cycles) further confirmed its durability, showing only 8.2% latent heat decay (vs. 15–20% in other organic PCMs). Consequently, the Slushy Ice solution was selected as the filling material in the experiment. This choice not only optimizes the system’s thermal performance but also ensures higher energy storage efficiency.
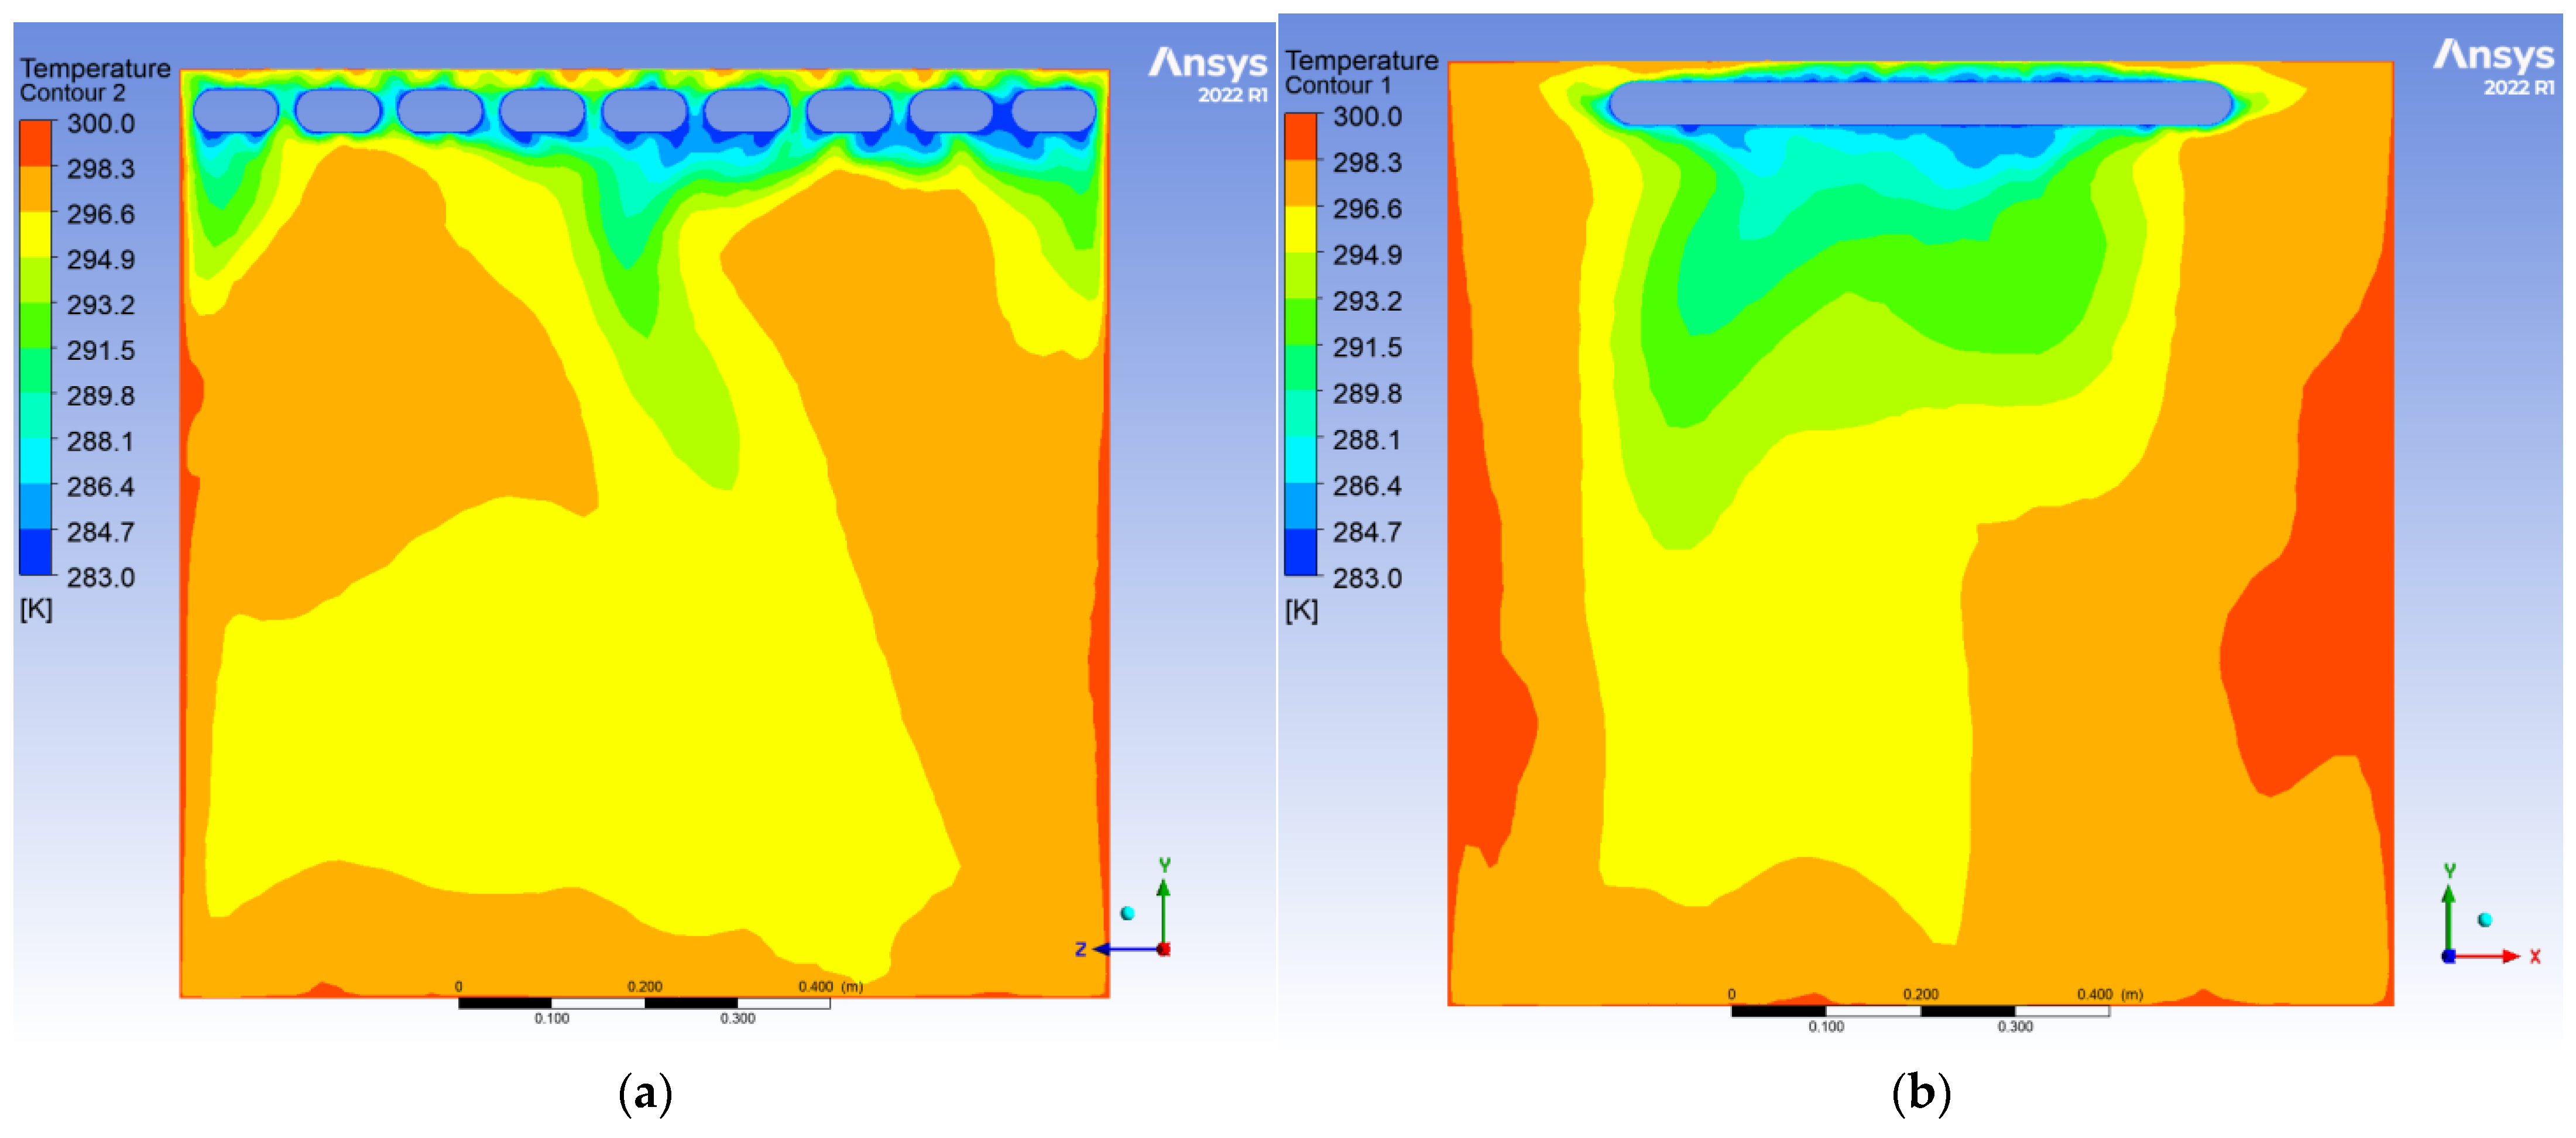
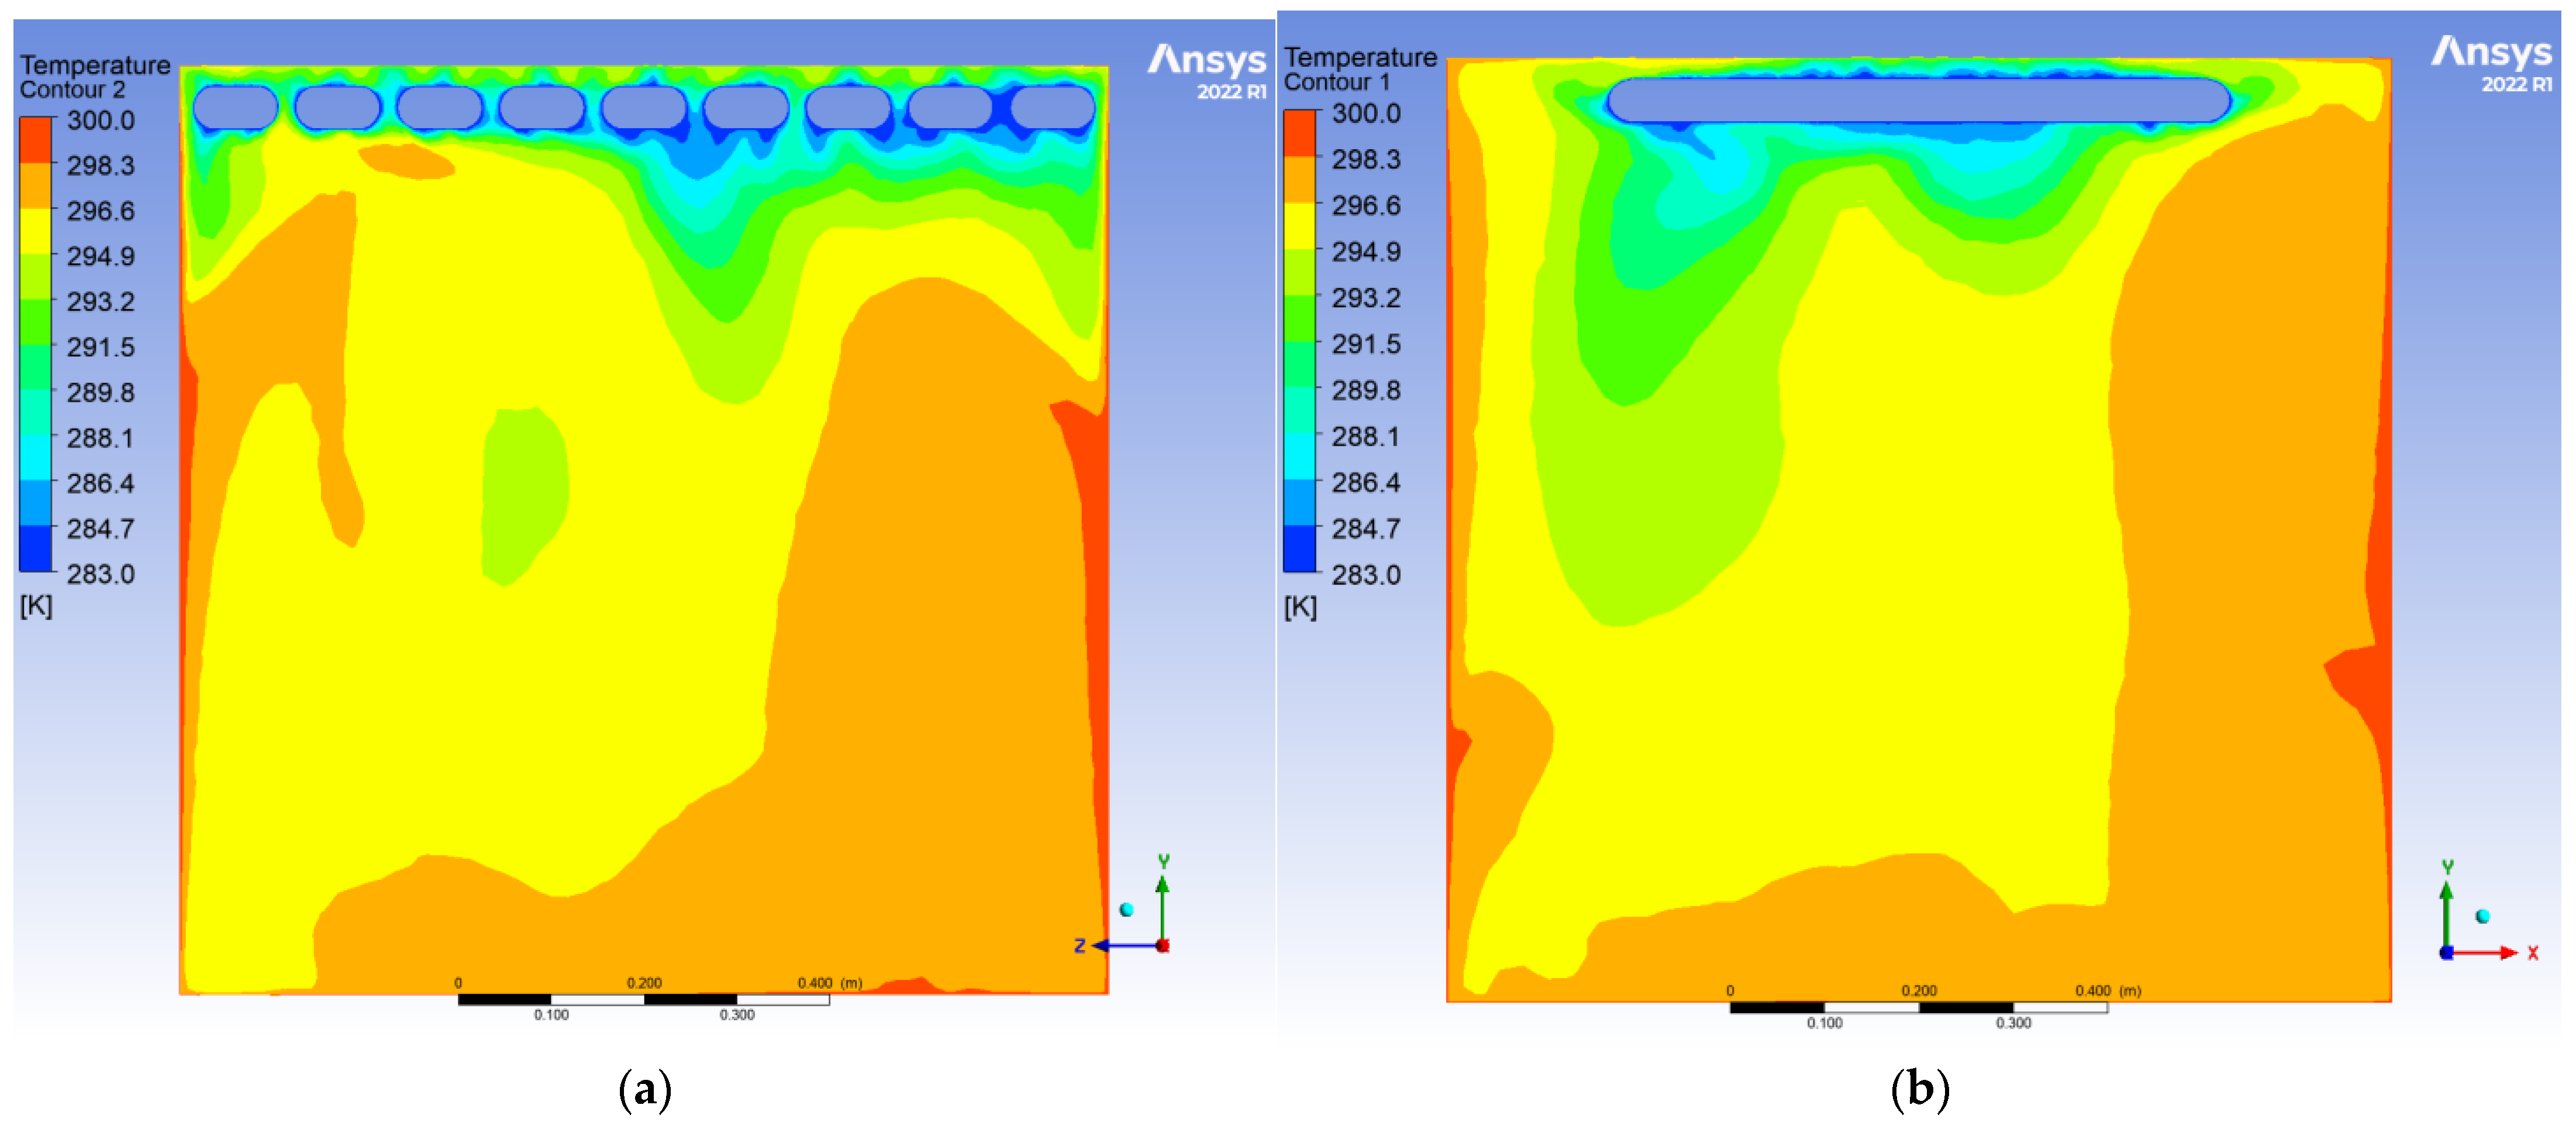
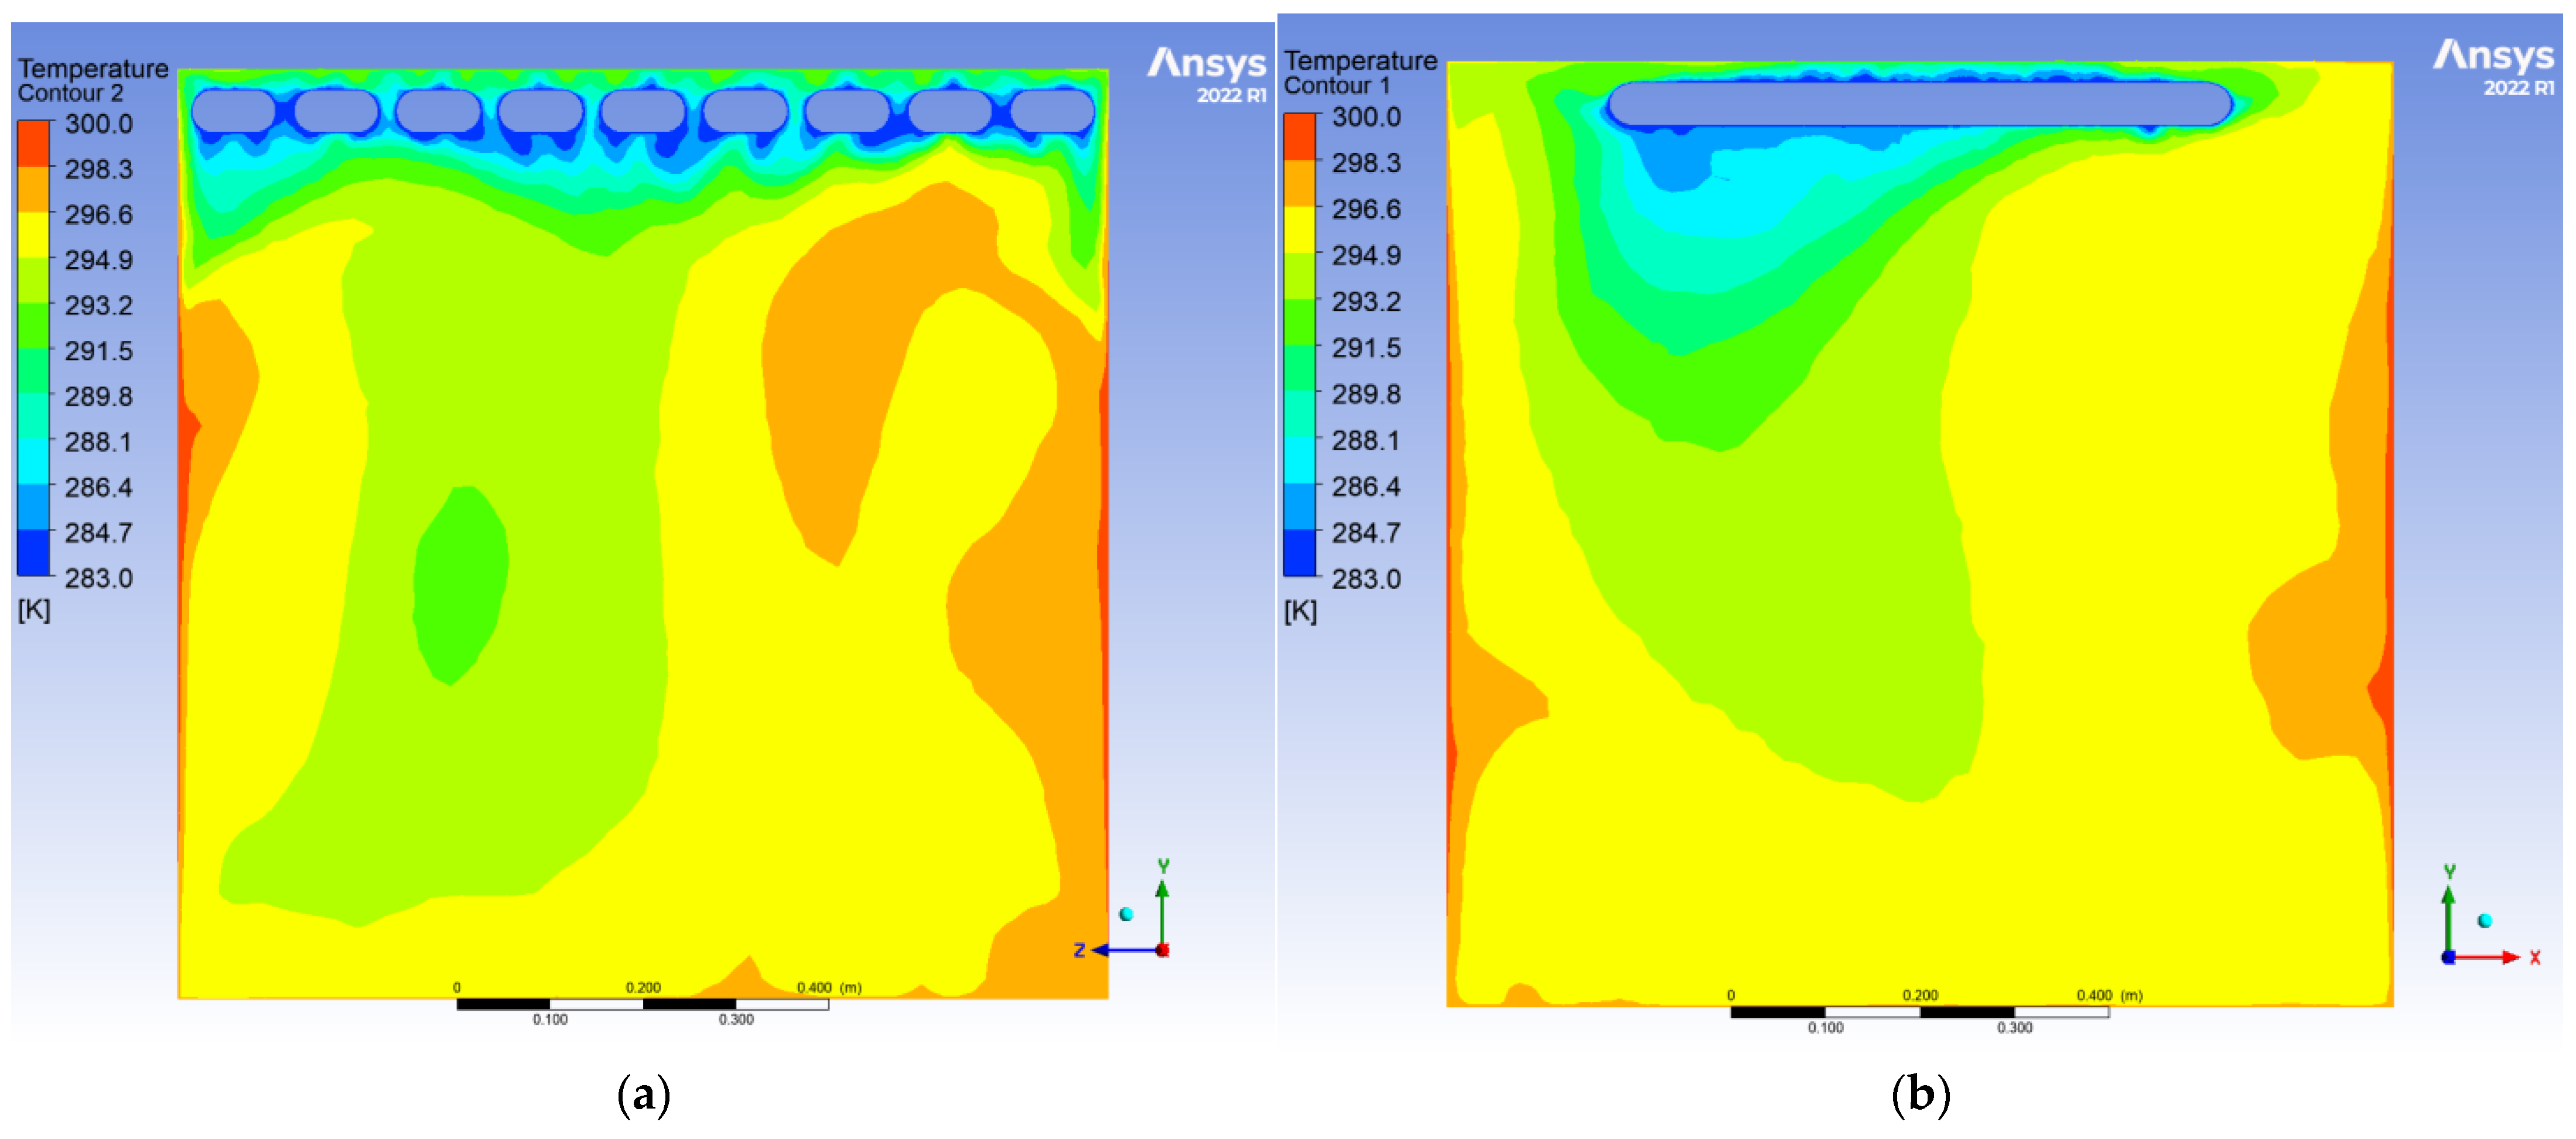
3.2. Simulation Results of Radiant Cooling Ceiling
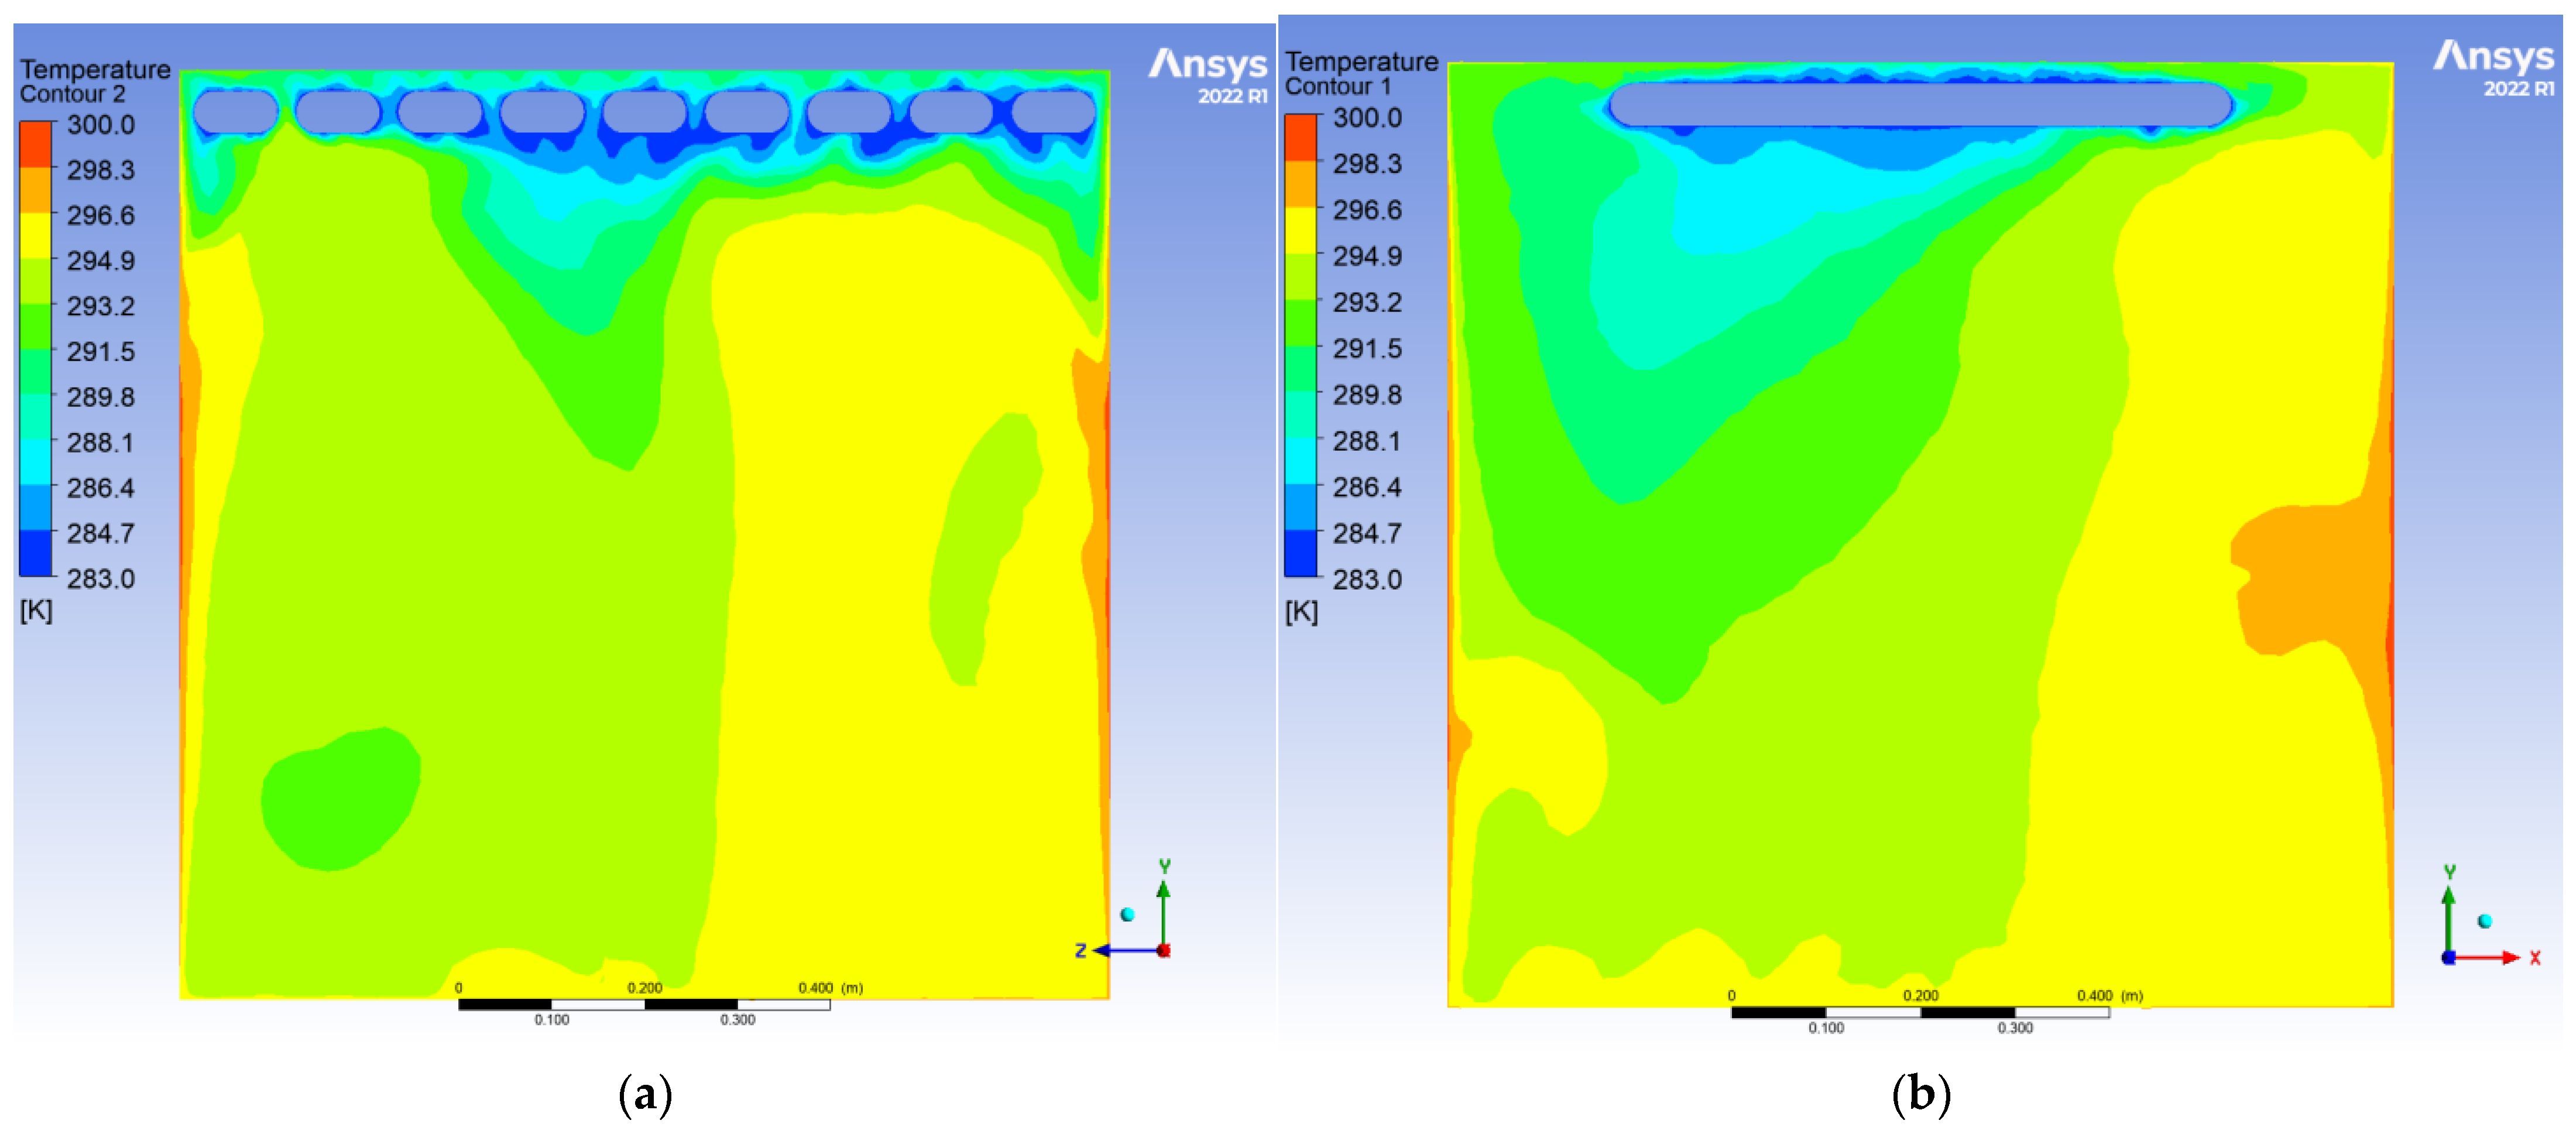
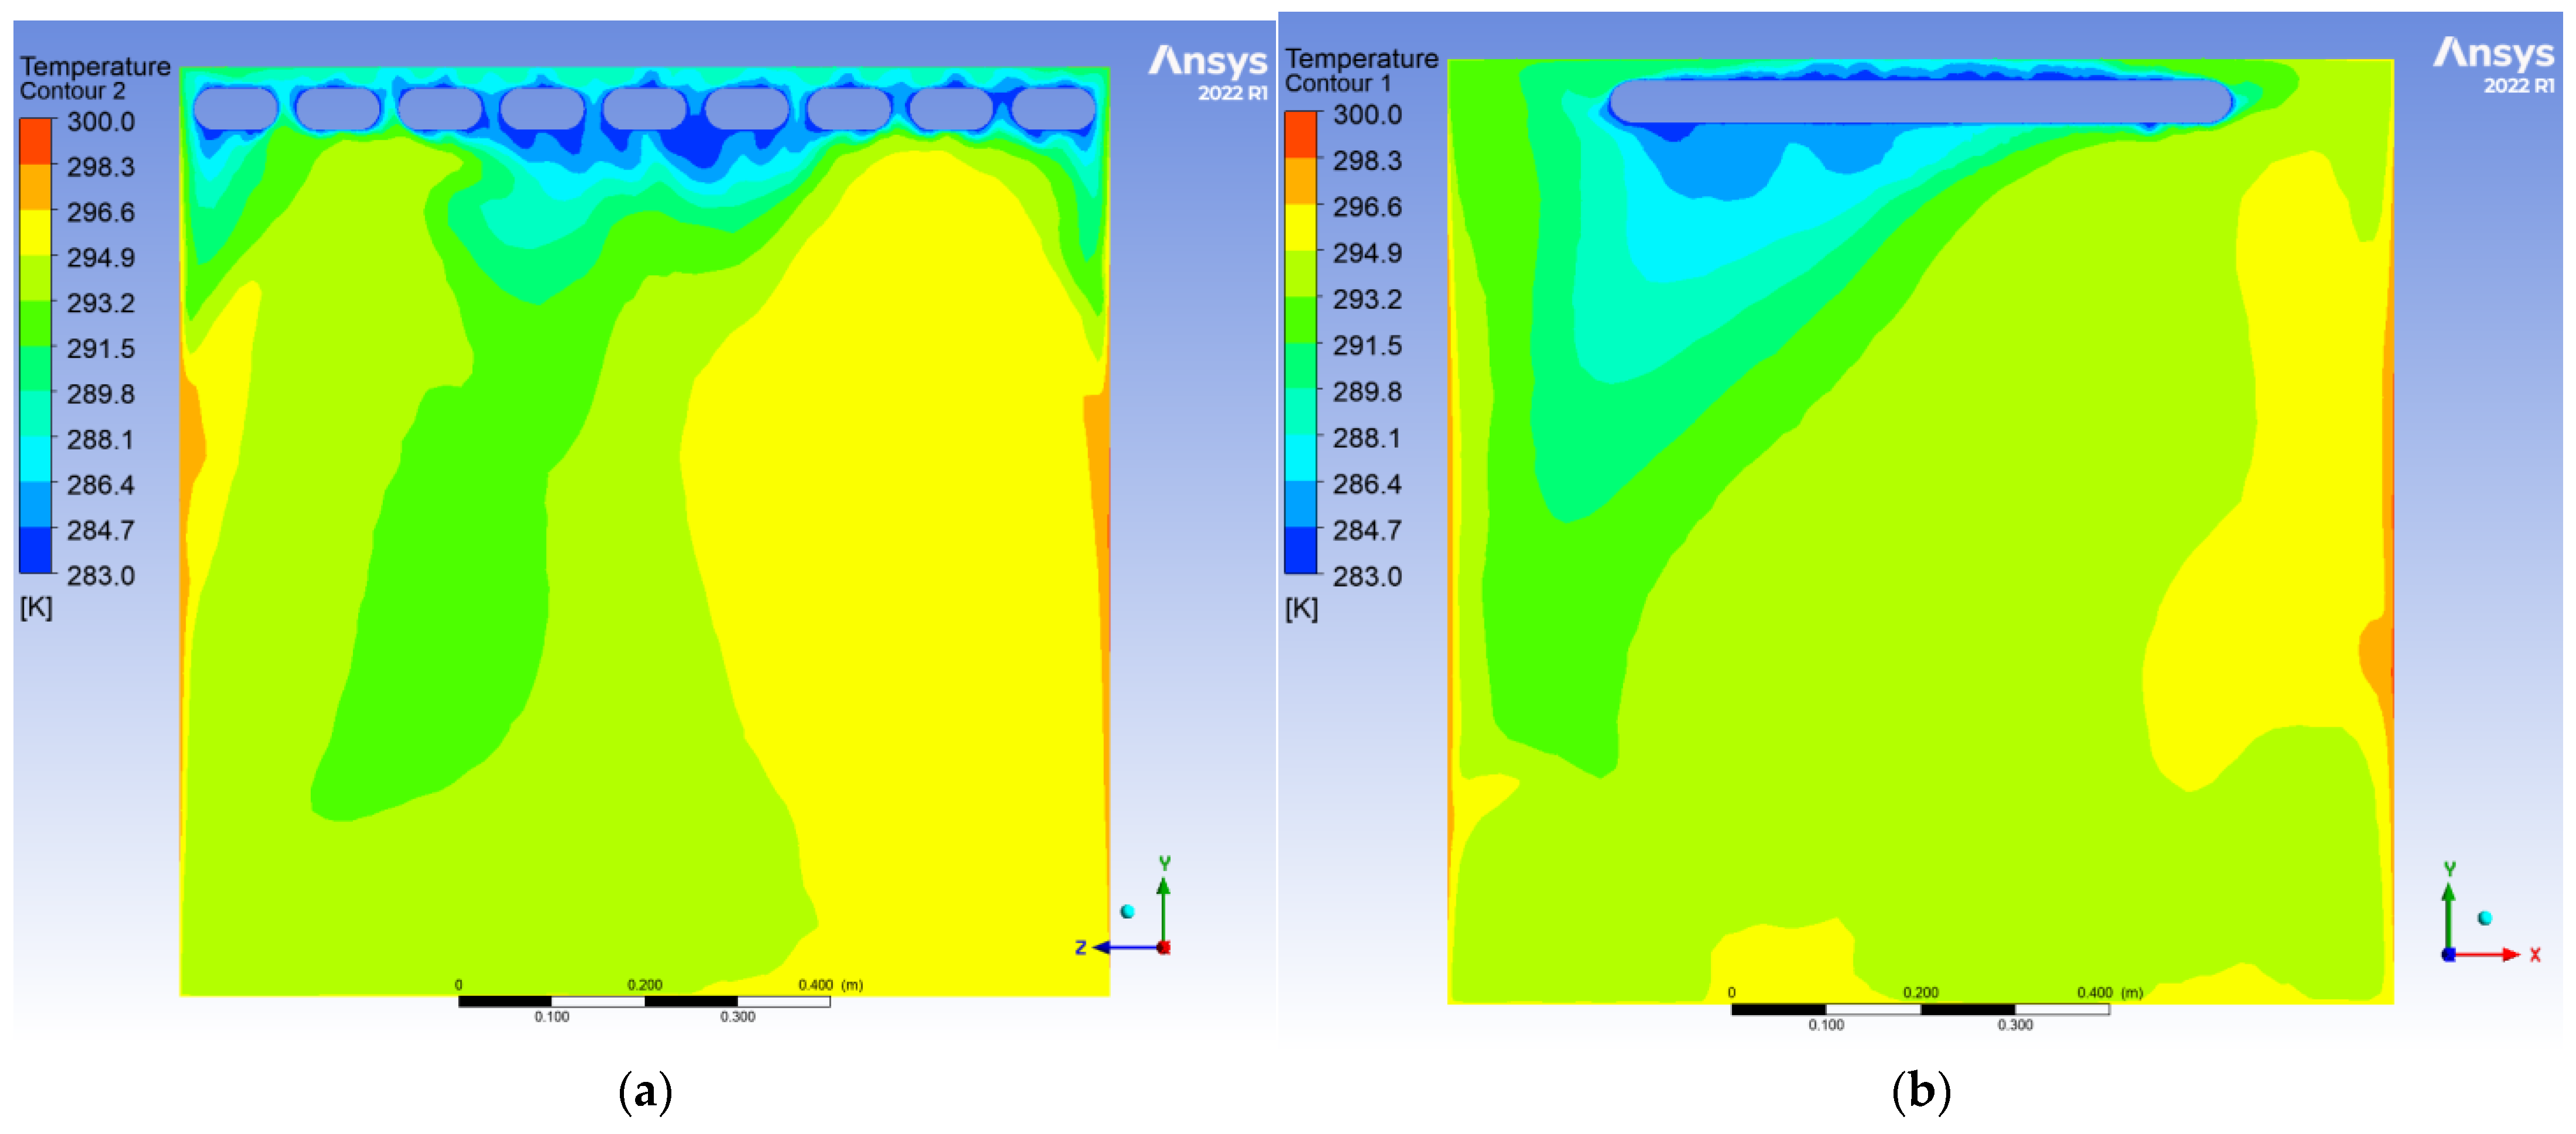
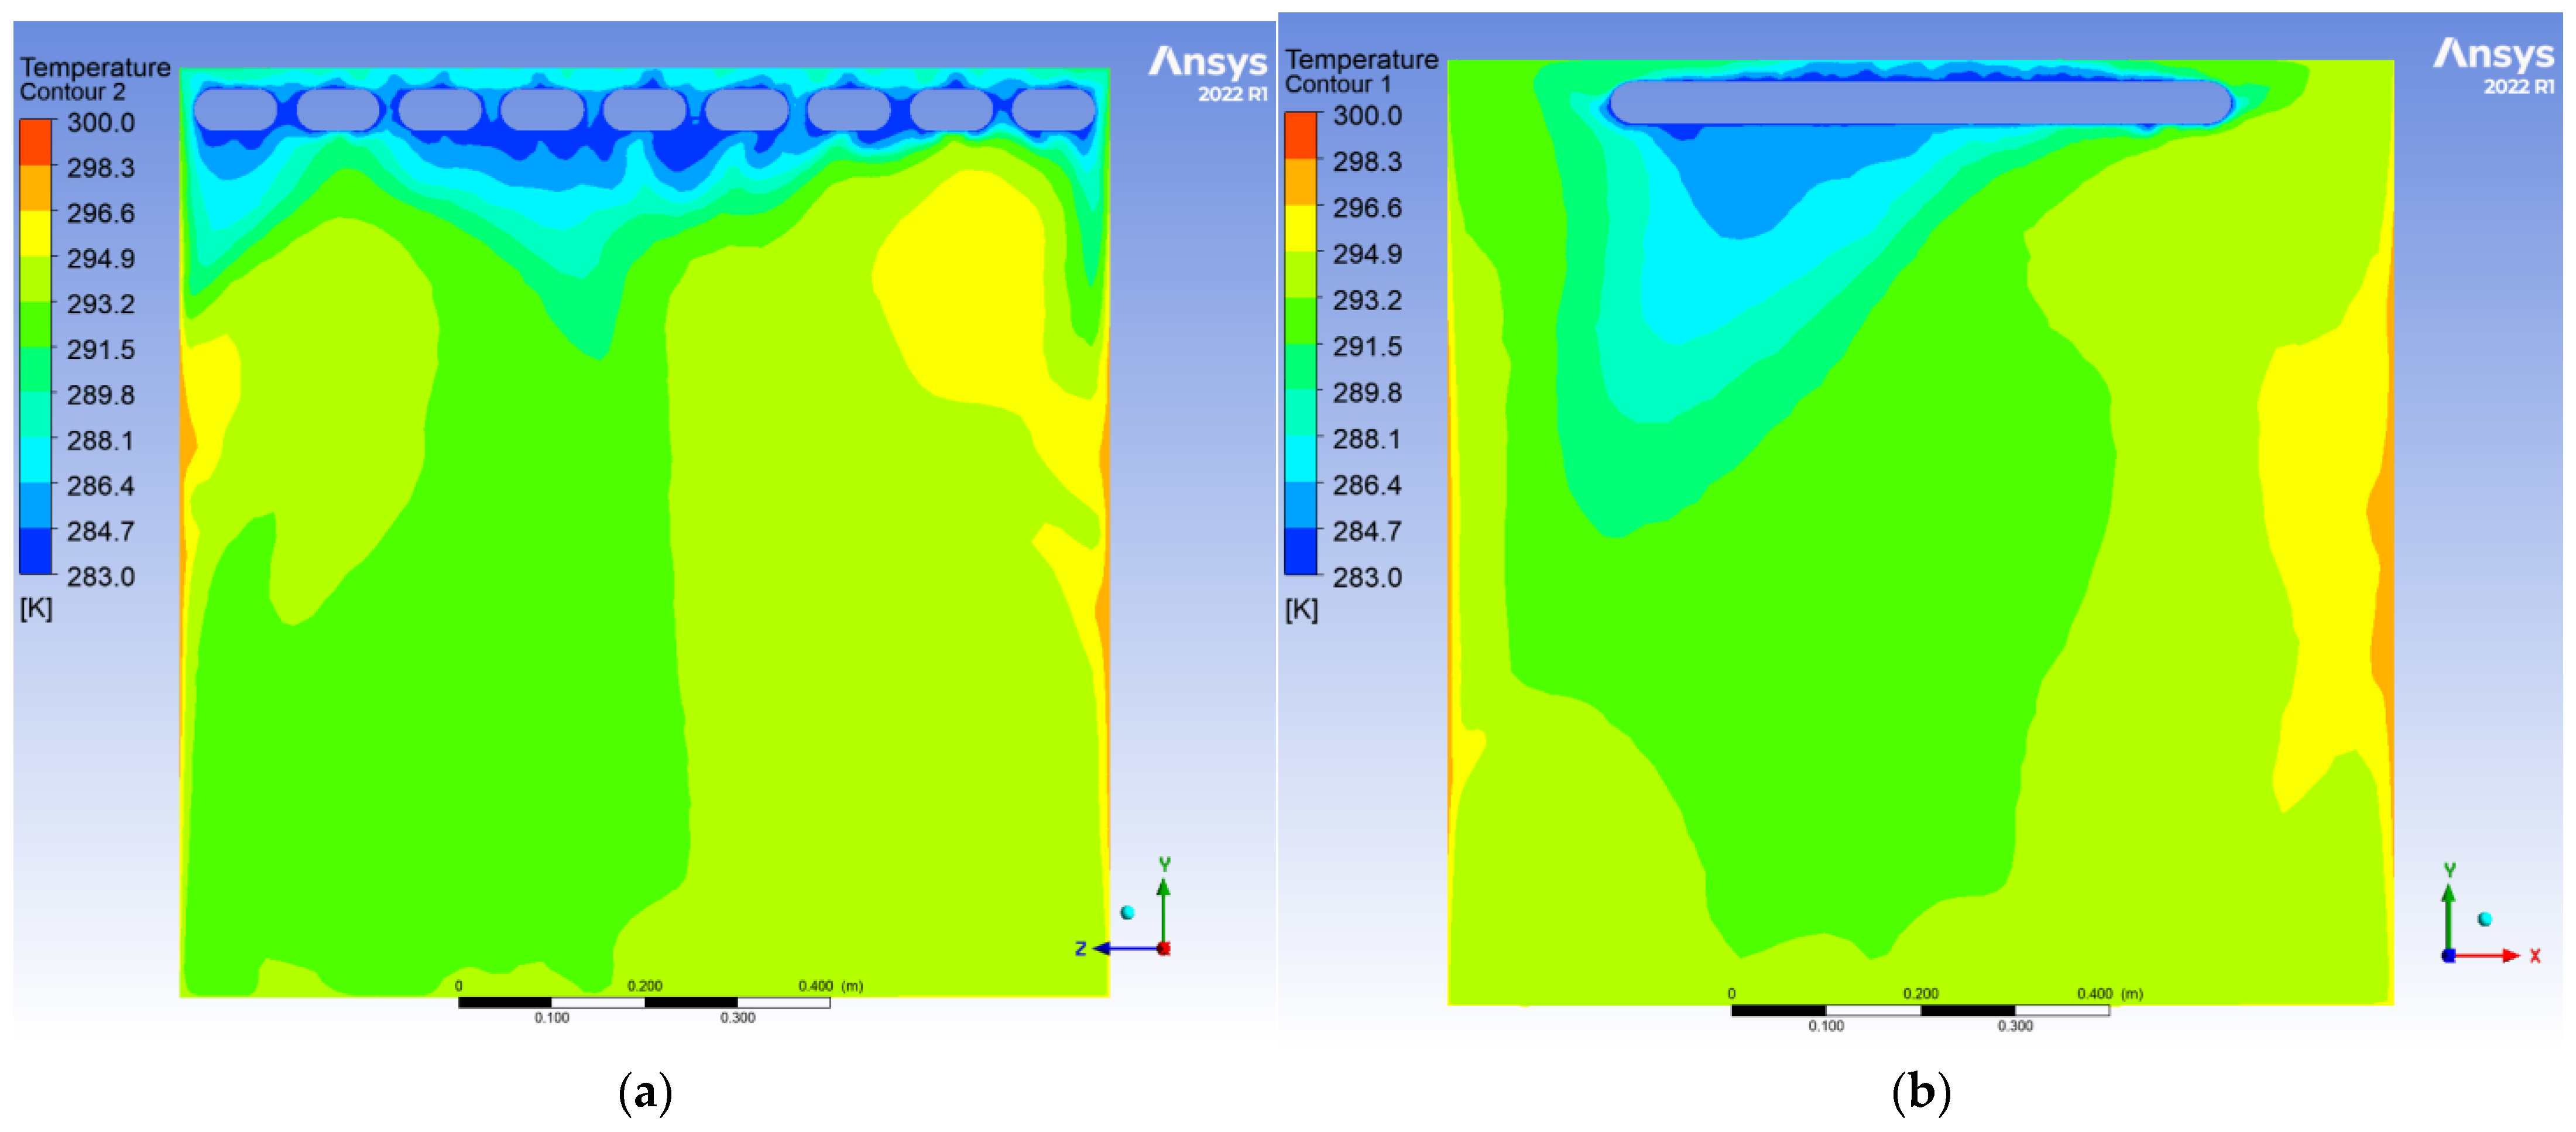
To evaluate the dynamic thermal regulation efficacy of the radiative cooling ceiling, this study employs a three-dimensional transient thermal model to document temperature field evolution from 0.5 to 10 h of operation on ZY and YX orthogonal observation cross-sections (labeled as Plane 1 and Plane 2, shown in
Figure 7,
Figure 8,
Figure 9,
Figure 10,
Figure 11 and
Figure 12).
During the initial phase, the cooling panel exhibited a radiant heat flux density of 750 W/m2, with the near-wall air layer temperature plunging to 283 K. A vertical temperature differential of 17 K emerged, where radiative heat transfer dominated over 60% of the thermal exchange. Cold air masses descended to a 0.25 m elevation, while the bottom thermal air maintained 300 K due to underdeveloped natural convection. The corner regions demonstrated enhanced heat transfer characteristics with a 1.6-fold increase in local Nusselt number (Nu) induced by horseshoe vortex structures (a U-shaped flow pattern formed around obstacles in turbulent boundary layers), accompanied by a 1.5 K temperature anomaly reduction, revealing transient-phase flow-enhanced heat transfer mechanisms.
After 10 h of operation, the system transitioned to a quasi-steady state: Radiative (55%) and convective (45%) heat transfer reached equilibrium, with the thermal stratification index Γ decreasing by 12.5% and temperature distribution linearization. A stable dual-vortex natural convection structure (Re = 4.5 × 10²) emerged, sustaining continuous thermal migration channels through wall-adjacent cold air descent. Corner temperature anomalies diminished to ΔT ≈ 0.3 K, demonstrating significant assimilation of local disturbances by primary vortex systems. The steady-state cooling power stabilized at 1.8 kW, achieving 57% energy savings compared to initial peak consumption, thereby validating the system’s operational efficiency in prolonged service.
4. Discussion
This study demonstrates the synergistic potential of integrating RCC with PCM thermal storage to enhance building energy efficiency. Experimental results confirmed that the glycerol–alcohol–water ternary PCM (Slushy Ice) exhibits optimal phase transition characteristics, with a latent heat capacity of 361.66 J/g and a phase change temperature of 1.91 °C, effectively preventing cooling water freezing. Numerical simulations revealed that the RCC system stabilized cooling power at 1.8 kW after 10 h, achieving 57% energy savings compared to initial peak consumption. The dual-vortex natural convection structure and reduced thermal stratification (Γ decreased by 12.5%) validated the system’s ability to maintain uniform indoor temperatures.
While the proposed system demonstrates efficacy in temperate climates, its adaptability to arid or tropical regions—characterized by extreme temperatures, high humidity, or intense solar radiation—remains unexplored. For instance, in arid climates, enhanced radiative cooling potential due to low atmospheric humidity may improve performance, whereas in tropical regions, high ambient humidity could suppress radiative heat dissipation, necessitating material or structural optimizations [
17].
Future research should focus on advanced encapsulation techniques, multi-physics coupling simulations, thermal response coordination through coil structure optimization or nanocoating-enhanced heat transfer (while phase change material cold storage batteries can partially mitigate the thermal response mismatch between RCC and PCM, systematic optimization remains essential), and life cycle assessments to optimize system robustness and cost-effectiveness. The proposed RCC-PCM hybrid system offers a promising solution for sustainable building cooling, bridging the gap between renewable energy utilization and thermal comfort requirements.


