Abstract
To research a transformer’s vibration characteristics, a simulation and an experiment are conducted on a 10 kV transformer. The theoretical model for core and winding vibration is established. The electric–magnetic–mechanic multi-physical field coupling model for the transformer core and winding is constructed, yielding voltage and current waveform and magnetic field distributions. The simulation results show that the amplitude of the main flux for core is 1.79 T, the amplitude of vibration acceleration for core is 0.005 m/s2, the magnetic flux leakage is 0.31 T, the amplitude of the vibration acceleration on the side of the winding is 0.0795 m/s2, and the amplitude of vibration acceleration on the front midpoint of winding is 0.0387 m/s2. The transformer vibration experimental platform is constructed, and no-load and load tests are conducted. Empirical findings demonstrate that the acceleration of core vibration is 0.0047 m/s2, and the simulation deviation is 6.38%. The maximum winding vibration acceleration at the side midpoint of phase A is 0.0714 m/s2, and at the front midpoint of Phase B is 0.0416 m/s2. Compared with experiment results, the simulation deviations are 2.1% and 3.3%, respectively. These conclusions indicate an alignment between the experiment and simulation results, thereby confirming reliability of the methodology.
1. Introduction
Transformers are core equipment in power systems and play a crucial role in power operations. Their vibration characteristics directly affect equipment lifespan and grid reliability. Failures in transformers frequently cause power disruptions, underscoring the importance of giving top priority to transformer fault detection and research [1]. As crucial components of transformers, the core and winding are indispensable for ensuring their safe and stable operation, which in turn affects the overall stability of the power grid [2,3,4]. According to the International Electrotechnical Commission’s statistics on power equipment failures (IEC 2022), approximately 32% of transformer faults are caused by abnormal vibrations resulting from the core magnetostriction or electromagnetic forces on windings, leading to insulation deterioration or even short circuits. Therefore, monitoring the vibration signals of transformers has emerged as a fundamental aspect of their maintenance and overhaul procedures, enabling the accurate assessments of their operational status [5].
Many scholars have achieved considerable advancements in transformer winding and iron core research. Liu et al. developed a vibration signal diagnosis system based on deep learning, achieving a 95% fault classification accuracy through a convolutional neural network (CNN). However, it relies on a large amount of labeled data (annotated with specific fault types for supervised training), which requires extensive manual effort. At the same time, it cannot explain the physical mechanism of vibration harmonics [6]. Furthermore, a prototype with diverse clamped iron cores was employed for experimental validation by Moses. Vibration data were gathered using a laser scanning vibrometer, while sound field data were collected through noise recording techniques. The collected test results were thoroughly analyzed and summarized to identify distinct patterns in the study of [7]. Chen Cao developed a multi-physics coupling model of transformer winding vibration incorporating electrical, magnetic, and structural fields. Experimental tests were conducted on windings with loosened and deformational faults. The short-circuit reactance and vibration characteristics of the transformer were calculated, and the winding condition was diagnosed based on the complementary ensemble empirical mode decomposition (CEEMD) energy transformation method [8]. In reference [9], Zhou et al. proposed a real-time vibration monitoring framework based on edge computing, which shortened the simulation time to within 10 min through a reduced-order model (ROM). However, this model did not integrate multi-physics coupling effects, which limited its dynamic load adaptability. Zhang et al. achieved a high-precision diagnosis of winding faults by using a CNN-LSTM hybrid model, but they lacked an explanation of the physical mechanism of vibration [10]. Meanwhile, researchers Chen Cao and colleagues proposed a comprehensive monitoring approach for detecting subtle loosening and deformation faults in transformer windings, leveraging both vibration and reactance information. They verified the precision of this method through prototype testing, contributing to the advancement of multi-information monitoring technology [11]. In conclusion, although some progress has been made in this field, further research is still needed on multi-field coupling models based on electricity, magnetism, structure, force, and vibration, as well as on the study of magnetostrictive properties of the core and vibration tests of the core and windings under different operating conditions to investigate the vibration characteristics of transformers. Therefore, this paper provides theoretical support for the study of future research on the fault detection of abnormal vibration through research on theoretical models, multi-physical field simulation calculations of transformers, as well as no-load and load experiments.
To research the transformer vibration characteristics, this paper adopts an oil-immersed transformer with a voltage rating of 10 kV as the subject of investigation and employs the finite element method for electric–magnetic–mechanic multi-physical field coupling to perform simulation analysis and experimental testing. Firstly, the theoretical model for transformer core and winding vibration is established. Secondly, the simulation model for transformer core vibration is constructed. Subsequently, the simulation model for winding vibration is established, and electric–magnetic–mechanic simulation calculations are conducted, respectively. Finally, the 10 kV transformer undergoes no-load and load tests, with comparative analysis conducted on the vibration signals of core and winding to validate the accuracy of both theoretical research and simulation analysis. Table 1 summarizes the advantages and limitations of previous studies on transformer vibration analysis.

Table 1.
Advantages and limitations of previous studies.
2. Theoretical Model for Vibration Analysis of Transformer Core and Winding
2.1. Theoretical Model for Transformer Core Vibration
The vibration of windings and core is the main cause of the vibration of the transformer. This section aims to study the magnetostrictive vibration mechanism of the core, establish the theoretical model of the core’s magnetostriction, and derive the vibration formula. This will offer a theoretical foundation for constructing and simulating the vibration model of the core in the subsequent section. The transformer core generates magnetostrictive vibration in the alternating magnetic field. The external voltage, denoted as , is in accordance with the fundamental principles of electromagnetism [12,13,14,15].
In the given formula, N1 represents the number of turns in the coil, S signifies the cross-sectional area of the core, U0 represents the voltage amplitude, represents angular frequency, and B represents magnetic flux density. Equation (1) is derived from Faraday’s law of electromagnetic induction, a foundational principle in transformer analysis [12].
In the given formula, B0 represents the peak value of magnetic flux density in the core when subjected to sinusoidal excitation.
In the given formula, Hc represents the coercive force, and Bs stands for the saturation magnetic flux density. Equation (3) defines the relationship between magnetic field intensity H and flux density B, incorporating the nonlinear B-H curve of silicon steel. This formulation aligns with classical treatments of ferromagnetic materials [16].
The deformation situation of the iron core under the action of magnetic field can be described as follows:
Equation (4) describes the magnetostrictive strain rate of the iron core under a magnetic field. In the formula, , is the saturation magnetostrictive change rate, represents the increment of the iron core, and L is the original length of the iron core [16].
The process for deriving the magnetostrictive strain rate and the vibration acceleration of the iron core is presented as follows:
Equation (5) integrates Equation (4) to derive the total magnetostrictive strain. In the given formula, the term represents the magnetostrictive change rate [6].
The term ac represents the vibration acceleration of core. Based on the aforementioned equation, the amplitude of the vibration acceleration of the transformer core is directly proportional to the square of the input voltage amplitude [16,17,18]. It offers a theoretical foundation for the subsequent studies on the vibration characteristics of transformer cores.
2.2. Theoretical Model for Transformer Winding Vibration
This section aims to study the vibration mechanism of the windings, establish the theoretical model of the vibration of the windings and derive the vibration formulas. This provides theoretical support for the establishment and simulation calculation of the winding vibration simulation model in the subsequent part. The passage of current through the transformer winding generates the magnetic field and electromotive force. This will further generate the Lorentz force, which in turn produces vibration. The derivation builds upon the classical Lorentz force model [19] and equivalent mass-spring-damper systems, extended here to incorporate multi-turn coupling effects. Key equations (e.g., Equations (10)–(13) are original adaptations, while Equation (8) follows the standard Biot-Savart formulation [20]. The derivation of the formula for winding vibration is as follows:
According to Ampere’s Law and the theory of Lorentz Force, the current passing through the winding part of the transformer is as follows [19]:
Magnetic flux density at a fixed location for the conductor is given by the following:
For a fixed point, represents the vacuum permeability, while it is the only variable quantity, all other parameters remain constant, and, so, the magnetic leakage density Bt can be equivalent to the following [20]:
The proportional coefficient of the two is represented by among them.
Based on the above derivation process, the axial electromagnetic force Fx and radial electromagnetic force Fz of the coil can be obtained according to the Lorentz force equation ().
The component forces are coupled and brought into the trigonometric transformation formula to obtain the winding of the electromagnetic force [21]:
The angular frequency, denoted as ω, and the radius of the winding, represented by R, are key parameters in this context. It can be deduced that the electromagnetic force is directly proportional to the square of the current in winding.
The current passing through the transformer winding produces a periodic vibration signal within the leakage field. This signal is then transmitted to the enclosure wall and other areas via the liquid cooling medium and solid connections. By considering factors such as circuitry, magnetic fields, coil structure, insulation stiffness coefficient, dielectric damping, etc., and coupling them together, the equivalent mathematical equation for the vibration of the winding can be derived based on its structural characteristics [22].
In this equation, i = 1, 2, …, n, i denotes the turn number. Fi represents the axial electromagnetic force exerted on the i-th turn. Si indicates how much each specific winding element vibrates compared to its original placement. K1 and K2 represent equivalent stiffness coefficients for insulating materials located at both ends of transformer coils near their attachment points on iron core clamps. Meanwhile, K3 serves as an equivalent stiffness coefficient specifically designed for insulation between turns within these coils themselves. Additionally, C1 symbolizes a damping coefficient that accounts for cooling mediums present between winding during operation. The variable m denotes mass per turn within each individual winding, while I corresponds to coil current flowing through them accordingly. Lastly, k acts as a proportional coefficient relating electric forces exerted on each coil with respect to their respective currents passing through them.
The aforementioned formula is both equivalent and simplified, and the general equation can be obtained by aggregating the constituent equations [23,24].
The equation is defined as , where K represents the cumulative stiffness coefficient resulting from the end compression forces acting on both ends of the insulation material of the transformer coil. S indicates axial displacement caused by vibration in relation to transformer reactance. F represents total electric force experienced by winding along its axial height with respect to transformer reactance. M signifies the overall mass of winding and can be calculated using . By simplifying and solving Equation (14), the general solution of the equation can be obtained as follows:
In the equation, A1 and θ are integration constants determined by the initial conditions of the equation. , , , .
By taking the derivative twice of the calculated displacement, the equation for the vibration of the winding can be solved as follows [25]:
From the analysis in this section, it can be inferred that the vibration acceleration of the winding is influenced by the load current. Based on Equations (7)–(18), the vibration of the transformer winding is directly proportional to the current squared. It provides a theoretical basis for the subsequent research on the vibration characteristics of transformer windings.
3. Simulation Model of Transformer Core and Winding Vibration Based on Multi-Physics Coupling
3.1. Simulation Analysis of Core Vibration Based on Multi-Physics Coupling
The S11-M-200/10 kV transformer is selected as the model for simulation analysis. Using the finite element software COMSOL 6.0, a simulation model of the transformer is established to calculate the vibration characteristics of the core and windings. In order to save computing time, the non-essential structural components such as the heat sinks, struts, and bolts of the transformer were ignored. Following the creation of the simplified three-dimensional transformer model, the material properties of the windings and core are specified in the simulation model based on the material parameters of the referenced transformer prototype. These material parameters are presented in Table 2.
Table 2.
Table of material parameter.
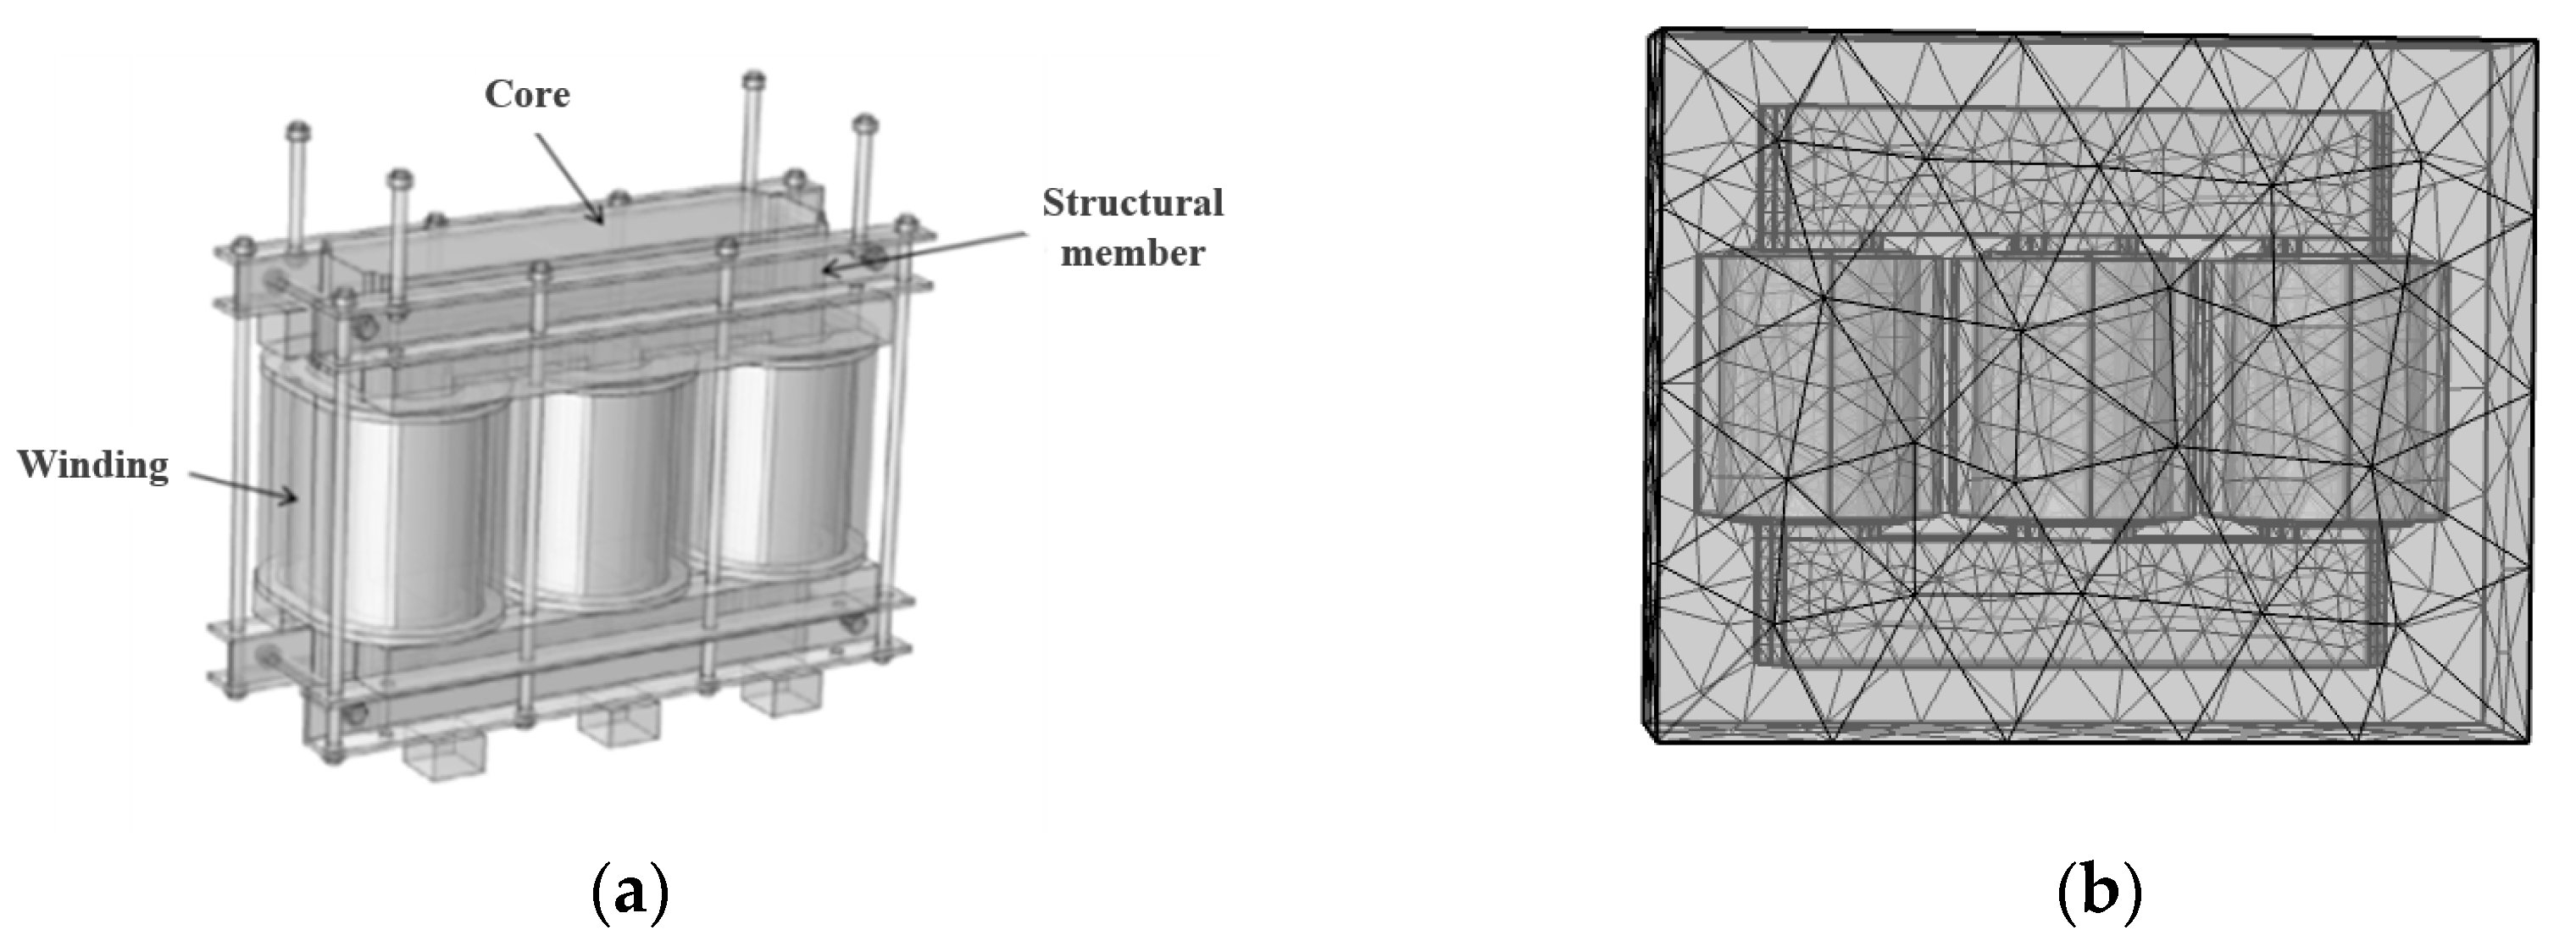
As a complex system, as shown in Figure 1a, the structure of the transformer is rather complex. It is necessary to set the boundary conditions to appropriately and reasonably simplify the transformer structure, so as to save the simulation computing time and achieve the goal of quickly conducting research on the coupling process of the transformer. The core of the transformer is reduced to five layers. The middle layer is the largest. The thickness of the laminations decreases towards both ends. The heat dissipation fins, support bars, and pressure plates, etc., which are not necessary structural components, are ignored. In actual operation, the pressure plates at the ends of the windings of a transformer are in a compressed state. The upper and lower yokes of the transformer core are fixed on both sides by solid clamping pieces, which are also in a compressed state. Therefore, the boundary conditions of the transformer body are set as the upper and lower end faces of the windings being fixed constraints, while the front and rear sides of the upper and lower yokes of the core are set as roller supports, which means that the normal acceleration of the surface is zero.
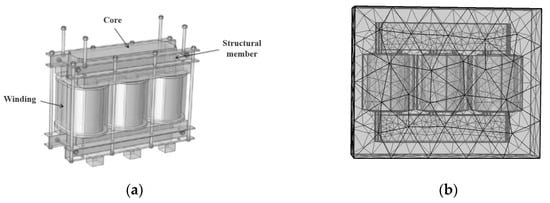
Figure 1.
(a) Model of transformer core. (b) Grid sectional drawing.
During the mesh generation process, an appropriate mesh refinement strategy is applied, where different domains are refined at varying levels depending on their importance. The iron core, windings, and oil tank of the transformer were refined with free tetrahedrons, while the air domain and other parts were coarsened. This approach ensures the accuracy of the calculations while maintaining mesh convergence, effectively accelerating the simulation process. Figure 1b presents the mesh refinement diagram.
The elastic modulus is the ratio of stress to strain within the elastic deformation stage of a material, characterizing its stiffness. The elastic modulus affects the amplitude of mechanical vibrations caused by electromagnetic forces. Poisson’s ratio is the ratio of the lateral strain to the axial strain of a material, reflecting the material’s lateral expansion characteristics when compressed. The larger the Poisson’s ratio, the more obvious the lateral expansion of the material under compression. Poisson’s ratio affects the stress distribution under complex loads. Conductivity refers to the extent to which a material can conduct electric current, and it is inversely related to resistivity. The higher the conductivity, the greater the eddy current generated in an alternating magnetic field, resulting in a significant increase in eddy current loss.
In the vibration part of the transformer core, the circuit connection mode is Yyn0. At this time, the high-voltage side of the transformer is open-circuited, while a sinusoidal voltage is applied to the low-voltage side of the transformer. In order to mitigate the impact of winding vibrations on the vibrations of the core, a no-load connection approach is adopted for specific sections of the entire circuit. The main parameter data of the transformer are shown in Table 3.
Table 3.
Transformer main parameters.
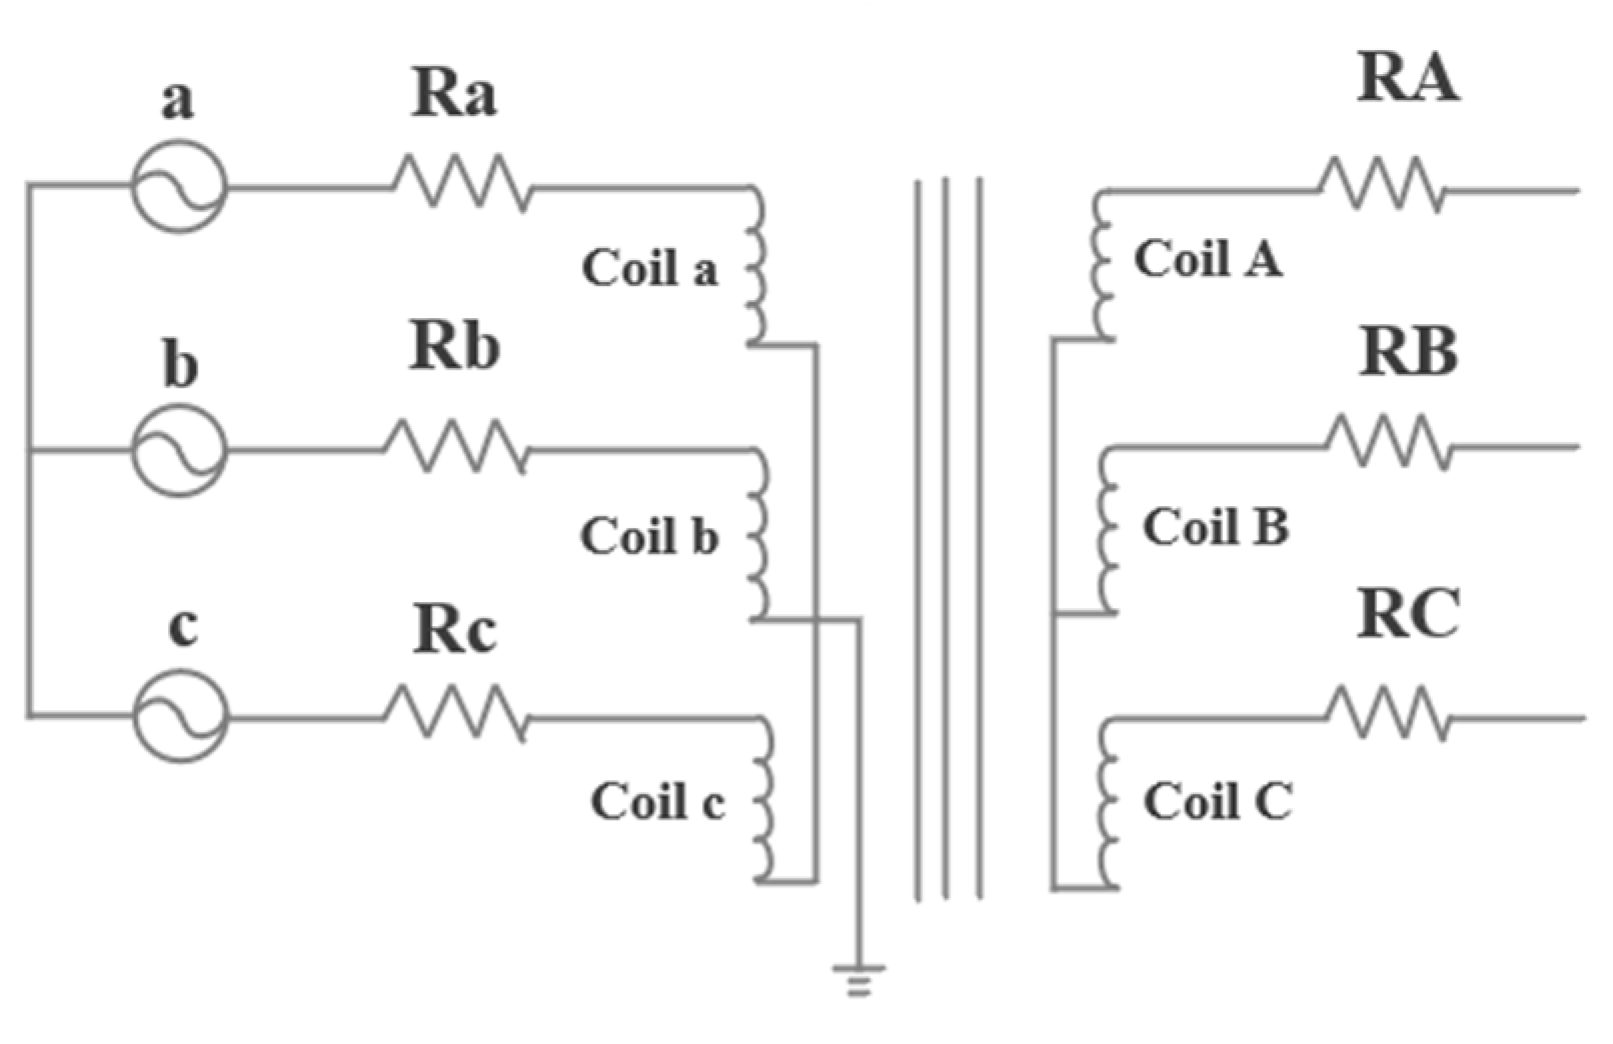
The connection group and wiring circuit diagram of the transformer during no-load operation are shown in Figure 2. After the structure of the transformer’s no-load circuit is established, a rated voltage of 400 V is input at the low-voltage side of the transformer to make the high-voltage side output a rated voltage, thereby keeping the transformer simulation in a no-load operation state. And, to eliminate inrush current effects, the simulation initialized the magnetic field with a steady-state solution at 50 Hz. Transient analysis began after five cycles (0.1 s), ensuring stable operation. Figure 3 illustrates the waveforms of both low and high voltages.

Figure 2.
Simulation circuit diagram for transformer under no-load condition.
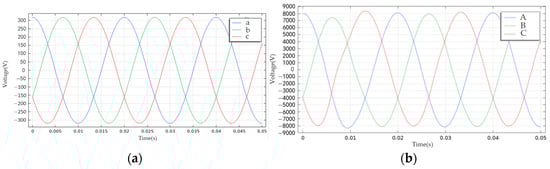
Figure 3.
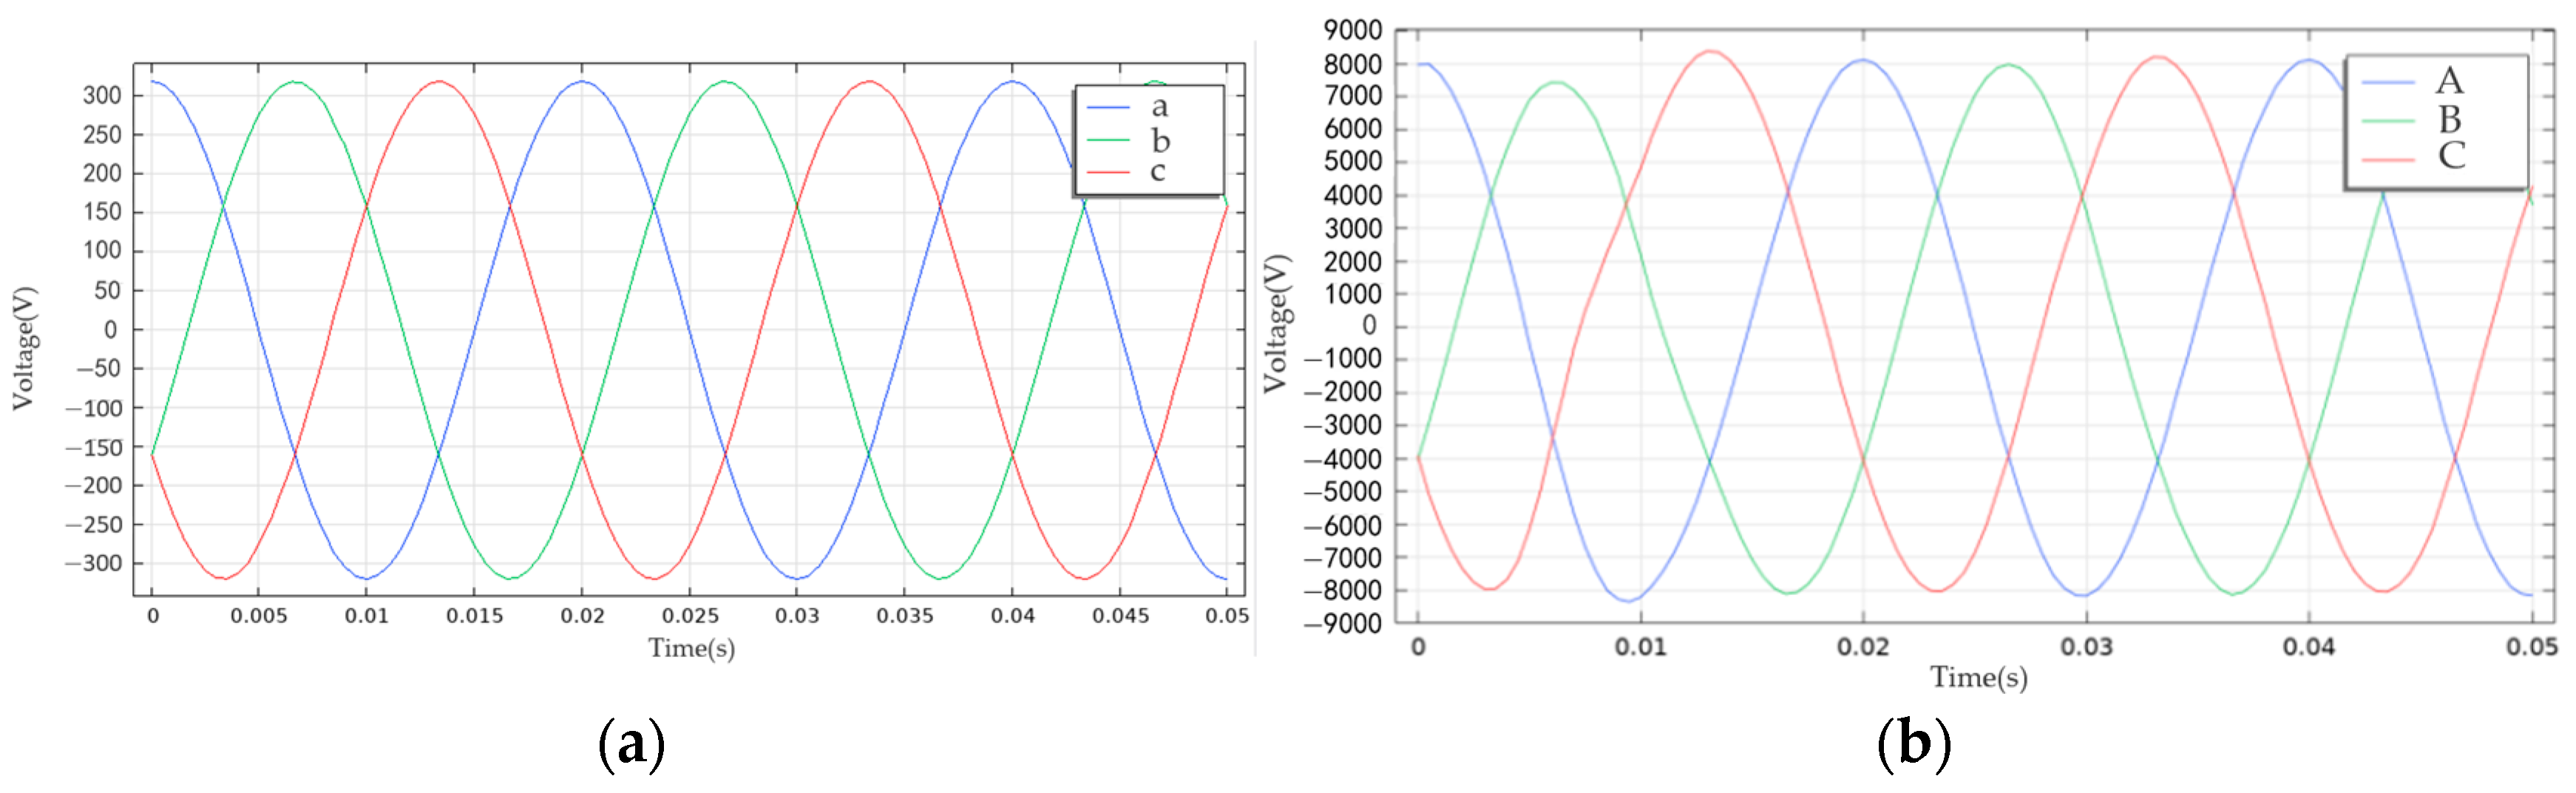
(a) Waveform diagram of phase voltage on the low-voltage side. (b) Waveform diagram of phase voltage on the high-voltage side.
As depicted in Figure 3a, the maximum amplitudes of the phase voltages for the a, b, and c three-phase windings on the low-voltage side of the transformer are approximately 325 V, 322 V, and 326 V, respectively. Since the amplitude of the phase voltage is times that of the effective value, it can be calculated that the corresponding effective values of the phase voltages of the three-phase windings are 229.8 V, 227.7 V, and 230.5 V, respectively. Also, since the line voltage is times that of the phase voltage, after calculation, the effective values of the line voltages on the low-voltage side of the corresponding three-phase windings can be obtained as 398 V, 394.4 V, and 399.2 V, respectively. The transformer nameplate indicates a nominal voltage of 400 V for its low-voltage side. Therefore, it can be seen that the obtained simulation results for the voltages of phases A, B, and C are the same as the parameters indicated on the transformer nameplate. This verifies the correctness of the simulation results.
Figure 3b presents the voltage conditions of the high-voltage windings of the transformer. Among them, the phase voltage amplitude of the A-phase high-voltage winding is 8134 V, that of the B-phase high-voltage winding is 7985 V, and that of the C-phase high-voltage winding is 8402 V. According to the parameters in Table 2, the standard amplitude of the phase voltage under no-load conditions should be 8164 V. The simulation results are relatively close to the actual standard value. Given the transformer ratio of 25:1, the simulation results align correctly with expectations.
After the simulation of the electric field part of the transformer was completed, the vibration condition of the transformer’s core is analyzed through the method of magnetic-force coupling, which involved the equations in Section 2.1. Equation (1) is used to calculate the induced magnetic flux density B under sinusoidal voltage excitation. Equation (5) is used to provide the magnetostrictive strain ε, mapped to structural deformation via the solid mechanic module. Equation (6) is used to directly input as the core vibration acceleration ac, linking magnetostriction to voltage amplitude. Figure 4 shows the magnetic field distribution of the transformer core.
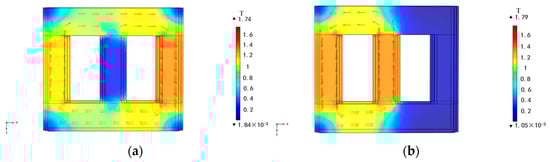
Figure 4.
(a) Distribution diagram of main magnetic flux density in a transformer core at 0.025 s, and the voltage reference corresponds to phase B, which crosses zero at t = 0. (b) Distribution diagram of main magnetic flux density in a transformer core at 0.035 s, and the voltage reference corresponds to phase B, which crosses zero at t = 0.
As depicted in the figure above, the peak value of the main magnetic flux density in the transformer core reaches 1.79 T, while the minimum value is T. The arrows shown in the figure represent the magnetization direction of the main magnetic flux density at various instants within the core. Additionally, the figure indicates that the maximum magnetic flux density of the transformer is predominantly concentrated in the core column. The upper and lower yokes are designed with a larger cross-sectional area than the core columns to reduce the magnetic flux density. According to the principles of electromagnetism, the magnetic flux density is always lower in the corners.
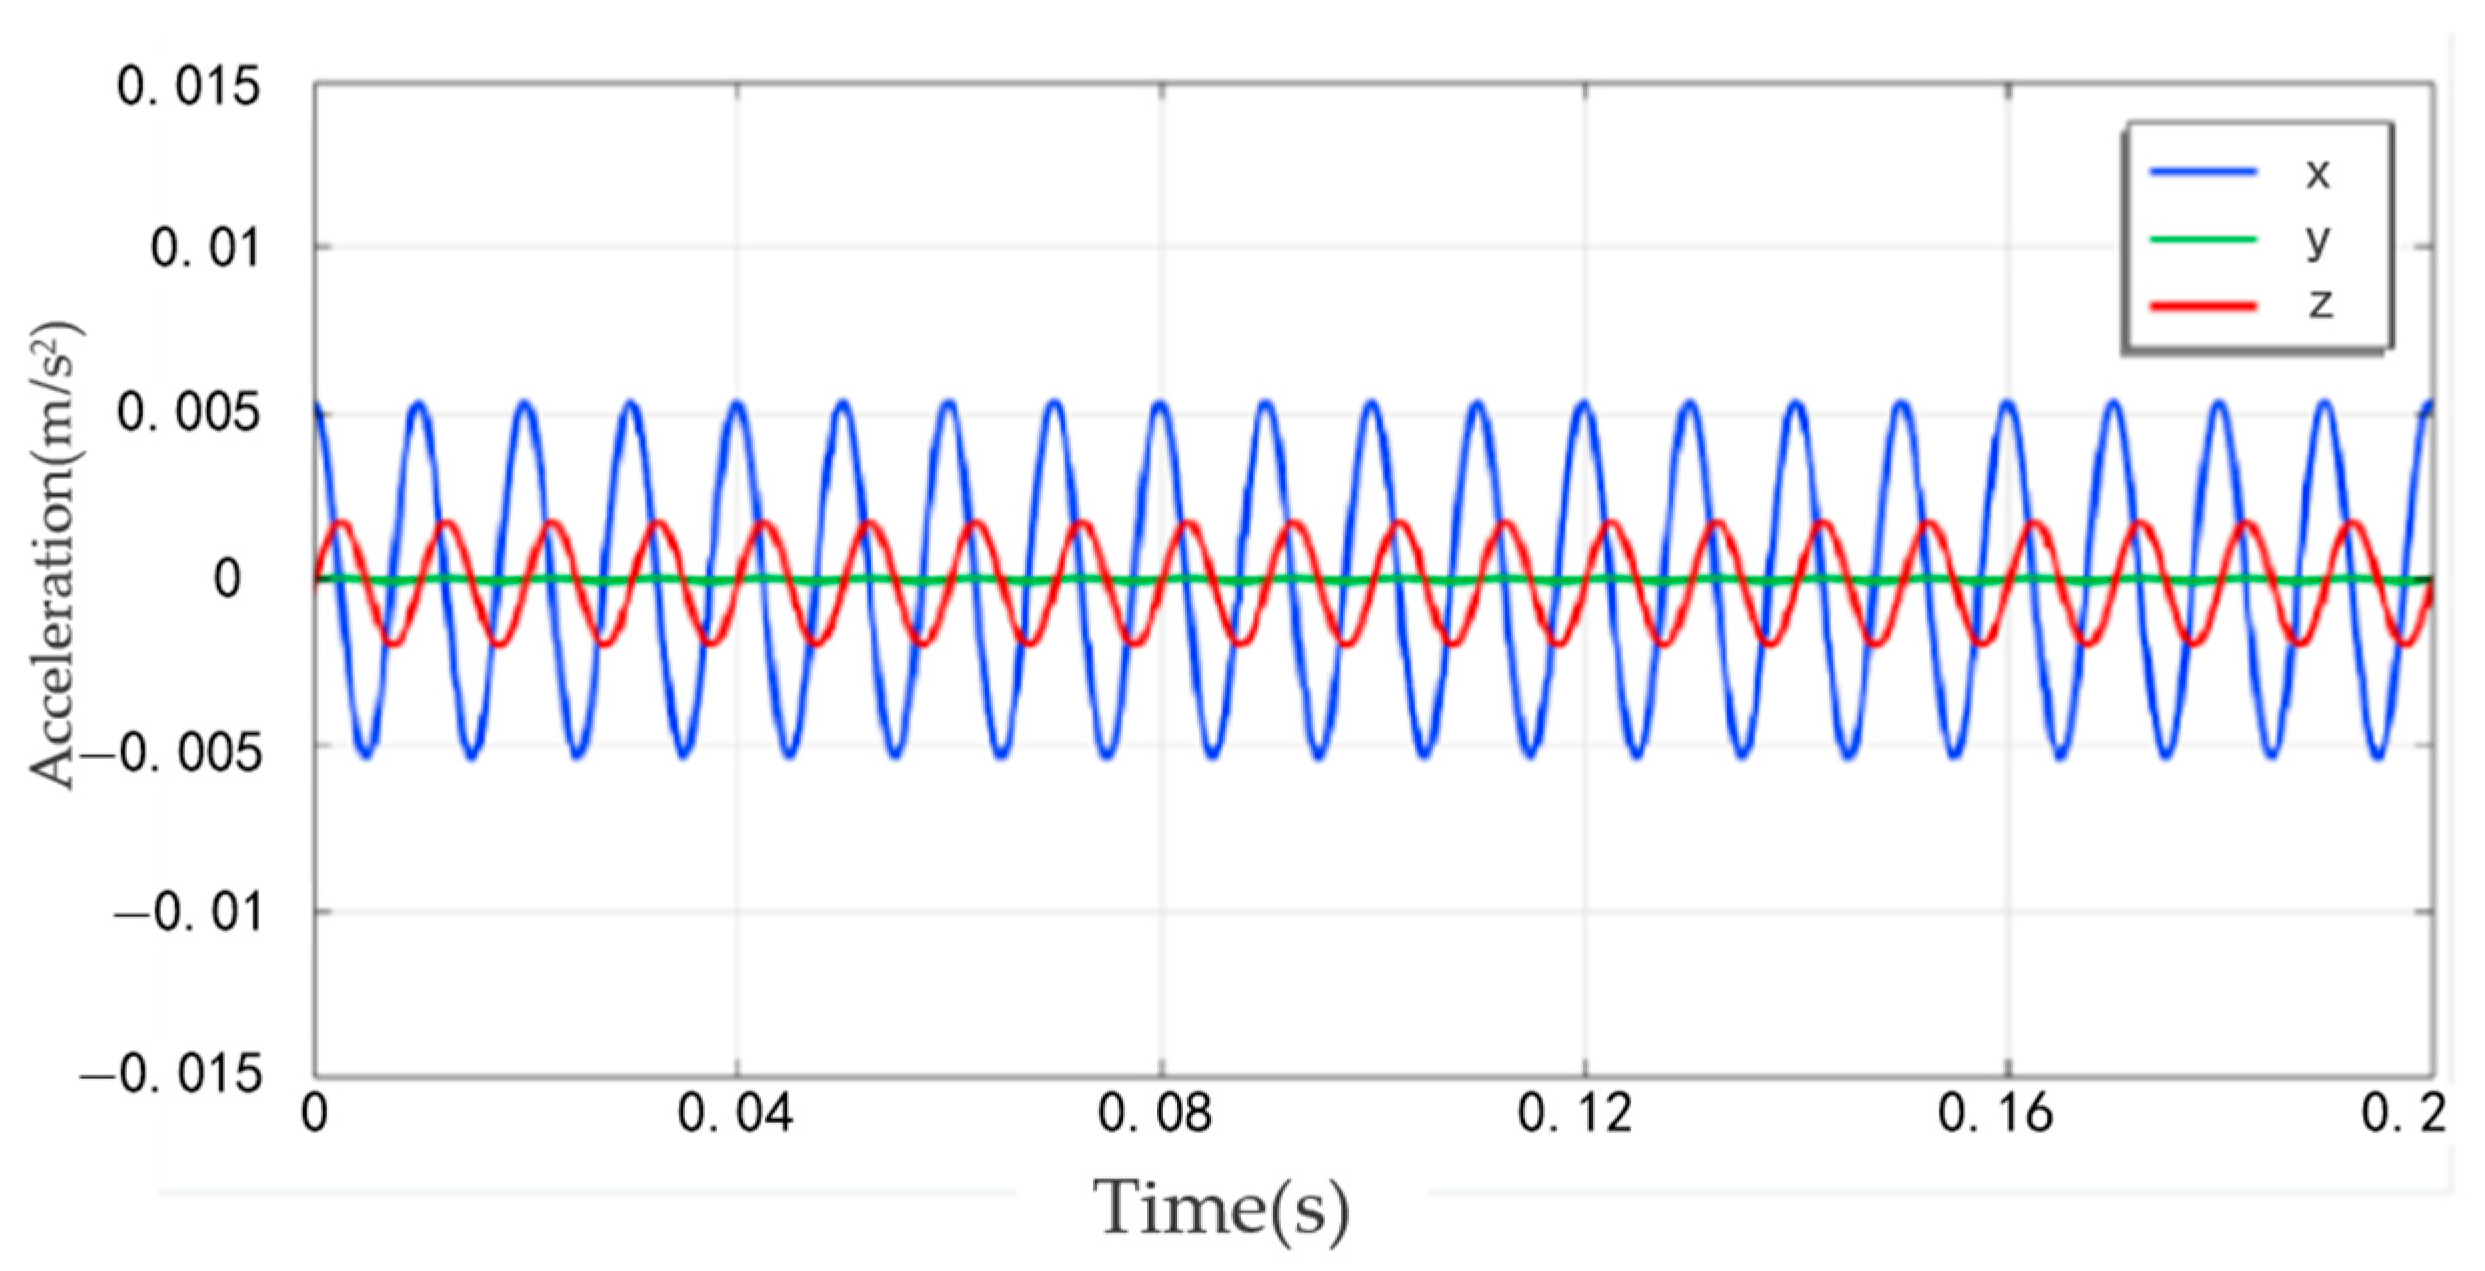
After completing the electromagnetic field simulation and solution, the vibration condition of the transformer core is analyzed. Because the core structure is symmetrical, the vibration condition can be analyzed at 1/2 of the middle core column of the transformer. As shown in Figure 5, in the figure, x represents the radial direction, y represents the axial direction, and z represents the tangential direction (perpendicular to the core column).
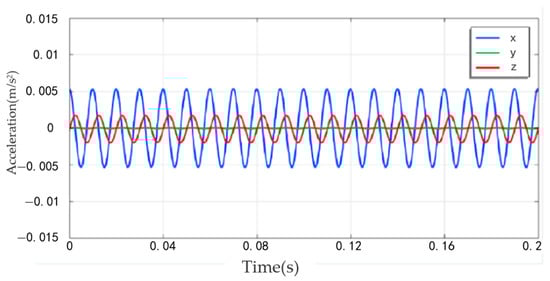
Figure 5.
Magnetostrictive vibration distribution of transformer core.
By analyzing the coupling of the electric, magnetic, and structural aspects of the transformer core, the vibration results were obtained. In this analysis, we disregard the influence of high-frequency vibrations on the transformer core vibration and instead focus on the primary vibration signal at 100 Hz, which represents the fundamental frequency vibration. Upon examining the vibration signal of the transformer core, it becomes apparent that the middle core column experiences a predominant acceleration of 0.005 m/s² at 100 Hz in both x and z directions, with minimal activity observed in the y direction. This indicates that volumetric magnetostrictive vibration has little influence, and the primary factors are the elongation and shortening in the z and x directions.
The diagram in Figure 6 illustrates the deformation of the transformer core, revealing a maximum displacement of mm. This displacement is indicative of the extent to which the transformer core has deformed; the displacement shape variable in the z direction is significantly greater than that in both the x and y directions. At the same time, it can also indicate the situation of magnetostrictive vibration of the iron core. The main manifestation is the elongation and shortening of the iron core along the z-axis and x-axis. However, the magnetostrictive vibration of the iron core along the y-axis caused by the deformation of the iron core in the y-axis direction is not obvious.
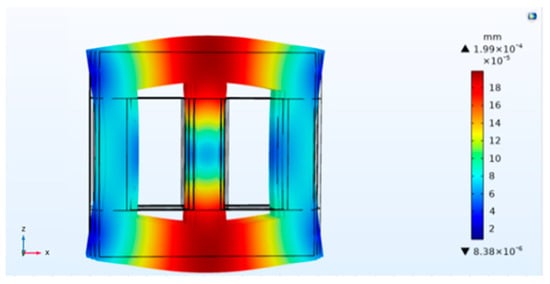
Figure 6.
Deformation diagram of a transformer.
3.2. Simulation Analysis of Winding Vibration Based on Multi-Physics Coupling
Furthermore, it highlights that the main magnetostrictive vibration of the transformer core is primarily associated with the expansion and contraction of ferromagnetic materials, especially along the z and x axes. In contrast, for simulating winding vibrations, a winding vibration simulation model consistent with load test conditions was developed. In this model, the secondary side of the transformer’s external circuit was short-circuited, while a voltage source was connected to the primary side. Due to the fact that the main flux density is very small under the operating condition of the transformer under load, and the winding voltage is extremely low, approaching zero, while the vibration of the core is proportional to the square of the winding voltage, the vibration of the core caused by magnetostriction due to the load can be neglected. Figure 7 illustrates the configuration of the short-circuit load circuit. Figure 8 presents the model of transformer windings.
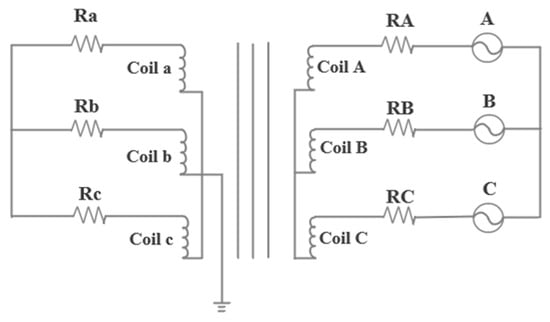
Figure 7.
Circuit diagram of the load.

Figure 8.
Model of transformer windings.
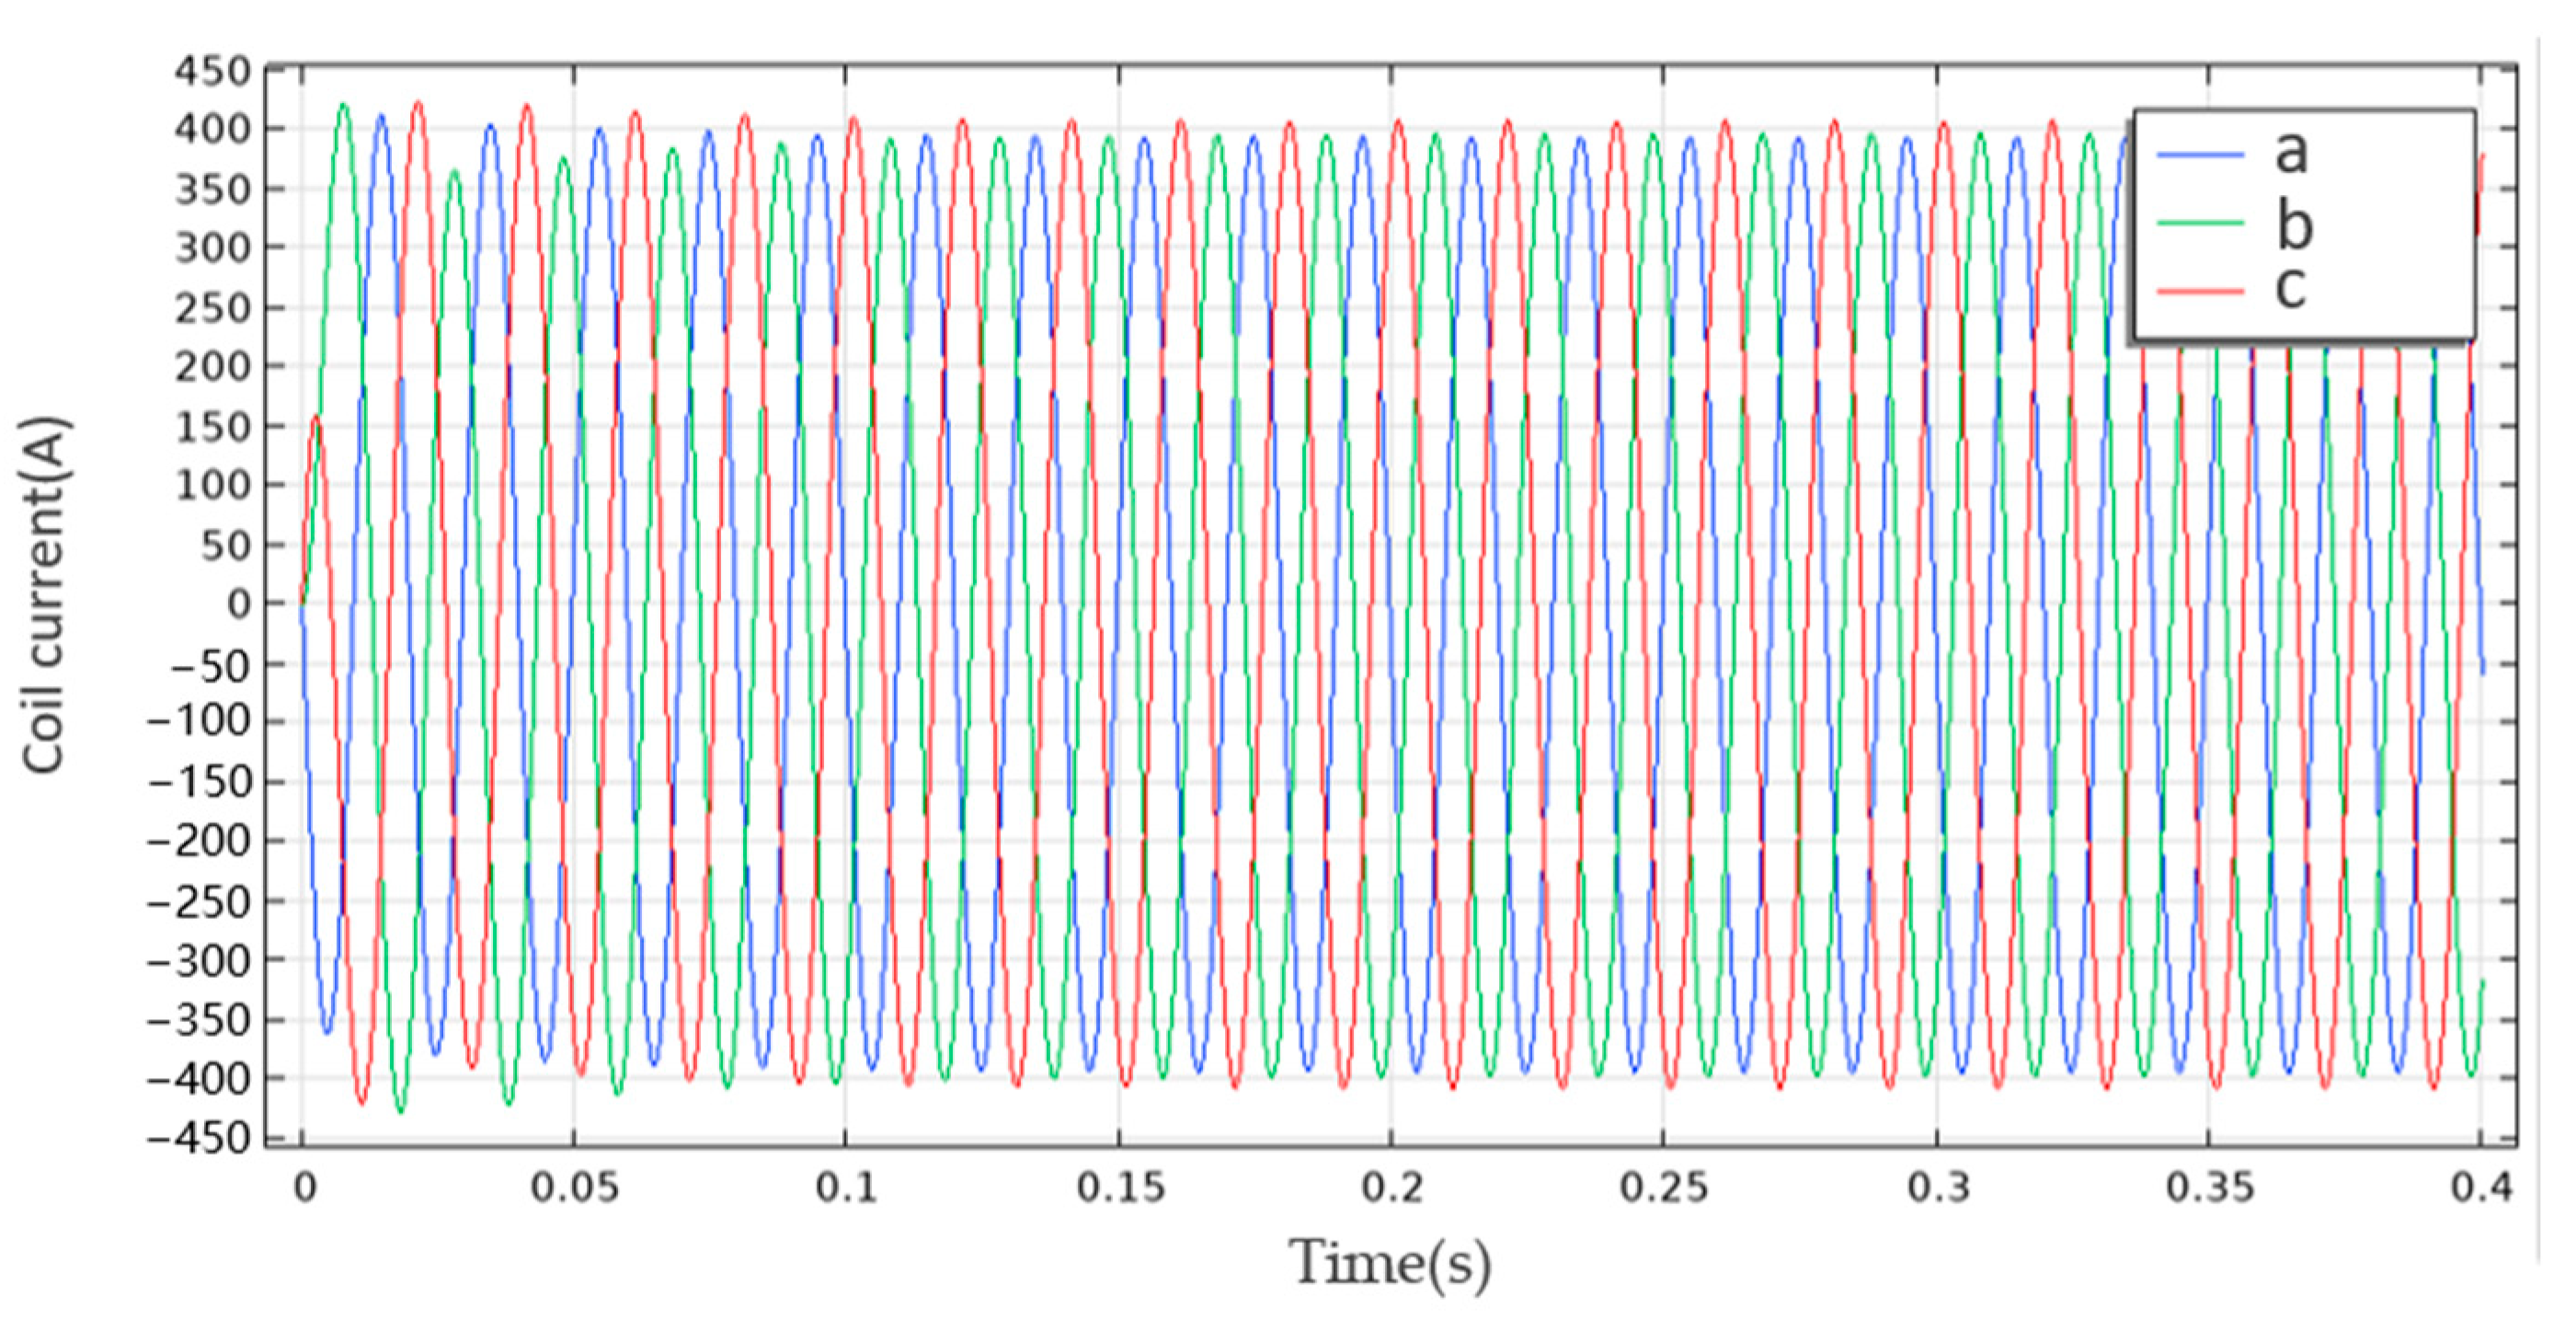
The simulation analysis results in the current distribution diagram shown in Figure 9, featuring a peak current of 400 A and an effective low-voltage current of 282.88 A. The secondary side current is compared with the rated current (288.7 A) specified on the transformer nameplate, and it is found that the two are very close, which confirms the accuracy of the simulation model.
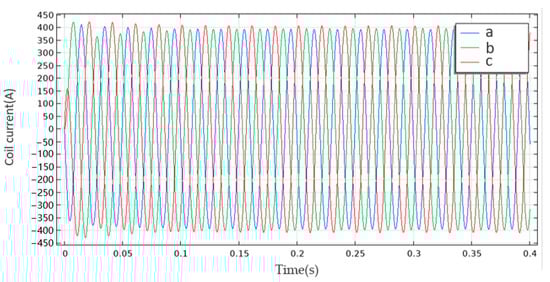
Figure 9.
Current on low-voltage side.
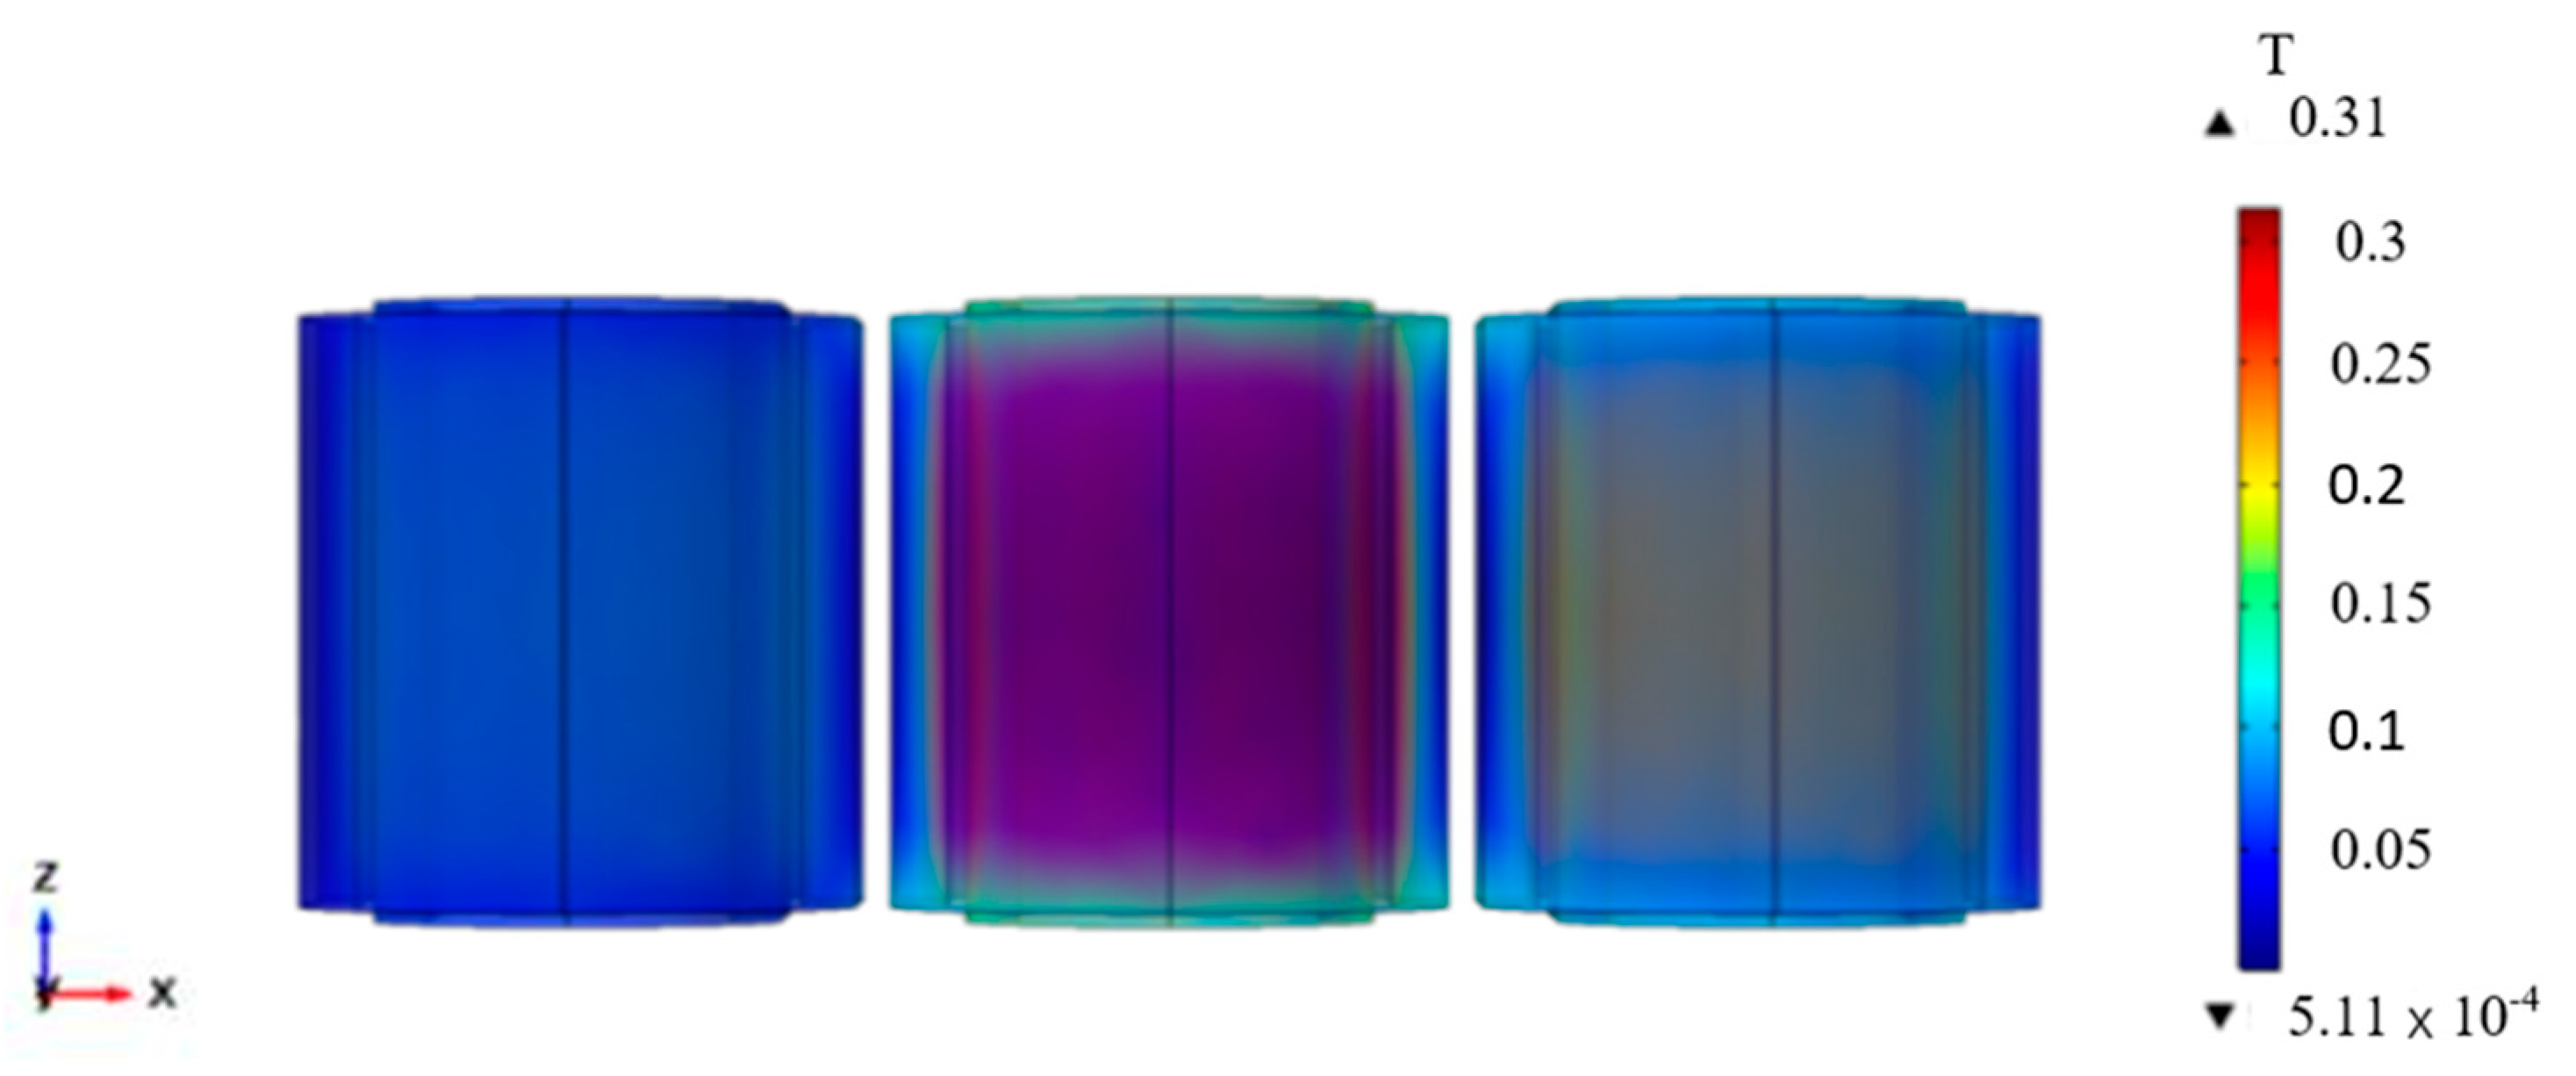
By solving the electromagnetic field simulation, the distribution of leakage flux in the windings can be obtained, as shown in Figure 10. The middle winding exhibits the highest leakage flux density (0.31 T). In contrast, the outer phases (A and C) experience reduced flux densities (0.15 T and 0.18 T, respectively). The simulation time corresponding to the current distribution of the magnetic field at this moment is 0.14 s. As shown in Figure 9, at this time, the current of the low-voltage winding of phase B is close to 390 A, that of phase A is close to 185 A, and that of phase C is close to 215 A. Since the current of phase B is the largest at this moment, the leakage magnetic flux of phase B is the greatest. Through the multi-physics field coupling calculation of electricity–magnetism–mechanics, the displacement variation distribution of the transformer windings can be obtained, as shown in Figure 11.

Figure 10.
Density of leakage magnetic flux.

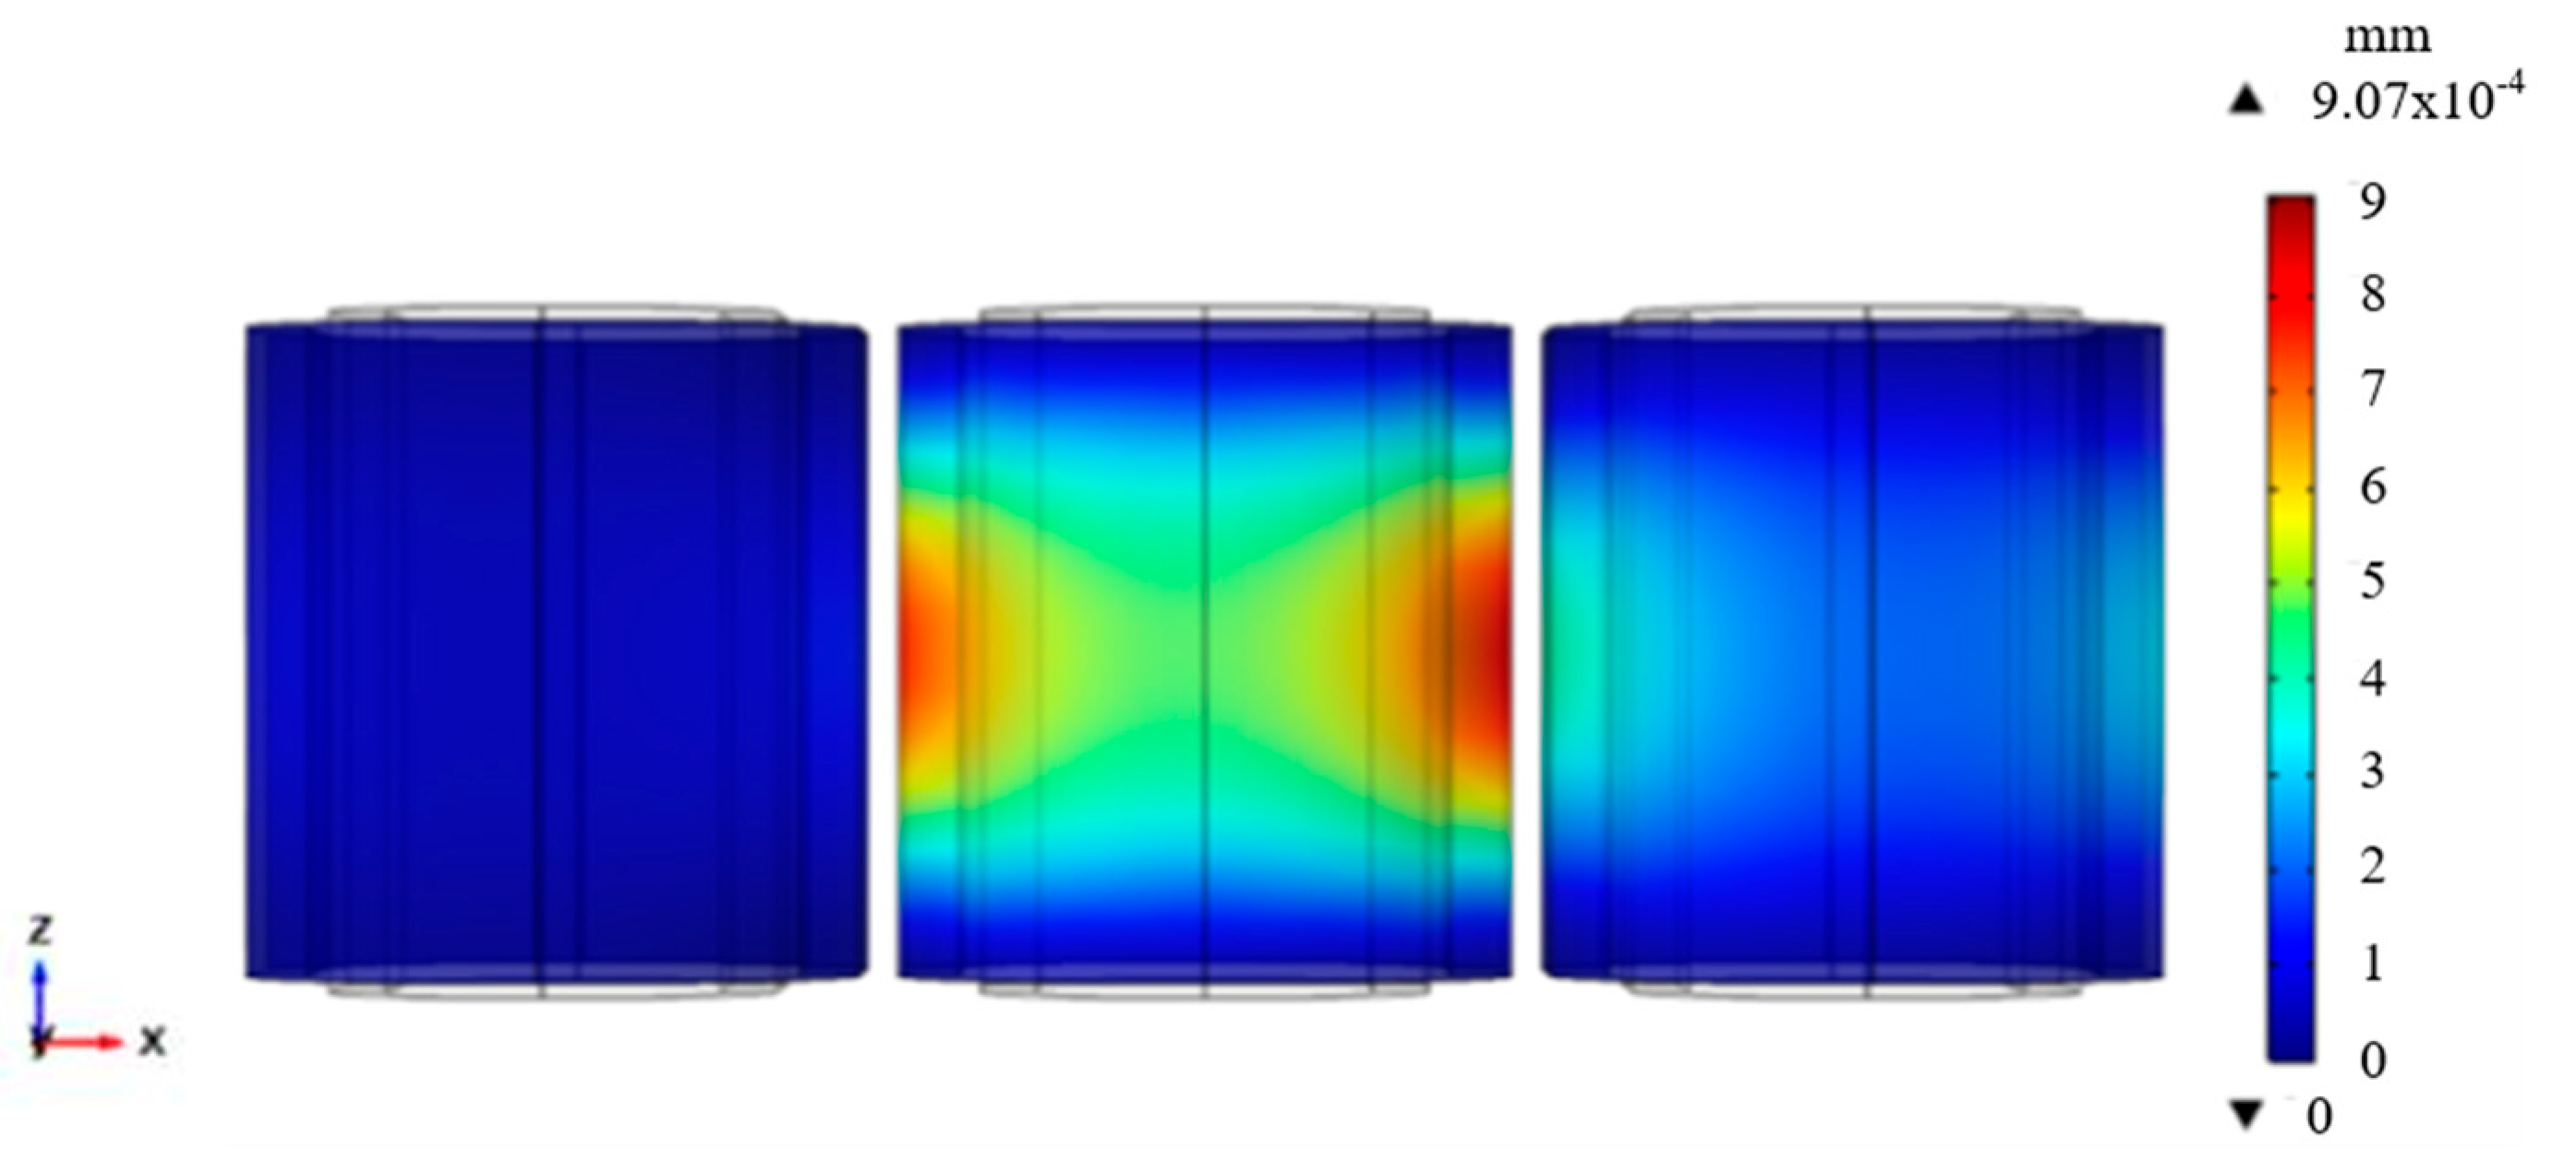
Figure 11.
Diagram of total winding displacement.
The winding vibration model integrates the following equations from Section 2.2. Equation (10) is used to define the axial (Fx) and radial (Fz) Lorentz forces, applied as distributed loads on the winding structure. Equation (14) is used to serve as the governing equation for multi-degree-of-freedom dynamics, with stiffness (K), damping (C), and mass (M) parameters derived from Table 2. Equation (18) is used to provide the final vibration acceleration a, validated against experimental results in Section 4.2. From the winding displacement diagram, it is evident that the maximum vibration displacement of the winding is mm, with the minimum displacement as 0. Additionally, the maximum vibration displacement on both sides of the winding is also mm. The smallest displacement of the windings is primarily located in the edge regions of the windings. Due to the effect of leakage flux, the leakage flux in the middle winding increases, resulting in the displacement of the middle winding being significantly larger than that of the windings on the other two sides.
The vibration of the winding can be broken down into movements in various directions, allowing for a clearer description of the winding’s vibration characteristics. The X direction represents the normal direction of the winding side, and the Y direction represents the normal direction of the winding front. The vibration distribution of the windings is shown in Figure 12 below.

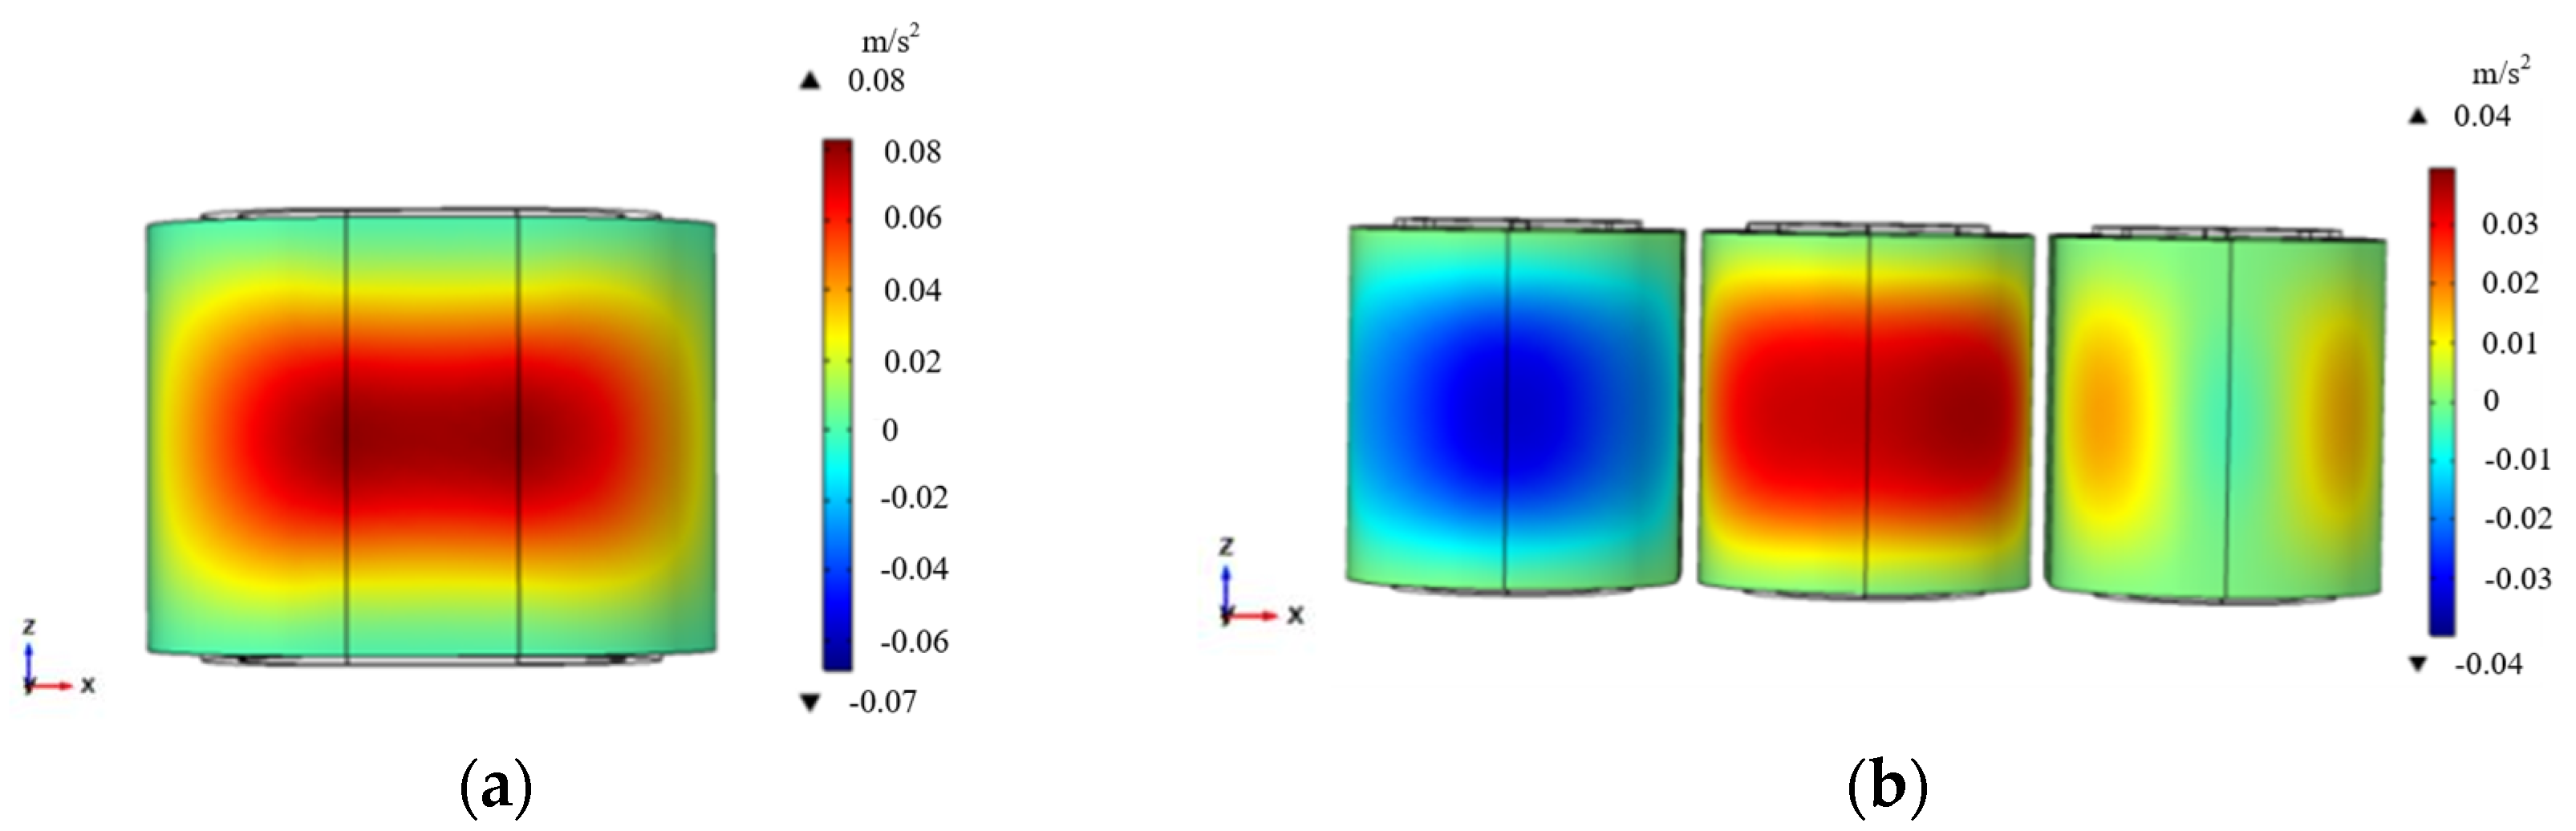
Figure 12.
(a) X-component of winding vibration acceleration. (b) Y-component of winding vibration acceleration.
In the vibration distribution map of the winding simulation, the duration is 0.04 s, and the step size is 0.0002 s. As shown in the figure above, the X-component of the radial vibration acceleration of the winding reaches its maximum value of 0.08006 m/s² at 0.015 s, while the Y-component of the surface acceleration of the winding achieves its peak value of 0.04246 m/s² at 0.007 s. The vibration pattern of the windings aligns with the distribution of the winding displacement. The slot structure of the windings makes the part close to the iron core column more severely vibrated. As can be seen from the above figure, the vibration of the transformer windings reaches its maximum value at the middle part of the windings and gradually decreases towards both ends.
4. Construction of Test Platform and Vibration Analysis of Transformer
4.1. Construction of No-Load Test Platform and Vibration Analysis of Transformer Core
To validate the simulation model’s predictive accuracy, a 10 kV-rated transformer prototype was developed, and a comprehensive experimental setup for acquiring vibration signals under no-load conditions was established. This setup comprises essential components like sensors, a data acquisition card, and a host computer, ensuring precise and comprehensive data collection. The vibration signals of the transformer core were tested under the experimental conditions of rated no-load voltage. During the no-load test, the high-voltage side was left disconnected, and a three-phase voltage was applied to the low-voltage side. The experimental transformer has a capacity of 200 kVA. During this experiment, the voltage is increased by adjusting the voltage regulator until the secondary-side voltage of the transformer reaches 400 V, and the primary-side voltage reaches its rated no-load voltage of 10 kV. At this point, the vibration signals at each measurement point on the surface of the transformer oil tank are recorded. During this procedure, the no-load current remains negligible, and any winding-induced vibrations are disregarded. Consequently, the vibration signals on the surface of the transformer oil tank are mainly caused by the magnetostriction of the iron core.
Firstly, the transformer body structure is lifted from inside the tank using a crane, and, then, the oil on the surface of the transformer body is drained. Afterwards, a test is performed on the iron core under no-load conditions. The structure of the transformer and the sensors are strategically positioned corresponding to phase A core post-upper yoke, phase B core post-upper yoke, phase C core post-upper yoke, phase A side position, and phase C side position, respectively. The actual wiring diagram and location of these arranged measuring points are illustrated in Figure 13 below. Once all these tasks are completed, and when the transformer reaches a safe and stable operating state, measurements for vibration in its core can be taken.

Figure 13.
No-load test platform for transformer core.
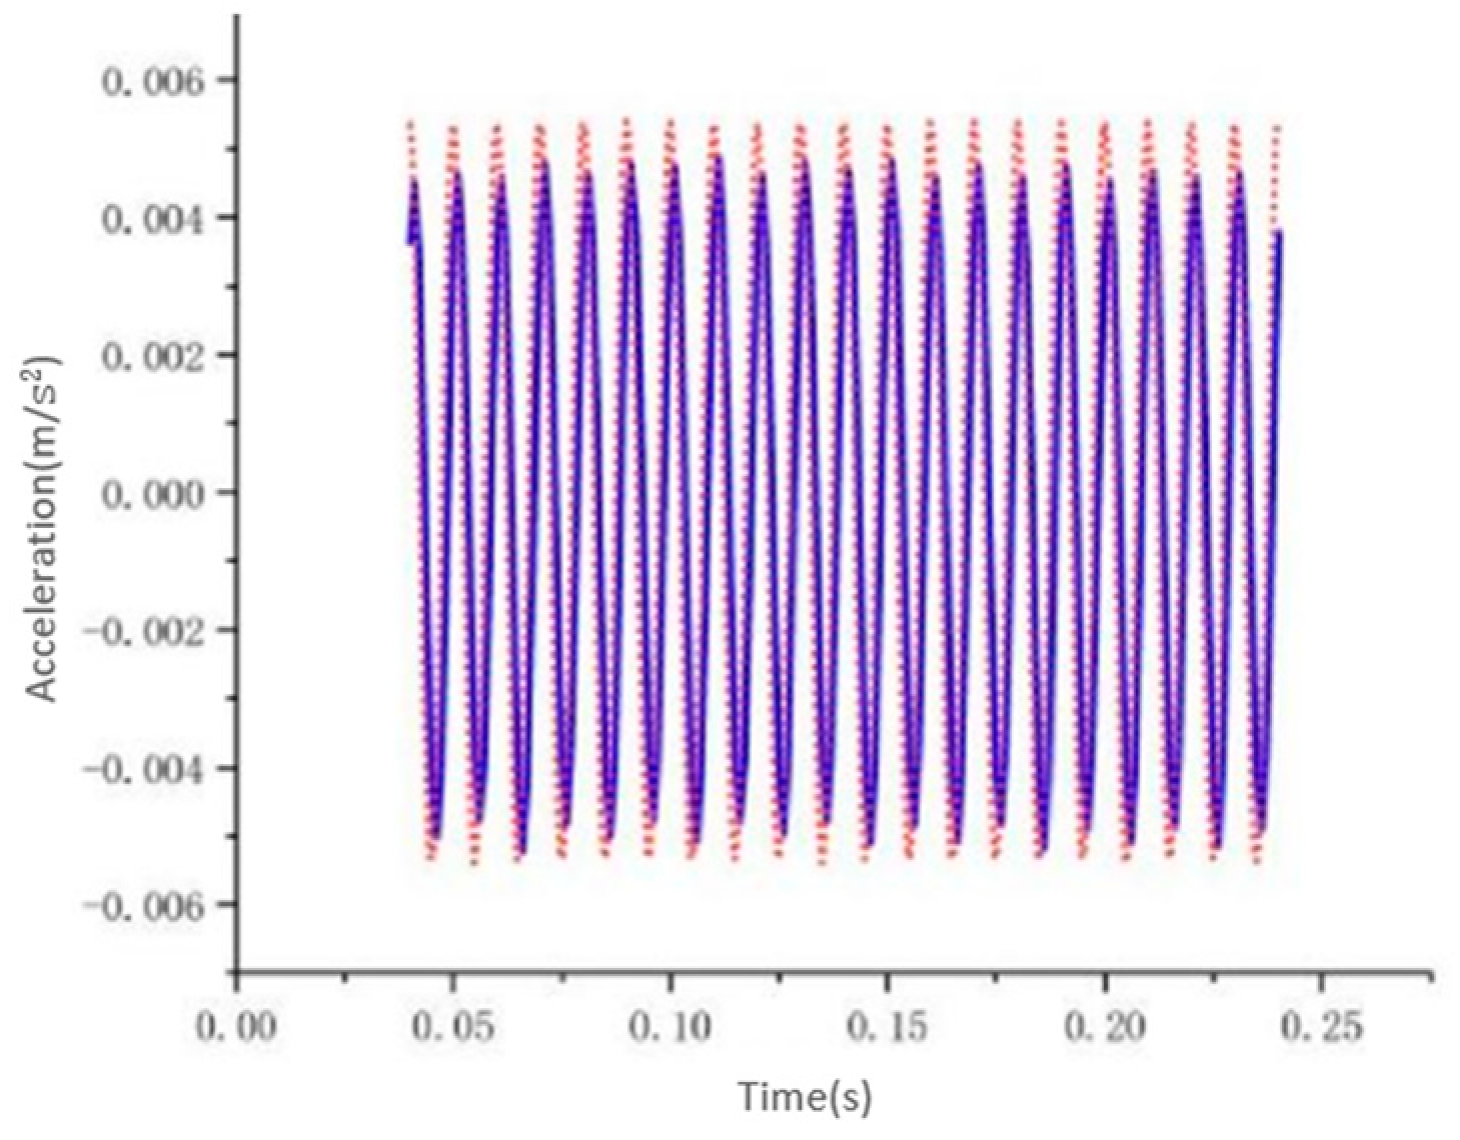
Through the establishment of the aforementioned testing platform, the vibration signal of the transformer core is measured, yielding the subsequent findings. In Figure 14, the FFT filtering technique is utilized to mitigate the impact of high-frequency signals, allowing for a concentration solely on vibrations occurring at 100 Hz. It can be observed from the graph that the maximum acceleration value amounts to 0.0047 m/s2. Despite actual transformer core vibrations affected by high-frequency signals, it remains evident that vibrations at 100 Hz prevail as the primary signal. The obtained test signal is then compared with a simulated signal, as depicted in Figure 15. The simulation results are compared with the experimental data. The simulated vibration acceleration is approximately 0.005 m/s2, while the experimental vibration acceleration measures 0.0047 m/s2, resulting in a discrepancy of 6.38%.
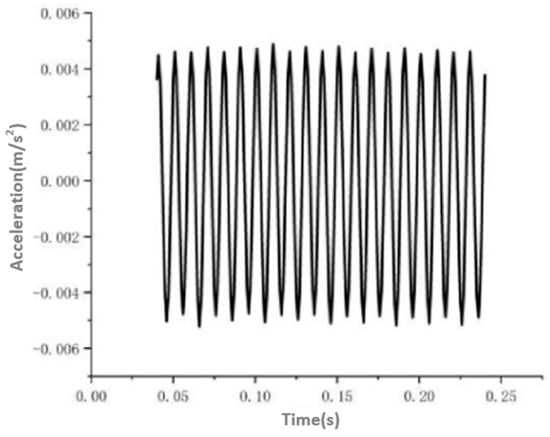
Figure 14.
Vibration signal graph of test.
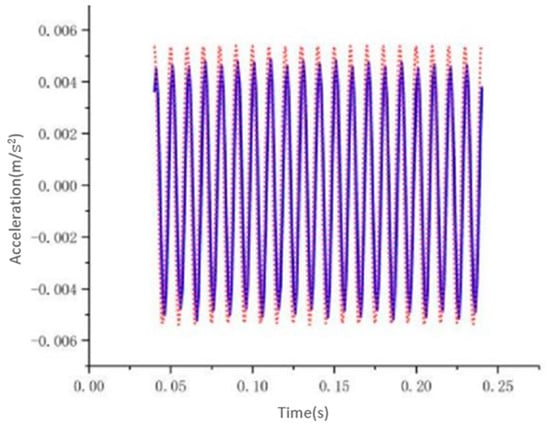
Figure 15.
Comparison chart of vibration simulation and test, and the blue line represents the experiment while the red line represents the simulation.
4.2. Construction of Load Test Platform and Vibration Analysis of Transformer Winding
In order to confirm the accuracy of the simulation model, a 10 kV-rated transformer prototype was developed, and a comprehensive experimental setup was designed and established for acquiring vibration signals during load operation. The experimental setup includes sensors, data acquisition cards, and host computers, ensuring precise and reliable experimental data. Measuring transformer winding vibrations differs from iron core vibration tests. The experimental transformer has a capacity of 200 kVA. In this experiment, the current was gradually increased by modifying the voltage regulator until the primary winding current of the transformer reached 11.55 A, at which point the secondary winding current reached the rated current of 288.7 A. During this experiment, vibration signals at the measurement points on the surface of the transformer’s oil tank were recorded under conditions of 25%, 50%, 75%, and 100% of the rated current. During the short-circuit test, a short circuit was induced on the low-voltage side, while a three-phase voltage was gradually applied to the high-voltage side until it attained its rated short-circuit level. Due to the substantial load currents (with negligible excitation currents), the primary source of vibrations in the transformer body was winding signals, with core magnetostriction causing insignificant vibrations.
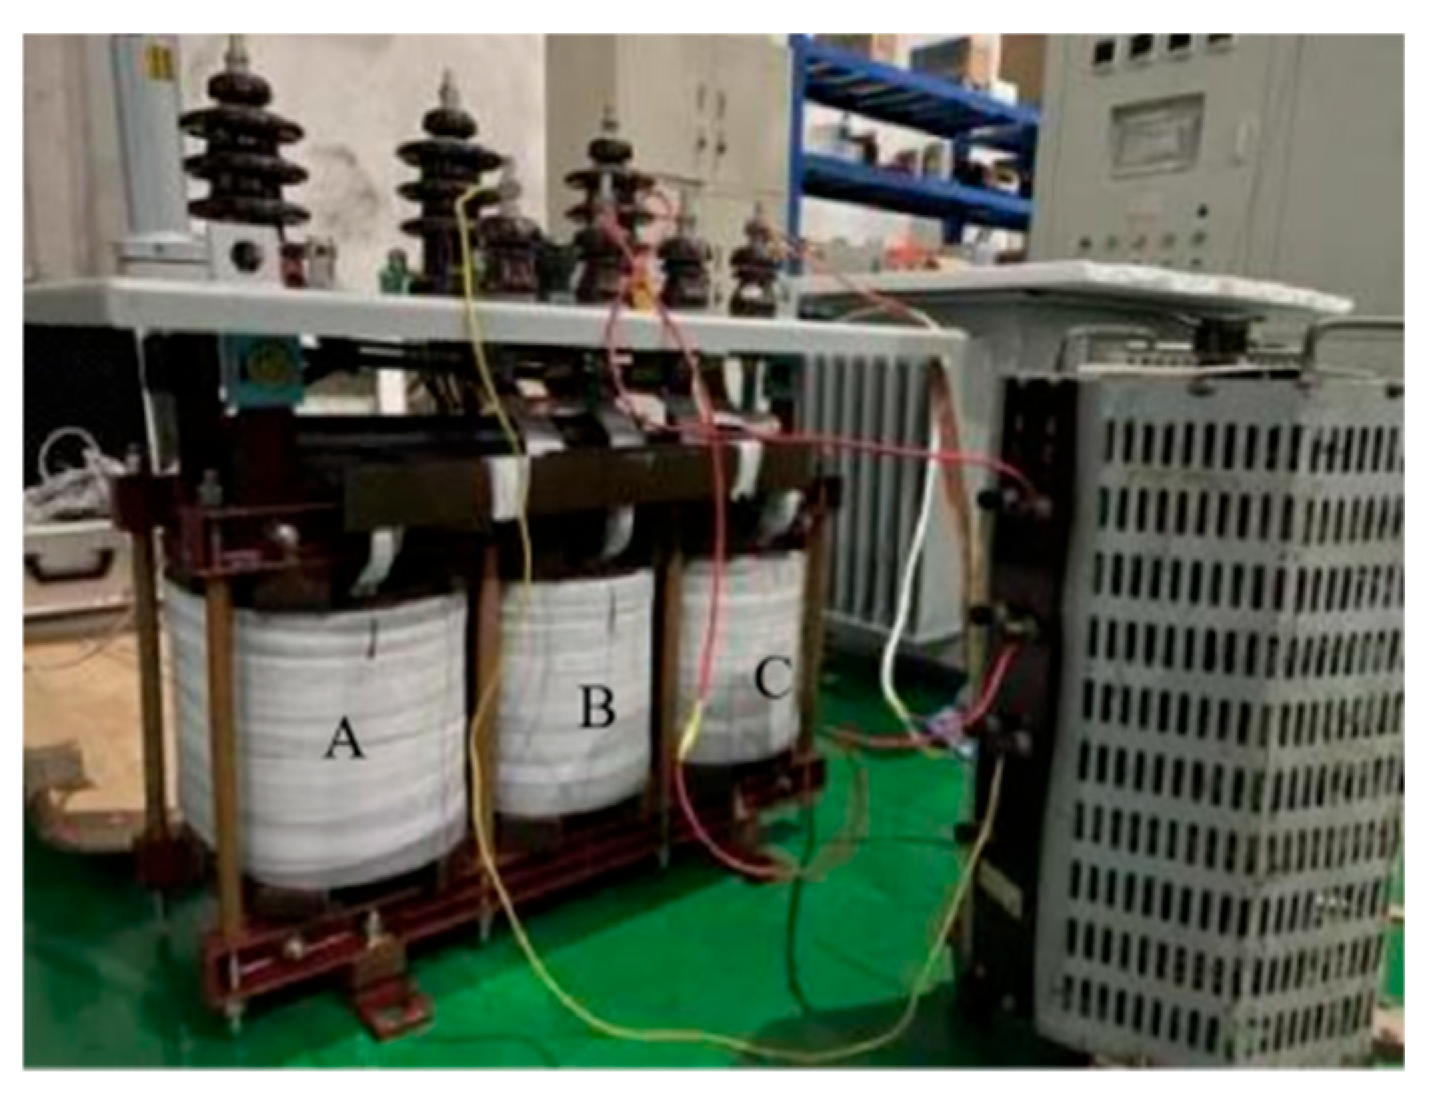
The transformer body structure was lifted out of the tank by a crane, and the load test was conducted after draining the oil from the surface of transformer body. Considering the structural aspects of transformer, measurements were taken at different positions on the transformer core, followed by drying of the transformer winding surfaces using transformer oil. Subsequently, sensors were securely fastened with tape at specific locations including the following: midpoint of phase A winding, midpoint of phase B winding, midpoint of phase C winding, side position of phase A, and side position of phase C. The actual wiring diagram and the locations of the measuring points can be seen in Figure 16 below. Once these tasks were completed, vibration measurements for the transformer windings were conducted when it was in a safe and stable operating state.
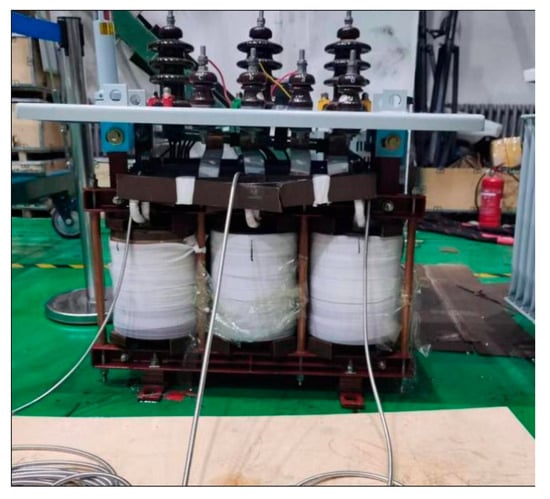
Figure 16.
The platform for conducting load tests on transformer windings.
The vibration signal results obtained from the test on the transformer coil are depicted in Figure 17.
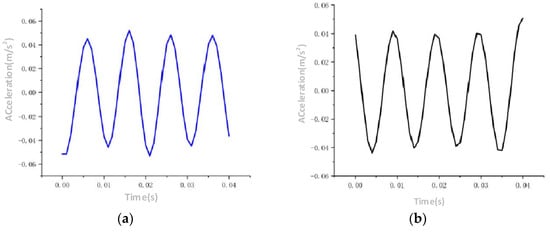
Figure 17.
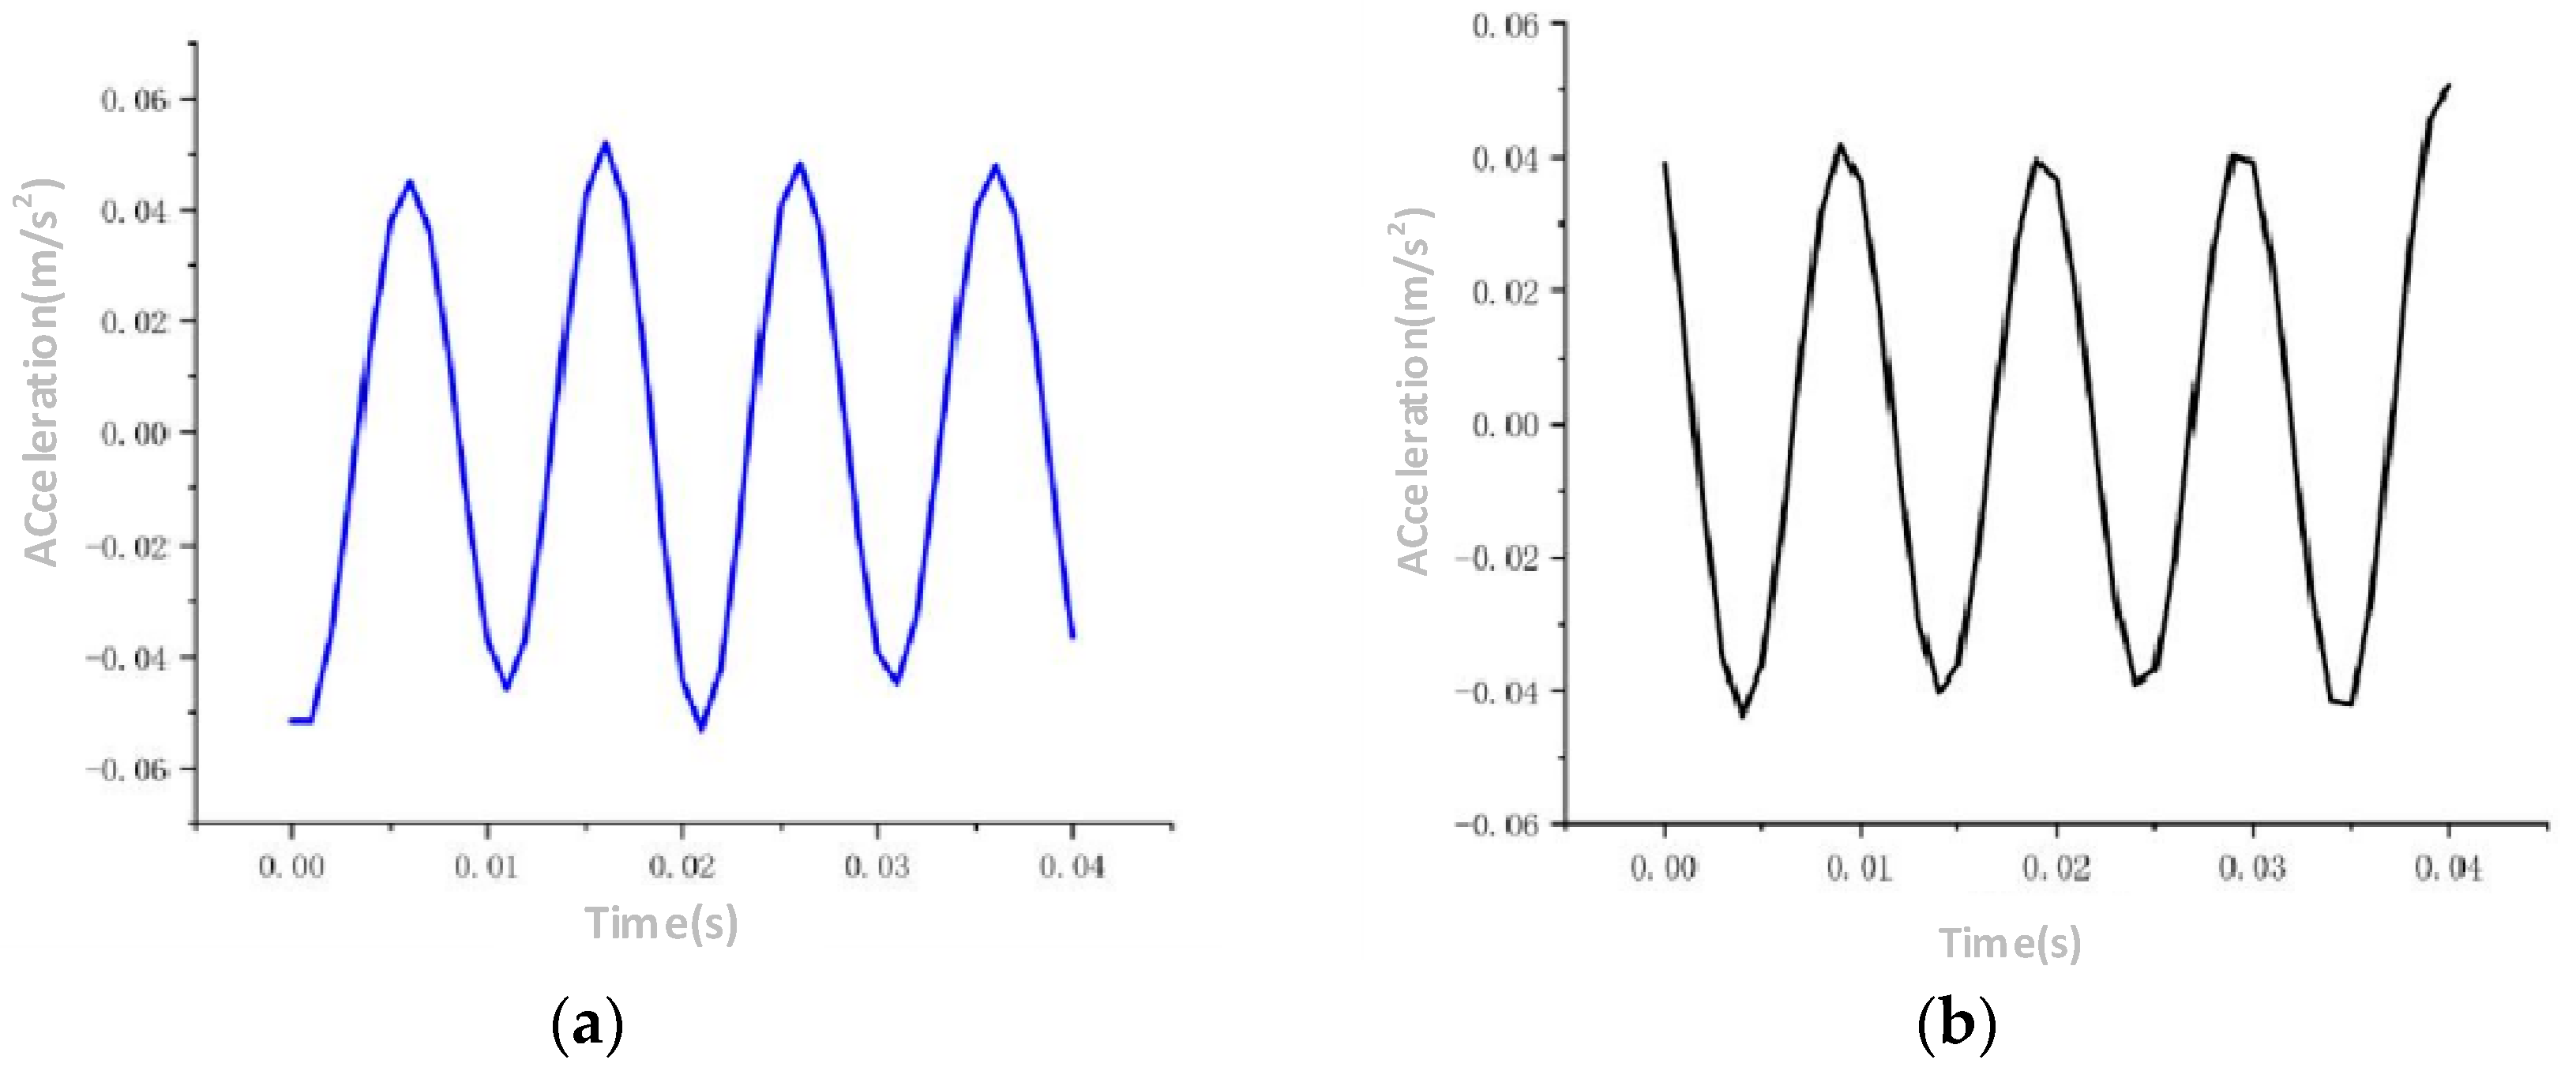
(a) Time-domain distribution of winding vibrations for frontal phase A. (b) Time-domain distribution of winding vibrations for frontal phase B.
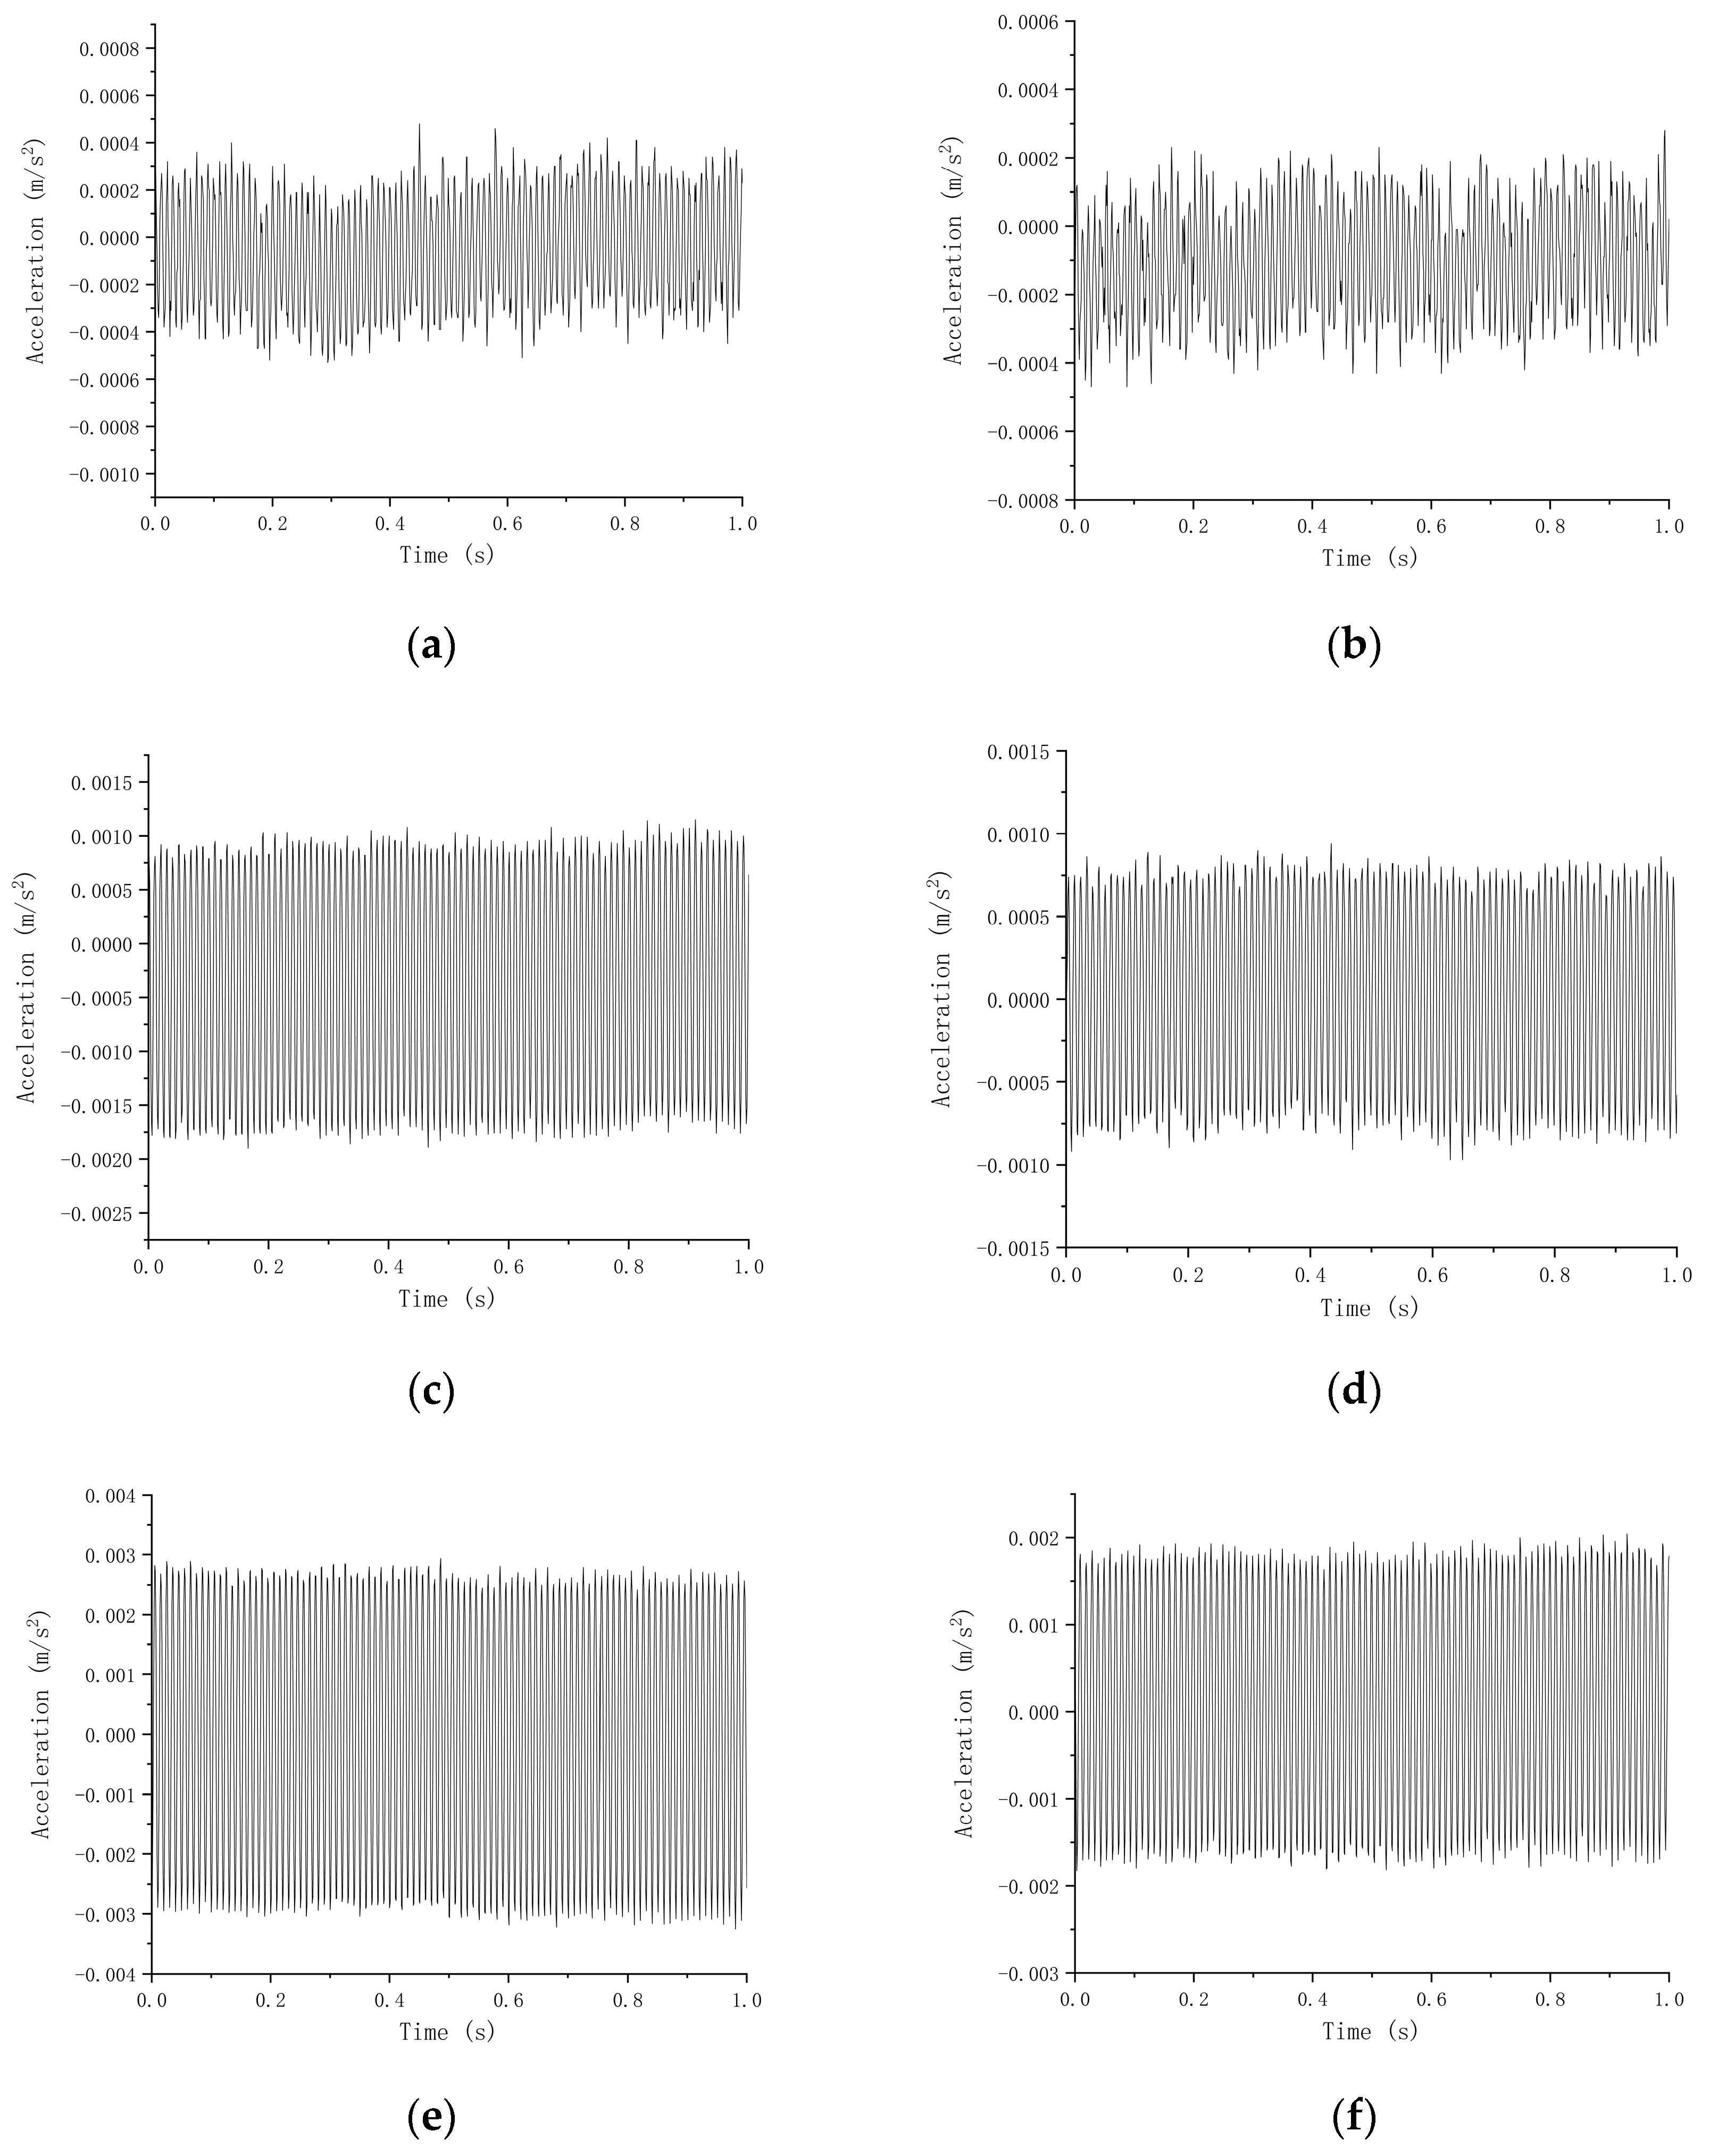
In order to investigate the vibration characteristics of transformer windings under various operating conditions, vibration testing experiments were conducted under 25%, 50%, and 75% of the rated current, based on the tests performed at the rated load current. The vibration test data for the windings under 25%, 50%, and 75% of the rated current are shown in Figure 18.
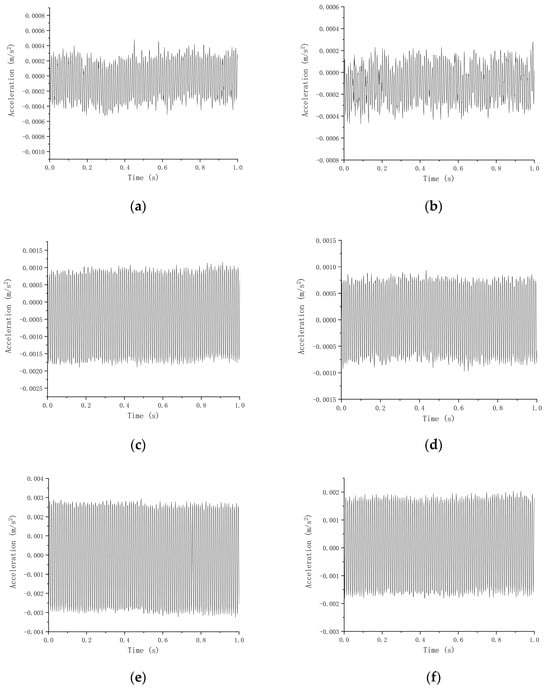
Figure 18.
(a) Time-domain distribution of winding vibrations for frontal phase A under 25% of the rated current. (b) Time-domain distribution of winding vibrations for frontal phase B under 25% of the rated current. (c) Time-domain distribution of winding vibrations for frontal phase A under 50% of the rated current. (d) Time-domain distribution of winding vibrations for frontal phase B under 50% of the rated current. (e) Time-domain distribution of winding vibrations for frontal phase A under 75% of the rated current. (f) Time-domain distribution of winding vibrations for frontal phase B under 75% of the rated current.
Like the iron core vibration signal, the winding vibration signal also undergoes FFT filtering to remove the influence of high-frequency signals on the winding vibration. This process results in a distribution diagram of the 100 Hz vibration signal, shown in Figure 17. The figure reveals that the maximum measured value of the winding vibration is 0.05 m/s2, the winding vibration signal exhibits periodic vibrations at a frequency that is twice the input power frequency, which is generally consistent with the previously analyzed mechanism. After obtaining the experimental vibration signals, a comparison was made with the previous simulation results, yielding comparative diagrams as shown in Figure 19.
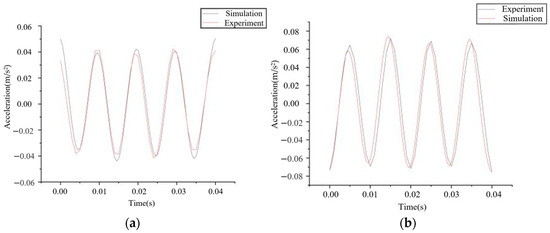
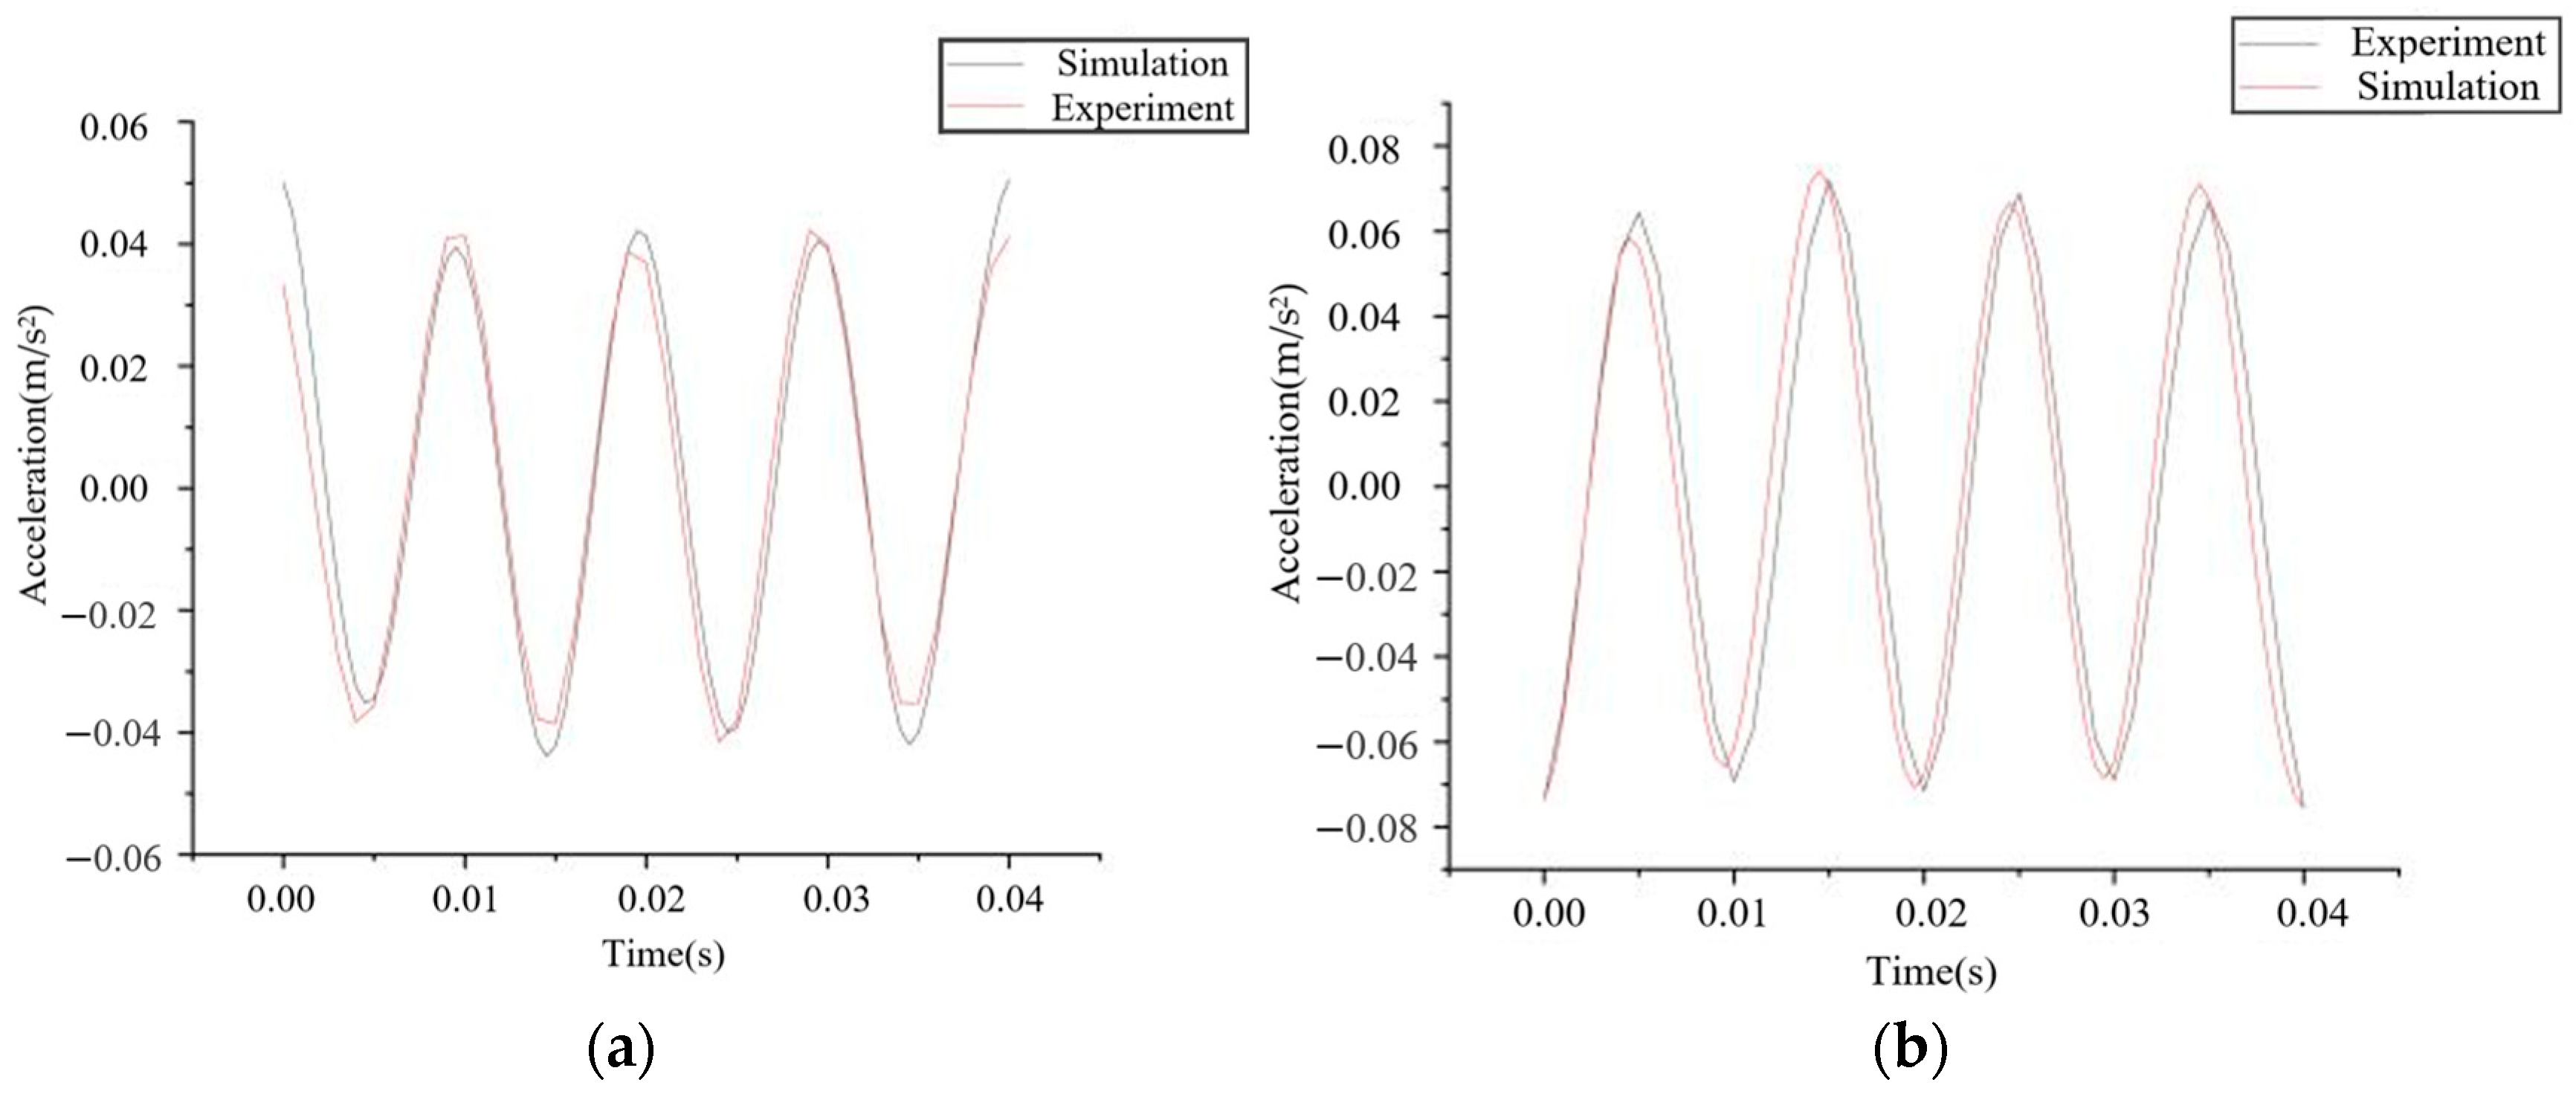
Figure 19.
(a) Comparison of the simulation and test results of phase B frontal midpoint in time-domain. (b) Comparison of the simulation and test results of phase A side midpoint in time domain.
The simulated waveform obtained from the time-domain analysis exhibits a high degree of consistency with the test waveform, demonstrating a close match in terms of periodic variation. This serves as evidence for the accuracy of the simulation results. In terms of numerical values, the maximum measured acceleration at point A is recorded as 0.0416 m/s2, while the corresponding simulated acceleration stands at 0.043 m/s2, resulting in a relative error of merely 3.3%. Similarly, at point B, the maximum measured acceleration reaches 0.0714 m/s2 compared to a simulated value of 0.0729 m/s2, yielding a relative error rate of only 2.1%.
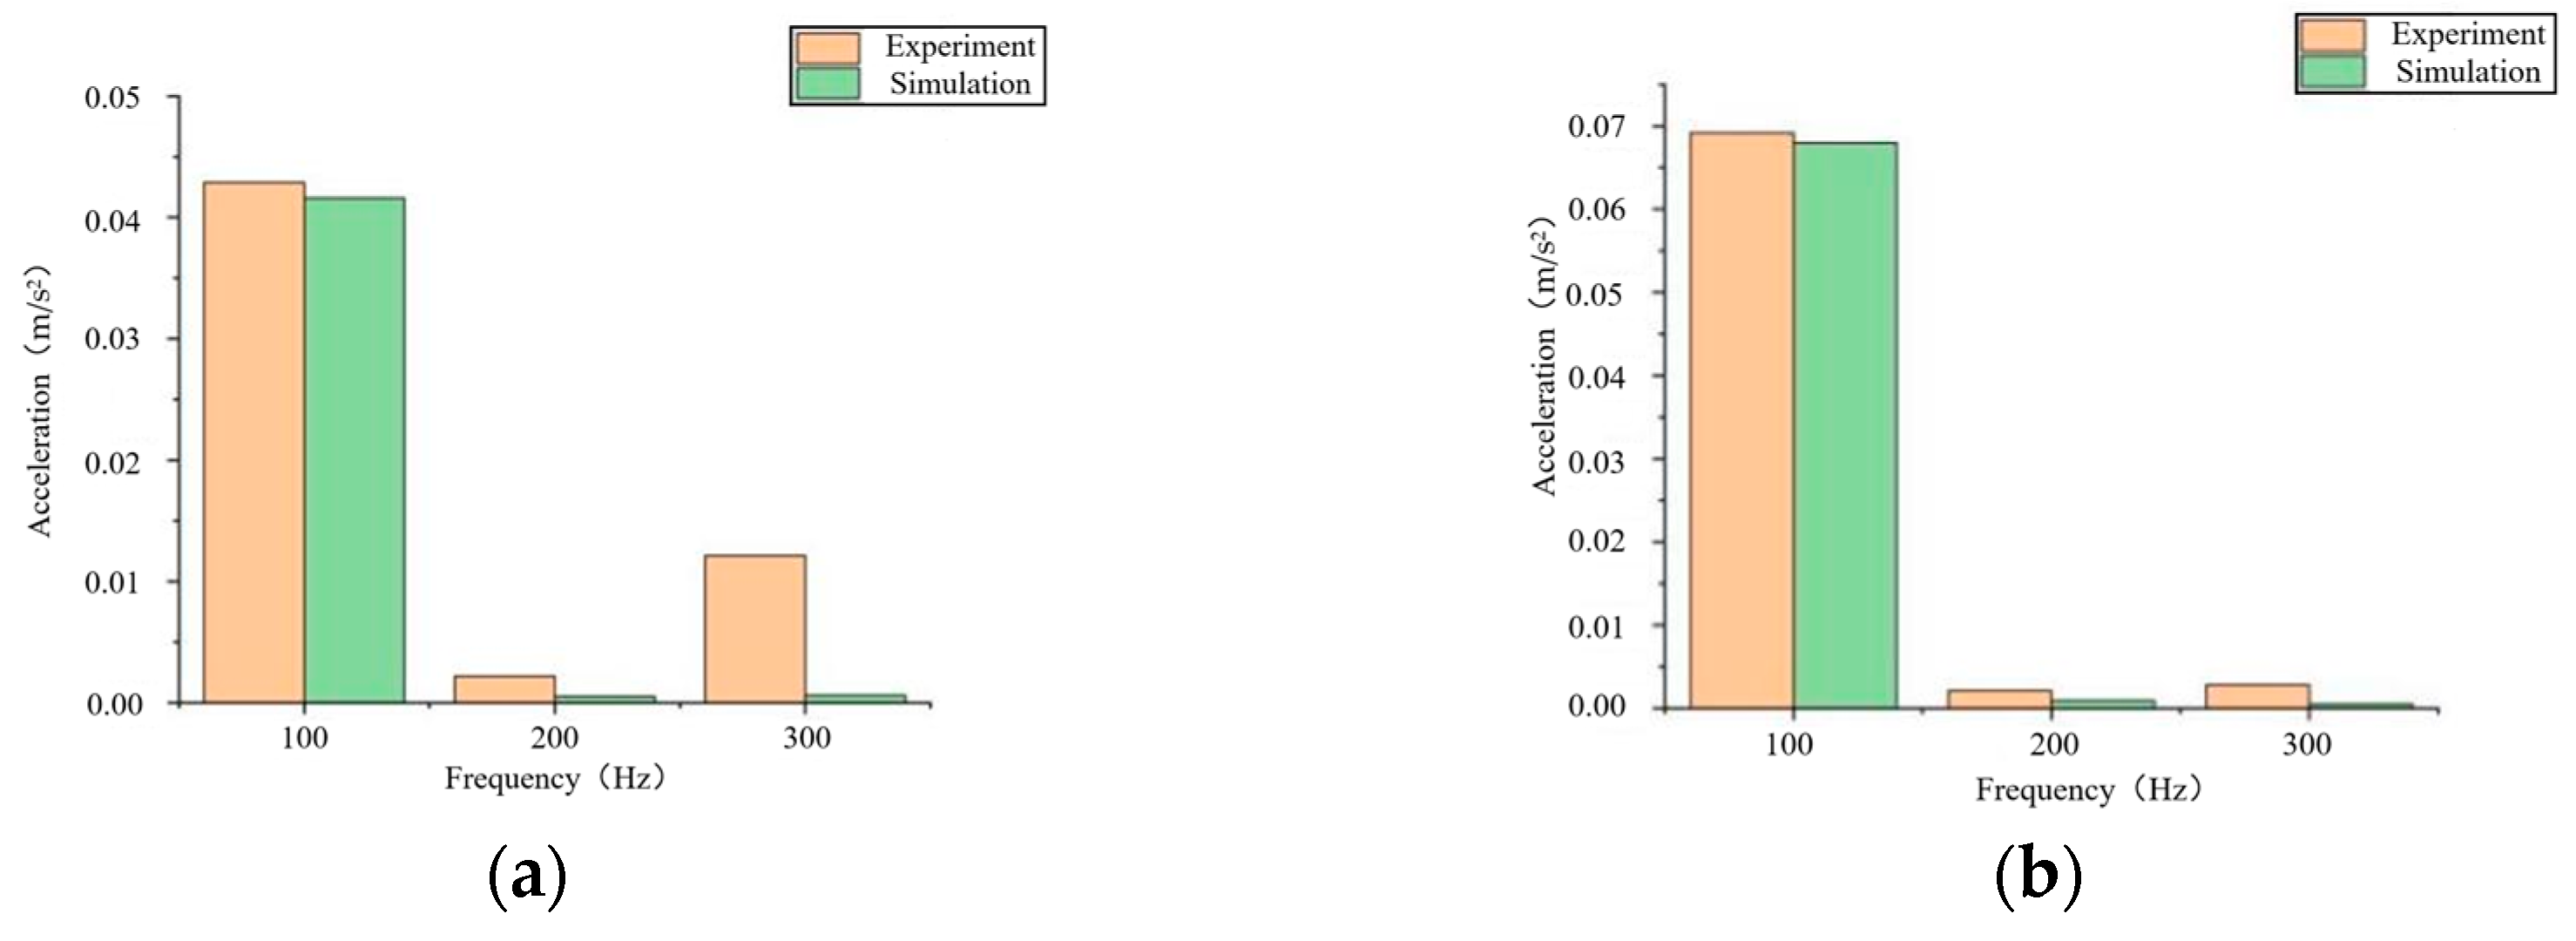
After applying FFT processing to the collected winding vibration signals, the results as shown in Figure 19 were obtained. From Figure 20, it is evident that the measured vibration acceleration of the winding is mainly focused at 100 Hz, which is twice the frequency of voltage. Additionally, there are also minor winding vibration signals at 200 Hz and 300 Hz. From the frequency spectrum, the acceleration values from both simulation and experimental data are generally in agreement, confirming the accuracy of the simulation model.

Figure 20.
(a) Comparison of the simulation and test results of phase B frontal midpoint in frequency domain. (b) Comparison of the simulation and test results of phase A side midpoint in frequency domain.
5. Conclusions
The following conclusions are obtained:
- A vibration simulation model of the transformer under no-load operation conditions was established, and the voltage waveform diagrams of the high-voltage side and the low-voltage side as well as the magnetic field distribution diagram of the core are obtained. The maximum value of the main magnetic flux of the transformer core is 1.79 T. The vibration of the core of the transformer is mainly at 100 Hz, and the vibration of the core exhibits a peak vibration acceleration of 0.005 m/s2 at 100 Hz under no-load condition. It uncovers a direct correlation between the input voltage squared and the acceleration of the vibrations in the core;
- A vibration model for load simulation is established, and the current waveform chart is derived. The vibration of the windings of the transformer is mainly at 100 Hz. The leakage magnetic field reaches 0.31 T, while the side vibration of the winding exhibits a peak vibration acceleration of 0.08 m/s2 and a maximum vibration acceleration of 0.04 m/s2. It uncovers that the electromagnetic force acting on the transformer winding is directly proportional to the current squared;
- The platform for collecting transformer vibration information was established, and no-load and load tests were conducted on the transformer under normal operating conditions. The experimental results uncover that the acceleration of core vibration in the transformer is 0.0047 m/s2, with a deviation of 6.38% from the simulation data. The maximum acceleration of winding vibration in phase A at the midpoint of its side and in phase B at the midpoint of its front are measured as 0.0714 m/s2 and 0.0416 m/s2, respectively, with errors of 2.1% and 3.3% compared to the simulation data. These findings demonstrate a consistent agreement between simulation and experiment, thus validating the reliability of both.
This paper conducts research on the prototype of the S11-M-200/10 kV transformer. Through the established theoretical model, guidelines, and experimental methods, it can be extended to other transformer studies. The multi-physics field coupling model proposed in this paper can be used for research on the early fault monitoring of transformers by generating vibration characteristics under different working conditions through simulation models and by arranging vibration acceleration sensors on the operating transformer to monitor the vibration signals of the core and windings. The next step will be to consider the influence of temperature changes, electrical noise, and other external disturbances; conduct simulation studies on transformers of other voltage levels; and perform vibration tests on transformers in actual operation, in order to further analyze and study the vibration characteristics of transformers in actual environments.
Author Contributions
Writing—original draft: L.H.; resources: L.H. and G.L.; methodology: L.H.; G.L. and C.C.; visualization: L.H. and Y.Z.; project administration: L.H. and Y.Z.; formal analysis: Y.Z.; data curation: Y.Z. and C.C.; funding acquisition: G.L.; validation: C.C.; writing—review and editing: C.C.; supervision: C.C. All authors have read and agreed to the published version of the manuscript.
Funding
This research was supported by the science and technology project of State Grid Xinjiang Electric Power Co, Ltd. Changji Power Supply Company (5230CJ230007).
Data Availability Statement
Data are contained within this article.
Acknowledgments
We would like to thank the engineers for their assistance with data collection and analysis. Their support and collaboration were crucial in ensuring the accuracy and reliability of our findings. We acknowledge the contributions of all the researchers and scholars whose work has inspired and informed our own. Their pioneering efforts in this field have laid a solid foundation for our research and have significantly advanced our understanding of transformer vibration.
Conflicts of Interest
Authors Long He, Yongming Zhu and Gang Liu were employed by the State Grid Xinjiang Electric Power Co, Ltd., Changji Power Supply Company. The remaining author declares that the research was conducted in the absence of any commercial or financial relationships that could be construed as a potential conflict of interest.
References
- Komatowski, E. Amplitude detection of power transformer tank vibrations signal. In Proceedings of the 2016 International Conference on Signals and Electronic Systems (ICSES), Kraków, Poland, 5–7 September 2016; pp. 41–46. [Google Scholar]
- Qian, G. Research on spectrum eigenvalues of transformer vibration and its application on diagnosis. In Proceedings of the 2016 IEEE International Conference on Mechatronics and Automation, Harbin, China, 7–10 August 2016; pp. 366–370. [Google Scholar]
- Gao, X.; Liu, Y. Nonlinear Research: Study Results from Beihang Universuty Broaden Understanding of Nonlinear Research (Research of giant magnetostrictive actuator’s nonlinear dynamic behaviors). J. Technol. Sci. 2018, 52, 864–872. [Google Scholar]
- Jin, M.; Pan, J. Vibration transmission from internal structures to the tank of an oil-filled power transformer. Appl. Acoust. 2016, 113, 1–6. [Google Scholar] [CrossRef]
- Zheng, J.; Pan, J.; Huang, H. An experimental study of winding vibration of a single-phase power transformer using a laser Doppler vibrometer. Appl. Acoust. 2015, 87, 30–37. [Google Scholar] [CrossRef]
- Liu, Q.; Li, X.; Zhang, R. Real-time vibration-based fault diagnosis of power transformers using deep learning. Energies 2022, 15, 3678. [Google Scholar]
- Moses, A.J.; Anderson, P.I.; Phophongviwat, T. Localized Surface Vibration and Acoustic Noise Emitted from Laboratory-Scale Transformer Cores Assembled from Grain-Oriented Electrical Steel. IEEE Trans. Magn. 2016, 52, 1–15. [Google Scholar] [CrossRef]
- Cao, C.; Xu, B.W.; Li, X.B. Monitoring Method on Loosened State and Deformational Fault of Transformer Winding Based on Vibration and Reactance Information. IEEE Access 2020, 8, 215479–215492. [Google Scholar] [CrossRef]
- Zhou, Q.; Ding, G.; Wang, F. Edge computing-enabled real-time vibration monitoring for power transformers. IEEE Trans. Ind. Inform. 2023, 19, 6789–6800. [Google Scholar]
- Zhang, B.; Yan, N.; Du, J.; Wang, H.; Wei, X.; Zhou, C. A hybrid CNN-LSTM model for transformer winding fault diagnosis using vibration signals. Energies 2022, 15, 2985. [Google Scholar]
- Cao, C.; Xu, J.Y.; Lin, X.; Li, X. State diagnosis method of transformer winding deformation based on fusing vibration and reactance parameters. IET Electr. Power Appl. 2020, 14, 818–826. [Google Scholar]
- Jonghoek, K.; Sungyun, C. Robust and efficient WLS-based dynamic state estimation considering transformer core saturation. J. Frankl. Inst. 2020, 357, 12938–12959. [Google Scholar]
- Wang, Y.; Pan, J. Comparison of mechanically and electrically excited vibration frequency responses of a small distribution transformer. IEEE Trans. Power Deliv. 2015, 32, 1173–1180. [Google Scholar] [CrossRef]
- Li, D.; Yu, Z.; Zhao, J.; Zhang, L. Study on axial vibration characteristics of transformer winding. In Proceedings of the 2019 14th IEEE Conference on Industrial Electronics and Applications (ICIEA), Xi’an, China, 19–21 June 2019; pp. 1080–1083. [Google Scholar]
- Yu, Z.; Li, D.; Chen, L. Statistical analysis of vibration characteristics of power transformers with different voltage levels. In Proceedings of the 2018 12th International Conference on the Properties and Applications of Dielectric Materials (ICPADM), Xi’an, China, 20–24 May 2018; pp. 694–699. [Google Scholar]
- Hilgert, T.; Vandevelde, L.; Melkebeek, J. Comparison of magnetostriction models for use in calculations of vibrations in magneticcores. IEEE Trans. Magn. 2008, 44, 874–877. [Google Scholar] [CrossRef]
- Zhang, B.; Yan, N.; Du, J.; Han, F.; Wang, H. A novel approach to investigate the core vibration in power transformers. IEEE Trans. Magn. 2018, 54, 1–4. [Google Scholar] [CrossRef]
- Chen, Z.; Zhou, Q.; Ding, G.; Wu, X.; Wu, J.; Zhang, Y. Influence of magnetic state variation on transformer core vibration characteristics and its measurement. IEEE Trans. Instrum. Meas. 2022, 71, 1–8. [Google Scholar] [CrossRef]
- Li, X.; Huang, X.; Zhou, Z.; Zhao, Y.; Chen, Y.; Song, X. Analysis of the measuring points selection of power transformer winding deformation though vibration test. In Proceedings of the 2016 China International Conference on Electricity Distribution (CICED), Xi’an, China, 10–13 August 2016; pp. 1–5. [Google Scholar]
- Duan, X.; Zhao, T.; Liu, J.; Zhang, L.; Zou, L. Analysis of winding vibration characteristics of power transformers based on the finite-element method. Energies 2018, 11, 2404. [Google Scholar] [CrossRef]
- Jiang, P.; Zhang, Z.; Dong, Z.; Wu, Y.; Xiao, R.; Deng, J.; Pan, Z. Research on distribution characteristics of vibration signals of ± 500 kV HVDC converter transformer winding based on load test. Int. J. Electr. Power Energy Syst. 2021, 132, 107200. [Google Scholar] [CrossRef]
- Li, H.; Li, Y.; Yu, X. Axial vibrations modal analysis and computation of power transformer windings under different levels of pre-compression. In Proceedings of the 2009 International Conference on Applied Superconductivity and Electromagnetic Devices, Chengdu, China, 25–27 September 2009; pp. 229–232. [Google Scholar]
- Peng, H.; Pan, Y.; Hu, J.; Yang, C.; Wang, Y.; Wu, K. The vibration analysis for transformer winding based on multi-field coupling. In Proceedings of the 2017 IEEE 2nd Advanced Information Technology, Electronic and Automation Control Conference (IAEAC), Chongqing China, 25–26 March 2017; pp. 2003–2006. [Google Scholar]
- Wang, Z.; Liu, S.; Zhang, L. Analysis of vibration characteristics of dry-type transformer iron core and windings based on multi physical field. In Proceedings of the 2022 12th International Conference on Power and Energy Systems (ICPES), Guangzhou, China, 23–25 December 2022; pp. 52–56. [Google Scholar]
- Luo, B.; Wang, F.H. A tank vibration model for online monitoring of power transformer. In Proceedings of the 2013 IEEE Power & Energy Society General Meeting, Vancouver, BC, Canada, 21–25 July 2013; pp. 1–5. [Google Scholar]


Disclaimer/Publisher’s Note: The statements, opinions and data contained in all publications are solely those of the individual author(s) and contributor(s) and not of MDPI and/or the editor(s). MDPI and/or the editor(s) disclaim responsibility for any injury to people or property resulting from any ideas, methods, instructions or products referred to in the content. |
© 2025 by the authors. Licensee MDPI, Basel, Switzerland. This article is an open access article distributed under the terms and conditions of the Creative Commons Attribution (CC BY) license (https://creativecommons.org/licenses/by/4.0/).