Article

Have the Links Between Natural Gas and Coal Prices Changed over Time? Evidence for European and Pacific Markets

by
Jerzy Rembeza
and
Dominik Katarzyński
*
Department of Economics, Koszalin University of Technology, Kwiatkowskiego 6E, 75-343 Koszalin, Poland
*
Author to whom correspondence should be addressed.
Energies 2025, 18(9), 2201; https://doi.org/10.3390/en18092201
Submission received: 2 April 2025 / Revised: 22 April 2025 / Accepted: 24 April 2025 / Published: 25 April 2025

Abstract

:
The relationships between the prices of major energy commodities have been a widely discussed topic in energy market analyses. This study examines whether the substantial changes observed in recent years have influenced the price linkages between coal and natural gas. By comparing selected price indices from European and Asian markets, we assess the evolving interdependencies between these fuels. The results indicate that the most significant changes in price linkages have occurred in European markets. Both VAR and ARDL model-based tests reveal a shift in the direction of causal relationships. Between 2006 and 2011, coal prices significantly influenced natural gas prices, with no strong evidence of reverse causality. However, in the more recent period (2018–2023), the relationship reversed—natural gas prices now have a significant impact on coal prices, while the reverse linkage has weakened. In Asian markets, the changes were less pronounced, particularly for Japanese import gas prices based on lagged average formulas. However, in the most recent period, a notable influence of Indonesian import gas prices on Australian coal prices emerged, mirroring trends observed in Europe. These findings highlight the increasing role of natural gas in shaping energy commodity prices, especially in Europe, where its growing importance in power generation has contributed to this shift. Additionally, the post-2018 period has been marked by significant supply disruptions, particularly in Europe, with geopolitical factors playing a crucial role in amplifying the importance of natural gas prices.

1. Introduction

The economic situation resulting from turmoil in the early years of the second decade of the 21st century calls for a renewed analysis of the interdependencies between energy carriers. This is a consequence of several significant events that have strongly impacted energy markets.
First, the COVID-19 pandemic and the associated lockdowns caused a drastic decline in demand for energy sources, particularly natural gas and crude oil [1]. Second, the outbreak of the largest armed conflict in Europe since the end of World War II in 2022 led to sudden shifts in fuel demand structures across most European countries, resulting in the partial disruption and redirection of energy supply chains to Europe [2].
These rapid changes have been reflected in the price dynamics of fuels such as coal, oil, and gas, which have experienced multiple sharp increases over short periods.
The rapid increase in energy carrier prices, combined with a slow stabilization period in many European markets, has contributed to unprecedented wholesale electricity price surges [3]. In light of mid-2024 data [4], this phenomenon is particularly evident in countries whose energy mix relies heavily on non-renewable energy sources.
In response to the challenges faced by nations due to the situation in global energy markets, the topic of price interdependencies between energy commodities has become particularly relevant and crucial for the functioning of the economy. This underscores the need to reassess the current price linkages between natural gas and coal in European and Pacific markets.
In line with this objective, the following research questions have been formulated:
  • How are price linkages formed, and what characteristics do they exhibit for energy commodities such as coal and natural gas?
  • How have long-term and short-term price linkages between coal and natural gas markets in the Pacific and Europe evolved between 2006 and 2023?
  • Have there been significant changes in the long-term and short-term price relationships between coal and natural gas in the European and Pacific regions during the period 2006–2023?

2. Literature Review

2.1. Market Price Linkages—Theory

Price interdependencies between products and services are not a new phenomenon, and economists have been studying the nature of price relationships for decades. Expected market prices are not solely the result of the interplay between supply and demand for a given good; they are also influenced by both endogenous and exogenous factors within the analyzed market.
For many years, researchers have examined price formation by analyzing aspects related to substitutability [5] as well as the complementarity [6] of goods and services.
The price linkages of complementary products are particularly complex and play a crucial role in producers’ pricing strategies and consumers’ responses to price changes. Research shows that complementary products are goods whose consumption enhances the utility or value of other products [7].
A widely recognized example of complementary products is printers and the ink required for their operation, where the price of ink can significantly influence the demand for printers. Analyses verifying the complementarity of specific products or services provide a deeper understanding of product group dynamics and help improve the effectiveness of sales and promotional strategies [8].
On the other hand, leveraging complementarity can create challenges in developing pricing strategies due to issues related to value capture and creation. These challenges arise when complementary products are developed and sold by separate companies (“non-integrated” producers) [9].
The phenomenon of product and service substitutability is also shaped by consumer reactions to expected prices. However, it describes a situation in which an increase in the price of one product leads to higher demand for another good with relatively similar characteristics [10]. This means that substitute products fulfill similar consumer needs and can be used interchangeably without significant differences in utility. A widely recognized classic example is butter and margarine, which, despite differences in production processes, serve the same purpose and satisfy identical consumer needs.
Substitutability is not only examined in the context of interchangeable products but is also frequently analyzed in labor markets. In recent years, it has gained particular attention in discussions on the replacement of human labor by automation and artificial intelligence [11].
Research on substitutability plays a crucial role in planning pricing strategies and making production decisions. Optimizing product offerings in response to external and internal factors—which influence consumer preferences and market conditions—enables companies to allocate resources more efficiently, ultimately aiming to maximize profit [12].
In addition to markets for goods and services, and the labor market, which involves the replacement of human labor by robots and artificial intelligence, the phenomena of complementarity and substitutability also apply to financial markets, including capital markets and commodity markets [13]. Due to their economic characteristics, international capital and commodity markets have been the subject of research in recent decades, conducted not only by academic institutions but also by private entities, including investors. As a result of these studies, it has been observed that the phenomena of complementarity and substitutability also occur in the case of capital and commodity markets. Hamao et al. [14], when studying capital markets in Tokyo, London, and New York, noticed that short-term dependencies exist between the analyzed markets, which can be identified as a phenomenon of substitutability.
The phenomena of complementarity and substitutability are commonly observed in commodity markets, largely due to the inherent nature of these markets. Commodities, whether raw materials or basic agricultural products, often have substitutes that can be used interchangeably for various purposes. For instance, grains like wheat, corn, rye, or rice [15] can act as substitutes in food production. Conversely, the demand for soybeans and corn may be complementary, as both are utilized together as animal feed in livestock farming.
The situation is similar in the case of raw materials, particularly energy resources, where studies show not only the mutual relationships between oil, gasoline, gas, and coal but also their impact on inflation and economic growth [16]. Researchers often point to the “almost simultaneous” complementarity and substitutability of these goods, depending on the market and the period of buying and selling transactions [17]. Natural gas, under certain price, spatial, and temporal conditions, can serve as a substitute for liquid and solid fuels, particularly when these fuels are used in electricity production. On the other hand, when considering energy mixes in electricity generation in different countries, both fuels most often complement each other in various proportions to meet the needs of a given country, which at times is reflected in electricity prices [18].

2.2. Rationale for the Connections Between Commodities

Price connections in commodity markets, particularly in the case of energy carriers, are an extremely complex and multidimensional phenomenon. These connections are influenced not only by purely economic factors, such as product characteristics or the law of supply and demand, but also by the policies of energy carrier supplier countries and international events [19], which can lead to embargoes or trade bans. Additionally, energy prices can be impacted by development strategies and policies, particularly those related to energy transition or restrictions on atmospheric pollution emissions [20].
Due to the complexity of the interrelationships between energy carrier prices and their implications for the entire economy, which became a popular subject of research after the oil crisis of the 1970s [21], the current state of knowledge is relatively well developed. The results of many studies suggest that oil can be seen as one of the key indicators in energy markets and the energy sector, with connections to other energy carriers [22], such as natural gas or coal [23].
Research studies have shown that, in the past, there was a strong and close price connection between oil and natural gas. It was observed that as oil prices increased, natural gas prices also tended to rise, although not always at the same rate [24]. Due to the strong price correlation between gas and oil, many regions and markets use the practice of indexing natural gas prices to oil prices, which means setting the price of gas based on the price of oil or its derivative products [25]. Price indexing of both energy carriers assumes that, in most applications, they can be used interchangeably, which gives them characteristics of substitute products. Therefore, rising oil prices may lead to increased demand for natural gas, and price indexing helps maintain more predictable and stable price relationships between these energy carriers [26].
Indexing the prices of oil and natural gas is based on determining a pricing formula that combines the components of oil or oil-derived products with settlement periods, during which the prices are converted into natural gas prices. The pricing formulas may rely on the average price of oil in recent months, adjusted by an accepted price coefficient [24]. As a result, the actual price of natural gas is tied to the price of oil. However, despite the advantages of this solution, such as the more accurate market predictability, there are also negative aspects. Through indexing to oil prices, the price of natural gas may become disconnected from its own supply and demand, meaning it will no longer reflect the equilibrium price for its market [27]. Additionally, with the development of “green technologies”, including methods for obtaining energy from clean renewable sources, there has been a gradual trend of moving away from indexing natural gas prices to oil prices. This is due to both the increasing efficiency of renewable energy sources and the implementation of policies and development strategies aimed at decarbonizing the economy [28].
Research also suggests that the behavior of oil prices significantly influences the formation of demand, and consequently the price of coal [29]. However, it is important to note that these relationships are highly complex. While oil and coal generally have very different economic applications, coal, particularly in the context of electricity generation, can be considered a substitute for oil, especially in countries where electricity generation relies primarily on non-renewable energy sources [30]. As energy companies aim to minimize electricity generation costs, rising oil prices can lead to an increased demand for coal, which is typically cheaper. This, in turn, may result in higher coal prices due to market mechanisms [31].
The relationship between coal prices and oil prices is not only due to their substitutability in electricity generation. It is also influenced by production costs [31]. As a fossil fuel, coal requires extraction from deposits located at various depths underground. Depending on the depth of the deposits and the extraction technology, the tools needed for these processes are typically powered by oil or its derivatives, such as gasoline. The increasing prices or consumption of these fuels can significantly impact the operating costs of coal extraction [32].
Another dimension of the price interdependence between coal and oil is the global shift in the energy sector. The processes of decarbonization and CO2 emission reduction, particularly in European countries and North America, have led to a decrease in coal demand [33]. Combined with rising oil prices and the costs of greenhouse gas emission allowances (Figure 1), this may encourage governments to increase investments in alternative energy sources, including nuclear power [34], which could further intensify the decline in demand for coal.

2.3. Connections Between Gas and Coal in Europe and the Asia-Pacific Region

The interconnections and relationships between the prices of gas and coal in the European and Asia-Pacific markets are highly complex and influenced by many factors that go beyond the standard assumptions of market models. In addition to economic factors, political and environmental elements also play a significant role in shaping gas and coal prices in these markets.
In Europe, the sharp rise in gas prices observed between 2022 and 2024, caused in part by the reduction in supplies from Russia, led to increased electricity production costs. The higher electricity production costs, in turn, caused some countries to increase the use of coal as a cheaper substitute for gas [35], thus increasing demand for this resource and contributing to a rise in its price. On the other hand, in Asia, particularly in China and India, there is a strong connection between coal and gas prices and the global LNG markets. Due to the continuously growing energy demand in these economies, LNG plays a crucial role in meeting their energy needs. Chai et al. [36], observed that rising coal prices in China could help mitigate the price imbalance between liquefied natural gas and pipeline natural gas.
Energy and environmental policies, particularly those stemming from the implementation of the Fit for 55 package and the European Green Deal, play a crucial role in shaping the interdependencies between coal and natural gas prices within the EU [37]. These policies, aimed at reducing CO2 emissions, are designed to shift the energy mix away from high-emission fuels such as coal toward lower-emission alternatives like natural gas—and ultimately toward renewable energy sources [38]. However, recent geopolitical disruptions, including the COVID-19 pandemic and the war in Ukraine, prompted several EU member states to temporarily revert to coal use. This shift highlighted the vulnerability of decarbonization pathways in times of crisis and underscored the volatility of price linkages between coal and gas, which remain sensitive to both policy signals and external shocks.
Furthermore, the growing influence of the EU Emissions Trading System (ETS) and rising CO2 allowance prices (Figure 1) has become a critical factor in determining the relative competitiveness of coal versus natural gas [39], as emphasized by Faiella and Mistretta [40]. These mechanisms have shaped fuel-switching behavior and reinforced the strategic role of carbon pricing in long-term energy market trends. At the same time, the broader implementation of decarbonization policies has significantly restructured energy markets, with substantial implications for price dynamics. As Zábojník et al. [41] point out, rising electricity prices—partially driven by climate-related regulatory frameworks—may undermine the international competitiveness of energy-intensive industries in Europe. This highlights the broader economic trade-offs associated with the energy transition and the EU’s ambitious climate objectives.
The increased cost of electricity, linked to carbon pricing and stricter environmental regulations, affects not only industrial demand but also the relative cost-competitiveness of different energy sources. Although gas is widely viewed as a transitional fuel due to its lower carbon intensity compared to coal, regulatory pressures and market signals can either support or impede this shift. As Mišík [42] observes, the political economy of renewable energy support has driven greater renewable penetration, which, while reducing average fossil fuel demand, has simultaneously increased the need for flexible generation sources such as natural gas—thereby affecting its price correlation with coal. The interaction between regulatory frameworks, the intermittent nature of renewables, and the need for market-balancing mechanisms contributes to a continually evolving and increasingly complex relationship between fossil fuel prices in the EU context
In China, the world’s largest consumer of coal, political and legal regulations related to energy and the environment also significantly impact the price relationships between gas and coal. Researchers suggest that the completion of the marketization process of the coal market in China has led to gas and coal price relations in the country resembling European patterns [24]. The Chinese government’s policy aimed at improving energy efficiency further strengthens these price connections, influencing both resources. On the other hand, in India, rising energy demand, driven by population growth and rapid economic development, has led to predictions of increased gas prices on the local market by 2025 [43]. This phenomenon could result in higher demand for coal as a cheaper energy alternative [43]. The increase in gas prices, combined with rising energy demand, may have significant implications for India’s economy, including for the stability of energy prices and the availability of resources [43].
Global changes in the LNG market, including shifts in the leading exporters of this resource, also have serious implications for gas and coal prices in Europe and Asia [44]. The increase in LNG imports from the United States and Australia helps stabilize gas prices in Asian markets by meeting the growing demand, while simultaneously affecting coal prices, which are used as an alternative during periods of higher gas prices [45]. In Europe, the situation is relatively similar, with changes in the structure of LNG suppliers (Figure 2) having a strong impact on gas and coal prices. Furthermore, research conducted by Hong et al. [24] suggests that coal prices are more dependent on natural gas prices than vice versa, both in Europe and Asia.
The empirical literature has extensively examined the interdependencies between coal, natural gas, and crude oil prices using various econometric techniques, such as Vector Error Correction Models (VECMs), Autoregressive Distributed Lag (ARDL) models, and Johansen cointegration tests. For instance, Chen et al. (2024) [46] found that natural gas, coal, and oil prices in Europe were cointegrated between 2009 and 2023. However, this long-term relationship was disrupted around 2020 due to the COVID-19 pandemic and the war in Ukraine. Their analysis showed a statistically significant negative correlation between crude oil and natural gas prices (coefficient: −1.79829, p < 0.001), and a significant positive correlation between coal and gas prices (coefficient: 1.132257, p = 0.001). These findings suggest that rising oil prices tend to coincide with falling gas prices, while coal and gas prices tend to move in the same direction.
Earlier work by Erdos [47] confirmed a long-term equilibrium between US and UK gas prices and crude oil prices before 2009, using VECM models. His results indicated that both US and UK gas prices adjusted individually to oil price shocks and tended to return to a shared equilibrium. Notably, deviations in gas prices on one continent mirrored those on the other, and adjustments to shocks typically took about 20 weeks. This convergence process was mediated primarily by oil prices, assuming transatlantic arbitrage was possible. After 2009, however, while the UK gas price remained linked to oil, the US gas price became decoupled from both oil and European gas prices as arbitrage opportunities diminished.
Chiapini et al. (2019) [48] offered further insights using bivariate error correction models that accounted for structural breaks and asymmetric responses among gas, coal, and oil prices. They found a declining degree of interdependence between gas and oil prices over time. Interestingly, they also noted that the speed and pattern of reversion to long-term equilibrium were highly asymmetric—particularly between Henry Hub (HH) and the National Balancing Point (NBP), and between HH and the Japan–Korea Marker (JKM). These asymmetries likely reflect market strategies by exporting countries in oversupplied markets. Their findings suggest that since 2009, no cointegration exists between JKM and HH, whereas HH and European gas prices remain cointegrated, albeit with a structural break.
Moreover, Chiapini et al. [48] observed that all natural gas prices—except for the Central European Gas Hub (CEGH)—are cointegrated with coal prices, again with evidence of structural breaks. For European gas hubs, the common structural break was identified in May 2010, while for HH it occurred in March 2006. Notably, the JKM price showed no cointegration with oil from 2009 to 2018, even when multiple structural breaks were considered. Using the Dynamic Ordinary Least Squares (DOLSs) approach, Chiapini et al. [48] estimated long-term relationships and concluded that after 2015, European gas prices began to recouple with oil prices, showing increasingly aligned trends. However, identifying a similar relationship with coal prices proved more challenging.
On the other hand, Ramberg and Parsons [49], focusing on the U.S. market, linked the volatility of gas and coal prices to marginal cost dynamics and substitution effects in electricity generation. These findings highlight both the strength and asymmetry of price interdependencies between energy commodities across different global regions.

3. Materials and Methods

The analysis of the interconnections between coal and natural gas prices on European and Pacific markets from 2006 to 2022 used comprehensive econometric methods to verify the presence of the assumed relationships. The research procedure involved testing the degree of integration of the examined variables and the long- and short-term relationships between prices on the respective markets. Two methodological approaches were used: the first based on VAR modeling, and the second on ARDL models. Below is a brief description of the research methodology.
The first step of the conducted analysis was to apply the Breakpoint Unit-Root Tests. In most cases the test is used to verify whether there were significant structural changes in the data during the analyzed period, which could affect price formation. In the analysis, Breakpoint Unit-Root Tests were employed, which account for breaks in the time series of the individual variables [50]. The results of these tests are crucial for further analyses. Standard causality tests and VAR models require that all variables be integrated to the same degree, while ARDL models require the variables to be either stationary or integrated of order one.
The following step of the research procedure included the Granger Causality Test (Toda-Yamamoto Procedure, χ2 Tests). The Granger causality test is a popular tool often used to examine the mutual relationships between variables in various fields. The primary goal of the test is to determine whether changes in variables x and y, such as coal and gas prices, can be used to predict the prices of coal or gas. The extension of the test with the Toda-Yamamoto procedure is introduced for analyzing processes that may be the non-stationary or have different degrees of integration. The Toda-Yamamoto procedure is a method for testing Granger causality that is robust to issues related to non-stationarity of the variables, but it requires the introduction of additional time lags compared to the baseline VAR model, depending on the results of the unit-root tests.
After the before mentioned step the Bounds Tests and Cointegrated Equations were used. Bound Tests are used to examine whether there is a long-term relationship (cointegration) between gas and coal prices [51]. The use of the ARDL (Autoregressive Distributed Lag Model) allows for the determination of cointegration between non-stationary variables and their impact over time. The ARDL model was constructed for two pairs of variables: first, the impact of coal prices on gas prices, and second, the impact of gas prices on coal prices. The starting point for this test is the ARDL model, which is transformed into an unrestricted or conditional ECM (Error Correction Model).
P y , t = α 0 + i = 1 k α i P y , t i + j = 1 p β j P x , t j + θ 1 P y , t 1 + θ 2 P x , t 1 + ϵ t
Testing the long-term relationship between variables is based on testing the hypothesis H0 that θ1 = θ2 = 0. The rejection of the null hypothesis H0 means accepting the hypothesis of a long-term relationship between the variables Py and Px. The results of the test are correlated with critical values for the lower and upper bounds. The lower bound is based on the assumption that all variables are I(0), while the upper bound is based on the assumption that all variables are I(1). The bounds test can be applied when the residuals from the ARDL model are independent over time. If the bounds test indicates a long-term correlation between the variables, the long-term form of the ARDL model is provided.
P y , t = α 0 + α 1 P x , t + z t
where z (the error correction term, EC) is the series of residuals from the long-term regression (the so-called cointegrating regression).
In the case of detecting cointegration between variables, an Error Correction Model (ECM) derived from the basic ARDL model can be applied. This model allows for the analysis of short-term adjustments to the long-term equilibrium between the variables and takes the following form:
P y , t = α 0 + i = 1 k α i P y , t i + j = 1 p β j P x , t j + γ z t 1 + ϵ t
The coefficient γ from the model indicates the speed of short-term adjustments of prices Py to the long-term equilibrium between prices Py and Px. According to theory, the coefficient γ should be negative.
The article focuses on the analysis of coal and natural gas prices in the following markets:
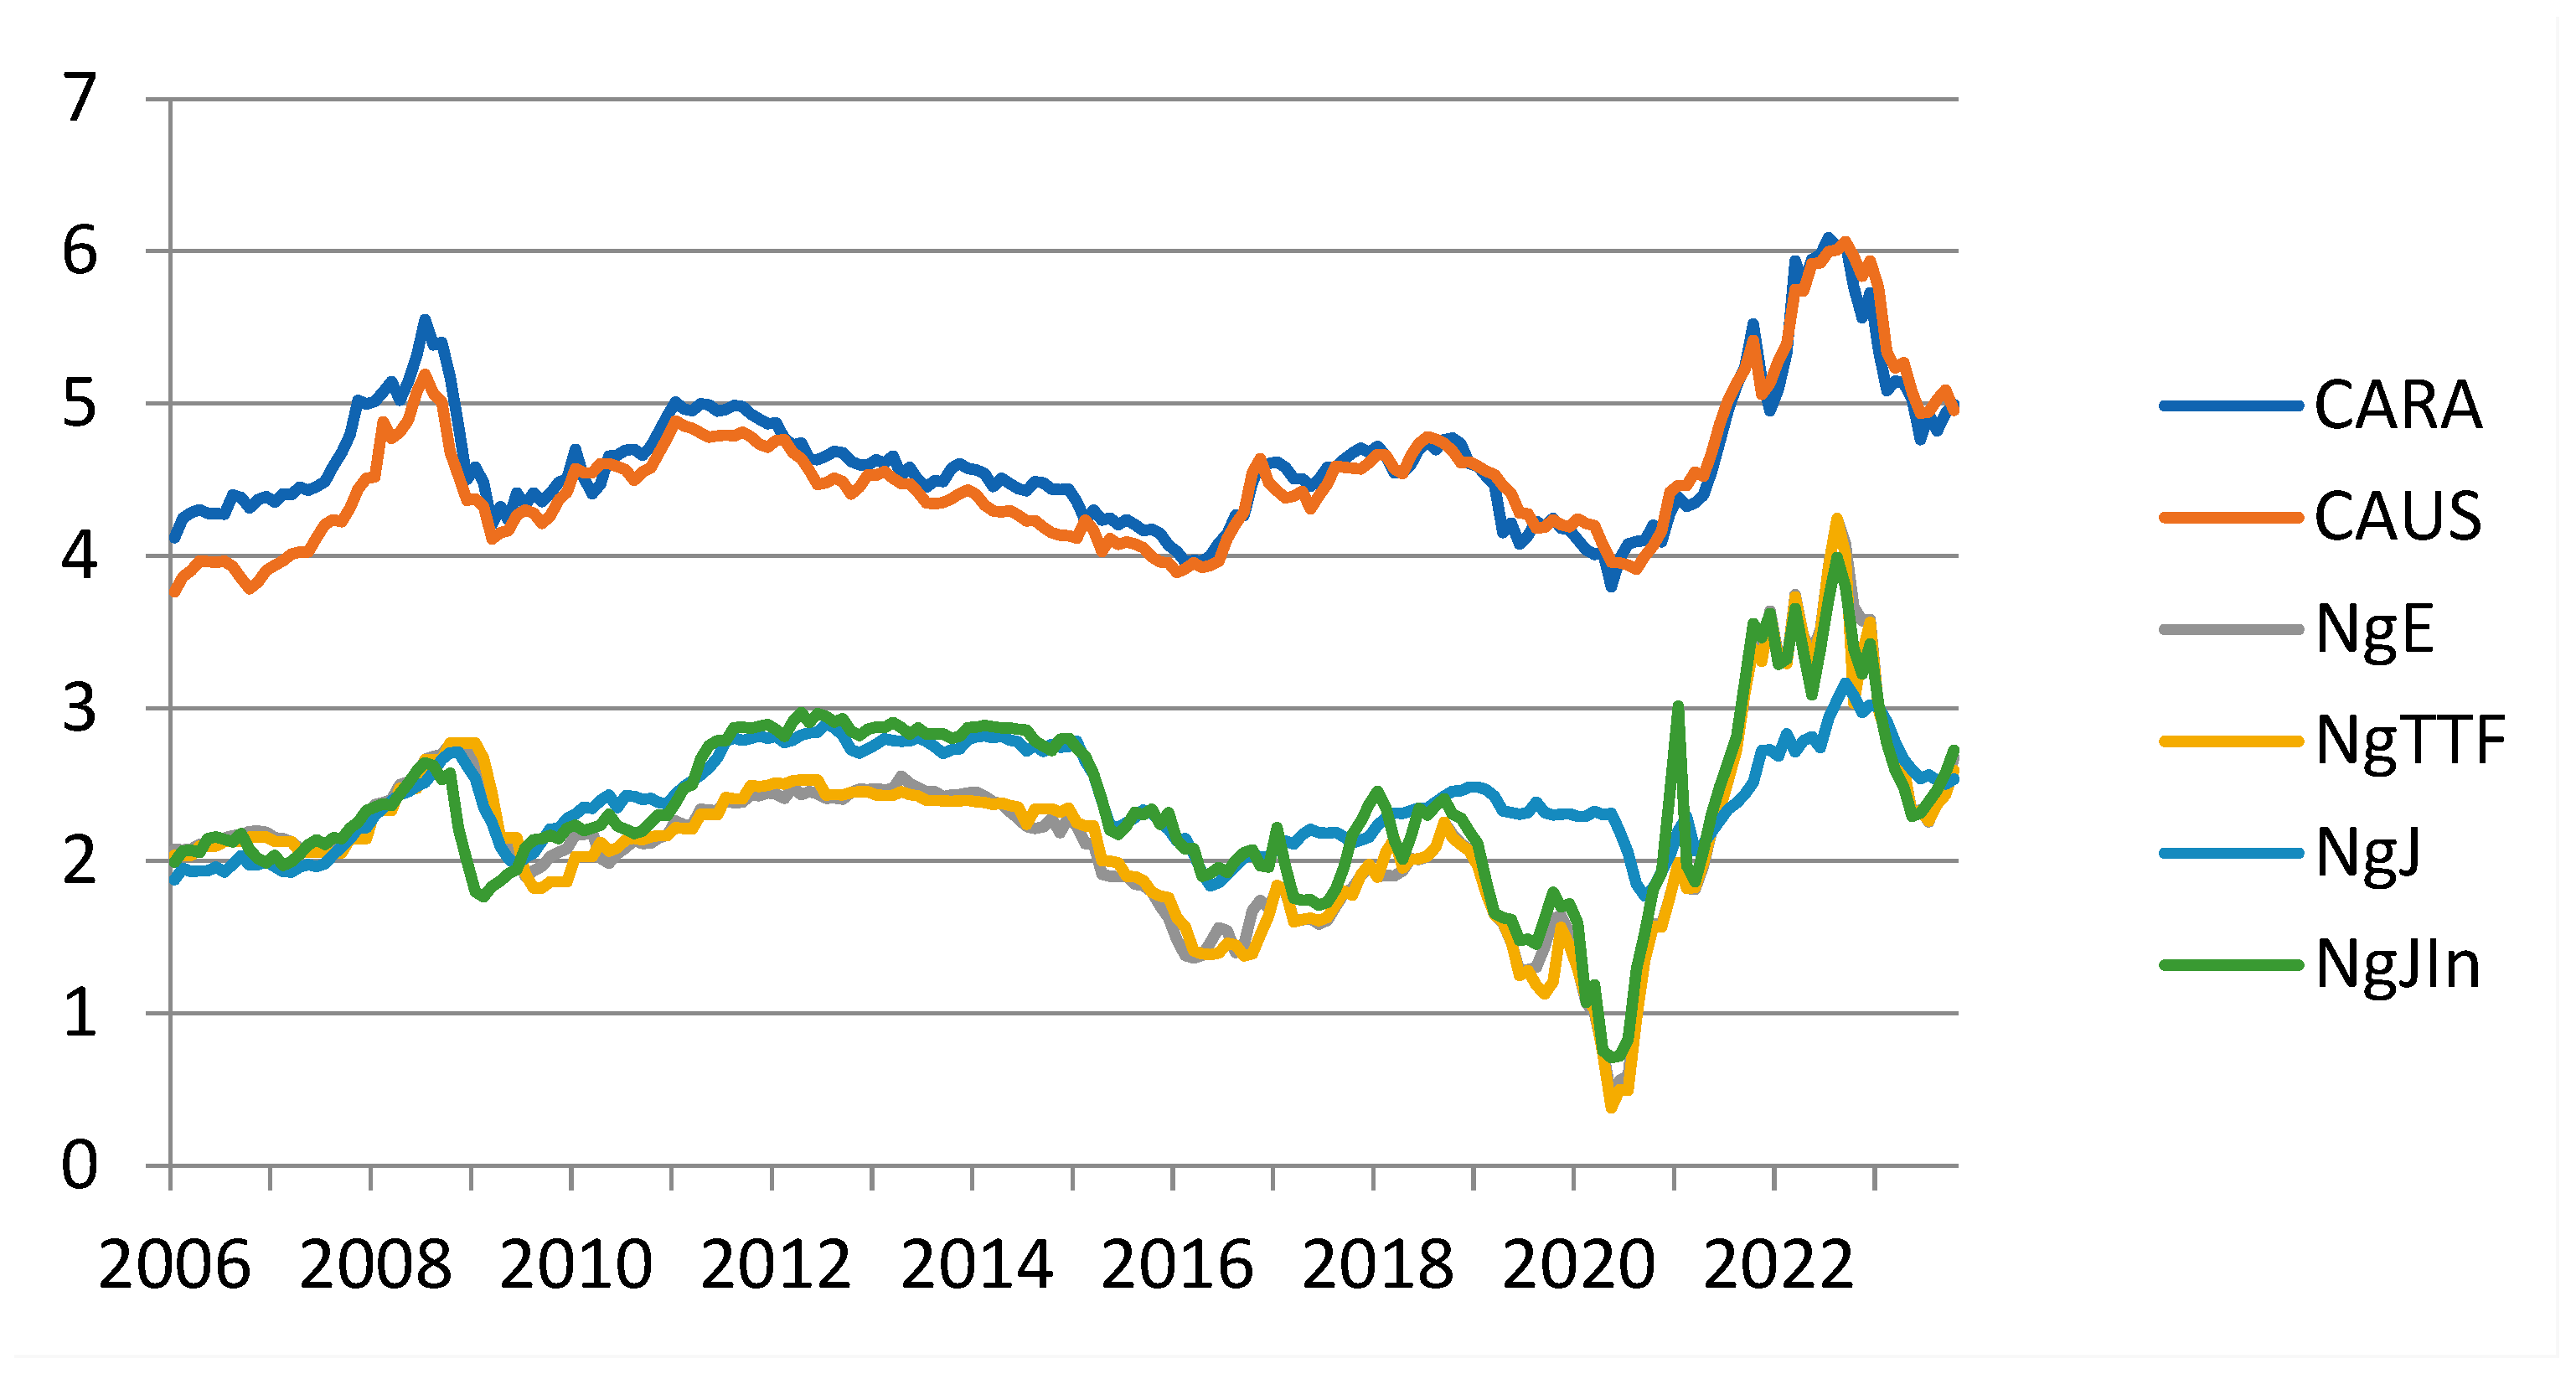
  • CARA—ARA Coal Prices (Amsterdam–Rotterdam–Antwerp) refer to coal prices set in the European market. These are some of the most commonly used reference prices for coal trading in Europe.
  • CAUS—AUS Coal Prices refer to coal exported from Australia, which are determined based on transactions in international markets. AUS coal mainly refers to coal exported from ports in Australia, one of the largest coal exporters in the world.
  • NgE—E Gas Prices refer to natural gas prices on European markets, specifically the prices of gas at the NBP (National Balancing Point) hub in the United Kingdom. NBP is a virtual trading point within the UK gas system that facilitates natural gas trading. It is one of the oldest and most developed gas markets in Europe.
  • NgTTF—TTF Gas Prices refer to natural gas quotations on the Dutch gas exchange, which is one of the most important wholesale gas markets in Europe. TTF is a virtual trading point that allows natural gas trading in Europe through futures and spot contracts.
  • NgJ—JKM Gas Prices (Japan Korea Marker) refer to liquefied natural gas (LNG) prices in the North-East Asian market, primarily covering Japan, South Korea, China, and Taiwan. JKM is a key price index used in spot LNG transactions, i.e., short-term market trading in this region.
  • NgJIn—Import Gas Prices from Indonesia to Japan refer to the prices that Japan pays for liquefied natural gas (LNG) imported from Indonesia. These prices can depend on various factors, including the type of contract involved. In this study, spot prices were used.
Energy commodity markets are characterized by a relatively high level of seasonality, particularly in relation to their use in electricity generation over the annual cycle [52]. Given the consideration of energy commodity prices across different regions of the world, the seasonality present may vary, which could distort the results of the analyses. Therefore the prices were seasonally adjusted using the Census X13 procedure.

4. Results

Energy commodity markets are characterized by significant price volatility, both in the short and long term. From 2006 to 2019, the prices of all the analyzed energy commodities showed similar trends, suggesting a certain degree of synchronization. However, between 2019 and 2024, there were more pronounced fluctuations in the prices of all the analyzed commodities. These fluctuations varied depending on the type of commodity, particularly in the case of natural gas, whose prices experienced a sharp decline around 2020. Coal also saw declines, but to a lesser extent (Figure 3). From mid-2020, coal and gas prices on all analyzed markets began to rise sharply, reaching their highest levels in the last quarter of 2022. This phenomenon may be linked to the war in Ukraine and the decisions made by many European countries to reduce imports of energy commodities from Russia.
Both natural gas and coal prices exhibited similar medium-term trends. The first period, from 2006 to 2011, was a phase of rising prices, characterized by a strong increase, with a short-term downturn in 2009 as a result of the global financial crisis. The second period, from 2012 to 2017, was marked by a gradual decline in energy commodity prices, with no major or abrupt deviations from the main trend. The final period, from 2018 to 2023, saw significant fluctuations in energy markets, driven by factors such as the COVID-19 pandemic and the armed conflict in Europe. At the beginning of this period, the prices of the analyzed commodities fell and then rose very dynamically.
According to the methodological remarks, the analysis of the price series began with unit root tests. The results presented in (Table 1) indicate that the individual variables were integrated of order one, meaning that their first differences were stationary. Therefore, in the analysis of causal relationships using the T-Y method, one additional lag was introduced to the VAR models. As can be observed in virtually all analyzed cases, data stationarity can only be assumed after taking first differences. In this case, the values obtained for the variables under both the constant and constant with trend specifications reach satisfactory levels of statistical significance, thereby allowing the data to be considered stationary. On the other hand, the original, non-differenced data (I~0) are, in the vast majority of cases, characterized by non-stationarity.
In the next stage of the analysis, the Granger causality test, extended by the Toda-Yamamoto procedure, was conducted to examine non-stationary data (Table 2). The test was applied to four time periods: 2006–2023, 2006–2011, 2012–2017, and 2018–2023, in order to investigate the interrelationships between energy commodities for the entire study period and for each of its subperiods. The statistical significance observed across different periods for the analyzed variables indicates that the exogenous variables Granger-cause changes in the endogenous variable. The highest level of significance, marked as ‘d’, was observed in nearly every analyzed period for most variable pairs, with the exception of CARA and NgTTF. It is al-so worth noting the variability in the statistical significance of the results depending on the time period under analysis. The results for 2006–2023 generally indicate the existence of bidirectional relationships between coal and natural gas prices. An exception was found for the CARA and NgTTF pair, where a unidirectional influence of coal prices on natural gas prices was observed. However, comparing the test results for the individual subperiods reveals significant differences between the price pairs and the subperiods. For the NgE—CARA and NgTTF—CARA pairs, coal prices were found to be the cause (in the Granger sense) of natural gas prices in the first and second subperiods. This influence was not confirmed in the third subperiod. However, in all subperiods, a long-term effect of natural gas prices on coal prices was confirmed. The price relationships in the Pacific region did not undergo such noticeable changes. For the NgJ—CAUS pair, the results for the individual subperiods indicated that coal prices influenced natural gas prices. For the NgJIn—CAUS pair, coal prices were found to influence natural gas prices in all subperiods, while in the last subperiod, a highly significant influence of natural gas prices on coal prices was also confirmed.
The results presented above were obtained based on VAR modeling, which is sensitive to the degree of integration of the variables. This complicates the analysis because, depending on the chosen optimization criterion, the number of optimal lags in the VAR model may vary. Therefore, an alternative approach to testing causal relationships based on ARDL models was conducted in this work. Table 3 and Table 4 present the results of testing long-term relationships based on boundary tests and the cointegrating equations derived from ARDL models. It should be noted that the cointegrating equations can describe the long-term relationship specifics only if the bounds test confirms the significance of such relationships. The direction of the relationships between the variables was not assumed a priori; therefore, analyses were conducted for both potential directions of relationships.
Table 3 presents the results of tests for models in which the exogenous variables were coal prices. The results for the entire study period indicated an influence of coal prices on the prices of natural gas NgTTF and NGJ. However, the results for the individual subperiods show that the influence of coal prices on natural gas prices was primarily observed in the first subperiod. The results for 2018–2023, on the other hand, indicate the absence of such an influence. The regression coefficients in the cointegrating equations for periods where the significance of long-term relationships between the variables was confirmed, however, showed significant differences, indicating the instability of these relationships.
Table 4 presents the results of ARDL models in which natural gas prices were treated as the exogenous variable. The impact of gas prices on coal prices for the entire period 2006–2023 was found only for the NgJ—CAUS pair, but this relationship was not observed in any of the subperiods. The results of the analysis for the individual subperiods indicate that for all the studied price pairs, no impact of gas prices on coal prices was found in the second subperiod, covering the years 2012–2017. At the 0.1 significance level, this impact was identified for the NgE—CARA pair, and at the 0.05 level for the NgTTF—CARA pair. Meanwhile, for the subperiod 2018–2023, a highly statistically significant impact of gas prices on coal prices was found in the European market, as well as the impact of NgJIn gas prices on CAUS prices.
The final step of the analysis involved testing the short-term relationships between variables. This was conducted only for those combinations where long-term relationships were confirmed in the ARDL models. The results are presented in Table 5. The speed of return to the long-term relationship between variables following an exogenous price shock is described by the coefficients for the CEq(-−1) variable. The magnitude of these coefficients for models describing the impact of coal prices on natural gas prices was relatively low, indicating a slow adjustment process of natural gas prices to the price shock in the coal market. On the other hand, for the subperiod 2018–2023, the coefficients describing the adjustment of coal prices to the price shock of gas on the European market were relatively high. These coefficients exceeded 0.45, indicating that within 3 months, most of the price gap created by the gas price shock was eliminated due to the adaptive response in coal prices.

5. Discussion

The analysis of the relationship between natural gas and coal prices in Europe over the observed period reveals significant shifts in recent years, particularly from 2018 to 2023. During this period, natural gas prices began to have a pronounced impact on coal prices, whereas the reverse relationship weakened. The results of the bounds tests and T-Y causality tests confirm this trend for the NGTTF–CARA and NgJ–CAUS pairs, showing relatively consistent results. However, in the cases of NgE–CARA and NgJIn–CAUS, the outcomes diverged significantly, suggesting that, in some instances, the relationship between gas and coal prices reversed. These findings align with recent studies that have highlighted how external factors, such as geopolitical disruptions and changes in supply chains, can cause fluctuations in energy prices [46,53].
One key factor influencing these changes in Europe is the ongoing implementation of the EU’s climate policies, particularly the “Fit for 55” package, aimed at reducing carbon emissions and transitioning to cleaner energy sources. As these policies push for a reduction in coal use and a greater reliance on natural gas as a transitional fuel, the interdependencies between gas and coal prices are increasingly shaped by both regulatory pressures and market dynamics. Studies by Wilson and Staffell [54] suggest that the pricing of carbon, through mechanisms such as the EU Emissions Trading System (ETS), plays a crucial role in driving the fuel switch from coal to natural gas. The rise in carbon prices has made coal less competitive, thus reinforcing the growing influence of natural gas prices on coal. However, this trend is not without its complexities, as geopolitical events, such as the disruption of Russian gas supplies, have also led some European countries to temporarily revert to coal to secure energy supplies [55].
This interplay between climate policy and geopolitical factors has been a major determinant in shaping the price relationships between gas and coal in Europe. The strong response to external shocks, such as the war in Ukraine, underscores the vulnerability of the EU’s decarbonization efforts [42]. Geopolitical factors, including the decisions of oil, gas, and coal-producing countries, can significantly influence market behavior by affecting production and export levels [56]. For instance, disruptions in gas supply have at times led to an increase in coal use in the short term, as countries have prioritized energy security over decarbonization goals [41,57]. This phenomenon aligns with previous findings that suggest geopolitical events and external supply shocks can have a profound impact on energy prices and fuel switching dynamics [54].
In contrast to Europe, the price relationships between gas and coal in the Asia-Pacific region, particularly in Japan, have remained relatively stable, with gas prices based on delayed average price formulas showing minimal correlation with coal prices. However, in the most recent period, a pattern similar to that of Europe has emerged, particularly in the case of Indonesian natural gas contracts (NgJIn), which have started to affect Australian coal prices. This shift suggests that, even in markets where price relationships have historically been less volatile, changes in the global energy landscape, driven by policy and market factors, are beginning to reshape the dynamics of fuel pricing which can be partially confirmed by the research conducted by Ma and Wang [58].
The observed trends in both European and Asian markets highlight the growing complexity of the interdependencies between natural gas and coal prices. While the EU’s energy transition policies, coupled with market disruptions, have led to significant changes in price dynamics, the Asia-Pacific region is beginning to show signs of similar shifts. The complexity of these relationships is further compounded by factors such as market structure, carbon pricing, and the intermittency of renewable energy sources, which all play a role in shaping the pricing behavior of fossil fuels [59]. Understanding these interconnections requires not only an examination of economic factors, such as production costs and demand, but also a comprehensive consideration of political, legal, and environmental factors that influence global energy markets [40,41,42].
In conclusion, the relationship between natural gas and coal prices is multifaceted and influenced by a variety of factors, including economic conditions, regulatory frameworks, and geopolitical events. As the global energy landscape continues to evolve, further research is needed to explore how these factors will continue to interact and shape the future of energy pricing.

6. Conclusions

The relationships between the prices of key energy commodities are a frequently addressed issue in energy market analyses. This study aims to answer whether the significant changes that have occurred over the past several years have affected the relationship between coal and natural gas markets. The results for selected commodity prices in European and Asian markets were compared.
The findings indicate that a significant shift in price relationships primarily occurred in European markets. Both VAR-based modeling and ARDL models suggest a change in the direction of causal relationships. In the earlier period (2006–2011), coal price changes significantly influenced natural gas prices, with no evidence of a reverse relationship. However, in the later period (2018–2023), natural gas prices had a significant impact on coal prices, while the reverse relationship weakened. The results of the bounds tests and the T-Y causality tests were relatively consistent for the pairs NGTTF–CARA and NgJ–CAUS. However, for the pairs NgE–CARA and NgJIn–CAUS, the outcomes differed significantly, which may suggest a reversal of trends over the analyzed years in some of the examined cases. In the earlier short-term periods, a clear influence of coal prices on gas prices was observed. However, in the years 2018–2023, the situation changed, and for both the CARA–NgE and CARA–NgTTF pairs, a significant influence of gas prices on coal prices was found. It is also worth noting that the CARA–NgTTF pair showed similar test results across methods, which suggests that the observed trend reversal over time is highly credible.
In Asian markets, the changes were less pronounced, especially for Japanese imported natural gas (NgJ) prices based on delayed average price formulas. However, in the most recent period, a pattern similar to that of European markets emerged, with the prices of natural gas in Indonesian import contracts (NgJIn) affecting Australian coal prices.
In the case of the CAUS–NgJIn commodity pair, an influence of gas prices on coal prices emerged during the 2018–2023 period—an effect that was not observed in previous years. However, this finding was not confirmed by either the bounds test or the T-Y causality test. On the other hand, the test results were relatively consistent for the NgJ–CAUS pair across most of the analyzed periods, suggesting that, with the exception of the years 2012–2017, there was a noticeable influence of coal prices on gas prices. This, in turn, indicates a lack of trend reversal over the analyzed years in the Asia-Pacific markets.
The results suggest the growing importance of natural gas in shaping energy commodity prices. This shift can be attributed to the increasing role of natural gas in energy production, particularly in European markets. However, it is important to note that the period after 2018 was marked by significant supply disruptions in energy markets, especially in Europe. Political disruptions, including those related to the war in Ukraine, had a major impact on European natural gas markets, which may have further contributed to the rising significance of natural gas prices. Non-economic factors, such as the aforementioned armed conflict, represent the most significant limitation of this study. External events unrelated to energy markets can have a substantial impact on commodity prices, as energy resources are often considered strategic in many countries—affecting virtually every aspect of society and the economy. Therefore, the inability to precisely quantify extraordinary, non-economic factors influencing energy commodity prices constitutes the primary limitation of the analysis.

Author Contributions

Conceptualization, J.R. and D.K.; methodology, J.R.; software, J.R.; validation, J.R. and D.K.; formal analysis, D.K.; investigation, D.K.; resources, D.K.; data curation, J.R.; writing—original draft preparation, D.K.; writing—review and editing, D.K.; visualization, J.R. and D.K.; supervision, J.R.; project administration, J.R.; funding acquisition, D.K. All authors have read and agreed to the published version of the manuscript.

Funding

This research received no external funding.

Data Availability Statement

The original data presented in the study are openly available in World Bank and International Monetary Fund databases.

Conflicts of Interest

The authors declare no conflicts of interest.

References

  1. Xing, X.; Cong, Y.; Wang, Y.; Wang, X. The Impact of COVID-19 and War in Ukraine on Energy Prices of Oil and Natural Gas. Sustainability 2023, 15, 14208. [Google Scholar] [CrossRef]
  2. Zakeri, B.; Paulavets, K.; Barreto-Gomez, L.; Echeverri, L.G.; Pachauri, S.; Boza-Kiss, B.; Zimm, C.; Rogelj, J.; Creutzig, F.; Ürge-Vorsatz, D.; et al. Pandemic, War, and Global Energy Transitions. Energies 2022, 15, 6114. [Google Scholar] [CrossRef]
  3. Zakeri, B.; Staffell, I.; Dodds, P.E.; Grubb, M.; Ekins, P.; Jääskeläinen, J.; Cross, S.; Helin, K.; Gissey, G.C. The role of natural gas in setting electricity prices in Europe. Energy Rep. 2023, 10, 2778–2792. [Google Scholar] [CrossRef]
  4. ENTSO-E. Available online: https://www.entsoe.eu/data/power-stats/ (accessed on 4 June 2023).
  5. Perrings, C. Substitutability and the Valuation of Natural Capital. In Conservation: Economics, Science, and Policy; Oxford Academic: Oxford, UK, 2021. [Google Scholar] [CrossRef]
  6. Puka, R.; Jedrusik, S. A New Measure of Complementarity in Market Basket Data. J. Theor. Appl. Electron. Commer. Res. 2021, 16, 670–681. [Google Scholar] [CrossRef]
  7. Telser, L.G. A theory of monopoly of complementary goods. J. Bus. 1979, 52, 211–230. [Google Scholar] [CrossRef]
  8. Gentzkow, M. Valuing new goods in a model with complementarity: Online newspapers. Am. Econ. Rev. 2007, 97, 713–744. [Google Scholar] [CrossRef]
  9. Yalcin, T.; Ofek, E.; Koenigsberg, O.; Biyalogorsky, E. Complementary goods: Creating, capturing, and competing for value. Mark. Sci. 2013, 32, 554–569. [Google Scholar] [CrossRef]
  10. Syverson, C. Product substitutability and productivity dispersion. Rev. Econ. Stat. 2004, 86, 534–550. [Google Scholar] [CrossRef]
  11. Georgieff, A.; Hyee, R. Artificial intelligence and employment: New cross-country evidence. Front. Artif. Intell. 2022, 5, 832736. [Google Scholar] [CrossRef]
  12. Tian, Y.; Lautz, S.; Wallis, A.O.G.; Lambiotte, R. Extracting complements and substitutes from sales data: A network perspective. EPJ Data Sci. 2021, 10, 45. [Google Scholar] [CrossRef]
  13. Adhikari, R.; Putnam, K.J. Comovement in the commodity futures markets: An analysis of the energy, grains, and livestock sectors. J. Commod. Mark. 2020, 18, 100090. [Google Scholar] [CrossRef]
  14. Hamao, Y.; Masulis, R.W.; Ng, V. Correlations in Price Changes and Volatility across International Stock Markets. Rev. Financ. Stud. 1990, 3, 281–307. [Google Scholar] [CrossRef]
  15. Wang, Y.; Jian, C. Sustainable plant-based ingredients as wheat flour substitutes in bread making. npj Sci. Food 2022, 6, 49. [Google Scholar] [CrossRef]
  16. Przekota, G. Do High Fuel Prices Pose an Obstacle to Economic Growth? A Study for Poland. Energies 2022, 15, 6606. [Google Scholar] [CrossRef]
  17. Debnath, D.; Whistance, J.; Thompson, W.; Binfield, J. Complement or substitute: Ethanol’s uncertain relationship with gasoline under alternative petroleum price and policy scenarios. Appl. Energy 2017, 191, 385–397. [Google Scholar] [CrossRef]
  18. Katarzyński, D.; Przekota, G. Pro-Inflationary Significance of Energy Commodity and Electricity Prices. Acta Scientiarum Polonorum. Oeconomia 2024, 23, 29–40. [Google Scholar] [CrossRef]
  19. Neely, C.J. The Russian Invasion, Oil and Gasoline Prices, and Recession. Econ. Synop. 2022, 10, 1–2. [Google Scholar] [CrossRef]
  20. von Homeyer, I.; Oberthür, S.; Dupont, C. Implementing the European Green Deal during the Evolving Energy Crisis. J. Common Mark. Stud. 2022, 60, 125–136. [Google Scholar] [CrossRef]
  21. Painter, D.S. Oil and Geopolitics: The Oil Crises of the 1970s and the Cold War. Hist. Soc. Res. 2014, 39, 186–208. [Google Scholar]
  22. Kilian, L.; Zhou, X. Oil Prices, Gasoline Prices and Inflation Expectations: A New Model and New Facts; Federal Reserve Bank of Dallas: Dallas, TX, USA, 2020. [Google Scholar]
  23. Rembeza, J. Coal prices in Poland: Is the domestic market separated from the international market? Int. J. Energy Econ. Policy 2020, 10, 405–410. [Google Scholar] [CrossRef]
  24. Li, H.; Chen, L.; Wang, D.; Zhang, H. Analysis of the Price Correlation between the International Natural Gas and Coal. Energy Procedia 2017, 142, 3141–3146. [Google Scholar] [CrossRef]
  25. Villar, J.A.; Joutz, F.L. The relationship between crude oil and natural gas prices. Energy Inf. Adm. 2006, 1, 1–43. [Google Scholar]
  26. Aloui, D.; Goutte, S.; Guesmi, K.; Hchaichi, R. COVID 19’s Impact on Crude Oil and Natural Gas S&P GS Indexes. 2020. Available online: https://shs.hal.science/halshs-02613280/ (accessed on 29 May 2024).
  27. Bartholomae, F.; Morasch, K. Oil Price Indexing of Natural Gas Prices: An Economic Analysis. Rev. Econ. 2007, 58, 250–264. [Google Scholar] [CrossRef]
  28. Mchich, A.; Till, H. Is Oil-Indexation Still Relevant for Pricing Natural Gas? CME Group, Articles and Reports. 2020. Available online: https://papers.ssrn.com/sol3/papers.cfm?abstract_id=3709139 (accessed on 29 May 2024).
  29. Min, H. Examining the Impact of Energy Price Volatility on Commodity Prices from Energy Supply Chain Perspectives. Energies 2022, 15, 7957. [Google Scholar] [CrossRef]
  30. Lorenz, U.; Grudzinski, Z. Hard coal for energetic purposes: Price-quality relationships; international coal market observations and Polish practice. Appl. Energy 2003, 74, 271–279. [Google Scholar] [CrossRef]
  31. Zhu, S.; Chi, Y.; Gao, K.; Chen, Y.; Peng, R. Analysis of Influencing Factors of Thermal Coal Price. Energies 2022, 15, 5652. [Google Scholar] [CrossRef]
  32. Dubiński, J.; Turek, M. Chances and Threats of Hard Coal Mining Development in Poland. Arch. Min. Sci. 2014, 59. [Google Scholar]
  33. Liu, X.; Wojewodzki, M.; Cai, Y.; Sharma, S. The dynamic relationships between carbon prices and policy uncertainties. Technol. Forecast. Soc. Change 2023, 188, 122325. [Google Scholar] [CrossRef]
  34. Zarębski, P.; Katarzyński, D. Small Modular Reactors (SMRs) as a Solution for Renewable Energy Gaps: Spatial Analysis for Polish Strategy. Energies 2023, 16, 6491. [Google Scholar] [CrossRef]
  35. Anderson, R.J. Europe’s Dependence on Russian Natural Gas: Perspectives and Recommendations for a Long-Term Strategy; George C. Marshall European Center for Security Studies: Garmisch-Partenkirchen, Germany, 2008. [Google Scholar]
  36. Chai, J.; Zhang, X.; Lu, Q.; Zhang, X.; Wang, Y. Research on imbalance between supply and demand in China’s natural gas market under the double-track price system. Energy Policy 2021, 155, 112380. [Google Scholar] [CrossRef]
  37. Sgarciu, S.; Scholz, D.; Müsgens, F. How CO2 prices accelerate decarbonisation–The case of coal-fired generation in Germany. Energy Policy 2023, 173, 113375. [Google Scholar] [CrossRef]
  38. Loewen, B. Coal, green growth and crises: Exploring three European Union policy responses to regional energy transitions. Energy Res. Soc. Sci. 2022, 93, 102849. [Google Scholar] [CrossRef]
  39. Rečka, L.; Ščasný, M. Impacts of carbon pricing, brown coal availability and gas cost on Czech energy system up to 2050. Energy 2016, 108, 19–33. [Google Scholar] [CrossRef]
  40. Faiella, I.; Mistretta, A. The Net Zero Challenge for Firms’ Competitiveness. Environ. Resour. Econ. 2022, 83, 85–113. [Google Scholar] [CrossRef]
  41. Zábojník, S.; Steinhauser, D.; Peštová, V. Decarbonisation: Do EU Electricity Costs Harm Export Competitiveness? Amfiteatru Econ. 2023, 25, 522–540. [Google Scholar] [CrossRef]
  42. Mišík, M. The EU Needs to Improve Its External Energy Security. Energy Policy 2022, 165, 112930. [Google Scholar] [CrossRef]
  43. Alam, M.S.; Murshed, M.; Manigandan, P.; Pachiyappan, D.; Abduvaxitovna, S.Z. Forecasting oil, coal, and natural gas prices in the pre-and post-COVID scenarios: Contextual evidence from India using time series forecasting tools. Resour. Policy 2023, 81, 103342. [Google Scholar] [CrossRef]
  44. Nagle, P.; Tema, K. Energy Market Developments: Coal and Natural Gas Prices Reach Record Highs; World Bank Blogs: Washington, DC, USA, 2022. [Google Scholar]
  45. Alvarez, C.F.; Molnar, G. What Is Behind Soaring Energy Prices and What Happens Next? IEA: International Energy Agency. France. Available online: https://coilink.org/20.500.12592/4bx52n (accessed on 14 April 2025).
  46. Chen, L.; Pan, L.; Zhang, K. The Dynamic Cointegration Relationship between International Crude Oil, Natural Gas, and Coal Price. Energies 2024, 17, 3126. [Google Scholar] [CrossRef]
  47. Erdős, P. Have Oil and Gas Prices Got Separated? Energy Policy 2012, 49, 707–718. [Google Scholar] [CrossRef]
  48. Chiappini, R.; Jégourel, Y.; Raymond, P. Towards a Worldwide Integrated Market? New Evidence on the Dynamics of US, European and Asian Natural Gas Prices. Energy Econ. 2019, 81, 545–565. [Google Scholar] [CrossRef]
  49. Ramberg, D.J.; Parsons, J.E. The weak tie between natural gas and oil prices. Energy J. 2012, 33, 13–35. [Google Scholar] [CrossRef]
  50. Bai, J.; Perron, P. Critical values for multiple structural change tests. Econom. J. 2003, 6, 72–78. [Google Scholar] [CrossRef]
  51. Pesaran, M.H.; Shin, Y.; Smith, R.J. Bounds testing approaches to the analysis of level relationships. J. Appl. Econom. 2001, 16, 289–326. [Google Scholar] [CrossRef]
  52. Campos, A.; Fernandes, C.P. The geopolitics of energy. Geopolit. Energy Energy Secur. 2017, 23–40. [Google Scholar] [CrossRef]
  53. Chevallier, J.; Nguyen, D.K.; Reboredo, J.C. A conditional dependence approach to CO2-energy price relationships. Energy Econ. 2019, 81, 812–821. [Google Scholar] [CrossRef]
  54. Wilson, I.A.G.; Staffell, I. Rapid fuel switching from coal to natural gas through effective carbon pricing. Nat. Energy 2018, 3, 365–372. [Google Scholar] [CrossRef]
  55. Kartal, M.T.; Pata, U.K.; Depren, S.K.; Depren, Ö. Effects of possible changes in natural gas, nuclear, and coal energy consumption on CO2 emissions: Evidence from France under Russia’s gas supply cuts by dynamic ARDL simulations approach. Appl. Energy 2023, 339, 120983. [Google Scholar] [CrossRef]
  56. Zhang, Y.; Hajiyev, N.; Smirnov, V. Tariff and non-tariff instruments of OPEC+ trade wars. Energy Strategy Rev. 2021, 38, 100771. [Google Scholar] [CrossRef]
  57. Khan, K.; Su, C.-W.; Rehman, A.U. Do multiple bubbles exist in coal price? Resour. Policy 2021, 73, 102232. [Google Scholar] [CrossRef]
  58. Ma, Y.; Wang, J. Co-movement between oil, gas, coal, and iron ore prices, the Australian dollar, and the Chinese RMB exchange rates: A copula approach. Resour. Policy 2019, 63, 101471. [Google Scholar] [CrossRef]
  59. Thomas, S.; Rosenow, J. Drivers of increasing energy consumption in Europe and policy implications. Energy Policy 2020, 137, 111108. [Google Scholar] [CrossRef]
Figure 1. Price of CO2 emission rights (€/t).
Energies 18 02201 g001
Figure 2. EU imports of liquefied natural gas by partner. Source: https://www.gospodarkamorska.pl/ (accessed on 28 May 2024).
Energies 18 02201 g002
Figure 3. Natural gas and coal prices (natural logarithms).
Energies 18 02201 g003
Table 1. Coal and natural gas prices—unit root with break tests.
CommodityI~0I~1
ConstantConstant
and Trend
ConstantConstant
and Trend
CARA−3.9674−3.6825−12.7885 c−13.3747 c
CAUS−3.6297−3.5580−10.4768 c−10.6301 c
NgE−3.6362−4.2477−11.7214 c−11.9260 c
NgTTF−3.30989−4.0508−12.6312 c−12.7935 c
NgJ−3.6447−4.7157 a−10.2566 c−9.5703 c
NgJIn−4.1785 a−4.4394−4.4775 b−4.8514 b
a–c—significant respectively at 0.1, 0.05, 0.001.
Table 2. Granger causality (T-Y procedure, χ2 tests).
Variable2006–20232006–20112012–20172018–2023
EndogenousExogenous
NgECARA13.07 c38.32 d6.33 b0.65
CARANgE8.50 b8.93 b8.71 b18.58 d
NgTTFCARA9.57 b25.66 d18.22 d0.87
CARANgTTF2.5610.21 c9.18 c11.27 c
NgJCAUS27.79 d25.42 d5.87 b28.82 d
CAUSNgJ8.66 b2.883.544.26
NgJInCAUS20.28 d19.57 d9.26 c10.45 b
CAUSNgJIn7.86 b4.752.0924.86 d
b–d—significant respectively at 0.05, 0.01 and 0.001.
Table 3. Bounds tests and cointegrated equations—impact of coal prices on natural gas prices.
Endogenous, Exogenous
Variable Period
Bounds TestCointegrated Equations
NgE, CARA
2006–20232.3497NgE = −2.8820 d + 1.090 CARA b
2006–20119.2270 dNgE = −0.9325 b + 0.6849 CARA d
2012–20173.2119NgE = −23.8508 + 5.7165 CARA
2018–20232.9983NgE = −4.3185 d + 1.3772 CARA d
NgTTF, CARA
2006–20234.8816 cNgTTF = −3.6489 d + 1.2555 CARA d
2006–201111.5936 dNgTTF = −1.8847 b + 0.8875 CARA d
2012–20177.6604 dNgTTF = −18.7019 a + 4.5981 CARA b
2018–20233.1423NgTTF = −4.3069 d + 1.3687 CARA d
NgJ, CAUS
2006–20233.8901 aNgJ = 0.9045 + 0.7368 CAUS d
2006–20119.8642 dNgJ = −1.0567 c + 0.7619 CAUS d
2012–20172.6146NgJ = −8.5039 + 2.4859 CAUS
2018–20239.7543 dNgJ = 0.1522 + 0.4793 CAUS d
NgJIn, CAUS
2006–20231.5264NgJIn = 0.6256 + 0.3742 CAUS
2006–20110.3553NgJIn = −4.2565 + 1.5071 CAUS
2012–20172.5873NgJIn = −12.7889 + 3.4195 CAUS
2018–20232.0934NgJIn = −2.1498 + 0.9305 CAUS
a–d—significant respectively at 0.1, 0.05, 0.01 and 0.001.
Table 4. Bounds tests and cointegrated equations—impact of natural gas prices on coal prices.
Endogenous, Exogenous
Variable Period
Bounds TestCointegrated Equations
CARA, NgE
2006–20233.3705CARA = 3.441 d + 0.5550 NgE d
2006–20113.9377 aCARA = −4.9090 + 4.1969 NgE
2012–20172.8533CARA = 5.3863 c − 0.4434 NgE
2018–202316.1281 dCARA = 3.2961 d + 0.6566 NgE d
CARA, NgTTF
2006–20232.7845CARA = 3.5591 d + 0.5094 NgTTF d
2006–20114.3841 bCARA = −51.6903 + 24.8642 NgTTF
2012–20173.3054CARA = 6.4541 a − 0.9668 NgTTF
2018–20239.4005 dCARA = 3.3168 + 0.6581 NgTTF
CAUS, NgJ
2006–20234.1625 aCAUS = 22.8752 − 7.8616 NgJ
2006–20112.6221CAUS = −8.1853 + 5.3628 NgJ
2012–20172.2799CAUS = 10.8431 − 2.6671 NgJ
2018–20230.8794CAUS = −4.5728 + 3.7946 NgJ
CAUS, NgJIn
2006–20231.8961CAUS = 4.1238 d + 0.2060 NgJIn
2006–20111.8304CAUS = 6.4672 − 0.8703 NgJIn
2012–20172.0118CAUS = 7.1325 a − 1.1540 NgJIn
2018–202310.5194 dCAUS = 3.0021 d + 0.7805 NgJIn d
a–d—significant respectively at 0.1, 0.05, 0.01 and 0.001.
Table 5. Bounds tests and cointegrated equations—impact of natural gas prices on coal prices.
Endogenous, Exogenous
Variable Period
ECM Reressions
CARA, NgE
2006–2011d(NgE) = 0.0550 d(NgE(-−1) − 0.0414 d(CARA) − 0.0056 d(CARA(−1)–
−0.2362 CEq(−1)d; Adj R2 = 0.4136
NgTTF, CARA
2006–2023d(NgTTF) = 0.1436 d(NgTTF(−1)) b + 0.4882 d(CARA) d − 0.0992 CEq(−1) d
Adj. R2 = 0.2556
2006–2011d(NgTTF) = 0.0297 d(CARA) − 0.1743 CEq(−1) d
Adj R2 = 0.3971
2012–2017
NgJ, CAUSd(NgTTF) = 0.1789(NgTTF(−1) − 0.2811 d(NgTTF(−2) + 0.1764 d(CARA) a
−0.0202 d(CARA(−1) + 0.3368 d(CARA(−2) c + 0.2398 d(CARA(−3)) d – 0.0359 CEq(−1) d
Adj R2 = 0.4321
2006–2011d(NgJ) = 0.2275 d(NgJ(−1)) b + 0.3120 d(NgJ(−2)) c − 0.1421 CEq(−1) d
Adj. R2 = 0.5885
2018–2023d(NgJ) = 0.2582 d(NgJ(−1)) c − 0.0154 d(CAUS) − 0.3119 CEq(−1) d
Adj. R2 = 0.3965
CARA, NgE
2018–2023d(CARA) = −0.4524 CEq(−1) d
Adj. R2 = 0.4190
CARA, NgTTF
2018–2023d(CARA) = 0.2308 d(CARA(−1)) b + 0.3373 d(NgTTF) d − 0.1332 d(NgTTF(−1)) –
−0.1733 d(NgTTF(−2) c − 0.4792 CEq(−1) d;
Adj. R2 = 0.4888
CAUS, NgJIn
2018–2023d(CAUS) = 0.1559 d(CAUS(−1)) − 0.2170 CEq(−1) d
Adj. R2 = 0.4467
a–d—significant respectively at 0.1, 0.05, 0.01 and 0.001.
Disclaimer/Publisher’s Note: The statements, opinions and data contained in all publications are solely those of the individual author(s) and contributor(s) and not of MDPI and/or the editor(s). MDPI and/or the editor(s) disclaim responsibility for any injury to people or property resulting from any ideas, methods, instructions or products referred to in the content.

