Abstract
Direct injection of hydrogen at high pressures into an otherwise unmodified heavy-duty diesel engine offers a near-term pathway to near-zero greenhouse gas emissions for commercial vehicles. Hydrogen direct-injection engines maintain diesel-like performance with equal or better thermal efficiency. Supplying the hydrogen for injection pressures of ~30 MPa requires a high-pressure supply. Onboard hydrogen compression enables more complete utilization of the stored compressed hydrogen; however, it introduces a significant parasitic load on the engine. The magnitude of this load depends on factors such as the compressor’s configuration, capacity, pressure ratio, efficiency, and the engine’s operating conditions. This paper presents an exergy analysis of an onboard hydrogen compression system that uses hydraulically driven free-floating pistons, sized for heavy-duty commercial vehicles. Minimizing the parasitic loads from the compressor is essential to retain vehicle performance and maximize system-wide efficiency. The exergy analysis approach provides a comprehensive understanding of the whole compression system by comparably quantifying the losses across all components. A one-dimensional model of the compression system, developed in GT-SUITETM and validated with experimental data, is used to quantify the main exergy loss components. Exergy efficiency ranges from 12% to 45% under varying pressure ratios and cycle frequencies, with a pronounced increase in efficiency observed at higher cycle frequencies. Major exergy losses occur in the hydraulic driving system up to 79%, especially during retracting and idle phases for lower pressure ratios and cycle frequencies. Within the compression cylinder, exergy destructions account for less than 10% of the total work input, wherein heat transfer and piston friction are identified as the dominant contributors to exergy destruction, with their effects intensifying at higher pressure ratios. This work highlights the challenges of onboard gas compression and develops a systematic framework that can compare compressor design alternatives for different driving cycles.
1. Introduction
The carbon footprint of heavy-duty vehicles (HDVs) has grown considerably over recent decades, particularly compared with other transportation sectors. Since 1990, CO2 emissions from HDVs in the United States have nearly doubled [1]. Within the HDV sector, tractor-trailers or long-haul trucks (LHTs) are the most significant contributors. Although long-haul trucks represent a relatively small share of the U.S. HDV fleet, they are responsible for approximately 60% of total HDV greenhouse gas (GHG) emissions, due to their high annual mileage, vehicle weight, and fuel consumption [2]. In response, stringent regulations have been targeting LHTs to reduce GHG emissions [3].
Decarbonizing the road freight sector is a significant challenge [4]. While hybrid and battery electric trucks are well suited for short-distance duty cycles with low to medium cargo loads, fuel cell and hydrogen internal combustion engines (H2 ICEs) are more appropriate for long-haul applications requiring extended range and high payload capacity [5]. Substantial improvements in ICEs, powertrains, and vehicle design and operation can significantly reduce GHG emissions from long-haul trucks [6]. For example, long-haul diesel trucks have a considerable CO2 reduction potential by building on mature and efficient ICEs paired with low- or zero-carbon content alternative gaseous fuels without compromising performance [7].
Engines using high-pressure direct injection (HPDI) of hydrogen can achieve diesel-like thermal efficiency while replacing more than 95% of diesel fuel with hydrogen [8]. An HPDI engine retains a diesel-like process, with fuel injected directly into the combustion chamber at pressures up to 28 MPa as the piston approaches top-dead-center of the compression stroke. A small amount of diesel (typically 3–5% of the total fuel) is injected first, followed by direct injection of hydrogen as the main fuel. The diesel sprays autoignite, providing the ignition for the subsequent hydrogen fuel jets. The non-premixed combustion of the hydrogen means that end-gas autoignition and preignition are not limitations. As a result, the base diesel engine architecture does not require modification, with its high compression ratio (17:1 or greater) enabling high thermodynamic efficiencies [8,9]. Lean, non-premixed HPDI combustion also avoids the part-load throttling losses typically seen in spark-ignited gaseous-fueled engines [9]. For HPDI, the gaseous fuel rail pressure to the engine needs to exceed peak cylinder pressures, approaching 28 MPa in modern heavy-duty engines [10]; even higher pressures can improve performance and emissions [11]. HPDI technology for long-haul commercial trucks has been developed for liquefied natural gas (LNG) by Westport Fuel Systems (WFS), reducing CO2 emissions by up to 20% compared with diesel [12,13]. A continuous supply of high-pressure fuel is supplied to the engine by a hydraulically driven pump immersed in the cryogenic LNG tank. For fuels stored on the vehicle as a compressed gas, such as hydrogen (H2), an onboard gaseous compression system is essential to supply high-pressure gaseous fuel to the engine as storage tank pressures decline. Such a system will ensure that most of the hydrogen in the tanks is utilized effectively, enabling HPDI adoption in regions where liquefied hydrogen infrastructure is unavailable by employing compressed hydrogen as a more viable storage alternative [14,15].
Achieving high thermal efficiency with hydrogen-fueled HPDI (high-pressure direct injection) engines, comparable to conventional diesel engines, has become a major focus in advanced ICE research. However, most existing studies concentrate on combustion strategies or on-engine components [16,17], with limited attention given to fuel delivery infrastructure, particularly the feasibility of onboard hydrogen compression. To date, no published work has systematically addressed the viability, design challenges, or system-level impacts of onboard hydrogen compression in commercial vehicle applications. Stationary hydrogen compressors for vehicle refueling have been extensively researched [18], but the applicability of these systems to the demands of an on-vehicle application is limited. As the engine effectively provides the compression work either directly or indirectly, minimizing work input is critical. As storage tanks are depleted, the supply pressure to the compressor declines while the discharge pressure should remain constant, around 30 MPa. This demands operation under varying pressure ratios and inlet charge densities. Additionally, constraints on size, complexity, and reliability, such as avoiding high discharge temperatures (limiting gas pressure ratios), are critical.
While numerous compressor options exist for hydrogen compression, few can meet the stringent requirements of vehicular applications. Although widely used in stationary applications, reciprocating piston and diaphragm compressors are less suitable for on-vehicle uses due to their size, power requirements, less flexibility in the capacity control, poor reliability, and overall system complexity [19,20]. More advanced approaches, such as ionic liquid or metal hydride compressors, offer higher efficiency [21], but their maturity and reliability remain insufficient for mobile applications [22,23], necessitating further research. A hydraulic-driven piston gas booster compressor, used in hydrogen refueling stations [24], presents a promising solution for vehicles meeting specific onboard requirements and limitations (e.g., compact design appropriate for limited space, tolerant to noise, vibration, and harshness (NVH), and responsive to transient duty cycles). It offers compatibility with variable pressure ratios and mass flow rates, ensuring efficient hydrogen delivery. Additionally, its scalability, reliability, simple design, low maintenance requirements, and cost-effectiveness make it a viable choice for onboard hydrogen compression in commercial vehicles.
In this concept, hydrogen is compressed within a piston-cylinder configuration driven by a hydraulic system. A free-floating piston, not connected to a crank drive, separates the hydrogen from the hydraulic oil. Compression occurs as hydraulic oil is pumped into one side of the cylinder, pushing the piston to reduce the volume on the opposite side, thereby compressing the hydrogen. The hydraulic pump can be coupled directly to the internal combustion engine’s (ICE) crankshaft to minimize mechanical energy transfer losses. However, it is critical to reduce the resulting parasitic loads to maintain engine power output and efficiency.
Performance and efficiency analysis of hydraulic-driven piston gas booster compressors for on-vehicle use is missing and is notably limited even in stationary applications. Ye et al. used computational fluid dynamics (CFD) for heat transfer analysis of a hydraulic-driven piston compressor for hydrogen refueling stations. The work demonstrated that the compression stroke is closer to the adiabatic behavior, but not strictly adiabatic, at higher cycle frequencies [25]. Additionally, the study revealed that compressor valves not only cause pressure fluctuations but also lead to temperature fluctuations inside the cylinder unsteadily [26]. Wang et al. [27] experimentally investigated a double-stage hydraulic-driven piston hydrogen compressor across various operating pressures with a fixed pressure ratio of around 6. Overall system efficiencies, defined as indicated work from the P-V diagram vs. electrical power consumption, increased from ~50% to ~59% as the operating discharge pressure increased from 37 to 65.5 MPa.
A fundamental challenge in comparing the performance of different piston compressor designs lies in defining efficiency across varying operating conditions. Previous studies have primarily relied on basic metrics, such as input or indicated power, in evaluating how key parameters (e.g., compressor speed, clearance, pressure ratio) impact performance [28]. To build on these efforts, exergy analysis offers a valuable approach by identifying the system-wise losses and quantifying their associated costs, a perspective that remains underreported in the literature [29]. McGovern et al. [30] developed an exergy analysis for a reciprocating piston refrigeration compressor, showing that throttling is the biggest contributor to shaft power wastage. Niazmand et al. [31] developed a numerical method to study the effects of significant design parameters on the isentropic and exergy efficiencies of a reciprocating piston compressor for CNG refueling stations. The results indicate that higher clearance, pressure ratio, and valve area ratio enhance compressor exergy efficiency, whereas increased speed reduces it. Thus, a research gap exists in conducting a detailed and comprehensive performance analysis of the entire system, integrating both the compressor and the driving mechanism for the on-vehicle hydrogen compression.
This research addresses these critical gaps by (1) developing a simulation framework that supports advancement of an onboard H2 compression system tailored to HPDI engine requirements that explicitly incorporates the unique thermophysical properties of hydrogen, such as low molecular weight, low density, and high gas constant during high-pressure compression; (2) integrating exergy analysis into the system-level modeling framework allowing for the quantification of irreversibilities and energy losses not only within the gas compression process but also across the driving subsystems; and (3) providing a fundamental framework capable of supporting the comparative assessment of other hydrogen compression technologies powered by hydraulic systems, such as ionic liquid compressors and diaphragm compressors, which are increasingly relevant in hydrogen refueling and storage infrastructures (as suggested in, e.g., ref. [24]).
2. Materials and Methods
This study uses experimental data from a single-stage floating piston test facility running with CNG to validate a system-level model developed in a 1D modeling environment (GT-SUITETM v2024, Gamma Technologies LLC, Westmont, IL, USA). The model solves conservation equations for mass, energy, and momentum at each time step to determine the properties of gas and hydraulic oil in each component, incorporating real gas effects. The authors extended the model to accommodate hydrogen in the existing testing setup. Then, they developed a new exergy analysis framework that incorporates both real gas and hydraulic oil properties to calculate the entropy generation and, consequently, exergy destruction in each element, based on equations derived from the second law of thermodynamics. The exergy destruction is integrated over a duty cycle period and normalized by the total work input to quantify each component’s contribution to exergy destruction. This analysis evaluates system efficiency across various pressure ratios and cycle frequencies, highlighting each component’s contribution to work input losses under different operating conditions.
2.1. Hydraulic-Driven Free-Floating Piston Gas Booster
Key components and working principles of a free-floating piston gas booster compressor are illustrated in Figure 1. Inside the cylinder, a well-sealed floating piston separates the compressed gas (e.g., hydrogen) from the hydraulic oil. The intake and discharge check valves, along with a proximity switch, are installed in the gas cap. During the compression stroke, hydraulic oil is pumped into the hydraulic chamber, displacing the floating piston, hence compressing the gas in the gas chamber by reducing its volume. When the gas chamber pressure exceeds the pressure in the discharge stream, which is typically around 30 MPa, the discharge check valve opens. Compressed gas flows into the discharge line at a volumetric flow rate equal to the rate at which hydraulic fluid is being supplied. The proximity switch detects when the piston reaches the end of its travel and shuts off the hydraulic flow to the cylinder. The high-pressure gas forces the piston to move backward, discharging hydraulic oil to the drain line. As the gas inside the cylinder expands and its pressure drops below the incoming gas supply pressure, the intake valve opens to refill the gas chamber. This process continues until the piston has reached the hydraulic end cap. The piston speed during the retracting phase is regulated by a flow control valve positioned in the oil return line.
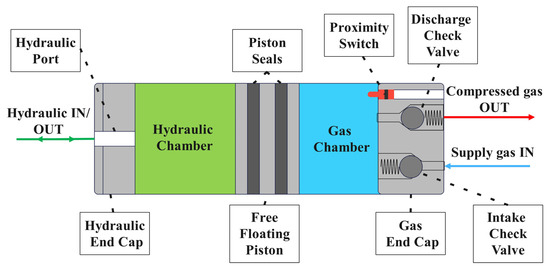
Figure 1.
Schematic of a free-floating piston gas booster showing the main components. Hydraulic flow paths (inlet and outlet) are indicated by green; supply gas inflow is shown with blue, and discharge gas outflow is represented by red arrows, respectively.
2.2. Experimental Setup
The facility used to evaluate and validate the numerical model incorporates a pair of identical hydraulic-driven single-stage gas boosters working in parallel, coupled to supply and discharge gas lines and a hydraulic supply system. The entire system layout is shown in Figure 2. Hydraulic flow is provided by a fixed-displacement oil pump driven by an 11.25 kW electric motor operating at 1760 rpm. Technical specifications of this compressor testing facility are summarized in Table 1.
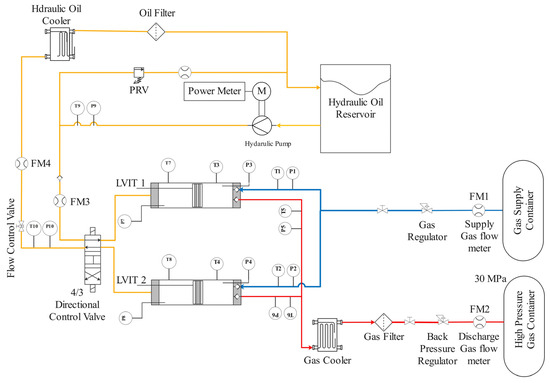
Figure 2.
Schematic of the testing setup for hydraulic-driven single-stage gas boosters in a parallel configuration (orange lines: hydraulic oil, blue: low-pressure gas supply, and red: high-pressure discharge gas).

Table 1.
Overview of the testing facility specifications.
During operation in this parallel configuration, the directional control valve (DCV) directs the hydraulic flow to supply one cylinder while allowing the other to drain into the reservoir. The cylinder receiving the hydraulic fluid compresses and discharges gas to the high-pressure system, while the other cylinder ingests lower-pressure gas from the supply line. When the compressing cylinder reaches the end of its travel (detected by the proximity sensor), DCV switches, reversing the flow between the two cylinders. To control the flow rate through the system, the DCV switches to the middle position (Figure 2), connecting the hydraulic pump flow and both compression cylinders to the hydraulic drain. In this case, all the hydraulic flow is returned to the reservoir, and both cylinders are filled with gas while floating pistons remain stationary in their initial positions, known as idle mode. The duration of this ‘dwell’ condition is selected to maintain the target gas mass flow rate through the compression system. The control strategy for the system’s full-cycle operation is outlined in Table 2. The maximum cycle frequency is achieved by immediately switching the DCV between parallel and cross positions, bypassing the intermediate open position and eliminating dwell duration/idle mode.

Table 2.
Control strategy for operating the compression system throughout a full cycle.
A full operating cycle of this compression system, including the normalized piston position (relative to maximum piston stroke) and the normalized piston speed (relative to maximum piston speed), is illustrated in Figure 3 for a lowered compression cycle frequency. During the compression stroke, the piston speed is dictated by the rate at which the hydraulic oil is supplied from the pump. As the pump is a positive displacement, the flow rate—and hence the piston speed—is relatively constant, with a slight decrease with increasing pressure due to the reduced volumetric efficiency of the pump (Appendix A, Figure A1a). During the retracting stroke, the piston speed is regulated by the flow control valve in the return line. DCV characteristic curves, adjusted using experimental data, show pressure drops across valve ports at various oil flow rates (Appendix A, Figure A1b). The curves differ between oil supply ports (pump-to-actuators) and oil drain ports (e.g., actuators-to-tank, pump-to-tank, and actuator-to-actuator).
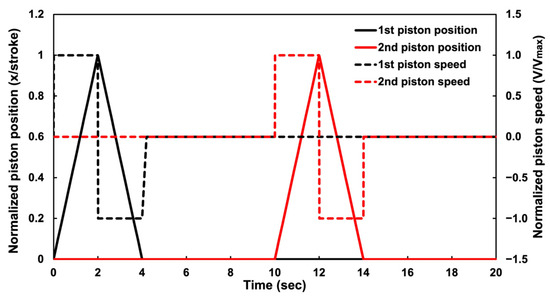
Figure 3.
An idealized operating cycle of the compression system, featuring a 2 s compression phase, a 2 s expansion phase, and a 16 s dwell period for each cylinder.
This testing facility was equipped with numerous sensors to enable a comprehensive examination of the compression system. Linear variable inductance transducers (LVITs) measured piston position, while in-cylinder gas and hydraulic pressures were measured using high-speed pressure transducers. Flow rates were measured using Coriolis flow meters on the gas (FM1 and FM2, Figure 2) and gear-type meters on the hydraulic system (FM3, FM4, and FM5). An electric motor power meter was used to measure the system’s energy input, while surface and fluid temperatures were recorded using K-type thermocouples, as illustrated in Figure 2. Specifications of key instruments are provided in Table 3.

Table 3.
Test setup instrument specifications.
2.3. Hydrogen Compression System Modeling
The model of the onboard gaseous fuel compression system was developed using GT-SUITETM v2024, a multi-physics simulation platform. Such one-dimensional (1D) flow models are appropriate for system-level analysis and are capable of accurately predicting dynamic behavior in pumps and compressors with acceptable computational time and cost [32,33]. The onboard gaseous compression system is divided into multiple volumes comprising flow splits and pipes, with the pipe elements further discretized into subvolumes along their lengths. The 1D flow model solves the Navier–Stokes equations, including the conservation of mass, energy, and momentum equations, at each time step in every subvolume. All quantities are averaged across the flow direction within each subvolume [34]. This 1D thermo-fluid dynamic model can simultaneously solve both gas and hydraulic flow systems, including heat transfer, sensing, and system control.
In this model, each gas compression cylinder is modeled with two separate volumes (one for the hydraulic chamber, one for the gas chamber) connected by a free-floating mechanical piston element. These two volumes are specified so that their individual volumes are adjusted as the piston moves, but their net total volume is fixed. Each chamber is represented as a single non-discretized element, with properties averaged over the entire volume at each time step. The gas enters the gas booster cylinder through a check valve when the gas in-cylinder pressure falls below the supply gas pressure. The gas supply reservoir is modeled as a ‘boundary pressure’ element with a defined pressure, connected to the cylinder through a pipe element with 12 mm ID and 1 m length. The high-pressure gas discharge is connected through a pipe element (1 m long and 12 mm ID) to a ‘boundary pressure’ element at a fixed pressure (approximately 30 MPa for all cases). The boundary pressure elements replicate the pressure regulators in the experimental validation test rig and are representative of the storage cylinders and a discharge accumulator in a vehicle system.
The hydraulic system model includes the hydraulic pump, directional control valve, flow control valve, pressure relief valve (PRV), and associated flow and control elements. The hydraulic reservoir is modeled as a ‘boundary pressure’ operating at ambient pressure and a constant temperature of 55 °C. The directional control valve is controlled based on piston location, with a switching strategy that replicates the switching control strategy of the compressor (Table 2).
2.3.1. Piston Motion
The piston motion is defined by the relative pressure in the gas and hydraulic chambers and estimated friction between the piston and cylinder, defined by [35]
where Ph and Pg are in-cylinder hydraulic oil and gas pressures, and mp, ap, and Ff represent the piston mass, acceleration, and friction force, respectively. Since the constant-speed, fixed-displacement hydraulic pump provides nearly constant hydraulic flow, the piston speed is constant (ap = 0) during compression. Therefore, friction is determined from Equation (1) using measured gas and hydraulic pressures. Based on calculations derived from empirical measurements, an average piston friction force of approximately 400 N was assumed during the compression stroke. During the retract stroke, the gas pressure varies, resulting in varying forces on the piston. Initially, the piston accelerates due to the expanding gas, followed by a transition to constant-speed motion during the suction phase. With relatively constant gas pressure acting on the piston during suction, the pressure difference across the hydraulic flow control valve is constant, resulting in a uniform hydraulic oil flow rate and piston speed. An average of 200 N is considered as the piston frictional force during the retracting stroke. This lower frictional force during the retracting stroke is attributed to the cylinder wall lubrication provided during the prior compression stroke.
2.3.2. Heat Transfer
The heat transfer in the gas chamber also impacts compressor performance. While heat transfer in reciprocating piston compressors has been widely studied, no single correlation encompasses all applications. Most use a Nusselt number (Nu) correlation of the general structure [36]:
where h is the convective heat transfer coefficient, L is a characteristic length, k is fluid thermal conductivity, and Re and Pr are Reynolds and Prandtl numbers. The characteristic length and velocity scales used in the Nu and Re correlations, and the constant (a) and exponential parameters (b, c) in Equation (2), vary widely between studies. Advanced correlations (e.g., Disconzi et al. [37]) define different gas velocities and parameter sets (a, b, c in Equation (2)) for different phases in the compressor operation (compression, discharge, expansion, intake). For this work, the Disconzi correlation is used, as the ability to modify the correlations for each phase was needed to match the experimental test rig results (Table 4). During discharge and suction, the velocity combines both piston speed (up) and the velocity of the gas entering or leaving the cylinder, measured in the cylinder (uc). During the dwell time, the cool ingested gas is heated by the hot walls of the cylinder through predominantly free convection.

Table 4.
Disconzi correlations for each process of a compression cycle [37].
Heat transfer in the hydraulic chamber is defined based on the flow speed, with Nu = 3.6 for laminar flow and the Dittus–Boelter correlation for turbulent flow [38] as follows:
2.3.3. Fluid Properties
While hydrogen and natural gas (primarily methane) differ in their thermophysical properties, including molecular weight, density, specific heat ratio, and compressibility factor at higher gas pressures (as summarized in Table 5), the validated CNG compression model can be reasonably extended to hydrogen by incorporating appropriate equations of state that account for these differences. Importantly, positive displacement compressors, such as reciprocating types, are generally less sensitive to gas property variations compared with dynamic compressors, particularly in terms of design implications [39]. This justifies the use of a CNG-based model structure as a foundation for hydrogen compression analysis. Nevertheless, the model extension remains predictive, and experimental validation under hydrogen-specific conditions is acknowledged as essential and is planned for future work.

Table 5.
Hydrogen and methane thermophysical properties (derived from [40]).
The properties of the modeled fuels (CNG, H2) are calculated with the Redlich–Kwong equation of state. It accounts for real gas effects and accurately represents hydrogen’s thermodynamic properties over a wide range of pressures [41]. It is also widely used in calculating properties of natural gas [42]. The hydraulic fluid is modeled as a compressible liquid with properties (bulk modulus, viscosity, density) that are a function of pressure and temperature.
2.3.4. Exergy Analysis
The second law of thermodynamics defines entropy generation (Sgen), and thus exergy destruction, within a control volume [43]:
where scv, si, and se are the entropy per unit mass of the control volume, input, and output fluid, respectively, and T0 is the ambient temperature.
The 1D system model is employed and integrated with the entropy balance (Equation (4)) to calculate the entropy generation, thus the exergy destruction, within each component at every time step. This is then integrated over a full cycle period to give the total exergy destruction within that component.
The system boundary, at the gas side, encompasses compression cylinders, the suction line immediately before the inlet check valves, the discharge line right after the discharge check valves, and all components within this boundary, excluding the regulators, heat exchangers, and gas containers. All hydraulic components, except heat exchangers, are within the system boundary for exergy analysis. The overall exergy efficiency of the onboard hydrogen compression system can be expressed as the exergy increase of the compressed gas between the inlet and outlet (exergy delivered), divided by the electric motor work input (derived from [44]):
where is the exergy increase of the compressed gas, and d and s are the exergy per unit mass of discharge and inlet gas. The total exergy destruction of the compression system is [30]
For each component, the exergy destruction fraction is defined as the exergy destruction in that component across the operating period divided by the total electric motor work input as [30]
This approach identifies and quantifies the overall exergy efficiency of the system, which provides a method of comparing different system configurations and sizes. By identifying the exergy destruction occurring at various points within the system (such as the check valves, friction, heat transfer, etc.), the main losses within the system can be compared. Irreversibility due to leakage of either hydraulic fluid or gas is not considered.
For hydrogen flowing into the gas compression cylinder, the exergy destruction due to isenthalpic throttling is formulated using Equation (4) as follows [30]:
where dmi/dt is the intake gas mass flow rate, and scyl and si are the mass-specific entropy of the hydrogen within the compressor and of the inlet gas, respectively.
The incoming gas temperature just after throttling (T’i) may differ from the cylinder’s residual gas temperature (Tcyl). This temperature difference during fluid mixing is an additional source of irreversibility within the compression cylinder. The exergy destruction resulting from this gas mixing is [30]
where hi and hcyl represent the enthalpy of the inlet and in-cylinder hydrogen.
The exergy destruction due to heat transfer from the fluid to the cylinder wall is calculated as follows [30]:
where is the heat transfer rate between the fluid and the cylinder wall, Tw and Tf are the cylinder wall and fluid temperatures. The exergy destruction remains positive regardless of whether heat transfers from the fluid (positive) or to the fluid (negative).
Exergy destruction due to piston friction can be assumed to be dissipated as equivalent heat transfer to the cylinder wall, with temperature Tw. Exergy destruction due to friction is [30]
where is the piston frictional power (piston frictional force times speed). Exergy destruction from unmodeled sources within the compression cylinder (e.g., conduction between solid components) is determined as the difference between the total exergy destruction calculated in the compression cylinder and the sum of the exergy destructions from modeled contributors, including convective heat transfer, friction, gas mixing, and throttling.
Exergy destruction in the hydraulic components is also calculated. The total exergy increase of the hydraulic fluid across the pump is calculated from (derived from [44]):
The total exergy loss caused by the hydraulic pump while operating is calculated as the difference between the total work input to the pump and the exergy increase from Equation (12).
The exergy loss in the directional control valve is calculated from (derived from [44])
where dmin/dt is the hydraulic oil mass flow rate in each operating port, and sin and sout are the entropy per unit of mass of the fluid in that port’s inlet and outlet.
Significant exergy destruction happens throughout the flow control valve, where high-pressure hydraulic oil is drained back to the hydraulic reservoir during retracting and idle modes. During the retracting phase, the high-pressure hydraulic oil in the compression cylinder is drained into the low-pressure reservoir. Additionally, during both retracting and idle modes, the hydraulic pump keeps running, returning relatively high-pressure oil to the reservoir. The total exergy destruction due to oil drainage is (derived from [44])
where dmcyl/dt and dmp/dt denote the mass flow rates of the drained hydraulic oil from the compression cylinder and the pump to the hydraulic reservoir, respectively. , , and are the available exergy of the hydraulic flow from the cylinder (and after the DCV) during the retracting stroke, from the hydraulic pump (and after the DCV) during the retracting and idle modes, and in the hydraulic oil reservoir at ambient pressure, respectively. The relative performance of individual components and their contributions to the total work input loss in various operating conditions are shown in the next section.
3. Results
All results in this section are based on the configuration depicted in Figure 2. The model is validated using data from natural gas compression and is then extended to predict performance with hydrogen. The exergy analysis results for the compression cylinder are presented first, followed by the drive system, and finally, the full system performance is presented for the hydrogen compression.
3.1. Model Validation
The model was validated using experimental data from tests with natural gas for cylinder pressures, gas discharge temperatures, gas mass flow rates, and total work input. As shown in Figure 4a, the modeled and measured P-V traces agree well. The minor discrepancy observed during the end of the compression phase is attributed to varying upstream reservoir pressure during testing. Small differences during the expansion phase are due to piston movement instability caused by directional control valve (DCV) switching, while discrepancies during intake valve opening are attributed to the dynamic response of the check valve. Similar results are seen at different pressure ratios. The electric motor power over an operational cycle of two gas boosters shows good alignment, represented in Figure 4b, for 8–29 MPa gas compression at 6 cycles per minute case; other cases show equivalent agreement. The gas mass flow rates, average gas discharge temperatures, and total work input are predicted with an error margin of less than 8%, 5%, and 5%, respectively, across a range of operating conditions, as depicted in Figure 4c. For modeled gas mass flow rate, larger errors occur at lower supply pressures with lower gas densities. This is primarily attributable to increasing uncertainty in the experimental measured values at low mass flow rates (the flow meter error exceeded +/−3.4% at mass flow rates lower than 20 kg/h; see Table 3).
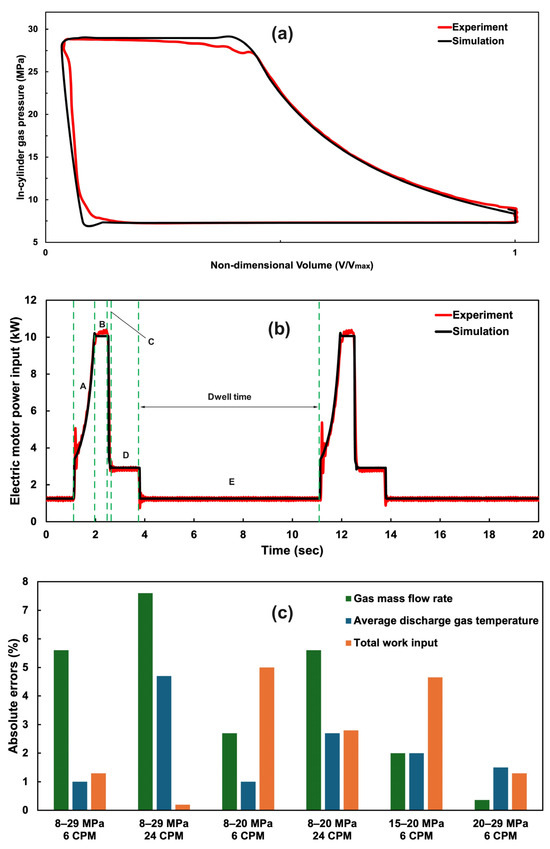
Figure 4.
Comparison of (a) gas P-V diagrams and (b) electric motor power input between simulation and experiment for natural gas compression (8 MPa intake, 29 MPa discharge) at 6 CPMs. Phases A–E, separated by green dashed lines, represent compression (A), discharge (B), expansion (C), intake (D), and dwell/idle (E), and (c) is absolute error of the modeled gas mass flow rate, average discharge temperature, and total work input at various compression pressures and cycle frequencies.
3.2. Hydrogen Model Operating Conditions
In a vehicle application of the compressor system, the supply and discharge pressures are defined by the supply tank pressure and a high-pressure receiver connected to the engine, respectively. Consequently, gas pressure regulators are excluded; otherwise, the model is the same as shown in Figure 2 and validated using the experimental NG data. To assess the suitability of the compression system for on-vehicle hydrogen compression, a series of operating points are defined based on the expected limits of the system requirements. These include compression pressure ratios up to 10:1 and cycle frequencies up to 44 CPMs for maximum speed. For all cases, discharge gas pressure is fixed at 30 MPa as required for current HPDI engines [10]. The 10:1 PR is representative of a supply tank pressure of 3 MPa, which would make use of 90% of the total mass of fuel contained in a 35 MPa storage tank (and 94% of a 70 MPa tank). Lower supply gas pressure also reduces the inlet gas density, resulting in a lower mass flow rate for a given cycle frequency. The compressor operates at higher cycle frequencies with shorter dwell times to meet the engine’s required mass flow rate at low tank pressures. Five different tank pressures (3, 5, 10, 15, and 20 MPa) at three various cycle frequencies (6, 12, and 44 CPMs) were modeled.
3.3. Compression Cylinder Performance Analysis
The performance of the hydrogen compression cylinder is evaluated with a single element (gas booster) operating at 12 CPMs over a single cycle for two different pressure ratios, as illustrated in Figure 5. The left-hand figures depict results for a pressure ratio of 6 (5–30 MPa), while the right-hand figures correspond to a lower pressure ratio of 2 (15–30 MPa). In this system, higher pressure ratios correspond to lower supply tank pressures and reduced gas densities, as the discharge pressure remains fixed at 30 MPa. For both pressure ratios, the piston extension stroke (encompassing gas compression and discharge) lasts approximately 1.5 s. However, at higher pressure ratios, the duration is longer for the compression phase and shorter for the discharge phase. At lower gas pressure ratios, the compression phase is shorter, and the discharge phase is longer, leading to a longer discharge duration and more mass discharged per stroke (Figure 5a,b). The retracting stroke (gas expansion and intake) lasts approximately 2 s for a pressure ratio of 6 and 0.8 s for a pressure ratio of 2, with most of the stroke attributed to the intake process. At lower pressure ratios, the higher supply gas pressure results in increased hydraulic pressure before the flow control valve, causing the piston to retract at higher speeds.
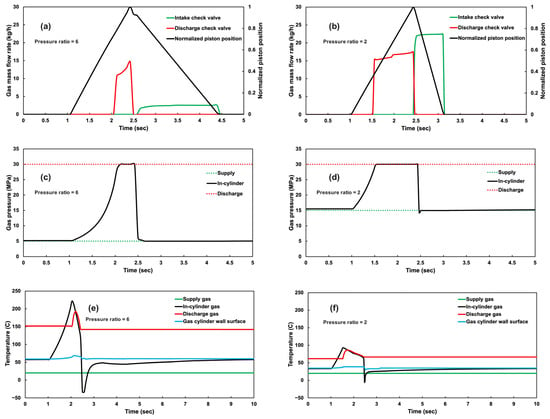
Figure 5.
Compression cylinder performance analysis including (a) modeled normalized piston position and gas mass flow rates in check valves for a pressure ratio of 6 (b) for a pressure ratio of 2 (c), predicted gas pressures in the compression system for a pressure ratio of 6 (d) for a pressure ratio of 2 (e), modeled gas and wall surface temperatures after stabilization for a pressure ratio of 6 (f) for a pressure ratio of 2; all figures are for a compressor operating at 12 CPMs.
The hydrogen inlet gas pressure, in-cylinder gas pressure, and discharge gas pressure are compared in Figure 5c,d. The results show a small rise and drop in the in-cylinder pressures during the gas discharge and suction phases due to small pressure drops in check valves (less than 0.05 MPa). The results for temperatures are shown in Figure 5e,f. The in-cylinder gas temperature reaches 220 °C at the higher pressure ratio of 6, compared with 100 °C at the lower pressure ratio of 2. However, the duration under these conditions is short, leading to relatively low cylinder and bulk average temperatures. During the discharge stroke, the in-cylinder gas also cools because of heat transfer to the cold cylinder walls. During expansion, the temperature of the hydrogen trapped in the residual volume decreases, briefly dropping below ambient temperature in the case with a higher expansion ratio. However, the incoming gas causes the bulk in-cylinder temperature to rise again. At the end of the intake process and during the idle mode, the gas temperature trapped in the cylinder increases due to natural convection from the hot cylinder wall to the gas. While these results are thermodynamically explainable, the NG cylinder testing did not include high-speed in-cylinder temperature measurements, so internal temperatures are, at this point, unvalidated.
3.4. Compression Cylinder Exergy Analysis
The main sources of exergy destruction in the compression cylinder include the check valves, heat transfer, piston friction, and gas mixing/transfer. These are shown in Figure 6 for a single cylinder, operating on a single cycle (12 CPMs) at two different pressure ratios. Faster piston movement at lower pressure ratios results in a higher gas volumetric flow rate through the inlet check valves, significantly increasing the inlet check valve exergy destruction (Figure 6a).
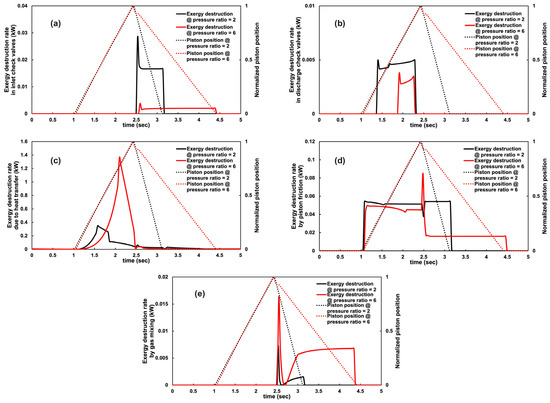
Figure 6.
Modeled piston positions and exergy destruction rates in the gas compression cylinder: (a) in the inlet check valve, (b) in the discharge check valve, (c) caused by the convective heat transfer, (d) caused by the piston friction, and (e) caused by the gas mixing during the suction phase for different hydrogen compression pressure ratios with a cycle frequency of 12 CPMs.
The exergy destruction rate in the discharge valves shows a lower sensitivity to the pressure ratio. The piston speed remains constant at different gas pressure ratios as the hydraulic flow is nearly constant (constant-speed, fixed-displacement hydraulic pump). As a result, the gas discharge volumetric flow rate and the pressure drop in the valve are nearly independent of the pressure ratio. Similar exergy destruction rates occur in the discharge valve, but the total exergy destruction is higher at lower gas pressure ratios due to longer discharge duration, as shown in Figure 6b. The slight variation in the rate is attributed to differences in the compressed gas temperature before discharge at varying pressure ratios.
The exergy destruction rate resulting from convective heat transfer from the gas to the cylinder wall at two different pressure ratios is depicted in Figure 6c. With increasing pressure ratios, the heat transfer rate rises, leading to a correspondingly higher rate of exergy destruction associated with this heat transfer. Even during the intake and idle phases (after 2.5 s), where the heat transfers from the wall to the cold gas (negative rate), the rate of exergy destruction due to the heat transfer is positive. The magnitude of exergy destruction rates caused by heat transfer is significantly greater than that caused by check valves.
The exergy destruction rate caused by the piston friction is primarily a function of piston speed. As shown in Figure 6d, the compression stroke exergy destruction is relatively constant, as the piston speed is determined by the hydraulic pump’s volumetric flow rate. Variations are primarily due to differences in cylinder wall temperature impacting exergy destruction, as described in Equation (11). In the retracting stroke, however, the piston speed is a function of the drain hydraulic oil flow rate, which increases with higher supply gas pressures (lower pressure ratios). The higher piston speeds at lower pressure ratios lead to increased exergy destruction rates but shorter retract times (Figure 6d. The offsetting effects of higher exergy destruction rates over shorter times lead to total exergy destruction due to piston friction over one complete operating cycle remaining nearly constant across different pressure ratios. However, incorporating an adjustable flow control valve in the hydraulic oil return line can mitigate exergy destruction rates at elevated gas supply pressures, potentially extending the service life of the piston seals. Exergy destruction due to gas mixing (Figure 6e) occurs only during the suction phase and is primarily a function of the mixing gases coming into thermal equilibrium: equivalent heat transfer between the expanded residual gas and the incoming fresh gas. Due to larger temperature differences, the rate of exergy destruction caused by the gas mixing over a complete operating cycle increases at higher pressure ratios. Cumulative exergy destruction per unit mass of hydrogen can be determined from the total work input multiplied by the share of each contributor in destroying the input work, as presented in the following sections. A detailed comparison of these contributors to the work input wastage is discussed later.
3.5. Hydraulic Driving System Exergy Analysis
Hydraulic drive system components have the potential to contribute significantly to total exergy destruction. The fixed-speed electric motor, fixed-displacement hydraulic oil pump, directional control valve, and drain flow control valve all significantly impact the hydraulic flow. These are summarized for a single compressor over a single operating cycle (with a cycle frequency of 12 CPMs) for two different gas pressure ratios in Figure 7.
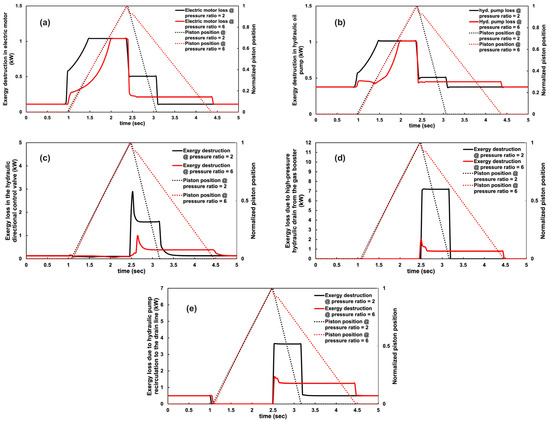
Figure 7.
Modeled piston positions and rate of exergy destruction in (a) electric motor, (b) hydraulic pump, (c) directional control valve, (d) caused by the oil drain from the gas booster, and (e) caused by the oil recirculation from the hydraulic pump to the drain line for different hydrogen compression pressure ratios with a cycle frequency of 12 CPMs.
The electric motor and hydraulic pump are significant sources of exergy destruction (Figure 7a,b). The fixed-speed electric motor has a nameplate efficiency of 91% at operating rated speed (1760 rpm—Table 1), corresponding to exergy destruction of 9% of the total electrical energy input. During the compression phase, the pump power input is higher at lower pressure ratios: the higher supply pressure requires a higher hydraulic pressure to drive the piston. The power—and corresponding exergy destruction in the pump and motor—during the discharge process is the same for both pressure ratios, but the duration is shorter for the higher pressure ratio (lower supply pressure). During the retracting stroke, the higher pressure ratio has a lower work input but a longer duration. This is due to the configuration of the directional control valve. In the retraction phase, the pump discharge mixes with the flow from the compression cylinder before the flow control valve. As a result, the pump outlet pressure is determined by the pressure in the gas supply. Therefore, a lower pressure ratio results in a higher pump outlet pressure. However, the duration is shorter because of the faster piston speed. Additionally, the pump consumes power during the idle mode (after the intake phase ends) while recirculating the hydraulic oil to the ambient-pressure reservoir, overcoming pressure losses in the drain line. This results in the pump operating at elevated pressures compared with the ambient pressure. The rate of exergy destruction in the hydraulic pump for these two pressure ratios is shown in Figure 7b. The rate of exergy destruction in the directional control valve (shown in Figure 7c) depends on operating conditions, such as the gas pressure ratio and cycle frequency, as key parameters, such as valve position, hydraulic oil pressure, oil flow rate, and pressure loss in the operating ports, vary accordingly. The exergy loss rates are low during the compression stroke and idle modes across various pressure ratios. Exergy destruction is the highest during the retracting phase, especially at a lower pressure ratio (higher supply pressures). This is attributed to the higher pressures and higher flow rate of hydraulic oil passing through the DCV from the gas compression cylinder to the drain line when the gas supply pressure is elevated at lower pressure ratios.
The greatest exergy destruction rate in the system occurs at the flow control valve, as shown in Figure 7d,e. At this point, significant energy is available in the high-pressure hydraulic fluid, which is then throttled to ambient pressure, resulting in significant exergy destruction. The higher gas supply pressures at lower pressure ratios generate increased in-cylinder hydraulic pressure in the gas booster, resulting in greater available exergy, which is subsequently drained to the return line (Figure 7d). Similar results from the recirculation of high-pressure hydraulic oil by the hydraulic pump to the drain line during the retracting stroke and idle mode are depicted in Figure 7e. Although the rate of exergy destruction is similar during the idle mode for various pressure ratios, it is much higher at the lower pressure ratio during the retracting stroke. This occurs because the pump works at a higher pressure due to an elevated gas supply pressure.
3.6. Full System Exergy Analysis
The exergy analysis of the onboard hydrogen compression system evaluates the system’s overall performance, including detailed system losses, under varying operating conditions. The total work input, total system exergy destruction (per unit mass of compressed hydrogen), and the overall system exergy efficiency (determined by Equation (5)) are shown in Figure 8 over a range of modeled pressure ratios and cycle frequencies. The results demonstrate that the system achieves higher efficiency at increased cycle frequencies, with a peak exergy efficiency of 45% observed at a pressure ratio of 6 and a cycle frequency of 44 CPMs. The total work input and the exergy destruction per unit mass of compressed hydrogen are larger at higher pressure ratios.
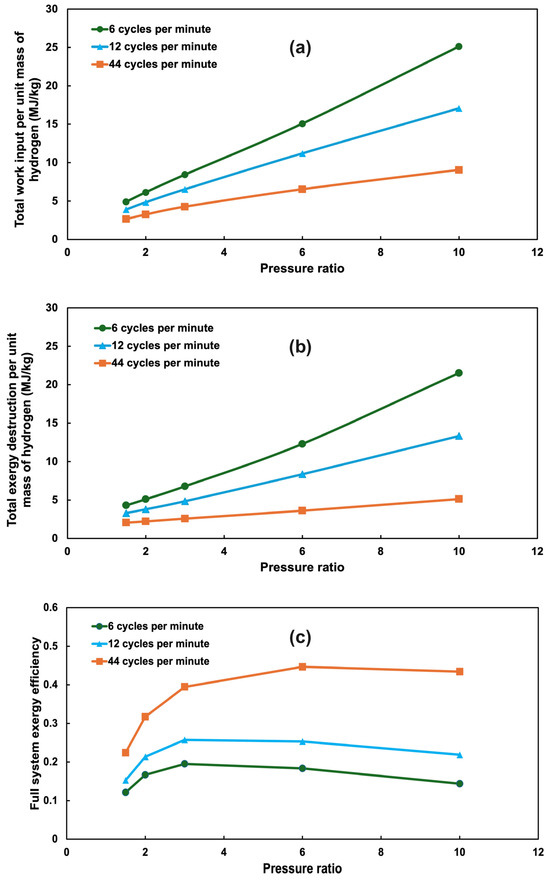
Figure 8.
Full system exergy analysis including (a) total electric work input per unit mass of compressed hydrogen, (b) total exergy destruction per unit mass of compressed hydrogen, and (c) overall exergy efficiency of the full system operating at compression pressure ratios of 1.5, 2, 3, 6, and 10 with cycle frequencies of 6, 12, and 44 CPMs.
4. Discussion
The full-system exergy destruction can be compared to the exergy destruction of individual components under specific operating modes to identify each component’s contribution to overall exergy efficiency. The exergy distribution diagrams in Figure 9 illustrate the percentage of exergy delivered and exergy destroyed across different components at various pressure ratios and cycle frequencies. In all cases, only a small fraction of the total exergy is destroyed in the gas compression cylinder or in ‘other’ losses (e.g., piping losses <2%). Most are destroyed in the hydraulic system, along with a constant 9% loss in the electric motor.
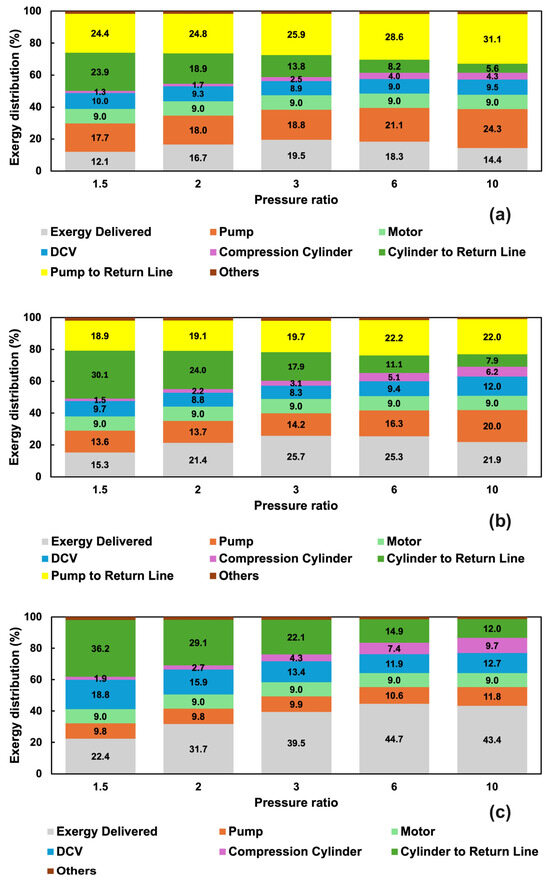
Figure 9.
Exergy distribution percentage in the full hydrogen compression system operating at various pressure ratios (1.5, 2, 3, 6, and 10) with a cycle frequency of (a) 6 CPMs, (b) 12 CPMs, (c) 44 CPMs (exergy destruction percentage due to pump recirculation to the drain line is zero for this case).
In the hydraulic system, the exergy loss due to draining high-pressure hydraulic oil from the gas compression cylinder and pump to the hydraulic reservoir is substantial. The percentage of the exergy destruction from draining high-pressure oil from the compression cylinder increases at lower pressure ratios but remains relatively constant in absolute terms, as shown in Figure 10 (1–1.4 MJ/kg H2 compressed, decreasing slightly at higher CPMs). In contrast, the exergy destruction attributed to the draining of hydraulic oil from the hydraulic pump to the reservoir rises with increasing gas pressure ratios and decreasing CPMs.
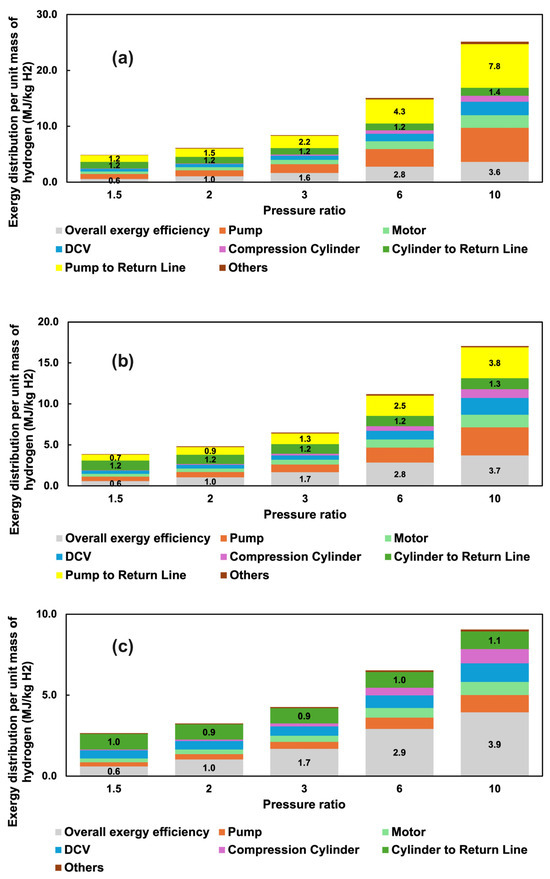
Figure 10.
Exergy distribution per unit mass of hydrogen in the full compression system operating at various pressure ratios (1.5, 2, 3, 6, and 10) with a cycle frequency of (a) 6 CPMs (b) 12 CPMs (c) 44 CPMs (exergy destruction due to pump recirculation to the drain line is zero for this case).
Exergy destruction in the rest of the hydraulic system also contributes significantly to total exergy losses. The hydraulic pump exergy destruction increases in both fractional and total terms with higher pressure ratios and lower CPMs due to the increased proportion of pump operation at lower pressures with lower isentropic efficiency, as shown in Appendix A, Figure A1a. Exergy destruction in the directional control valve is due to the flow restriction it imposes, as it increases in absolute terms with higher pressure ratios and lower CPMs (Figure 10).
Cycle frequency significantly impacts overall exergy destruction. As the cycle frequency increases, the compressor spends more time in compression and less time in idle mode. This significantly decreases the exergy destroyed in recirculating high-pressure hydraulic fluid from the pump directly to the reservoir and is the main contributor to the improved overall exergy efficiency at higher CPMs shown in Figure 9 and Figure 10. At maximum cycle frequency (44 CPM, Figure 9c), the system is compressing continuously and never runs idle. The exergy loss fraction associated with hydraulic pump operation decreases as the pump operates at higher pressures with improved isentropic efficiency (Appendix A, Figure A1a), and less of the hydraulic flow is ‘wasted’ during idle operation. As the magnitude of exergy losses in the idle mode decreases with higher CPMs, the relative contribution of exergy destruction in the gas compression cylinder, directional control valve, and high-pressure oil returning from the cylinder to the reservoir increases (Figure 9), although their absolute values (per unit mass of hydrogen delivered) are constant or, in some cases, decrease (Figure 10).
The contribution of the gas compression cylinder to total exergy destruction in the system is small. Considering the different sources of irreversibility, the primary contributor is the heat transfer, as shown in Figure 11 (44 CPM case: other cases are similar). Piston friction also makes a smaller but significant contribution. Even at high CPMs, the check valves generate low pressure drops, resulting in low work input wastage. The exergy loss due to the gas mixing is also less important. Other contributors, such as conductive heat transfer between solid parts and fluid losses due to the hydraulic oil entering and leaving the hydraulic chamber in the compression cylinder, are insignificant. In general, the share of exergy destruction due to heat transfer, gas mixing, and friction increases as the pressure ratio rises, while this decreases for throttling in intake and discharge check valves. It is important to note that, while heat transfer introduces irreversibility that reduces the exergy of the discharge gas, it provides significant benefits, including lowering the discharge temperature at the cost of 0.8–7.9% exergy loss (Figure 11). This enables a more secure seal design, achieving higher pressure ratios and reducing the work input. This exergy analysis quantifies the portion of the work input attributed to heat transfer from the gas, offering valuable insights from a design perspective.
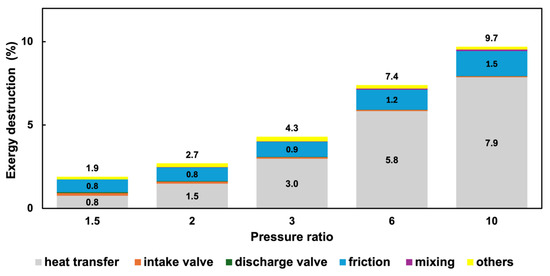
Figure 11.
Exergy destruction percentage in the gas compression cylinder operating at a max cycle frequency of 44 CPMs and various pressure ratios.
5. Conclusions
An exergy analysis approach was developed to identify and quantify losses in an onboard hydraulic-driven free-floating piston gaseous fuel compression system designed for high-pressure direct injection of hydrogen into internal combustion engines in commercial vehicles. The main outcomes are as follows:
- This one-dimensional dynamic thermo-fluid model developed in GT-SUITETM, v2024, has been validated to accurately predict key performance parameters of both gaseous fuel compression and hydraulic driving systems across various operating points. This can be used as a foundation for the exergy analysis of the full system for on-vehicle hydrogen compression or in other stationary applications such as hydrogen refueling stations.
- The exergy analysis over the full range of expected operating conditions revealed that the primary work input losses occur in the hydraulic drive system rather than in the hydrogen compression cylinder.
- The maximum overall exergy efficiency of this system, about 45%, happens at the highest cycle frequency, e.g., 44 CPMs, and at moderate gas pressure ratios. Lower cycle frequencies result in longer times for the hydraulic system in idle mode, while high gas pressure ratios lead to higher heat transfer and pressure losses.
- At a lower pressure ratio of 1.5:1 and a maximum cycle frequency of 44 CPMs, the energy required for hydrogen compression is less than 3 MJ/kg of H2. However, this requirement increases to over 25 MJ/kg of H2 at a higher pressure ratio of 10:1 and a lower cycle frequency of 6 CPMs.
- Major losses in the system are caused by the draining of high-pressure hydraulic fluid from both the gas compression cylinder and hydraulic pump to the reservoir in the return line during the retracting and idle modes. This destructs up to 50% of the total work input in low cycle frequencies and pressure ratios. This exergy destruction decreases to only 12% at a maximum pressure ratio of 10:1 and cycle frequency of 44 CPMs.
- Heat transfer and piston friction are the primary sources of irreversibility in the hydrogen compression cylinder, and they increase as the gas pressure ratio rises. The exergy destruction rate due to gas throttling remains minimal, owing to the effective selection of inlet and discharge check valves with low pressure drops.
This work underpins the next stages of analysis: an improved design with optimum sizing and configuration for in-use vehicle driving cycles. The proposed improvements include, but are not limited to, the use of a high-pressure hydraulic accumulator in place of an ambient-pressure reservoir, the replacement of the fixed-displacement pump with a variable-displacement pump, and employing an adjustable flow control valve, in the hydraulic oil return line, to enhance the efficiency of the hydraulic drive system. The system has a relatively large number of independent variables, meaning that advanced optimization/machine learning approaches will likely be valuable in guiding the optimization process. In a vehicle application, the operating speed, mass flow rate, and pressure ratio of the compression system vary with engine operating conditions, including speed and load (fuel flow), along with the pressure in the onboard compressed gas storage cylinders. In certain conditions, compressor operation may not be required. Ongoing research, building on the floating piston compression system and exergy analysis introduced here, is exploring strategies to reduce the parasitic loads in real-world scenarios.
Author Contributions
Conceptualization, M.N.K., A.S., S.M. and G.M.-C.; methodology, M.N.K., A.S., S.M. and G.M.-C.; software, M.N.K.; validation, M.N.K., A.S., S.M. and G.M.-C.; formal analysis, M.N.K., A.S., S.M. and G.M.-C.; investigation, M.N.K., A.S., S.M. and G.M.-C.; resources, G.M.-C. and S.M.; data curation, M.N.K. and A.S.; writing—original draft preparation, M.N.K.; writing—review and editing, M.N.K., A.S. and G.M.-C.; visualization, M.N.K.; supervision, G.M.-C.; project administration, S.M. and G.M.-C.; funding acquisition, G.M.-C. All authors have read and agreed to the published version of the manuscript.
Funding
This research was funded by MITACS Accelerate and supported by Westport Fuel Systems Inc., grant number IT24021.
Data Availability Statement
The raw data supporting the conclusions of this article will be made available by the authors upon request.
Acknowledgments
Technical support from Westport Fuel Systems Inc. is acknowledged.
Conflicts of Interest
Authors S.M. and A.S. were employed by sponsor Westport Fuel Systems. The remaining authors declare that the research was conducted in the absence of any commercial or financial relationships that could be construed as a potential conflict of interest.
Abbreviations
The following abbreviations are used in this manuscript:
| H2 ICE | Hydrogen Internal Combustion Engines |
| GHG | Greenhouse Gases |
| HPDI | High-Pressure Direct Injection |
| DCV | Directional Control Valve |
| CPM | Cycle per Minute |
Appendix A
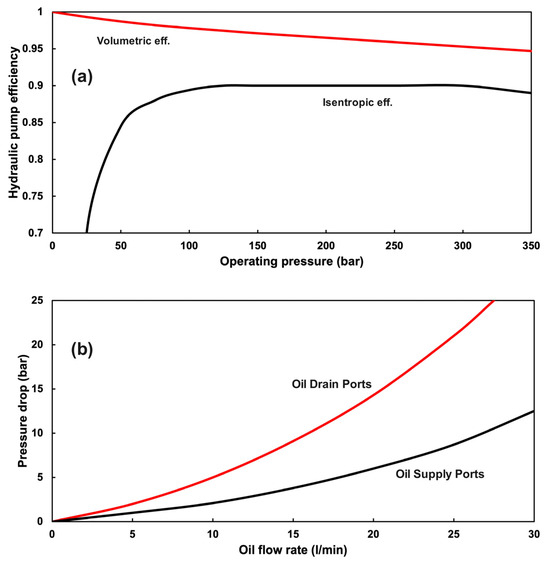
Figure A1.
(a) The manufacturer-reported volumetric and isentropic efficiencies of the hydraulic oil pump across operating pressures. (b) Pressure drop in the directional control valve across oil flow rates for different ports extracted from the experiments.
References
- US EPA. Inventory of U.S. Greenhouse Gas Emissions and Sinks: 1990–2022. Available online: https://www.epa.gov/ghgemissions/inventory-us-greenhouse-gas-emissions-and-sinks-1990-2022 (accessed on 30 March 2025).
- Ragon, P.-L.; Buysse, C.; Sen, A.; Meyer, M.; Benoit, J.; Miller, J.; Rodríguez, F. Potential benefits of the U.S. Phase 3 Greenhouse Gas Emissions Regulation for Heavy-Duty Vehicles, International Council on Clean Transportation, White Paper, 14 April 2023. Available online: https://theicct.org/publication/hdv-phase3-ghg-standards-benefits-apr23/ (accessed on 30 March 2025).
- US EPA. Proposed Rule: Greenhouse Gas Emissions Standards for Heavy-Duty Vehicles—Phase 3. Available online: https://www.epa.gov/regulations-emissions-vehicles-and-engines/proposed-rule-greenhouse-gas-emissions-standards-heavy (accessed on 30 March 2025).
- Churchman, P.; Longhurst, N. Where is our delivery? The political and socio-technical roadblocks to decarbonising United Kingdom road freight. Energy Res. Soc. Sci. 2022, 83, 102330. [Google Scholar] [CrossRef]
- NACFE: Hydrogen Trucks: Long-Haul’s Future? Available online: http://nacfe.org/research/emerging-technologies/electric-trucks/hydrogen/ (accessed on 30 March 2025).
- Balazadeh Meresht, N.; Moghadasi, S.; Munshi, S.; Shahbakhti, M.; McTaggart-Cowan, G. Advances in Vehicle and Powertrain Efficiency of Long-Haul Commercial Vehicles: A Review. Energies 2023, 16, 6809. [Google Scholar] [CrossRef]
- Treacy, M.; Hadadpour, A.; Bai, X.-S.; Fatehi, H. Performance and emissions of a novel high-pressure direct injection hydrogen dual-fuel engine. Fuel 2024, 376, 132639. [Google Scholar] [CrossRef]
- Mumford, D.K.; Williams, G.; Leclercq, N. Assessing Heavy Duty Vehicle CO2 Emissions for Qualification as a Zero Emissions Vehicle; SAE Technical Paper 2024-37–0007; SAE International: Warrendale, PA, USA, 2024. [Google Scholar] [CrossRef]
- McTaggart-Cowan, G.; Mann, K.; Wu, N.; Munshi, S. An Efficient Direct-Injection of Natural Gas Engine for Heavy Duty Vehicles. In Proceedings of the SAE 2014 World Congress & Exhibition, Detroit, MI, USA, 8–10 April 2014. SAE Technical Paper 2014-01-1332. [Google Scholar] [CrossRef]
- Willems, R.; Seykens, X.; Bekdemir, C.; Doosje, E.; Van Gompel, P. The Potential of Hydrogen High Pressure Direct Injection toward Future Emissions Compliance: Optimizing Engine-Out NOx and Thermal Efficiency. In Proceedings of the CO2 Reduction for Transportation Systems Conference, Turin, Italy, 12–13 June 2024. SAE Technical Paper 2024-37-0005. [Google Scholar] [CrossRef]
- McTaggart-Cowan, G.; Mann, K.; Huang, J.; Singh, A.; Patychuk, B.; Zheng, Z.X.; Munshi, S. Direct Injection of Natural Gas at up to 600 Bar in a Pilot-Ignited Heavy-Duty Engine. SAE Int. J. Engines 2015, 8, 981–996. [Google Scholar] [CrossRef]
- Rochussen, J.; McTaggart-Cowan, G.; Kirchen, P. Parametric study of pilot-ignited direct-injection natural gas combustion in an optically accessible heavy-duty engine. Int. J. Engine Res. 2020, 21, 497–513. [Google Scholar] [CrossRef]
- Yang, X.; Wang, X.; Dong, Q.; Ni, Z.; Song, J.; Zhou, T. Experimental study on the two-phase fuel transient injection characteristics of the high-pressure natural gas and diesel co-direct injection engine. Energy 2022, 243, 123114. [Google Scholar] [CrossRef]
- Alternative Fuels Data Center: Alternative Fueling Station Locator. Available online: https://afdc.energy.gov/stations (accessed on 30 March 2025).
- Milojević, S. Reconstruction of Existing City Buses on Diesel Fuel for Drive on Hydrogen. Appl. Eng. Lett. 2016, 1, 16–23. [Google Scholar]
- Babayev, R.; Morén, M.; Johansson, B. Comparative computational study of hydrogen and natural gas in high-pressure direct-injection (HPDI) compression-ignition engines: Combustion characteristics, thermal efficiency, and local pollutant and greenhouse gas emissions. Fuel 2025, 395, 135126. [Google Scholar] [CrossRef]
- Delbari, H.; Munshi, S.; McTaggart-Cowan, G. Characterizing injection and ignition of hydrogen and hydrogen-methane blend fuels in a static combustion chamber. Fuel 2025, 381, 133562. [Google Scholar] [CrossRef]
- Sdanghi, G.; Maranzana, G.; Celzard, A.; Fierro, V. Review of the current technologies and performances of hydrogen compression for stationary and automotive applications. Renew. Sustain. Energy Rev. 2019, 102, 150–170. [Google Scholar] [CrossRef]
- Zhou, H.; Dong, P.; Zhu, S.; Li, S.; Zhao, S.; Wang, Y. Design and theoretical analysis of a liquid piston hydrogen compressor. J. Energy Storage 2021, 41, 102861. [Google Scholar] [CrossRef]
- Ren, S.; Jia, X.; Shi, L.; Li, K.; Peng, X. Theoretical and experimental study on improving diaphragm compressor design for hydrogen refueling stations through use of a free moving oil piston concept. J. Energy Storage 2023, 74, 109397. [Google Scholar] [CrossRef]
- Sdanghi, G.; Maranzana, G.; Celzard, A.; Fierro, V. Towards Non-Mechanical Hybrid Hydrogen Compression for Decentralized Hydrogen Facilities. Energies 2020, 13, 3145. [Google Scholar] [CrossRef]
- Zou, J.; Han, N.; Yan, J.; Feng, Q.; Wang, Y.; Zhao, Z.; Fan, J.; Zeng, L.; Li, H.; Wang, H. Electrochemical Compression Technologies for High-Pressure Hydrogen: Current Status, Challenges and Perspective. Electrochem. Energ. Rev. 2020, 3, 690–729. [Google Scholar] [CrossRef]
- Guo, Y.; Wang, Q.; Liu, X.; Zhang, M.; Peng, X. Numerical analysis of the dynamic two-phase flow behaviour in the ionic liquid compressor for hydrogen refuelling stations. Appl. Therm. Eng. 2022, 219, 119607. [Google Scholar] [CrossRef]
- Genovese, M.; Fragiacomo, P. Hydrogen refueling station: Overview of the technological status and research enhancement. J. Energy Storage 2023, 61, 106758. [Google Scholar] [CrossRef]
- Ye, J.; Du, Z.; Xie, J.; Yin, X.; Peng, W.; Yan, Z. Transient flow performance and heat transfer characteristic in the cylinder of hydraulic driving piston hydrogen compressor during compression stroke. Int. J. Hydrogen Energy 2023, 48, 7072–7084. [Google Scholar] [CrossRef]
- Ye, J.; He, Y.; Du, Z.; Ji, R.; Xie, J.; Liu, J. The transient flow and heat transfer characteristics in reciprocated conditions of hydraulic-driven piston hydrogen compressor in hydrogen storage system. J. Energy Storage 2024, 89, 111662. [Google Scholar] [CrossRef]
- Wang, Y.; Qi, Q.; Xiong, W.; Peng, X. Experimental investigation on the hydraulic-driven piston compressor for hydrogen under varied operating conditions. Int. J. Hydrogen Energy 2024, 74, 78–88. [Google Scholar] [CrossRef]
- Farzaneh-Gord, M.; Niazmand, A.; Deymi-Dashtebayaz, M.; Rahbari, H.R. Thermodynamic analysis of natural gas reciprocating compressors based on real and ideal gas models. Int. J. Refrig. 2015, 56, 186–197. [Google Scholar] [CrossRef]
- Lu, K.; Sultan, I.A.; Phung, T.H. A Literature Review of the Positive Displacement Compressor: Current Challenges and Future Opportunities. Energies 2023, 16, 7035. [Google Scholar] [CrossRef]
- McGovern, J.A.; Harte, S. An exergy method for compressor performance analysis. Int. J. Refrig. 1995, 18, 421–433. [Google Scholar] [CrossRef]
- Niazmand, A.; Farzaneh-Gord, M.; Deymi-Dashtebayaz, M. Exergy analysis and entropy generation of a reciprocating compressor applied in CNG stations carried out on the basis models of ideal and real gas. Appl. Therm. Eng. 2017, 124, 1279–1291. [Google Scholar] [CrossRef]
- Harrison, J.; Aihara, R.; Eshraghi, M.; Dmitrieva, I.; Harrison, J.; Aihara, R.; Eshraghi, M.; Dmitrieva, I. Modeling Engine Oil Variable Displacement Vane Pumps in 1D to Predict Performance, Pulsations, and Friction. In Proceedings of the SAE 2014 World Congress & Exhibition, Detroit, MI, USA, 8–10 April 2014; SAE International: Warrendale, PA, USA, 2014. [Google Scholar] [CrossRef]
- Ramchandran, G.; Bhatia, K.; Aihara, R. Simulation of 1D Flow Coupled with 3D Multi-Body Dynamics Model of a Double-Acting Swashplate Compressor. In Proceedings of the International Compressor Engineering Conference 2018, West Lafayette, IN, USA, 9–12 July 2018; Available online: https://docs.lib.purdue.edu/icec/2623 (accessed on 30 March 2025).
- Gamma Technologies, LLC. GT-SUITE Flow Theory Manual, Version 2024, Westmont, IL, USA, 2024. Available online: https://www.gtisoft.com/download/general-download/ (accessed on 10 May 2024).
- Pan, Q.; Zeng, Y.; Li, Y.; Jiang, X.; Huang, M. Experimental investigation of friction behaviors for double-acting hydraulic actuators with different reciprocating seals. Tribol. Int. 2021, 153, 106506. [Google Scholar] [CrossRef]
- Tuhovcak, J.; Hejcik, J.; Jicha, M. Comparison of heat transfer models for reciprocating compressor. Appl. Therm. Eng. 2016, 103, 607–615. [Google Scholar] [CrossRef]
- Disconzi, F.P.; Deschamps, C.J.; Pereira, E.L.L. Development of an In-Cylinder Heat Transfer Correlation for Reciprocating Compressors, 2012, International Compressor Engineering Conference. Paper 2103. Available online: https://docs.lib.purdue.edu/icec/2103 (accessed on 14 June 2024).
- Abbas, Q.; Khan, M.; Khan, Y.M.; Koreshi, Z. Numerical simulation and experimental verification of air flow through a heated pipe. Int. J. Mech. Mechatron. Eng. 2010, 10, 7–12. [Google Scholar]
- Schuster, S.; Dohmen, H.J.; Brillert, D. Challenges of compressing hydrogen for pipeline transportation with centrifugal-compressors. In Proceedings of the GPPS Chania20, Online, 7–9 September 2020. [Google Scholar] [CrossRef]
- Lemmon, E.W.; Bell, I.H.; Huber, M.L.; McLinden, M.O. REFPROP; National Institute of Standards and Technology, Standard Reference Data Program: Gaithersburg, MD, USA, 2018. [Google Scholar] [CrossRef]
- Kim, M.-S.; Ryu, J.-H.; Oh, S.-J.; Yang, J.-H.; Choi, S.-W. Numerical Investigation on Influence of Gas and Turbulence Model for Type III Hydrogen Tank under Discharge Condition. Energies 2020, 13, 6432. [Google Scholar] [CrossRef]
- Bondarev, E.A.; Voevodin, A.F.; Argunova, K.K.; Rozhin, I.I. Equations of State in Mathematical Models of NaturalGas Production and Transportation Systems. Numer. Analys. Appl. 2020, 13, 258–261. [Google Scholar] [CrossRef]
- Bejan, A. Entropy Generation Minimization: The Method of Thermodynamic Optimization of Finite-Size Systems and Finite-Time Processes; CRC Press: Boca Raton, FL, USA, 2013. [Google Scholar] [CrossRef]
- Moran, M.J.; Shapiro, H.N.; Boettner, D.D.; Bailey, M.B. Fundamentals of Engineering Thermodynamics; John Wiley & Sons: Hoboken, NJ, USA, 2010. [Google Scholar]
Disclaimer/Publisher’s Note: The statements, opinions and data contained in all publications are solely those of the individual author(s) and contributor(s) and not of MDPI and/or the editor(s). MDPI and/or the editor(s) disclaim responsibility for any injury to people or property resulting from any ideas, methods, instructions or products referred to in the content. |
© 2025 by the authors. Licensee MDPI, Basel, Switzerland. This article is an open access article distributed under the terms and conditions of the Creative Commons Attribution (CC BY) license (https://creativecommons.org/licenses/by/4.0/).